
Submitted:
30 October 2025
Posted:
03 November 2025
You are already at the latest version
Abstract
Objectives: This study focuses on Sustainable Development Goal (SDG) number 3, which promotes health and well-being. The overall objective was to determine the construction and psychometric properties of the Inventory of Prevalence of Sexist Thoughts in adolescents in the city of Trujillo, 2025. Method: The research is descriptive in nature, with a methodological approach and a non-experimental, instrumental design. The sample consisted of 555 male and female adolescents from Trujillo, who were administered the Sexist Thoughts Prevalence Inventory (IPPS-25). Results: With regard to evidence of content validity, the Sexist Thoughts Prevalence Inventory was submitted to nine expert judges for evaluation, who analyzed whether all items met Aiken’s V requirement of ≥ .80 in the three areas of consistency, clarity, and relevance. The factorial analysis identified two dimensions: gender hierarchies and social identity, and affective and behavioral expectations toward the opposite gender. The confirmatory factor analysis confirmed that the two-dimensional model fits appropriately (CFI = 0.949, TLI = 0.939, SRMR = 0.048, RMSEA = 0.038). Convergent validity reflected a positive correlation with the external test, the Ambivalent Sexism Inventory (ASI). Likewise, adequate internal consistency was shown, given that the alpha coefficient is .719 and the omega coefficient is .749. Conclusion: The IPPS-25 psychometric instrument allows for the identification of the prevalence of sexist thoughts in the adolescent population in an ideal way.
Keywords:
I. Introduction
2. Method
3. Results

| Model | X2 | gl | CFI | TLI | SRMR | RMSEA |
|---|---|---|---|---|---|---|
| One-dimensional (14 items) | 292.760 | 77 | 0.680 | 0.622 | 0.090 | 0.096 |
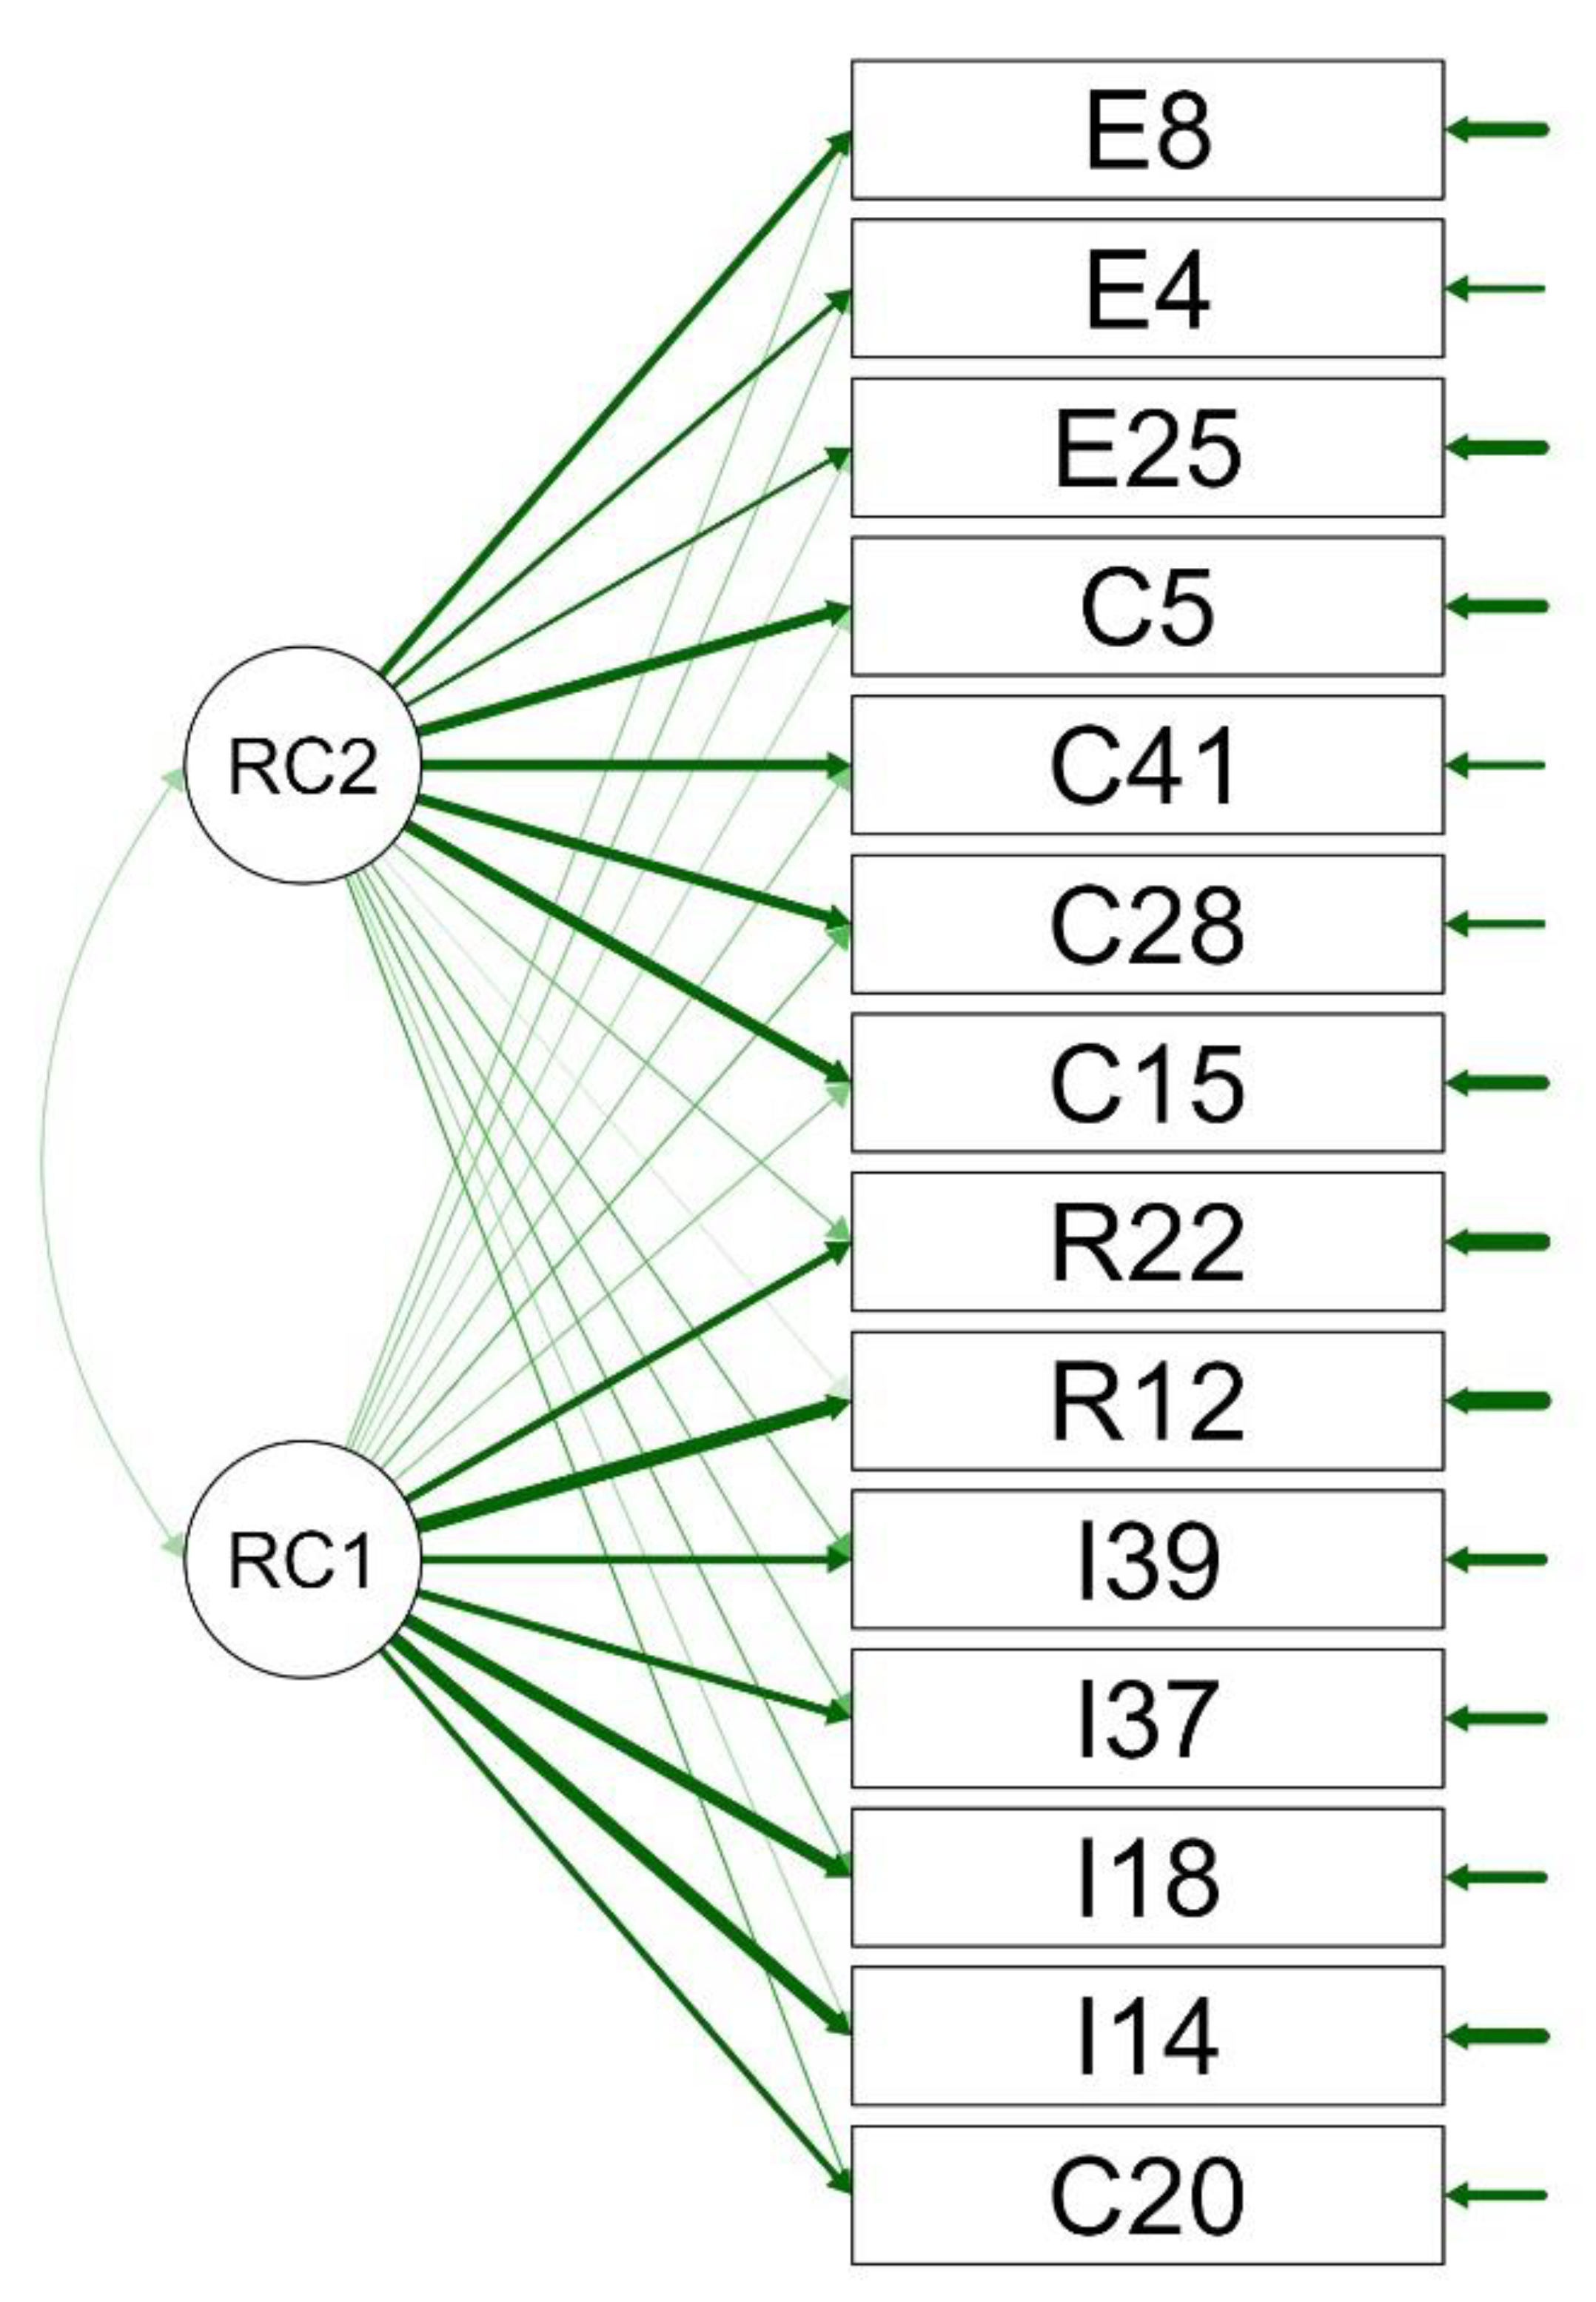
| 2 factors (14 items) |
110.295 | 79 | 0.949 | 0.939 | 0.048 | 0.038 |
| Items | Frequency | M | DE | g1 | g2 | h2 | IHC | ||||
|---|---|---|---|---|---|---|---|---|---|---|---|
| 1 | 2 | 3 | 4 | ||||||||
| Emotional and behavioral expectations toward the opposite gender |
e4 | 15.5 % | 34.5 % | 38.0 % | 12.0 % | 2.46 | 0.896 | -0.0421 | -0.752 | 0.674 | 0.397 |
| e8 | 12.0 % | 24.0 % | 43.5 % | 20.5 % | 2.73 | 0.924 | -0.352 | -0.668 | 0.764 | 0.222 | |
| e13 | 32.0 % | 28.0 % | 24.5 % | 15.5 % | 2.23 | 1.07 | 0.298 | -1.17 | 0.794 | 0.208 | |
| e16 | 57.0 % | 25.5 % | 10.0 % | 7.5 % | 1.68 | 0.934 | 1.24 | 0.498 | 0.747 | 0.258 | |
| e19 | 11.0 % | 31.0 % | 37.0 % | 21.0 % | 2.68 | 0.928 | -0.157 | -0.837 | 0.87 | 0.166 | |
| e25 | 32.5 % | 32.0 % | 24.5 % | 11.0 % | 2.14 | 0.998 | 0.39 | -0.955 | 0.699 | 0.392 | |
| e33 | 34.5 % | 24.5 % | 27.0 % | 14.0 % | 2.21 | 1.07 | 0.284 | -1.22 | 0.546 | 0.457 | |
| e38 | 16.5 % | 31.5 % | 37.0 % | 14.5 % | 0.5 | 3.28 | 12.4 | 168 | 0.923 | 0.153 | |
| e43 | 34.5 % | 26.5 % | 28.0 % | 11.0 % | 2.15 | 1.02 | 0.31 | -1.12 | 0.743 | 0.253 | |
| e45 | 16.0 % | 23.5 % | 35.5 % | 25.0 % | 2.69 | 1.02 | -0.281 | -1.02 | 0.666 | 0.39 | |
| Dimensions | Coefficient ω | items |
|---|---|---|
| Hierarchies and social gender identity | .728 | 7 |
| Emotional and behavioral expectations toward the opposite gender | .716 | 7 |
| Total | .749 | 14 |
| Dimensions | Coefficient α | Items |
|---|---|---|
| Hierarchies and social gender identity | .727 | 7 |
| Emotional and behavioral expectations toward the opposite gender | .719 | 7 |
| PC | HIERARCHY | EXPECTATION | GRAND TOTAL |
|---|---|---|---|
| 100 | 28.00 | 27.00 | 55.00 |
| 95 | 24.70 | 24.00 | 46.00 |
| 90 | 23.00 | 23.00 | 43.00 |
| 85 | 22.00 | 22.00 | 42.00 |
| 80 | 21.00 | 21.00 | 41.00 |
| 75 | 20.00 | 21.00 | 39.00 |
| 70 | 20.00 | 20.00 | 38.00 |
| 65 | 19.00 | 19.00 | 37.00 |
| 60 | 19.00 | 19.00 | 37.00 |
| 55 | 18.00 | 18.00 | 36.00 |
| 50 | 18.00 | 17.00 | 35.00 |
| 45 | 17.00 | 17.00 | 34.00 |
| 40 | 17.00 | 16.00 | 34.00 |
| 35 | 16.00 | 16.00 | 33.00 |
| 30 | 15.00 | 15.00 | 32.00 |
| 25 | 15.00 | 15.00 | 31.00 |
| 20 | 14.00 | 14.00 | 30.00 |
| 15 | 13.00 | 13.00 | 29.00 |
| 10 | 12.00 | 12.00 | 26.00 |
| 5 | 11.00 | 10.30 | 23.30 |
| N | 305 | 305 | 305 |
| Media | 17.57 | 17.50 | 37.07 |
| Fashion | 19 | 15 | 33 |
| DS | 4.141 | 4.092 | 6.658 |
| Minimum | 7 | 7 | 16 |
| Maximum | 28 | 27 | 55 |
4.1. Percentile Norms
5. Discussion
6. Conclusions
7. Recommendations
Appendix A
| Items | Frequency | M | DE | g1 | g2 | h2 | IHC | ||||
| 1 | 2 | 3 | 4 | ||||||||
| Beliefs about gender roles and capabilities |
c5 | 23.0 % | 24.5 % | 35.0 % | 17.5 % | 2.47 | 1.03 | -0.0713 | -1.15 | 0.4 | 0.4339 |
| c7 | 2.5 % | 15.5 % | 59.5 % | 22.5 % | 3.02 | 0.694 | -0.482 | 0.483 | 0.667 | 0.0287 | |
| c9 | 12.0 % | 36.5 % | 37.0 % | 14.5 % | 2.54 | 0.884 | -0.0124 | -0.708 | 0.644 | 0.4222 | |
| c15 | 21.0 % | 35.0 % | 37.0 % | 7.0 % | 2.3 | 0.88 | 5.40E-16 | -0.839 | 0.446 | 0.5161 | |
| c20 | 17.0 % | 24.0 % | 42.0 % | 17.0 % | 2.59 | 0.963 | -0.259 | -0.875 | 0.604 | 0.3522 | |
| c24 | 21.0 % | 31.0 % | 31.5 % | 16.5 % | 2.44 | 1 | 0.0438 | -1.06 | 0.342 | 0.3658 | |
| c28 | 12.0 % | 28.0 % | 37.0 % | 23.0 % | 2.71 | 0.954 | -0.231 | -0.876 | 0.486 | 0.5663 | |
| c30 | 37.0 % | 34.5 % | 22.0 % | 6.5 % | 1.98 | 0.924 | 0.542 | -0.685 | 0.525 | 0.4391 | |
| c41 | 27.0 % | 31.0 % | 24.0 % | 18.0 % | 2.33 | 1.06 | 0.224 | -1.17 | 0.545 | 0.496 | |
| Items | Frequency |
M | DE | g1 | g2 | h2 | IHC | ||||
|---|---|---|---|---|---|---|---|---|---|---|---|
| Power and control relations between genders |
r1 | 34.0 % | 20.5 % | 36.5 % | 9.0 % | 2.21 | 1.01 | 0.104 | -1.28 | 0.502 | 0.384 |
| r3 | 9.0 % | 34.0 % | 41.5 % | 15.5 % | 2.63 | 0.852 | -0.108 | -0.597 | 0.525 | 0.42 | |
| r6 | 33.0 % | 34.0 % | 24.5 % | 8.5 % | 2.08 | 0.955 | 0.423 | -0.84 | 0.542 | 0.431 | |
| r12 | 15.5 % | 31.5 % | 29.5 % | 23.5 % | 2.61 | 1.01 | -0.0684 | -1.1 | 0.578 | 0.464 | |
| r17 | 30.0 % | 26.0 % | 37.0 % | 7.0 % | 2.21 | 0.954 | 0.0585 | -1.16 | 0.815 | 0.407 | |
| r22 | 16.0 % | 39.0 % | 27.5 % | 17.5 % | 2.46 | 0.961 | 0.152 | -0.921 | 0.514 | 0.671 | |
| r27 | 30.0 % | 26.0 % | 37.0 % | 7.0 % | 2.21 | 0.954 | 0.0585 | -1.16 | 0.815 | 0.671 | |
| r32 | 24.0 % | 36.5 % | 26.5 % | 13.0 % | 2.29 | 0.974 | 0.258 | -0.915 | 0.487 | 0.37 | |
| r36 | 17.5 % | 34.0 % | 31.0 % | 17.5 % | 2.48 | 0.977 | 0.0424 | -0.984 | 0.618 | 0.511 | |
| r46 | 50.0 % | 26.5 % | 13.5 % | 10.0 % | 1.83 | 1.01 | 0.935 | -0.331 | 0.589 | 0.47 | |
| Items | Frequency | M | DE | g1 | g2 | h2 | IHC | ||||
|---|---|---|---|---|---|---|---|---|---|---|---|
| 1 | 2 | 3 | 4 | ||||||||
| Gender group identification and favoritism |
i11 | 18.5 % | 30.0 % | 39.0 % | 12.5 % | 2.46 | 0.934 | -0.0922 | -0.883 | 0.726 | 0.398 |
| i14 | 24.5 % | 28.5 % | 22.5 % | 24.5 % | 2.47 | 1.11 | 0.0763 | -1.34 | 0.531 | 0.556 | |
| i18 | 18.5 % | 43.0 % | 30.0 % | 8.5 % | 2.29 | 0.865 | 0.214 | -0.597 | 0.418 | 0.654 | |
| i23 | 26.5 % | 32.5 % | 29.0 % | 12.0 % | 2.27 | 0.985 | 0.212 | -1.01 | 0.689 | 0.435 | |
| i26 | 36.5 % | 33.5 % | 24.0 % | 6.0 % | 2 | 0.922 | 0.477 | -0.788 | 0.564 | 0.534 | |
| i31 | 49.0 % | 26.5 % | 15.5 % | 9.0 % | 1.84 | 0.993 | 0.876 | -0.417 | 0.511 | 0.58 | |
| i37 | 22.5 % | 27.5 % | 28.5 % | 21.5 % | 2.49 | 1.07 | 0.00117 | -1.23 | 0.656 | 0.465 | |
| i39 | 14.5 % | 26.5 % | 32.5 % | 26.5 % | 2.71 | 1.02 | -0.236 | -1.05 | 0.629 | 0.493 | |
| i42 | 33.0 % | 40.5 % | 18.5 % | 8.0 % | 2.02 | 0.916 | 0.604 | -0.446 | 0.578 | 0.526 | |
| Items | Frequency | M | DE | g1 | g2 | h2 | IHC | ||||
|---|---|---|---|---|---|---|---|---|---|---|---|
| 1 | 2 | 3 | 4 | ||||||||
| Justification for sexist prevalence |
j2 | 23.0 % | 35.5 % | 23.5 % | 18.0 % | 2.37 | 1.03 | 0.229 | -1.07 | 0.977 | 0.0966 |
| j10 | 31.0 % | 41.5 % | 19.5 % | 8.0 % | 2.04 | 0.909 | 0.558 | -0.471 | 0.641 | 0.4614 | |
| j21 | 37.0 % | 28.5 % | 21.5 % | 13.0 % | 2.1 | 1.05 | 0.475 | -1.02 | 0.644 | 0.4033 | |
| j29 | 28.0 % | 34.0 % | 25.0 % | 13.0 % | 2.23 | 1 | 0.314 | -0.977 | 0.697 | 0.3882 | |
| j34 | 23.5 % | 30.5 % | 31.0 % | 15.0 % | 2.38 | 1 | 0.0924 | -1.07 | 0.539 | 0.4972 | |
| j35 | 22.5 % | 31.5 % | 32.0 % | 14.0 % | 2.38 | 0.984 | 0.0823 | -1.02 | 0.543 | 0.496 | |
| j38 | 33.5 % | 29.0 % | 23.5 % | 14.0 % | 2.18 | 1.05 | 0.369 | -1.09 | 0.526 | 0.5271 | |
| j40 | 39.0 % | 24.5 % | 20.5 % | 16.0 % | 2.13 | 1.11 | 0.45 | -1.18 | 0.508 | 0.5369 | |
| ÍTEM ORIGINAL | JUDGE 1 Dr. Sandra Elizabeth Fuentes Chávez Cpsp |
JUDGE 2 M.A. Roberth Alexander Gutiérrez Caballero Cpsp |
JUDGE 3 M.A. Dyko Guillermo Mejia Ruedell Lamelal Cpsp |
JUDGE 4 M. A. Gustavo Adolfo Morillo Ahumada Cpsp |
JUDGE 5 B.A. Milagros Liliana Jimenes Gómez Cpsp 63422 |
JUDGE 6 Dr. Ernesto Maximiliano Loyaga Bartra Cpsp 17181 |
JUDGE 7 Dr. Mercedes Fiorella Gavidia Samame Cpsp 20115 |
JUDGE 8 M.A. Lorena de Jesús Díaz Herna Cpsp 31455 |
JUDGE 9 M.A. Hugo Iván Alvarado Ríos Cpsp 47121 |
ITEMS REVIEWED |
|
| Item1 | Women exaggerate when they talk about gender equality. | - | - | - | - | - | It is an opinion, it does not measure the dimension. |
- | - | - | - |
| Item2 | Women want more privileges than rights. | - | - | - | - | It is an opinion, it does not measure the dimension. | - | - | - | - | |
| Item3 | Many men miss out on opportunities because women are given preference. | - | - | - | - | - | - | - | - | - | - |
| Item4 | If women are in high positions, it is because they are given preference, not because of merit. | - | - | - | “ | - | - | - | -. | - | - |
| Item5 | All women use feminism to gain advantages. | - | - | - | The term “advantages” can have two connotations, positive or negative; change to be clear about this, or clarify. | - | It is an opinion, it does not measure the dimension. |
- | -. | The use of “all” could confuse or skew responses. |
Some women use feminism as a way to gain unfair advantages over men. |
| Item6 | Women should be protected by men. | - | - | - | - | - | - | - | -. | - | - |
| Item7 | Women are naturally sweeter and therefore should take care of others. | - | - | - | - | - | - | - | -. | - | - |
| Ítem8 | A man is only truly a man if he always cares for and provides for a woman. | - | - | - | - | - | Improve writing |
- | -. | - | - |
| Item9 | . Women have a special intuition for solving family problems. | - | - | - | - | - | - | - | -. | - | - |
| Item10 | Women are more valuable when they are delicate and kind. | - | - | - | - | - | - | - | -. | - | - |
| Item11 | There is no need to keep talking about equality; it has already been achieved. | - | - | - | - | - | - | - | -. | - | - |
| Item12 | Current laws favor women too much. | - | - | - | - | - | - | - | - | - | - |
| Item13 | Feminism has gone too far and is harmful to men. | - | - | - | - | - | - | - | - | - | - |
| Item14 | If a woman wants equality, she should stop expecting special treatment. | - | - | - | - | - | - | - | - | - | - |
| Item15 | We shouldn’t change structures because of feminist complaints. | - | - | - | It could not be understood structure, specific, uses simple language. |
- | - | - | - | - | The rules should not be changed because of feminist complaints. |
| Item16 | There will always be one gender that leads more than the other. | - | - | - | - | - | - | - | - | - | - |
| Item17 | Men have a greater natural ability to make important decisions. | - | - | - | - | - | - | - | -. | - | - |
| Item18 | The social structure works better when men are in charge. | - | - | - | - | - | - | - | -. | - | - |
| Item19 | It is normal for men to have greater authority in the home. | - | - | - | - | - | - | - | -. | - | - |
| Item20 | Women are better at obeying than leading. | - | - | - | - | - | - | - | -. | - | - |
| Item21 | Nowadays, men can no longer express themselves freely without being judged. | - | - | - | - | - | - | - | -. | - | - |
| Item22 | Women are taking away men’s space in all areas of life. | - | - | - | - | - | - | - | -. | - | - |
| Item23 | Defending men’s rights is frowned upon, and that’s not fair. | - | - | - | - | - | -. | - | - | - | - |
| Item24 | New equality policies are hurting men. | - | - | - | - | - | -. | - | - | - | - |
| Item25 | Men are prevented from expressing their opinions on gender without being attacked. | - | - | - | - | - | -. | - | - | - | - |
| Item26 | Today, men are losing rights because of feminism. | - | - | - | - | - | -. | - | - | - | - |
| ÍIem 27 | Things were better when men had more leadership. | - | - | - | There are questions that may be related to the previous dimension, but they are not measuring the same thing. Keep this in mind, as it could cause problems later on at the psychometric level. | - | -. | - | - | - | - |
| ÍtIm28 | We must unite among men so that we do not continue to lose ground. | - | - | - | - | - | -. | - | - | - | - |
| -Item29 | Women should learn more about how men think. | - | - | - | It does not seem to correspond. |
- | -. | - | - | - | - |
| Item30 | Among men, we understand each other better and work more efficiently. | - | - | - | It does not seem to correspond. |
- | -. | - | - | It measures group favoritism, but can be interpreted as work efficiency. |
Men are better at working together than women. |
| Item31 | Sexist jokes are not meant to offend, they are just humor. | - | - | - | Sexist jokes can be confusing in terms of what they mean. |
- | “Sexist” is an ambiguous adjective; use operational language. |
- | - | - | Jokes that make fun of women are not meant to offend, they are just humor. |
| Item32 | It’s not such a big deal for a man to catcall women on the street. | - | - | - | - | - | -. | - | - | - | . |
| Item33 | There will always be differences in how men and women are treated, and that’s okay. | - | - | - | - | - | -. | - | - | “Always” is extreme, and “okay” is subjective. |
There are differences in treatment between men and women, and that’s okay. |
| Item34 | Saying that women are bad drivers is not sexism, it’s reality. | - | - | - | - | - | -. | - | - | - | - |
| Item35 | Sexism is not as common as they make it out to be. | - | - | - | It might not be understood; use simple language. |
- | Same as (31) |
- | - | - | Acts of discrimination against women are not as frequent as they are made out to be. |
| Item36 | People get offended by anything these days. | - | - | - | Specify who, women? |
- | What about the sexist connotation? | - | - | Generic and not specific to the topic. |
Women are easily offended by any comment related to gender. |
| Item37 | Women complain about little things that don’t matter. | - | - | - | - | - | -. | - | - | - | - |
| Item38 | Machismo no longer exists; it’s a media invention. | - | - | - | - | - | -. | - | - | - | - |
| Item39 | Allegations of harassment are exaggerated and often false. | - | - | - | - | - | -. | - | - | - | - |
| Item40 | There’s so much talk about inequality that it’s tiresome. | - | - | - | - | - | What “inequality”? Use operational language. |
- | - | Similar to item 36, they could be merged. |
Discussions about how women do not have the same rights as men are tiresome. |
| Item41 | The most important thing for a woman is to be a good mother. | - | - | - | - | - | -. | - | - | - | - |
| Item42 | Women feel more fulfilled when they take care of their family. | - | - | - | - | - | -. | - | - | - | - |
| Item43 | A woman who does not want to have children is incomplete. | - | - | - | - | - | -. | - | - | - | - |
| Item44 | Women should prioritize their family over their career. | - | - | - | - | - | -. | - | - | - | - |
| Item45 | Women look better when they act tenderly. | - | - | - | - | - | -. | - | - | “They look better” is ambiguous. | - |
| Item46 | Men should be the financial providers for their households. | - | - | - | - | - | -. | - | - | - | - |
| Item47 | Men lose respect if they show too much emotion. | - | - | - | - | - | -. | - | - | - | - |
| Item48 | Men should be strong and not complain. | - | - | - | - | - | -. | - | - | - | - |
| Item49 | Women prefer dominant, confident men. | - | - | - | - | - | -. | - | - | - | - |
| Item 50 | A man who doesn’t work is less valuable. | - | - | - | - | - | -. | - | - | - | - |
References
- Alemany-Arrebola, I., González-Gijón, G., Ortiz-Gómez, M. D. M., & Ruiz-Garzón, F. (2024). Los estereotipos de género en adolescentes: Análisis en un contexto multicultural. Revista Colombiana de Educación, 90, 164-184. [CrossRef]
- American Educational Research Association, American Psychological Association, & National Council on Measurement in Education. (2018). Estándares para pruebas educativas y psicológicas (Spanish edition). American Educational Research Association.
- Arias Gonzáles, J. L. (2021). Guía para elaborar la operacionalización de variables. Revista Espacio I+D Innovación más Desarrollo, X(28), 42-56. [CrossRef]
- Ávila Toscano, J. H., De La Rosa Ibáñez, G., Hernández Chang, E. A., Navarro Barreto, A., & Blanquicet Genes, R. (2024). Estereotipos de género como predictores de sexismo hostil y benevolente en hombres y mujeres heterosexuales. Psicología desde el Caribe, 40(1), 115-132. [CrossRef]
- Ayala, A., Vives-Cases, C., Davó-Blanes, C., Rodríguez-Blázquez, C., Forjaz, M. J., Bowes, N., DeClaire, K., Jaskulska, S., Pyżalski, J., Neves, S., Queirós, S., Gotca, I., Mocanu, V., Corradi, C., & Sanz-Barbero, B. (2021a). Sexism and its associated factors among adolescents in Europe: Lights4Violence baseline results. Aggressive Behavior, 47(3), 354-363. [CrossRef]
- Ayala, A., Vives-Cases, C., Davó-Blanes, C., Rodríguez-Blázquez, C., Forjaz, M. J., Bowes, N., DeClaire, K., Jaskulska, S., Pyżalski, J., Neves, S., Queirós, S., Gotca, I., Mocanu, V., Corradi, C., & Sanz-Barbero, B. (2021b). Sexism and its associated factors among adolescents in Europe: Lights4Violence baseline results. Aggressive Behavior, 47(3), 354-363. [CrossRef]
- Bareket, O., & Fiske, S. T. (2023). A systematic review of the ambivalent sexism literature: Hostile sexism protects men’s power; benevolent sexism guards traditional gender roles. Psychological Bulletin, 149(11-12), 637-698. [CrossRef]
- Bonilla-Algovia, E., Carrasco Carpio, C., & García-Pérez, R. (2024). Do Attitudes towards Gender Equality Influence the Internalization of Ambivalent Sexism in Adolescence? Behavioral Sciences, 14(9), 805. [CrossRef]
- Cáceres Campoverde, J. A. (2025). El perfil psicológico y social del hombre sexista: Implicaciones para la violencia de pareja. [CrossRef]
- Calle Mollo, S. E. (2023). Diseños de investigación cualitativa y cuantitativa. Ciencia Latina Revista Científica Multidisciplinar, 7(4), 1865-1879. [CrossRef]
- Calvete, E., Fernández-González, L., Orue, I., Machimbarrena, M., & González-Cabrera, J. (2021). Validación de un cuestionario para evaluar el abuso en relaciones de pareja en adolescentes (CARPA), sus razones y las reacciones. Revista de Psicología Clínica con Niños y Adolescentes, 8(no 1), 60-69. [CrossRef]
- Chávez-Ayala, C. A., San Lucas Poveda, H. A., Ramirez Andrade, D. S., & Farfán-Córdova, N. S. (2024). Validation of a questionnaire on teacher attitudes towards values education in Piura. SCIÉNDO, 27(2), 173-180. [CrossRef]
- Checa-Romero, M., Rivas-Rivero, E., & Viuda-Serrano, A. (2021). Factors related to distorted thinking about women and violence in Secondary School students. Revista de Educación, 395, 363-389. [CrossRef]
- Chero-Pacheco, V. (2024). Población y muestra. International Journal of Interdisciplinary Dentistry, 17(2), 66-66. [CrossRef]
- Colorado Romero, J. R., Romero Montoya, M., Salazar Medina, M., Cabrera Zepeda, G., & Castillo Intriago, V. R. (2025). Análisis Comparativo de los Coeficientes Alfa de Cronbach, Omega de McDonald y Alfa Ordinal en la Validación de Cuestionarios. Estudios y Perspectivas Revista Científica y Académica, 4(4), 2738-2755. [CrossRef]
- Cortés Rodríguez, M. (2023). Biplot de datos composicionales, una nueva herramienta estadística para el estudio de test psicológicos: Aplicación al cuestionario de bienestar de Carol Ryff [Tesis de doctorado, Universidad de Salamanca].
- Fernández García, O., Gil Lario, M. D., & Ballester Arnal, R. (2022). Prevalencia y Caracterización del Sexismo en el Contexto Español. Revista Contexto & Educação, 37(117), 118-12.
- Galván-Cabello, M. (2021). Inventario de Sexismo Ambivalente (ISA) en adolescentes chilenos: Estructura factorial, fiabilidad, validez e invarianza por sexo. Revista de Psicología Clínica Con Niños y Adolescentes, 8(3), 9-17. [CrossRef]
- García Viamontes, D., & Carbonell Vargas, M. S. (2023). Los estereotipos de género. Un estudio en adolescentes. Revista Estudios del Desarrollo Social: Cuba y América Latina, 11(1).
- García-González, J. R., & Sánchez-Sánchez, P. A. (2020). Diseño teórico de la investigación: Instrucciones metodológicas para el desarrollo de propuestas y proyectos de investigación científica. Información tecnológica, 31(6), 159-170. [CrossRef]
- García-Goñi, S., Loría-García, A., & Quesada-Leitón, H. (2023). Los Efectos del sexismo hacia las mujeres sobre la autoeficacia y desempeño en matemática de los hombres: Modelos de ecuaciones estructurales desde la teoría del sexismo ambivalente. Uniciencia, 37(1), 1-21. [CrossRef]
- Glick, P. (2023). Social psychological research on gender, sexuality, and relationships: Reflections on contemporary scientific and cultural challenges. Frontiers in Social Psychology, 1. [CrossRef]
- Glick, P., & Fiske, S. T. (1996). The Ambivalent Sexism Inventory: Differentiating hostile and benevolent sexism. Journal of Personality and Social Psychology, 70(3), 491-512. [CrossRef]
- Glick, P., & Raberg, L. (2018). Benevolent sexism and the status of women. En APA handbook of the psychology of women: History, theory, and battlegrounds (Vol. 1). (pp. 363-380). American Psychological Association.
- González-Vega, A. M. D. C., Salazar, A. L., & Ramírez, J. M. (2023). LA ÉTICA EN LA INVESTIGACIÓN CUALITATIVA. UNA REFLEXIÓN DESDE LOS ESTUDIOS ORGANIZACIONALES. New Trends in Qualitative Research, 17, e808. [CrossRef]
- Goyal, H., & Aleem, S. (2023). Confirmatory Factor Analysis (CFA) and Psychometric Validation of Healthy Lifestyle and Personal Control Questionnaire (HLPCQ) in India. Indian Journal of Community Medicine, 48(3), 430-435. [CrossRef]
- Groskurth, K., Bluemke, M., & Lechner, C. M. (2023). Why we need to abandon fixed cutoffs for goodness-of-fit indices: An extensive simulation and possible solutions. Behavior Research Methods, 56(4), 3891-3914. [CrossRef]
- Guerra-Marmolejo, C., Fernández-Fernández, E., González-Cano-Caballero, M., García-Gámez, M., Del Río, F. J., & Fernández-Ordóñez, E. (2021). Factors Related to Gender Violence and Sex Education in Adolescents: A Cross-Sectional Study. International Journal of Environmental Research and Public Health, 18(11), 5836. [CrossRef]
- Gutiérrez Prieto, B., Bringas Molleda, C., & Tornavacas Amado, R. (2022). Autopercepción de maltrato y actitudes ante la victimización en las relaciones interpersonales de pareja. Anuario de Psicología/The UB Journal of Psychology, 52(3). [CrossRef]
- Hernández González, O. (2021). Aproximación a los distintos tipos de muestreo no probabilístico que existen. 37(3).
- Hogg, M. A. (2021). Chapter Five—Self-uncertainty and group identification: Consequences for social identity, group behavior, intergroup relations, and society. En B. Gawronski (Ed.), Advances in Experimental Social Psychology (Vol. 64, pp. 263-316). Academic Press. [CrossRef]
- Hooks, B. (2022). Enseñar pensamiento crítico. Rayo Verde Editorial.
- Huamán Rojas, J. A., Treviños Noa, L. L., & Medina Flores, W. A. (2022). Epistemología de las investigaciones cuantitativas y cualitativas. Horizonte de la Ciencia, 12(23). [CrossRef]
- Juarros-Basterretxea, J., Ocampo, N. Y., Rojas-Solis, J. L., Rodríguez-Díaz, F. J., & García-Cueto, E. (2023). Revisiting the Ambivalent Sexism Inventory’s Adolescent and Brief Versions: Problems, solutions, and considerations. Anales de Psicología, 39(2), 304-313. [CrossRef]
- Lescano López, G. S., & Ponce Yactayo, D. L. (2020). Adaptación, validez y confiabilidad de la escala de detección de sexismo (DSE) en estudiantes del nivel secundaria. Delectus, 3(2), 71-78. [CrossRef]
- Madrona-Bonastre, R., Sanz-Barbero, B., Pérez-Martínez, V., Abiétar, D. G., Sánchez-Martínez, F., Forcadell-Díez, L., Pérez, G., & Vives-Cases, C. (2023). Sexismo y violencia de pareja en adolescentes. Gaceta Sanitaria, 37, 102221. [CrossRef]
- Mancilla Barillas, M. R. (2024). Midiendo la realidad: El papel de las variables en la investigación científica. Revista Docencia Universitaria, 5(2), 51-68. [CrossRef]
- Manrique Tapia, C. R., & Flores Monzon, K. A. (2021). Sexismo y violencia en las relaciones de noviazgo en adolescentes de Lima. PSIQUEMAG/ Revista Científica Digital de Psicología, 10(1), 79-89. [CrossRef]
- Marín Hernández, R., Barajas Márquez, M. W., & Pineda Gómez, L. D. (2023). Relación de la insatisfacción corporal y la identificación grupal en hombres y mujeres universitarios durante el Covid19. Journal of Behavior, Health & Social Issues, 15(2), 47-54. [CrossRef]
- Martín Cabrera, E., Torbay Betancor, Á., & Alonso Sánchez, J. A. (2024). Mitos del amor romántico y sexismo ambivalente en adolescentes. Pedagogia Social Revista Interuniversitaria, 45, 137-148. [CrossRef]
- Martín, E., Torbay, Á., Alexis-Alonso, J., Gutiérrez, V., & Santos, I. (2025). Segregación por sexo en la adolescencia y su relación con el sexismo ambivalente. Revista de Investigación Educativa, 43. [CrossRef]
- Medina León, S. C., & Bravo Pisconti, C. A. (2021). Autoestima y sexismo ambivalente en adolescentes de una institución educativa del distrito de moche. WARMI, 1(1), 37-46. [CrossRef]
- Medina, M. , Rojas, R., Bustamante, W., Loaiza, R., Martel, C., & Castillo, R. (2023). Metodología de la investigación: Técnicas e instrumentos de investigación. [CrossRef]
- Navarro López, E., & Guerrero Martínez, M. A. (2023). La gestión de la amenaza a la identidad social en el hashtag de Twitter #CaravanaMigrante: Un estudio de caso sobre la narrativa en México. Estudios sobre el Mensaje Periodístico, 29(1), 177-193. [CrossRef]
- Navas, M. P., Gómez-Fraguela, J. A., & Sobral, J. (2022). Sexismo y tríada oscura de la personalidad en adolescentes: El rol mediador de la desconexión moral. Revista Latinoamericana de Psicología, 54. [CrossRef]
- Ondé, D., & Alvarado, J. M. (2022). Contribución de los Modelos Factoriales Confirmatorios a la Evaluación de Estructura Interna desde la Perspectiva de la Validez. Revista Iberoamericana de Diagnóstico y Evaluación – e Avaliação Psicológica, 66(5), 5. [CrossRef]
- Organización Mundial de la Salud. (2021). Estadísticas Sanitarias Mundiales 2020: Monitoreando la Salud para Los ODS, Objetivo de Desarrollo Sostenible (1st ed). World Health Organization.
- Ortega Sánchez, Delfín. (2023). ¿Cómo investigar en didáctica de las ciencias sociales? Fundamentos metodológicos, técnicas e instrumentos de investigación. Octaedro.
- Reyes-Solano, F. E., & Castaños-Cervantes, S. (2022). Sexismo Ambivalente como Correlato y Predictor de la Agresión Psicológica. Revista Lasallista de Investigación, 18(1), 280-293. [CrossRef]
- Rodríguez, M. N., Martínez, E. R. P., Martínez, I. B. L., Cruz, D. H. M., Guerra, M. del R. A., Farías, J. O. I., Hachec, K. Y. B., López Olea, M., Iturribarri, S. L. C., Hurtado, J. S., Herrera, M. C., Luna, M. S. C., & Suazo, C. J. (2021). La evaluación de EO y EE en ELE : retos y propuestas. Centro de Enseñanza para Extranjeros.
- Sideridis, G., & Alghamdi, M. (2025). Corrected goodness-of-fit index in latent variable modeling using non-parametric bootstrapping. Frontiers in Psychology, 16, 1562305. [CrossRef]
- Tenny, S., & Hoffman, M. R. (2025). Prevalence. En StatPearls. StatPearls Publishing.
- Unidad de Estadística Educativa. (2024). ¿QUÉ ES EL CENSO EDUCATIVO? [Ministerio Educación]. ESCALE. Available online: https://escale.minedu.gob.pe/censo-escolar-eol/.
- Urban, J., Scherrer, V., Strobel, A., & Preckel, F. (2025). Continuous Norming Approaches: A Systematic Review and Real Data Example. Assessment, 32(5), 654-674. [CrossRef]
- Vargas Vargas, S. P., & Vásquez Huamán, T. C. (2022). Propiedades Psicométricas del Cuestionario Copsoq-istas 21 en colaboradores que realizan home office en entidades privadas limeñas [Universidad Peruana de Ciencias Aplicadas].
- Veloza Gamba, R. (2023). Validez y fiabilidad del instrumento de análisis cuantitativo del uso de las redes sociales y el desarrollo de la inteligencia emocional en adolescentes. Ciencia Latina Revista Científica Multidisciplinar, 7(3), 4907-4933. [CrossRef]
- Verkuyten, M. (2022). Understanding Intergroup Relations in Childhood and Adolescence. Review of General Psychology, 26(3), 282-297. [CrossRef]
- Vizcaíno Zúñiga, P. I., Cedeño Cedeño, R. J., & Maldonado Palacios, I. A. (2023). Metodología de la investigación científica: Guía práctica. Ciencia Latina Revista Científica Multidisciplinar, 7(4), 9723-9762. [CrossRef]
|
Items |
Clarity | Consistency | Relevance | |||||||||||||
|---|---|---|---|---|---|---|---|---|---|---|---|---|---|---|---|---|
|
M |
V |
IC 95% |
M |
V |
IC 95% |
M |
V |
IC 95% | ||||||||
| L | U | L | U | L | U | |||||||||||
| j4 | 1.0 | 1.00 | [0.57 | - | 1.00] | 1.0 | 1.00 | [0.57 | - | 1.00] | 1.0 | 1.00 | [0.57 | - | 1.00] | |
| j5 | 0.9 | 0.89 | [0.54 | - | 0.99] | 1.0 | 1.00 | [0.57 | - | 1.00] | 1.0 | 1.00 | [0.57 | - | 1.00] | |
| j7 | 1.0 | 1.00 | [0.57 | - | 1.00] | 1.0 | 1.00 | [0.57 | - | 1.00] | 1.0 | 1.00 | [0.57 | - | 1.00] | |
| j8 | 1.0 | 1.00 | [0.57 | - | 1.00] | 1.0 | 1.00 | [0.57 | - | 1.00] | 1.0 | 1.00 | [0.57 | - | 1.00] | |
| j9 | 1.0 | 1.00 | [0.57 | - | 1.00] | 1.0 | 1.00 | [0.57 | - | 1.00] | 1.0 | 1.00 | [0.57 | - | 1.00] | |
| j12 | 1.0 | 1.00 | [0.57 | - | 1.00] | 1.0 | 1.00 | [0.57 | - | 1.00] | 1.0 | 1.00 | [0.57 | - | 1.00] | |
| j13 | 1.0 | 1.00 | [0.57 | - | 1.00] | 1.0 | 1.00 | [0.57 | - | 1.00] | 1.0 | 1.00 | [0.57 | - | 1.00] | |
|
Items |
Clarity | Consistency | Relevance | |||||||||||||
|---|---|---|---|---|---|---|---|---|---|---|---|---|---|---|---|---|
|
M |
V |
IC 95% |
M |
V |
IC 95% |
M |
V |
IC 95% | ||||||||
| L | U | L | U | L | U | |||||||||||
| e1 | 1.0 | 1.00 | [0.57 | - | 1.00] | 1.0 | 1.00 | [0.57 | - | 1.00] | 1.0 | 1.00 | [0.57 | - | 1.00] | |
| e2 | 1.0 | 1.00 | [0.57 | - | 1.00] | 1.0 | 1.00 | [0.57 | - | 1.00] | 1.0 | 1.00 | [0.57 | - | 1.00] | |
| e3 | 1.0 | 1.00 | [0.57 | - | 1.00] | 1.0 | 1.00 | [0.57 | - | 1.00] | 1.0 | 1.00 | [0.57 | - | 1.00] | |
| e6 | 1.0 | 1.00 | [0.57 | - | 1.00] | 1.0 | 1.00 | [0.57 | - | 1.00] | 1.0 | 1.00 | [0.57 | - | 1.00] | |
| e10 | 1.0 | 1.00 | [0.57 | - | 1.00] | 1.0 | 1.00 | [0.57 | - | 1.00] | 1.0 | 1.00 | [0.57 | - | 1.00] | |
| e11 | 1.0 | 1.00 | [0.57 | - | 1.00] | 0.9 | 0.89 | [0.45 | - | 0.99] | 0.9 | 0.89 | [0.45 | - | 0.99] | |
| e14 | 1.0 | 1.00 | [0.57 | - | 1.00] | 0.9 | 0.89 | [0.45 | - | 0.99] | 1.0 | 1.00 | [0.57 | - | 1.00] | |
| Items |
Frequency | M | DE | g1 | g2 | h2 | IHC | ||||
|---|---|---|---|---|---|---|---|---|---|---|---|
| 1 | 2 | 3 | 4 | ||||||||
| Hierarchies and social gender identity |
j4 | 15.5 % | 31.5 % | 29.5 % | 23.5 % | 2.61 | 1.01 | -0.0684 | -1.1 | 0.578 | 0.464 |
| j5 | 24.5 % | 28.5 % | 22.5 % | 24.5 % | 2.47 | 1.11 | 0.0763 | -1.34 | 0.531 | 0.556 | |
| j7 | 18.5 % | 43.0 % | 30.0 % | 8.5 % | 2.29 | 0.865 | 0.214 | -0.597 | 0.418 | 0.654 | |
| j8 | 17.0 % | 24.0 % | 42.0 % | 17.0 % | 2.59 | 0.963 | -0.259 | -0.875 | 0.604 | 0.3522 | |
| j9 | 16.0 % | 39.0 % | 27.5 % | 17.5 % | 2.46 | 0.961 | 0.152 | -0.921 | 0.514 | 0.671 | |
| j12 | 22.5 % | 27.5 % | 28.5 % | 21.5 % | 2.49 | 1.07 | 0.00117 | -1.23 | 0.656 | 0.465 | |
| j13 | 14.5 % | 26.5 % | 32.5 % | 26.5 % | 2.71 | 1.02 | -0.236 | -1.05 | 0.629 | 0.493 | |
| Items |
Frequency | M | DE | g1 | g2 | h2 | IHC | ||||
|---|---|---|---|---|---|---|---|---|---|---|---|
| 1 | 2 | 3 | 4 | ||||||||
| Emotional and behavioral expectations toward the opposite gender |
e1 | 15.5 % | 34.5 % | 38.0 % | 12.0 % | 2.46 | 0.896 | -0.0421 | -0.752 | 0.674 | 0.397 |
| e2 | 23.0 % | 24.5 % | 35.0 % | 17.5 % | 2.47 | 1.03 | -0.0713 | -1.15 | 0.4 | 0.4339 | |
| e3 | 12.0 % | 24.0 % | 43.5 % | 20.5 % | 2.73 | 0.924 | -0.352 | -0.668 | 0.764 | 0.222 | |
| e6 | 21.0 % | 35.0 % | 37.0 % | 7.0 % | 2.3 | 0.88 | 5.40E-16 | -0.839 | 0.446 | 0.5161 | |
| e10 | 32.5 % | 32.0 % | 24.5 % | 11.0 % | 2.14 | 0.998 | 0.39 | -0.955 | 0.699 | 0.392 | |
| e11 | 12.0 % | 28.0 % | 37.0 % | 23.0 % | 2.71 | 0.954 | -0.231 | -0.876 | 0.486 | 0.5663 | |
| e14 | 27.0 % | 31.0 % | 24.0 % | 18.0 % | 2.33 | 1.06 | 0.224 | -1.17 | 0.545 | 0.496 | |
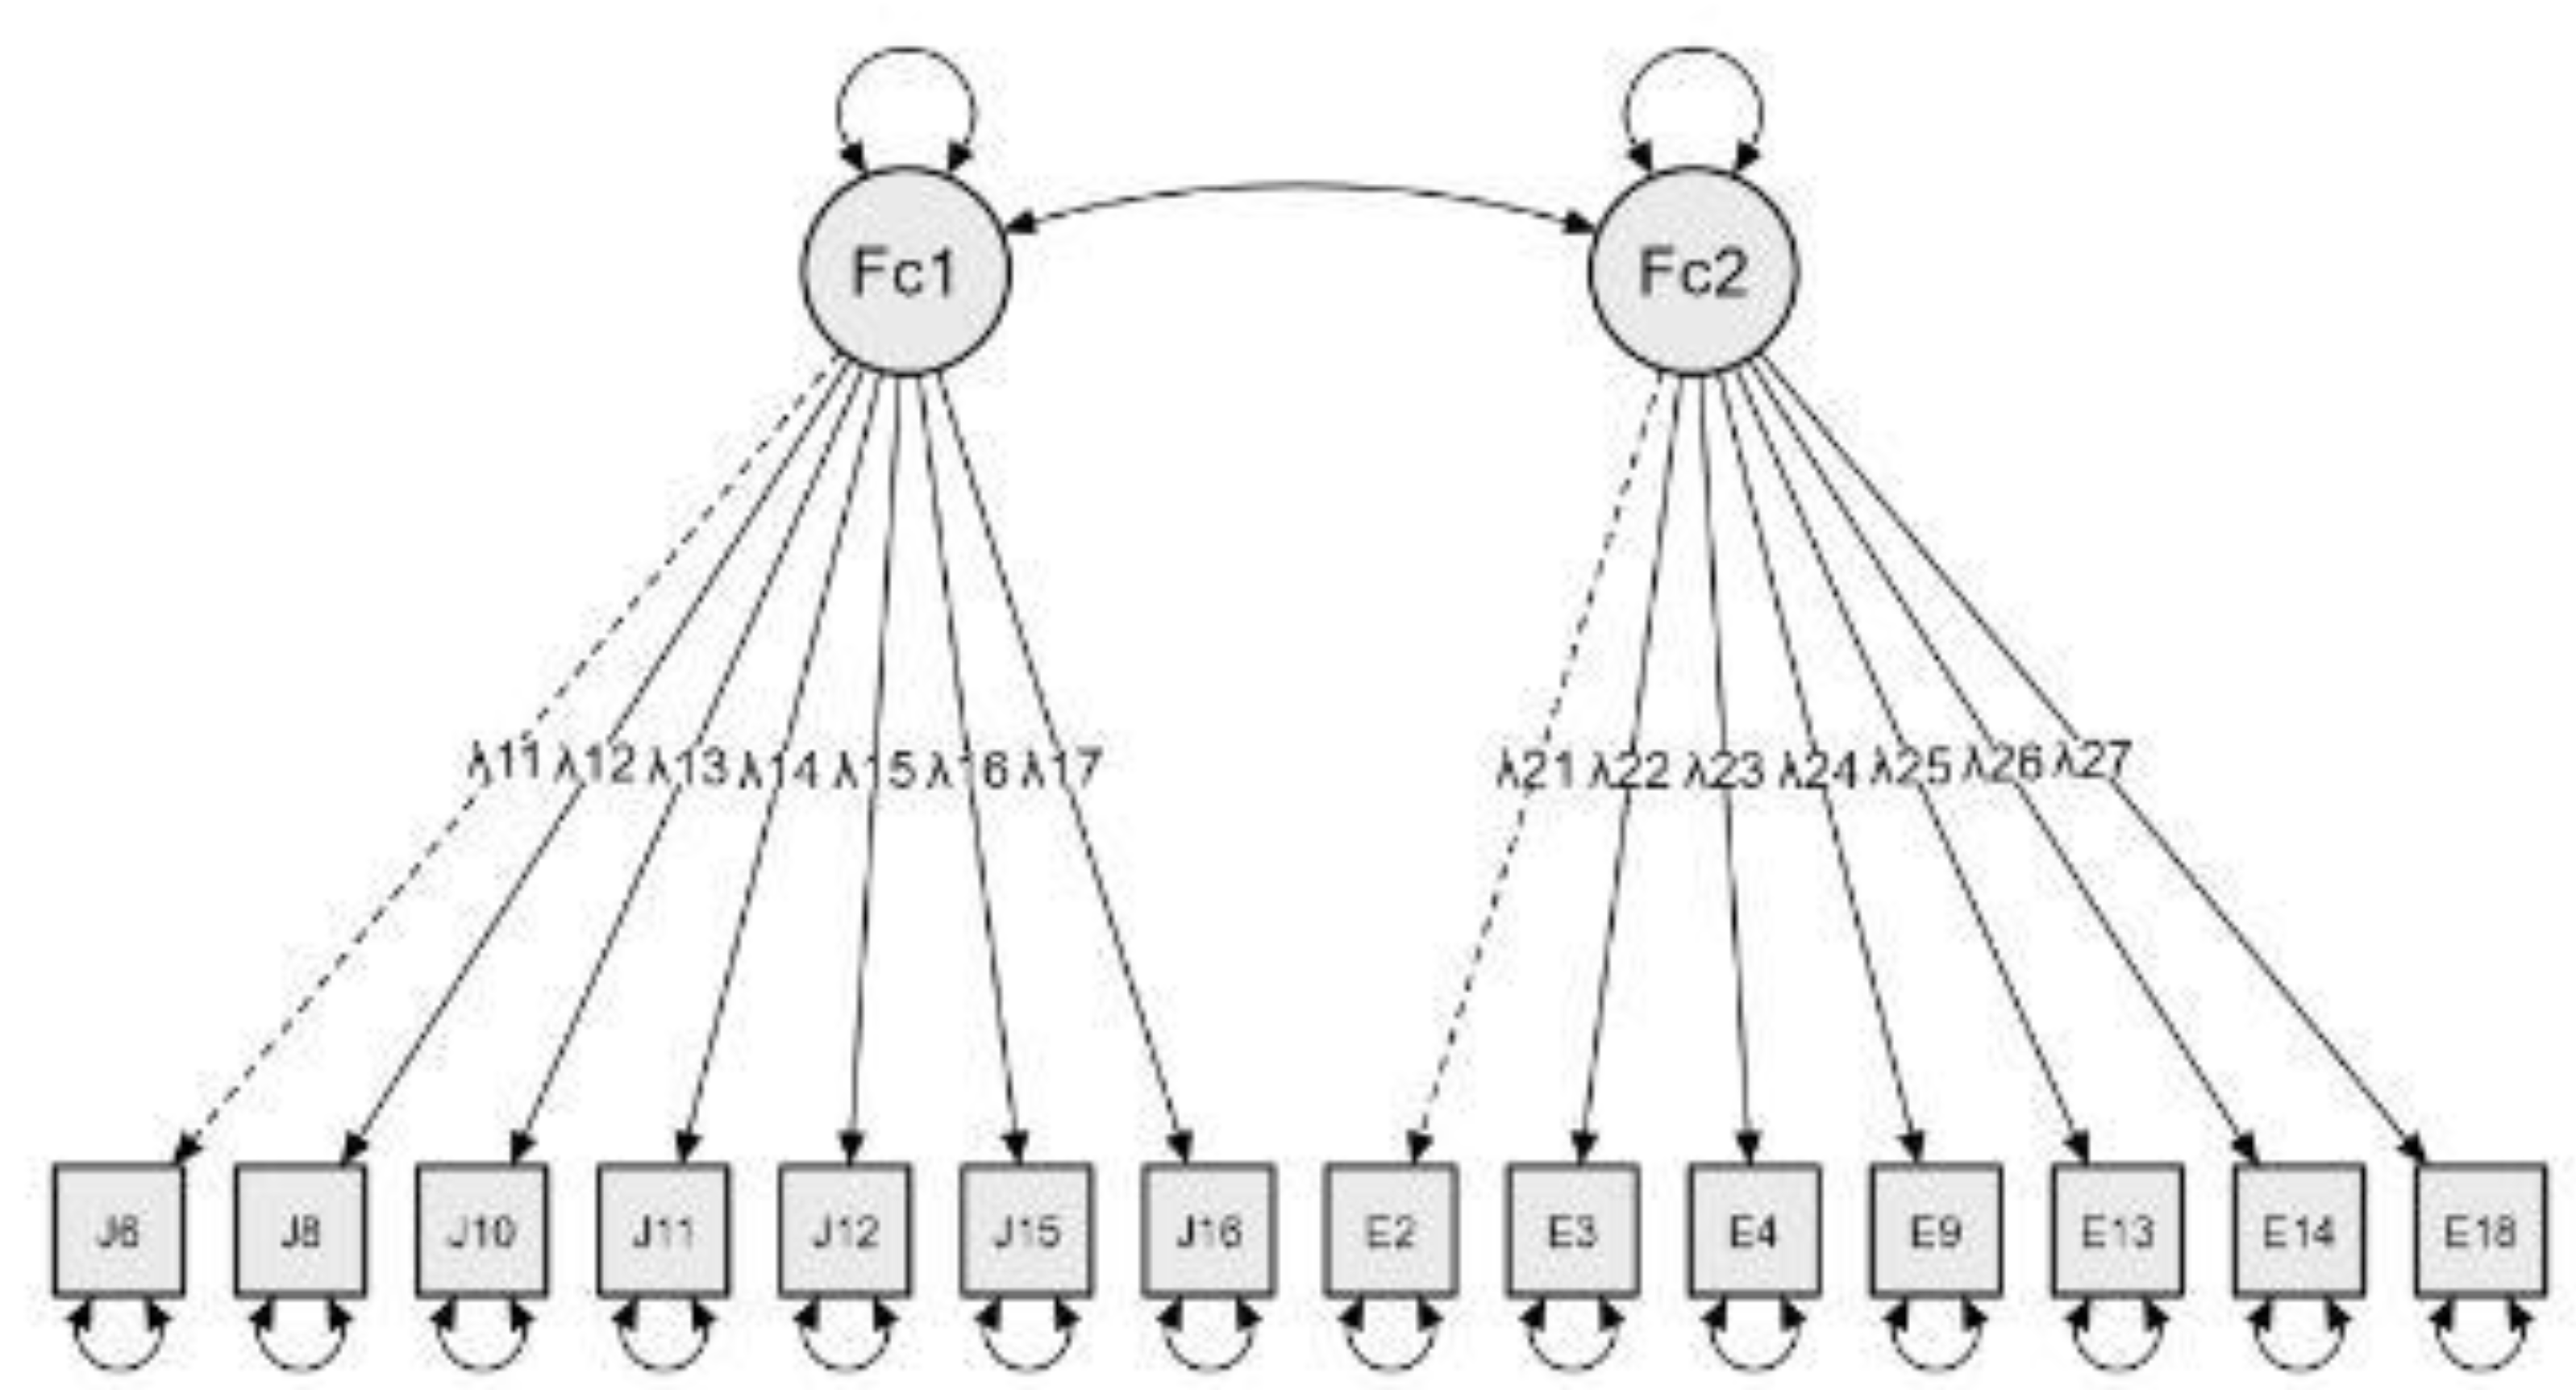
| A. GLOBAL | |||||||
|---|---|---|---|---|---|---|---|
| Model | X2 | gl | p | SRMR | RMSEA | CFI | TLI |
| Four factors (40 items) | 745.643 | 626 | <.001 | 0.043 | 0.031 | 0.949 | 0.935 |
| Two factors (14 items) | 90.741 | 64 | .016 | 0.042 | 0.045 | 0.957 | 0.939 |
| Items | Factor 1 | Factor 2 |
|---|---|---|
| J4 | 0.740 | |
| J5 | 0.708 | |
| J7 | 0.693 | |
| J12 | 0.522 | |
| J9 | 0.505 | |
| J13 | 0.500 | |
| J8 | 0.456 | |
| E6 | 0.633 | |
| E2 | 0.618 | |
| E11 | 0.601 | |
| E14 | 0.600 | |
| E3 | 0.513 | |
| E1 | 0.404 | |
| E10 | 0.367 |
| Ambivalent Sexism Inventory for Adolescents (ASI) | |||
|---|---|---|---|
| Inventory of Prevalence of Sexist Thoughts (IPPS-25) |
Spearman’s Rho | 0.535 | *** |
| r2 | 0.345 | ||
| Sig. (bilateral) | < .001 | ||
| N | 305 | ||
Disclaimer/Publisher’s Note: The statements, opinions and data contained in all publications are solely those of the individual author(s) and contributor(s) and not of MDPI and/or the editor(s). MDPI and/or the editor(s) disclaim responsibility for any injury to people or property resulting from any ideas, methods, instructions or products referred to in the content. |
© 2025 by the authors. Licensee MDPI, Basel, Switzerland. This article is an open access article distributed under the terms and conditions of the Creative Commons Attribution (CC BY) license (http://creativecommons.org/licenses/by/4.0/).


