
Submitted:
10 October 2025
Posted:
13 October 2025
You are already at the latest version
Abstract
Traditional innovation studies frequently highlight the role of geographic clustering in fostering competitive advantages. However, the sustainability of innovation cannot be understood solely through spatial proximity and requires a broader, multidisciplinary perspective. This study examines the Information and Communication Technology (ICT) sector in Quito by applying the CRI (Capacities, Results, and Impacts) model of innovation potential, adapted to the local organisational and institutional context. By combining normalised CRI data with georeferenced firm information, spatial autocorrelation was assessed using Moran’s Index and local indicators of spatial association (LISA). The results reveal random spatial patterns and no statistically significant evidence of innovation clustering among firms, academia, and the public sector. Notably, the few high-concentration clusters identified lie outside the traditional economic and institutional hubs of the Quito Innovation System. These findings demonstrate that innovation capacities, outputs, and impacts in Quito’s ICT sector are driven more by organisational capabilities, institutional linkages, and sectoral dynamics than by geographic location. The study contributes to the debate on sustainable innovation systems by challenging the assumption of spatial dependence and emphasising the need for policies and managerial practices that strengthen resilient innovation networks beyond clusters.
Keywords:
innovation sustainability
; geography of innovation
; ICT industry
; spatial analysis
; Quito
1. Introduction
Despite international efforts to promote innovation [1,2] highlight a significant difference in innovation indicators between countries and regions. Innovation is, in fact, an often-overused term, but frequently poorly defined and overlooked in its spatial dimension. An empirical study of the geography of innovation requires measurement, and the most commonly used available indicators, such as R&D spending or patent applications, are one- dimensional and do not capture the multidimensionality and complexity of innovation [3,4]. The study of the diffusion of innovations as a spatial process is of crucial interest for less industrialized countries [5](p. 41). Therefore, the measurement of innovation becomes essential in generating innovation indicators contextualized to local realities to understand the spatial dynamics of innovation.
The literature on the geography of innovation emphasizes the importance of proximity and geographic location in innovative activity [6]. It is argued that innovation not only spreads, but also emerges through spatial collaborations [7]. This phenomenon is due to the fact that firms depend not only on the territorial contexts of physical and intangible inputs, but also on the proximity relationships between them [8]. The spatial clustering of innovative activities offers advantages due to the role of its location and technological use [9]. Consequently, innovation is geographically agglomerated in areas where specialized inputs, services and resources necessary for the effective functioning of innovative processes are concentrated [10]. In this sense, geographic proximity between actors is an instrument to facilitate other non-spatial dimensions of proximity [11].
Location is important for innovation, and organizations should expand approaches for their management in the most attractive location [12]. Of all economic activities, innovation benefits the most from localization [6]. In this context, [13] justifies this idea by emphasizing the importance of location in technological innovation, which is mainly based on the fact that certain forms of innovation arise from interactive knowledge and skills derived from know-how, which appear in specific geographical spaces and defined organizational environments. Therefore, the concentration and specialization of innovation in certain geographical areas positively impact productivity and economic growth [7]. Companies and groups or networks of companies jointly involved in production systems depend not only on territorial contexts of tangible and intangible inputs but also on the varying degrees of proximity between them [8]. In this sense, [14] support the argument that agglomeration economies provide the best explanation for the dynamics of innovation. The importance of knowledge as a driver of innovation and the need for good interaction between parties to effectively transfer this knowledge suggest that closer destinations will have advantages [15].
[4] Argues that to understand the geography of innovation, empirical studies that include specific measurements are necessary. However, measuring innovation is a challenge that requires proper conceptualization [16]. There is little consensus on how innovation measurement should be conducted due to the various definitions used [17]. Broad interpretations of innovation, as argued by [18], can strip it of its true nature by not considering its specific context. Therefore, a generic and integrative definition of the various dimensions of innovation is needed [19]. This, in turn, determines what is considered as elements of innovation and how they are measured. The definitions found in the literature review by [20] identified several aspects of innovation that are important in delineating which attributes will be measured. In their study, they retrieved 13.401 articles from 7 databases and applied inclusion/exclusion criteria to select relevant articles. The result of the systematic literature review contributed to the development of a model that identifies three main elements in innovation measurement: innovation capabilities, innovation production, and the impact of innovation. This model served as a starting point for measuring innovation in 30 SMEs in the software sector located in Argentina [21]. At the local level, the study conducted by [1, 2] which supports the characterization of the ICT sector in this study, is an academic initiative aimed at providing Ecuadorian organizations with a tool to measure innovation processes that adheres to international methodological standards while considering the socio-economic characteristics of the local environment. This model posits that organizations must develop a set of capabilities to achieve results in terms of products, processes, organizational models, and marketing systems, which manifest in tangible impacts across various areas.
On the other hand, [22] argues that innovation, in its broadest sense, includes new technologies and new ways of doing things. The digital economy touches all sectors. However, the ICT sector remains at the core of digital transformation, and is essential to supporting further digital innovation [23] and plays an important role in creating new jobs, new sources of income, new business models and reducing the cost of access to public services [24]. The growing demand for technological solutions has boosted the ICT sector in Ecuador as it contributes to improving traditional competitive advantages in other industries. The steady growth of the sector makes it a key pillar for economic modernization and productivity, supported by efficient resource management, evidenced by positive indicators of solvency, liquidity and profitability [25].
The spatial dimension of innovation has been addressed in several studies using different methods to measure innovation and its distribution patterns. Some works such as [26,27,28,29]focus on the use of patent statistics as indicators of innovation mainly to data availability. On the other hand, studies by [30,31] examine the location of R&D activities. However, patents represent inventions, not innovations, according to Schumpeter's definition and innovative activities are not limited to R&D. These indicators are unidimensional and do not capture the multidimensionality of innovation. To address the complexity of the innovation process, more comprehensive approaches to its measurement are required, such as those studied by [32,33] that consider the combination of total and relative indicators and qualitative and quantitative indicators, referring to research results from related literature. [34]analyzes spatial heterogeneity in innovation, using local and global regressions of innovation input and output variables.
There is evidence that geographic location is a determinant of innovation, as suggested by [6,12,35]. One obstacle to the analysis of the location of innovative activity has been the lack of a direct measure of innovative output [36]. Despite the inherent limitations, many studies on the geography of innovation in developed economies have employed patents as the main indicator. Others, such as those mentioned above, employ multidimensional tools. The empirical results of their studies have implicit spatial implications [4] and use spatial tools such as the Moran Index and Local Spatial Association Indicators. The lack of detailed data on the geography of innovation hinders the understanding of its linkage to long-term development, especially in less industrialized countries [33]. This paper is an attempt to fill this gap in literature. We conceive innovation as a complex process. The present research addresses the influence of location and geographic proximity on innovation capabilities, outcomes and impacts in firms in the ICT sector in Quito.
2. Methodology
2.1. Innovation in Developing Industrial Economies
The study of innovation potential in developing industrial economies requires consideration of structural conditions, science, technology, and innovation policies, as well as institutional and territorial dynamics that may either hinder or foster innovation processes. Unlike advanced industrial economies, contexts such as Ecuador often exhibit fragile innovation ecosystems, high technological dependence on external sources, and weak coordination among key actors.
To contextualize this issue and build a solid conceptual foundation, an exploratory bibliometric review of scientific literature indexed in Scopus (2006–2024) was conducted. The search was structured around two thematic groups: ("innovation" OR "technological innovation") AND ("developing countries" OR "low-income countries" OR "Global South"), and ("innovation" OR "technological innovation") AND ("OECD" OR "developed countries" OR "high-income countries" OR "Global North"). VOSviewer was used to visualize keyword co-occurrence networks and identify major thematic clusters.
2.2. Potential innovation in ICT Sector in Quito
2.2.1. Innovation Potential – CRI Model
Innovation potential, the main construct, is defined in three secondary constructs: Capabilities, Results and Impacts. Each subconstruct comprises factors with observed variables that represent them unidimensionally, as shown in Table 1. To measure Innovation Potential, the model developed by [1,2] organizes these factors and their observed variables using a questionnaire with 4-level polarized Likert selected questions focused on respondents with middle/high management or executive roles to capture strategic perceptions of the organizations in the study sample. Since the questionnaire is a measurement instrument, it requires assessment. The spaces and actors of the innovation ecosystem, in which knowledge flows are generated, distributed, and utilized, constitute the information sources that are useful for the generation of innovations. The sources of financing refer to the different entities that can offer internal and external economic resources aimed at the organization's innovation activities. Innovation activities encompass all the initiatives of the organization, both in development, finance, and commerce, carried out with the goal of generating innovation as the final result. Innovation objectives consist of the identifiable goals of an organization that reflect its underlying motives and strategies concerning its innovation efforts. Innovation results are the products, processes, and other observable and/or tangible effects of innovation. Finally, innovation impacts are the potential effects generated by innovation results in the organization's environment, which can be of various types [38].
Therefore, the construction of a valid measure of innovation potential is based on an Item Response Theory (IRT). The proposals of [39] verify the innovation potential measurement tool through the mathematical validity of the IRT models by checking the fit to the data collected through the questionnaire, this allows measuring the intensity of each factor and establishing adjusted measurement models. It is important to note that, in order to interpret and geographically represent the results on a latent trait scale, it is necessary to normalize the values to a range from 0 to 100.
2.2.2. ICT Sector in Quito
The object of study is companies in the ICT sector that encompass the subsectors of computer programming, IT consulting and related activities, information service activities, and telecommunications. This classification is defined by the Superintendency of Companies, Insurance, and Securities of Ecuador (Supercias). This entity shares information about companies and other economic sectors based on their financial status. The city of Quito has been identified as the epicenter of economic activity in the province and region, thanks to the continuous growth and development of the ICT sector in recent years. This is further supported by the Location Quotient (LQ) for the ICT sector in Quito, calculated as shown in Equation (1), which yields a value of approximately 1.54. This value indicates that ICT-related firms are significantly more concentrated in the city than in the rest of the country. Such a high concentration suggests the presence of agglomeration economies and sectoral specialization within the ICT sector in Quito.
(1)
Where:
is the location quotient for sector k(ICT) in region j(Quito),
is the number of firms in sector k in region j,
is the total number of firms in region j,
is the total number of firms in sector k in the country,
E is the total number of firms in the country.
In Figure 1, the location and particular agglomeration of ICT companies in Quito can be seen. These companies are concentrated in the northern center of the city, in an area identified as the metropolitan centrality of La Carolina. This area exerts a significant economic, tourist, and social influence within the urban system of the Metropolitan District of Quito. It gathers the main public management entities, facilities, and places of general use. These are high-attraction areas for floating populations, as they are the largest providers of goods and services, as well as generators of employment.
According to data provided by the Supercias, in the year 2010, there were a total of 545 ICT sector companies in the city. In the period between 2010 and 2022, there was a notable 220% increase in the number of telecommunications, information services and software companies in the country. Quito stands out as the leading city in Ecuador, concentrating 45% of the companies, 55% of sales and employing 60% of the workforce. Quito provides favorable conditions for new technology companies, driving the growth of the sector. Figure 2 shows the geographical distribution of ICT companies in Quito, along with the location of universities and public research institutions that are key components of the innovation system.
A probability sampling strategy was implemented using simple random sampling, ensuring that all cases in the universe have an equal probability of being selected initially. Therefore, the sample size for this research corresponds to a total of 358 organizations to be studied.
2.3. Spatial Autocorrelation
Spatial autocorrelation is derived from the first law of geography, which states that everything is related to everything, but things near are more related than things far away, proposed by [40]. The term autocorrelation indicates that the measurement of correlation is made with the same variable in different locations of the geographic space. Therefore, if there is a relationship between the elements of the analyzed phenomenon, a spatial pattern can be identified [41]. Spatial autocorrelation implies the need to determine which units influence a specific unit of the spatial system. Formally, this is expressed in neighborhood relationships that rely on geographic criteria, such as contiguity or distance, to establish such relationships [42,43,44,45].
2.3.1. Units of Observation – Spatial Weight Matrix
In spatial analysis, weight matrices are fundamental for modeling spatial dependence between units. In this study, point-based spatial analysis was used, focusing on the exact location of ICT companies. This approach was selected to preserve the granularity of firm-level data and to accurately model spatial relationships based on geographic proximity. Using polygonal units, such as urban blocks, would have required aggregating firm-level characteristics—such as computing the average or total value of each factor of innovation potential per block—thus losing important variations between individual firms. Therefore, as shown in Figure 3, a distance-based weight matrix was applied, assuming spatial interaction only within a 0.5 km threshold, which better captures the micro-scale dynamics of agglomeration and spatial dependence among firms, .
Given that the objective of the study is to assess whether geographic proximity influences innovation capacities, outcomes, and impacts, the decision was made to define 'nearby' spatial neighborhoods that can adequately capture potential spatial dependence relationships. This methodological choice aligns with the principle that, under the null hypothesis of spatial independence, any detected spatial autocorrelation should be attributed to a relevant neighborhood structure [42]. Therefore, reduced distance thresholds and nearest-neighbor schemes were used to capture meaningful local interactions that may reflect externalities, spillovers, or territorial dynamics inherent to innovation processes.
2.3.1. Moran’s I
Spatial autocorrelation is interpreted as a descriptive statistical index that indicates the relationship of a single variable with observed values of the same variable in neighboring areas [43]. Moran’s I is one of the most well-known and widely used indices, in fact, it is the most used in many studies published in the field of innovation geography. Where n is the number of units of analysis, and the double summation corresponds to the matrix of spatial weights that represents neighbor relationships among the units of analysis, which has been previously discussed. The ratio between the double summation and the total number of neighborhoods defines a type of weighted covariance or restricted to neighbors [42]. Equation 2 shows its structure:
(2)
The Moran’s I index is used to measure spatial autocorrelation in a set of units of analysis. To determine whether the index indicates significant dispersion or clustering, spatial randomness hypothesis tests are used. These tests assess whether the spatial distribution of the phenomenon is random or not, considering different confidence levels. If the null hypothesis of spatial randomness is rejected, it is concluded that the phenomenon exhibits clustering or aggregation. Therefore, the following hypothesis tests are proposed, with a 95% confidence level, to evaluate the standardized indicators of innovation potential in the organizations under study:
- Null hypothesis (H₀): No spatial autocorrelation
- Alternative hypothesis (H₁): Spatial autocorrelation
This approach helps determine if the distribution of innovation potential among organizations shows significant spatial patterns of clustering, indicating the presence of spatial autocorrelation. In light of studying spatial proximity and its significance, we’ve opted to utilize a 1 km distance in our analysis, providing a balance between immediate spatial relations and broader influences. Several authors have suggested using neighbors that relate more directly to the specific phenomenon under study [44,45,46]. Thus, spatial autocorrelation is established as a prominent topic of study in the social sciences.
2.4. Local Indicators of Spatial Association (LISA)
As previously discussed, spatial autocorrelation is designed to reject the null hypothesis of spatial randomness in favor of a clustering alternative, without further detail about their location. However, found that local values are proportional to global values. These local statistics are used to identify hotspots or potential centers of statistically significant clustering and were named by Anselin as LISA, Local Indicators of Spatial Association [42]. By directly linking local indicators with a global measure of spatial association, it facilitates the decomposition of the latter into its specific observation components, allowing for the evaluation of influential observations and outliers. LISA are easy to implement and lend themselves easily to visualization,their distribution was plotted using GeoDa software. Therefore, they serve a useful purpose in spatial data analysis, potentially identifying local clusters referred to as High-High, Low-Low, Low-High, High-Low, and non-significant values [47]. The formula for calculating the Local Moran’s I is show in Eq. (2).
(2)
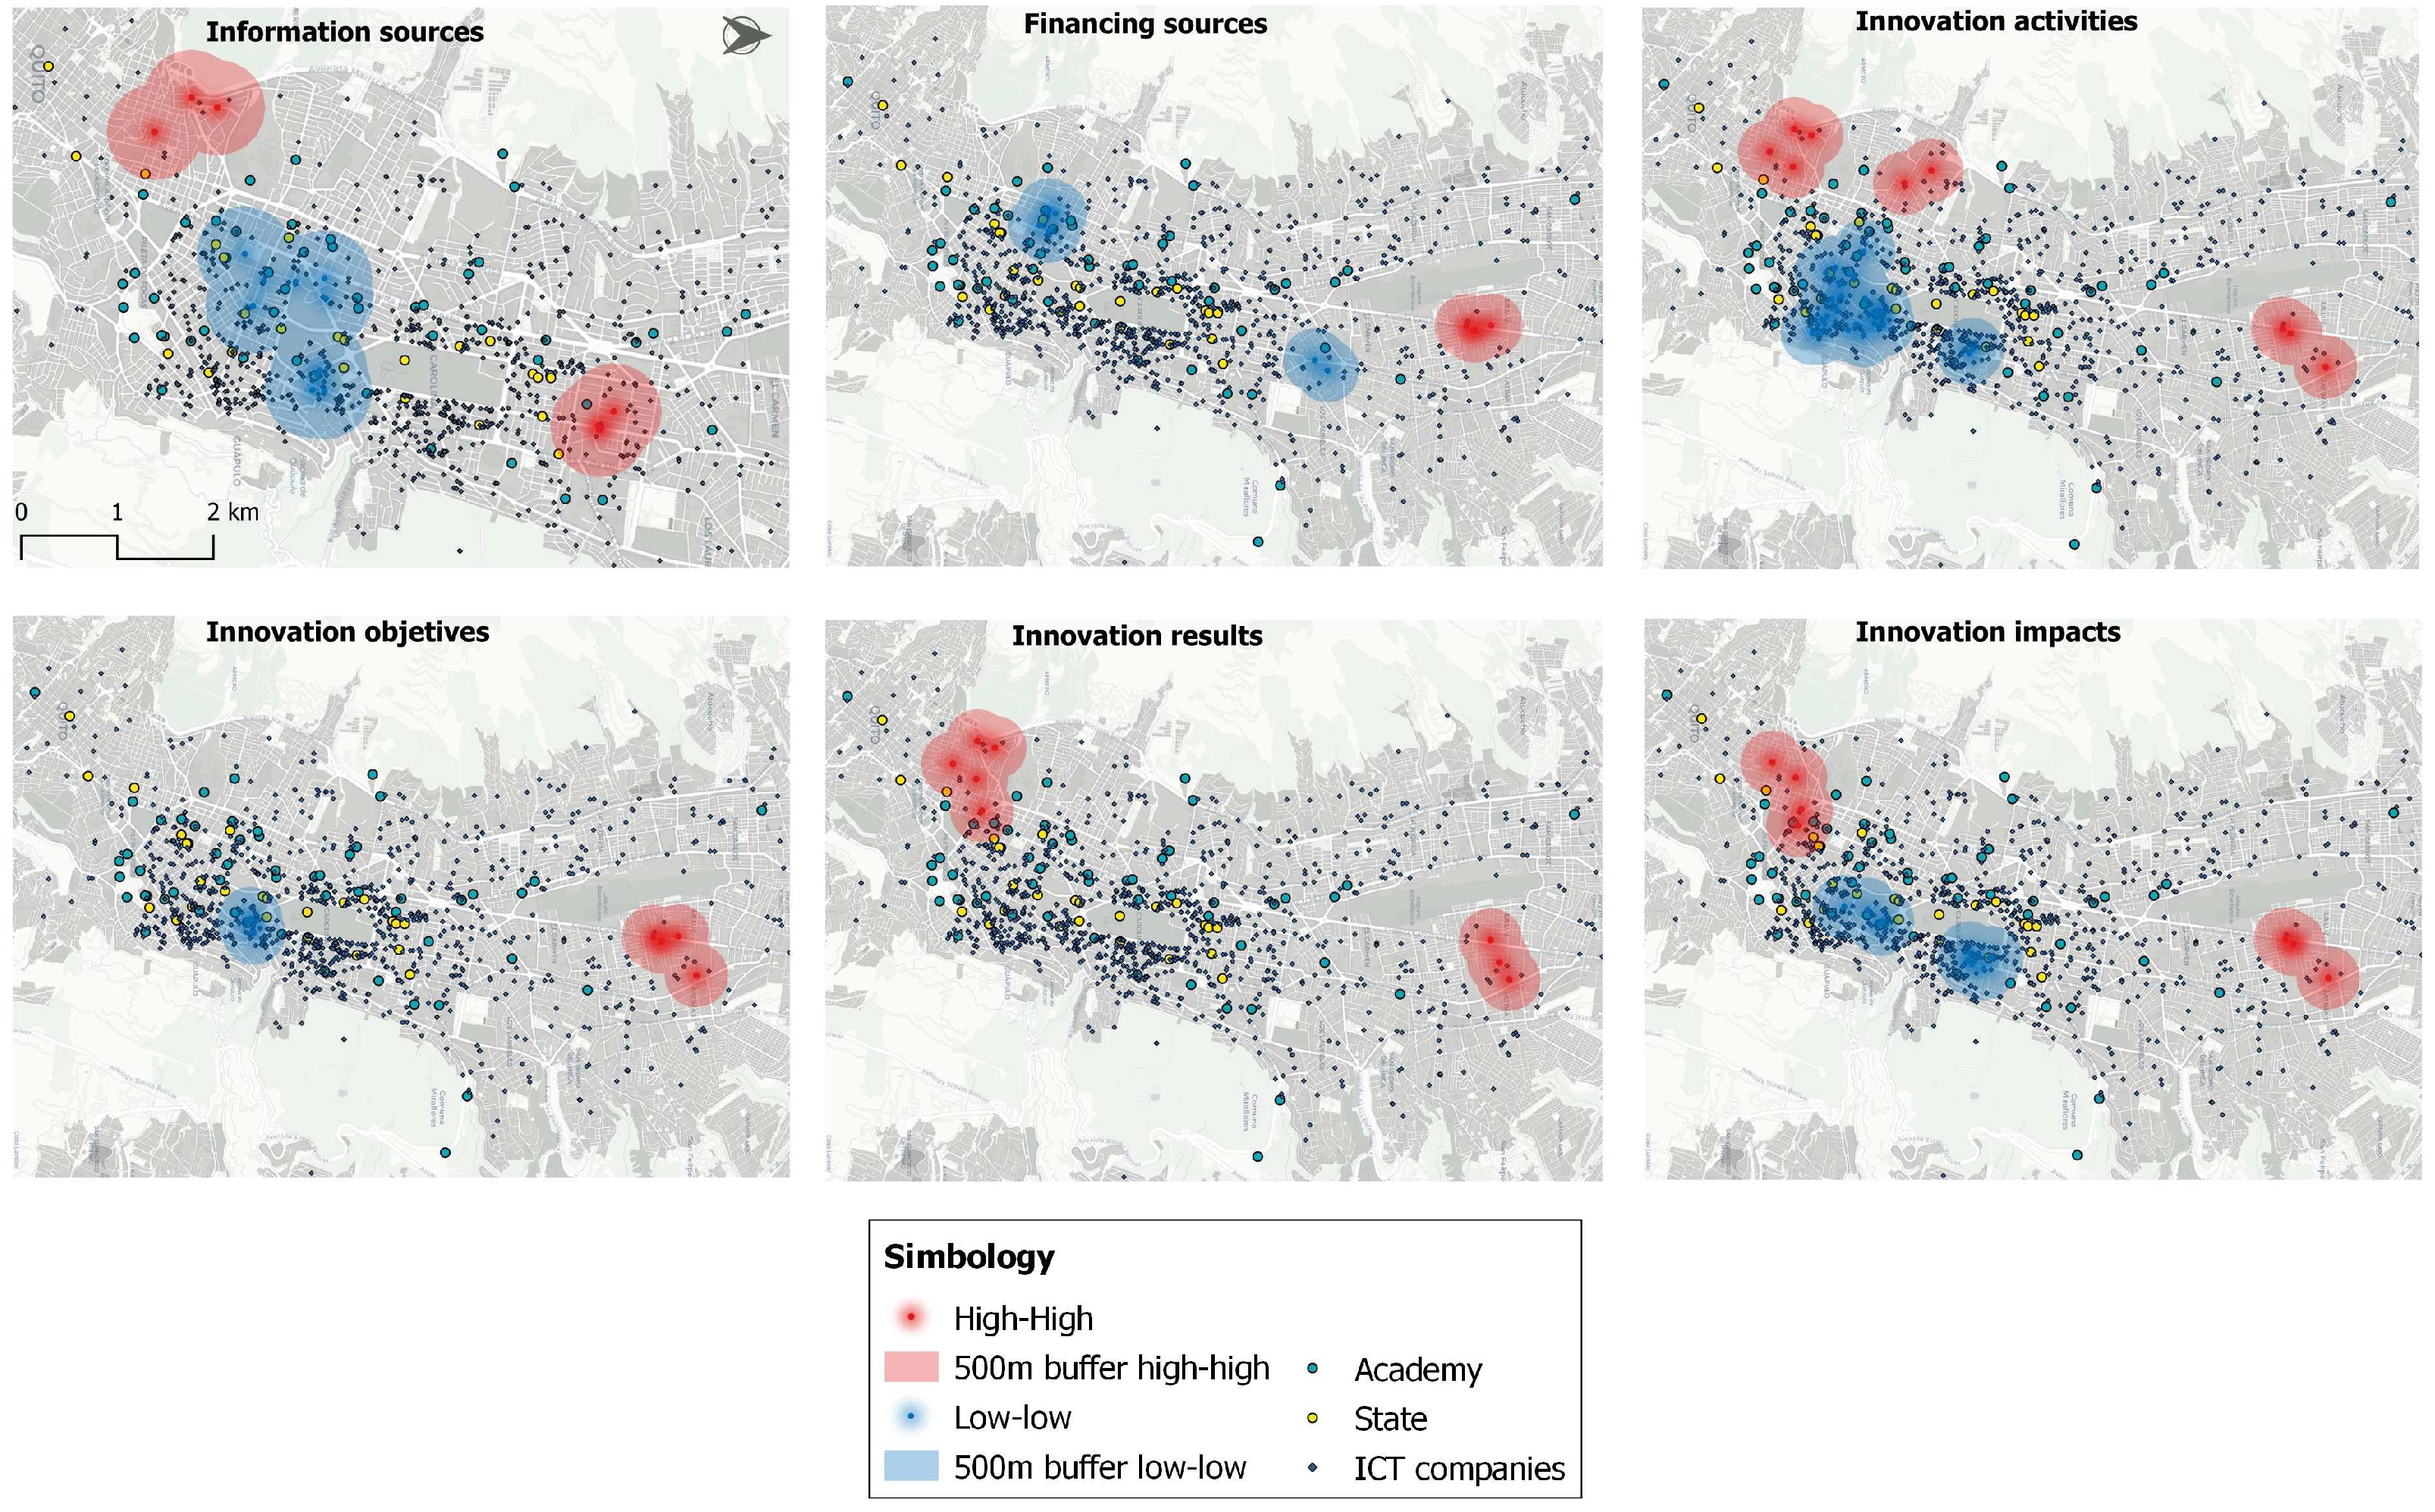
The High-High category suggests that in Quito, there are ICT companies scoring highly across all innovation potential factors, and they are neighbored by other companies with comparably high values. In contrast, the Low-Low, Low-High, and High-Low categories represent companies with either low or high scores, mirroring the values of their neighboring firms. For the LISA analysis, neighborhoods located at a distance of 1 km from the companies studied were specifically considered.
Finally, a detailed geographic proximity analysis was conducted between the ICT companies in Quito and academic and governmental organizations. For this, the geographic locations of universities, technical and technological institutes, public research institutes, ministries, and coworking spaces were collected. As a result, the geographic proximity analysis considered the clusters obtained from the application of local spatial association indicators for each factor and the previously and the previously mentioned organizations.
3. Results
3.1. Innovation in Developing Industrial Economies
The relationships and proximities between these thematic clusters can be visualized in Figure 4, which illustrates how these dimensions interact and overlap. After a review of the documents’ abstracts, cluster themes were identified as follows:
- (1)
- Innovation: This cluster focuses on key concepts such as research and development (R&D), intellectual property, technology transfer, and technology adoption, all of which are considered fundamental pillars for the emergence and strengthening of innovation processes.
- (2)
- Developing countries: This cluster brings together terms related to information technologies, information systems, industrial management, investments, decision-making, and institutional frameworks. These elements reflect the role that organizational and technological structures play in consolidating innovative ecosystems. In developed contexts, these conditions are more mature, which facilitates the adoption, adaptation, and optimization of technologies.
- (3)
- Economy: This cluster, focused on economic development, encompasses key aspects such as education, knowledge diffusion, public policies, patents, financing, and international cooperation. These elements are essential for creating an environment that fosters innovation as a driver of economic growth.
- (4)
- Sustainable development: This cluster identifies key trends related to sustainability, environmental protection, and climate change adaptation through innovation. In developing countries, green technology and sustainability policies help mitigate the effects of climate change and promote inclusive economic development.
The literature on innovation in developing industrial economies emphasizes that innovation is not exclusive to advanced economies. In fact, various thematic trends overlap due to the theoretical legacy consolidated in developed economies, which is later adapted and applied in developing economies [48]. Structural characteristics significantly influence the thematic nature of literature. The findings of several studies and our exploratory bibliometric analysis on innovation in developing countries suggest that, in these contexts, innovation is often shaped as a process of adoption and adaptation of knowledge and technologies originating in developed economies, through spillovers and incremental transfers in key areas such as management, information and communication technologies, economics, environment, agriculture, among others.
However, technology transfer from developed countries can be inappropriate, either because it is too costly to implement or has limited impact on the economy due to an unaddressed capability gap [49]. These processes depend on substantial and well-targeted technological efforts [50] and are shaped by the dynamics among geographic, socioeconomic, political, and legal subsystems [51] .
Much of the current debate on technology policy assumes that a country's productivity largely depends on its investment in research and development (R&D). Productivity and technological adoption capacity are linked to investment in research and development activities [52,53]. This contrasts with the reality in Ecuador, where the most recent official data on R&D investment dates back to 2014, when the country allocated 0.44% of its Gross Domestic Product (GDP) to these activities, and the target for 2028 is merely to reach 0.48%. These and other limitations in the management and policies of science, technology, and innovation act as major barriers to the adoption and diffusion of innovations, and also hinder informed decision-making.
From a Latin American regional development perspective, [54] define innovation as the introduction of knowledge with the aim of generating a productive process. The development process in low-income countries can be accelerated by leveraging existing knowledge and experience from foreign countries or by facilitating the exchange of external and local knowledge within a country [49]. The diffusion of knowledge toward developing countries depends on the degree of economic openness and on the policies and characteristics of the recipient country that promote foreign direct investment and international trade [51] . According to [48], this approach promotes a unique type of development that views technology and innovation as tools for bringing progress to a society from a dominant perspective, which may lead to dependence on the technological advances and innovations of developed countries.
In light of this, the literature suggests that the openness of a national innovation system is beneficial for the international flow of knowledge and technologies, as it facilitates productivity growth and the development of innovation capabilities in developing countries [49]. At the same time, it explicitly recognizes that policies must be context-specific. Institutions develop in response to changing economic and social conditions, and vice versa [55]. A national innovation system implies a new perspective on social policy, labor market policy, education, industrial policy, energy, environmental policy, and science and technology policy [56]. In this framework, developing an effective national innovation system requires that these policies be strategically aligned to facilitate knowledge exchange and institutional collaboration. In particular, it is essential to strengthen the link between scientific and technological institutions and the productive sector, as this connection is a key component to driving technological innovation in developing countries [48].
3.2. Innovation Potential - ICT Sector in Quito
The characterization of innovation potential, using the CRI questionnaire, indicates that ICT sector organizations in Quito do not view internal and external information as pivotal to their innovation processes. While certain financing sources, such as own resources and commercial banking, are valued, others, like governmental resources, seem to play a lesser role. The main observed innovation activities include investment in licenses and portfolio design, while R&D activities are less emphasized. While many companies don’t display clear innovation objective planning, some prioritize areas like digital transformation and cost reduction. The impacts of innovation vary among companies, with some recognizing tangible benefits, whereas others do not perceive significant impacts. These findings highlight the diversity and complexity of the innovation ecosystem, as indicated in Figure 5.
The measurements presented in Figure 6 correspond to the same companies evaluated across different innovation factors. From the visualization, it is evident that companies with the highest potential in capabilities, results, and innovation impact are distributed across various areas of the city, without a clear concentration in a specific zone, but rather appearing spatially randomly. It is also observed that companies with high values in certain factors are located near others with low values. Likewise, a company that stands out in one factor does not necessarily achieve high scores in others, suggesting that innovation capabilities and results can vary significantly within the same business ecosystem.
3.3. Spatial Autocorrelation
Figure 7 and Table 2 display a summary that includes the p-value and z-value corresponding to the analysis. The spatial autocorrelation of these factors was analyzed using the Moran Index, utilizing a distance-based neighborhood approach. After conducting the statistical test with a 95% confidence level, it was determined that the null hypothesis is not rejected. The results indicate that the companies studied show random values in each factor. Therefore, it is concluded that there is no spatial autocorrelation in the factors, suggesting that the values are random.
3.4. Local Indicators of Spatial Association (LISA)
The LISA analysis further solidified this finding by pointing out that high-concentration clusters are not close to public and academic institutions. Instead, they’re located outside the main economic Hubs of Quito. Such an observation underscores a lack of significant spatial interaction between the ICT sector and the pivotal public and academic entities in the sphere of innovation. As a result, innovation in Quito isn’t being centralized or predominantly propelled in any specific part of the city.
There are companies with high values in innovation information sources located outside of the High-High clusters, which are surrounded by companies with random values. The difference between these two groups lies in their geographical location. The companies that make up the High-High clusters are primarily located outside the economic agglomeration characteristic of north-central Quito, and therefore, are not close to the innovation actors considered in this study. This observation is reinforced when analyzing the Low-Low cluster, where a closer proximity to these actors is evident due to the geographical location of the cluster. Thus, these patterns suggest that companies acquiring internal and external information do so through a non-spatial proximity. This interpretation is supported by the fact that in the same areas where companies with high values of information sources are found, companies with low values are also located, meaning there is no spatial autocorrelation.
Figure 8.
Local Indicators of Spatial Association.
A typical proximity analysis operation is the search or selection of geometric entities that are within a certain distance from other geometric entities (57). In this sense, a geographic proximity analysis was carried out between ICT companies in Quito and academic and governmental organizations. To do this, the geographic location of universities, technical and technological institutes, public research institutes, ministries, and coworking spaces was collected. Consequently, the geographic proximity analysis considered the clusters obtained from the application of local spatial association indicators for each factor and the mentioned organizations.
The companies that make up the High-High clusters are mainly located outside the economic agglomeration typical of the northern-central area of Quito, and therefore, are not close to the ICT actors considered in this study. This observation is reinforced when analyzing the Low-Low cluster, where there is greater proximity to these ICT actors due to the geographic location of the cluster. Therefore, these patterns suggest that companies that acquire internal and external information do so through non-spatial proximity. This interpretation is supported by the fact that in the same areas where companies with high information source values are located, companies with low values are also found, meaning there is no spatial autocorrelation.
4. Discussion
The technological development models according to [58] can be categorized into two: the scientific supply-side thinking, which promotes the generation of knowledge that would in itself generate innovations, and the innovative technological development, which challenges the linear supply-side model and proposes starting from the demand of the productive sector and social needs to guide innovation activities. Transforming demands into technological innovations requires a joint effort between the government, academia, and the ICT sector. One of the approaches developed to address this issue is open innovation, proposed by [59]. In this approach, innovation is conceived as a process in which both internal and external actors play a fundamental role. The importance of knowledge as a driver of innovation and its related processes benefits from proximity [15]. Geographical proximity alone is not a sufficient factor to foster collaboration and improve knowledge transfer. However, according to [7,12,11], it facilitates other non-spatial proximity dimensions, such as social, organizational, and cognitive proximity among the actors in the innovation ecosystem.
Addressing this complexity requires more comprehensive approaches to innovation measurement, essential for both business management and public policy formulation [3,4,7]. The Oslo and Bogotá manuals are a direct reference regarding the measurement and definition of innovation. The study by [20] highlights the importance of measuring innovation for academia and industry. Furthermore, it contributes to the listing of metrics proposed in the literature and their classification according to the aspect of innovation that is used for measurement.
Specialized factors, primarily those that are fundamental for innovation such as academic research, are not only essential for achieving high levels of productivity, but they tend to be less available from other places [60]. Geographical proximity can be enhanced in the context of an urban area through the creation of localized innovation clusters. The city is a tangible phenomenon with specific genetic roots and internal organizational dynamics [61]. The production of space in Quito has been characterized by the presence of agglomeration centers and regular flow patterns. This has allowed for the formulation of policies related to territorial planning, which aim to facilitate environments for the construction of a knowledge city, in which significant synergies are generated among the actors of innovative ecosystems. Given this phenomenon, the literature considers that geographical proximity is a driver of innovation, as it promotes and facilitates cooperation between local actors, thus enhancing innovation capabilities [62]. Geographical proximity tends to facilitate the exchange of knowledge through the ease of face-to-face interactions, as suggested by [63]. Therefore, according to [64], managing knowledge is essential for innovation in organizations.
The concept of spatial dependence suggests that the capabilities, outcomes, and impacts of innovation in a company can be affected by what is happening in nearby companies. This implies the need to determine which other units in the geographical space have an influence on the unit being considered. Contributions found in the literature suggest using a combination of neighborhoods. Determining the appropriate specification for the spatial weight matrix, according to [42], is a methodological challenge that arises in spatial econometrics. Choosing the relevant distance of spatial association becomes complicated when the spatial arrangement of observations is irregular, as it then becomes possible for an infinite combination of distance measures. In this case, network or graph models can offer an alternative to direct geographical distance. This can be relevant in an urban environment like Quito, where the shortest route can have a more significant impact. This gives rise to the notion of accessibility, which, when considered in a space-time context, allows for a geographical proximity analysis based on isochrones. This approach could provide a more accurate perspective than an analysis based on an influence area defined by a specific radius. This study focused on analyzing the ICT sector of Quito and its geography of innovation through geographical proximity to universities and government institutions, aiming to understand the importance of location. However, a recognized limitation is that other economic sectors that are also part of Quito’s economic agglomerations’ characteristics were not included. The presence and interaction of these other sectors can play a relevant role in shaping the city’s innovation geography. Understanding the interactions and relationships between these sectors, possibly using origin and destination matrices, can provide a more holistic view of the importance of location and geographical proximity in innovation.
5. Conclusions
The geography of innovation highlights the importance of location in generating competitive advantages. To determine if geographical proximity facilitates innovation, ICT companies in Quito were geographically located, along with governmental and academic institutions. This allowed for the identification of agglomerations in the north-central area of Quito, an area influenced by the industrialization, modernization, and urbanization that the capital has experienced since the middle of the last century. In these zones, centripetal forces drive the concentration of economic activity. However, from the analysis of spatial association and interaction, it is concluded that a consolidated innovation ecosystem is not identified in these spaces. As [65] suggests, to change spatial distributions, decisions in politics and economics that occur in space must be acted upon. Therefore, planning instruments were reviewed that promote driving innovation ecosystems in Quito, allowing the inclusion of the temporal dynamic to notice how these spatial configurations might change.
The geographical proximity analysis was conducted to examine the spatial relationship of the CRI factors. Hypotheses were formulated for each factor, considering a distance-based neighborhood approach. However, the results showed that there is no spatial autocorrelation in the information sources, funding sources, innovation activities, innovation objectives, outcomes, and impacts of innovation. Therefore, the null hypotheses put forth were not rejected. Moreover, through the LISA analysis, High-High clusters were identified that are not found in the economic agglomeration of the ICT sector. This is evident in the geographical proximity analysis, where the influence area of clusters with high values is not close to public and academic institutions, nor to other ICT companies. On the contrary, clusters with low values show a higher concentration of ICT companies in their influence area, as well as public and private institutions. Consequently, the capabilities, outcomes, and impacts of innovation in the Quito ICT sector occur in non-spatial proximity dimensions.
The geography of innovation acknowledges that geographical location matters as it allows for a variety of interdependencies in space and time. Understanding whether geographical proximity facilitates innovation requires properly conceptualizing it and considering a multidisciplinary approach that analyzes the context in which innovation processes are to be measured, to optimize their management. This information enabled the representation of the geographical distribution of innovation capabilities, outcomes, and impacts. The results of the study suggest that current policies and initiatives in Ecuador may not be effectively fostering innovation in Ecuador. Unlike the models proposed by [66] and [67], the research shows that companies, governmental, and academic institutions are not linked and concentrated in the same space. This is evidenced by the responses from the CRI questionnaire information sources. Therefore, it is essential for the relevant authorities to review and adopt policies and initiatives based on geographical information that serves as a basis for informing decision-making and providing concrete solutions in city planning. To strengthen and promote an innovation ecosystem in Quito, it is crucial to consider specific actions that address the challenge of mobility in the city.
Author Contributions
Conceptualization, A.B. and A.R.-L.; methodology, A.B. and A.R.-L.; software, A.B.; validation, A.B. , A.R.-L., V.M, Z.A.; formal analysis, A.B.; investigation, A.B.; data curation, A.B., V.M; writing—original draft preparation, A.B.; writing—review and editing, A.B., Z.A. and A.R.-L; visualization, A.B.; supervision, A.R.-L.; project administration, A.R.-L. All authors have read and agreed to the published version of the manuscript.
Funding
This research received no external funding.
Institutional Review Board Statement
This study has considered that it does not require an additional approval of an ethics committee as it complies with Ecuadorian legislation “Ley Orgánica de Protección de Datos Personales (LOPDP)”—Organic Law on Protection of Personal Data. Under Article 7, the processing of personal data is legitimate and licit when consent is obtained for specific purposes. This research meets this requirement as participants have voluntarily provided their informed and unequivocal consent for the use of their data, with the study’s objectives and processing methods clearly outlined in the Informed Consent Statement, previously sent. This also ensures compliance with Article 8 of the LOPDP, as consent follows the principles: Free: Participants have provided explicit and voluntary consent. Specific: The study's objectives and data use are clearly outlined, ensuring specificity Informed: All participants were fully informed of the processing details Unequivocal: The data collection process was designed to make the act of consent unambiguous. Furthermore, the study adheres to Article 26, which permits the processing of sensitive data for scientific research purposes. This study has compiled a declaration of ethnicity as the only data that may be considered sensitive according to LODPD. The research employs anonymization of participants, ensuring they cannot be identified, which further aligns with national legislation requirements. Finally, LOPDP provides additional exceptions to processing of personal data for scientific research under Articles 26, 32, and 36, allowing archival for historical, or statistical purposes. By meeting these conditions, the study complies with the national law's specific provisions for handling personal data in a scientific context, thereby exempting it from additional ethical approvals.
Acknowledgments
The authors extend their gratitude to the following key stakeholders in Ecuador’s Entrepreneurship and Innovation Ecosystem for providing institutional support for this work: Escuela Politécnica Nacional (EPN), Corporación Ecuatoriana para el Desarrollo de la Investigación y la Academia (CEDIA), Corporación de Promoción Económica ConQuito, and Cámara de Innovación y Tecnología Ecuatoriana (CITEC). The authors also acknowledge the contributions of academic members and researchers from the Observatorio de la Organización y la Industria (O2i-EPN), whose cooperation was relevant to this study.
Conflicts of Interest
The authors declare no conflicts of interest.
References
- Robalino-López, A.; Ramos, V.; Franco, A.; Unda, X. Diseño de un modelo-herramienta para la medición de la innovación en la industria ecuatoriana. CienciAmérica Rev. Divulg. Científica Univ. Tecnológica Indoamérica 2017, 6. [Google Scholar]
- Morales, V. P.; Robalino-López, J. A.; Rodríguez, C. A. Medición Del Potencial de Innovación En Las Organizaciones: Propuesta Metodológica Para El Contexto Ecuatoriano. Rev. Gest. E Secr. Manag. Adm. Prof. Rev. 2023, 14, 6149–6168. [Google Scholar] [CrossRef]
- Carter, A. P. Measurement of the Clustering and Dispersion of Innovation. In The Economic Geography of Innovation; Polenske, K. R., Ed.; Cambridge University Press, 2007; pp 13–29. [CrossRef]
- Ratanawaraha, A.; Polenske, K. R. Measuring the Geography of Innovation: A Literature Review. In The Economic Geography of Innovation; Polenske, K. R. E., Ed.; Cambridge University Press, 2007; pp 30–59.
- Santos, M. Economia espacial: críticas e alternativas, 2. ed.; Coleção Milton Santos; Editora da Univ. de Sao Paulo: Sao Paulo, 2003. [Google Scholar]
- Feldman, M. P.; Kogler, D. F. Stylized Facts in the Geography of Innovation. In Handbook of the Economics of Innovation; Elsevier, 2010; Vol. 1, pp 381–410. [CrossRef]
- Crescenzi, R.; Iammarino, S.; Ioramashvili, C.; Rodríguez-Pose, A.; Storper, M. The Geography of Innovation and Development: Global Spread and Local Hotspots. LSE Res. Online Doc. Econ. 2020. [Google Scholar]
- Storper, M. Las economías regionales como activos relacionales. Ekon. Rev. Vasca Econ. 1998, No. 41, 10–45. [Google Scholar] [CrossRef]
- Delgado, M. The Co-Location of Innovation and Production in Clusters. Ind. Innov. 2020, 27, 842–870. [Google Scholar] [CrossRef]
- Breschi, S. The Geography of Innovation and Economic Clustering: Some Introductory Notes. Ind. Corp. Change 2001, 10, 817–833. [Google Scholar] [CrossRef]
- Hansen, T. Substitution or Overlap? The Relations between Geographical and Non-Spatial Proximity Dimensions in Collaborative Innovation Projects. Reg. Stud. 2015, 49, 1672–1684. [Google Scholar] [CrossRef]
- Porter, M.; Stern, S. Innovation: Location Matters. MIT Sloan Manag. Rev. 2001, 42, 28–36. [Google Scholar]
- Feldman, M. P. Geography of Innovation. In The Palgrave Encyclopedia of Strategic Management; Augier, M., Teece, D. J., Eds.; Palgrave Macmillan UK: London, 2016. [Google Scholar] [CrossRef]
- Gordon, I. R.; McCann, P. Innovation, Agglomeration, and Regional Development. J. Econ. Geogr. 2005, 5, 523–543. [Google Scholar] [CrossRef]
- Santamaría, L.; Nieto, M. J.; Rodríguez, A. Failed and Successful Innovations: The Role of Geographic Proximity and International Diversity of Partners in Technological Collaboration. Technol. Forecast. Soc. Change 2021, 166, 120575. [Google Scholar] [CrossRef]
- Carter, A. Measurement of the Clustering and Dispersion of Innovation. In The Economic Geography of Innovation; Polenske, K., Ed.; Cambridge University Press, 2007. [CrossRef]
- Jensen, P.; Webster, E. ANOTHER LOOK AT THE RELATIONSHIP BETWEEN INNOVATION PROXIES*. Aust. Econ. Pap. 2009, 48, 252–269. [Google Scholar] [CrossRef]
- Blake, M. K.; Hanson, S. Rethinking Innovation: Context and Gender. Environ. Plan. Econ. Space 2005, 37, 681–701. [Google Scholar] [CrossRef]
- Baregheh, A.; Rowley, J.; Sambrook, S. Towards a Multidisciplinary Definition of Innovation. Manag. Decis. 2009, 47, 1323–1339. [Google Scholar] [CrossRef]
- Edison, H.; bin Ali, N.; Torkar, R. Towards Innovation Measurement in the Software Industry. J. Syst. Softw. 2013, 86, 1390–1407. [Google Scholar] [CrossRef]
- Camio, M. I.; Rébori, A.; Romero, M. del C.; Álvarez, M. B. Innovación y Software: Diagnóstico y Medición En Empresas Argentinas, 1a edición.; Colección Saberes; Editorial UNICEN: Tandil, 2014. [Google Scholar]
- Porter, M. The Competitive Advantage of Nations. Harvard Business Review, /: https, 1 March 1990. [Google Scholar]
- ICT and Economic Growth: Evidence from OECD Countries, Industries and Firms; Pilat, D. , Organisation for Economic Co-operation and Development, Eds.; Information and communications technologies; OECD Publications: Paris, 2003. [Google Scholar]
- Remeikiene, R.; Gaspareniene, L.; Fedajev, A.; Vebraite, V. The Role of ICT Development in Boosting Economic Growth in Transition Economies. J. Int. Stud. 2021, 14, 9–22. [Google Scholar] [CrossRef]
- Ganchala, R.; Robalino-López, A.; Aniscenko, Z. High-Growth Firms’ Behavior in Latam: The Case of ICT Sector in Ecuador. J. Technol. Manag. Innov. 2022, 17, 48–62. [Google Scholar] [CrossRef]
- Archibugi, D.; Planta, M. Measuring Technological Change through Patents and Innovation Surveys. Technovation 1996, 16, 451–519. [Google Scholar] [CrossRef]
- Paci, R.; Usai, S. [Externalities, Knowledge Spillovers and the Spatial Distribution of Innovationtitle Found]. GeoJournal 1999, 49, 381–390. [Google Scholar] [CrossRef]
- Serrano, R.; Paci, R.; Usai, S. Spatial distribution of innovation activity. The case of European regions; Working Paper CRENoS; 200310; Centre for North South Economic Research, University of Cagliari and Sassari, Sardinia, 2003. https://ideas.repec.org/p/cns/cnscwp/200310.html (accessed 2022-08-15).
- Dwivedi, A.; Arora, A. Economic Geography of Innovation in India: An Empirical Investigation. Innov. Dev. 2020, 10, 395–412. [Google Scholar] [CrossRef]
- Malecki, E. J. The R&D Location Decision of the Firm and “Creative” Regions—a Survey. Technovation 1987, 6, 205–222. [Google Scholar] [CrossRef]
- Hu, E.; Hu, D.; He, H. Spatial Patterns of Urban Innovation and Their Evolution from Perspectives of Capacity and Structure: Taking Shenzhen as an Example. ISPRS Int. J. Geo-Inf. 2021, 11. [Google Scholar] [CrossRef]
- Olah, D.; Alpek, B. L. The Theoretical Model of Spatial Production for Innovation. J. Innov. Entrep. 2021, 10. [Google Scholar] [CrossRef]
- Tu, W.; Zhang, L.; Sun, D.; Mao, W. Evaluating High-Tech Industries’ Technological Innovation Capability and Spatial Pattern Evolution Characteristics: Evidence from China. J. Innov. Knowl. 2023, 8. [Google Scholar] [CrossRef]
- Musella, G.; Castellano, R.; Bruno, E. Evaluating the Spatial Heterogeneity of Innovation Drivers: A Comparison between GWR and GWPR. METRON 2023, 81, 343–365. [Google Scholar] [CrossRef]
- Tavassoli, S.; Karlsson, C. The Role of Location on Complexity of Firms’ Innovation Outcome. Technol. Forecast. Soc. Change 2021, 162, 120404. [Google Scholar] [CrossRef]
- Feldman, M. P. Spatial Patterns of Innovation. In The Geography of Innovation; Antonelli, C., Carlsson, B., Series Eds.; Economics of Science, Technology and Innovation. In The Geography of Innovation; Antonelli, C., Carlsson, B., Series Eds., Economics of Science, Technology and Innovation, Eds.; Springer Netherlands: Dordrecht, 1994; Antonelli, C., Carlsson, B., Series Eds. [Google Scholar] [CrossRef]
- Andrews, M. J.; Whalley, A. 150 Years of the Geography of Innovation. Reg. Sci. Urban Econ. 2021, 103627. [Google Scholar] [CrossRef]
- OECD. The OECD Innovation Strategy: Getting a Head Start on Tomorrow, 2010. [CrossRef]
- Anasi, C.; Robalino-López, A.; Morales, V.; Almeida, C. Measuring Innovation Potential in Ecuadorian ICT Companies: Development and Application of the CRI-IRT Model. Information 2025, 16. [Google Scholar] [CrossRef]
- Tobler, W. R. A Computer Movie Simulating Urban Growth in the Detroit Region. Econ. Geogr. 1970, 46, 234. [Google Scholar] [CrossRef]
- Siabato, W.; Guzmán-Manrique, J. La Autocorrelación Espacial y El Desarrollo de La Geografía Cuantitativa. Cuad. Geogr. Rev. Colomb. Geogr. 2019, 28, 1–22. [Google Scholar] [CrossRef]
- Anselin, L. Spatial Econometrics: Methods and Models; Studies in Operational Regional Science; Springer Netherlands: Dordrecht, 1988. [Google Scholar] [CrossRef]
- Getis, A. Reflections on Spatial Autocorrelation. Reg. Sci. Urban Econ. 2007, 37, 491–496. [Google Scholar] [CrossRef]
- Getis, A.; Ord, J. K. The Analysis of Spatial Association by Use of Distance Statistics. Geogr. Anal. 2010, 24, 189–206. [Google Scholar] [CrossRef]
- Anselin, L.; Rey, S. Properties of Tests for Spatial Dependence in Linear Regression Models. Geogr. Anal. 1991, 23, 112–131. [Google Scholar] [CrossRef]
- Getis, A. A History of the Concept of Spatial Autocorrelation: A Geographer’s Perspective. Geogr. Anal. 2008, 40, 297–309. [Google Scholar] [CrossRef]
- Anselin, L. Local Indicators of Spatial Association-LISA. Geogr. Anal. 1995, 27, 93–115. [Google Scholar] [CrossRef]
- Lema, R.; Kraemer-Mbula, E.; Rakas, M. Innovation in Developing Countries: Examining Two Decades of Research. Innov. Dev. 2021, 11, (2–3). [Google Scholar] [CrossRef]
- Fu, X.; Shi, L. Direction of Innovation in Developing Countries and Its Driving Forces. SSRN Electron. J. 2023. [Google Scholar] [CrossRef]
- Lall, S. Technological Capabilities and Industrialization. World Dev. 1992, 20, 165–186. [Google Scholar] [CrossRef]
- Zanello, G.; Fu, X.; Mohnen, P.; Ventresca, M. The Creation and Diffusion of Innovation in Developing Countries: A Systematic Literature Review. J. Econ. Surv. 2016, 30, 884–912. [Google Scholar] [CrossRef]
- Coe, D. T.; Helpman, E.; Hoffmaister, A. W. North-South R & D Spillovers. Econ. J. 1997, 107, 134–149. [Google Scholar] [CrossRef]
- Lederman, D.; Maloney, W. F. R&D and Development; World Bank, Washington, DC, 2003. [CrossRef]
- Sábato, J.; Botana, N. La ciencia y la tecnología en el desarrollo futuro de América Latina. 1968, No. Revista de la Integración, INTAL, 11.
- Altenburg, T. Building Inclusive Innovation Systems in Developing Countries: Challenges for IS Research. In Handbook of Innovation Systems and Developing Countries; Lundvall, B.-Å., Joseph, K. J., Chaminade, C., Vang, J., Eds.; Edward Elgar Publishing, 2009. [CrossRef]
- Lundvall, B.-Å.; Johnson, B.; Andersen, E. S.; Dalum, B. National Systems of Production, Innovation and Competence Building. Res. Policy 2002, 31, 213–231. [Google Scholar] [CrossRef]
- Martínez Llario, J. C. PostGIS 2: análisis espacial avanzado, 2a ed.; CreateSpace Independent: Lugar de publicación no identificado, 2018. [Google Scholar]
- Castellanos Domínguez, Ó. F. Gestión tecnológica: de un enfoque tradicional a la inteligencia.; Facultad de Ingeniería Universidad Nacional de Colombia, 2008.
- Chesbrough, H. W. Open Innovation: The New Imperative for Creating and Profiting from Technology, Nachdr.; Harvard Business School Press: Boston, Mass, 2003. [Google Scholar]
- Porter. Location, Competition, and Economic Development: Local Clusters in a Global Economy. Econ. Dev. Q. 2000, 14, 15–34. [Google Scholar] [CrossRef]
- Storper, M.; Scott, A. J. Current Debates in Urban Theory: A Critical Assessment. Urban Stud. 2016, 53, 1114–1136. [Google Scholar] [CrossRef]
- Ben Letaifa, S.; Rabeau, Y. Too Close to Collaborate? How Geographic Proximity Could Impede Entrepreneurship and Innovation. J. Bus. Res. 2013, 66, 2071–2078. [Google Scholar] [CrossRef]
- Grillitsch, M.; Tödtling, F.; Höglinger, C. Variety in knowledge sourcing, geography and innovation: Evidence from the ICT sector in Austria. Pap. Reg. Sci. 2015, 94, 25–43. [Google Scholar] [CrossRef]
- Ibujes Villacis, J. M.; Benavides Pazmino, M. A. Contribution of Technology to the Productivity of Small and Medium-Sized Enterprises in the Textile Industry in Ecuador. Cuad. Econ.-SPAIN 2018, 41, 140–150. [Google Scholar]
- Buzai, G. La Geotecnología: ¿Nuevo Paradigma de La Geografía o Paradigma Geográfico de La Ciencia? Rev. Catalana Geogr. 2011, 16. [Google Scholar]
- Galante, O.; Marí, M. Jorge Sabato y El Pensamiento Latinoamericano En Ciencia, Tecnología, Desarrollo y Dependencia. Cienc. Tecnol. Política 2020, 3. [Google Scholar] [CrossRef]
- Leydesdorff, L. Triple Helix of University-Industry-Government Relations. In Encyclopedia of Creativity, Invention, Innovation and Entrepreneurship; Carayannis, E. G., Ed.; Springer New York: New York, NY, 2013. [Google Scholar] [CrossRef]
Figure 1.
ICT Sector in Quito.
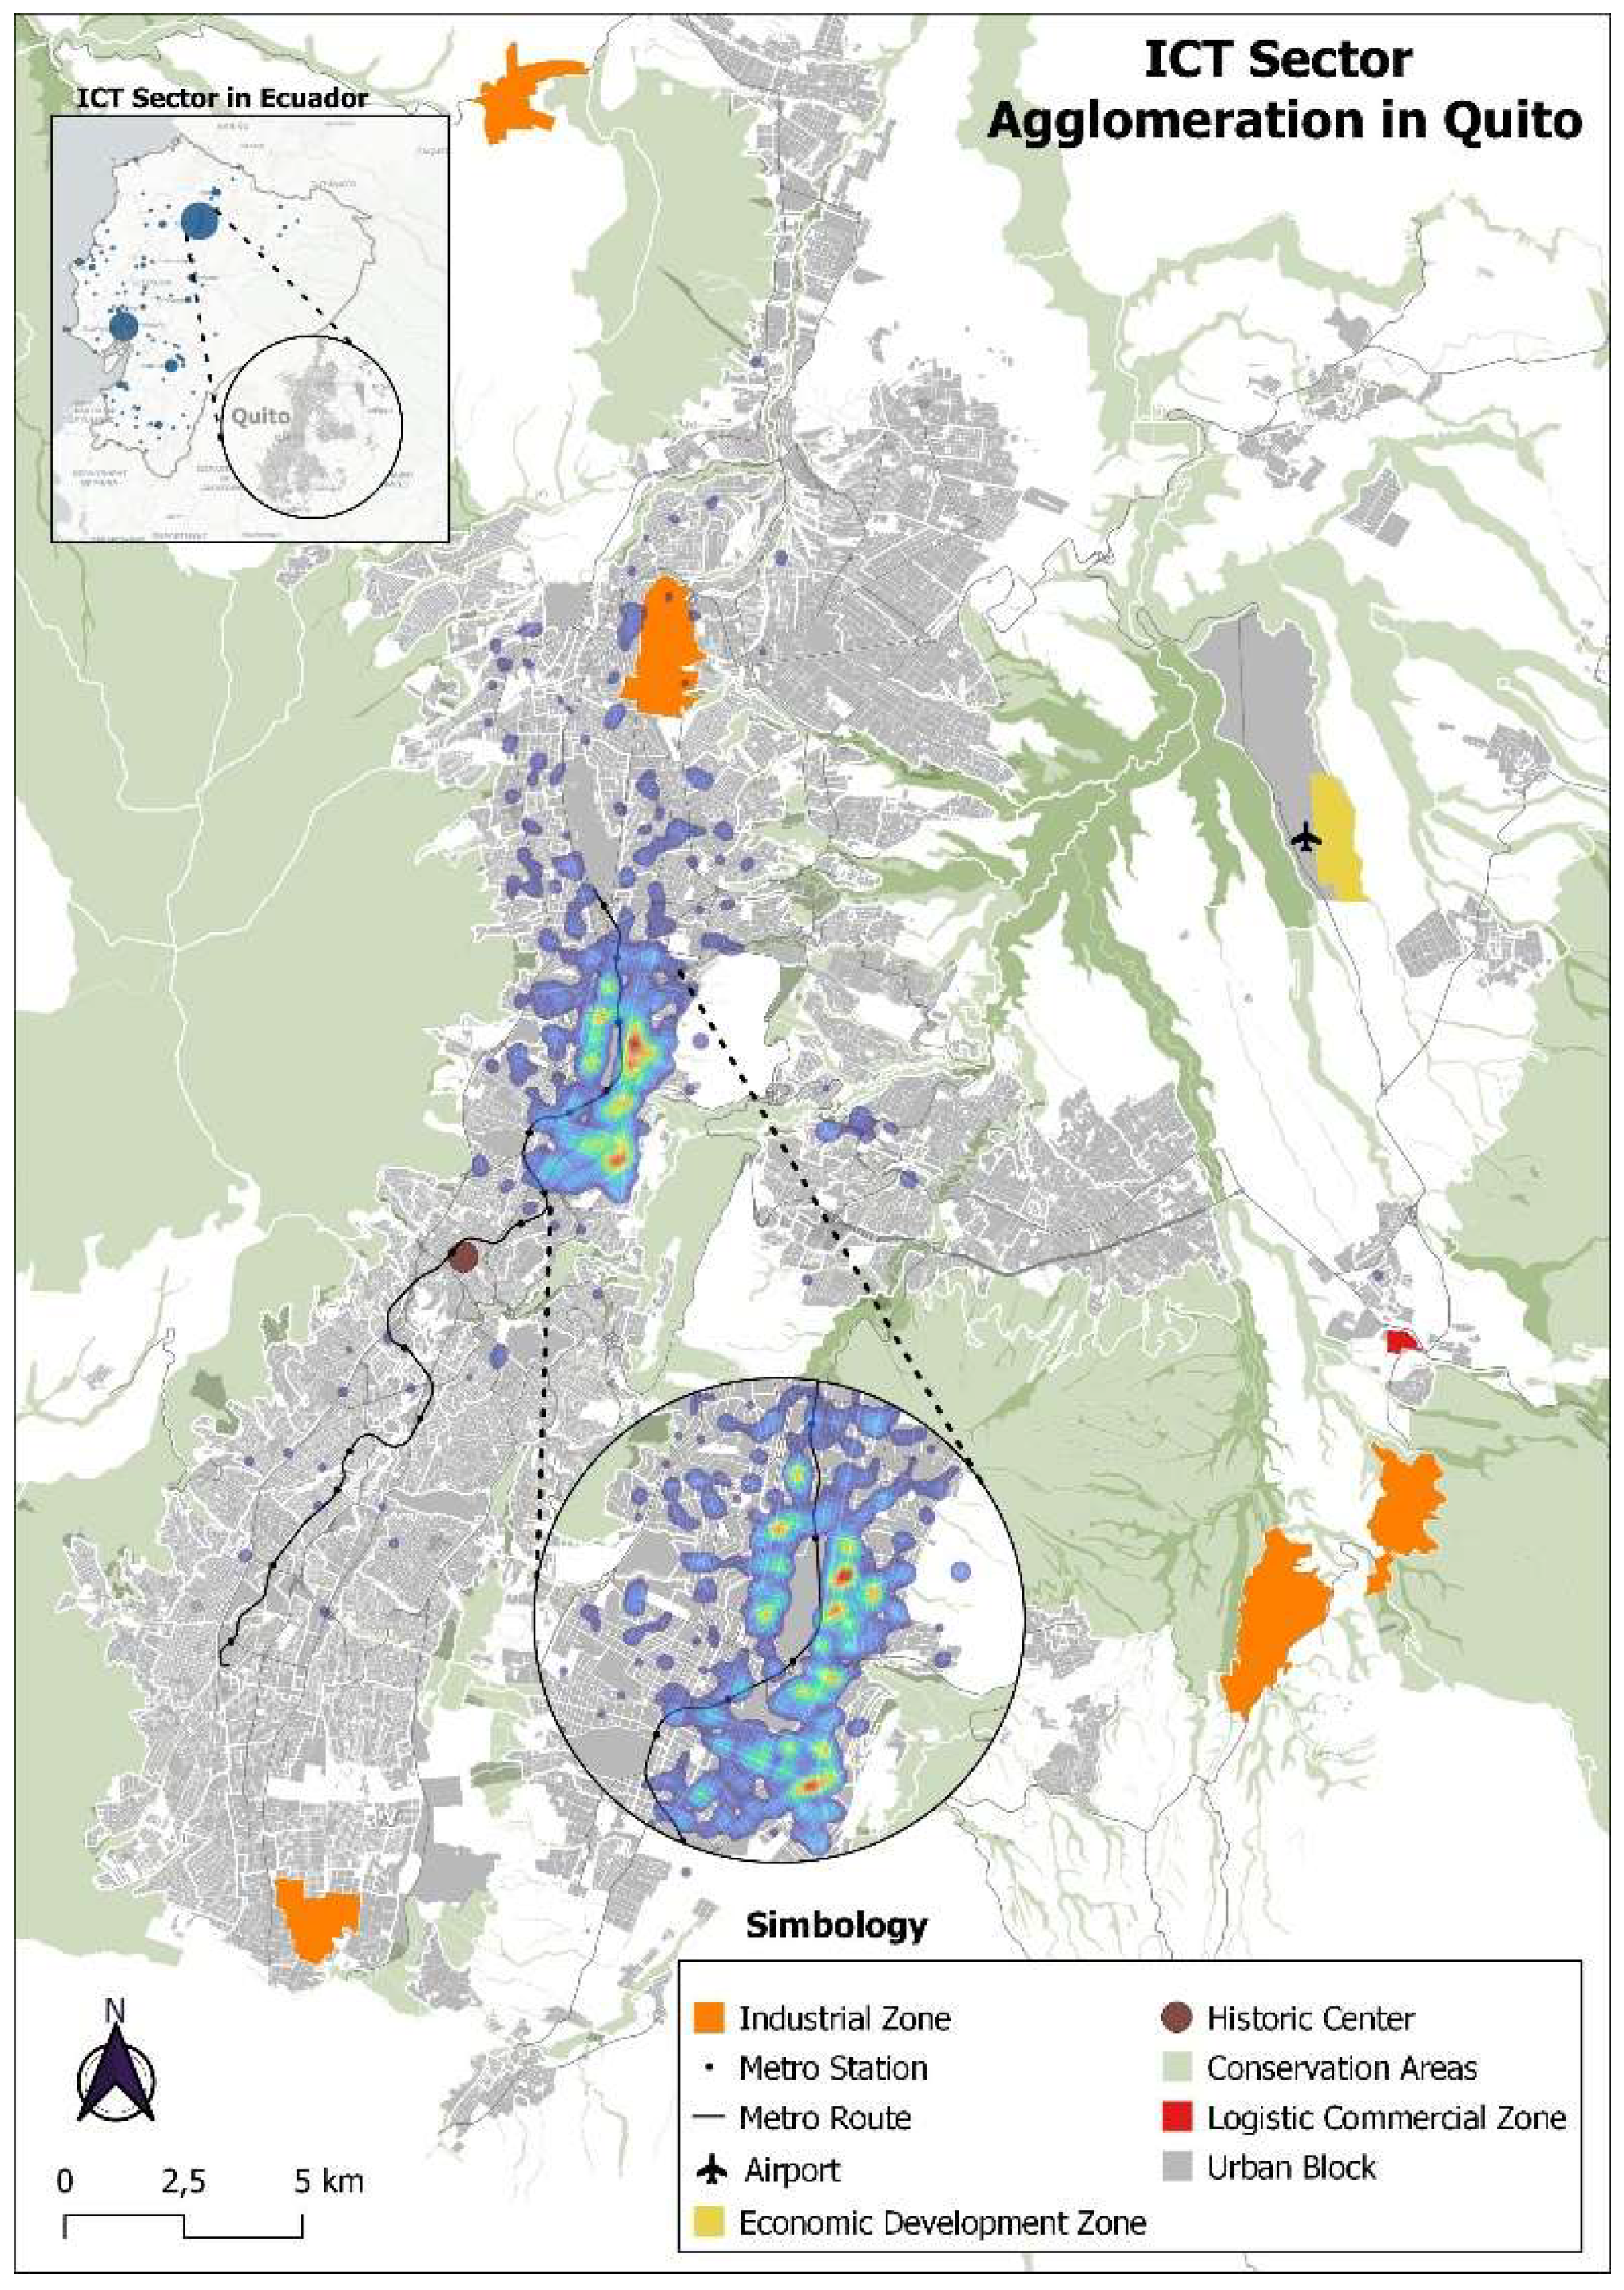
Figure 2.
ICT Sector, Government Institutios and Universities in Quito.
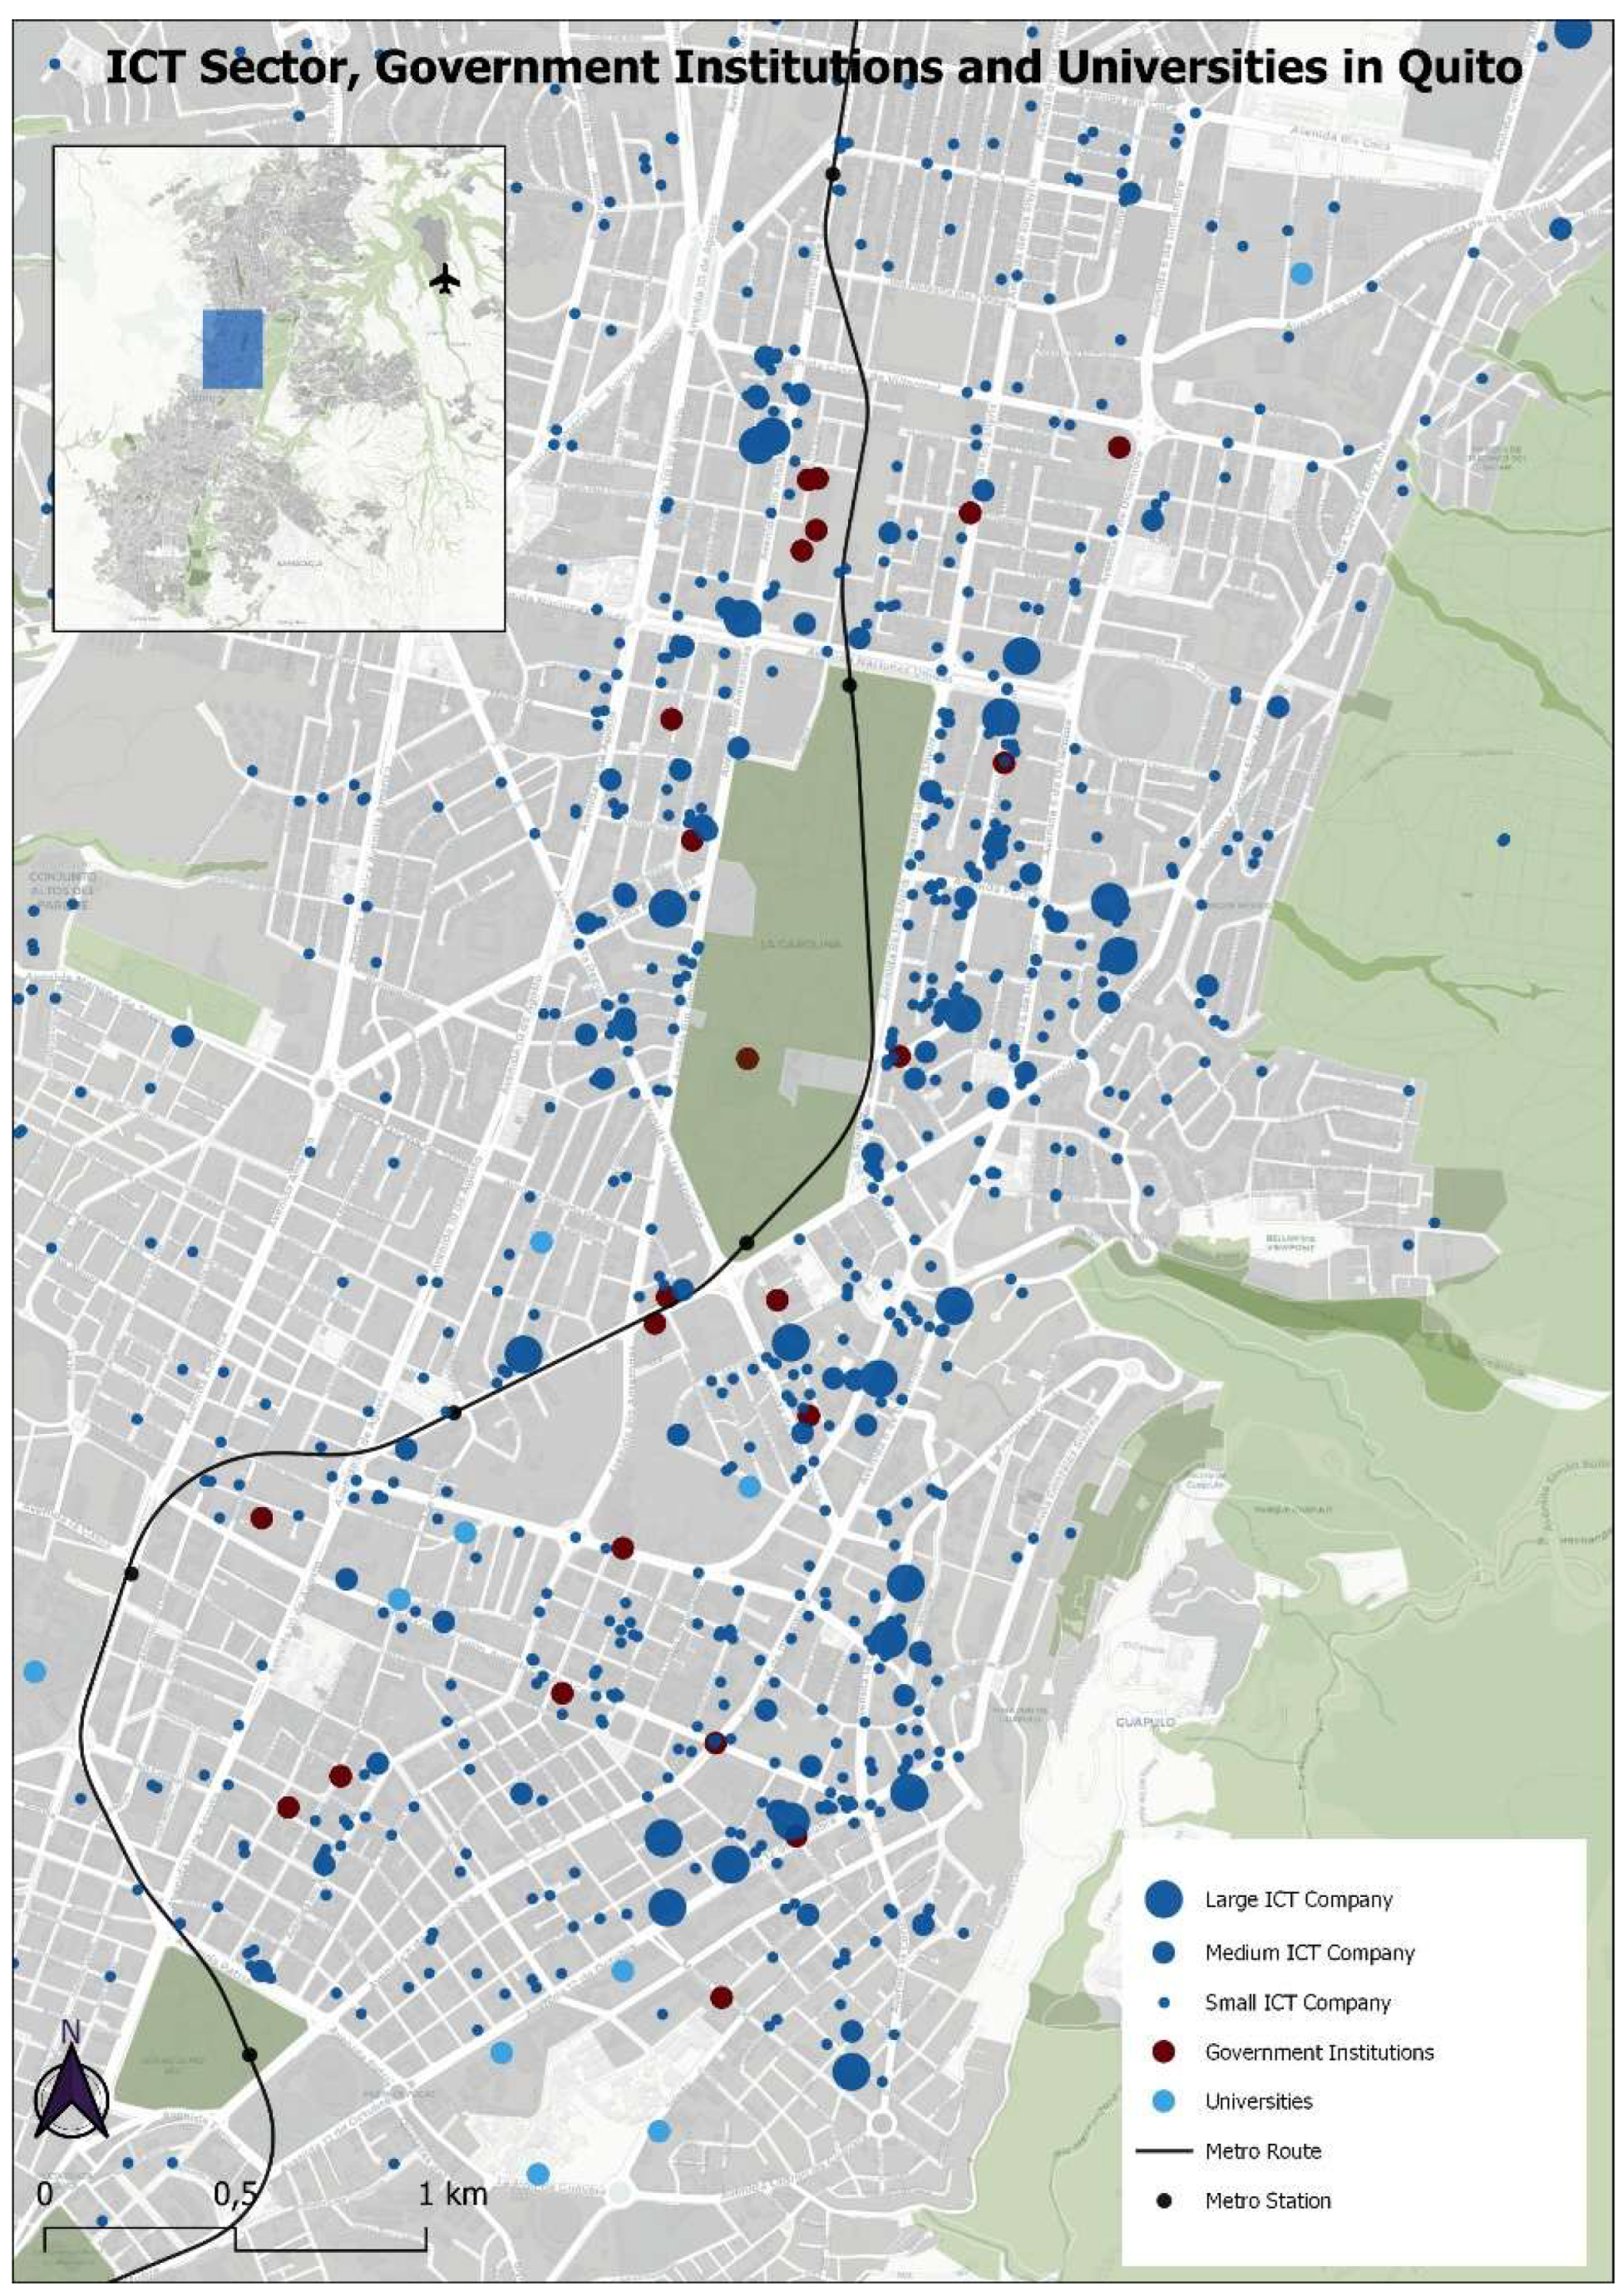
Figure 3.
Units of observation.
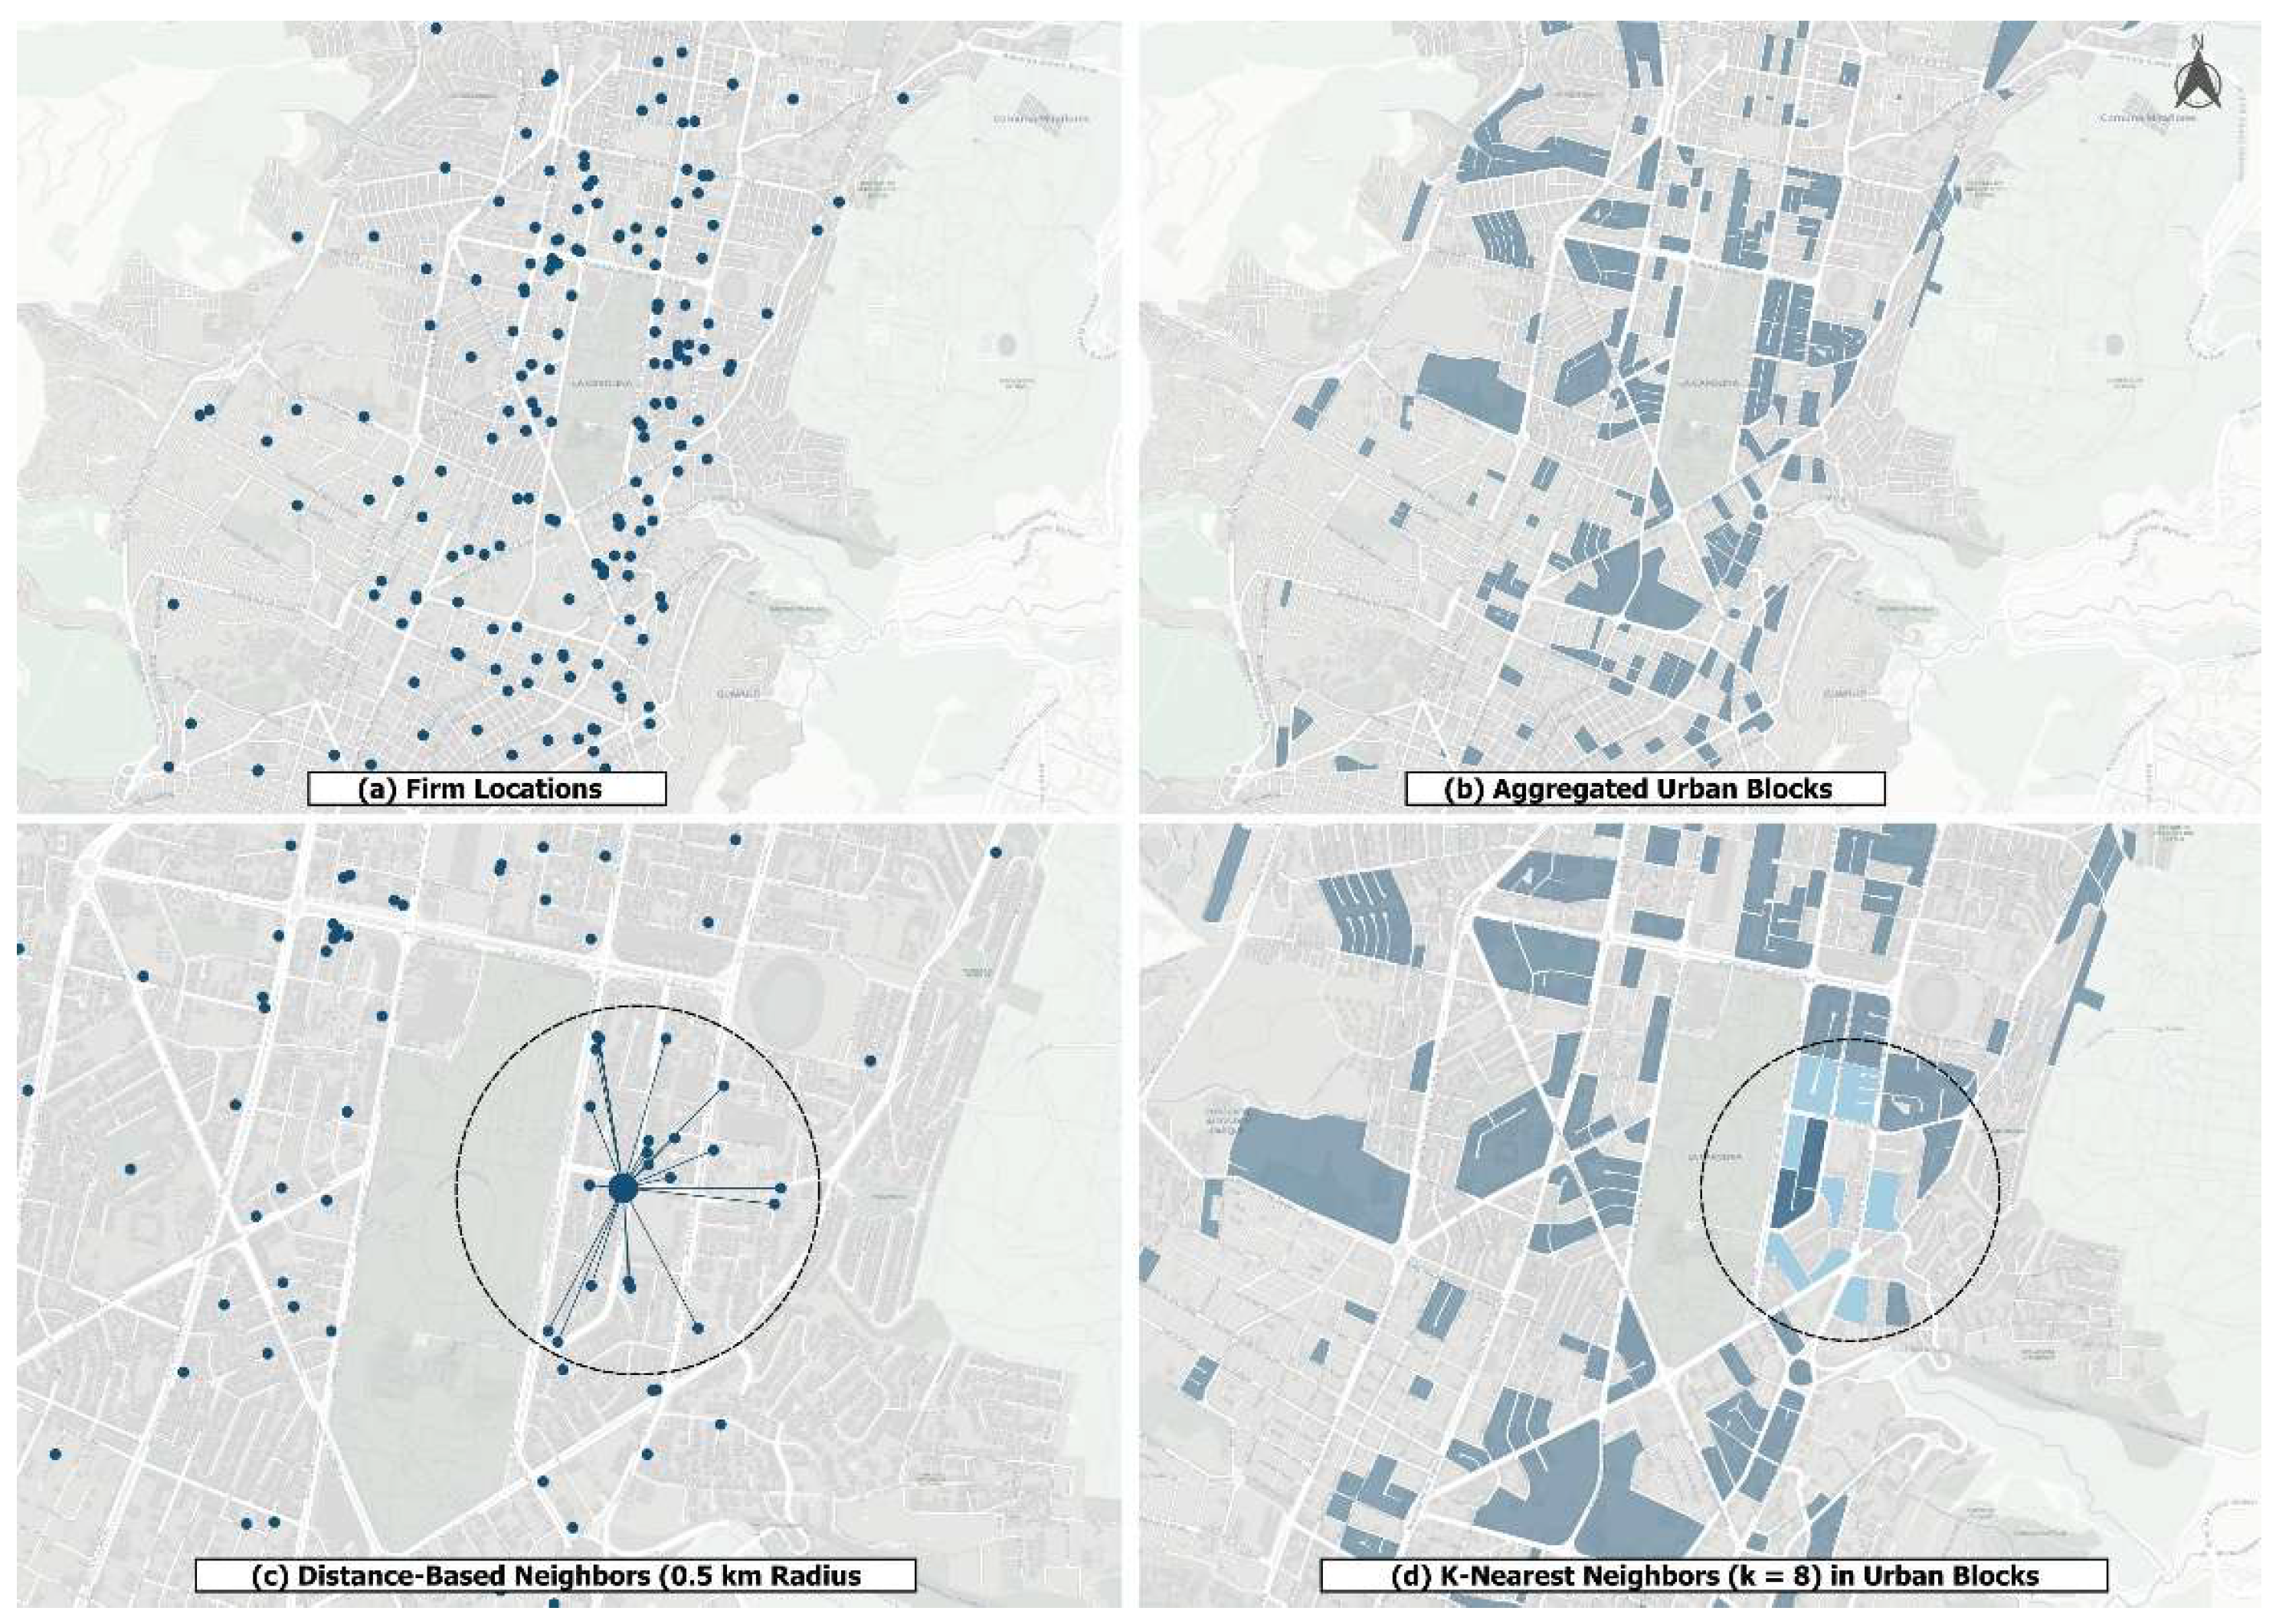
Figure 4.
Innovation in Developing Industrial Economies.
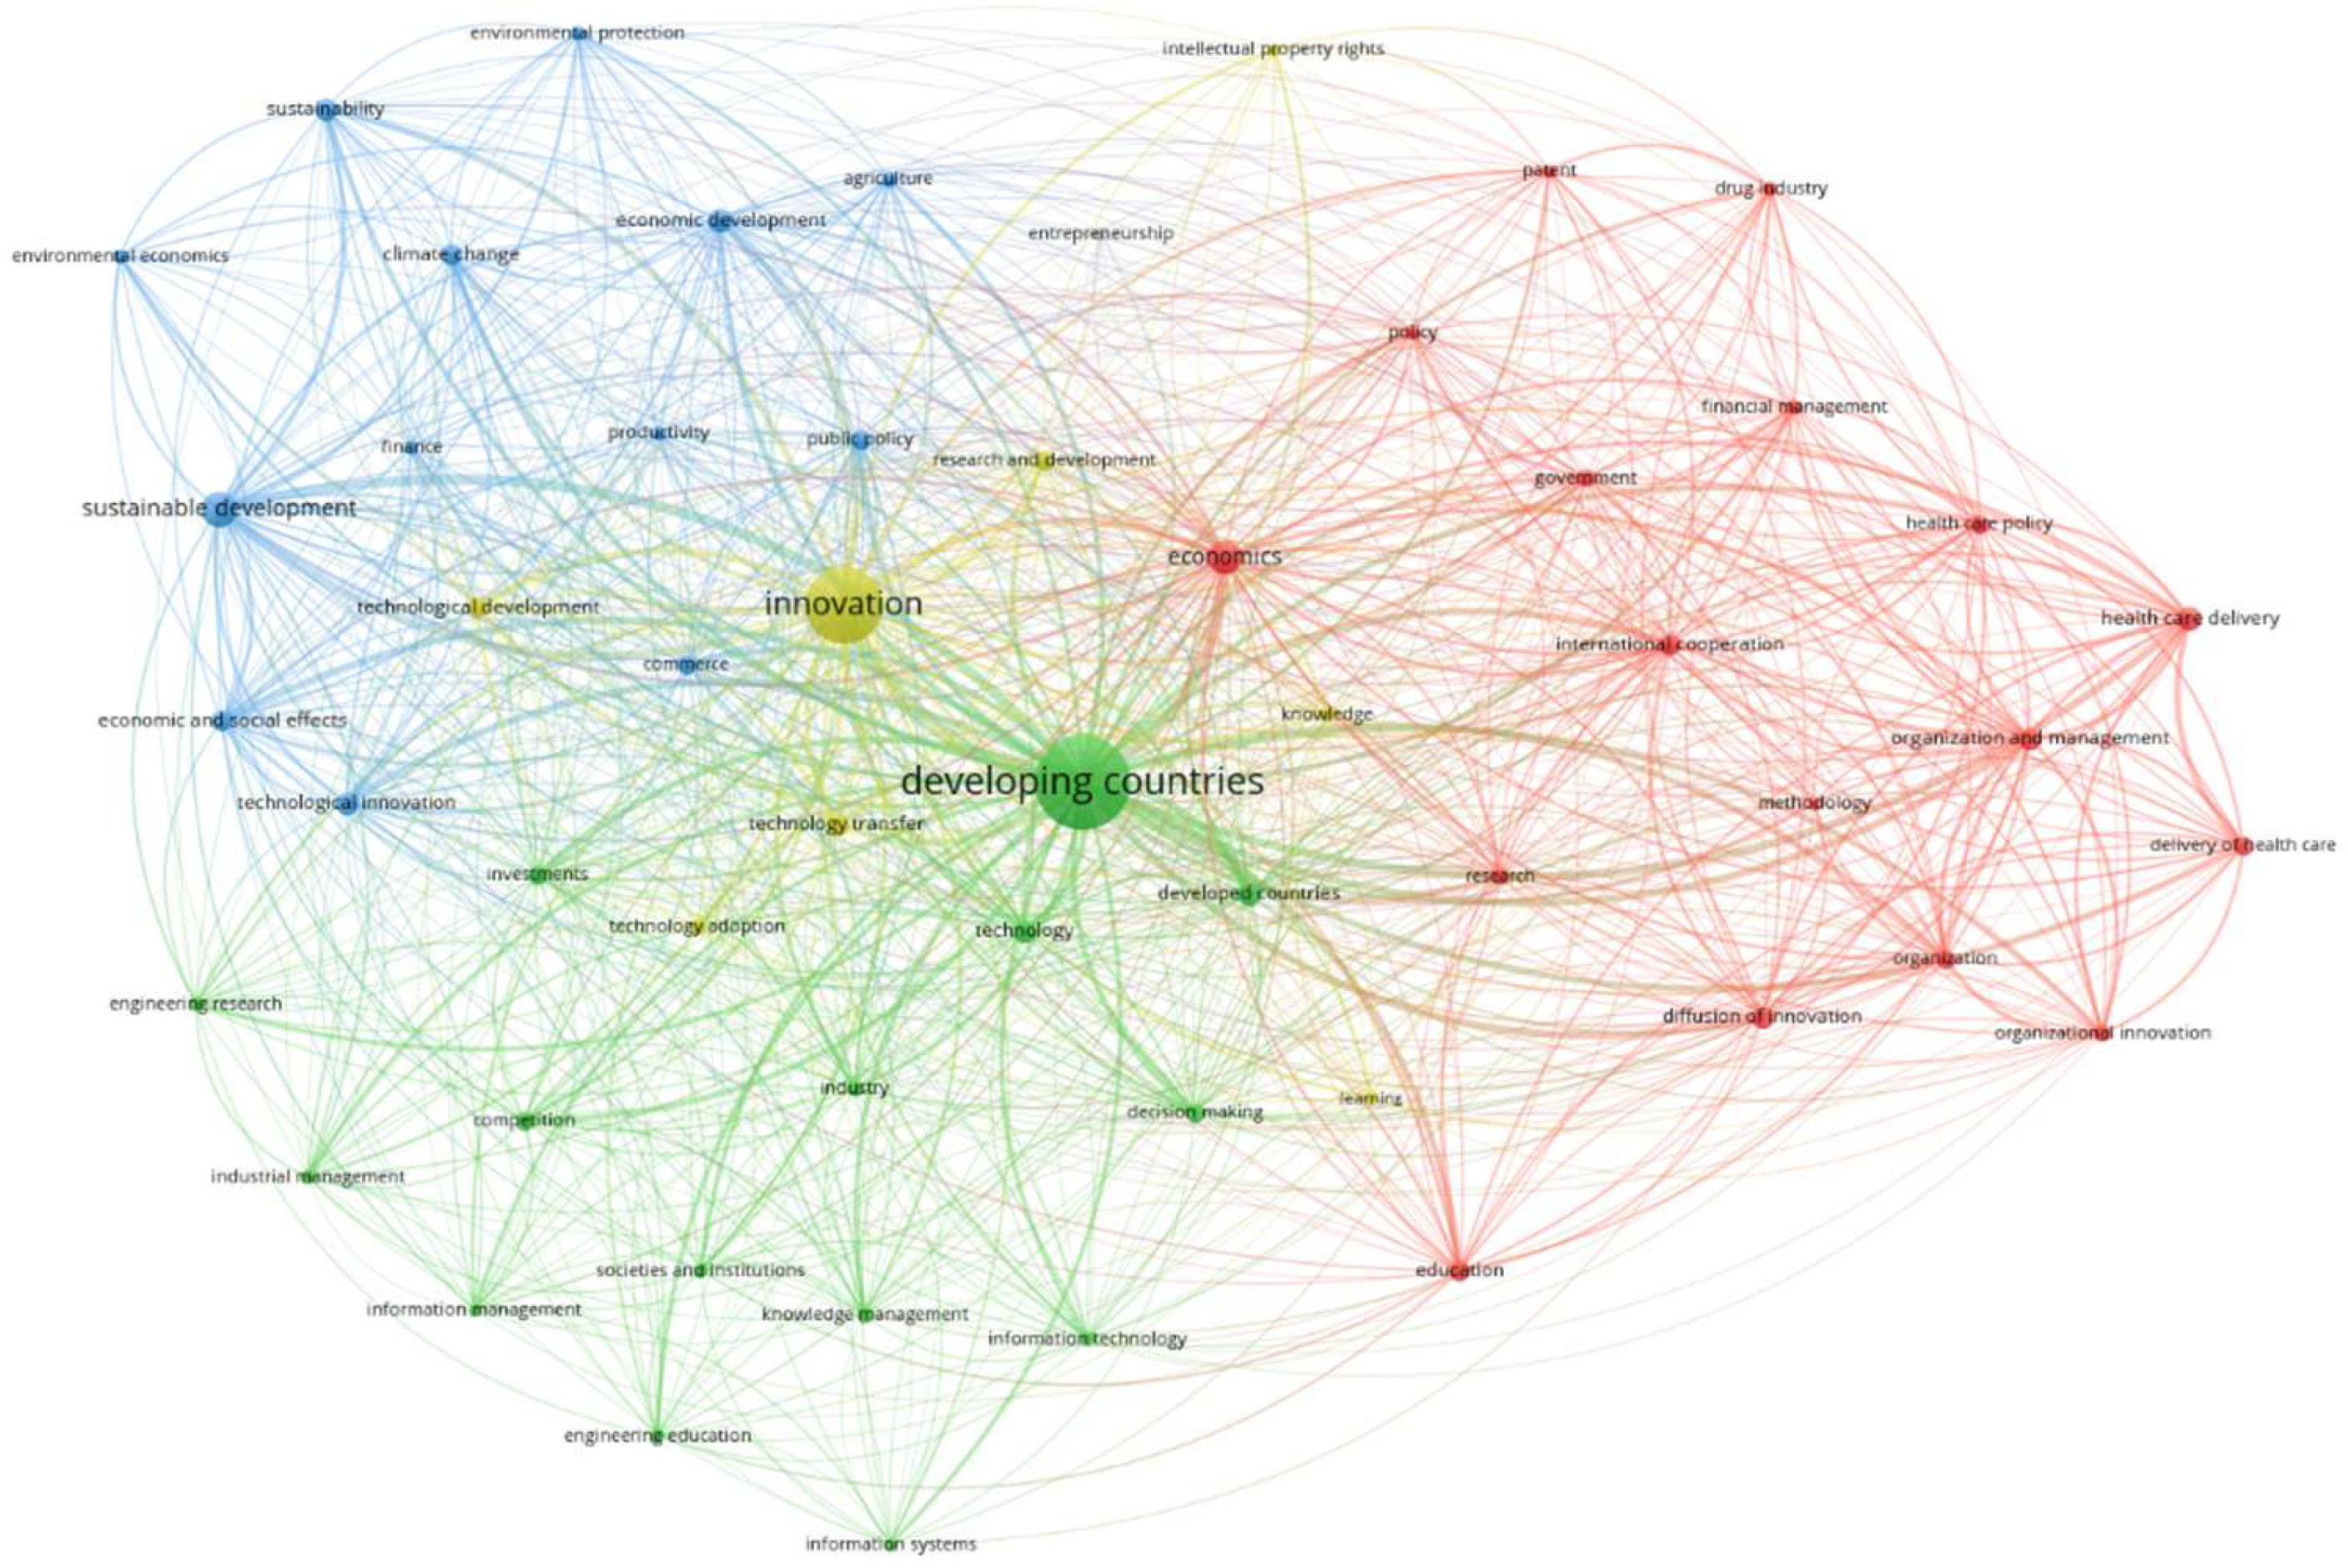
Figure 5.
Innovation Potential factors.
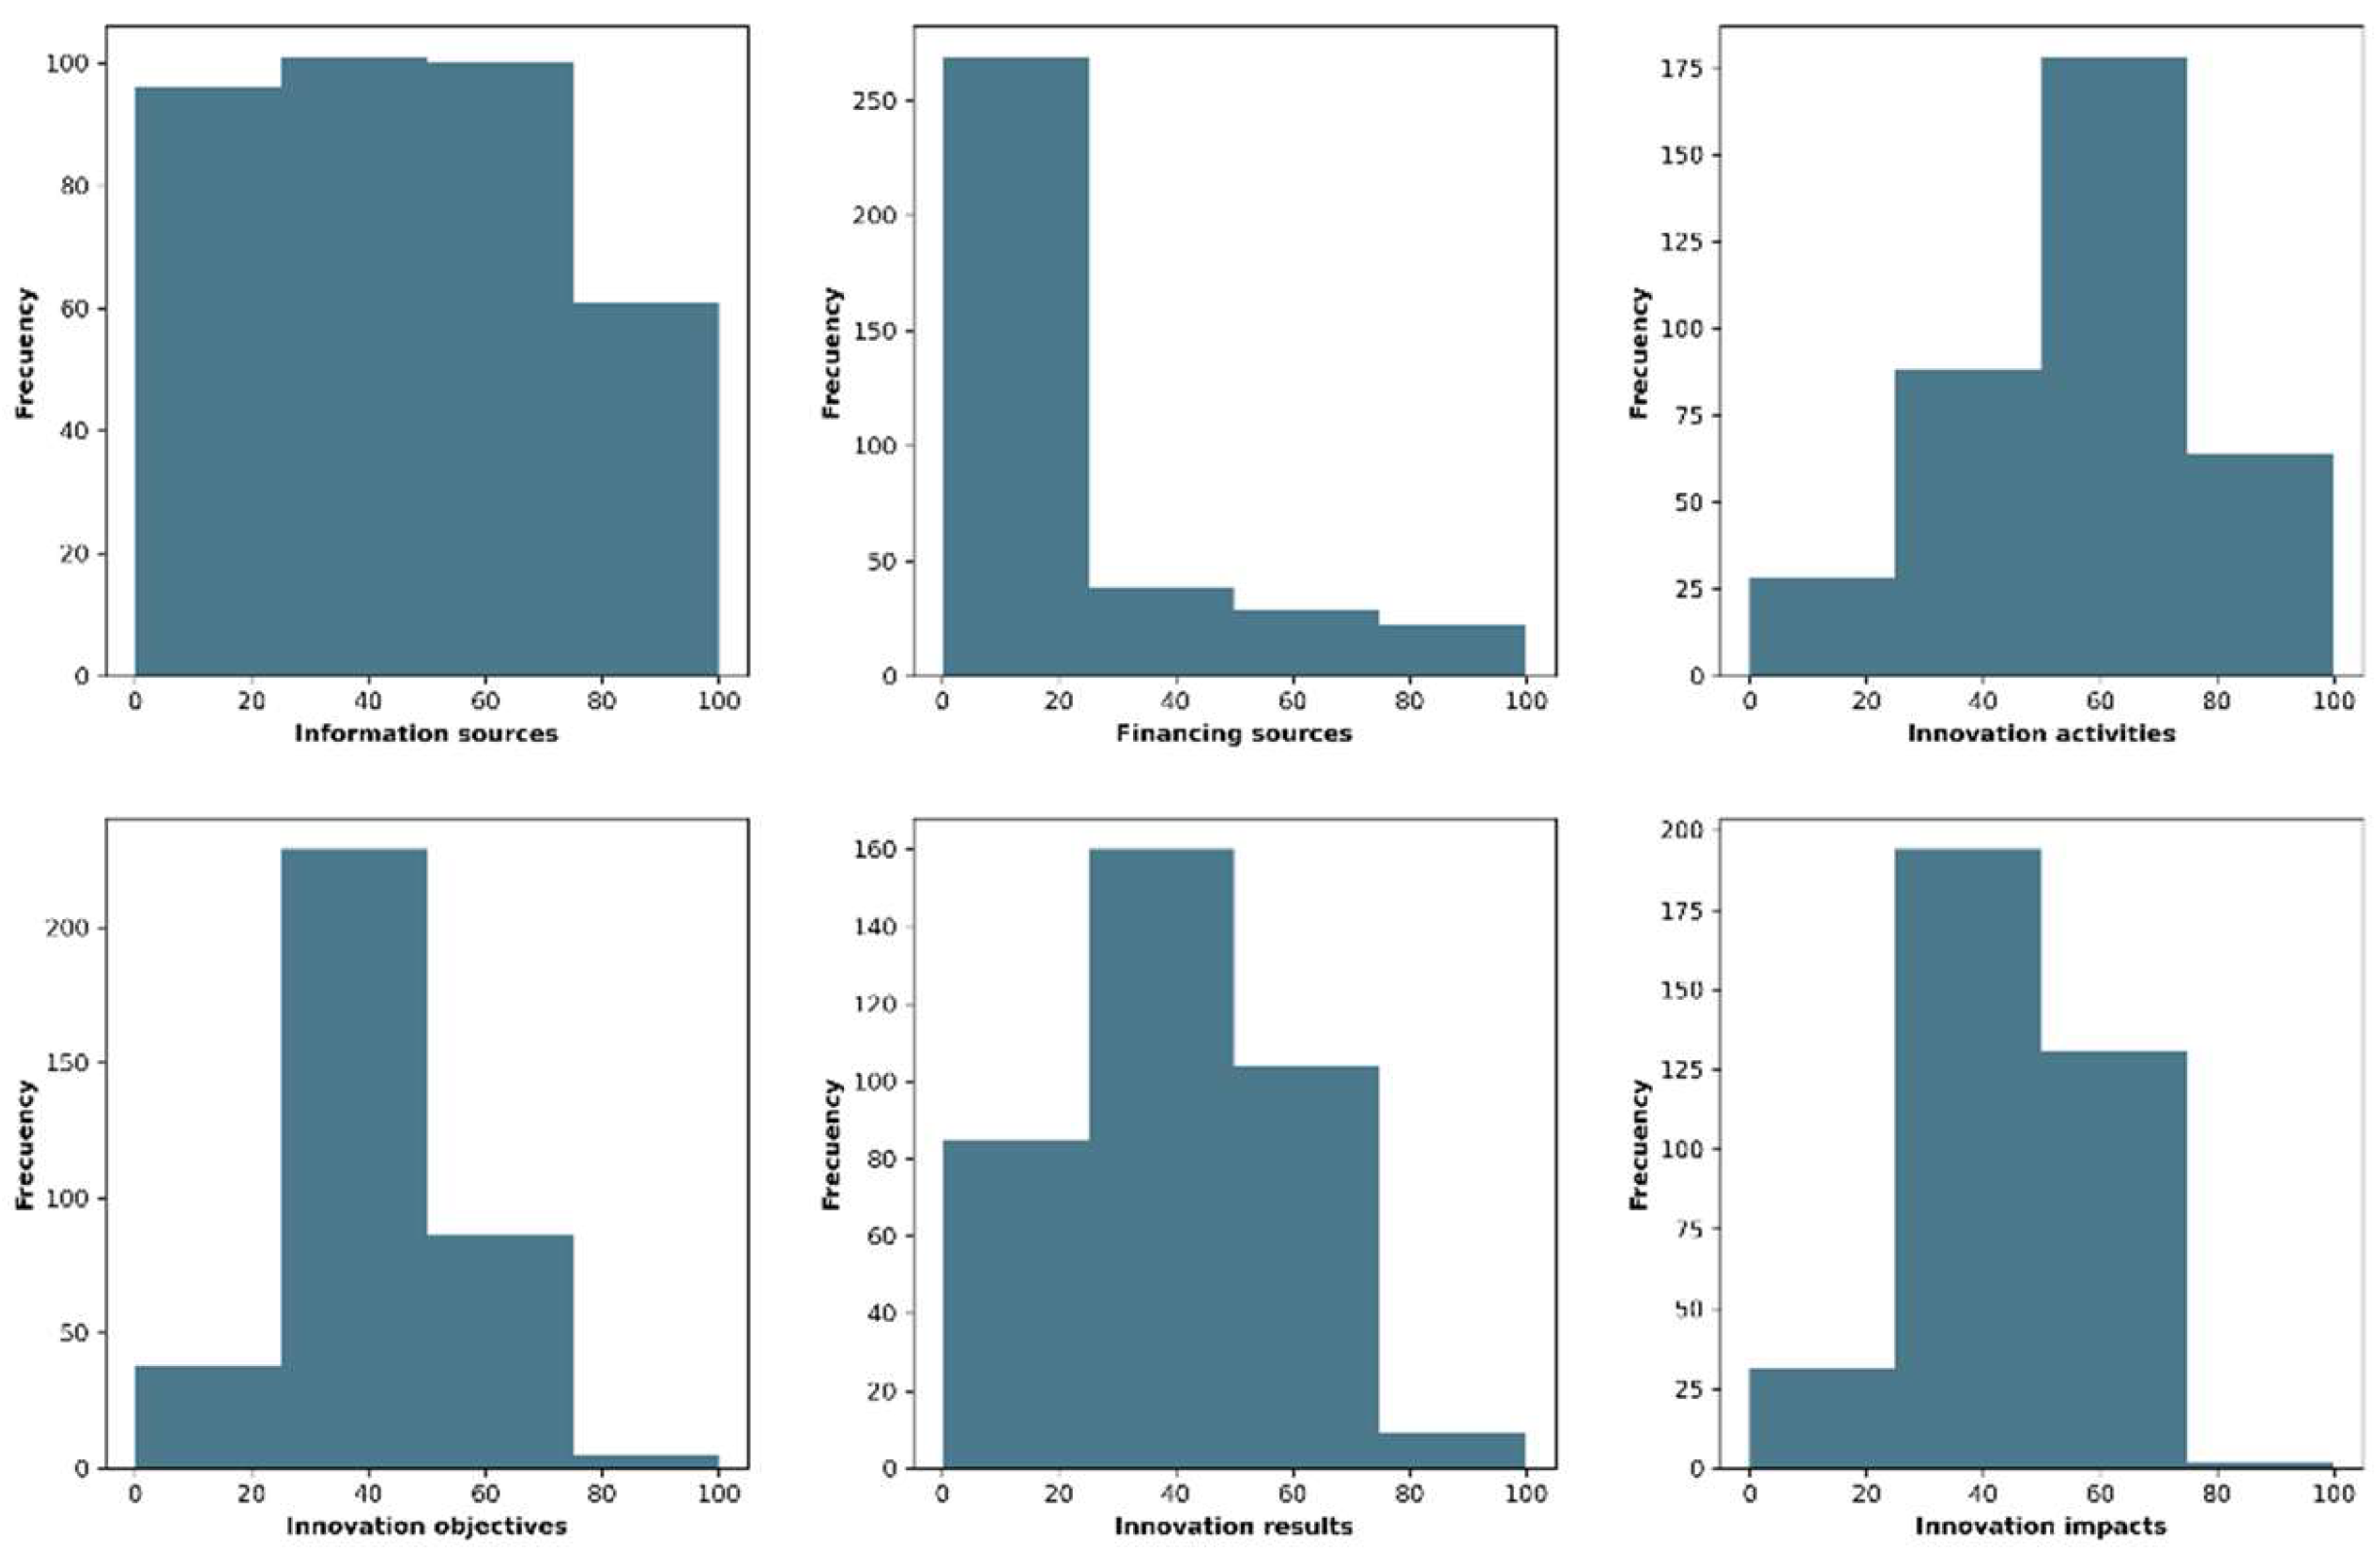
Figure 6.
Innovation potential of ICT sector in Quito.
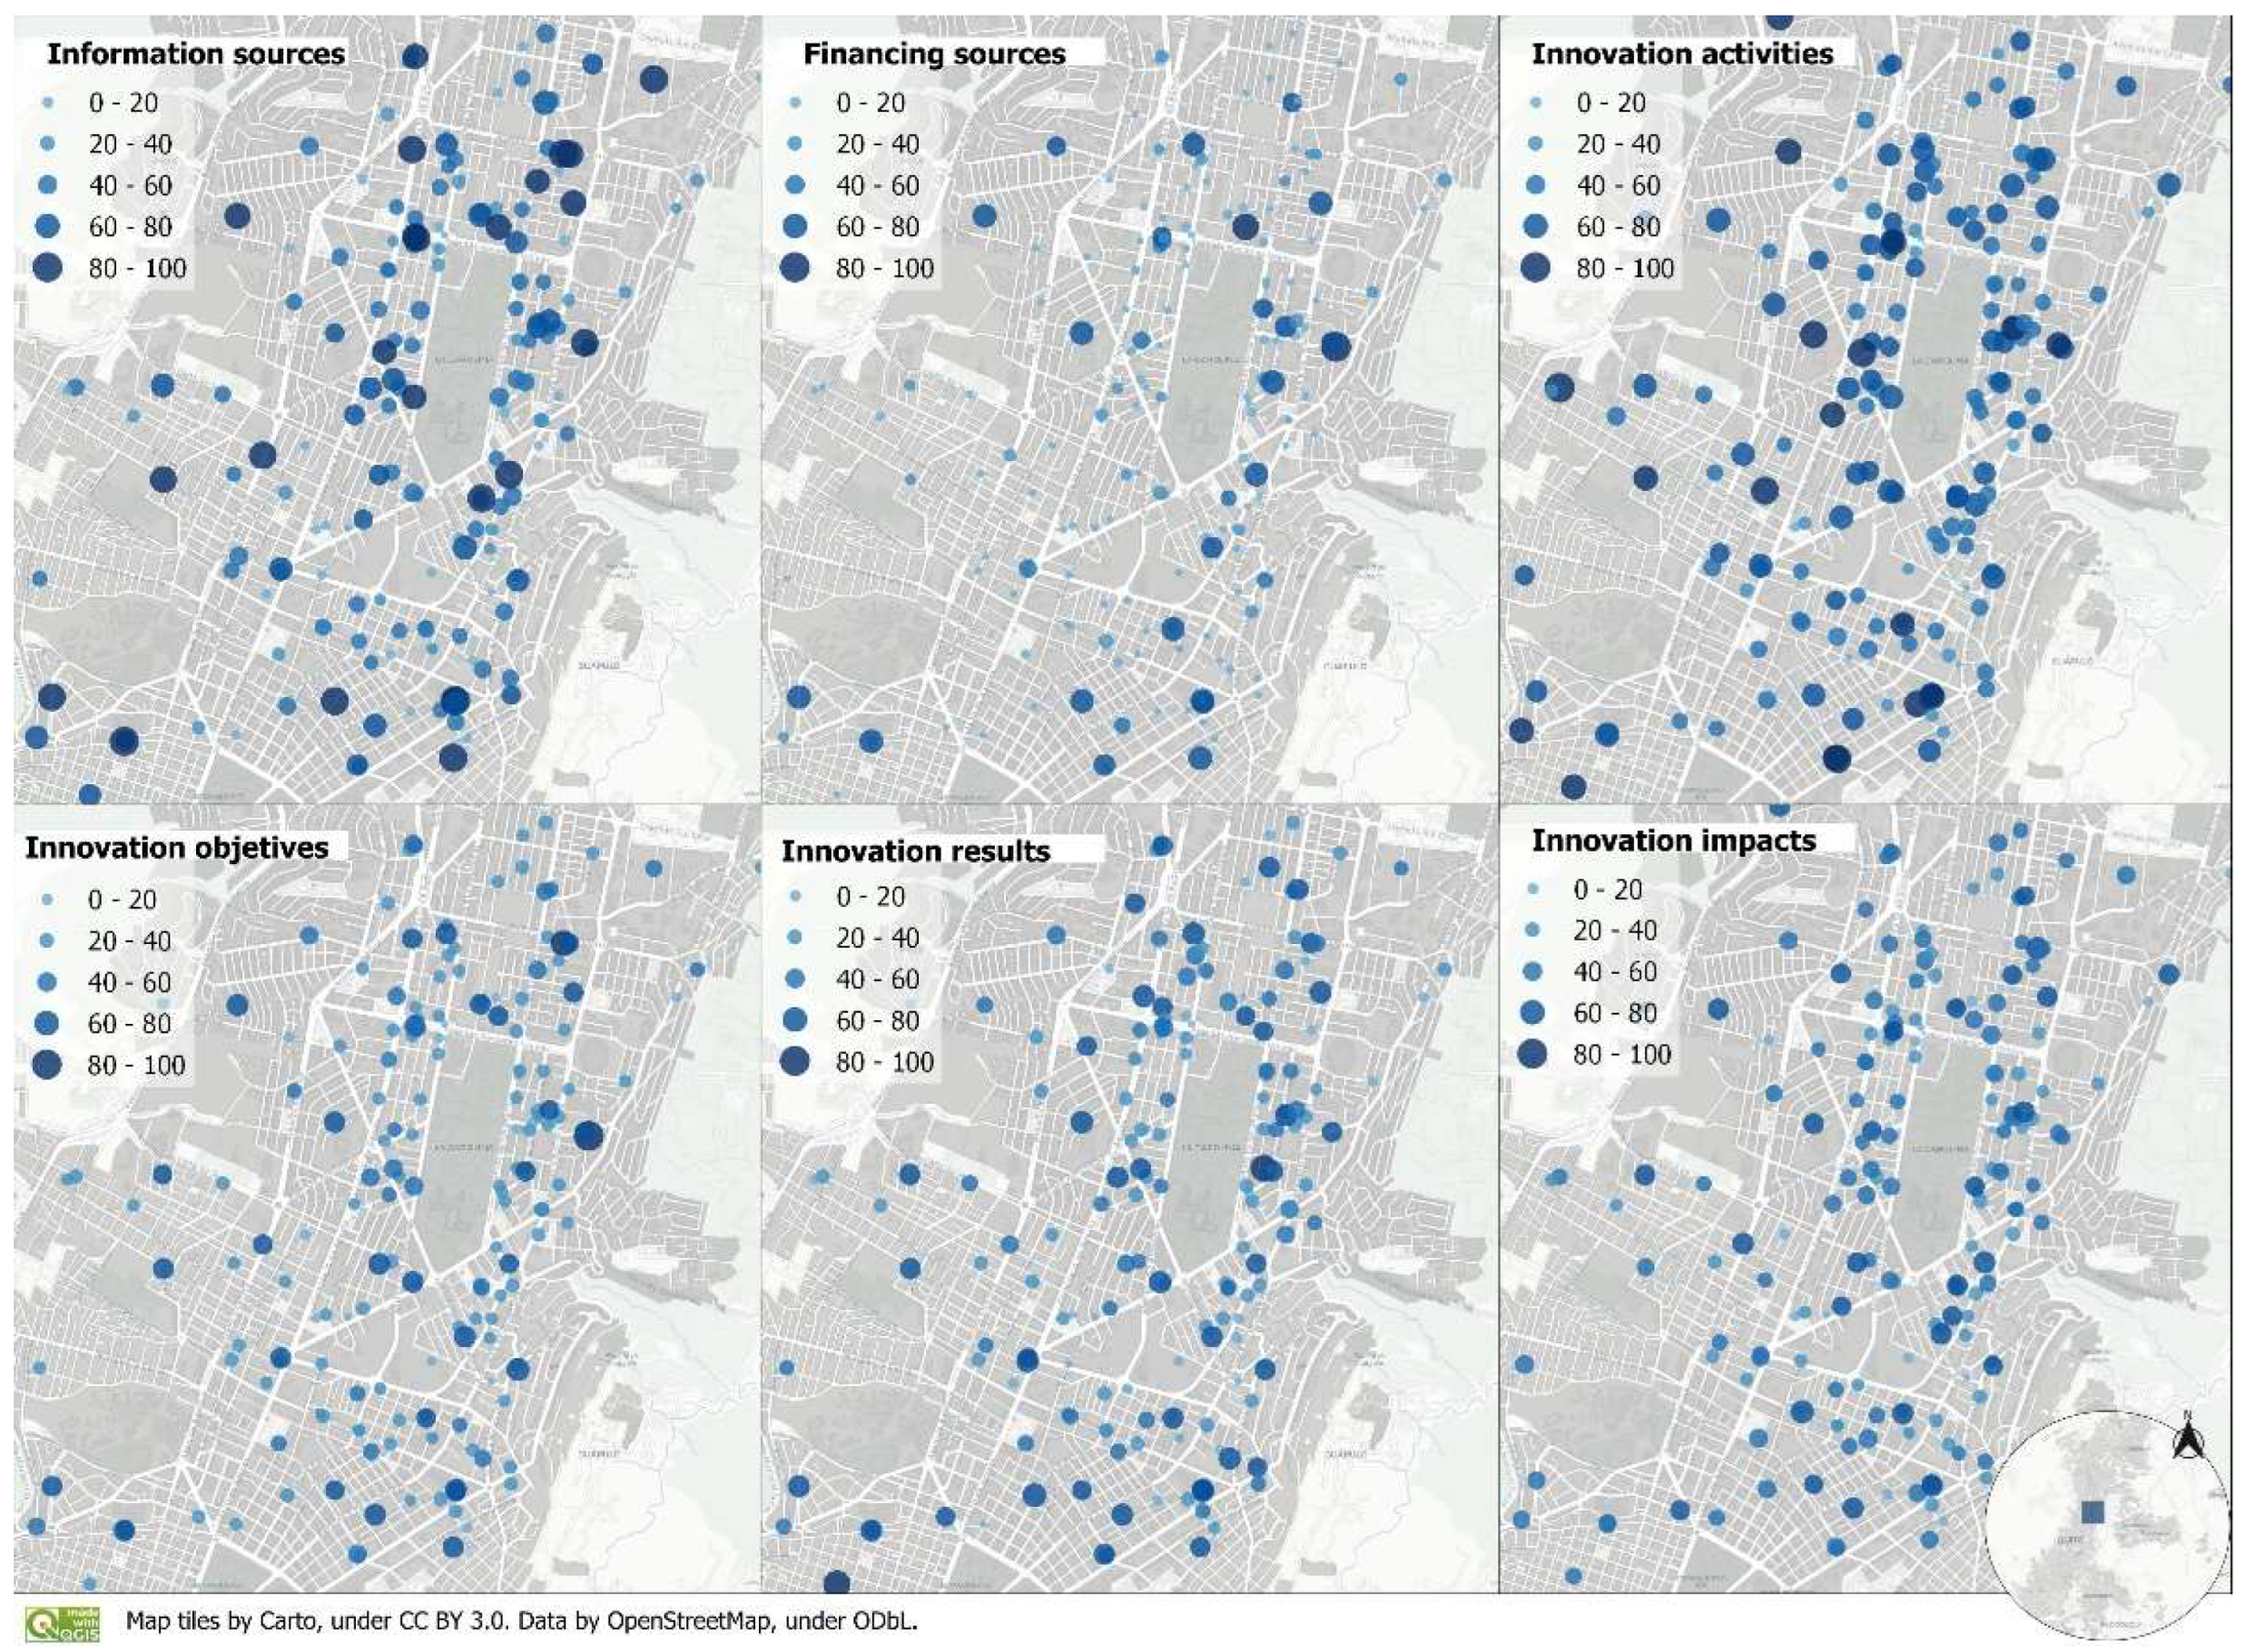
Figure 7.
Moran’s I.
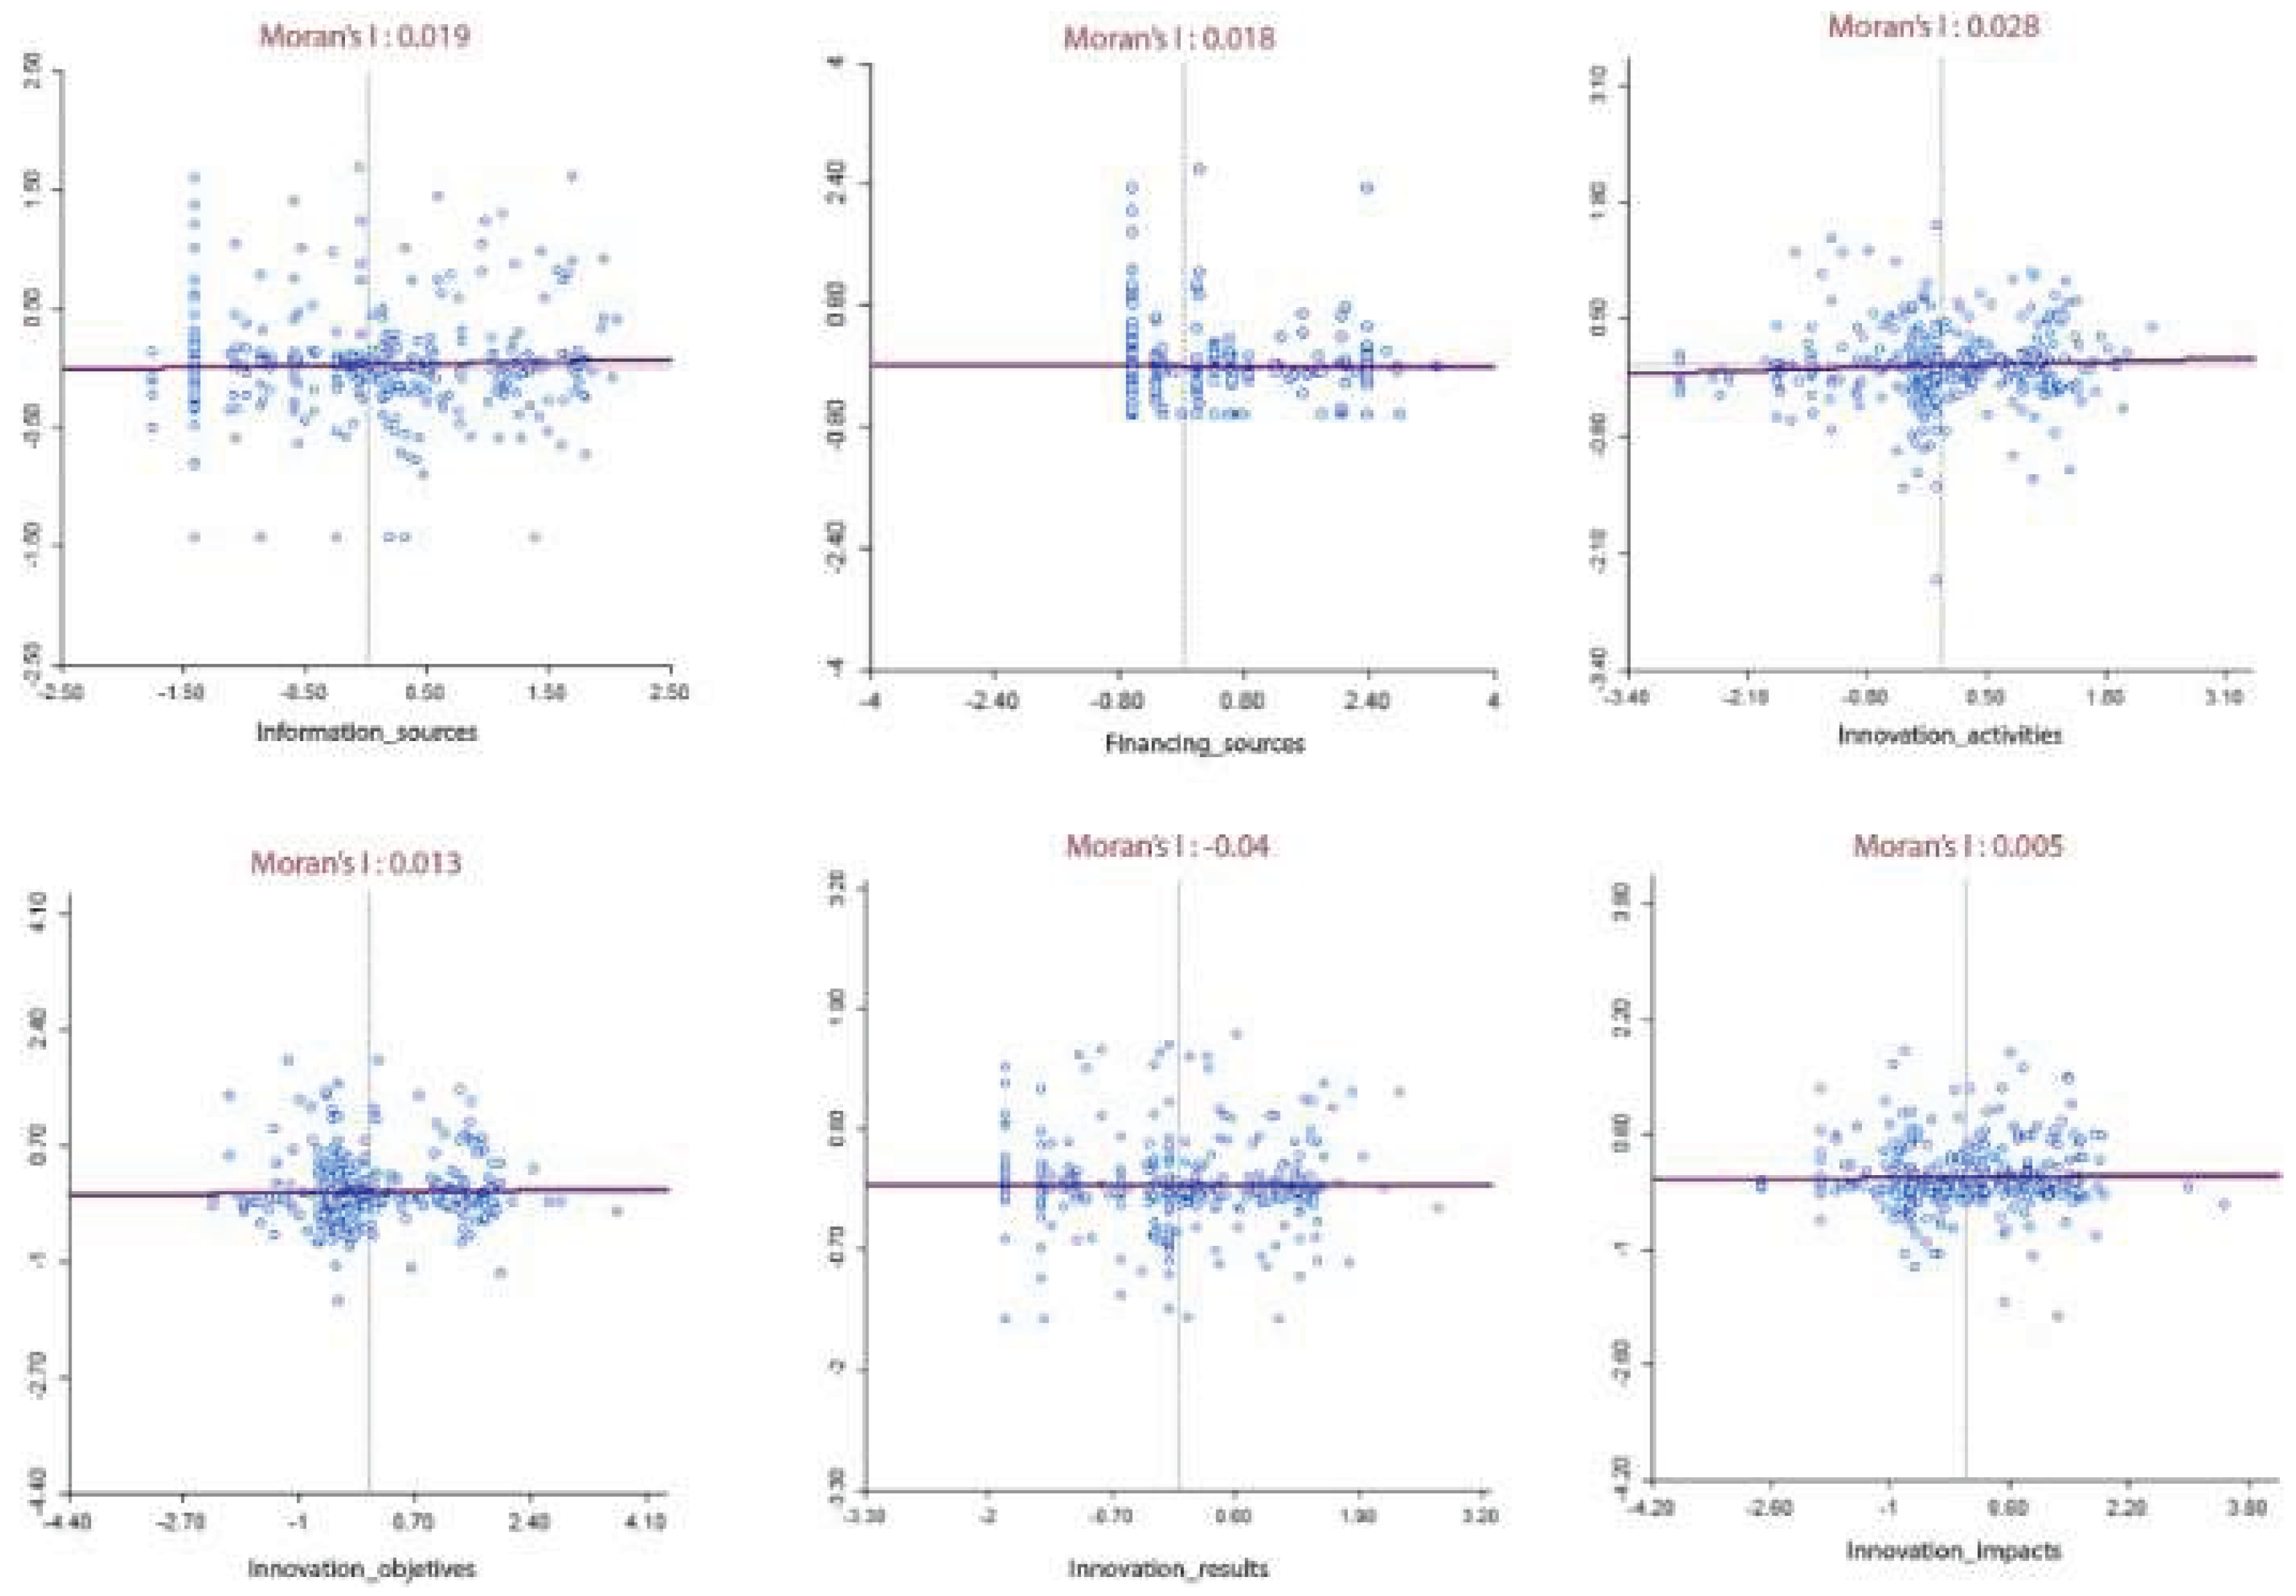

Table 1.
Innovation potential.
| Principal construct |
Secondary construct |
Factors | Observerd variables |
|---|---|---|---|
| Innovation Potential | Capabilities | Information sources | R&D Departament |
| Marketing Departament | |||
| Organization's management | |||
| Parent company | |||
| Customers and competitors | |||
| External entities | |||
| Financing sources | Owns resources | ||
| Parent company resources | |||
| Commercial Bank | |||
| Corporate group | |||
| Government resources | |||
| Innovation activities | R&D activities | ||
| Intelectual property | |||
| Digital transformation | |||
| New marketing methods | |||
| Commercialization of innovative products | |||
| Innovation objetives | Expand current market | ||
| Reduce laboral costs | |||
| Reduce downtime | |||
| Improve digital transformation | |||
| leveraging knowledge | |||
| Results | Innovation results | Product/Services | |
| Processes | |||
| Organization | |||
| Comercialization | |||
| Impacts | Innovation impacts | Economical | |
| Social | |||
| Enviromental | |||
| Cultural | |||
| Organizacional |
Table 2.
Hypothesis testing.
| Factor | Moran’s I | p | z | Null hypothesis |
|---|---|---|---|---|
| Information sources | 0.019 | 0.253 | 0.5956 | is not rejected |
| Financing sources | -0.08 | 0.479 | -0.0998 | is not rejected |
| Innovation activities | 0.018 | 0.264 | -0.66 | is not rejected |
| Innovation objetives | 0.013 | 0.32 | 0.434 | is not rejected |
| Innovation results | -0.004 | 0.496 | 0.0192 | is not rejected |
| Innovation impacts | 0.005 | 0.415 | 0.204 | is not rejected |
Disclaimer/Publisher’s Note: The statements, opinions and data contained in all publications are solely those of the individual author(s) and contributor(s) and not of MDPI and/or the editor(s). MDPI and/or the editor(s) disclaim responsibility for any injury to people or property resulting from any ideas, methods, instructions or products referred to in the content. |
© 2025 by the authors. Licensee MDPI, Basel, Switzerland. This article is an open access article distributed under the terms and conditions of the Creative Commons Attribution (CC BY) license (http://creativecommons.org/licenses/by/4.0/).
Copyright: This open access article is published under a Creative Commons CC BY 4.0 license, which permit the free download, distribution, and reuse, provided that the author and preprint are cited in any reuse.


