
Submitted:
09 October 2025
Posted:
10 October 2025
You are already at the latest version
Preprints on COVID-19 and SARS-CoV-2
Abstract
Earlier research (2021–2024, Omicron and post Omicron dominant period) established a pronounced seasonal pattern in Italian COVID-19 deaths, with weekly mortality spiking in early winter after increases throughout summer and fall, with a subsequent decline in the late winter and spring periods. Using recent data spanning 53 weeks (late May 2024–late May 2025), a new investigation utilizing piecewise linear regression confirms the continuation of this trend. The data shows the cycle repeating precisely: mortality rose in early summer, peaked at the beginning of wither, and declined steadily through midwinter and spring, tracking the previous year’s trend. This persistence suggests a continued influence of the seasonal trend on COVID-19 mortality, necessitating further exploration into the driving factors.
Keywords:
segmented linear regression
; COVID-19 mortality trends
; computational epidemiology
; Omicron and post-Omicron variants
1. Introduction
On May 5 2023, the World Health Organization (WHO) announced the beginning of the COVID-19 post-pandemic era [1]. Nonetheless, over a roughly three-year period (from late 2021 to late 2024) Italy faced escalating apprehension regarding the COVID-19 pandemic, primarily driven by the prevalence of the Omicron variant and its subsequent sub-lineages. However, due to prompt and diverse response strategies, notably vaccination, COVID-19 mortality steadily decreased. Weekly deaths plummeted from nearly 1000 on average during October 2021-September 2022 to about 100 by October 2023-September 2024.
Nonetheless, at least in all the Western countries, with each new year the question arises again as to which season is the most prone to this specific disease. Usually in the winter, other respiratory viruses illnesses, like cold and flu, are common, tending to peak during this time, historically during the latter part of winter. The main factors to which this is attributable are: i) colder temperatures that can weaken the immune system thus making people more susceptible to infections, and ii) an increased amount of individuals spending time indoors in closer proximity.
The same kind of question, about the possibility of the COVID-19 illness to follow a similar one-year seasonal pattern, rising and peaking in winter, has been subject of an intense scientific debate, with the emergence of two opposing ideas.
On one side, some are in favour of the existence of a seasonal infection pattern focused only on the winter months [2], on the other side, many have brought to the attention of the scientific community evidences of several repeating outbreaks occurring in different seasons, even if they are more common and apt to be worse in winter [3].
We have had this discussion repeated many times over these years also in Italy, with the two sides proposing almost the same arguments mentioned above.
In light of this scenario, in some earlier works, conducted in Italy with the time series data of weekly COVID-19 deaths of the period late September 2021- late September 2024, when the Omicron and post-Omicron variants were predominant, we have documented, instead, pronounced seasonal increasing variations of COVID-19 mortality rising in summer and high fall to peak in early winter, and then steadily declining in mid- and post- winter periods. Our investigations leveraged publicly available, weekly COVID-19 mortality data provided by the Italian Civil Protection Department and the Italian Ministry of Health. This robust dataset allowed for the identification of non-random variations in COVID-19 fatalities throughout the aforementioned three-year observation period, demonstrating escalating shifts in the mortality trend across both winter and summer seasons, with the former exhibiting a more pronounced effect [4].
A more recent phase of our research involved further validating the seasonal mortality pattern observed for COVID-19 during the Omicron and post-Omicron periods referenced above. This was achieved by utilizing 53 weeks of data, spanning a full year from late May 2024 to late May 2025. Our key observation was the repetition of a biphasic seasonal mortality trend for COVID-19. Weekly deaths exhibited an increasing pattern commencing in early summer and cresting in late autumn/early winter. Conversely, a consistent reduction in fatalities was noted from mid-winter extending through the conclusion of spring. Crucially, the latest 53-week data, extending through May 2025, have corroborated findings from the previous 2023-2024 period analysis [5].
To be noticed is the fact that the study of the seasonal profiles of deaths from COVID-19 in the entire period of interest (2021-2025) was conducted by adopting a mathematical approach resulting in a segmented linear regression model of the COVID-19 deaths data, where each increasing/decreasing seasonal death trend variation corresponds to a regression segment with a given steepness. The comparative analysis of regression segment slopes facilitated our discussion on the evolving mortality trend, enabling the identification of distinct seasonal growth and decline profiles. The efficacy of our linear regression model in fitting the observed COVID-19 mortality data has been always affirmed by mean determination coefficients approximating 70% throughout all stages of the study. Concurrently, the statistical rigor of this analysis was further underscored by all calculated p-values falling below the predetermined significance level of α=0.05.
Before concluding this Section, it is also worth mentioning the following three facts. This paper, to our knowledge, represents the first study to specifically examine COVID-19 mortality within Italy’s unique epidemiological landscape [6,7], characterized by the sole dominance of SARS-CoV-2 Omicron and its post-Omicron sub-lineages, across a very long observational period spanning from September 2021 to May 2025. A second key point is that this is an observational study, which purposefully did not attempt to quantify the precise influence of various factors, including prevention/control measures and vaccinations, on COVID-19 deaths. Thirdly, we understand that segmented linear regression, the method employed [8,9], is not designed for an exact count of COVID-19 deaths; Poisson-based or Negative Binomial methods would be more appropriate for such a task. However, the true objective of our study was not a precise weekly tally, but rather an examination of growth and decline trends, determined by comparing the slopes of the regression segments.
Since there is little published work from Italy with these results, having shown the seasons with increasing variations of COVID-19 mortality should serve as a resource for at-risk individuals who face seasonal vulnerabilities. In essence, our linear regression study has clearly indicated that the COVID-19 mortality trend observed in those years when the Omicron and post Omicron sub lineages were predominant (2021-2025) is still continuing, influenced by several factors (including: new variants, decreasing immunity from previous infections and past vaccinations, environmental conditions, dense people gathering, relaxation of public health measures, holidays, …) that need further investigation.
The remainder of this paper is the following. In the Materials and Methods Section, we first describe our data and then we explain the methodology we have used to analyze them. In the Results Section, we describe the obtained results. In the Discussion Section, we discuss both the advantages and the limitations of our approach. Finally, the Conclusions terminates our paper.
2. Materials and Methods
2.1. Data Acquisition and Linear Regression Segmentation
All COVID-19 death data of our study are accessible via two public, open-access repositories: one maintained by the Italian Civil Protection Department (under the Italian Presidency of the Council of Ministers) and the other by the Italian Ministry of Health. Links to these resources are provided at the end of the paper. All the data are available on a per week basis. With this data, we fitted a segmented linear regression model, where the dependent variable was the number of weekly confirmed COVID-19 deaths, and the independent variable was the number of weeks from the beginning to the end of the period. The study, as noted earlier, was carried out in two distinct timeframes. The first phase involved analyzing 157 weeks of data, from the end of September 2021 to the end of September 2024. For the more recent confirmatory part of our research, we focused on a 53-week period (a full year) stretching from Mid-May 2024 to late May 2025. Within the next two subsections, we will first briefly present an overview of the COVID-19 death data from the 2021-2024 period, then following this, we will offer a detailed account of the death figures for the most recently studied 53-week period, spanning May 2024 to May 2025.
To continue, it is also worth exploring the meaning of a regression segment, being our model comprised of a series of segments, each connecting two points, beginning at one and ending at the other. Defined by two specific points, rather than being a continuous line, each regression segment’s boundary was determined by criteria distinguishing between increases and decreases in the death time series. For an upward variation, the starting point aligned with the beginning of a wave, concluding at its peak. For a downward variation, the segment began in the weeks immediately after a peak, extending until baseline death values were re-established. Crucially, as weekly death counts can exhibit micro-oscillations (up to +/- 15%) during both ascending and descending phases of a time series, the above rule incorporated flexibility. This allowed for proximate, oscillating points not to be misconstrued as a definitive change in the death trend’s direction. Such flexibility is particularly relevant at the commencement of a wave or in the immediate aftermath of a peak.
2.2. Time Series Data of COVID-19 Deaths (September 2021 – September 2024)
Drawing on existing literature suggesting increased COVID-19 activity in winter and summer [10,11,12,13,14,15], our study focused on these seasons within the Italian context. We adopted extended seasonal definitions: “winter” (late September to end of January, thus encompassing late fall) and “summer” (late May/early June to end of August/beginning of September). Within these extended periods, we identified increasing COVID-19 death trends, each lasting at least six weeks, aligning with established definitions of COVID-19 waves [16]. This initial analysis revealed three distinct fall-winter and three summer periods with significant increases in mortality. The remaining portions of the time series, remarkably, formed three periods of noticeable decline, positioned between the end of winter and the start of summer – effectively extended “intermediate” (spring periods). These preliminary steps segmented the three-year COVID-19 death time series into nine distinct periods: six with increasing mortality trends and three with decreasing trends. The start and end weeks of each period define the segments for our regression analysis. In any case, the deeper meaning of this investigation primarily concerns the search for well-established trends, and in this sense, an extra week or one less attributed to one season or another makes no difference.
Figure 1 visually summarizes these nine periods, from one to nine starting from left. Table 1 provides further details, including segment dates and average durations for winter (17.66 weeks, SD 1.25), summer (12.33 weeks, SD 3.30), and intermediate (22.33 weeks, SD 3.40) periods. In addition, the total number of COVID-19 deaths were, respectively: 44,576 (Winter 2021 + Intermediate 2002 + Summer 2022), 16,349 (Winter 2022 + Intermediate 2003 + Summer 2023), and 6,160 (Winter 2023 + Intermediate 2024 + Summer 2024). It is crucial to reiterate that our seasonal definitions are based on climatic homogeneity rather than strict astronomical alignment, allowing for slight variations to maintain consistency with observed mortality trends.
2.3. Time Series Data of COVID-19 Deaths (May 2024 – May 2025)
After studying the aforementioned 2021-2024 period, we sought confirmation of our findings by further investigating a more recent period that could, however, highlight at least two seasons whose profiles could be confirmed as one ascending and the other descending.
Hence we decide to further investigate the COVID-19 seasonal mortality variations and the deaths time trends, observable in the most recent 53 weeks from 16 May 2024 to 21 May 2025.
To permit to readers to have a comprehensive and unique view of all the used data, we report all this data in Table 2, indicating, respectively: the number of consecutive weeks, any given week, and the corresponding number of weekly COVID-19 deaths.
The timeframe of interest (i.e., 16 May 2024 - 21 May 2025) was chosen to include the rise of a COVID-19 mortality increasing trend, its subsequent peak, as well as the final downward decline, as clearly shown in Figure 2, where a visual representation of the same data of Table 2 is also offered.
In closing this Subsection, while the data presented in Figure 2 could be fully included within this manuscript (see Table 2), the data corresponding to the longer period of Figure 1 could not be extensively included here, due to space constraints. Hence, both the data of Figure 1, as well as the regression code developed, are accessible via the links provided in the Data Availability Statement at the end of the manuscript.
2.4. Method of Analysis
The segmented (or piecewise) regression model we used to fit the COVID-19 deaths data of both Figure 1 and Figure 2 follows the formula.
where Y corresponds to the number of the weekly COVID-19 deaths and X represents the passage of time measured in weeks. It is worth noting that b is the slope coefficient of the regression segment and indicates the steepness of that segment. It reflects the velocity with which a segment ascends (or descends) a mortality trend, informing about the change of the number of deaths for an increase of one week. a is instead the intercept, that is the value of Y when X is equal to 0. Finally, c represent the error term.
Y = a + b · X + c,
The b coefficient is central to our linear model, directly indicating the weekly change in the number of COVID-19 deaths. A higher b value signifies a steeper segment slope, reflecting a more rapid increase in the mortality trend. Our analytical goal is to derive b parameter estimates that accurately reflect the observed death data.
In this context, it is worth mentioning also the R2 coefficient that plays a vital role in assessing the goodness-of-fit of our linear regression model, indicating how well the simulated death values for each segment correspond to the actual data (of Figure 1 and Figure 2) [17].
Our decision to employ segmented regression stems from the observation that COVID-19 mortality data exhibits varying linear trends across different periods. Consequently, these segments are not continuously connected, a characteristic feature when modeling functions with alternating increases and decreases. In closing this issue, our model will provide b values for all segments, allowing us to quantify the changing steepness of COVID-19 death trends across relevant seasons. The R2 values will then confirm the fidelity of our segments to the observed deaths data.
It is important to remind that the fit of any linear regression model is assessed by minimizing the least squares criterion. This involves reducing the Residual Sum of Squares (RSS), which is the sum of squared differences between observed and predicted COVID-19 deaths (also said residuals), computed with the following formula:
ci = Yi – pred(Yi)
The regression parameters (a and b) are chosen to minimize this RSS. To evaluate the explanatory power of the model, the coefficient of determination is used, instead. Calculated as 1- RSS/TSS (where TSS is the total sum of squares, representing the overall data variability), R2 also indicates the proportion of variability in predicted deaths explained by the model. A high R2 signifies a strong fit, encapsulating the model overall performance more comprehensively than other single metrics. As a holistic metric, R2 effectively consolidates the model performance.
3. Results
We provide, here, the essential results of our research, broken down into the two following distinct points.
3.1. COVID-19 Seasonal Mortality Profiles: September 2021 – September 2024
In Figure 3, we present an exhaustive summary of the regression segments derived for the nine periods depicted in Figure 1. In particular, our piecewise regression model has illuminated the dynamics of the Italian COVID-19 mortality across nine specific periods, comprehensively represented visually in Figure 3, and in extended form in Table 3. To be noticed the fact that Figure 3 synthesizes these results, showing the original death data of Figure 1 with our fitted regression segments overlaid. Consistent with expectations, all winter and summer periods displayed positive b values (Table 3), indicating increasing death trends, while intermediate periods consistently showed negative b values, signifying decreasing trends. A notable difference emerged in the intensity of these increases, with winter surges being significantly steeper (average b = 55.75) than summer surges (average b = 22.90) (Table 3). We also observed considerable inter-annual variability in slope coefficients within similar seasonal periods, tending towards less extreme (less positive or less negative) slopes over the years (Table 3). As easily noticeable, the sustained decline in COVID-19 mortality during the relatively long intermediate periods served as a compensatory mechanism, effectively balancing the upward trends of winters and summers, thereby contributing to the overall reduction in COVID-19 deaths over the study duration. Moreover, the goodness-of-fit of our segmented model was largely strong, as indicated by R2 values. Winter periods showed excellent fit (average R2=0.74), as did intermediate periods (average R2=0.70). While summer periods also achieved a good average R2 (0.63), with the exception of the particularly low R2 for Summer 2022 (0.36) which reflected a highly rapid, non-linear increase and decrease in deaths that a linear model could not adequately capture. The consistent statistical significance (p-values < 0.05) across all model applications further validated our findings.
3.2. COVID-19 Seasonal Mortality Profiles: May 2021 – May 2025
Figure 4 and Figure 5 shows the regression segments obtained with our model for the two time series data of Figure 2. Each Figure reports the dates of the beginning and of the end of the considered periods comprised in the timeframe: 16 May 2024 – 21 May 2025.
Again, Y represents the number of weekly COVID-19 deaths for each given week (indicated over the X axis). Each Figure comes also with the values of the parameters b and R2, computed for each single segment and specified in the corresponding captions. They also come along with the average and the standard deviation values of the weekly COVID-19 deaths.
As already anticipated, while the slope of a regression segment provides an immediate visual impression of the steepness of the corresponding COVID-19 mortality trend, the numerical value of b gives the exact number of COVID-19 deaths by which that trend increases/decreases with each new week. Finally, R2 informs on how well a given regression segment fits the available observations.
First, COVID-19 deaths are more common in the period plotted in Figure 4, with an increasing seasonal mortality pattern rising in late spring/early summer and peaking in late fall/early winter (and an average progressive increase of the number of deaths, per each new week, of almost 4).
Second, a descending mortality trend is observable, instead, in the period portrayed in Figure 5, starting to go down in early winter with a steady decrease until early spring (here, the average progressive reduction of the number of deaths per each new week is almost 2).
Final and most important is the fact that these seasonal mortality trends are clearly consistent throughout previous years (September 2021- September 2024), when similar seasonal mortality variations were observed [4].
Concerning the issue of the goodness-of-fit of our regression model, it should be clear that the values we got for the coefficients of determination R2, ranging in the interval [65-75%], can be considered a reasonable result, in the light of the fact that the specialized literature suggests as good values R2 coefficients in the neighborhood of 70%.
In conclusion, it should be also reminded that again all the p-values obtained during the use of our model were below the statistical significance value of α = 0.05, thus providing a further confirmation of the validity of this analysis.
4. Discussion
The aim of this research was to document and statistically validate the seasonal variations and time trends of COVID-19 mortality in Italy in very recent times (Mid of May 2024 – Late May 2025). Our findings have suggested the presence of an increasing mortality trend rising in late spring and early summer to peak in high fall/early winter. Then, we observed a steady decrease starting in mid-winter until almost the end of spring. All these trends are in keeping with those observed in a first phase of our studies during the period September 2021- September 2024 (when the Omicron and post-Omicron variants were predominant).
Evidently, there are limitations to our study that warrant appropriate acknowledgment. First, we recognize that we have avoided identifying the motivations behind these seasonal drifts that hence need further investigation. They can be attributable to several different causes (or even to a combination of them). Nonetheless, our study intentionally refrains from engaging in discussions regarding those causal factors behind seasonal COVID-19 mortality fluctuations. This decision stems from a commitment to neutrally observe a natural phenomenon, independent of its root causes. Therefore, our research is strictly observational, presenting empirical findings without offering compulsory public health recommendations.
Secondly, our study deliberately employed a simple linear regression model, despite acknowledging that more sophisticated epidemiological models are typically used for precise COVID-19 death counts [18,19,20,21,22,23,24,25,26]. In fact, our primary goal was not exact counting, but rather to identify whether mortality trends were increasing or decreasing in a specific season. While linear regression assumptions (e.g., normally distributed, homoscedastic, uncorrelated residuals) are often violated with count data, visual inspection of Figure 3, Figure 4 and Figure 5 largely supports our model’s fit, showing generally well-aligned data and stable variance (except for Summer 2022). Weekly grouping of data also mitigates autocorrelation issues, common in daily counts. Confirmation of all these hypotheses would be provided by Q-Q plots we have developed; however, their inclusion is precluded by space limitations. In closing, although simple linear regression is not universally ideal for death counts, its application here is justified by its adequate performance in capturing the directional trends, as evidenced by Figures and an acceptable fit (R2 around 70%) for most segments. In the end, our aim was an acceptable approximation, not an optimized count model.
5. Conclusions
We fitted a segmented linear regression model with the time series data of the COVID-19 deaths in the periods September 2021 - September 2024 and more recently May 2024 - May 2025. The aim was to document and statistically validate the seasonal variations and time trends of COVID-19 mortality in Italy during the Omicron age. Our findings suggest the presence of an increasing mortality trend rising in late spring and early summer to peak in high fall/early winter. Then, we observe a steady decrease starting in mid-winter until almost the end of spring. The observation of the more recent profiles (May 2024 – May 2025) are in keeping with those observed in other previously (September 2021 – September 2024). We recognize that we have avoided identifying the motivations behind these seasonal drifts. We are also aware that the method we used is not the one with which COVID-19 deaths are typically counted, but our target was just to look at how quickly COVID-19 mortality trends grew or declined. Our study permits a clear identification of the COVID-19 mortality trends for each season helping that subset of at risk population who can be seasonally vulnerable.
Data availability statement and AI declaration: All the COVID-19 deaths are downloadable from the Italian: i) Civil Protection Department (https://github.com/pcm-dpc/COVID-19/blob/master/dati-andamento-nazionale), and ii) Ministry of Health (https://www.salute.gov.it/new/it/tema/covid-19/report-settimanali-covid-19/). Developed code downloadable from: https://github.com/EugenioDeRosa/Covid-19_Linear_Regression.git. Authors declare that they have not used AI tools for this study.
Disclosure of interests and informed consent statement: The authors declare no conflict of interest. This study uses publicly available, aggregated data that contains no private information. No humans, animals, personal data have been used. Hence, ethical approval is not required.
References
- WHO - United Nations, WHO chief declares end to COVID-19 as a global health emergency. UN News, 2023, https://news.un.org/en/story/2023/05/1136367.
- D’Amico M, Shaman J, Dubrow R, et al, COVID-19 seasonality in temperate countries, Environmental Research, 2022, 206(15). [CrossRef]
- Cappi R, Casini L, Tosi D, et al, Questioning the seasonality of SARS-COV-2: a Fourier spectral analysis. BMJ Open, 2022, 12:e061602. [CrossRef]
- Roccetti M, De Rosa EM, Seasonal variations and time trends of deaths from COVID-19 in Italy, September 2021 - September 2024: a segmented linear regression study. MedRxiv Preprint, 2025. [CrossRef]
- Roccetti M, De Rosa EM, Seasonal Trends of COVID-19 Deaths in Italy: A Confirmatory Linear Regression Study with Time Series Data from 2024/2025. MedRxiv Preprint, 2025. [CrossRef]
- Casini L, Roccetti M, Reopening Italy’s schools in September 2020: a Bayesian estimation of the change in the growth rate of new SARS-CoV-2 cases. BMJ Open, 2021, 11:e051458. [CrossRef]
- Chirumbolo S, Pandolfi S, Valdenassi L, Seasonality of COVID-19 deaths. Did social restrictions and vaccination actually impact the official reported dynamic of COVID-19 pandemic in Italy? Environmental Research, 2022, Volume 212. [CrossRef]
- Taljaard M, McKenzie JE, Ramsay CR, et al, The use of segmented regression in analysing interrupted time series studies: an example in pre-hospital ambulance care. Implementation Science, 2014, 9(77). [CrossRef]
- Altman N, Krzywinski M, Simple linear regression. Nature Methods, 2015, Volume 12. [CrossRef]
- Venturelli F, Mancuso P, Vicentini M, et al, High temperature, COVID-19, and mortality excess in the 2022 summer: a cohort study on data from Italian surveillances. Science of The Total Environment, 2023, Volume 887. [CrossRef]
- Wiemken TL, Khan F, Puzniak L, et al, Seasonal trends in COVID-19 cases, hospitalizations, and mortality in the United States and Europe. Scientific Reports, 2023, Volume 13. [CrossRef]
- Wong C, Why do covid cases rise in summer? New Scientist, 2024, 263. [CrossRef]
- Stefanelli P, Trentini F, Petrone D, et al, Tracking the progressive spread of the SARS-CoV-2 Omicron variant in Italy, December 2021 to January 2022. Eurosurveillance, 2022, 27(45). [CrossRef]
- Fontal A, Bouma MJ, San-José A, et al, Climatic signatures in the different COVID-19 pandemic waves across both hemispheres, Nature Computational Science, 2021, Volume 1. [CrossRef]
- Sera F, Armstrong B, Abbott S, et al, A cross-sectional analysis of meteorological factors and SARS-CoV-2 transmission in 409 cities across 26 countries. Nature Comm., 2021, 12(1). [CrossRef]
- Zhang SX, Marioli A, Gao R, et al, A Second Wave? What Do People Mean by COVID Waves? – A Working Definition of Epidemic Waves. Risk Management and Healthcare Policy, 2021, 14. [CrossRef]
- Ozili PK, The acceptable R-square in empirical modelling for social science research. 2022, Social Research Methodology and Publishing Results. [CrossRef]
- Hao B, Liu C, Wang Y, et al, A mathematical-adapted model to analyze the characteristics for the mortality of COVID-19. Scientific Reports, 2022, Volume 12. [CrossRef]
- Roccetti M, Drawing a parallel between the trend of confirmed COVID-19 deaths in the winters of 2022/2023 and 2023/2024 in Italy, with a prediction. Mathematical Biosciences and Engineering, 2023, 21(3). [CrossRef]
- Roccetti M, Marfia G, Palazzi CE, Entertainment beyond divertissment: using computer games for city road accessibility. Computers in Entertainment (CIE), Volume 9, Issue 2, Pages 1 – 9. [CrossRef]
- Marfia G, Roccetti M, TCP at last: reconsidering TCP’s role for wireless entertainment centers at home. IEEE Transactions on Consumer Electronics, vol. 56, no. 4, pp. 2233-2240, November 2010. [CrossRef]
- Ghini V, Panzieri F, Roccetti M, Client-centered load distribution: A mechanism for constructing responsive web services. Proceedings of the 34th Annual Hawaii International Conference on System Sciences, Maui, HI, USA, 2001. [CrossRef]
- Roccetti M, Excess mortality and COVID-19 deaths in Italy: A peak comparison study. Mathematical Biosciences and Engineering, 2023, 20(4). [CrossRef]
- Naz S, Sarwar M, Sha K, et al, A Mathematical Model of COVID-19 Using Piecewise Derivative of Fractional Order. European Journal of Pure and Applied Mathematics, 2025, 18(2). [CrossRef]
- Casini L, Marchetti N, Montanucci A, Orrù V, Roccetti M, A human–AI collaboration workflow for archaeological sites detection. Scientific Reports, 13, 8699, 2023. [CrossRef]
- Marchetti N, Angelini I, Artioli G, Benati G, Bitelli G, Curci A, Marfia G, Roccetti M, , NEARCHOS. Networked archaeological open science: advances in archaeology through field analytics and scientific community sharing. Journal of Archaeological Research, 26, 447–469, 2018. [CrossRef]
Figure 1.
COVID-19 deaths: 23/9/21 – 19/9/24. Y: number of weekly deaths; X: weeks from 1 to 157. Nine sectors (from left to right) for nine different seasons with corresponding weekly number of observed deaths. Precisely: 1 (1-19 weeks); 2 (20-38); 3 (39-48); 4 (49-66); 5 (67-93); 6 (94-103); 7 (104-119); 8 (120-140); 9 (141-157).
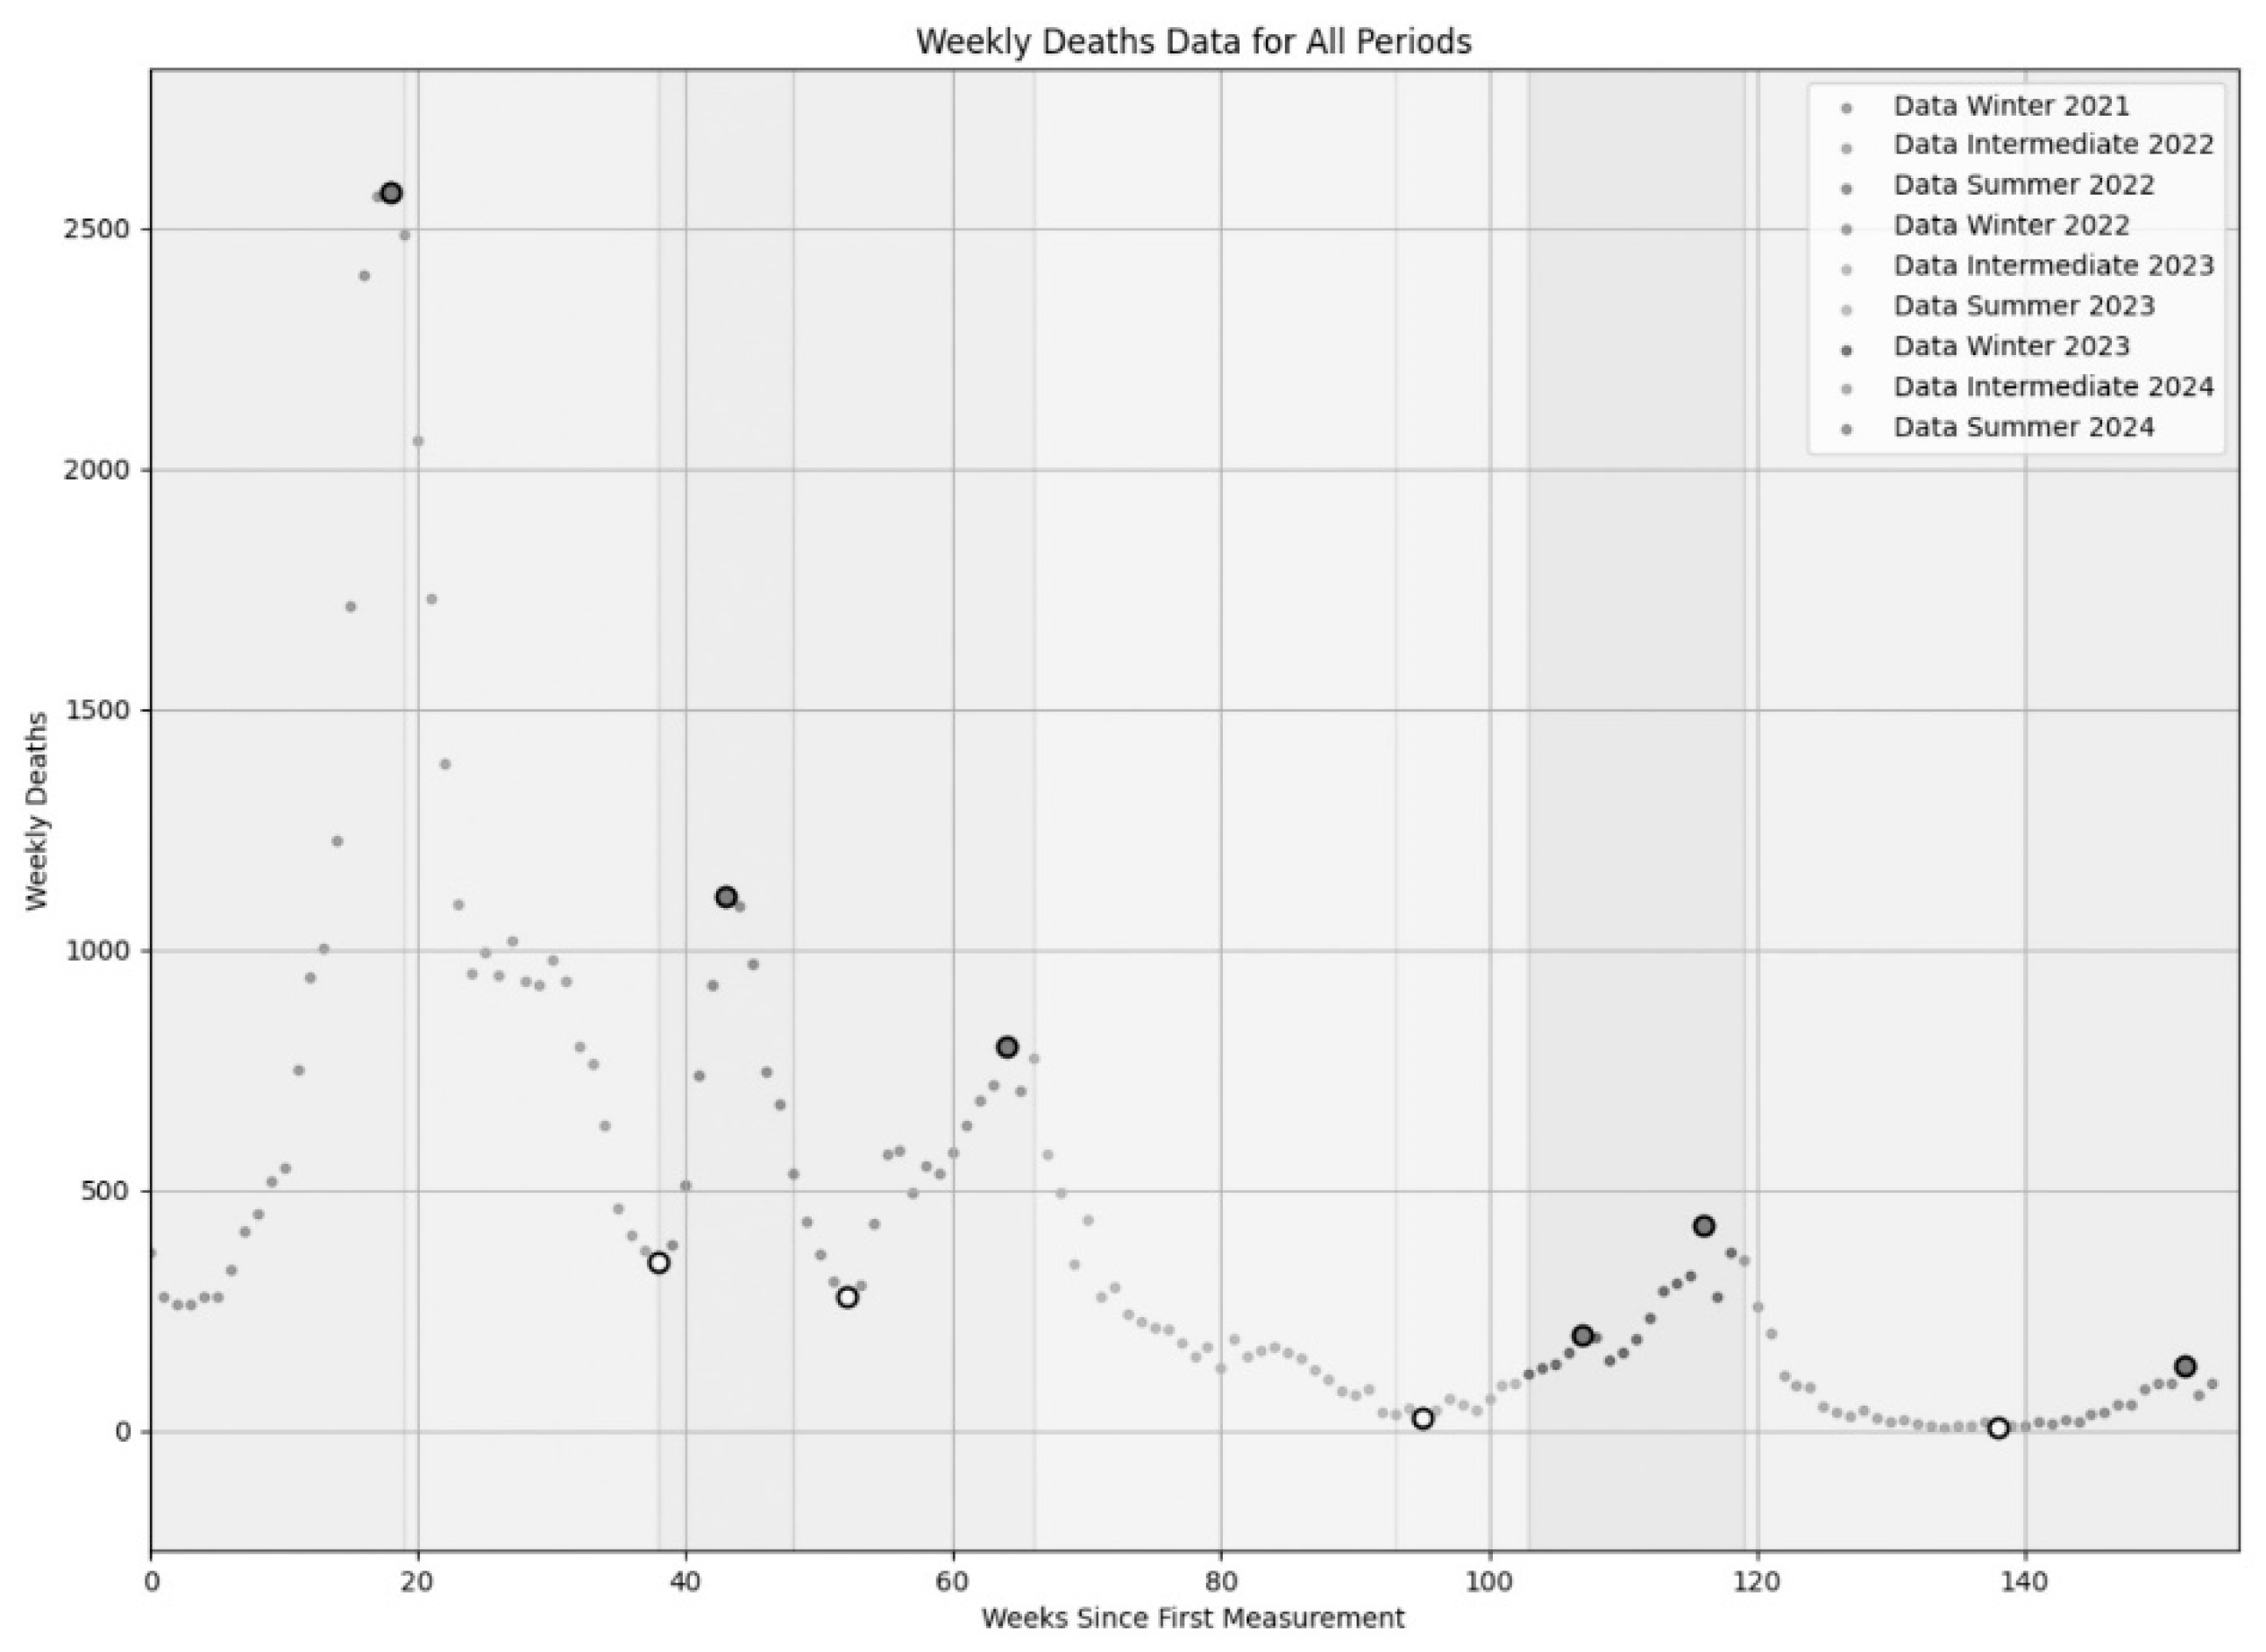
Figure 2.
Visualization of the COVID-19 deaths data time series in Italy: 16/5 2024 – 21/5 2025. Y axis: number of COVID-19 deaths per week. X axis: weeks from 1 to 53.
Figure 2.
Visualization of the COVID-19 deaths data time series in Italy: 16/5 2024 – 21/5 2025. Y axis: number of COVID-19 deaths per week. X axis: weeks from 1 to 53.
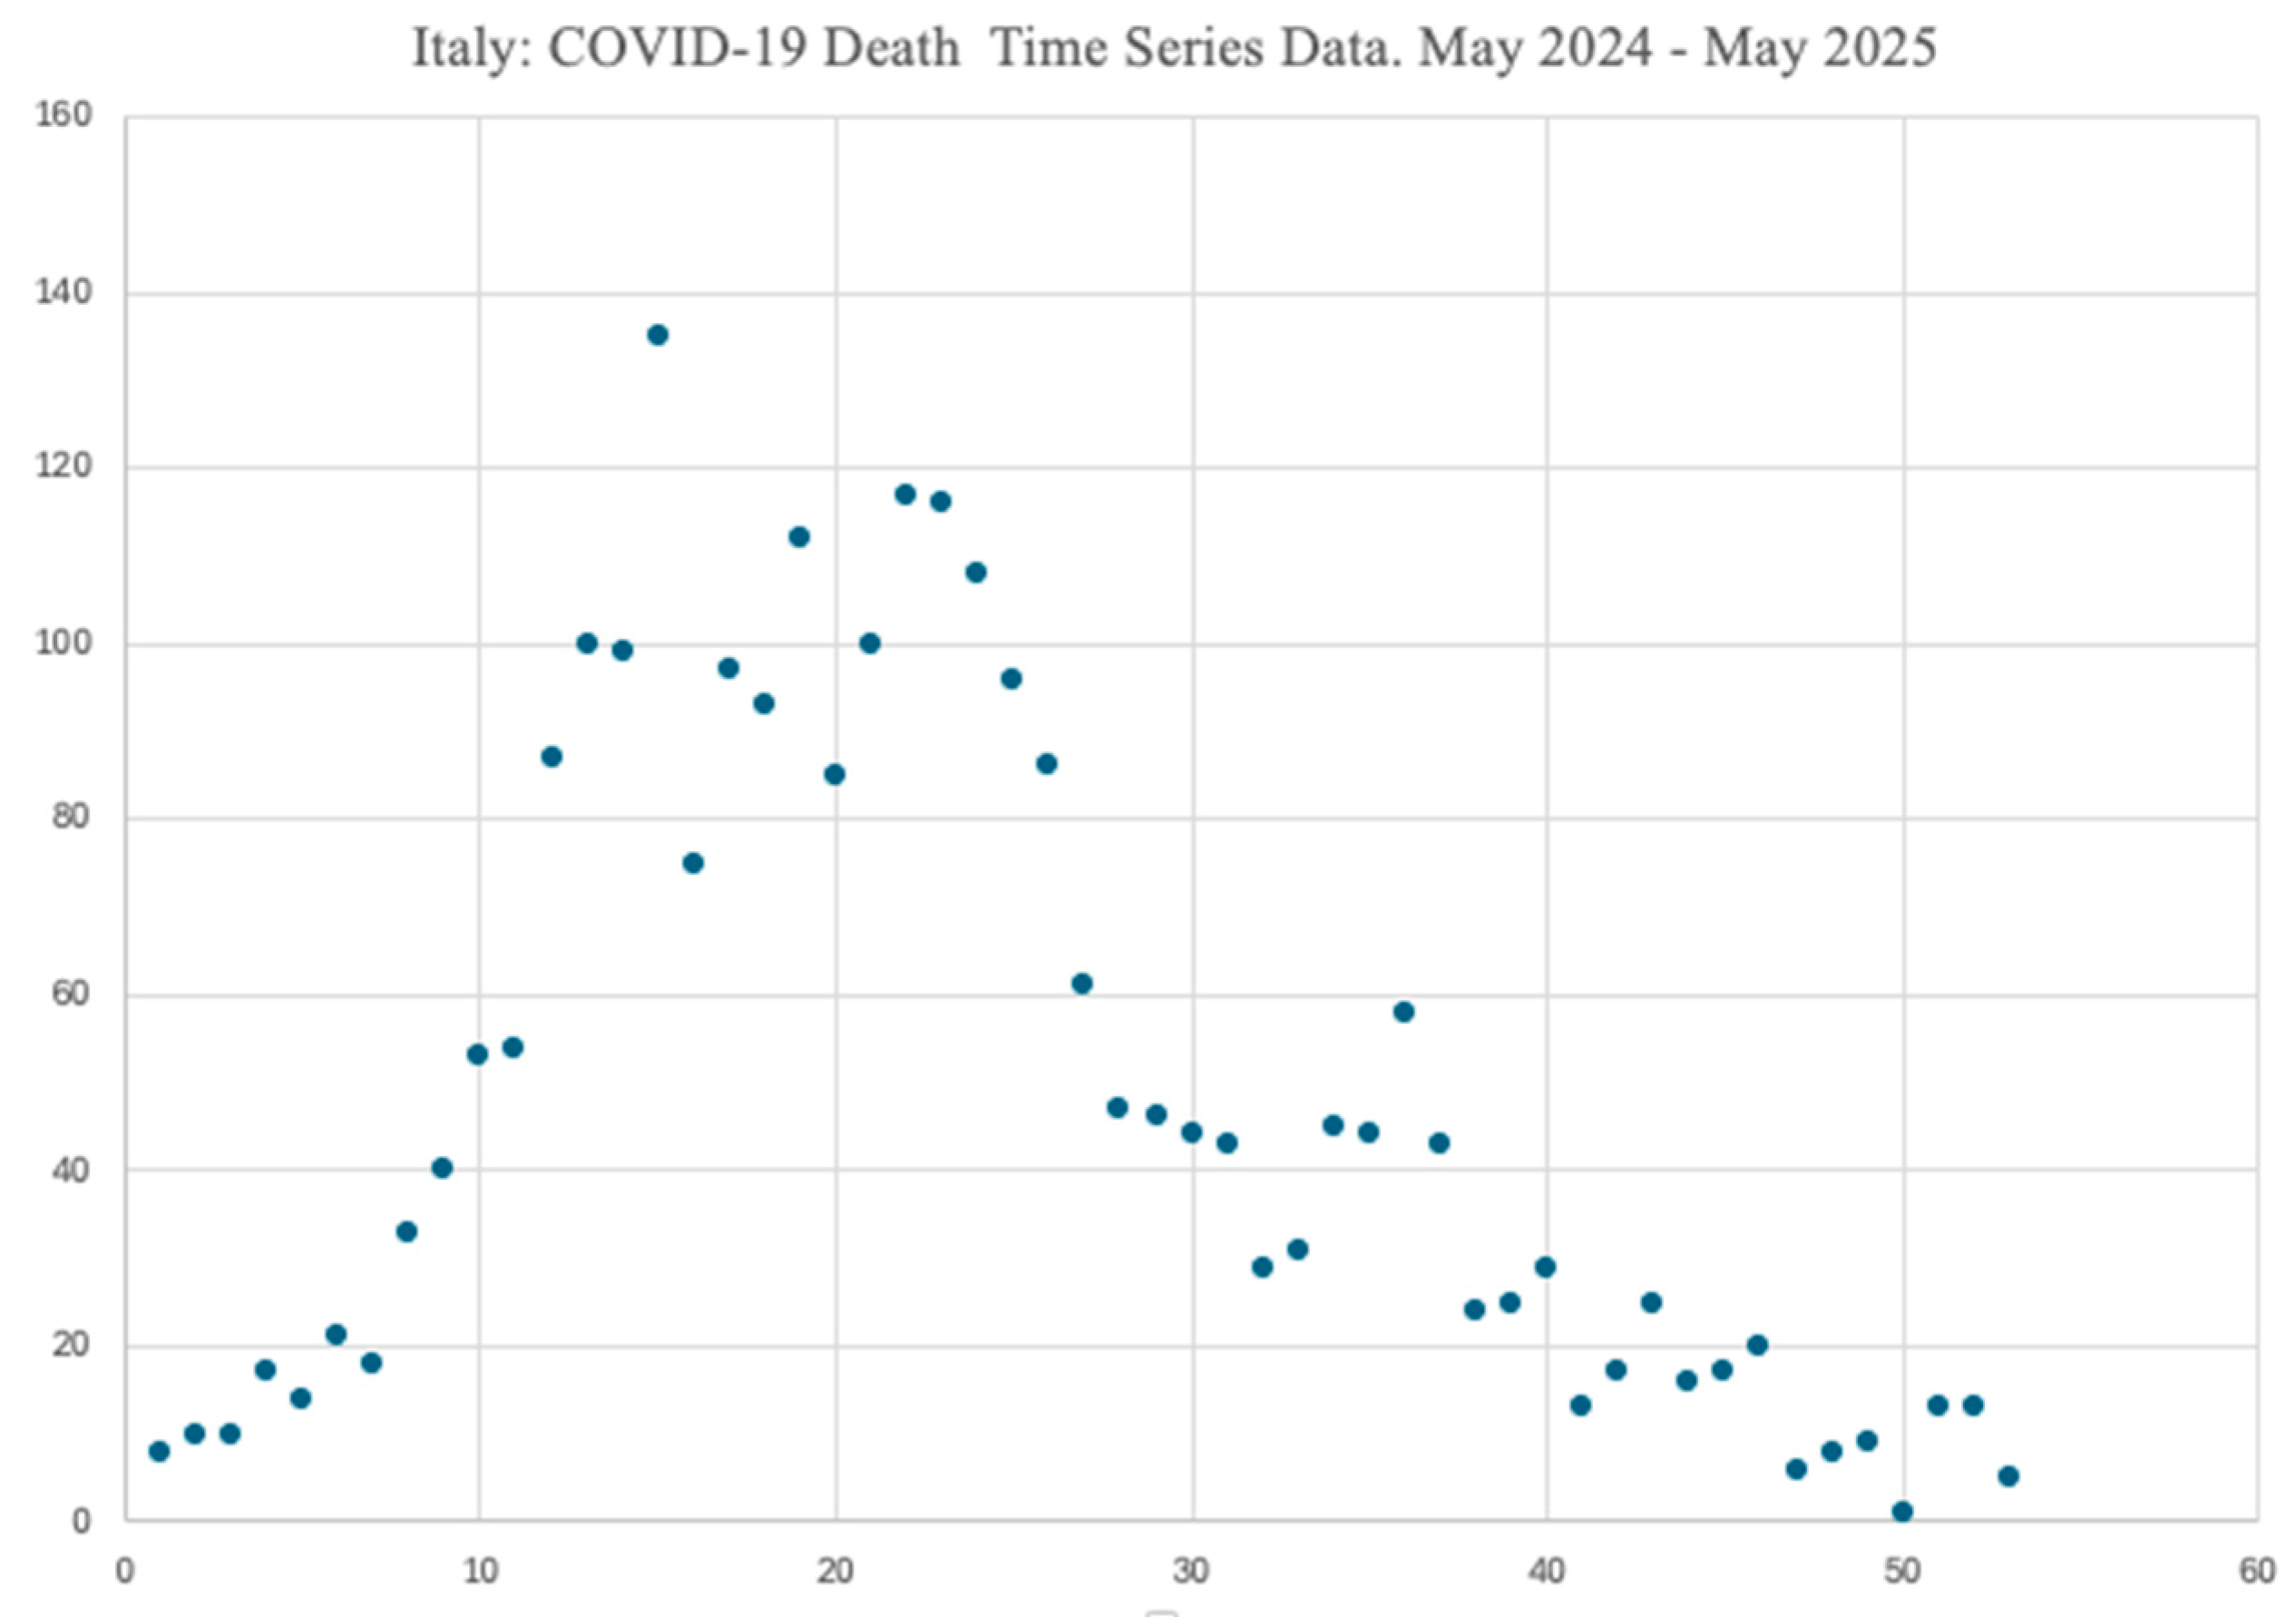
Figure 3.
A comprehensive graphical summary of the linear regression results with the COVID-19 deaths data of September 2021 – September 2024 (weeks from 1 to 157). The linear regression segments are overlaid on the nine distinct seasonal sectors.
Figure 3.
A comprehensive graphical summary of the linear regression results with the COVID-19 deaths data of September 2021 – September 2024 (weeks from 1 to 157). The linear regression segments are overlaid on the nine distinct seasonal sectors.
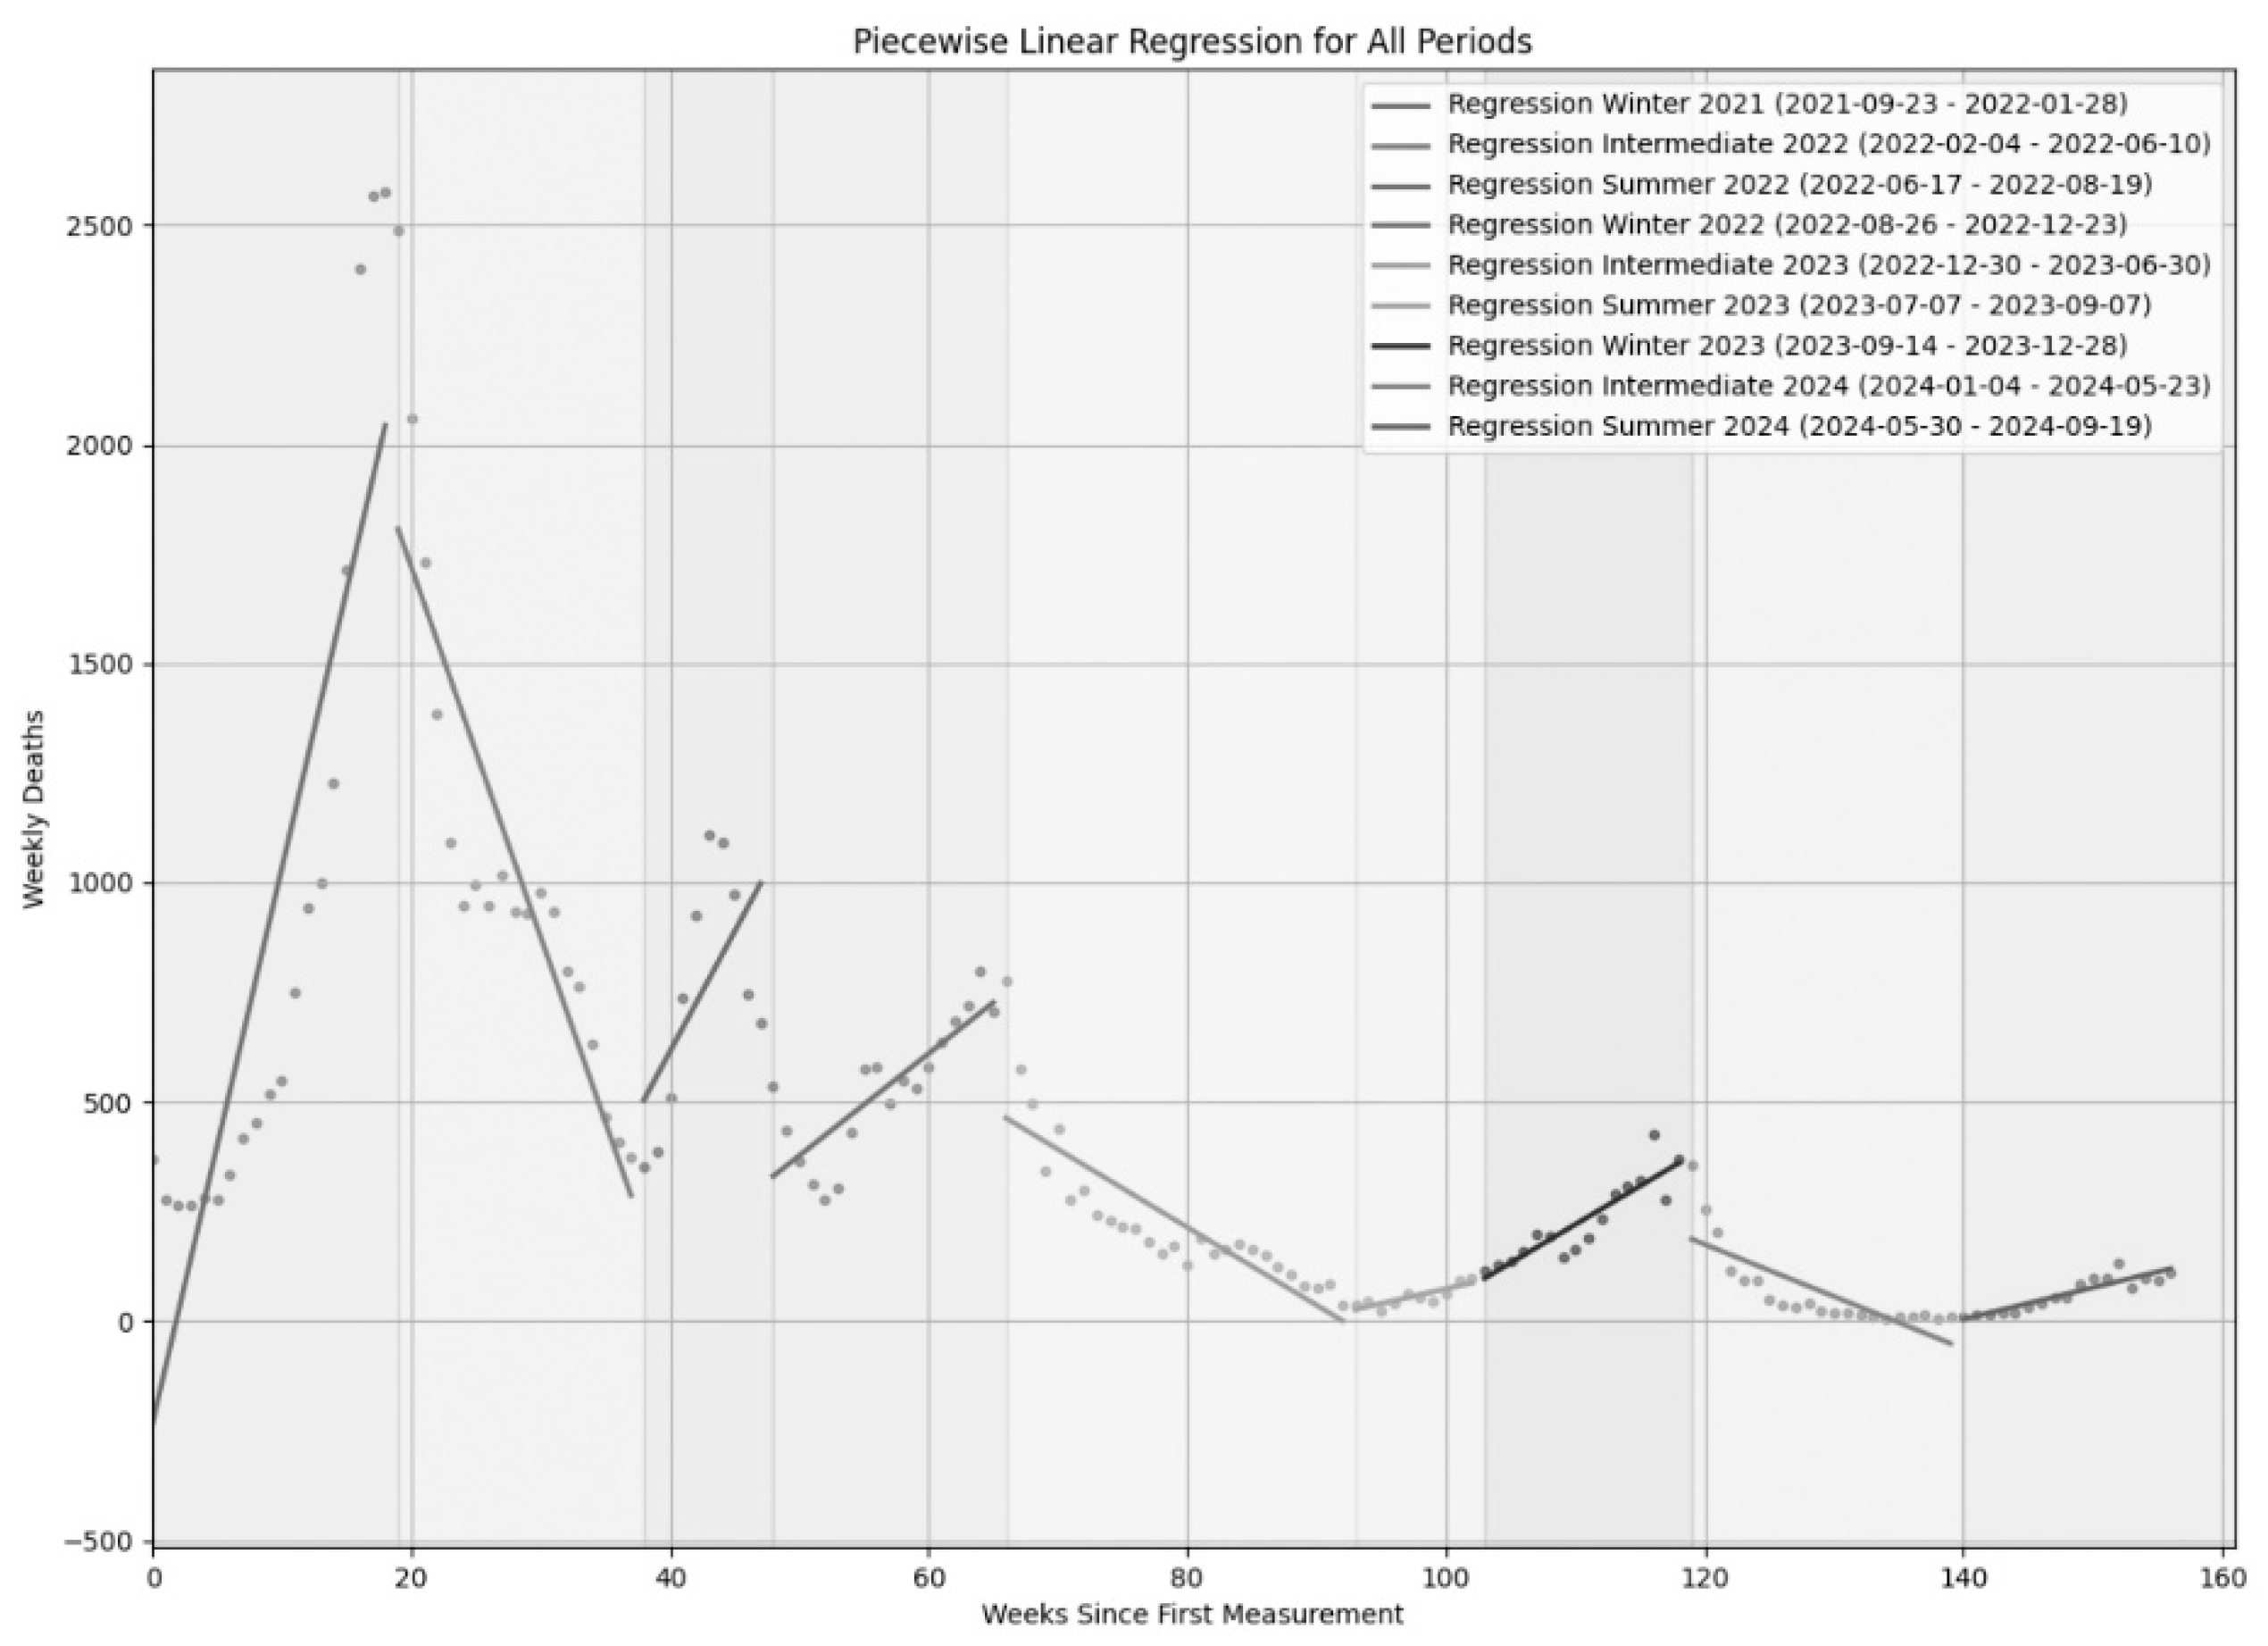
Figure 4.
Summer 2024/Late Fall 2024. Regression segment: b = +4.08. R2 = 64.97%. Average (SD) deaths per week: 68.70 (39.67).
Figure 4.
Summer 2024/Late Fall 2024. Regression segment: b = +4.08. R2 = 64.97%. Average (SD) deaths per week: 68.70 (39.67).
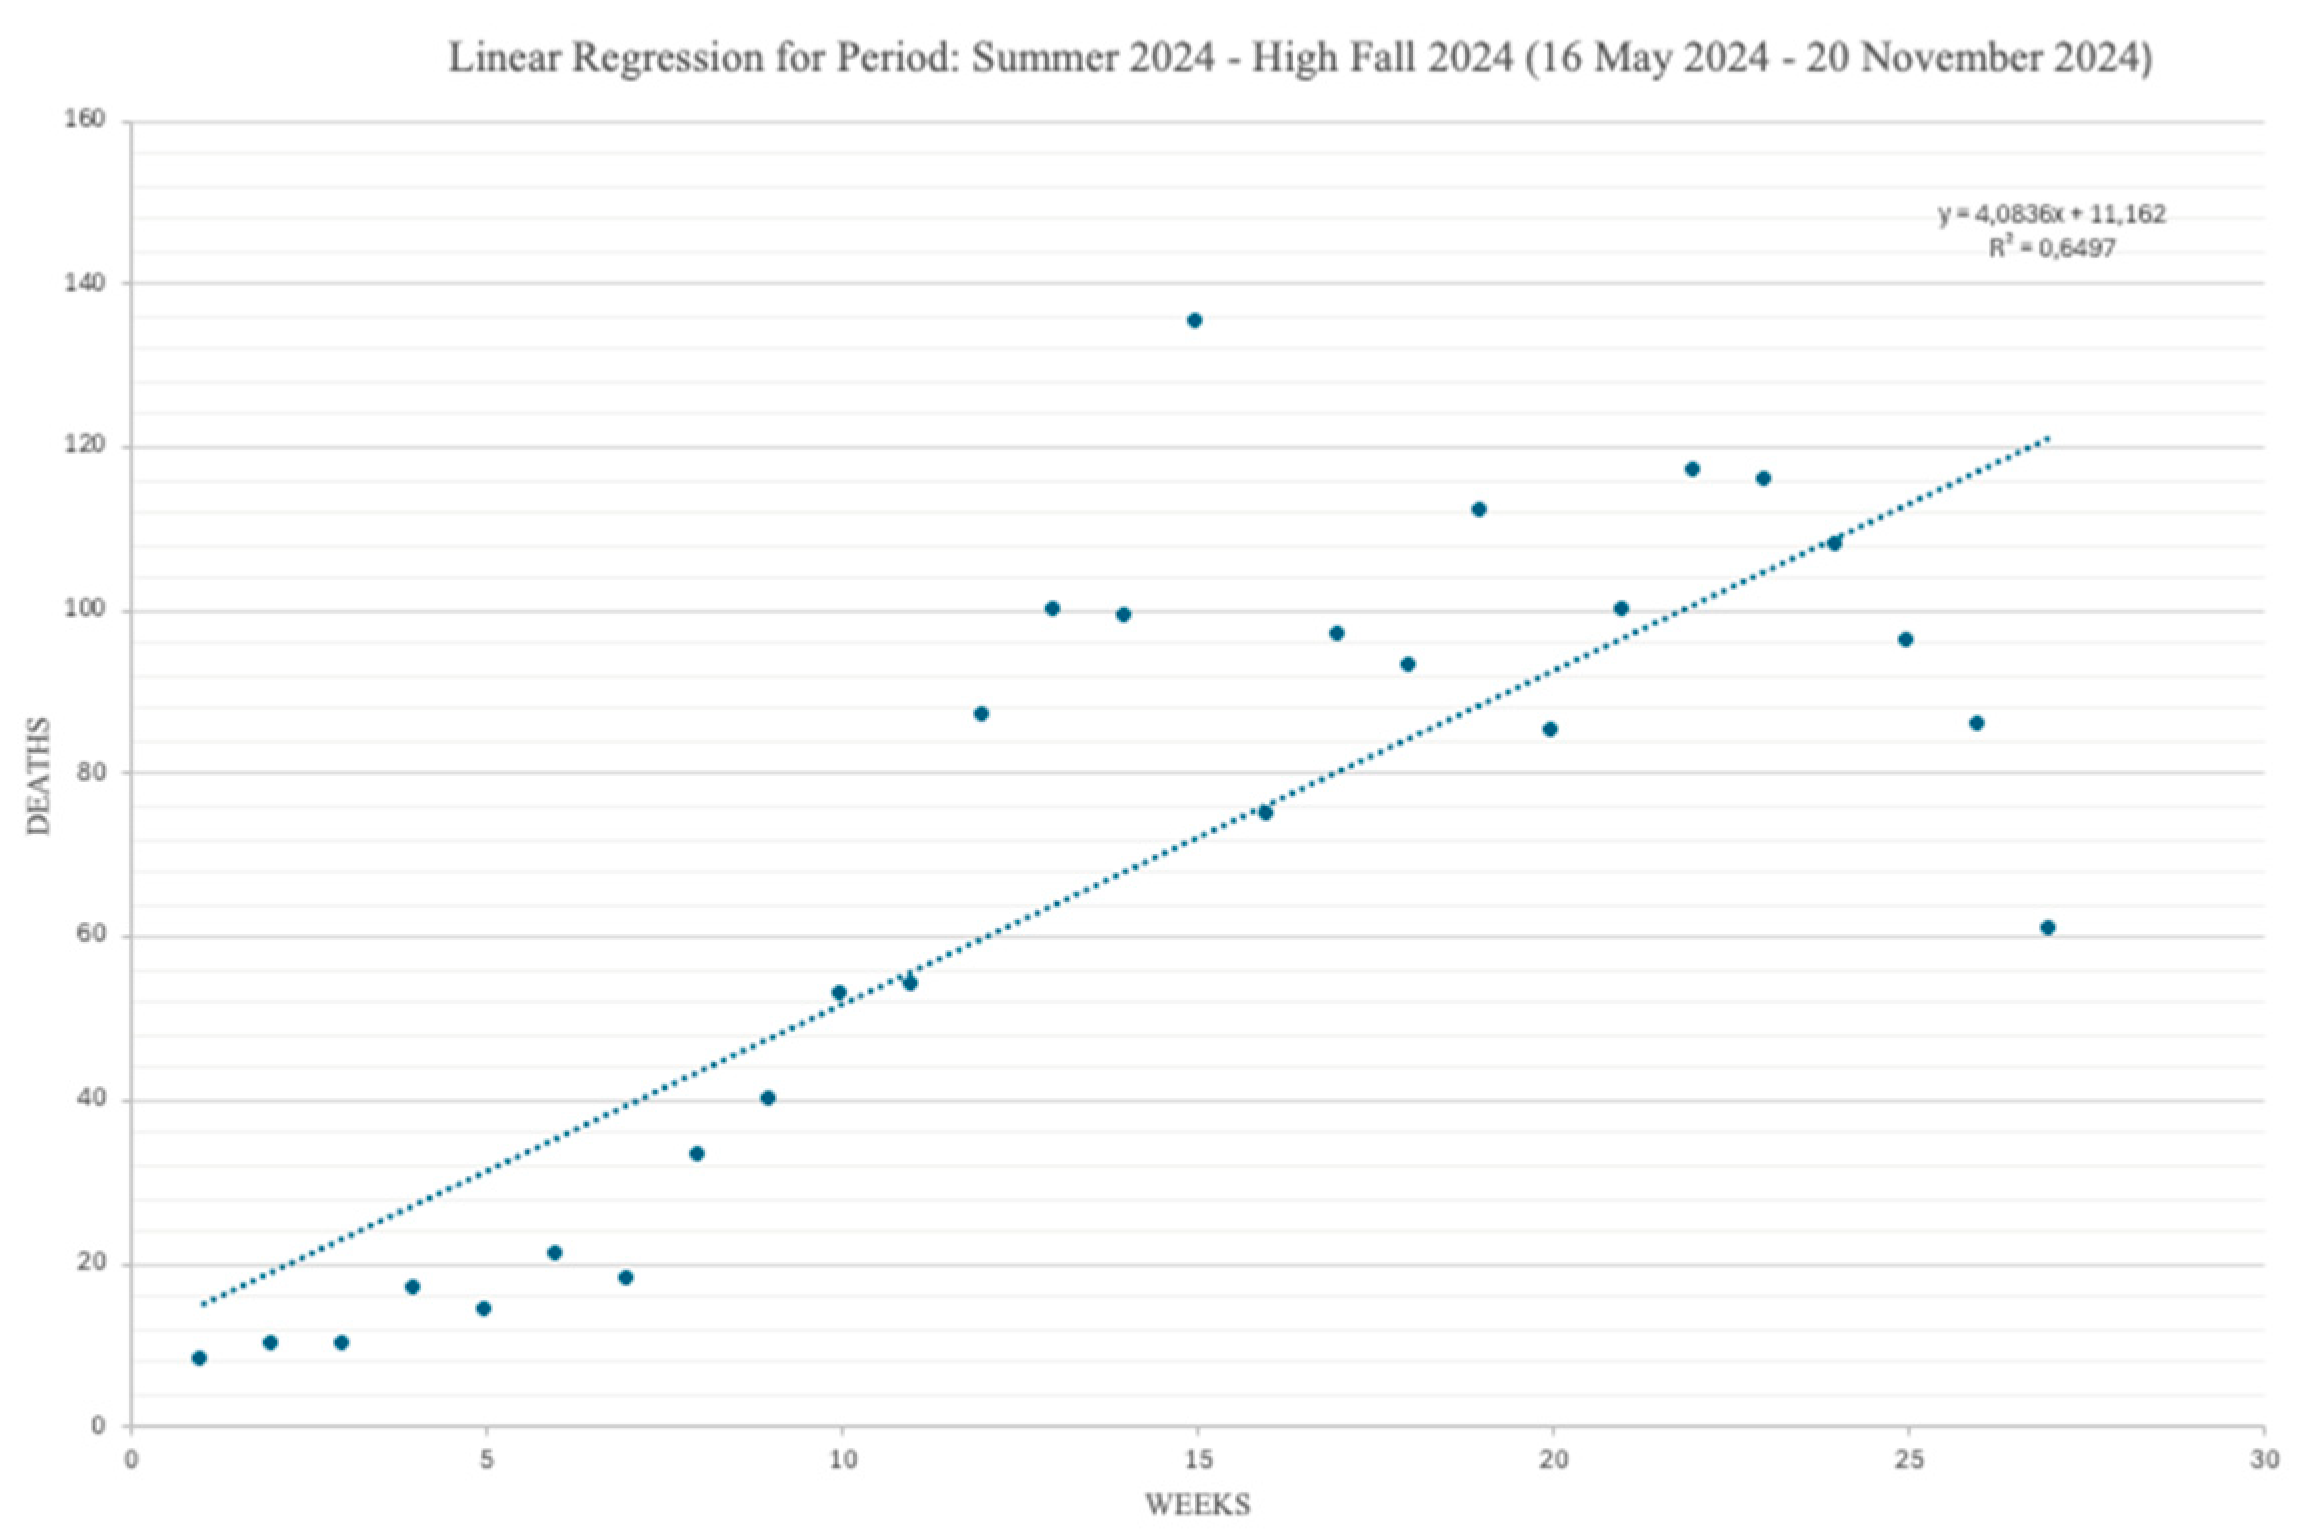
Figure 5.
Early Winter 2024/Spring 2025: Regression segment: b = -1.81. R2 = 75.41%. Average (SD) deaths per week: 25.80 (15.67).
Figure 5.
Early Winter 2024/Spring 2025: Regression segment: b = -1.81. R2 = 75.41%. Average (SD) deaths per week: 25.80 (15.67).
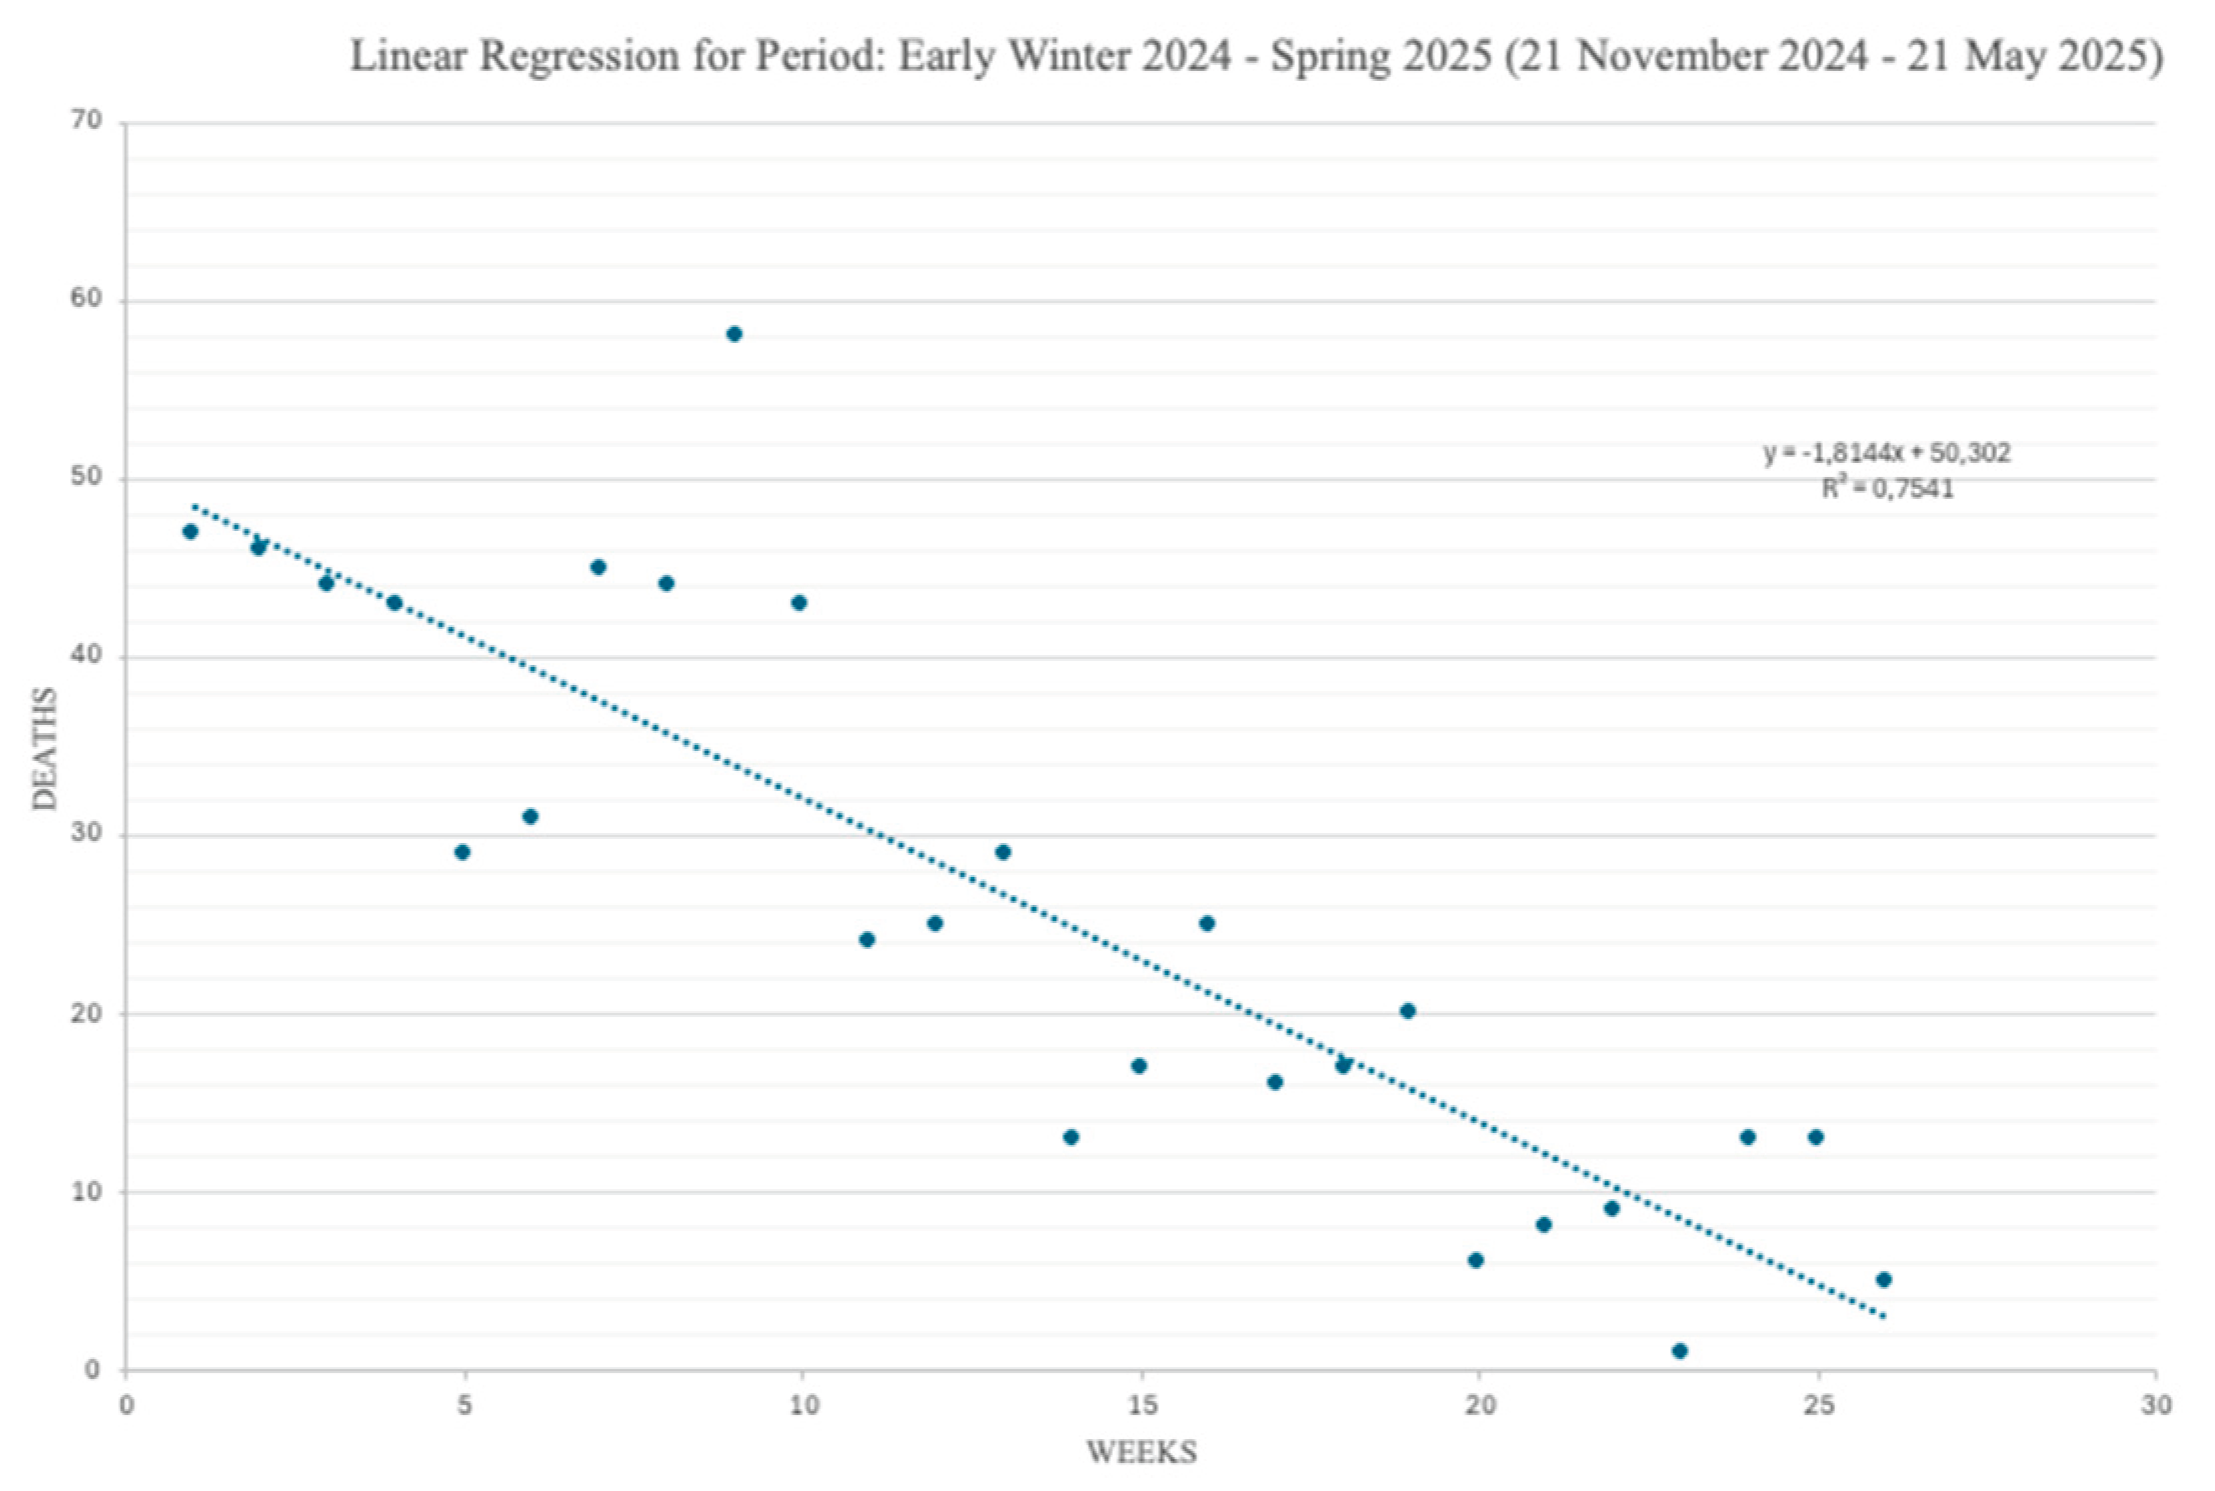

Table 1.
COVID-19 deaths data: period, season type, increasing/decreasing mortality trend, number of weeks per period, dates of beginning/end.
Table 1.
COVID-19 deaths data: period, season type, increasing/decreasing mortality trend, number of weeks per period, dates of beginning/end.
| Period | Season | Trend | Weeks | Begin | End |
|---|---|---|---|---|---|
| Wint. 21 Inter. 22 Sum. 22 Wint. 22 Inter. 23 Sum. 23 Wint. 23 Inter. 24 Sum. 24 |
Fall-Winter Extd. Spring Summer Fall-Winter Extd. Spring Summer Fall-Winter Extd. Spring Summer |
Incr. Decr. Incr. Incr. Decr. Incr. Incr. Decr. Incr. |
19 19 10 18 27 10 16 21 17 |
23/9/21 4/2/22 17/6/22 26/8/22 30/12/22 7/7/23 14/9/23 4/1/24 30/5/24 |
28/1/22 10/6/22 19/8/22 23/12/22 30/6/23 7/9/23 28/12/23 23/5/24 19/9/24 |
Table 2.
COVID-19 deaths time series data in Italy: from 16 May 2024 to 21 May 2025 (totaling 53 weeks).
Table 2.
COVID-19 deaths time series data in Italy: from 16 May 2024 to 21 May 2025 (totaling 53 weeks).
| # Week | Week: beginning date - end date | Weekly Deaths |
| 1 | 16/5 2024 - 22/5 2024 | 8 |
| 2 | 23/5 2024 - 29/5 2024 | 10 |
| 3 | 30/5 2024 - 5/6 2024 | 10 |
| 4 | 6/6 2024 - 12/6 2024 | 17 |
| 5 | 13/6 2024 - 19/6 2024 | 14 |
| 6 | 20/6 2024 - 26/6 2024 | 21 |
| 7 | 27/6 2024 - 13/7 2024 | 18 |
| 8 | 4/7 2024 - 10/7 2024 | 33 |
| 9 | 11/7 2024 - 17/7 2024 | 40 |
| 10 | 18/7 2024 - 24/7 2024 | 53 |
| 11 | 25/7 2024 - 31/7 2024 | 54 |
| 12 | 1/8 2024 - 7/8 2024 | 87 |
| 13 | 8/8 2024 - 14/8 2024 | 100 |
| 14 | 15/8 2024 - 21/8 2024 | 99 |
| 15 | 22/8 2024 - 28/8 2024 | 135 |
| 16 | 29/8 2024 - 4/9 2024 | 75 |
| 17 | 5/8 2024 - 11/9 2024 | 97 |
| 18 | 12/9 2024 - 18/9 2024 | 93 |
| 19 | 19/9 2024 - 25/9 2024 | 112 |
| 20 | 26/9 2024 - 2/10 2024 | 85 |
| 21 | 3/10 2024 - 9/10 2024 | 100 |
| 22 | 10/10 2024 - 16/10 2024 | 117 |
| 23 | 17/10 2024 - 23/10 2024 | 116 |
| 24 | 24/10 2024 - 30/10 2024 | 108 |
| 25 | 31/10 2024 - 6/11 2024 | 96 |
| 26 | 7/11 2024 - 13/11 2024 | 86 |
| 27 | 14/11 2024 - 20/11 2024 | 61 |
| 28 | 21/11 2024 - 27/11 2024 | 47 |
| 29 | 28/11 2024 - 4/12 2024 | 46 |
| 30 | 5/12 2024 - 11/12 2024 | 44 |
| 31 | 12/12 2024 - 18/12 2024 | 43 |
| 32 | 19/12 2024 - 25/12 2024 | 29 |
| 33 | 26/12 2024 - 1/1 2025 | 31 |
| 34 | 2/1 2025 - 8/1 2025 | 45 |
| 35 | 9/1 2025 - 15/1 2025 | 44 |
| 36 | 16/1 2025 - 22/1 2025 | 58 |
| 37 | 23/1 2025 - 29/1 2025 | 43 |
| 38 | 30/1 2025 – 5/2 2025 | 24 |
| 30 | 6/2 2025 - 12/2 2025 | 25 |
| 40 | 13/2 2025 - 19/2 2025 | 29 |
| 41 | 20/2 2025 - 26/2 2025 | 13 |
| 42 | 27/2 2025 - 5/3 2025 | 17 |
| 43 | 6/3 2025 - 12/3 2025 | 25 |
| 44 | 13/3 2025 - 19/3 2025 | 16 |
| 45 | 20/3 2025 - 26/3 2025 | 17 |
| 46 | 27/3 2025 – 2/4 2025 | 20 |
| 47 | 3/4 2025 - 9/4 2025 | 6 |
| 48 | 10/4 2025 - 16/4 2025 | 8 |
| 49 | 17/4 2025 - 23/4 2025 | 9 |
| 50 | 24/4 2025 - 30/4 2025 | 1 |
| 51 | 1/5 2025 - 7/5 2025 | 13 |
| 52 | 8/5 2025 - 14/5 2025 | 13 |
| 53 | 15/5 2025 - 21/5 2025 | 5 |
Table 3.
Characteristics of the regression segments for COVID-19 deaths of Figure 3: b and R2per period, plus average and standard deviation per season.
Table 3.
Characteristics of the regression segments for COVID-19 deaths of Figure 3: b and R2per period, plus average and standard deviation per season.
| Period | b | R2 | Seasonal Avg/SD: b | Seasonal Avg/SD: R2 |
|---|---|---|---|---|
| Wint. 21 Wint. 22 Wint. 23 Sum. 22 Sum. 23 Sum. 24 Int. 22 Inter. 23 Sum. 24 |
126.45 23.28 17.52 54.80 6.72 7.20 -84.38 -17.76 -11.89 |
0.76 0.67 0.80 0.36 0.70 0.82 0.77 0.71 0.62 |
55.75/61.29 55.75/61.29 55.75/61.29 22.90/22.55 22.90/22.55 22.90/22.55 -38.01/32.87 -38.01/32.87 -38.01/32.87 |
0.74/0.05 0.74/0.05 0.74/0.05 0.63/0.05 0.63/0.05 0.63/0.05 0.70/0.19 0.70/0.19 0.70/0.19 |
Disclaimer/Publisher’s Note: The statements, opinions and data contained in all publications are solely those of the individual author(s) and contributor(s) and not of MDPI and/or the editor(s). MDPI and/or the editor(s) disclaim responsibility for any injury to people or property resulting from any ideas, methods, instructions or products referred to in the content. |
© 2025 by the authors. Licensee MDPI, Basel, Switzerland. This article is an open access article distributed under the terms and conditions of the Creative Commons Attribution (CC BY) license (http://creativecommons.org/licenses/by/4.0/).
Copyright: This open access article is published under a Creative Commons CC BY 4.0 license, which permit the free download, distribution, and reuse, provided that the author and preprint are cited in any reuse.


