
Submitted:
09 October 2025
Posted:
10 October 2025
You are already at the latest version
Abstract
In-plane shear is the dominant deformation mode during thermoforming of fiber-reinforced composites, and accurate characterization of shear behavior is essential for reliable forming simulations. The present work investigates the shear response of a unidirectional cross-ply UHMWPE material system (DSM Dyneema® HB210) using the picture-frame test, with emphasis on sample configuration, normalization methods, and shear-rate effects. Three cruciform sample sizes were tested at 120 °C, along with a configuration in which cross-arm material was removed to isolate the gage region. Finite element analyses using LS-DYNA® were performed to evaluate the shear-rate distribution during forming and to validate the experimental characterization. To maintain a constant shear rate during testing, a decreasing crosshead speed profile was implemented in the test software. Results showed that normalizing by the full specimen area yielded consistent shear stiffness curves across sample sizes, indicating that the arm region contributes equally to the load. Samples with cross-arm material removed exhibited greater scatter than those specimens without cross-arm material removed, confirming that preparation of cross-arm removal complicates repeatability. Rate dependence was observed at room temperature but not at elevated processing temperatures, suggesting that rate-dependent shear models are unnecessary for forming simulations of this material system. These findings provide a practical methodology for shear characterization of UHMWPE cross-ply laminates suitable for thermoforming analyses.
Keywords:
composite
; finite element
; picture frame
; shear
; thermoforming
; thermoplastic
1. Introduction
Thermoforming is attractive as a cost-effective, high-volume production process for the manufacture of complex-shaped thermoplastic composite parts. One option for thermoforming is the two-step process depicted in Figure 1. In the first step, a stack of multiple composite sheets, i.e., a blank, is punch-formed, between a tool and a mold, at an elevated temperature, into a loosely assembled preform. In the second step, a stack of preforms is consolidated under pressure and elevated temperature in a process that bonds the loosely assembled sheets together, forming a complex-shaped laminated structural component.
The preforming process involves a variety of complex physical phenomena including in-plane shear deformation, in-plane and out-of-plane wrinkling, and frictional sliding. These phenomena can be modeled using finite element methods to guide the design of critical preforming parameters, as well as the selection of composite materials and ply orientations, thereby achieving the target performance with reduced development time and costs compared to experimental approaches.
Intra-ply shearing of a fabric-reinforced laminate is the primary mode of deformation during the draping of such a laminate over a compound curvature tool, which has also been shown to be true for unidirectional cross-plies [1,2,3,4,5,6,7,8,9,10,11,12,13,14,15]. Characterizing the intra-ply shear response of a material in an accurate and reliable manner is critical to the success of a thermoforming process simulation. The picture-frame test is a well-accepted method in the composites forming community for characterizing the shear properties of textiles [2,7,8,10,16,17,18,19] and cross-ply sheets [3,20]. This test captures the change in the shear stiffness as a function of the state of shear. While the fixturing can be challenging, one benefit of the picture-frame test is that the specimen is theoretically subjected to a pure and uniform in-plane shear [10,21]. Past research has found that large errors can occur if the test samples are misaligned in the fixture, so mounting methods that mitigate alignment errors are important. Also, to prevent misalignment, the sample should be clamped neither too loosely nor too tightly [22,23,24].
Much research has been done in developing the equations used to calculate the shear angle and normalized shear stress from picture frame experiments [7,8,10,18,24,25,26,27]. The global shear angle, γ, of the sample is geometrically related to the length of the frame, LF, and the displacement of the top of the frame, δ through Equation 1,
Although research has shown that the shear angle of the material is not always in exact agreement with the angle of the frame, the approximation is generally accepted for the purposes of material characterization [9,23,28]. The shear force, FSh, on the fabric is also a function of the global shear angle and the force applied to the top of the frame, F,
Using a method of normalization for cruciform sample testing based on energy conservation through work done per unit volume, researchers justified normalizing the force using the picture frame side length [7,18]. Peng et al. [7] specifically addressed using an assumption of zero contribution of load from the arms and uniform shear deformation in the gage area, the shear force can be normalized over the gage area with side length Lf, and the frame side length, LF. Combining these into a single expression yields Equation 3 [29],
On the other hand, if the arm parts make the same load contribution as the gage area, then the load would be analyzed using the entire area of the sample, including arms, as in Equation 4 [7],
Both Equations 3 and 4 are divided by the thickness of the sample for normalization.
During a benchmark study completed by Cao et al. [8], researchers from seven international institutions completed shear testing on cruciform specimens of three identical woven fabrics. Some of the groups removed unclamped fringe (cross) tows from the arms of a woven-textile test specimen to eliminate the additional force contributions necessary to shear the textile in that region of the fabric, and some did not. Two extreme scenarios existed: (1) the arm region does not contribute to the load, and the central gage area is only considered in the analysis, and (2) the arm region contributes the same as the gage region, and the entire specimen area is used for analysis. A third and intermediate scenario is that the arm region partially contributes, thereby complicating the analysis in determining the partial contribution [7]. These cross-yarns were expected to contribute to the overall load. However, because they were unbounded on the sides, the contribution would not be equal to that of the gage area. In the benchmarking research, good agreement was observed among the samples using the central gage area when the cross-arms were removed; however, an increase in the measured force was found when the yarns in the arm area were not pulled out.
Dangora et al. [30] successfully used the shear-frame test for the characterization of a unidirectional cross-ply material system. They applied the same thought process of removing the arm contribution in a unidirectional cross-ply laminate, i.e., DSM Dyneema® HB80, by removing the resin and cross fibers from the arm area to isolate the shear to the central gage area of the specimen. Five different test sample configurations were explored to determine how many slits needed to be made in a continuous sheet to isolate the shear deformation to the central square of material in the shear-frame test, thereby approximating the removal of unclamped tows in the arm region of a woven material. The “infinite” number of slits configuration had the least variation for the distribution of the shear stress across the sample. It was found that the shear-stress vs. shear-strain curve derived from the “infinite” number of slits configuration gave the best correlation between a model of the shear-frame test and the experimental results for each of the five configurations.
Krogh et al. [25] performed a similar sample preparation investigation to that of Dangora et al. with a woven carbon prepreg material. DIC (Digital Image Correlation) was used to document the shear frame testing of two sample configurations: cruciform samples with tows in the arm area removed and samples without tows removed. The analysis showed the same average shear deformation regardless of sample preparation, even though slightly less variation was observed in the central area than in the arm areas. Based on this analysis, the same shear characterization data were achieved using either the entire sample area for normalization with full samples or the central area for samples with arms removed. Krogh et al. also noted that the challenging preparation procedures for removing arm yarns and the handling of the free yarns when mounting them into the fixture led to less repeatable results due to misalignment errors [25]. Lastly, Krogh et al. determined a method for controlling the crosshead rate to achieve a constant shear rate during a shear-frame test. The carbon prepreg material being investigated showed rate dependence that could be compared with bias-extension testing.
Shear rate effects were also investigated by Chen et al. [31] in a bias-extension test with constant pull velocity, resulting in a constantly changing shear rate. The rate effects were built into a simulation using resin viscosity parameters. Multiple researchers, including Guzman-Maldonado et al. [32] and Hsiao and Kikuchi [33], also built rate effects into a simulation using experimentally-derived viscosities as a function of rate and temperature. Each of these studies coupled the mechanical properties of the material with thermal properties, creating complex models that yielded good results.
Most of the research groups that performed experimental investigations of shear behavior also used the data as inputs to various simulation methods, many of them employing discrete mesoscopic approaches that strike a balance between high fidelity of the model and computational efficiency [6,34,35,36,37,38,39]. The Sherwood Group [21] developed a discrete modeling approach that was successfully used to simulate the forming of a plain-weave hemisphere. In this modeling approach, conventional elements available in commercial finite element software are used in a unit cell approach of a 2D element surrounded by four 1D elements. Fiber directionality is described and tracked by beam elements that represent the tensile and flexural properties of the laminate. The shear load is carried by shell elements that capture the evolution of the in-plane shear stiffness as a function of the degree of shear. Single nodes are used to connect the beams in the corners, assuming a “no-slip” condition between layers. This “no-slip” condition has been demonstrated to be an acceptable assumption by Harrison et al. [20]. This modeling technique has been applied to a variety of textile architectures, including woven fabrics, non-crimp fabrics, cross-ply fabrics, and unidirectional fabrics [21,40,41,42,43,44,45].
Extensive research has been conducted on the shear characterization of a variety of materials for the purpose of simulating forming in manufacturing. However, with new material systems continually being developed, the need for efficient and simple evaluation of their formability needs to happen not only with simulation, but with the accompanying characterization. The current research not only aims to identify the need for strain-rate dependence in forming simulations but also takes it a step further to streamline the shear characterization method of unidirectional cross-ply systems through simple sample preparation and constant strain-rate testing.
In this paper, the technical challenges in characterizing a UHMWPE unidirectional fiber/matrix cross-ply, i.e., DSM Dyneema® HB210 [46], are explored. Shear characterization is performed with a shear-frame setup. Sample size and configuration, as well as normalization methods, are investigated to validate a sample configuration and normalization method that leads to reduced misalignment and repeatable results. Finite element analyses are performed using the explicit solver in LS-DYNA® to validate the material characterization results and methodology. The effects of rate are investigated with a varying crosshead speed to achieve a constant shear rate throughout the test, with results determining if there is the need for a rate-dependent shear description in the finite element simulation. This research contributes to a larger objective of simulating the two-step thermoforming and consolidation processes.
2. Materials and Methods
The variation of shear deformation across a compound curvature part, as shown in Figure 2 has been widely reported [1,2,3,4,5,6,7,8,9,10,11,12,13,14,15]. Likewise, the shear rate during forming will also vary across the part. Quantifying the range of shear rates experienced by the material was a required step in establishing the range of rates to perform shear characterization. From there, ascertaining reliable and repeatable methods for testing and for data normalization were required to obtain the material properties best suited for simulation input.
The material system considered in the current research is DSM Dyneema HB210. This material system is a thermoplastic cross-ply containing four highly directional layers in a [0/90]2 configuration. Each ply is comprised of ultrahigh molecular weight polyethylene (UHMWPE) unidirectional fibers with a polyurethane (PUR) resin.
2.1. Determination of Shear Rate in Forming
An LS-DYNA explicit dynamics finite element model was exercised to explore shear deformation rates in the UHMWPE sheets during the thermoforming process. The model is depicted in the exploded view of Figure 3a and consists of a punch, a binder ring, a die plate, and a single sheet of the UHMWPE material. A rigid material definition was used for the binder ring, die plate, and punch. The constitutive behavior of UHMWPE was defined using a fabric model, which employed a trilinear stress-strain relationship. This fabric model has been shown to capture the shear behavior of UHMWPE accurately [47]. The in-plane axial stiffness in the x- and y-directions of the orthogonal UHMWPE sheet ([0/90]2 architecture) was 13 GPa at 120°C. The UHMWPE began in contact with the die plate and binder ring. A fixed boundary condition was applied to the die plate in all directions, while the binder ring and punch were only constrained in the x- and y-directions. The initial state of the model is shown in Figure 3b, and the final state is shown in Figure 3c and Figure 3d. A load was applied to the binder ring in the z-direction to achieve a prescribed pressure. The punch was initially positioned 1 mm above the UHMWPE and was lowered at a constant displacement rate of 6.35 mm/s (in the z-direction) until it was fully embedded in the UHMWPE. The finite element model of the UHMWPE sheet was comprised of 16,129 fully integrated square shell elements (ELFORM16). Increasing the number of elements to 36,100 had a negligible influence on the shear-strain distribution. Thus, the model was concluded to be sufficiently converged for 16,129 elements.
2.2. Sample Size Variation
The configuration of the shear-frame fixture used in this research is shown in Figure 4. The rate multiplier is included on the frame so that the top of the frame can move approximately 4.25 times faster than the crosshead movement, allowing for higher shear rates than what could be achieved without it. The inclusion of the multiplier requires that the displacement of the top of the frame, δ, is determined by multiplying the crosshead displacement, δc, by the multiplier value, C. For the frame used in this study, C = 4.25. Equation 1 can be rewritten to include the multiplier,
Likewise, the recorded crosshead force, Fc, must be adjusted to include the multiplier as shown in Equation 6 to find the shear force acting on the specimen.
The current research uses some of the findings of Dangora et al. [30] and the equations developed by Peng et al. [7] to build an argument that, for this class of material systems, the arm region contributes equally to the load and can be used in the normalization. Figure 5a denotes the area generally used for normalization when the arm regions do not contribute to the load because either the cross-yarns are removed, or the cross-over friction of a woven material is considered negligible. However, for unidirectional cross-plies, the arm area will be constrained to shear with the sample, and the full area shown in Figure 5b should be considered in the normalization.
The three different shear-frame sample sizes, as summarized in Table 1, were prepared with varying gage areas that led to a varying ratio of arm area to total area. The samples are shown in Figure 6. The assumption is that if the arm area is contributing to the shear force of the system in the same manner as the gage region, then the force normalized by the entire area will agree regardless of the ratio of arm area to the total area. Likewise, if the arm crossover material is removed, and the shear force is normalized by the central gage area, then those results should agree with the full area normalization tests. A comparison of a full-area analysis and a gage-area-only analysis was accomplished by testing a sample with the cross-arm material removed, thereby removing the contribution of the arm region to the total load. The method employed by Dangora et al. [30] was used on the Dyneema HB80 material. Acetone was applied to the arm regions to dissolve the PUR, and the cross fibers were removed with a fine-toothed comb, as shown in Figure 7.
2.3. Constant Shear-Rate Testing
During a typical shear-frame test, the crosshead rate remains constant. However, because of the nonlinear geometric relationship between the top displacement and the shear angle, the shear-strain rate increases during such a typical test. To calculate an appropriate changing crosshead rate to achieve a specific constant shear rate, derivations of the equations relating the frame geometry to the shear angle were developed and analyzed in MATLAB®. The details of the development by Krogh et al. can be found in [25]. The previous shear-frame testing performed in the research of this forming process used a constant crosshead rate of 2 mm/sec, which mimics the tool speed in the process. Therefore, a value slightly below that was used as the lower end of the constant strain rate range.
Figure 8 shows how a 20-segment multi-linear approximation of the changing crosshead rate can be used to achieve a constant strain rate. The solid blue line in Figure 8a represents how the strain rate increases with a constant crosshead rate. However, by employing the decreasing crosshead rate depicted by the black dashes, the shear rate closely matches the 0.05 rad/sec solid red line for constant shear rate. Figure 8b shows the specific displacement vs. time points that can be programmed into an Instron® Bluehill® software profile to achieve the 0.05 rad/sec strain rate.
3. Results
3.1. Strain Rate Variation
For the current study, the magnitude of the shear-strain rate over the UHMWPE sheet as a function of the deformed state was used to determine the range of shear-strain rates to be investigated in the shear-frame testing. During the FE analysis, the shear-strain rate is calculated for each element at each time step using,
where Δt is the time between output states, and n denotes the time step number.
Figure 9 shows contour maps of the shear-strain rate distribution for when the punch is at 33%, 67%, and 100% embedded in the UHMWPE sheet. In this figure, the x-y location is normalized by the punch radius, meaning that a normalized x-location of 1 would be at a distance of 7.62 cm (3 in.) from the center of the plot if the punch radius were 7.62 cm (3 in.). It can be seen in these contour maps that the shear rate within the UHMWPE sheet is a function of both spatial location and time during the thermoforming process. Both the peak shear rate and shear-rate variation increase with increasing punch depth. The peak shear rate at any location during the simulation was calculated to be 8°/sec (0.14 rad/sec). Based on the results from this analysis, an ideal range of constant shear rates to explore was found to be 0.05 to 0.14 rad/sec.
3.2. Sample Size
The four sample configurations were tested using an Instron® 4464 universal testing machine with a 2kN load cell. Crosshead displacement and force were recorded with the Instron Bluehill software during the picture-frame tests. A typical test setup and result are shown for each size full-arm sample in Figure 10, and the sample with the cross-arm material removed is shown in Figure 11. Equations 1 and 2 were used to calculate the shear angle as a function of the crosshead displacement and the shear force as a function of the load as measured by the crosshead, respectively. The crosshead displacement was multiplied by 4.5 to calculate the actual displacement of the top in compensation for the speed multiplier on the shear fixture, as discussed in the Methodology section. Three samples of each size, as well as a 125-mm sample with cross arms removed, were tested in shear at a processing temperature of 120°C. Figure 12 shows how the measured load decreased with the decreasing gage area of the samples. Each line in this figure is the average for three tests, and the error bars denote one standard deviation. The error bars for the sample configuration with the cross-arm fibers removed are wider than for the other three configurations. Based on the challenges with mounting the free fibers into the frame and consequently the high probability for fiber misalignment, a spread in the data was expected for the sample configuration with the cross-arm fibers removed.
Two normalization methods were used for the full-arm samples: (1) Equation 3, which assumes only the gage area contributes, and (2) Equation 4, which assumes the arms contribute equally to that of the gage area. Figure 13a shows that normalizing with the gage area reverses the order of the results for the full-arm samples as they are shown in Figure 12, i.e., the smallest gage area having the highest normalized force. However, when the results are normalized using the full sample area, the curves come together in Figure 13b, with the samples of varying sizes converging to a single curve. That single curve is the same as the “infinite” slits configuration as concluded by Dangora et al. [30]. The convergence to a single curve in Figure 13b implies (1) that for this material system, the cross fibers and matrix in the arms do not need to be removed to find the effective stress-strain curve, and (2) the size of the “central” area of the cruciform is flexible.
3.3. Constant Shear-Rate
Three samples of Dyneema HB210 with a 125-mm gage side length (same configuration as shown in Figure 6a were tested for different combinations of rate and temperature. The test rates included two constant shear-strain rates of 0.05 and 0.10 rad/sec, corresponding to approximately 3° and 6° of shear per second, and one constant crosshead rate of 2 mm/sec. The preferred constant strain rate of 0.14 rad/sec for the peak rate reported in the analysis could not be achieved due to machine speed limitations. However, that peak rate was only reached by a small portion of the material during a short span of time during the preform process. Testing temperatures included room temperature, 80 °C, and 120 °C. These rates and temperatures were used to examine the strain-rate dependence as a function of processing temperature.
The test results are shared in Figure 14, with Figure 14b including standard deviation error bars for comparison. For this range of test temperatures and shear rates, Dyneema HB210 did show a significant variation as a function of temperature. Rate dependence is present at room temperature. At the elevated temperatures of 80 °C and 120 °C, which lie in the range of processing temperatures for this material system, there was essentially no change in the stress-strain response as a function of loading rate. Based on these results, it was concluded that shear rate dependence is not critical in the thermoforming simulation for this material system. This result is a key for thermoforming models as it ensures the process can be simulated without the need for rate-dependent material models or the amount of testing required to characterize fully the rate-dependent response of this class of material.
3.4. Finite Element Modeling Results
The shear frame experiments were modeled using the discrete mesoscopic modeling approach developed by the Sherwood Group [21] with a user-defined material model (UMAT) in LS-DYNA®. An initial analysis was performed using a built-in fabric material model, MAT 214, with a trilinear fit to the test data for calculating the shear stiffness as a function of the state of shear to estimate the range of shear rates to be explored. However, the UMAT option in LS-DYNA® offers the ability to explore shell options that are not compatible with the built-in trilinear material. In the discrete mesoscopic modeling approach, beam elements represent the axial behavior of the fibers and the in-plane orientation of the material, while shell elements carry the shear load. Figure 15 shows the models for the full-arm and cross-arm material removed specimens. The shear curve from the data that was normalized by the full area was used for the shear behavior of the shell elements. Strain-rate dependence was not considered because the experimental results did not exhibit strain-rate dependence within the rate and temperature ranges being modeled. The tensile modulus found during previous testing was used [48].
Four configurations (three different full-arm sample sizes and one cross-arm material removed) were modeled using the data from the full-arm 125-mm specimen shown in Table 2. Figure 16 shows good agreement in all four cases up to 90 mm of crosshead displacement, which corresponds to approximately 43° of shear strain. The results confirm that full-arm tests could be used to characterize this class of unidirectional cross-ply laminates.
4. Discussion
The present study investigated shear characterization of UHMWPE cross-ply laminates using the picture-frame test, with an emphasis on specimen configuration, normalization methodology, and shear-rate effects. The findings demonstrate that normalization by the full cruciform area yields consistent shear stiffness curves across sample sizes, indicating that the arm regions contribute comparably to the central gage region. This contrasts with prior research on woven composites, where removal of cross-arm yarns was often required to obtain reliable shear data [7,8,25,30]. In unidirectional cross-plies, however, the continuous fiber and matrix architecture constrains the arms to deform in shear, eliminating the need for the more complex preparation methods previously employed [30].
The increased scatter observed in the arm-removed specimens highlights the practical challenges of specimen modification, including misalignment and difficulty in mounting free fibers. These results are consistent with the observations of Krogh et al. [25], who noted reduced repeatability when woven samples required yarn removal. Thus, for UHMWPE cross-ply systems, full-arm testing provides a more robust and repeatable methodology while simplifying specimen preparation.
The implementation of a constant shear-rate test protocol allowed for explicit evaluation of rate effects across processing temperatures. While rate dependence was evident at room temperature, no significant dependence was found at 80 °C or 120 °C. These results align with prior investigations of thermoplastic prepregs where elevated temperature reduced rate sensitivity [31,32,33]. Importantly, this suggests that rate-dependent constitutive models are unnecessary for thermoforming simulations of UHMWPE laminates within their processing window, thereby simplifying model calibration and reducing experimental demands.
Finite element simulations confirmed that full-arm shear-frame data could be used to represent different specimen sizes and configurations, with good agreement observed up to approximately 43° of shear strain. This validates the use of discrete mesoscopic modeling approaches [21] for cross-ply UHMWPE laminates and supports the generalizability of the proposed experimental methodology.
Overall, this work provides a practical framework for shear characterization of UHMWPE cross-ply composites that reduces specimen preparation complexity, ensures repeatability, and establishes that shear-rate effects can be neglected at processing temperatures. These contributions streamline the integration of experimental data into forming simulations and address a critical need for efficient, material-specific characterization in composite manufacturing research.
5. Conclusions
In this research, investigations into sample configuration were performed to expand the understanding of how shear frame testing can be used to characterize the shear response of fiber-reinforced UHMWPE material systems. Shear force curves from three different cruciform sample sizes normalized with the full specimen area, as well as samples with the cross-arm area removed, converged to a single curve. This convergence implies that the arm area contributes to the force on the sample the same as the gage area and need not and should not be ignored in normalization efforts. Likewise, there was large variation in the test results from the samples with cross-arm material removed, highlighting the challenge in preparing and mounting those samples consistently to produce repeatable results and demonstrating the desire for an alternative experimental methodology. The experimental methodology and accompanying data analysis presented above fulfill this need for the UHMWPE cross-ply class of materials.
Though strain-rate dependence was demonstrated for ambient temperature testing, rate dependence was not evident at a processing temperature of 120°C. Therefore, rate dependence was not a requirement for the shear stiffness input in a finite element forming simulation. This rate independence is critical for process modeling because it eliminates the need for a rate-dependent material model and the time required to characterize a rate-dependent material response fully. The converged data curve was used as an input into an LS-DYNA finite element model to simulate the shear frame tests for all sample configurations. The simulation results agreed well with experimental results for the full-arm samples as well as for sample configuration with the arm material removed. This work establishes an experimental procedure and data analysis methodology for characterizing the shear response of cross-ply UHMWPE composites, which can be used as input into thermoforming models.
Author Contributions
“Conceptualization, K.W. and J.S.; methodology, K.W. and J.S.; software, K.W. and J.S.; validation, K.W. and J.S.; formal analysis, K.W. and J.S.; investigation, K.W. and J.S.; data curation, K.W.; writing—original draft preparation, K.W.; writing—review and editing, K.W. and J.S.; funding acquisition, J.S. All authors have read and agreed to the published version of the manuscript.”
Funding
This research was funded by the US Army Research Laboratory under Cooperative Agreement Number W911NF-18-2-0033. The views and conclusions contained in this document are those of the authors and should not be interpreted as representing the official policies, either expressed or implied, of the Army Research Laboratory or the U.S. Government.
Data Availability Statement
Test data are available upon sending a request to the corresponding author.
Acknowledgments
The authors acknowledge the great technical discussions with Drs. Travis Boghetti and Michael Yeager of the Army Research Lab. The authors express thanks to DSM for providing Dyneema HB210 material for this research and to the ANSYS academic program for the use of LS-DYNA.
Conflicts of Interest
The authors declare no conflicts of interest
References
- Dangora, L.M.; Mitchell, C.J.; Sherwood, J.A.; Parker, J.C. Deep-drawing forming trials on a cross-ply thermoplastic lamina for helmet preform manufacture. Journal of Manufacturing Science and Engineering 2017, 139, 031009. [Google Scholar] [CrossRef]
- Prodromou, A.G.; Chen, J. Relationship between shear angle and wrinkling of textile composite preforms. Composites Part A: Applied Science and Manufacturing 1997, 28A, 491–503. [Google Scholar] [CrossRef]
- McGuinness, G.B.; Brád aigh, C.M.O. Characterisation of thermoplastic composite melts in rhombus-shear. Composites Part A: Applied Science and Manufacturing 1998, 29, 509–518. [Google Scholar] [CrossRef]
- Potter, K. Bias extension measurements on cross-plied unidirectional prepreg. Composites Part A: Applied Science and Manufacturing 2002, 33, 627–634. [Google Scholar] [CrossRef]
- Lebrun, G.; Bureau, M.N.; Denault, J. Evaluation of bias-extension and picture-frame test methods for the measurement of intraply shear properties of PP/glass commingled fabrics. Composite Structures 2003, 61, 341–352. [Google Scholar] [CrossRef]
- Sharma, S.B.; Sutcliffe, M.P.F. A simplified finite element model for draping of woven material. Composites Part A: Applied Science and Manufacturing 2004, 35, 637–643. [Google Scholar] [CrossRef]
- Peng, X.Q.; Cao, J.; Chen, J.; Xue, P.; Lussier, D.S.; Liu, L. Experimental and numerical analysis on normalization of picture frame tests for composite materials. Composites Science and Technology 2004, 64, 11–21. [Google Scholar] [CrossRef]
- Cao, J.; Akkerman, R.; Boisse, P.; Chen, J.; Cheng, H.S.; de Graaf, E.F.; et al. Characterization of mechanical behavior of woven fabrics: experimental methods and benchmark results. Composites Part A: Applied Science and Manufacturing 2008, 39, 1037–1053. [Google Scholar] [CrossRef]
- Shear of woven fabrics: theoretical model, numerical experiments and full field strain measurements. In: Proc. ESAFORM-2004, 7th International Conference on Material Forming; 2004. (No DOI found). Lomov, S.V.; Stoilova, T.; Verpoest, I. (Eds.).
- Harrison, P.; Clifford, M.J.; Long, A.C. Shear characterisation of viscous woven textile composites: a comparison between picture frame and bias extension experiments. Composites Science and Technology 2004, 64, 1453–1465. [Google Scholar] [CrossRef]
- Potluri, P.; Ciurezu, D.P.; Ramgulam, R. Measurement of meso-scale shear deformations for modelling textile composites. Composites Part A: Applied Science and Manufacturing 2006, 37, 303–314. [Google Scholar] [CrossRef]
- Kawabata, S.; Niwa, M.; Kawai, H. The finite-deformation theory of plain-weave fabrics part I: the biaxial-deformation theory. Journal of the Textile Institute 1973, 64, 21–46. [Google Scholar] [CrossRef]
- Kawabata, S.; Niwa, M.; Kawai, H. The finite-deformation theory of plain-weave fabrics part III: the shear deformation theory. Journal of the Textile Institute 1973, 64, 62–85. [Google Scholar] [CrossRef]
- Long, A.; Rudd, C.; Blagdon, M.; Smith, P. Characterizing the processing and performance of aligned reinforcements during preform manufacture. Composites Part A: Applied Science and Manufacturing 1996, 27, 247–253. [Google Scholar] [CrossRef]
- Wang, J.; Page, J.; Paton, R. Experimental investigation of the draping properties of reinforcement fabrics. Composites Science and Technology 1998, 58, 229–237. [Google Scholar] [CrossRef]
- Nguyen, M.; Herszberg, I.; Paton, R. The shear properties of woven carbon fabric. Composite Structures 1999, 47, 767–779. [Google Scholar] [CrossRef]
- McGuinness, G.B.; O’Brien, M. O’B. Development of rheological models for forming flows and picture-frame shear testing of fabric reinforced thermoplastic sheets. Journal of Non-Newtonian Fluid Mechanics 1997, 72, 1–16. [Google Scholar] [CrossRef]
- Harrison, P.; Wiggers, J.; Long, A. Normalization of shear test data for rate-independent compressible fabrics. Journal of Composite Materials 2008, 42, 2315–2344. [Google Scholar] [CrossRef]
- Boisse, P.; Akkerman, R.; Carlone, P.; Kärger, L.; Lomov, S.V.; Sherwood, J.A. Advances in composite forming through 25 years of ESAFORM. International Journal of Material Forming 2022, 15, 39. [Google Scholar] [CrossRef]
- Boisse, P.; Gomes, R.; Curado-Correia, N. Press forming a 0/90 cross-ply advanced thermoplastic composite using the double-dome benchmark geometry. Composites Part A: Applied Science and Manufacturing 2013, 54, 56–69. [Google Scholar] [CrossRef]
- Boisse, P.; Hamila, N.; Guzman-Maldonado, E.; Madeo, A.; Hivet, G.; dell’Isola, F. The bias-extension test for the analysis of in-plane shear properties of textile composite reinforcements and prepregs: a review. International Journal of Material Forming 2017, 4, 473–499. [Google Scholar] [CrossRef]
- Milani, A.; Nemes, J.; Lebrun, G.; Bureau, M. A comparative analysis of a modified picture-frame test for characterization of woven fabrics. Polymer Composites 2010, 31, 561–568. [Google Scholar] [CrossRef]
- Willems, A.; Lomov, S.V.; Verpoest, I.; Vandepitte, D. Picture frame shear tests on woven textile composite reinforcements with controlled pretension. AIP Conference Proceedings 2007. [CrossRef]
- Launay, J.; Hivet, G.; Duong, A.V.; Boisse, P. Experimental analysis of the influence of tensions on in-plane shear behaviour of woven composite reinforcements. Composites Science and Technology 2008, 68, 506–515. [Google Scholar] [CrossRef]
- Krogh, C.; White, K.D.; Sabato, A.; Sherwood, J.A. Picture-frame testing of woven prepreg fabric: an investigation of sample geometry and shear angle acquisition. International Journal of Material Forming 2019, 1–13. [Google Scholar] [CrossRef]
- Liu, L.; Chen, J.; Gorczyca, J.L.; Sherwood, J.A. Modeling of friction and shear in thermostamping of composites—Part II. Journal of Composite Materials 2004, 38, 1931–1947. [Google Scholar] [CrossRef]
- Lussier, D.; Chen, J. Material characterization of woven fabrics for thermoforming of composites. Journal of Thermoplastic Composite Materials 2002, 15, 497–509. [Google Scholar] [CrossRef]
- Lomov, S.V.; Belov, E.; Bischoff, T.; Ghosh, S.B.; Chi, T.T.; Verpoest, I. Carbon composites based on multiaxial multiply stitched preforms. Part 1: geometry of the preform. Composites Part A: Applied Science and Manufacturing 2002, 33, 1171–1183. [Google Scholar] [CrossRef]
- Jauffrès, D.; Morris, C.D.; Sherwood, J.A.; Chen, J. Simulation of the thermostamping of woven composites: mesoscopic modeling using explicit finite element analysis. International Journal of Material Forming 2010, 3, S1205–S1216. [Google Scholar] [CrossRef]
- Dangora, L.M.; Hansen, C.J.; Mitchell, C.J.; Sherwood, J.A.; Parker, J.C. Challenges associated with shear characterization of a cross-ply thermoplastic lamina using picture frame tests. Composites Part A: Applied Science and Manufacturing 2015, 78, 181–190. [Google Scholar] [CrossRef]
- Chen, Q.; Boisse, P.; Park, C.H.; Saouab, A.; Bréard, J. Intra/inter-ply shear behaviors of continuous fiber reinforced thermoplastic composites in thermoforming processes. Composite Structures 2011, 93, 1692–1703. [Google Scholar] [CrossRef]
- Guzman-Maldonado, E.; Hamila, N.; Naouar, N.; Moulin, G.; Boisse, P. Simulation of thermoplastic prepreg thermoforming based on a visco-hyperelastic model and a thermal homogenization. Materials & Design 2016, 93, 431–442. [Google Scholar] [CrossRef]
- Hsiao, S.-W.; Kikuchi, N. Numerical analysis and optimal design of composite thermoforming process. Computer Methods in Applied Mechanics and Engineering 1999, 177, 1–34. [Google Scholar] [CrossRef]
- Lee, J.S.; Hong, S.J.; Yu, W.-R.; Kang, T.J. The effect of blank holder force on the stamp forming behavior of non-crimp fabric with a chain stitch. Composites Science and Technology 2007, 67, 357–366. [Google Scholar] [CrossRef]
- Lin, H.; Wang, J.; Long, A.; Clifford, M.; Harrison, P. Predictive modelling for optimization of textile composite forming. Composites Science and Technology 2007, 67, 3242–3252. [Google Scholar] [CrossRef]
- Boubaker, B.B.; Haussy, B.; Ganghoffer, J. Discrete models of woven structures: macroscopic approach. Composites Part B: Engineering 2007, 38, 498–505. [Google Scholar] [CrossRef]
- Pickett, A.K.; Creech, G.; de Luca, P. Simplified and advanced simulation methods for prediction of fabric draping. Revue Européenne des Eléments 2005, 14, 677–691. [Google Scholar] [CrossRef]
- Skordos, A.A.; Aceves, C.M.; Sutcliffe, M.P. A simplified rate dependent model of forming and wrinkling of pre-impregnated woven composites. Composites Part A: Applied Science and Manufacturing 2007, 38, 1318–1330. [Google Scholar] [CrossRef]
- Cherouat, A.; Billoët, J.L. Mechanical and numerical modelling of composite manufacturing processes: deep-drawing and laying-up of thin pre-impregnated woven fabrics. Journal of Materials Processing Technology 2001, 118, 460–471. [Google Scholar] [CrossRef]
- Dangora, L.M.; Mitchell, C.; White, K.D.; Sherwood, J.A.; Parker, J.C. Characterization of temperature-dependent tensile and flexural rigidities of a cross-ply thermoplastic lamina with implementation into a forming model. International Journal of Material Forming 2018, 11, 43–52. [Google Scholar] [CrossRef]
- Dangora, L.M.; Mitchell, C.J.; Sherwood, J.A. Predictive model for the detection of out-of-plane defects formed during textile-composite manufacture. Composites Part A: Applied Science and Manufacturing 2015, 78, 102–112. [Google Scholar] [CrossRef]
- Chen, J.; Niezrecki, C.; Sherwood, J.; Avitabile, P.; Rumsey, M.; Hughes, S.; et al. Effect of manufacturing-induced defects on reliability of composite wind turbine blades. University of Massachusetts Lowell Report 2012. (No DOI).
- Morris, C.D.; Dangora, L.; Sherwood, J. Using LS-DYNA to simulate the thermoforming of woven-fabric reinforced composites. In: Proceedings of the 13th International LS-DYNA Users Conference; Dearborn, MI; 2014. p. 1–11. (No DOI).
- Morris, C.D.; Dangora, L.; Sherwood, J. Using LS-DYNA to simulate the forming of woven-fabric reinforced composites. In: Proceedings of the 19th International Conference on Composite Materials; Montreal, Quebec, Canada; 2013.
- Yeager, M.; Cline, J.; White, K.; Bogetti, T.; Sherwood, J. Characterization and modeling of the in-plane shear deformation in ultra-high molecular weight polyethylene (UHMWPE) composites. 2019.
- DSM Dyneema® Industries. Dyneema, 2018. Available online: http://www.dsm.com/products/dyneema/en_US/home.html.
- Cline, J.; Yeager, M.; Bogetti, T. Determination of in-plane shear properties of ultra-high molecular weight polyethylene composites for input into a thermoforming model. CCDC Army Research Laboratory, Aberdeen Proving Ground, USA; 2019.
- White, K.D.; Sherwood, J.A. Characterization and modeling of a highly-oriented thin film for composite forming. AIP Conference Proceedings 2018, 1960, 020038. [Google Scholar] [CrossRef]
Figure 1.
Two-step thermoforming process for multiple-layer laminate consolidations.
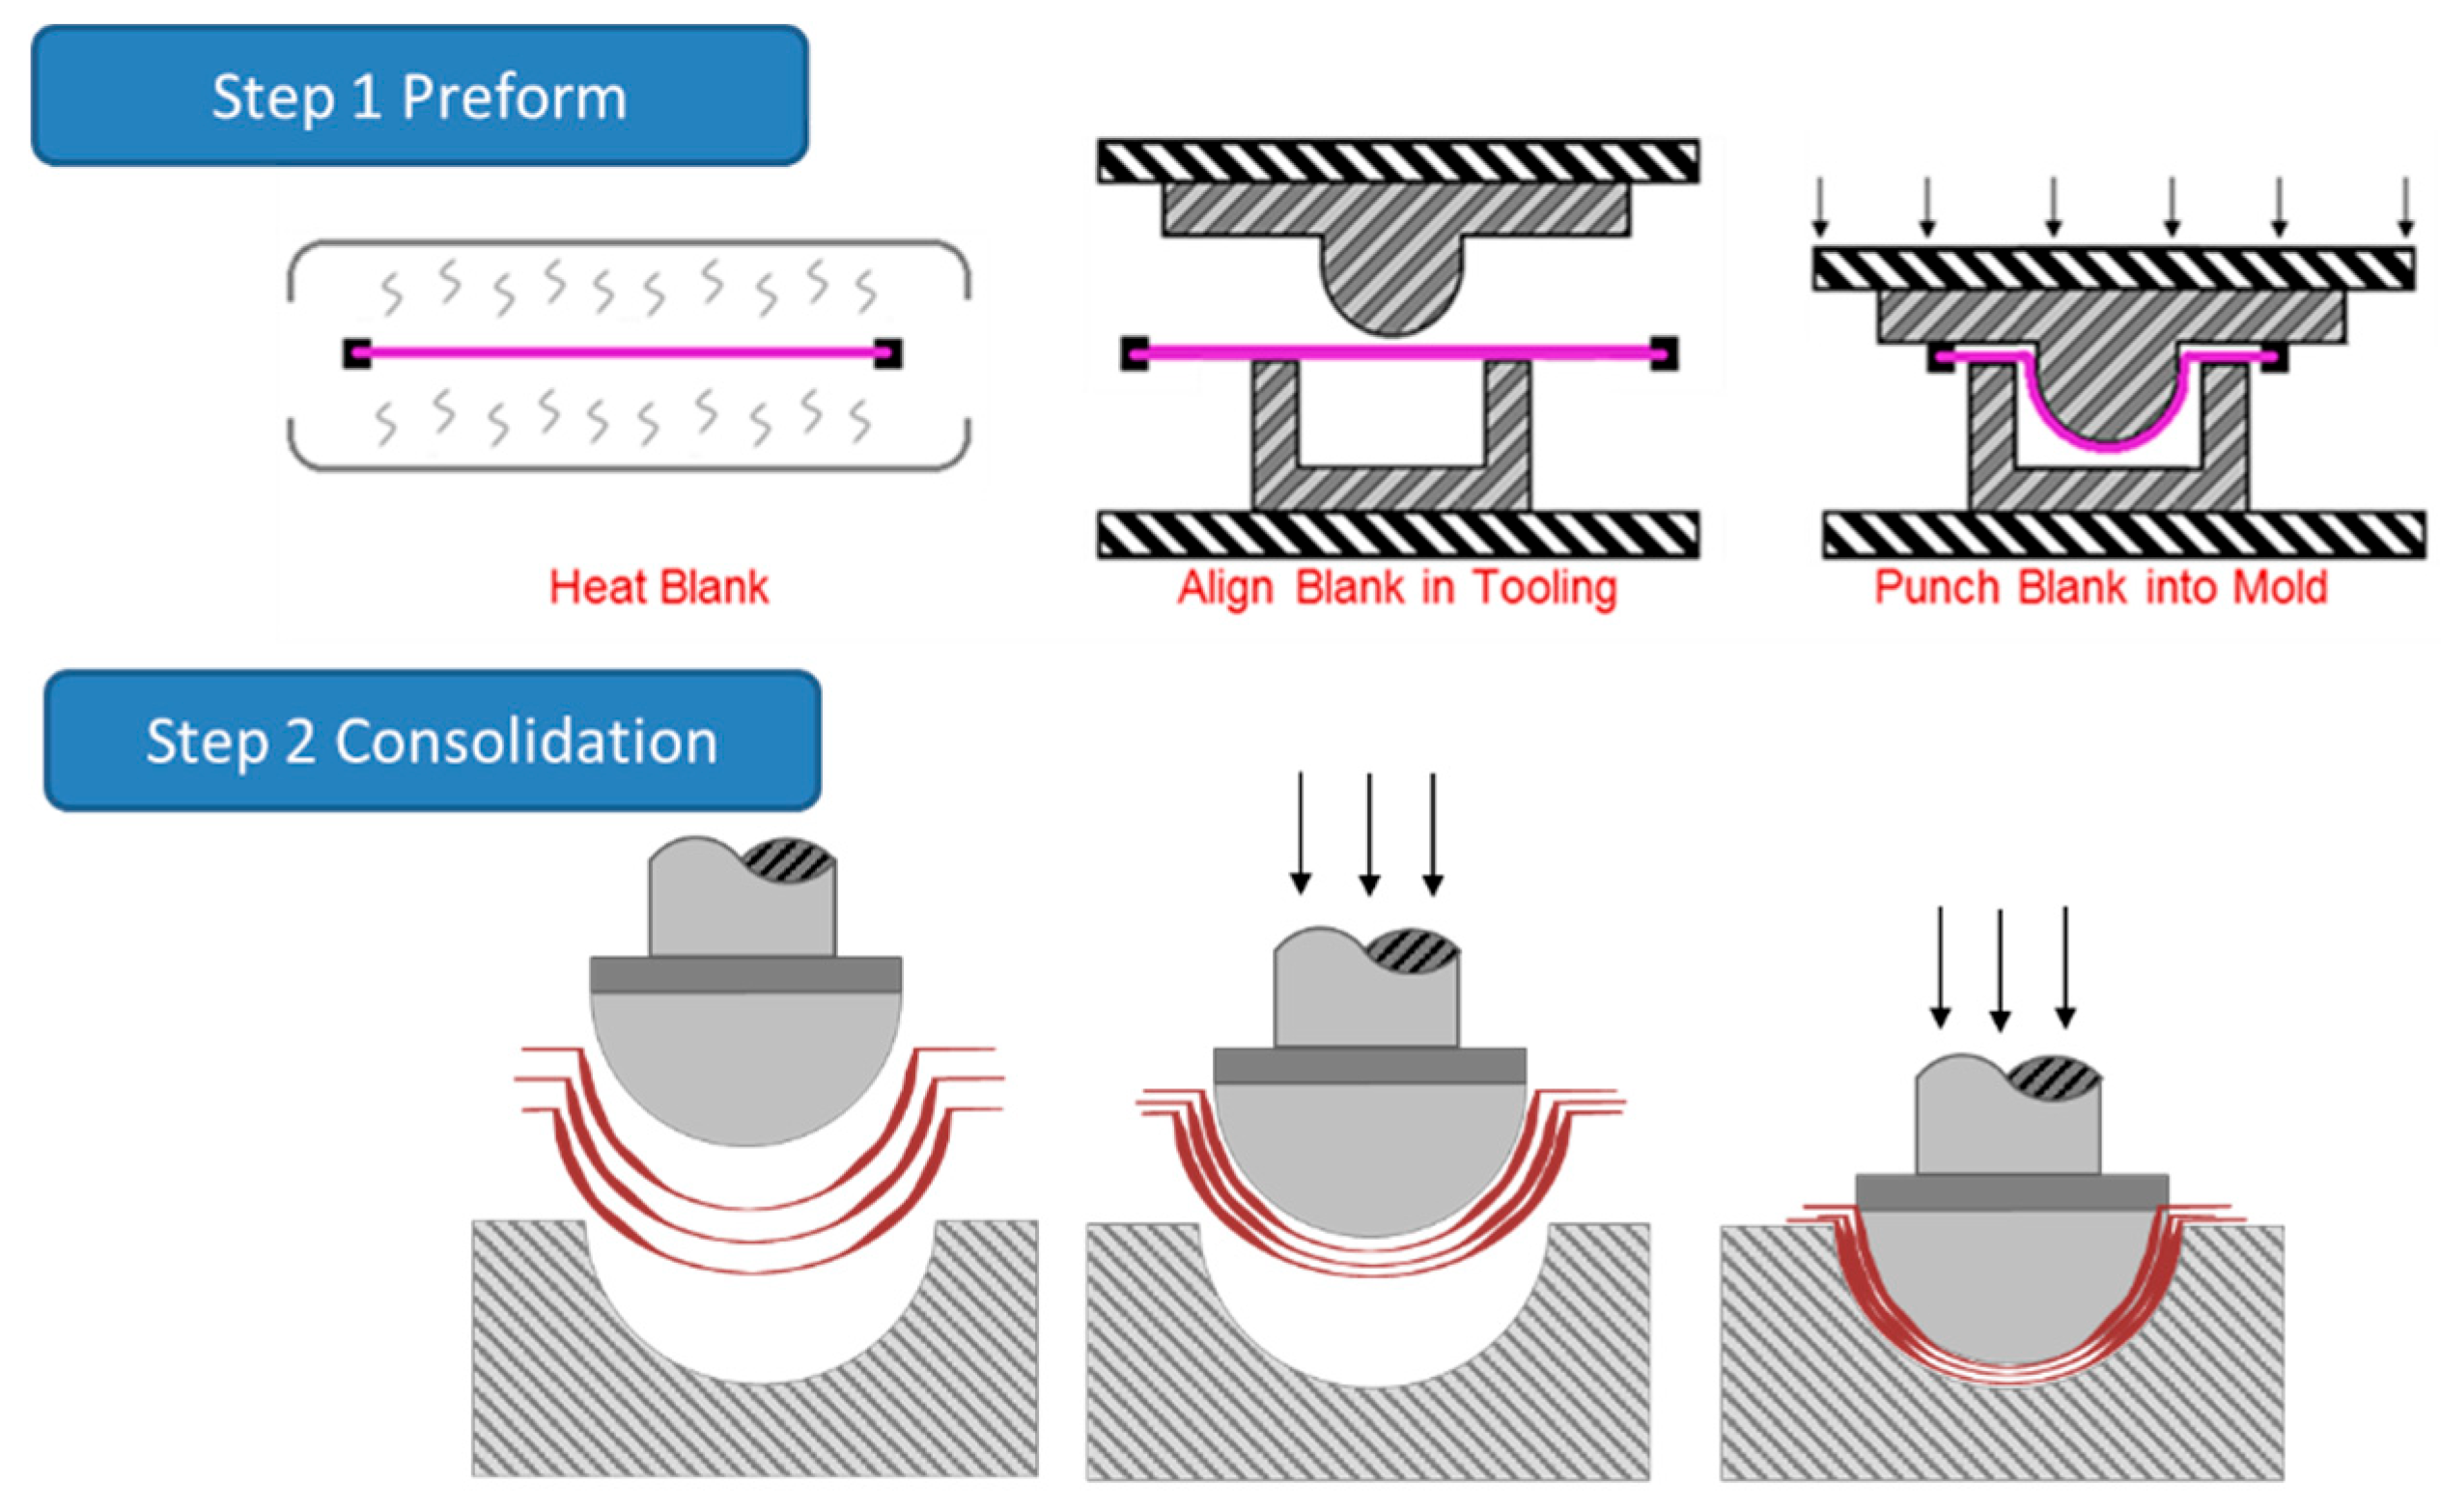
Figure 2.
Intra-ply shear of cross-ply composite during hemispherical forming.
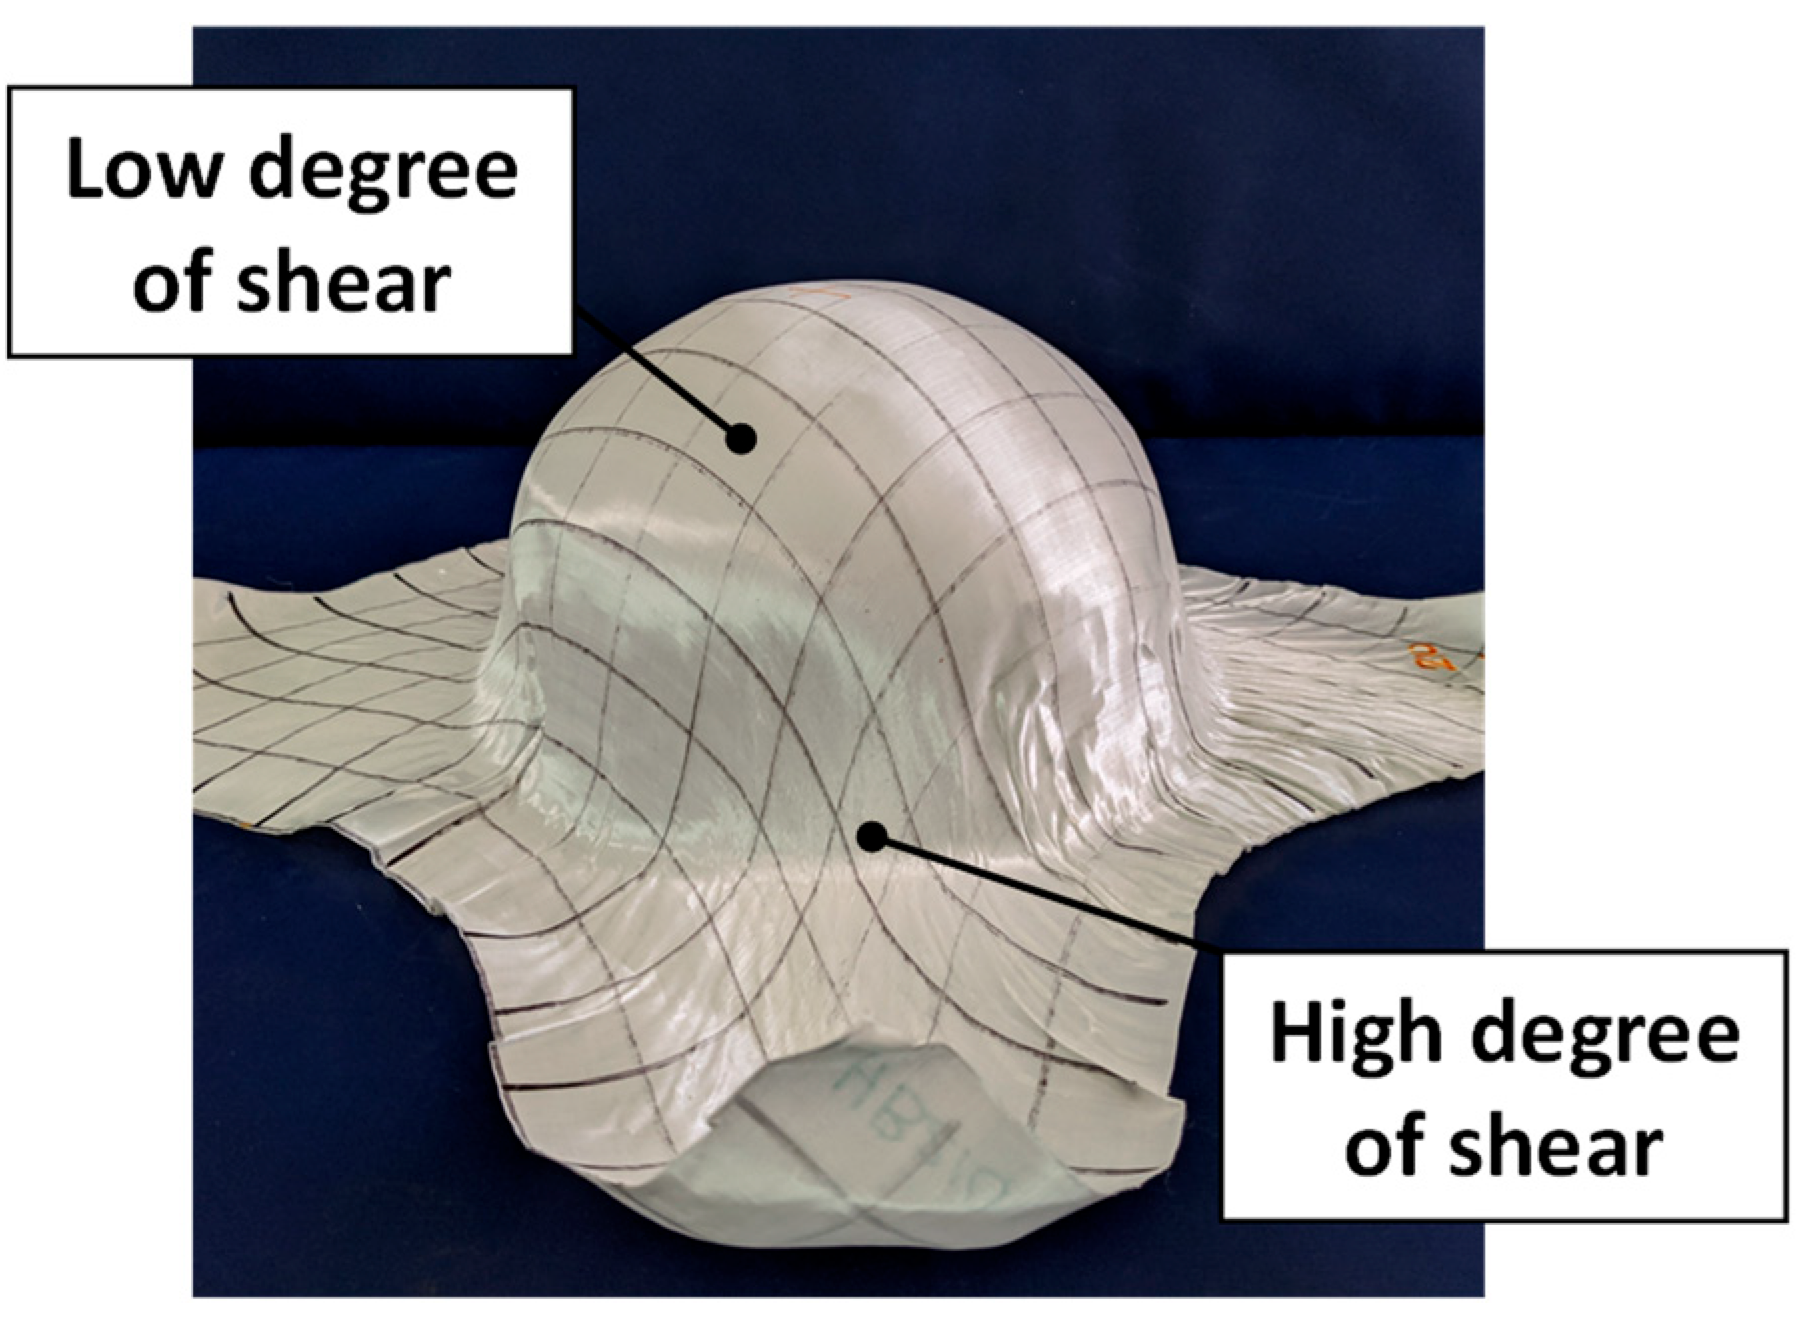
Figure 3.
UHMWPE sheet and tooling in the thermoforming model: (a) Exploded view of the model, (b) the initial state of the model, (c) the final formed part – top view with tooling shown, and (d) the final formed part – bottom view without the tooling.
Figure 3.
UHMWPE sheet and tooling in the thermoforming model: (a) Exploded view of the model, (b) the initial state of the model, (c) the final formed part – top view with tooling shown, and (d) the final formed part – bottom view without the tooling.
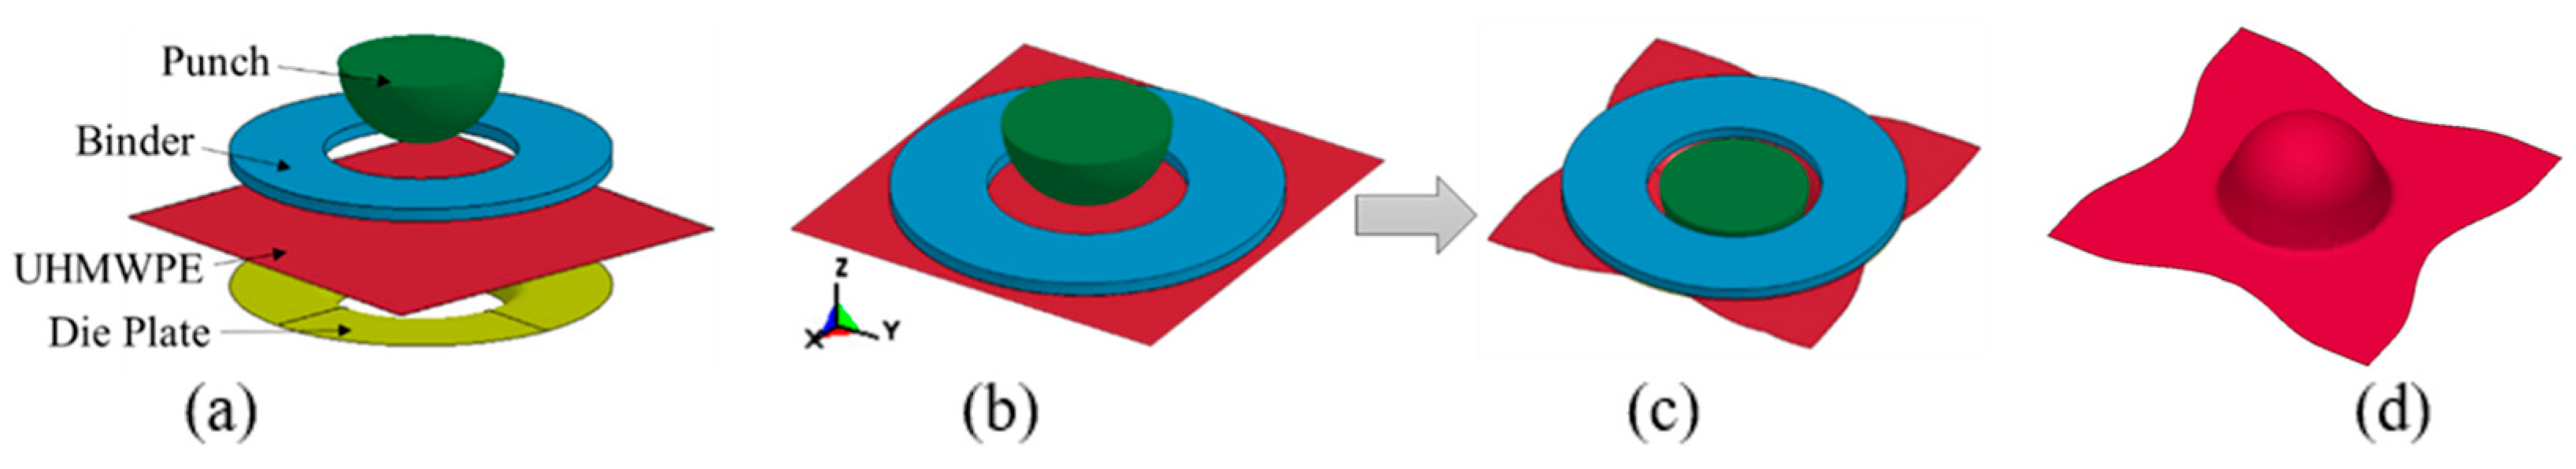
Figure 4.
Shear fixture with rate multiplier.
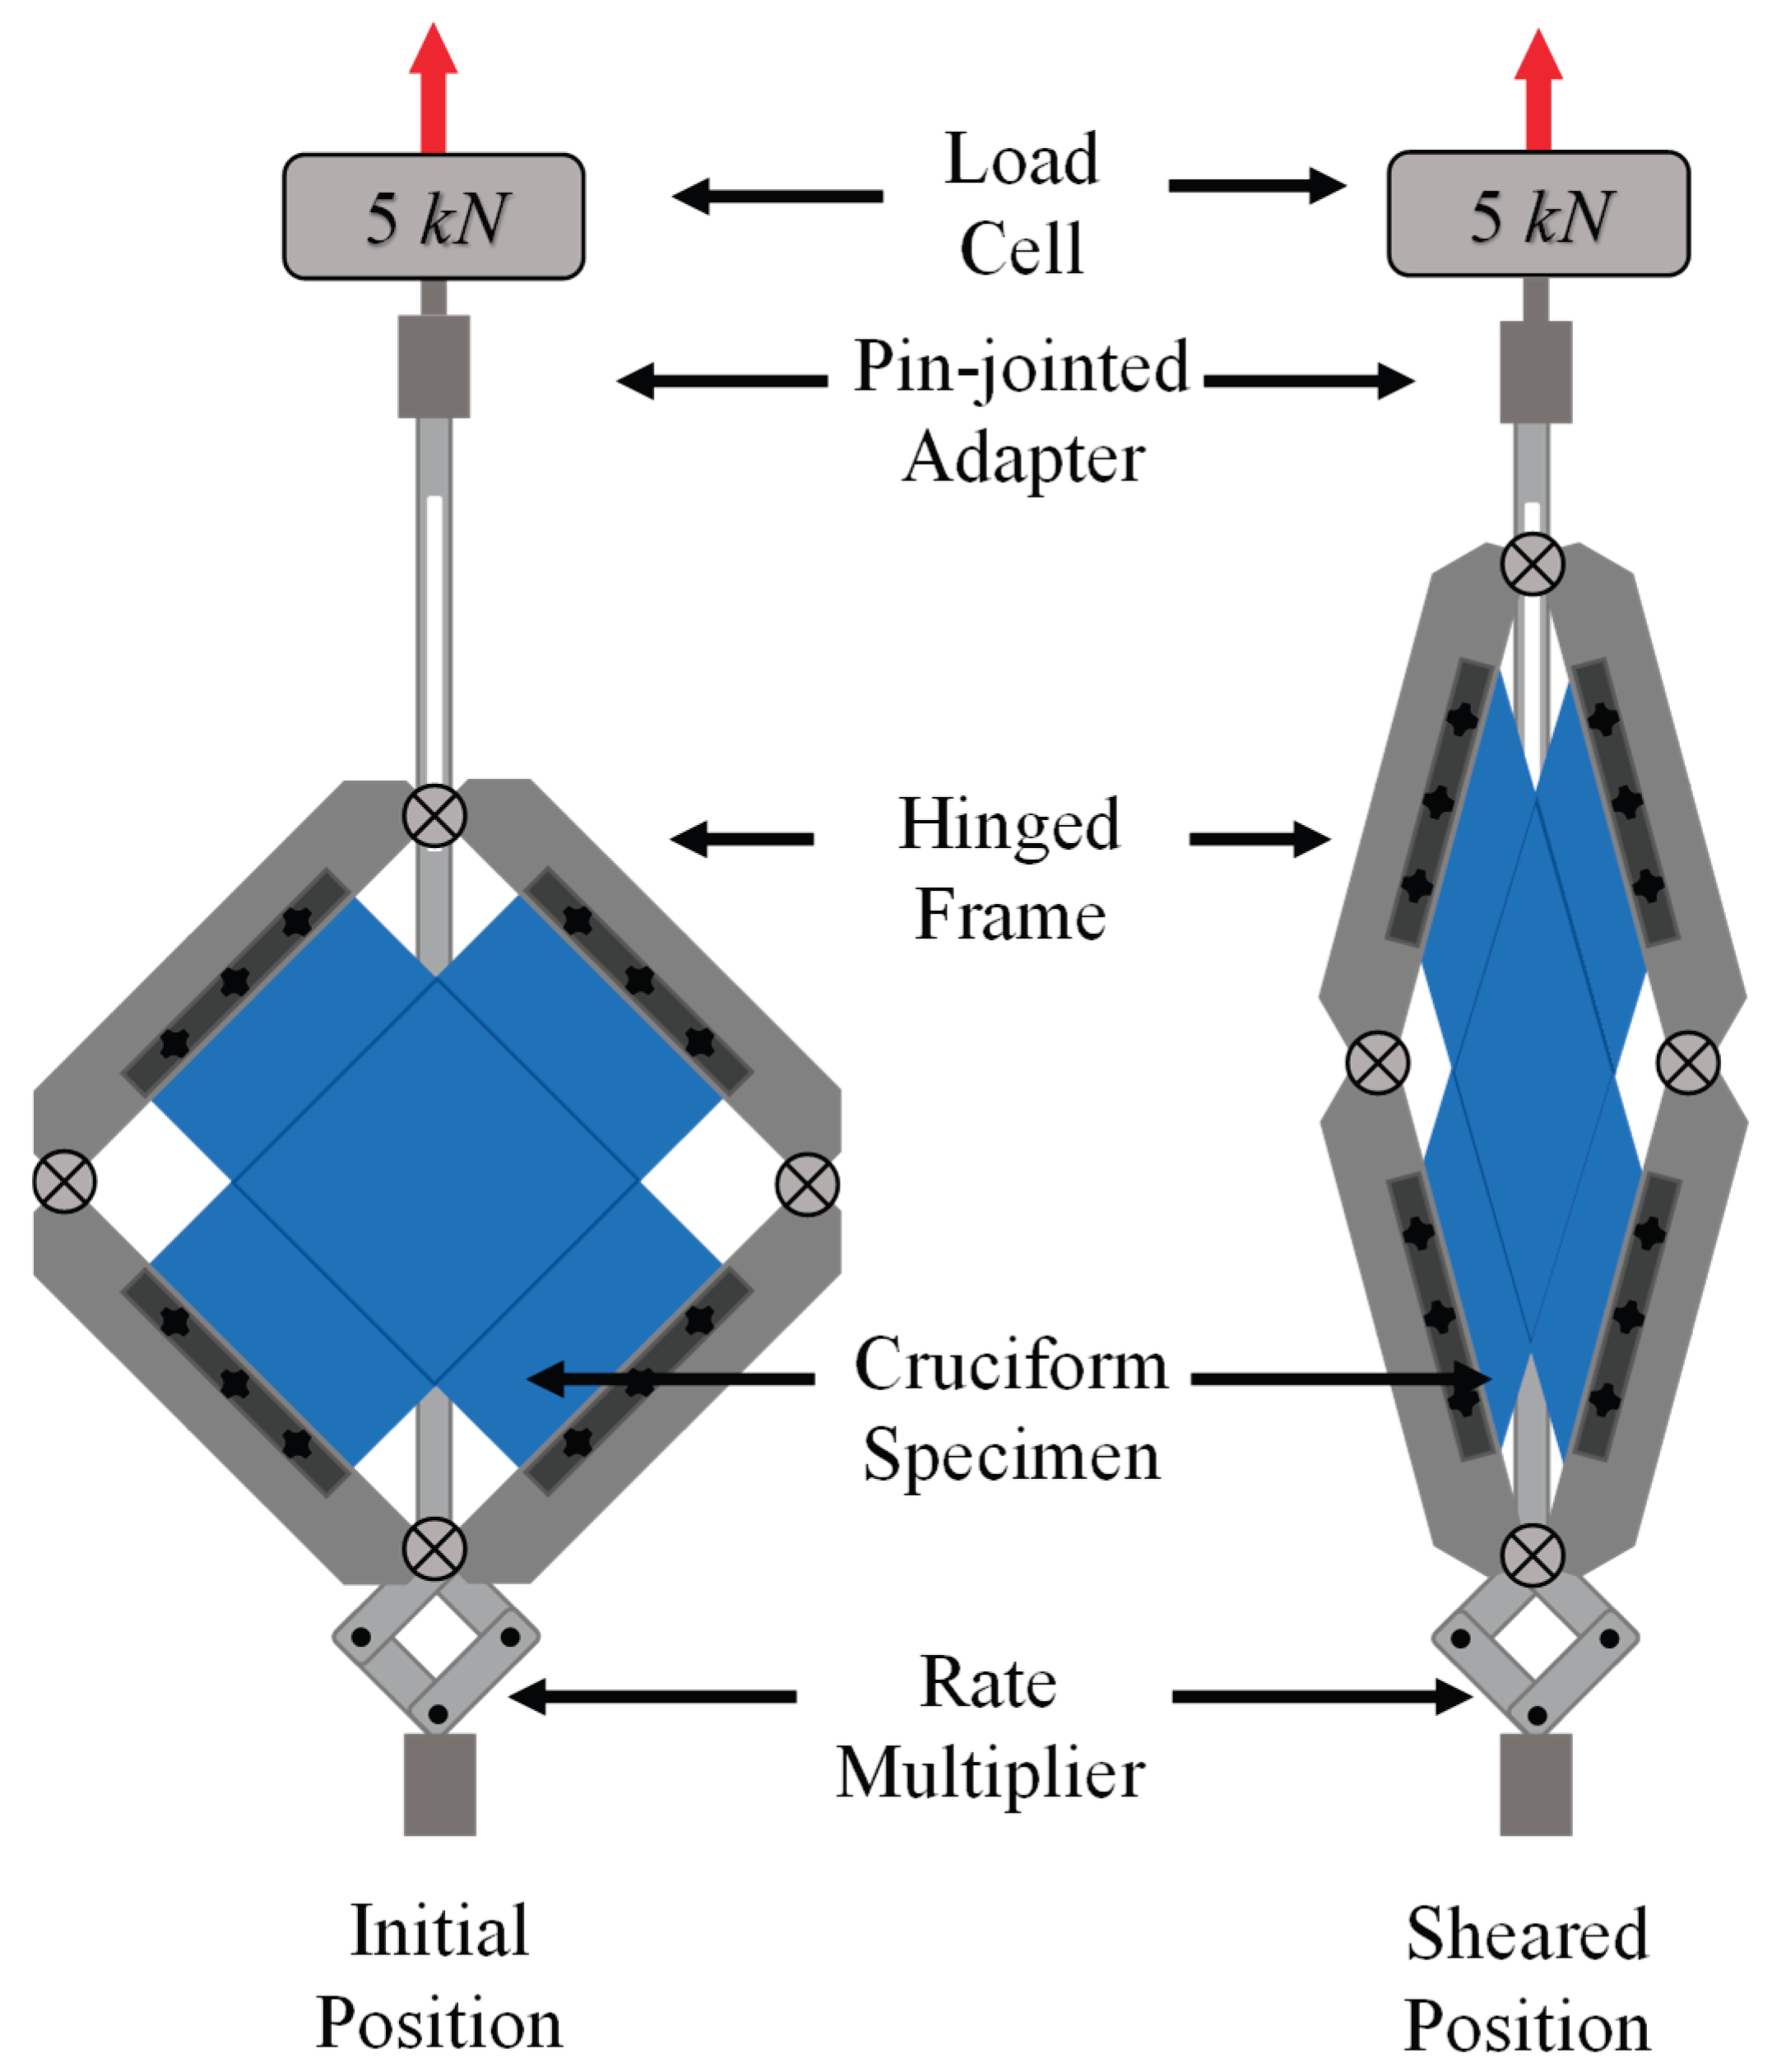
Figure 5.
Shear frame cruciform sample normalization area for (a) central gage area and (b) full area with equal arm contribution.
Figure 5.
Shear frame cruciform sample normalization area for (a) central gage area and (b) full area with equal arm contribution.
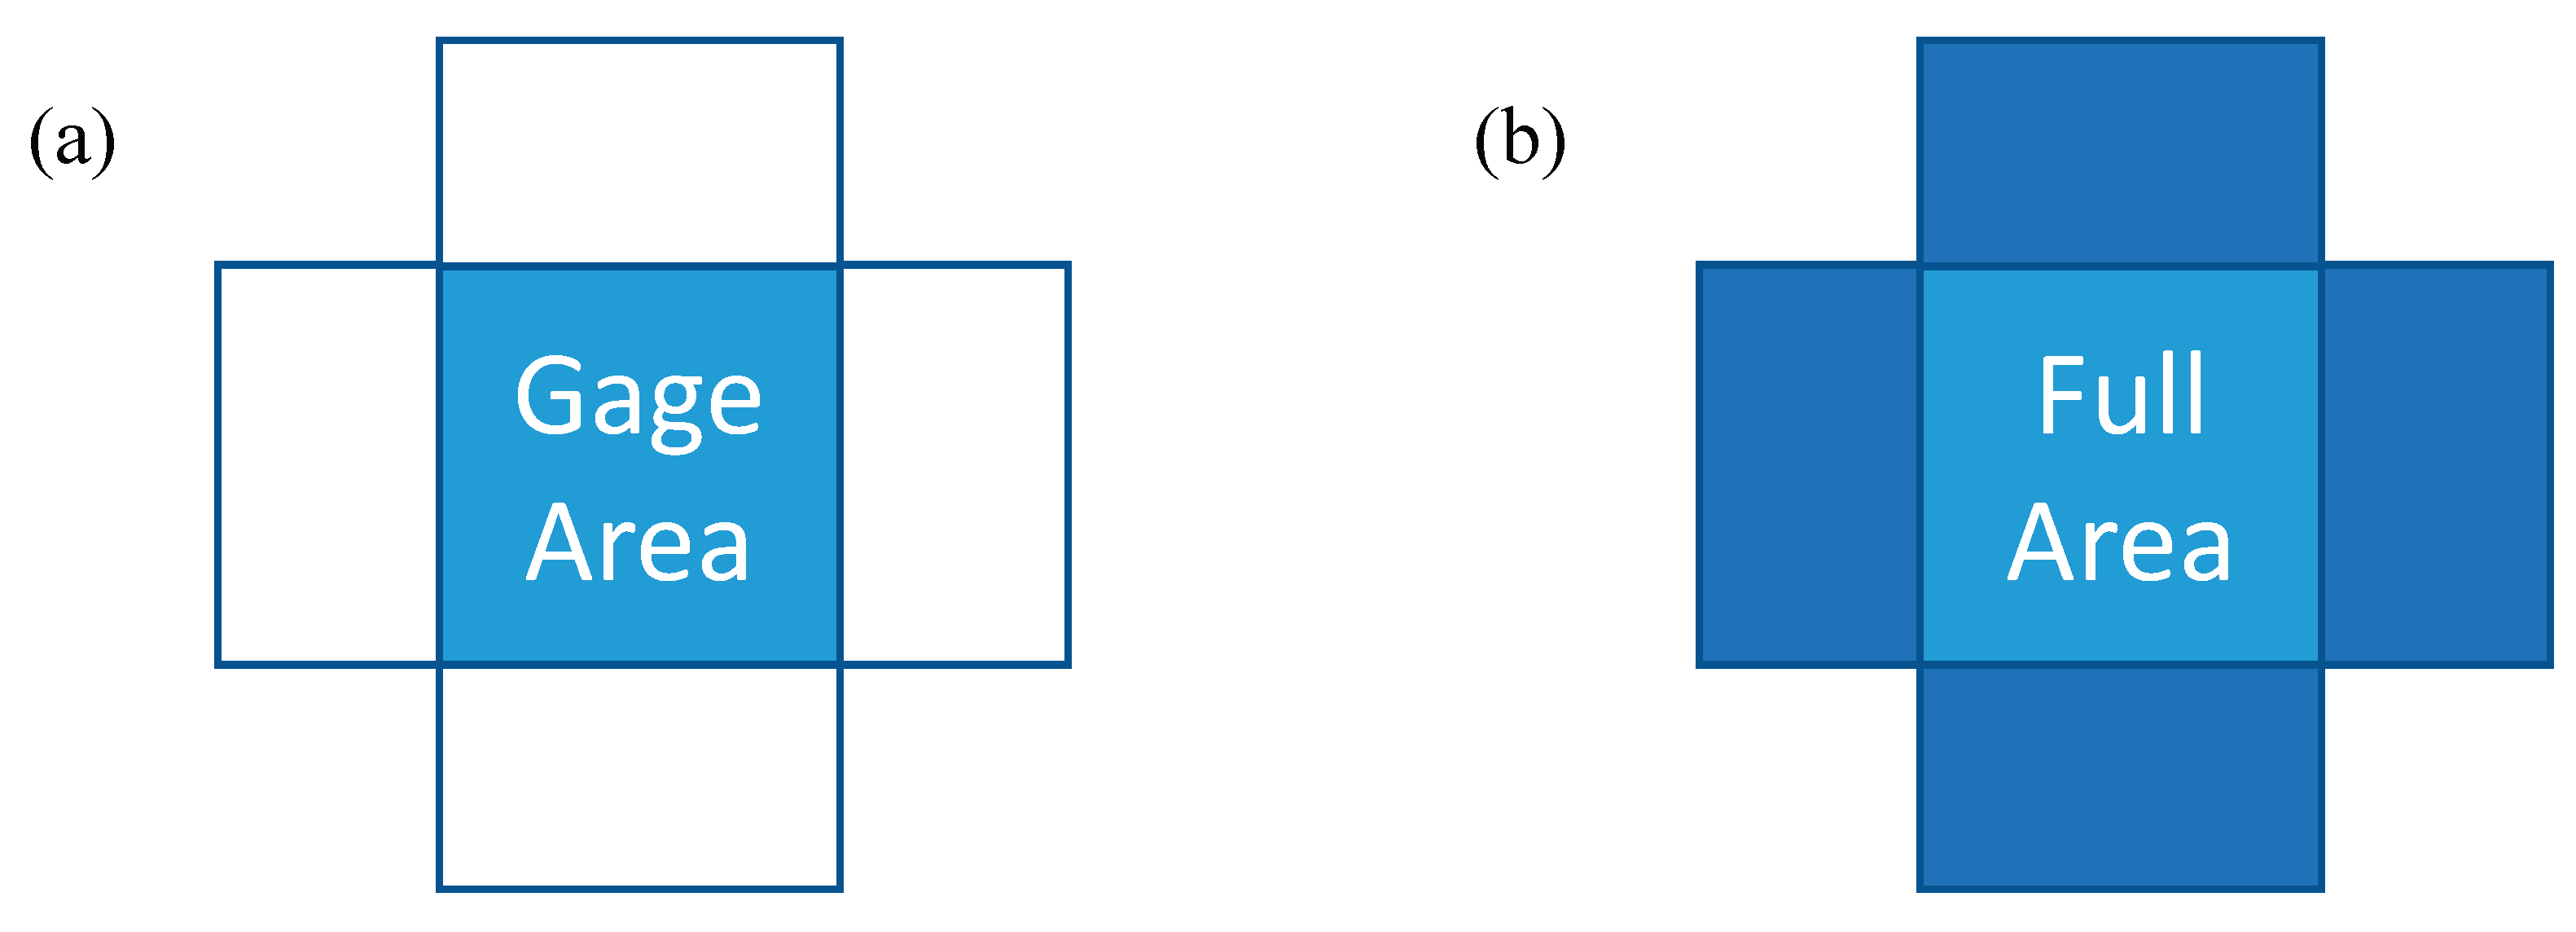
Figure 6.
Shear test samples (a) 125-mm, (b) 100-mm, and (c) 75-mm gage side length with 216-mm total sample width.
Figure 6.
Shear test samples (a) 125-mm, (b) 100-mm, and (c) 75-mm gage side length with 216-mm total sample width.
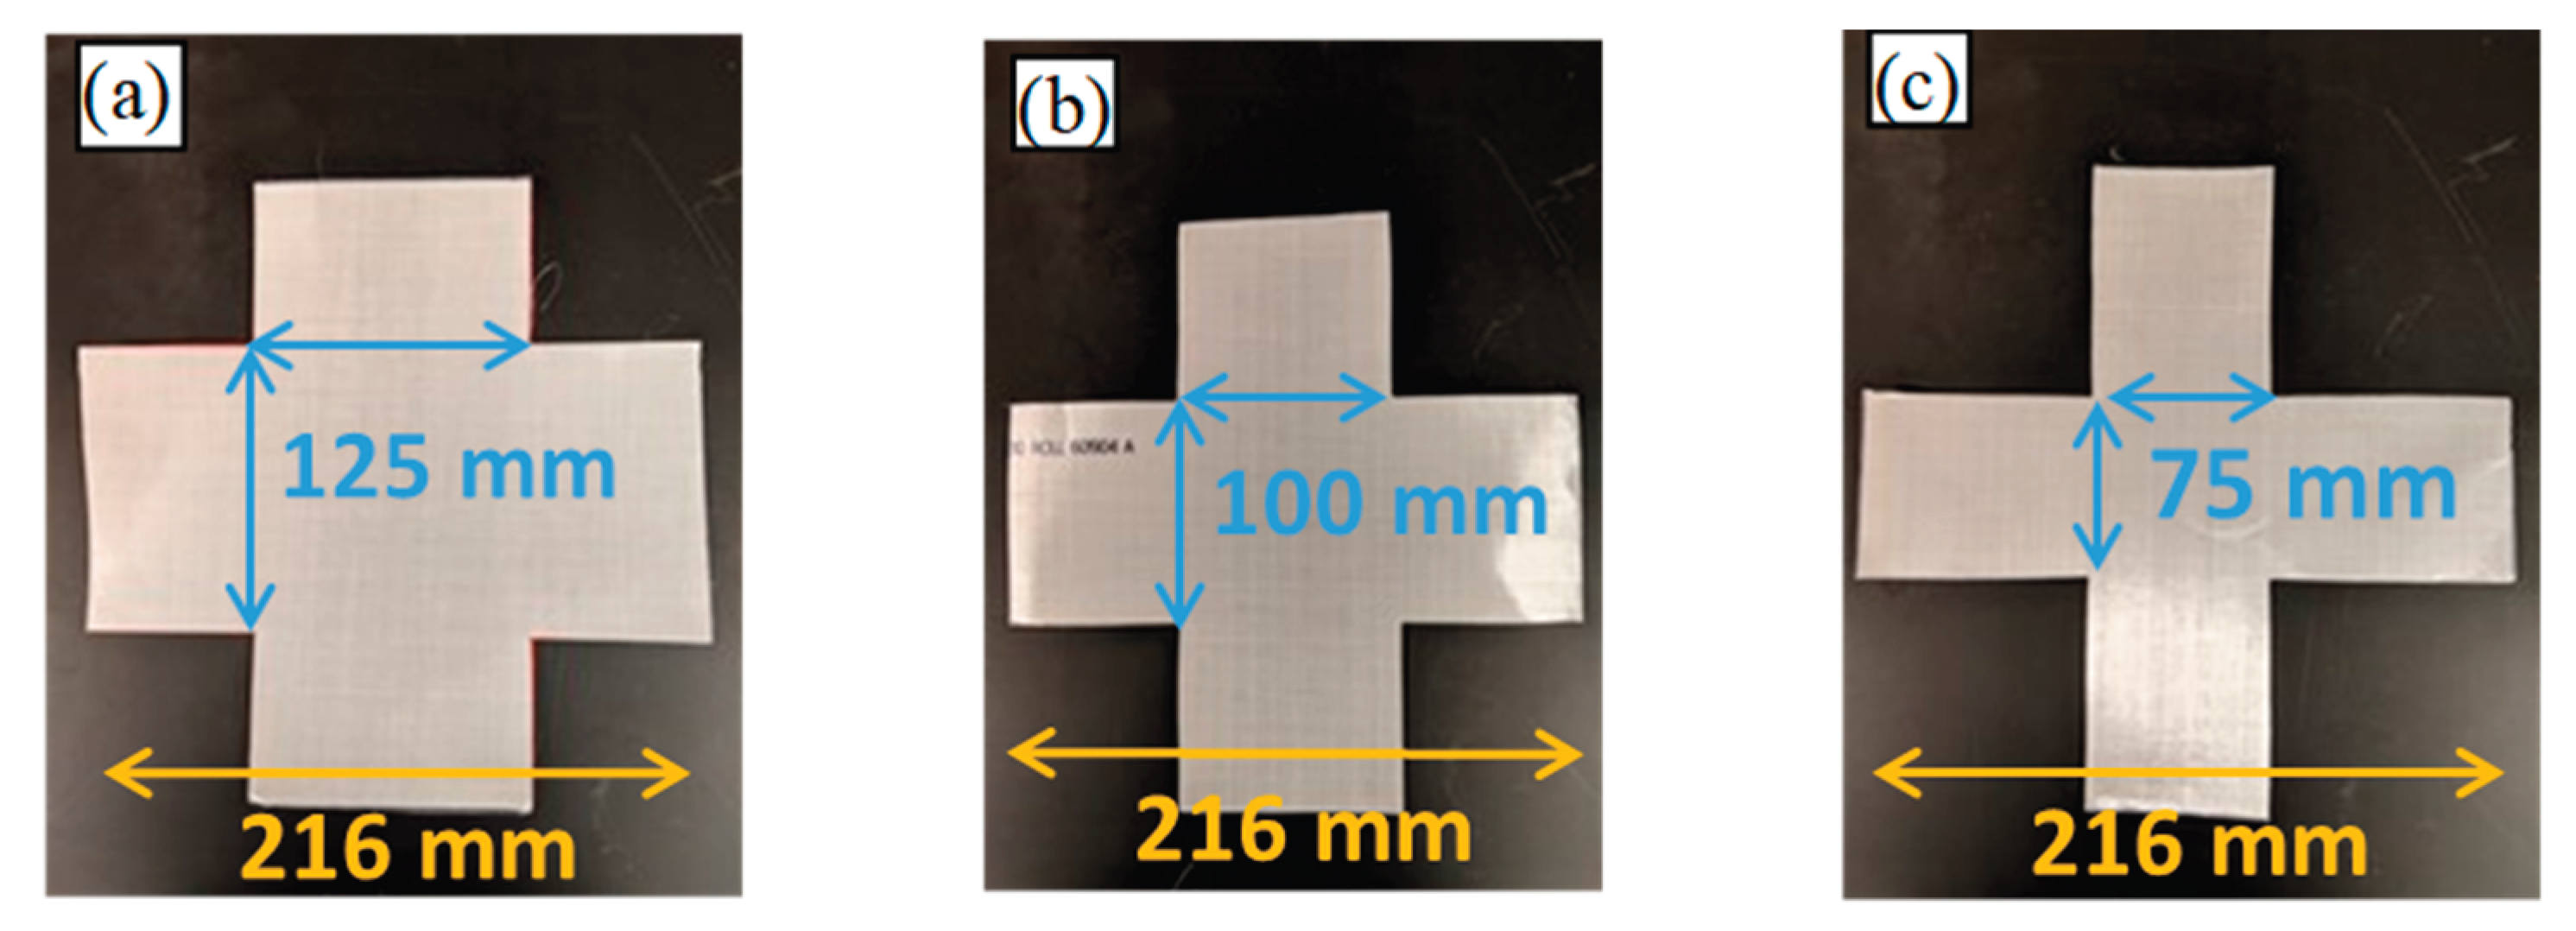
Figure 7.
Removal of cross-arm material from 125-mm gage sample.
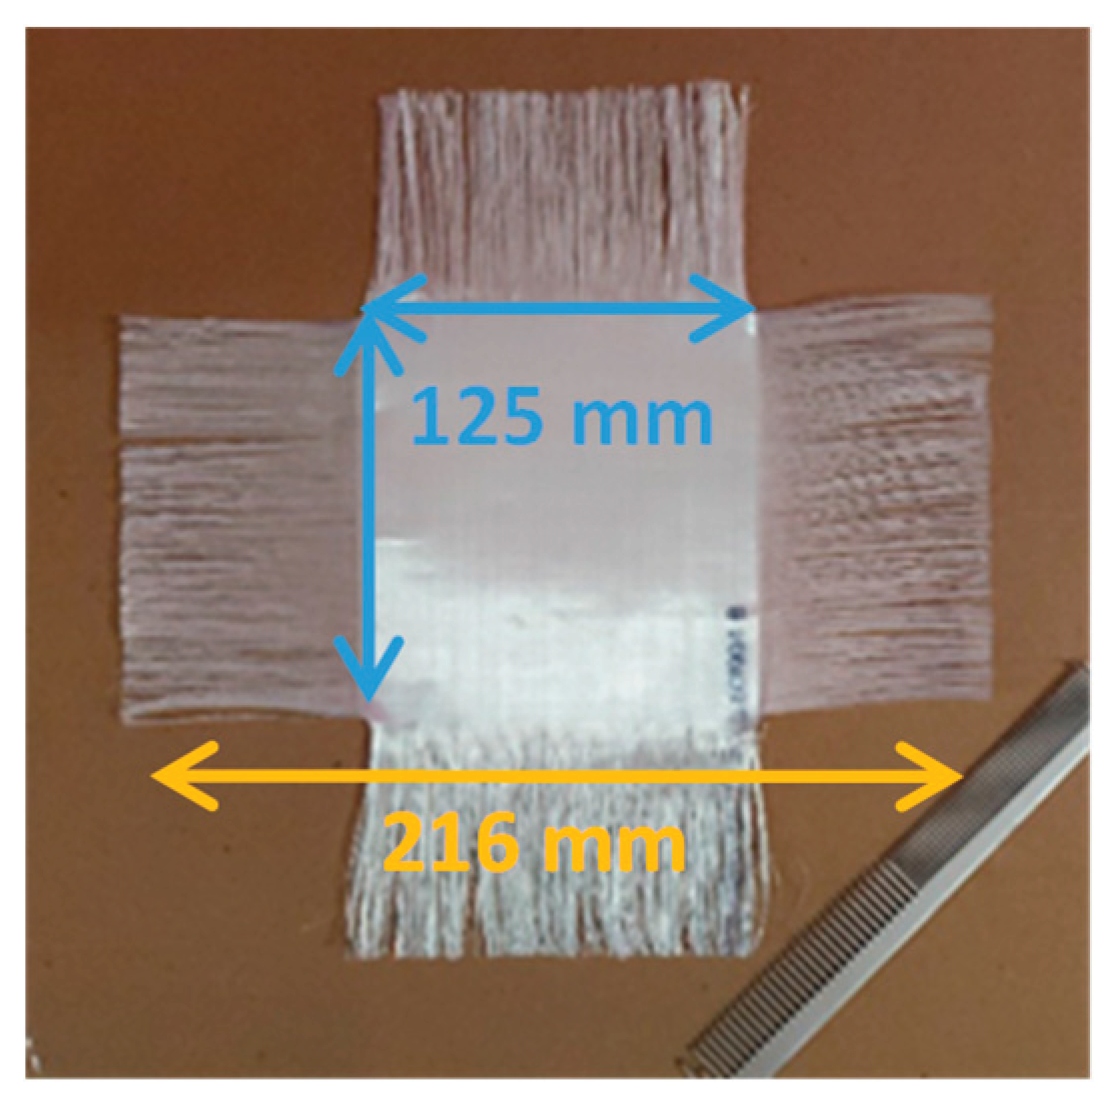
Figure 8.
Comparison of shear-strain rate of 0.05 rad/sec vs. crosshead rate of 1.8 mm/sec (a) for shear strain rate and (b) for crosshead movement.
Figure 8.
Comparison of shear-strain rate of 0.05 rad/sec vs. crosshead rate of 1.8 mm/sec (a) for shear strain rate and (b) for crosshead movement.
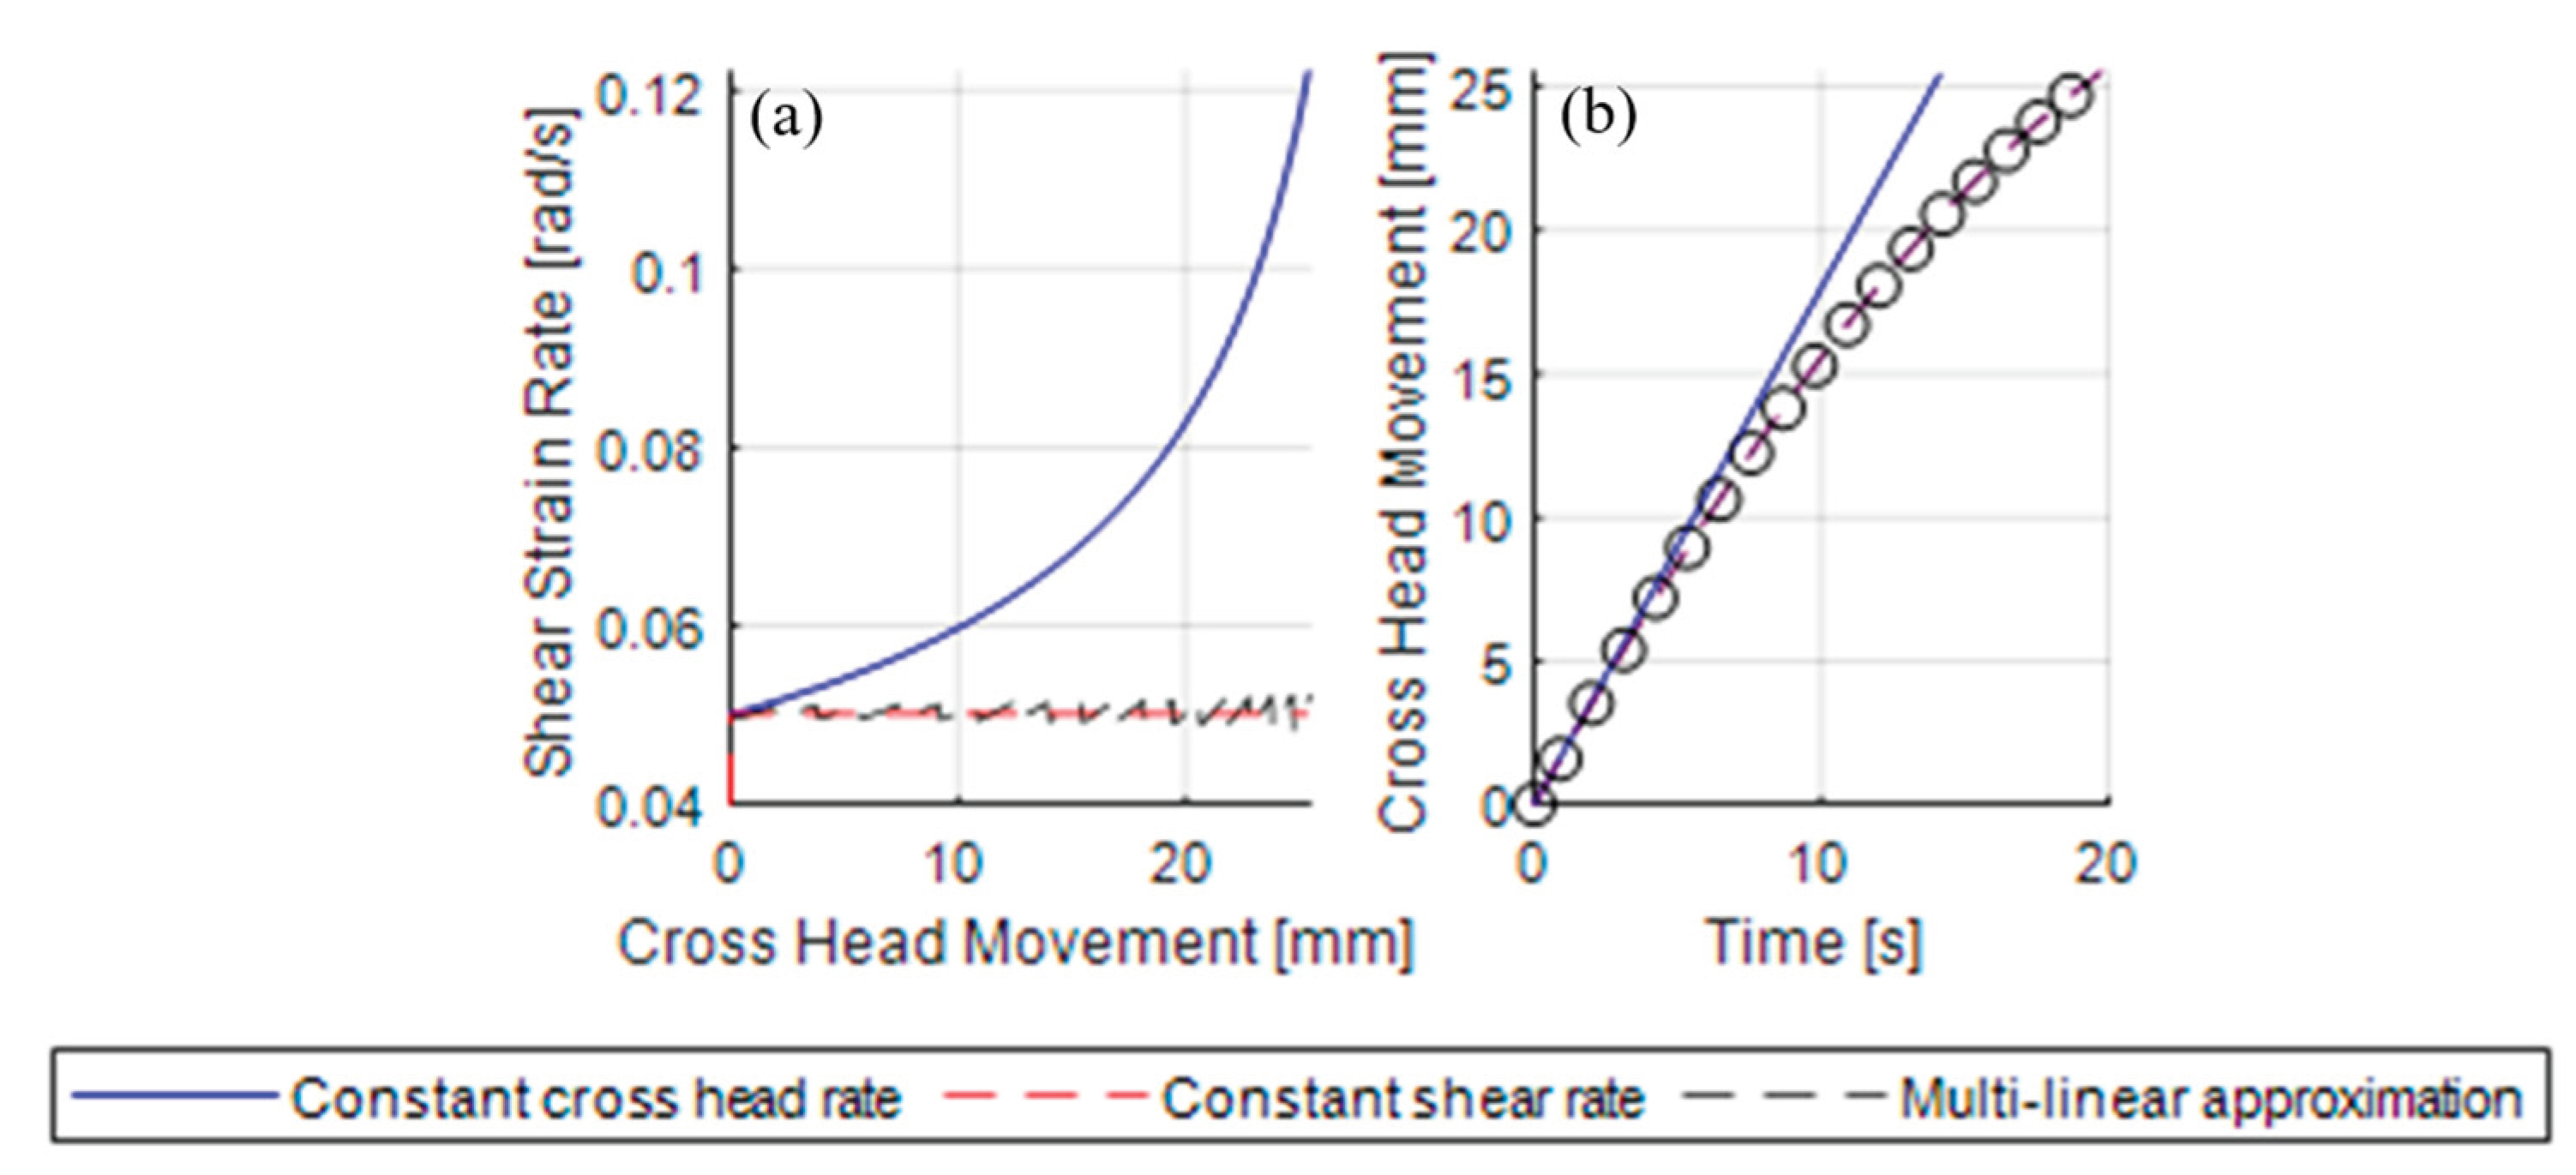
Figure 9.
Shear-strain rate distribution for when the punch is (a) 33%, (b) 67%, and (c) 100% embedded in the UHMWPE sheet, with the x-y location normalized by the punch radius.
Figure 9.
Shear-strain rate distribution for when the punch is (a) 33%, (b) 67%, and (c) 100% embedded in the UHMWPE sheet, with the x-y location normalized by the punch radius.
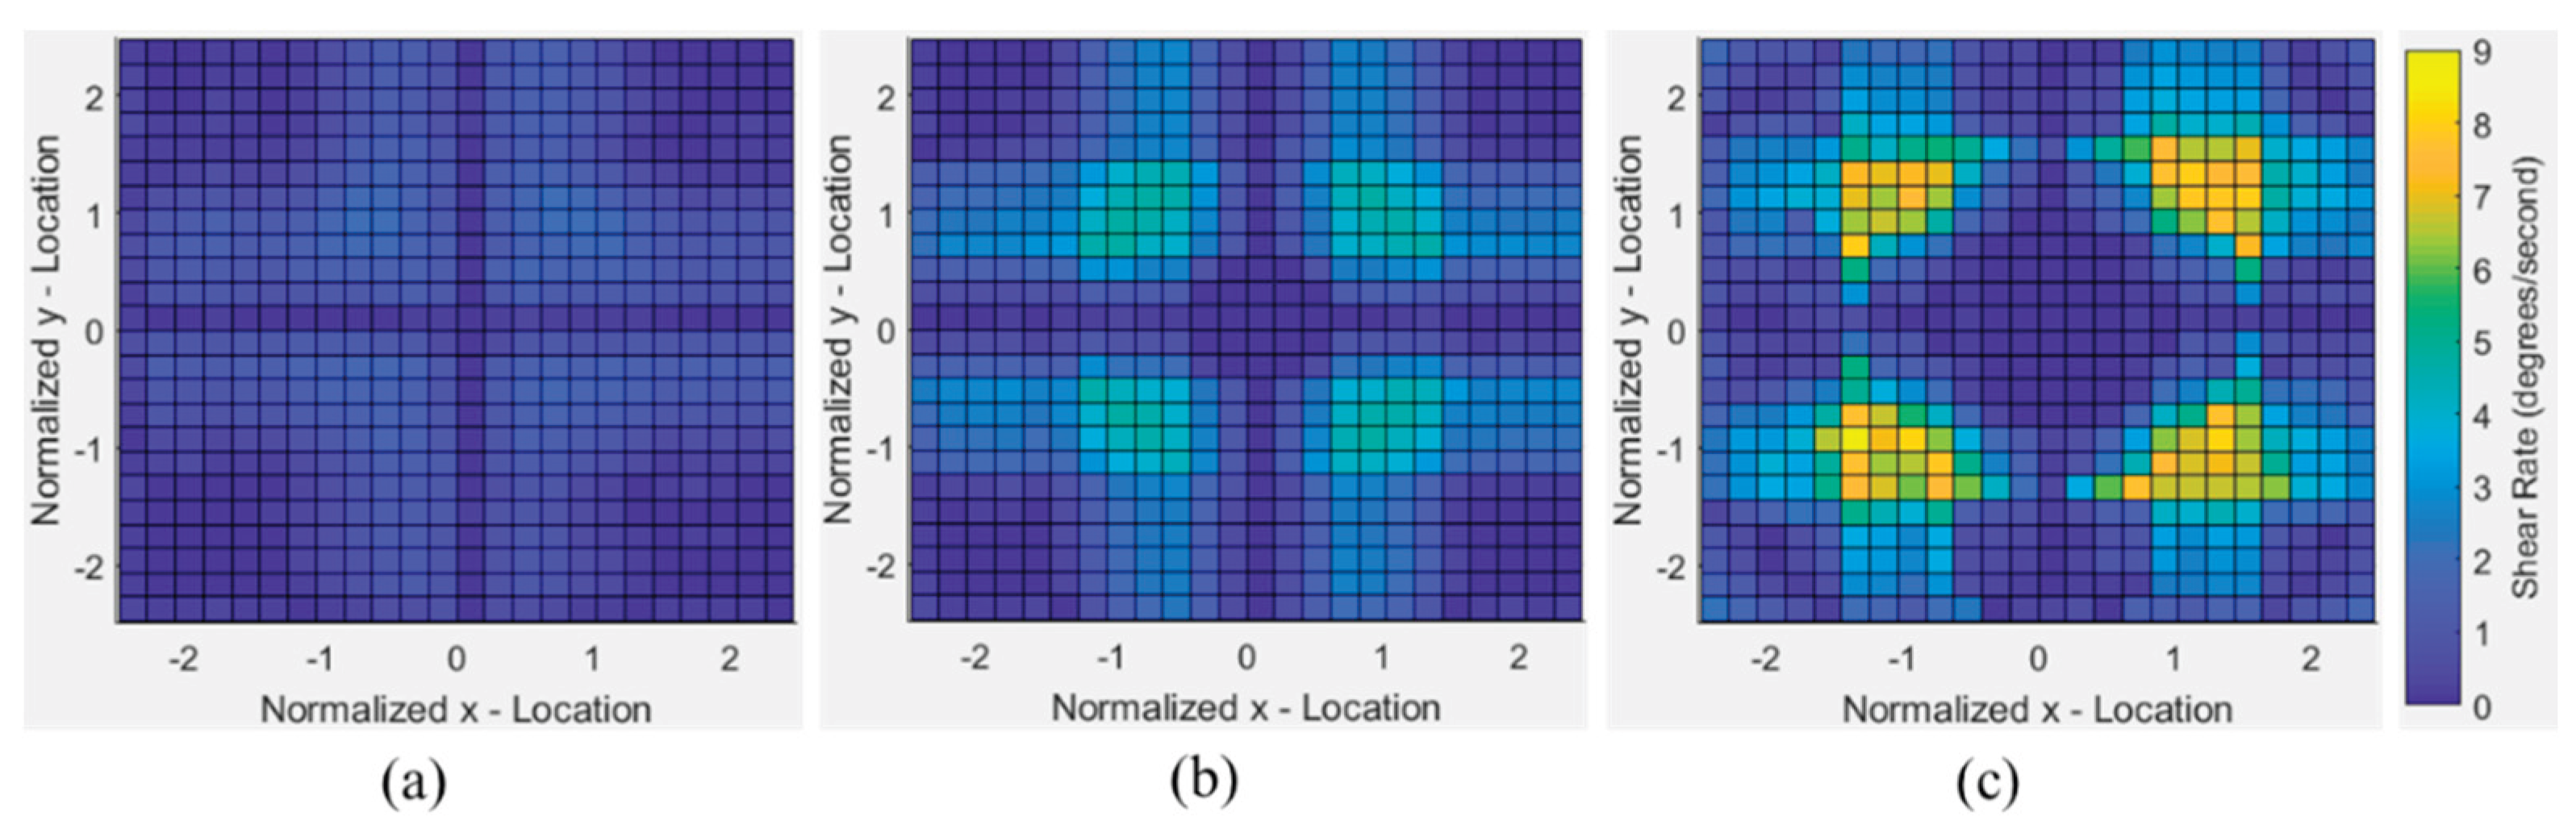
Figure 10.
Shear frame tests at 120°C at the start and at the end of the test for (a) (125-mm)2, (b) (100-mm)2, and (c) (75-mm)2 gage areas.
Figure 10.
Shear frame tests at 120°C at the start and at the end of the test for (a) (125-mm)2, (b) (100-mm)2, and (c) (75-mm)2 gage areas.
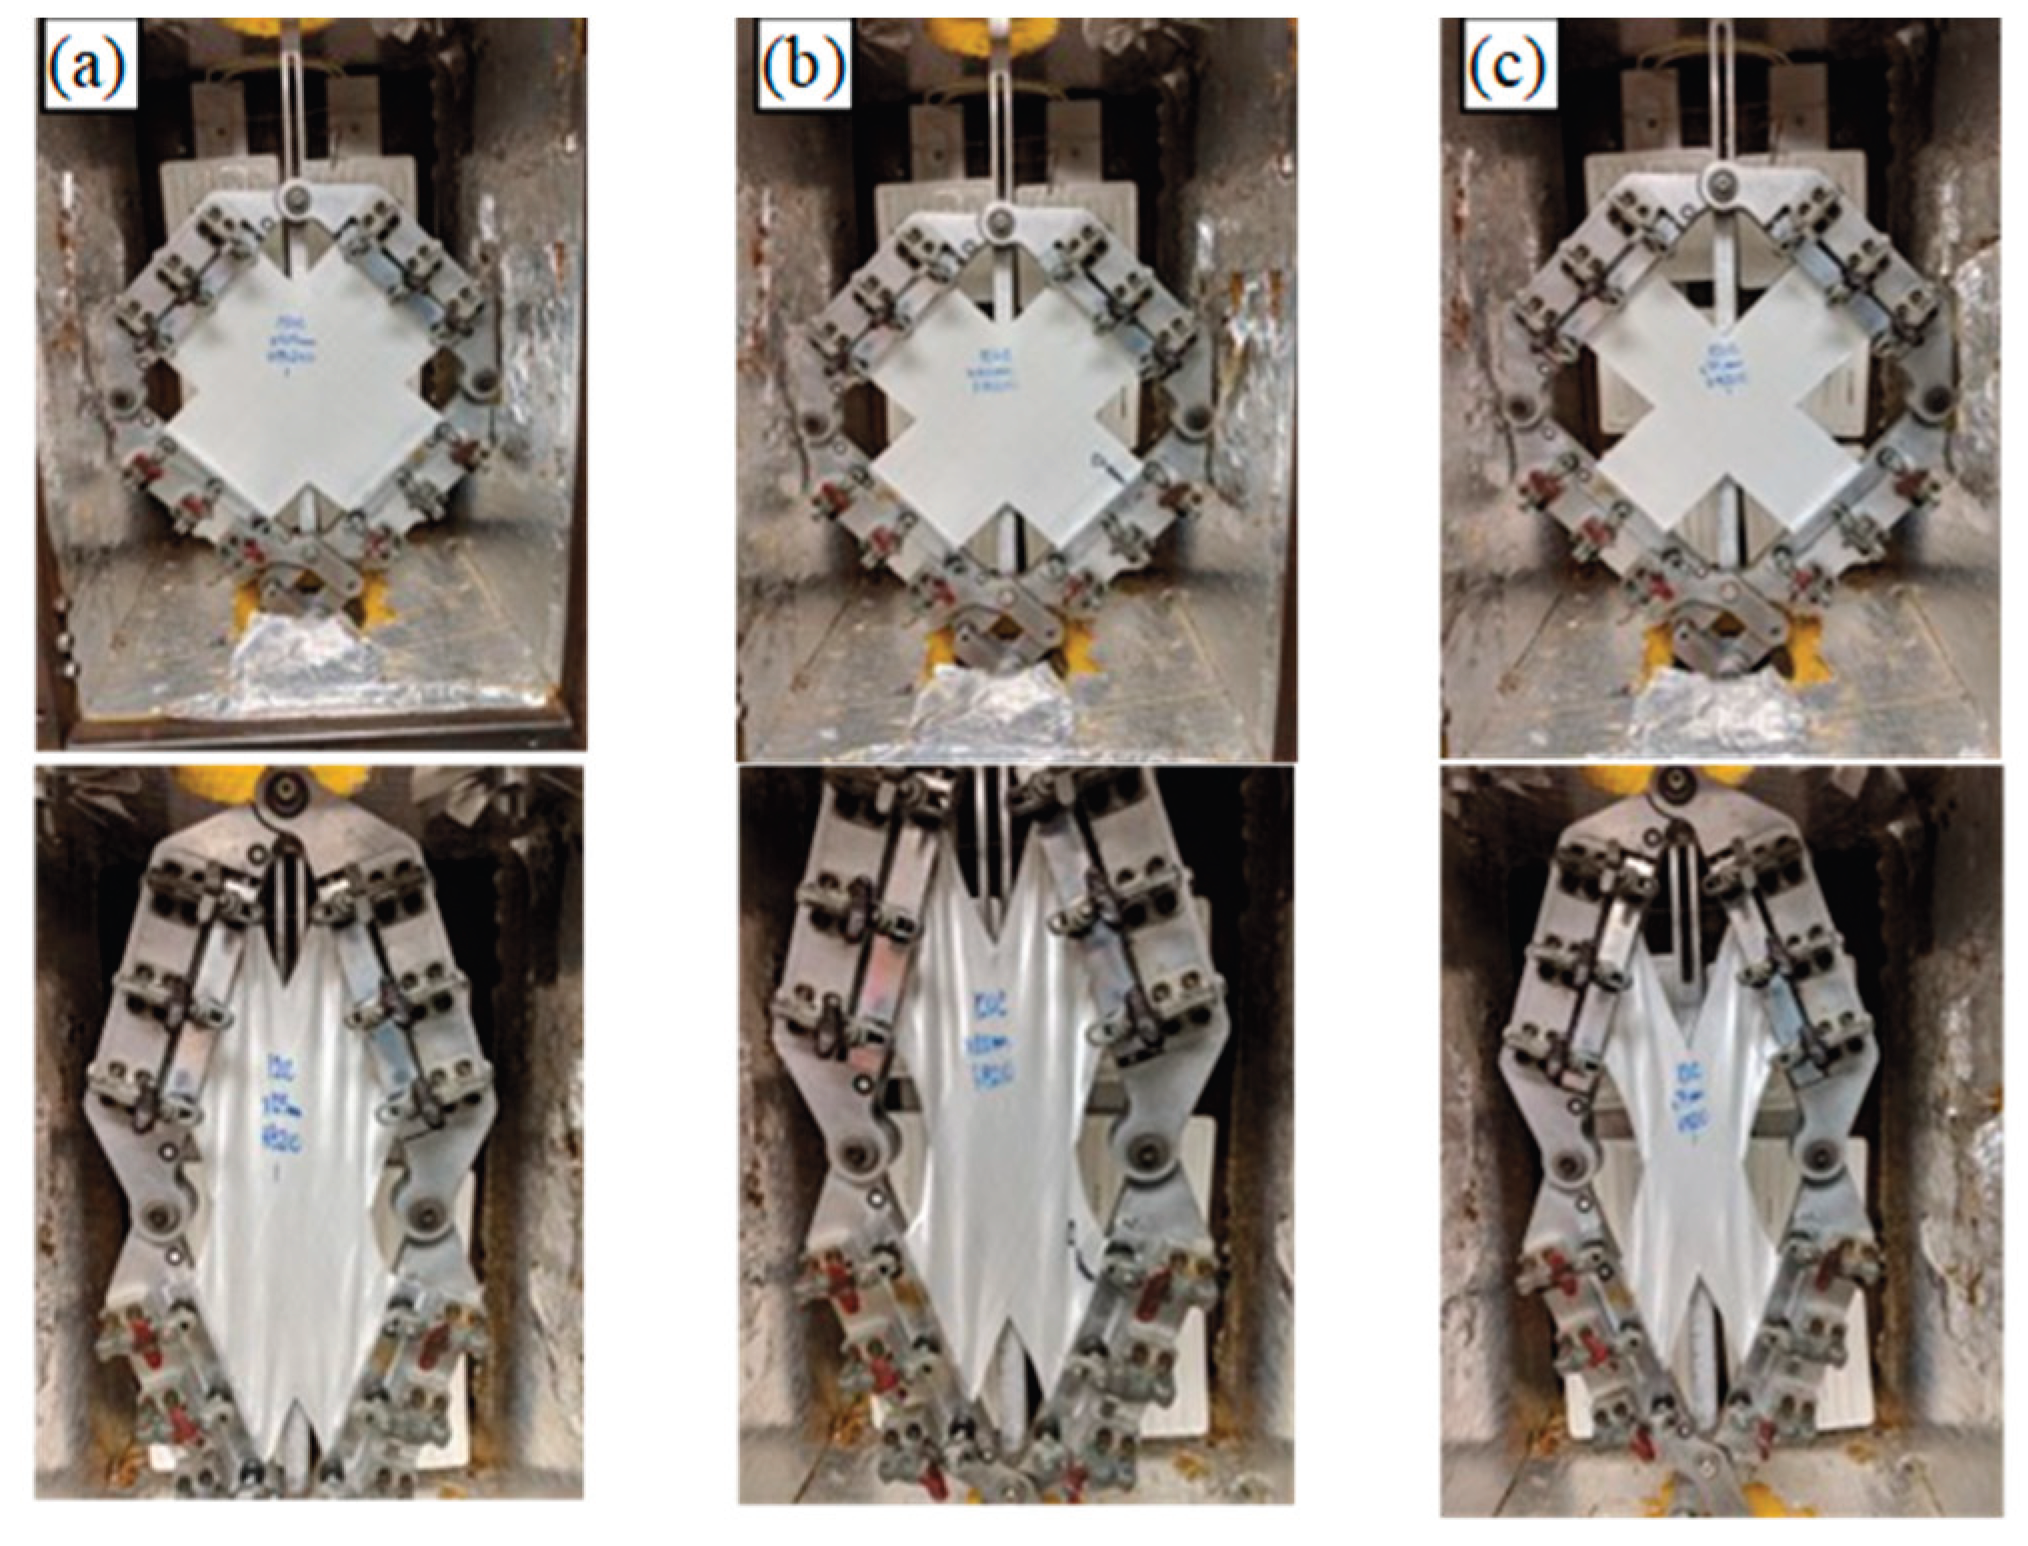
Figure 11.
Shear frame test for (125-mm)2 gage-area sample at 120°C with cross-arm material removed for (a) start and (b) end.
Figure 11.
Shear frame test for (125-mm)2 gage-area sample at 120°C with cross-arm material removed for (a) start and (b) end.
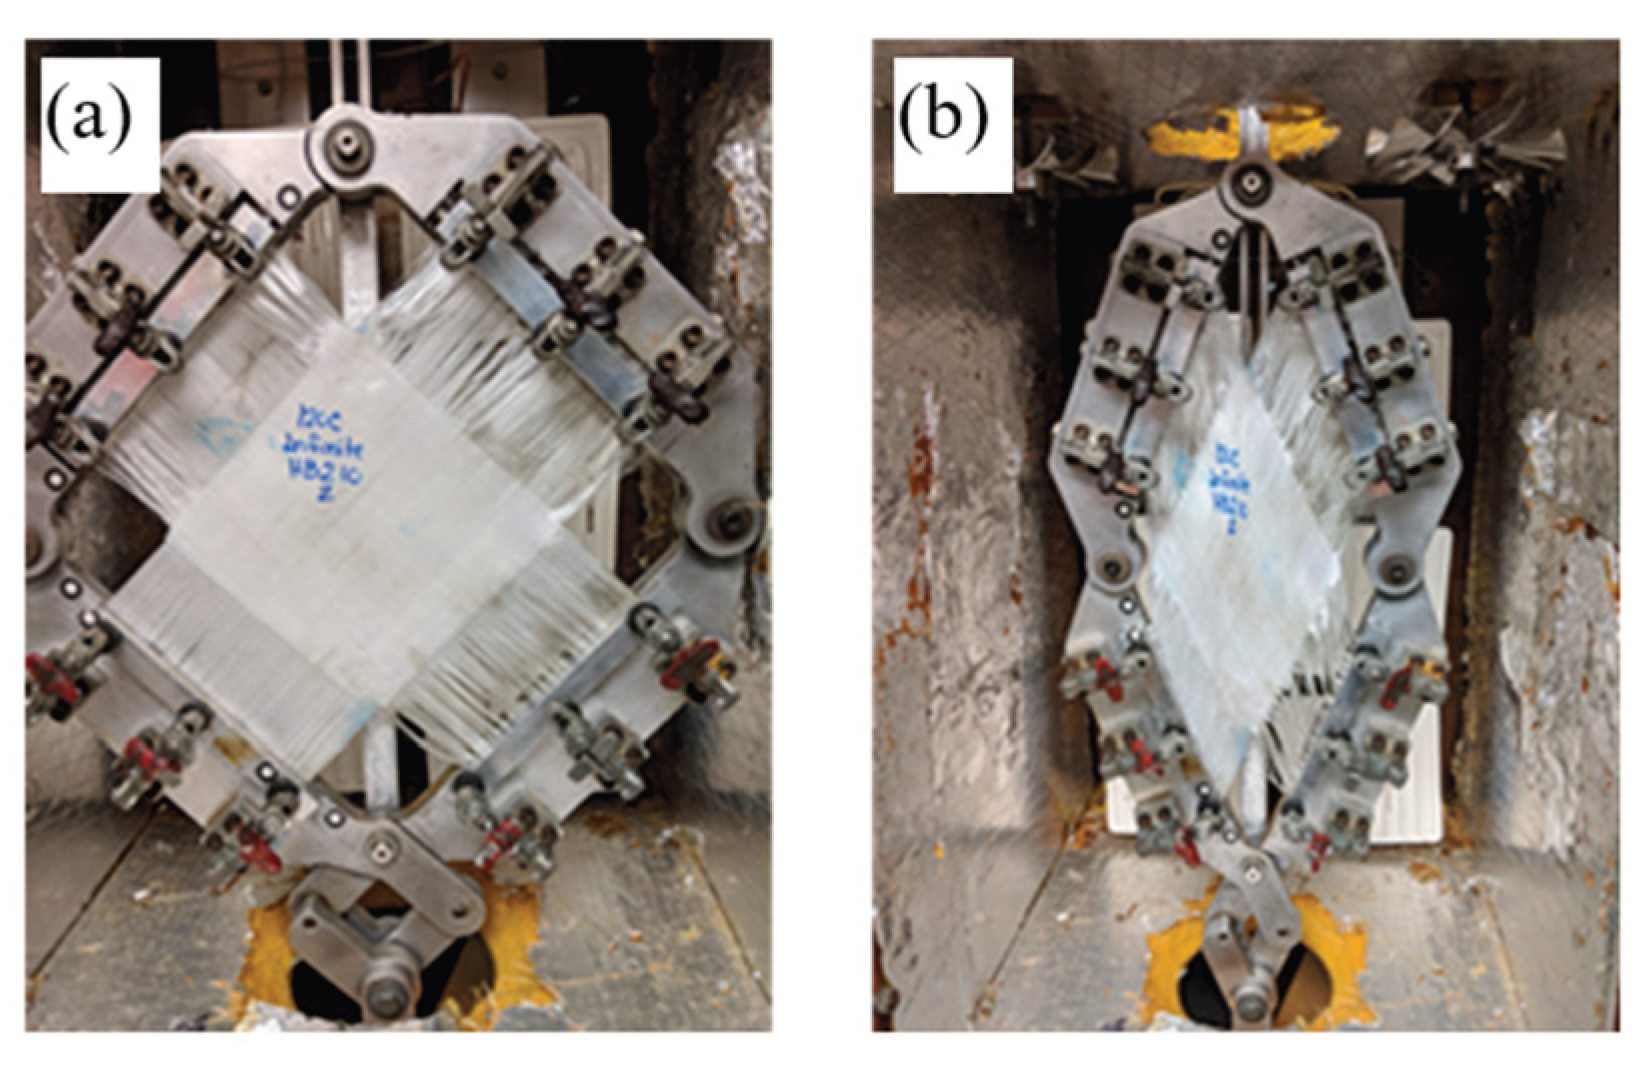
Figure 12.
Load vs. crosshead displacement results for shear-frame testing.
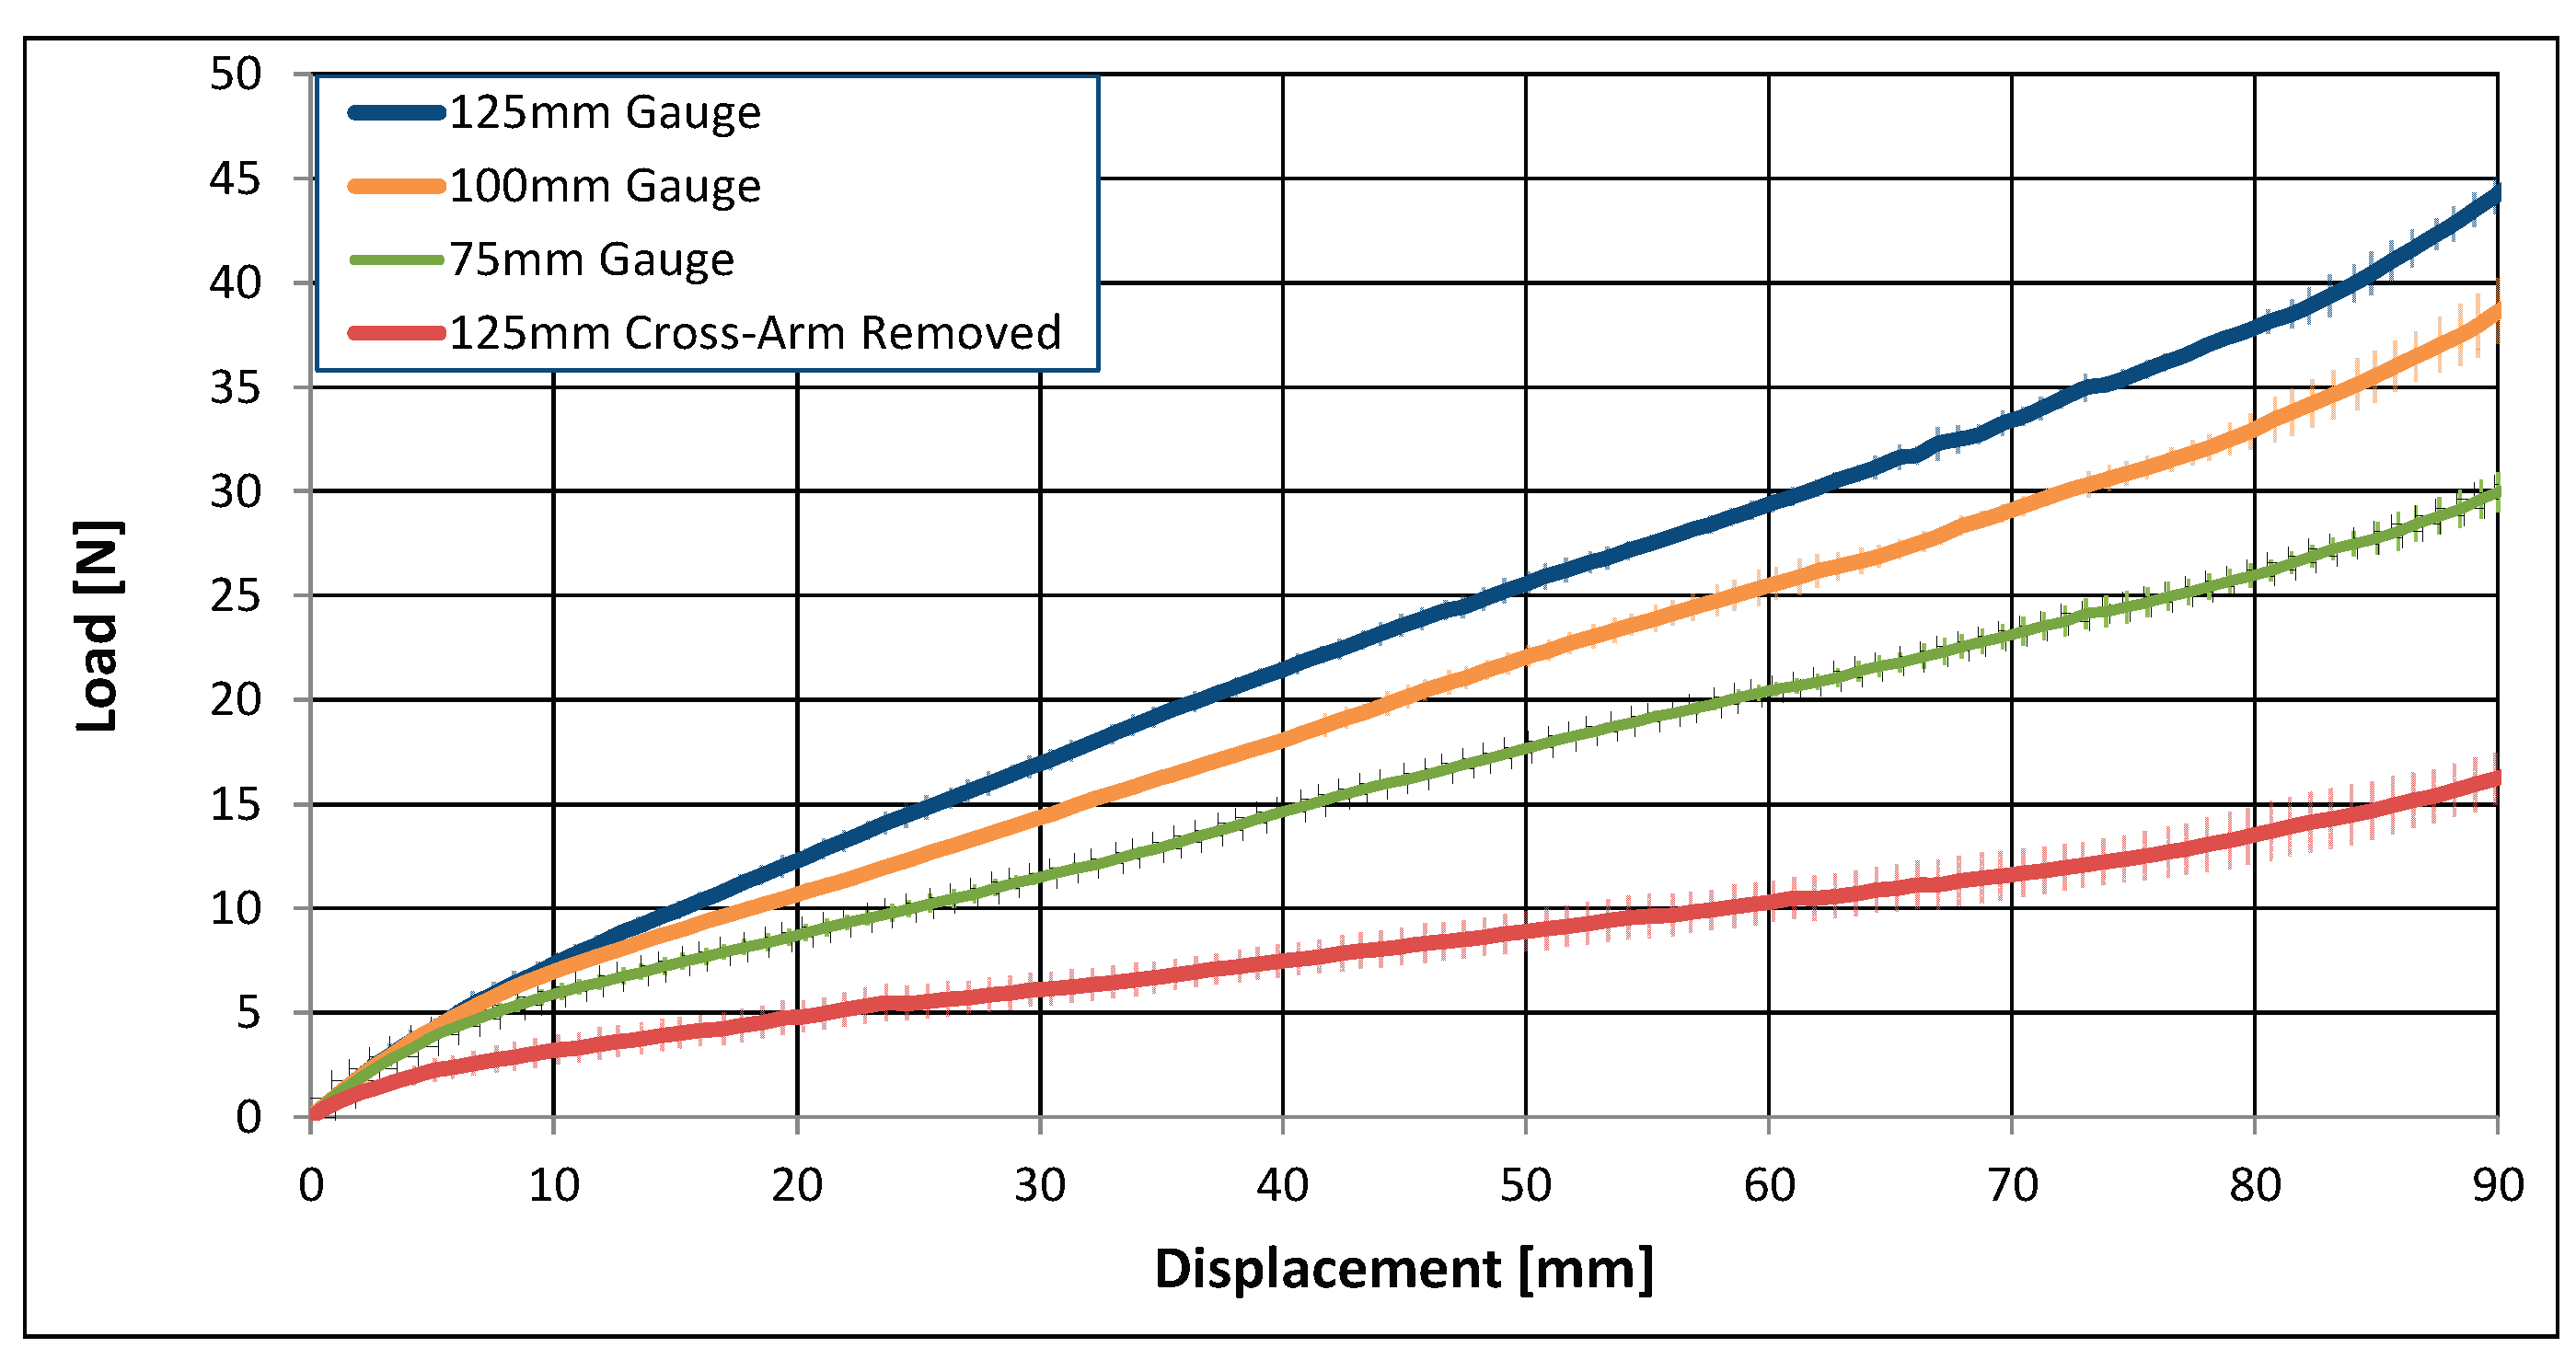
Figure 13.
Normalized shear stress: (a) for assuming no arm contribution and thereby using only the central gage area, and (b) for assuming equal arm contribution and thereby using the full area.
Figure 13.
Normalized shear stress: (a) for assuming no arm contribution and thereby using only the central gage area, and (b) for assuming equal arm contribution and thereby using the full area.
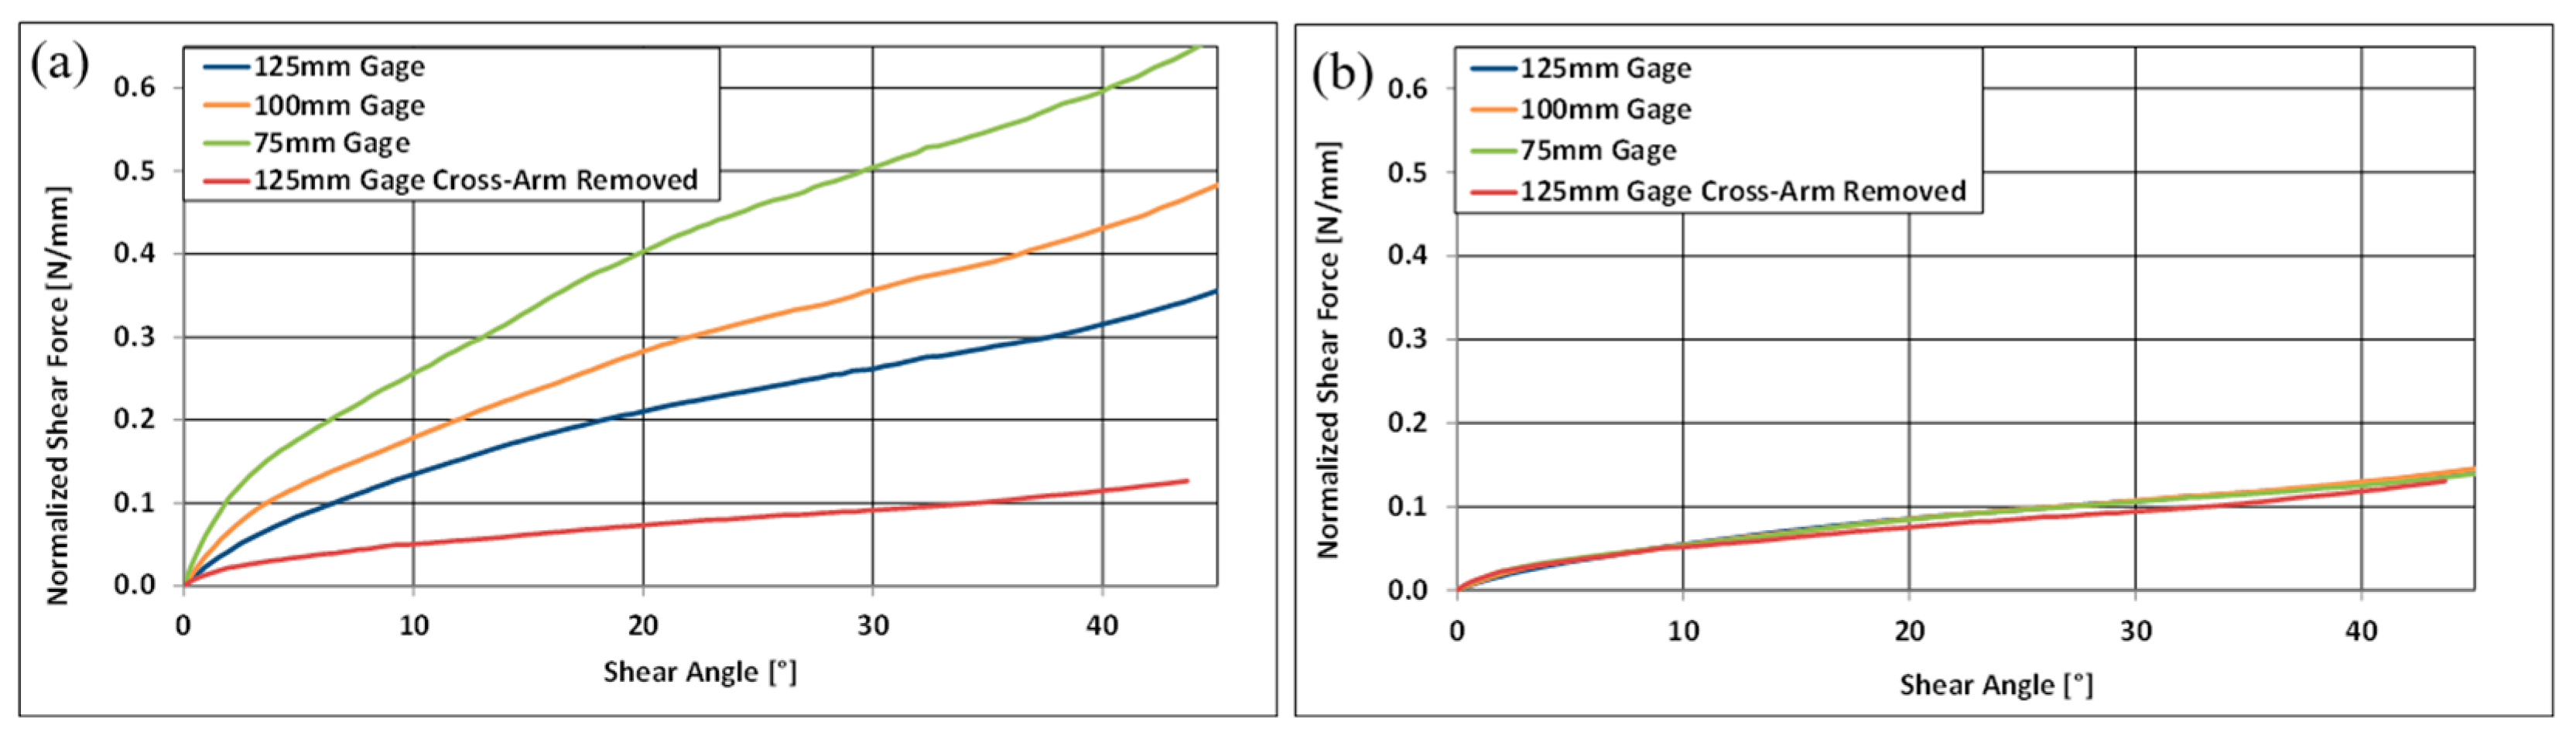
Figure 14.
Normalized stress vs. displacement for three constant strain rates (a) without error bars and (b) with one standard deviation error bars.
Figure 14.
Normalized stress vs. displacement for three constant strain rates (a) without error bars and (b) with one standard deviation error bars.
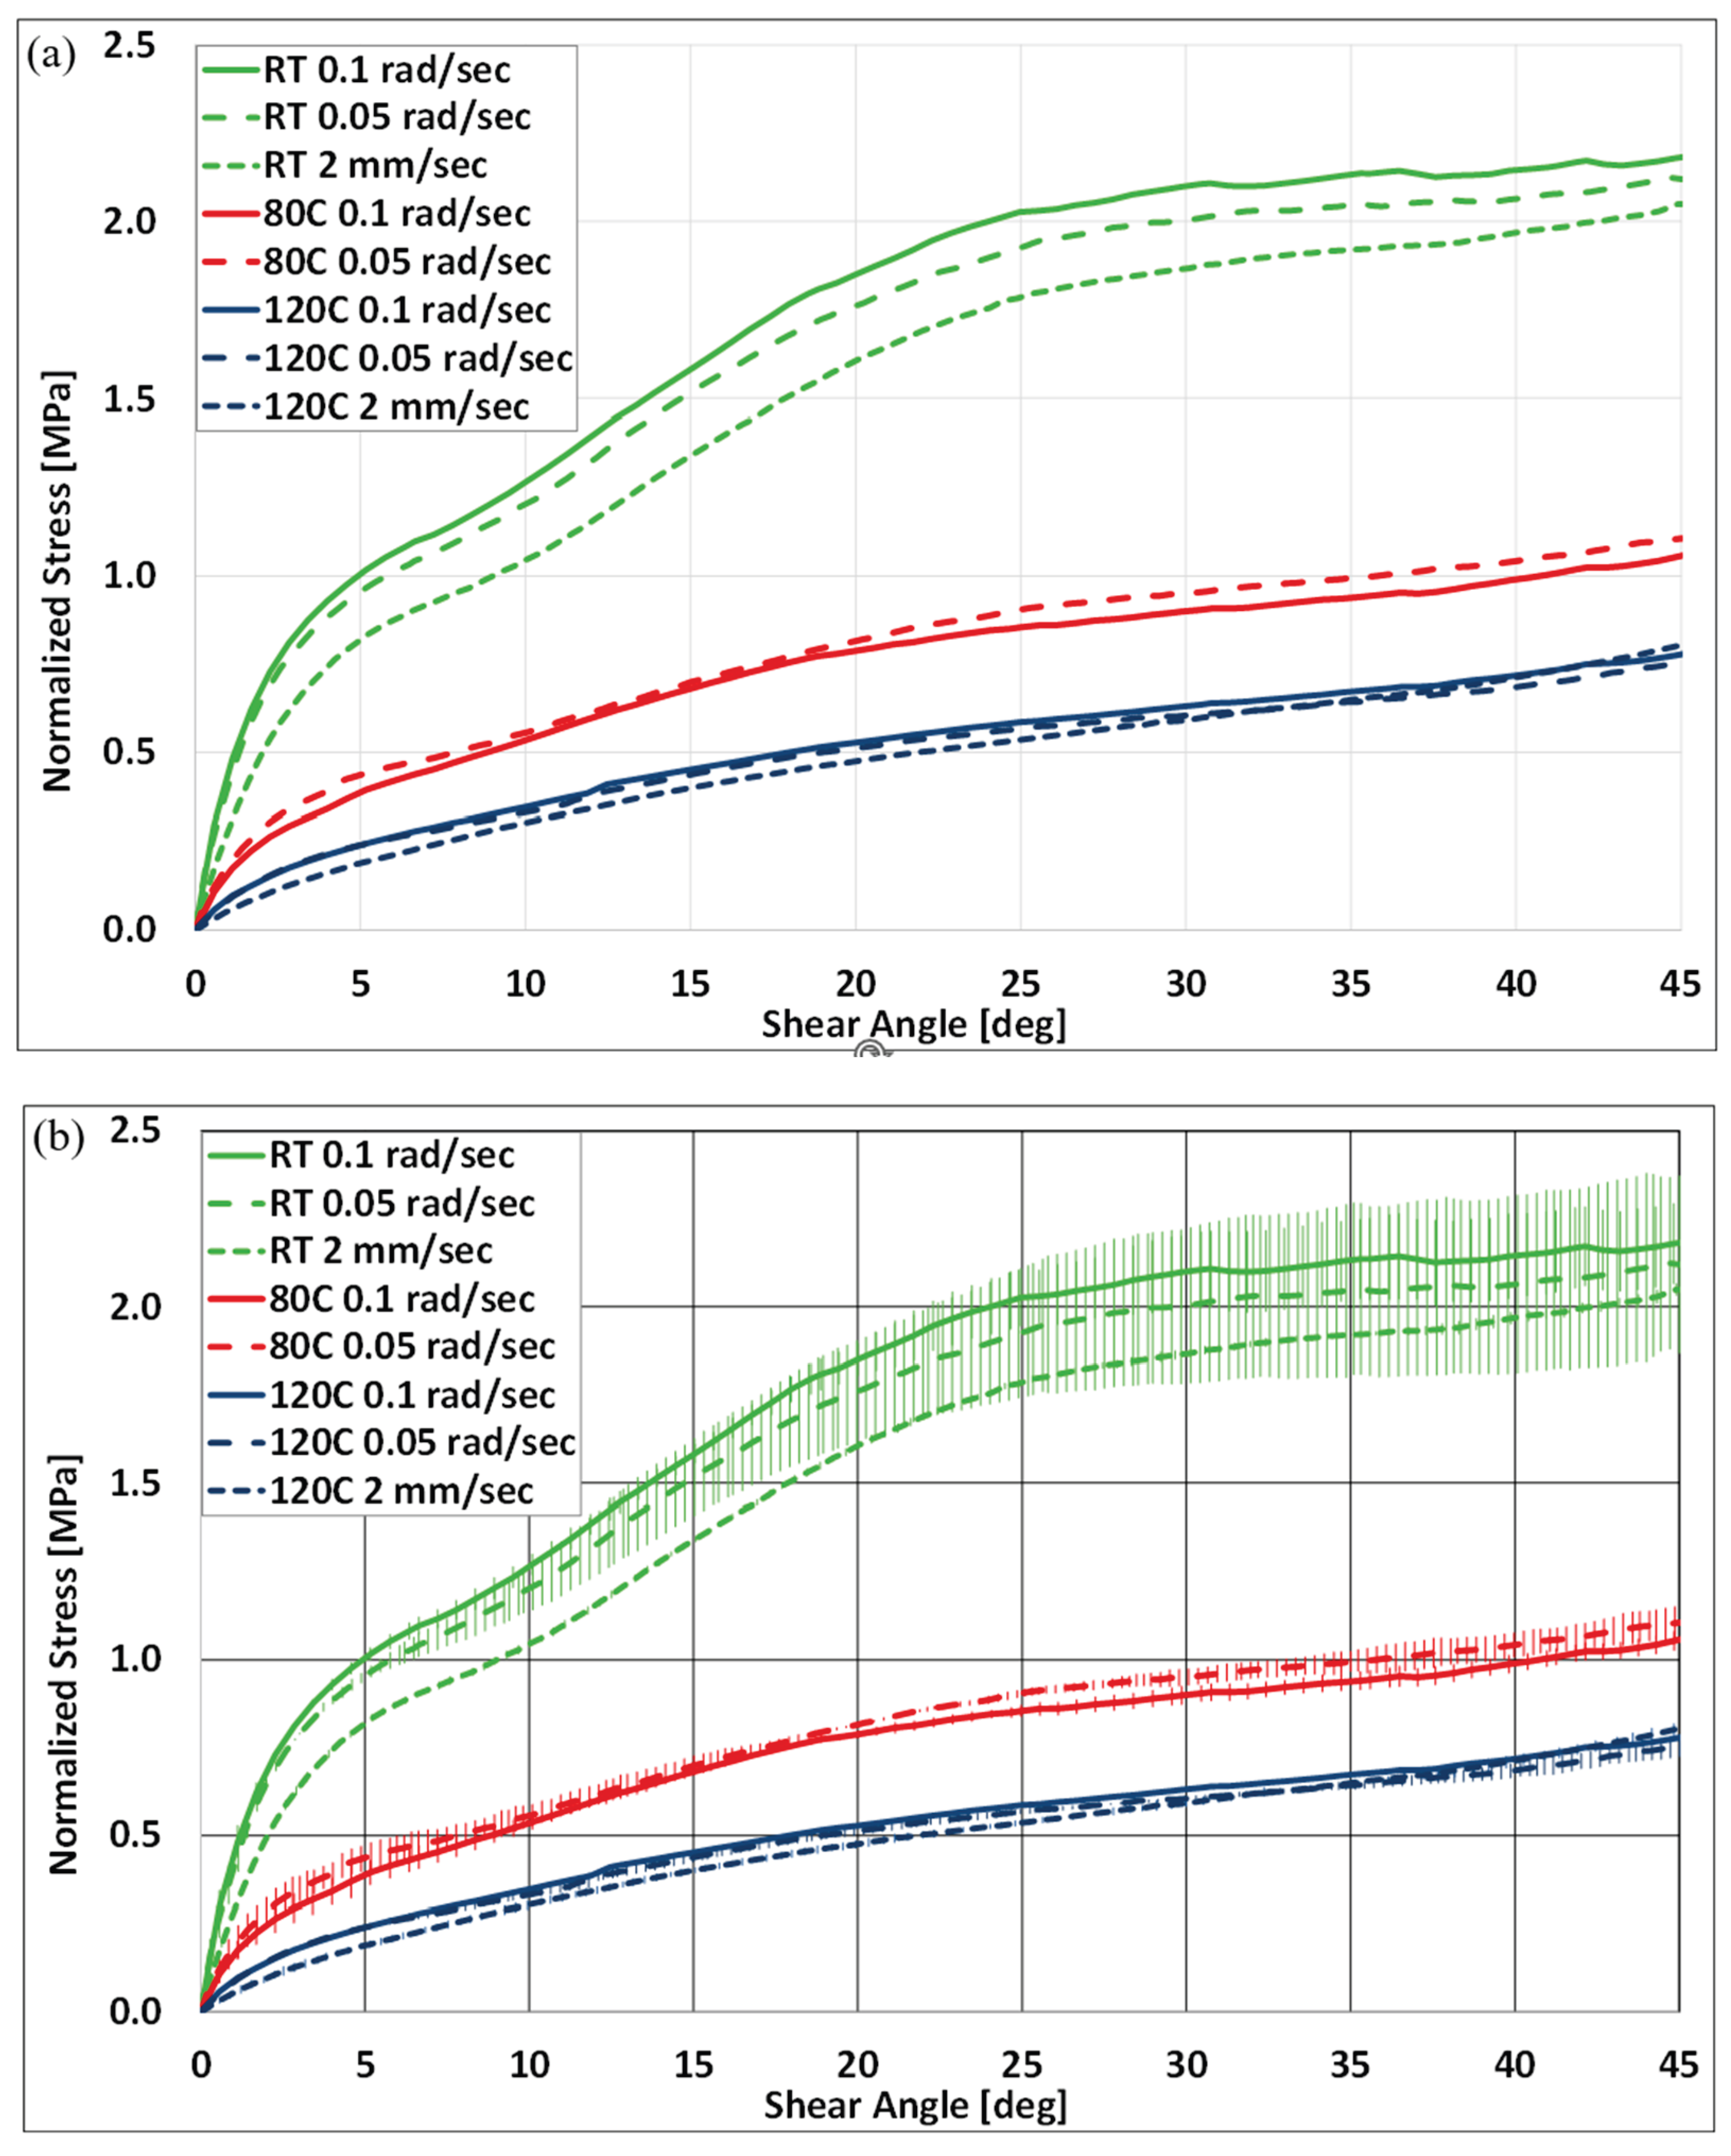
Figure 15.
Finite element models (a) of full-arm specimen and (b) of cross-arm material removed.

Figure 16.
Finite element results from four configurations using full-arm data.
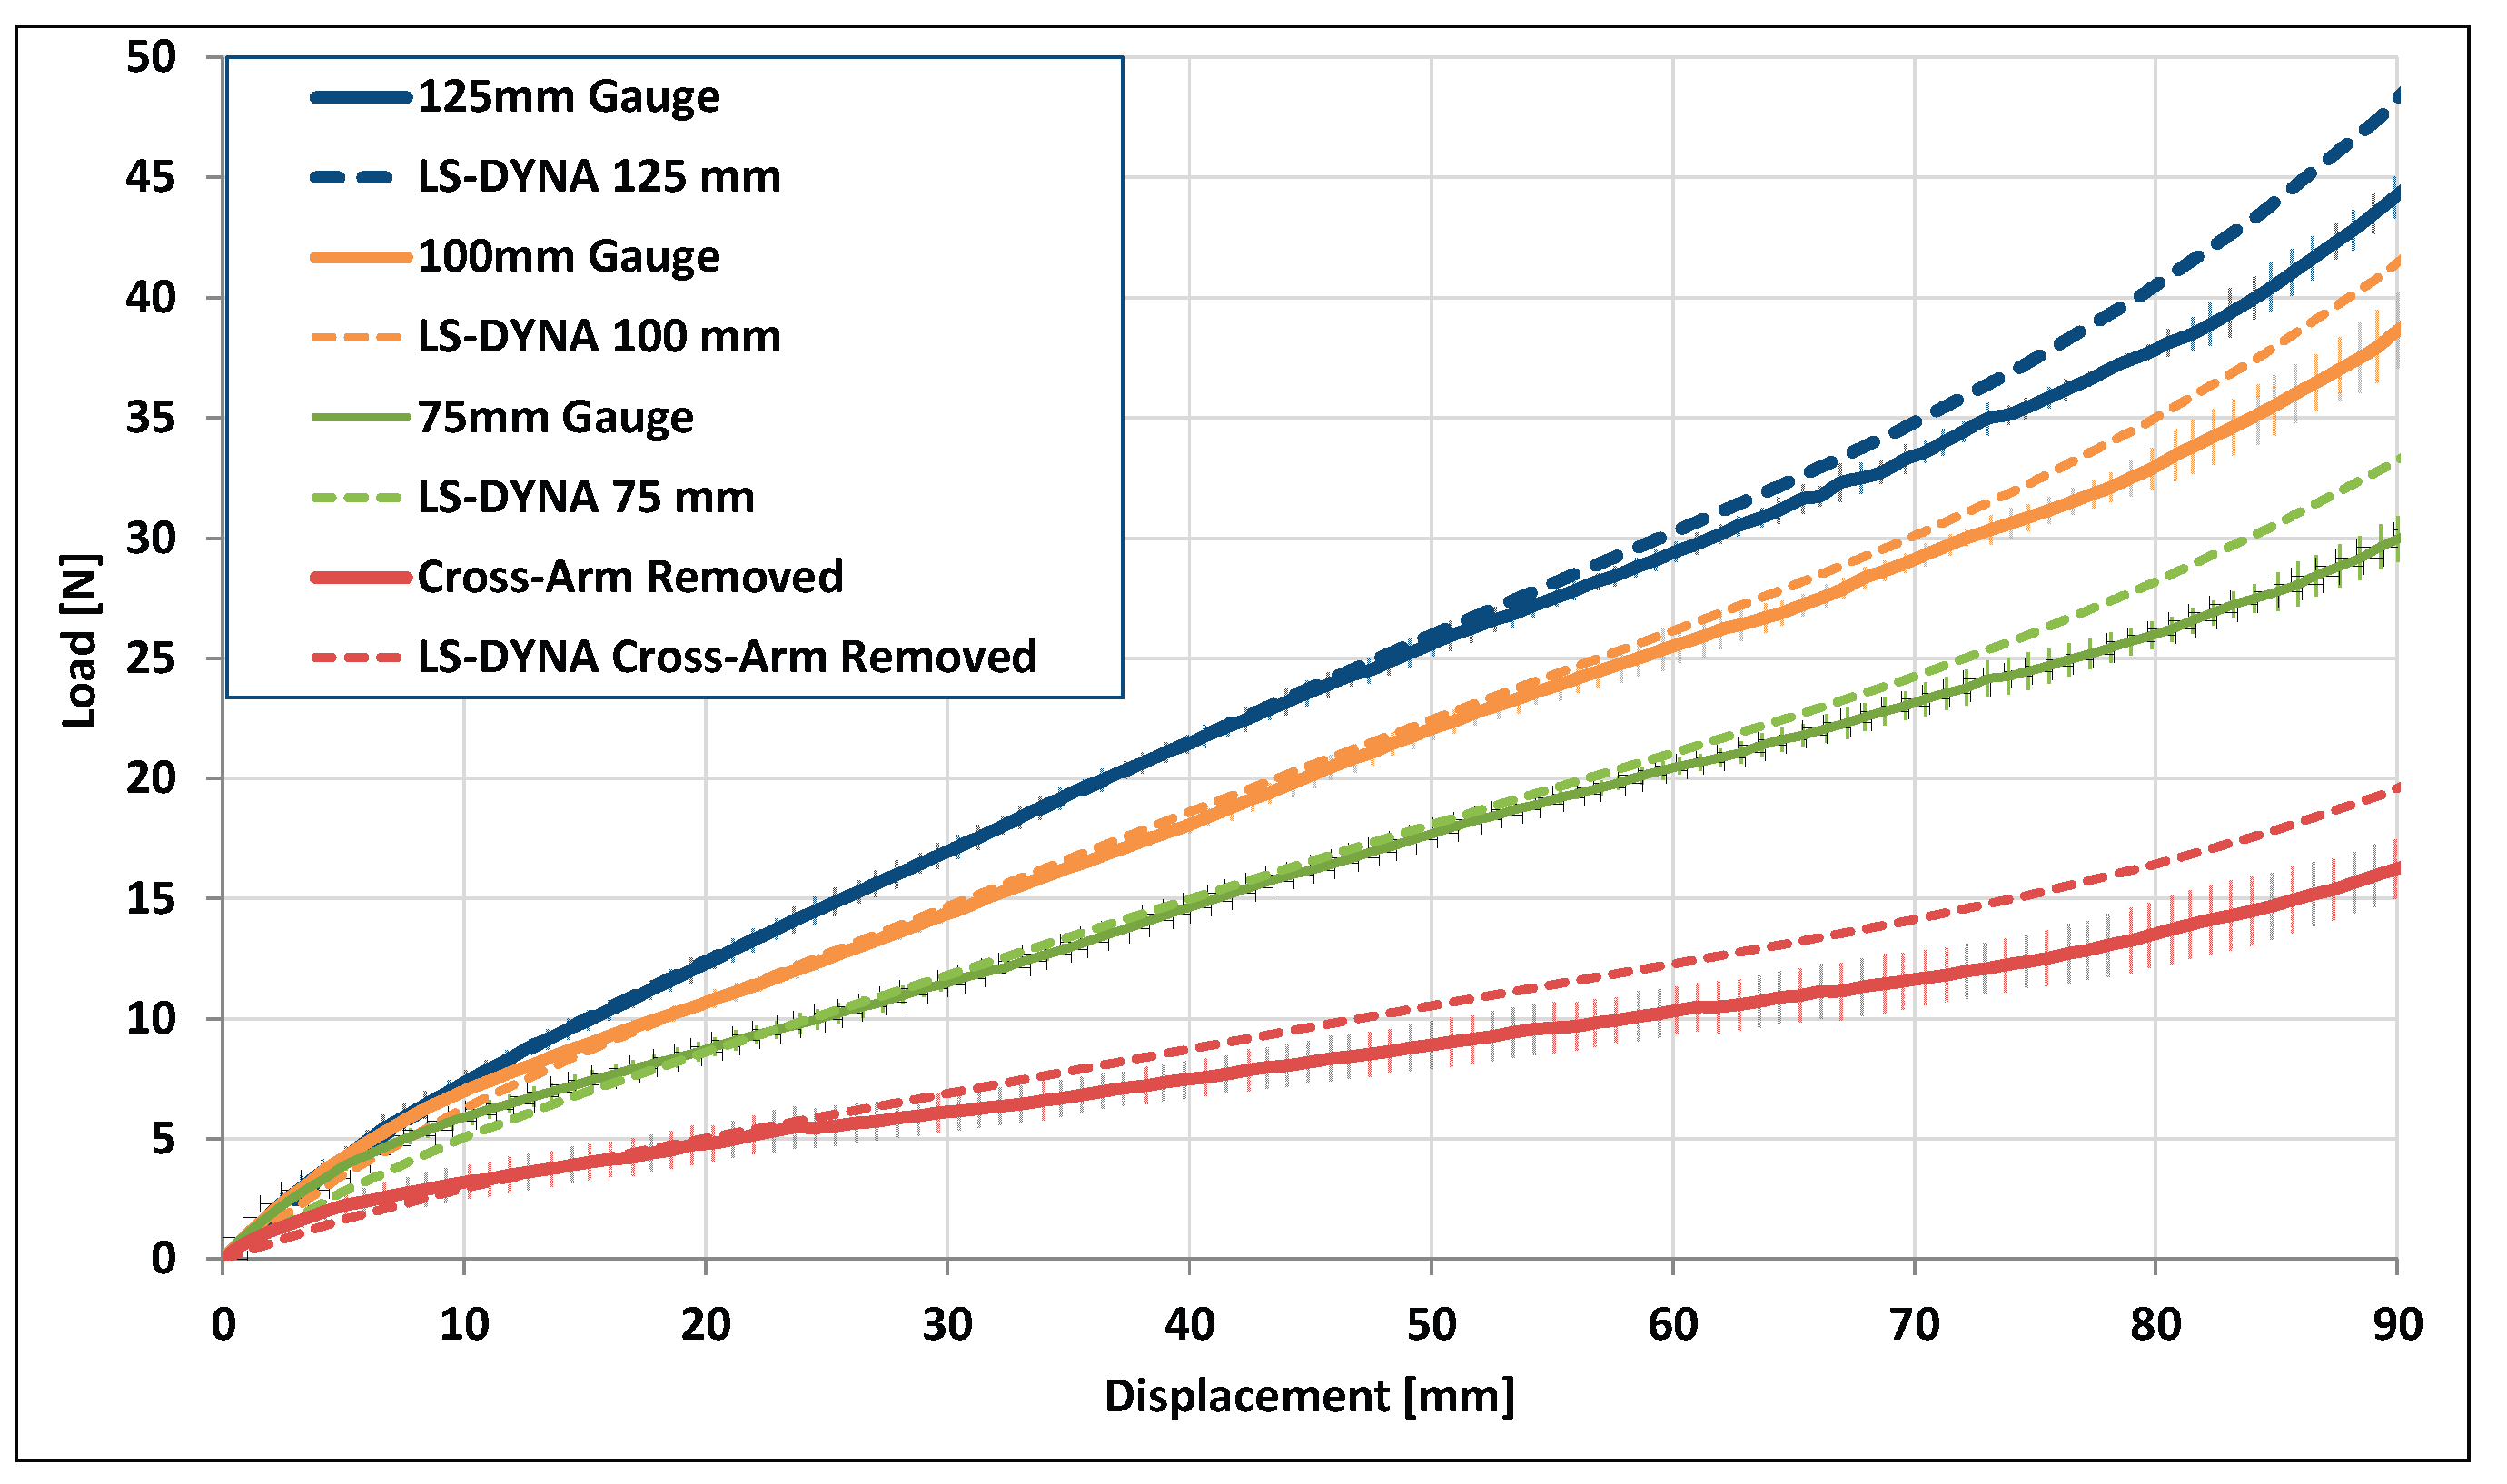

Table 1.
Cruciform Sample Sizes for Shear-Frame Testing.
| Sample | Gage Side Length | Ratio of Arm Area / Total Area |
|---|---|---|
| A | 125 mm | 0.6 |
| B | 100 mm | 0.7 |
| C | 75 mm | 0.8 |
Table 2.
Material inputs for finite element model with UMAT at 120°C.
| Material System | Temperature (°C) |
Shear Stiffness (MPa) |
Tensile Modulus (MPa) |
|---|---|---|---|
| Dyneema HB210 | 120 | 13222 |
Disclaimer/Publisher’s Note: The statements, opinions and data contained in all publications are solely those of the individual author(s) and contributor(s) and not of MDPI and/or the editor(s). MDPI and/or the editor(s) disclaim responsibility for any injury to people or property resulting from any ideas, methods, instructions or products referred to in the content. |
© 2025 by the authors. Licensee MDPI, Basel, Switzerland. This article is an open access article distributed under the terms and conditions of the Creative Commons Attribution (CC BY) license (http://creativecommons.org/licenses/by/4.0/).
Copyright: This open access article is published under a Creative Commons CC BY 4.0 license, which permit the free download, distribution, and reuse, provided that the author and preprint are cited in any reuse.


