
Submitted:
09 October 2025
Posted:
09 October 2025
You are already at the latest version
Abstract
Photoacoustic spectroscopy (PAS) is a powerful technique for selective gas detection; however, its performance in non-resonant configurations is fundamentally constrained by the poor low-frequency response of conventional acoustic detectors. Commercial MEMS microphones, although compact and cost-effective, exhibit limited infrasound sensitivity, which restricts the development of truly miniaturised and broadband PAS systems. To address this limitation, we present a novel MEMS fluidic microphone (f-mic) that operates on a thermal sensing principle and is explicitly optimised for the infrasound regime. The sensor demonstrates a constant sensitivity of 32 µV/Pa for frequencies below 20 Hz. A detailed analytical model incorporating frequency-dependent effects was developed to identify and investigate the critical design parameters that influence system performance. Based on these insights, a miniaturised photoacoustic cell was fabricated, ensuring efficient optical coupling
and f-mic integration. Experimental validation using a CO2-targeted laser system demonstrates a linear response up to 5000 ppm, a sensitivity of 6 nV/ppm, and a theoretical detection limit of 300 ppb over 100 seconds, resulting in an NNEA of 6e-6 W cm^-1 Hz^-0.5. Long-term measurements indicate good stability, with minor drift primarily due to gas leakage and chopper fluctuations. These results establish the f-mic as a robust, scalable solution for non-resonant PAS, effectively overcoming
a significant bottleneck in compact gas sensing technologies.
Keywords:
Photoacoustic
; acoustic sensor
; non-resonant
; microphone
; thermal sensor
; gas sensing
1. Introduction
Photoacoustic spectroscopy (PAS) is a gas detection technique that exploits the photoacoustic effect, in which modulated light is absorbed by target gas molecules and converted into heat. The resulting periodic thermal expansion generates acoustic pressure within a closed volume, which can be detected using an acoustic transducer such as a microphone. In the weak absorption limit, the generated photoacoustic pressure is proportional to the gas concentration [1]. This technique enables direct and selective detection without requiring long optical paths or bulky spectral instruments. Unlike long-path optical techniques, such as non-dispersive infrared spectroscopy (NDIR) and tunable laser spectroscopy (TLS), PAS sensitivity is primarily governed by the available optical power and the efficiency of acoustic transduction, rather than the optical path length, allowing for compact, miniaturised gas sensors with high sensitivity [2]. The combination of spectral selectivity from tunable lasers and compactness has resulted in PAS as a highly suitable technology for trace-gas detection in applications such as environmental monitoring, automotive emissions, medical and health diagnostics, and industrial process control and safety.
The choice of acoustic detector determines the operational mode of a PAS system, which can be either resonant or non-resonant, and it significantly influences performance metrics, including bandwidth, dynamic range, and robustness. Considerable research has focused on resonant detection schemes, such as quartz tuning forks (QEPAS) [3] and cantilevers (CEPAS) [4,5,6], which provide high sensitivity by exploiting mechanical resonance. Other approaches include piezoelectric resonators and micro-resonators, which similarly rely on resonance effects. While such detectors achieve sensitivities in the ppb range, they are inherently limited by narrow bandwidths, fragile structures, environmental disturbances and complex readout requirements, posing a real challenge to cost-effective commercialisation [7,8]. In contrast, non-resonant systems offer broader frequency response, improved robustness, and reduced sensitivity to imperfections, making them more suitable for miniaturised and commercial devices. Commercial MEMS microphones have been widely adopted in this context due to their broadband response, small size, and low cost [9]. However, their low-frequency (a few tens of Hz) performance remains limited, constraining their application in non-resonant PAS.
Non-resonant PAS requires high optical power sources to compensate for the absence of acoustic resonance. While lasers offer high modulation depth and stable output, most compact systems rely on thermal emitters, which behave as blackbody sources and are limited by their modulation speed. Commercial MEMS microphones, typically optimised for the audio range (20 Hz–20 kHz), deliver good broadband sensitivity but are restricted at low frequencies [10,11,12,13], which are particularly relevant for non-resonant PAS. Their performance is further constrained by mechanical damping mechanisms, such as squeeze-film damping [14], which significantly contributes to the overall noise. Since non-resonant PAS relies on the direct conversion of optical energy into acoustic pressure, these limitations restrict the achievable performance in the desired frequency range. Alternative detector technologies that are inherently robust and more sensitive in the low-frequency regime are therefore of significant interest.
Thermal sensors, such as calorimetric and thermal flow sensors, provide a promising alternative for low-frequency acoustic detection. Thermal flow sensors transduce pressure-driven flow or particle velocity into a temperature signal using highly sensitive thermal elements, and can be fabricated via MEMS processes with no moving parts, providing enhanced robustness [15]. Their sensitivity can be tailored through surface micro-machining, enabling favourable broadband and low-frequency performance, as demonstrated in particle velocity sensing applications [16,17,18]. To address the limitations of MEMS microphones in non-resonant PAS, we previously developed a MEMS fluidic microphone based entirely on thermal transduction [19]. This device exhibited a flat infrasound response, indicating its potential as a robust, miniaturised acoustic sensor for PAS. Building on this foundation, the present work validates the feasibility of integrating this sensor into a non-resonant PAS system for gas detection.
was used as a test gas due to its availability, ease of handling and non-toxic behaviour. We utilise a laser-based setup due to its multiple advantages over other thermal IR emitters. To achieve the goal of investigating detector performance, a laser allows for high power with high modulation depths. This allows for a systematic and more accurate characterisation of the detector in a PAS system. Firstly, we present the operating principle and acoustic characterisation results for the fluidic mic. Given its limited frequency bandwidth and superior performance in the low-frequency range, we opted for a non-resonant PAS configuration. Secondly, we provide a comparison of the PAS concept when integrated with a commercial microphone versus a fluidic microphone. Then, we develop a detailed analytical model that accounts for all frequency-dependent effects that are crucial for system design and optimisation. We also outline the key considerations necessary for designing a detector cell to achieve optimal sensor integration. A detailed experimental investigation of the system’s performance is presented, focusing on dependence on various design and physical parameters, including the frequency response and cell volume design. Finally, we discuss the long-term stability of the system, highlighting its performance limits, followed by a summary of our findings and future research directions.
2. Theory
2.1. The Fluidic Microphone as PA Detector
The fluidic microphone, used as an acoustic detector, differs from the traditional capacitive microphone in several ways. The traditional microphone directly measures the PA pressure and converts it into a voltage signal. However, the fluidic microphone relies on the generation of an acoustic flux due to the PA pressure. This flux ultimately creates temperature oscillations through convective heat transfer, which are then converted to voltage due to the Seebeck effect at the right thermopile (TPR). The electrical symbol with the cross-sectional view indicating all the components of the fluidic microphone is displayed in Figure 1. The top-view image of the chip design used in this work is also shown.
The sensor is characterised acoustically using the measurement setup published previously [19] to extract the sensitivity and the frequency response. The results are shown in Figure 2. For a heater current of 2 mA, a sensitivity of -90 dBV/Pa (or 32 µV/Pa) is achieved. More importantly, the sensor shows a flat frequency response below 20 Hz, unlike a membrane-based capacitive microphone. Noise measurements show a strong noise behaviour, as expected due to the thermal components. For a 20 Hz acoustic signal, the noise is -140 dB V/, which converts into an SNR of approximately 50 dB. The sensitivity dependence on the acoustic pressure and the heater temperature can be expressed as
2.1.1. Acoustic vs Photoacoustic Pressure Detection
In conventional acoustics, pressure fluctuations result from longitudinal waves, creating symmetric deviations around equilibrium pressure. For instance, a loudspeaker produces a sinusoidal pressure wave through mechanical displacement, leading to an oscillatory flow with a zero time-average. In contrast, photoacoustic pressure in gases comes from the absorption of modulated optical radiation, which causes localised heating and thermal expansion. This process creates an asymmetric waveform, typically featuring a sharp rise during illumination and a slower thermal relaxation, resulting in primarily positive excursions with a non-zero time-average. The fluidic microphone responds differently to this distinction. For an acoustic pressure, the output signal is generated at double the acoustic frequency given by . In contrast, for PA pressure, the output is detected as a thermopile voltage at the infrared modulation frequency expressed as . This explains the quadratic dependence of its sensitivity on the acoustic pressure as mentioned above in Equation 1.
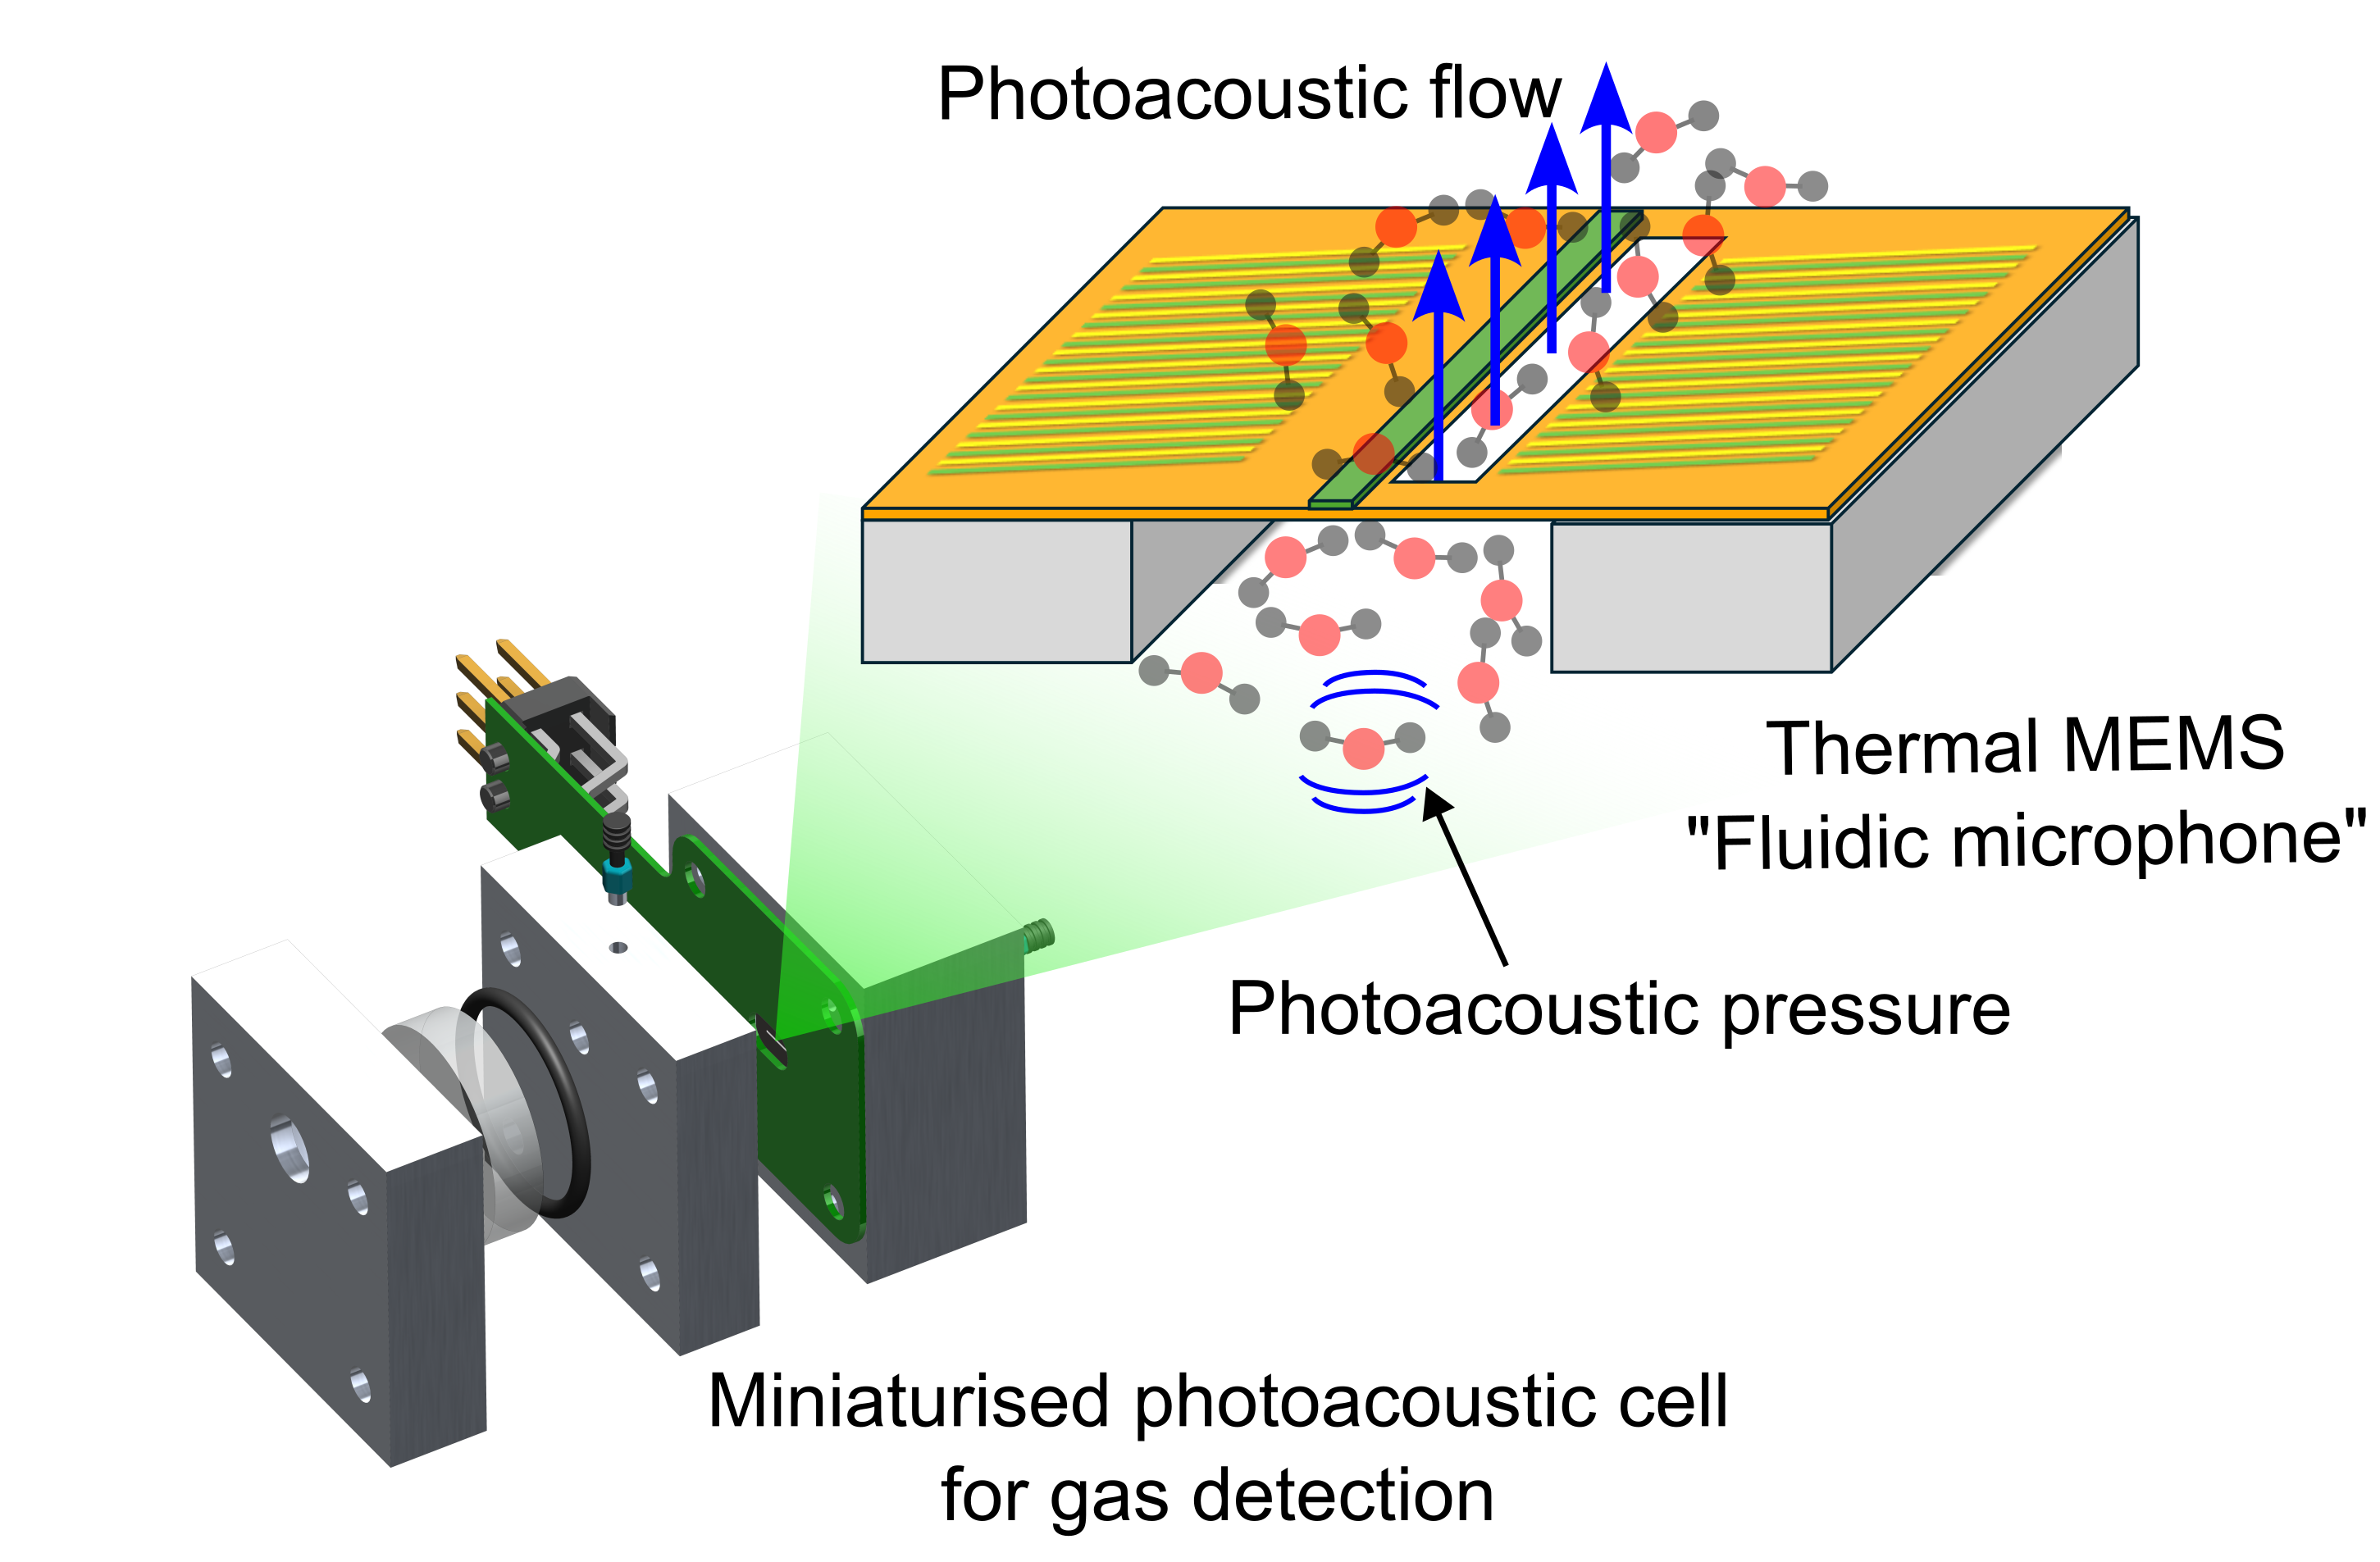
In Figure 3, a comparison of the integration of the fluidic microphone and a commercial microphone in a PA detector cell is shown. The commercial microphone can be directly sealed inside a small volume consisting of the target gas. On the other hand, the fluidic microphone, which relies on flow detection, requires two volumes: the active volume and the passive volume. The PA pressure is generated in the active volume, which generates a flow through the micro-perforation to the passive volume. In this way, the integration of these two sensors inside a detector cell varies. More importantly, the fluidic microphone is a thermal sensor, which means that its direct interaction with the incident IR radiation must be avoided to prevent additional thermal noise. This is not a significant issue with a commercial microphone.
2.2. Model and Simulation
In this section, an analytical model is developed that incorporates all the critical frequency-dependent effects related to the fluidic microphone-based PAS. This enables us to understand the frequency behaviour of the system and investigate the various physical parameters that affect system performance. Being a multi-physical coupled system, three significant frequency-related effects in the thermal and acoustic domains were modelled to simulate the overall system behaviour. The signal chain consisting of these frequency effects is shown in Figure 4. From the frequency modulated input optical power to the output PA signal measured at the thermopile , all the effects are discussed in detail.
2.2.1. PA Pressure Generation
The input power modulated at a frequency reaches the front volume (in ) of the detector cell containing the target gas. The power is absorbed, resulting in the generation of pressure due to the photoacoustic effect widely expressed as [20]
are the adiabatic constant, mole fraction, and the absorption coefficient (in ) of the gas, respectively. is the absorbed IR power inside the PA cell and is expressed using Beer-Lambert’s law [21]. This can be used to derive the amplitude of the PA pressure as
where is the optical power (in W) reaching the detector cell. (s) represents the time constant for the thermal losses involved in the pressure generation. These losses depend on the difference in thermal conductivities between the gas and the detector cell, as well as the thermal mass of the sealed gas volume. This conversion process behaves like a damped first-order low-pass electrical filter, implying that below a certain frequency , gas has sufficient time to heat, and hence, the PA pressure generation is the highest. As derived in [6], increases quadratically with the radius of the detector cell and can be expressed as
where depends on the geometry of the cell and will be experimentally extracted in this work. Finally, Equation 3 can be rewritten as
2.2.2. Acoustic-Flux Generation
This effect is specific to the fluidic microphone and is one of the most significant factors in determining its sensitivity. The generated PA pressure in the front volume creates a pressure difference across the perforation in the membrane. This leads to an oscillating volume flow (or flux) through the perforation, which generates a convective cooling effect at the TPR and the heater at the frequency of IR modulation. The goal is to maximise this flux for a certain PA pressure to achieve high sensitivity.
In terms of a mechanical analogy, the flux behaviour is comparable to an oscillating mass connected between two hinged springs. In the acoustic domain, this corresponds to the mass of the air oscillating between the acoustic compliances of the front and back volumes. The effective compliance of such a system can be expressed as the parallel combination of the front volume and the back volume compliance as
This can be further expressed in terms of volume by using the compliance from the literature as [22] ( is the density and c is the speed of sound in the sealed gas mixture)
The flux is calculated using the total acoustic impedance of the system, given as
is the viscous resistance offered by the perforation. Now, the magnitude of the flux can be written as
Now, from Equation 9, 5, and using the values of the and the from [22], the flux velocity is expressed as
where
This means that and are two of the most critical design parameters for the fluidic microphone, determining the dynamic response and sensitivity of the PA system. The output PA signal and depend linearly with and inversely with the .
2.2.3. Thermopile Detection
The generated flux cools the hot contact of the TPR due to forced convective heat transfer, creating an oscillation in the heat flux. These oscillations are converted into temperature oscillations, which can be eventually read out as a differential Seebeck voltage. This is the final output signal, also known as the photoacoustic signal. However, due to the thermal mass of the fluidic microphone, the conversion from heat to temperature behaves like a low-pass filter. The corresponding time constant depends the microphone’s thermal mass as . This effect can be expressed using a transfer function of a first-order low-pass filter [23] as
where are the operating temperature of the heater and the number of thermo-elements contributing to the Seebeck voltage (20 in this work). On combining all the frequency effects, the PA signal is expressed as
where , and are used as the fitting parameters. From Equation 16, the dependence of the photoacoustic signal on different system and design parameters of the detector cell and the fluidic microphone can be derived. The different frequency effects, using the parameters listed in Table 1 are plotted in Figure 5.
The simulation results show that the output PA signal exhibits broadband behaviour where the thermal leakage cutoff frequency determines the lower limit, and the thermal mass of the chip determines the upper limit. However, the signal amplitude at a constant frequency depends on the perforation area and the effective volume. These parameters can be used to control the frequency response for the desired operational bandwidth, providing flexibility in tuning system performance.
3. Materials and Methods
3.1. IR Absorption and Laser Selection
gas strongly absorbs IR in the 4 – 4.4μm wavelength range. The simulated IR absorption lines for gas at 295 K and 1 atm are shown in Figure 6. The data was taken from the HITRAN database [24]. The selection of the optical excitation source is a critical factor in PA gas sensing. Therefore, to target this strongly absorbing region, a specially optimised Distributed Feedback (DFB) laser from Nanoplus GmbH is used as the IR source. The laser is integrated into a housing that includes a collimator and a thermo-electric cooler (TEC) for temperature control. The emission characteristics of the laser, such as the emitted wavelength and the output power , are both dependent on the supplied current. This dependence is shown in Figure 7. The output power of the laser as well as the wavelength increase with the input current. The drop in the laser power is due to the presence of in the atmosphere during its characterisation, as confirmed by the manufacturer. Hence, to achieve optimal performance and maximum sensitivity, we operate the laser using a current that targets the IR line near 4228 nm. The operating current will be extracted experimentally, as it can depend on several external factors such as the geometry of the PA cell and the measurement conditions.
3.2. Detector Cell
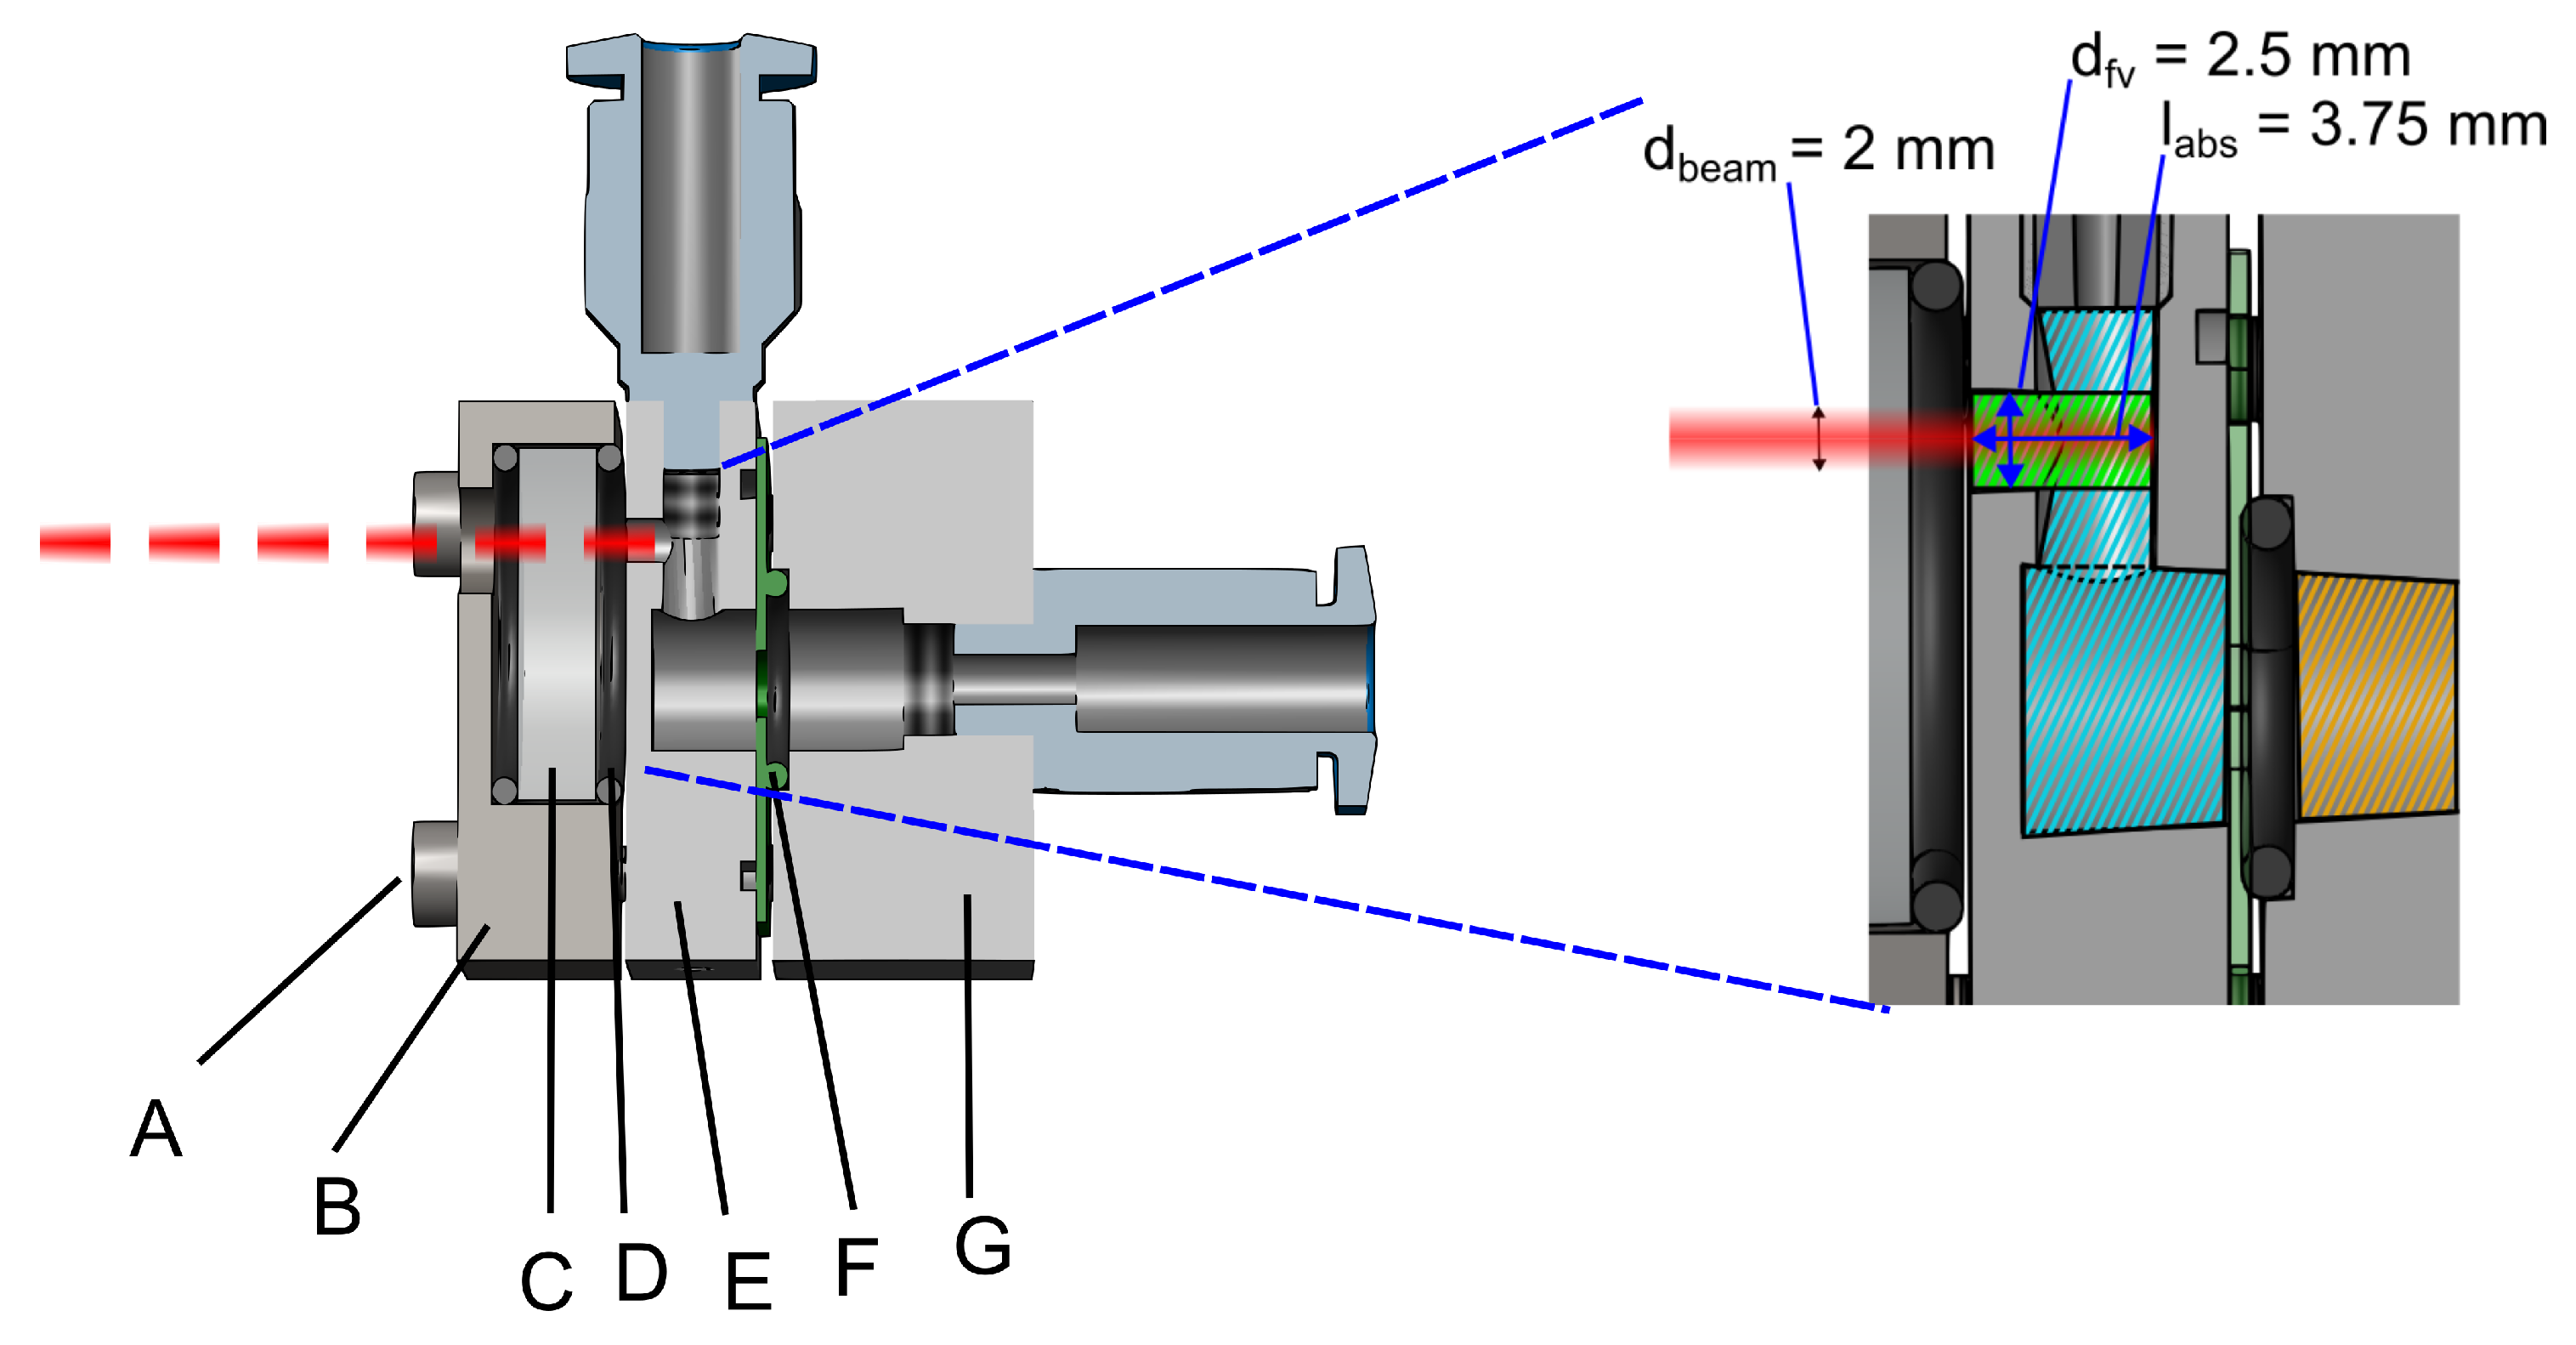
The design of the detector cell, integrated with the fluidic microphone, is the main focus of this work. Various design factors and limitations were considered to optimise the performance of the PAS system. The main challenge was the direct interaction of the laser beam with the fluidic microphone. As a thermal sensor, it can absorb IR radiation, resulting in high thermal noise levels, eventually reducing its sensitivity to detect low gas concentrations. To avoid this, we used a lateral cavity approach as shown in Figure 8. The cross-sectional view of the detector cell, marked with all relevant dimensions, is also shown. The front volume is a cylinder with diameter mm and mm. The dimensions are chosen to maintain a small front volume while coupling the laser beam with a mm diameter inside the cell. There is some additional volume referred to as the dead volume . As explained via the model, the fluidic microphone requires a well-defined back volume that facilitates the transmission of the photoacoustic flow through the perforation, thereby generating a maximum convective cooling effect and leading to a high output signal at the TPR. Therefore, a combination of tubes and valves is used to vary the back volume in experiments easily. The gas mixture is allowed to flow through the perforation on the sensor and manually sealed for gas concentration measurements.
Figure 8.
3D model and the exploded view of the detector cell.
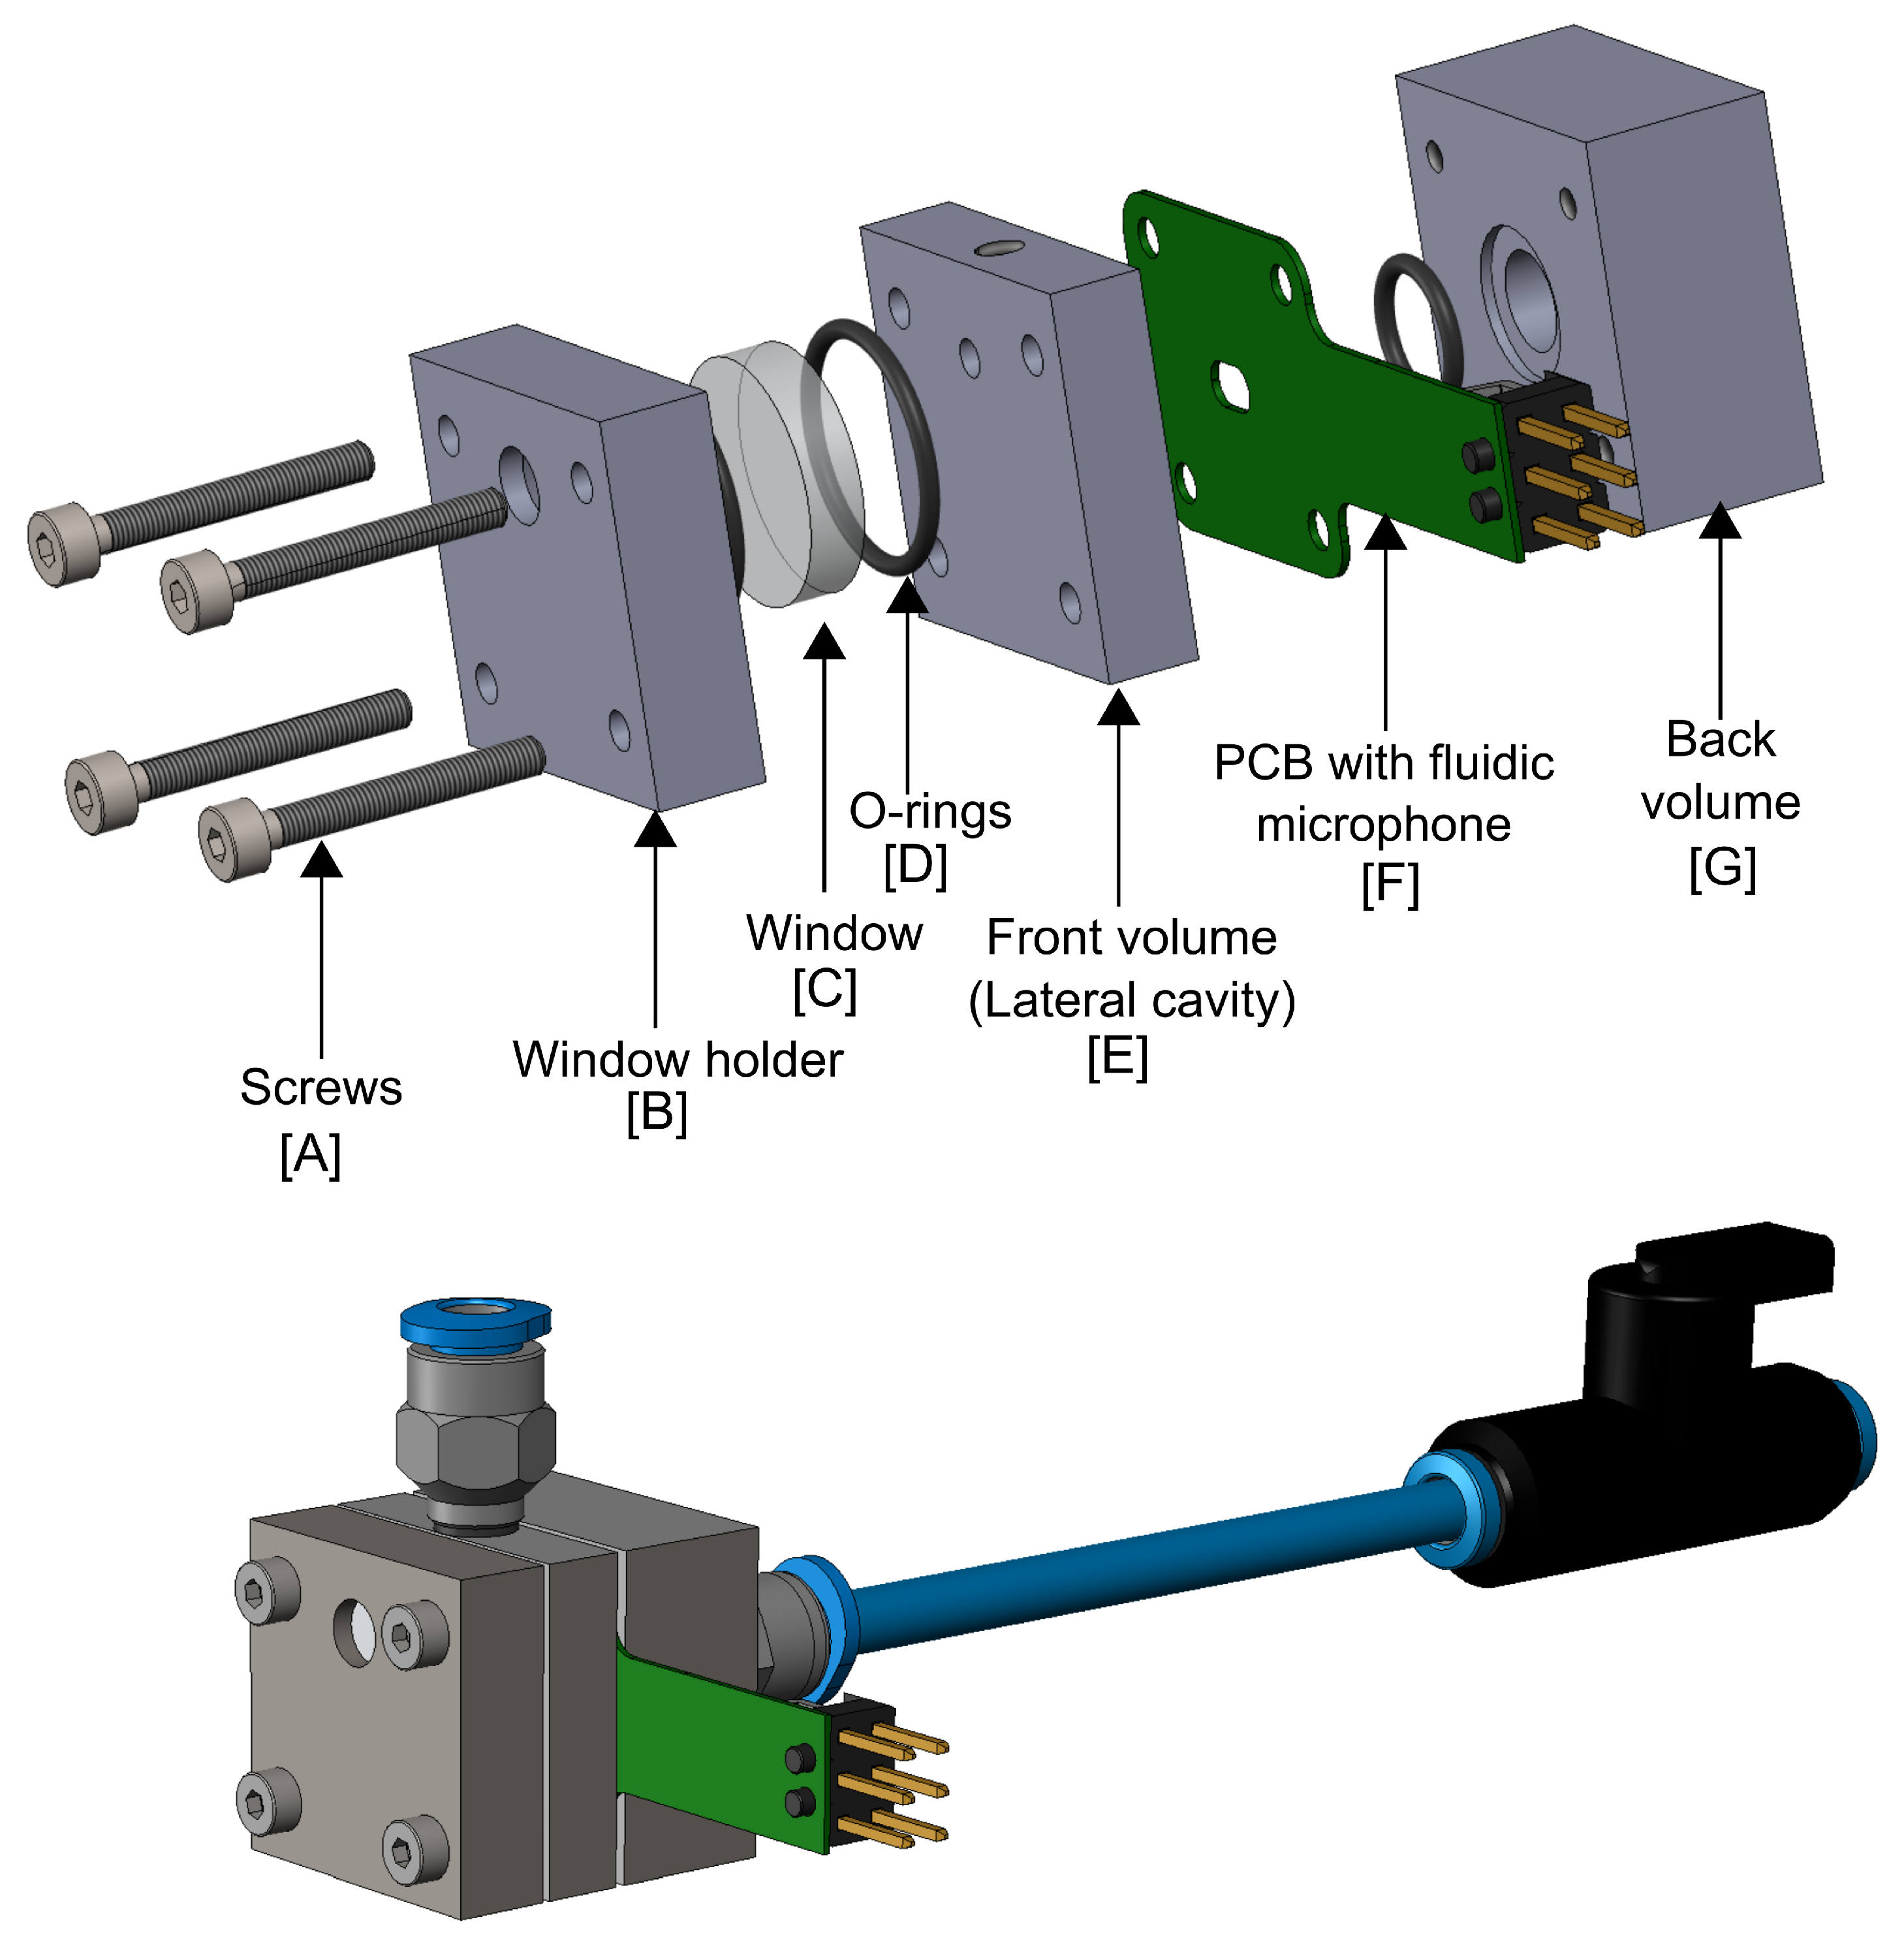
Figure 9.
Cross-section and inner dimensions of the detector cell. Green area is the front (active) volume, blue is the dead volume contributing to the thermal leakage and orange is the back (passive) volume.
Figure 9.
Cross-section and inner dimensions of the detector cell. Green area is the front (active) volume, blue is the dead volume contributing to the thermal leakage and orange is the back (passive) volume.
3.3. Measurement Setup
The entire measurement setup is shown in Figure 10. The laser is operated using a constant current under controlled temperature conditions. This is achieved using a laser current driver (KLD101) and a temperature controller (TTC001) from Thorlabs GmbH. An optical chopper is used to modulate the frequency of the collimated laser beam mechanically in the range of 3 Hz to 3 kHz. The detector cell and the chopper are optically aligned with the laser beam on an optical bench. A lock-in amplifier from Zurich Instruments AG is used to control the chopper frequency and simultaneously to measure the photoacoustic signal from the thermopile. The component of the TPR voltage at the chopper frequency is demodulated. The heater on the fluidic microphone operates in constant current mode at 2.5 mA using a source and measurement unit (SMU) from Keithley Instruments.
The gas mixing setup consists of two mass flow controllers (SFC5500) from Sensirion AG, which are calibrated for 100% . 5000 ppm of is diluted with pure while keeping the total flow rate constant to 50 ml/min (cm3/min). A low flow rate is crucial for gas filling inside the detector cell to prevent any damage that can be caused to the MEMS sensor due to the gas flowing through the chip membrane. The gas flows from the inlet through the chip to the outlet, thoroughly flushing the system and maintaining a constant concentration inside the cell. The valves are controlled manually, but special care is taken to avoid overpressure inside the cell by first closing the input valve and then the outlet valve.
4. Results and Discussion
4.1. Laser Emission Line Sweep
This measurement was performed to determine the optimum operating current for the laser, where the laser emission and absorption lines align, thereby achieving the maximum possible sensitivity and minimising the impact from other interfering gases. We swept the current from 80 to 101 mA in steps of 1 mA, at a constant temperature of 15°C. The detector cell was sealed with 5000 ppm , and the TP signal was continuously recorded at a chopper frequency of 40 Hz. The results are plotted in Figure 11. As expected, the PAS signal increases when the laser matches the absorption lines. The first peak near 80 mA is slightly lower than the second peak near 100 mA. This is due to the difference in the line intensities as shown in Figure 14. For maximum sensitivity, we chose 98.2 mA as the laser current for all further measurements.
4.2. Optimal Modulation Frequency
The frequency response of the PA signal was measured by varying the chopper frequency from 2 to 200 Hz and continuously recording the PA signal. This was done to validate the simulated frequency behaviour and to determine the frequency at which the maximum signal is obtained, thereby achieving the maximum possible SNR. The measurements were performed at 5000 ppm , a back volume of 0.5 ml, and a laser current of 98.2 mA. The measurements were repeated three times under similar environmental conditions to verify the accuracy and reproducibility of the results, as well as the error introduced by the manual gas sealing process.
As seen from the measurement results in Figure 12, the curves overlap, with a peak close to 70 Hz indicating good repeatability and reliability of the experimental data. The Equation 16 was used to fit the measured data with fit parameters as , /Pa, . The increased value of signifies the underestimation in the calculated front volume by neglecting the gas volume in the valve and the non-illuminated dead volume. The increased value of signifies a more substantial thermal leakage effect due to the uneven geometry and operation in the boundary layers. This was ignored in the model.
4.3. Back Volume Dependence
The dependence of the PA signal on the effective volume was validated experimentally. This was achieved by varying the back volume to four different values from BV1 = 0.25 cm3 (250 μl), BV2 = 0.47 cm3, BV3 = 8.64 cm3, BV4 = 53.47 cm3, which indirectly increased the effective volume (refer to Equation 8). The PA signal was measured and averaged over 200 s for each point while keeping the other parameters constant. The results, plotted in Figure 13a, show a linear dependence of the PA signal with as expected from Equation 8. The PA signal increases linearly at first and then saturates for high back volume or the effective volume. This suggests that the front volume will limit the performance of the PA system; hence, an appropriately sized back volume would yield the highest signal with the smallest possible system size. These results highlight the importance of the volume design in a fluidic microphone integrated PAS cell.
4.4. Heater Power Sweep
The heater power is varied from 3 to 14 mW by increasing the heater current from 0.5 to 3 mA. This increases the heater operating temperature from ambient ( 20°C) up to 200 °C. The PA signal is continuously recorded at all operating conditions and parameters, which are held constant throughout the measurement. The results are plotted in Figure 13b. We observe a linear increase in the output voltage because the sensitivity of the fluidic microphone increases linearly within this temperature range, thus increasing the PA signal, as also expected from the theoretical model (ref. Equation 16).
4.5. Gas Concentration Measurements
Gas measurements were performed to investigate the system’s sensitivity and potential for detection. We varied the gas concentration in steps of 1000 ppm and recorded the PA signal by averaging the data for 200 s for each step. The measurements were performed at 68 Hz, a heater current of 2.5 mA, and a back volume of 0.5 ml. The gas concentration change was performed manually as explained previously. The system exhibited a linear response up to 5000 ppm, as expected from theory and validated by a linear fit shown in Figure 14. The standard deviation per point was less than 0.1 μV. A concentration of 1000 ppm of the gas can be easily detected with higher than accuracy with a sensitivity of 6 nV/ppm and lower concentrations up-to 250 ppm could be detected with good accuracy. The sensitivity of the microphone should be increased to detect even lower gas concentration.
4.6. Allan Variance and Long-Term Stability
Two parameters, namely the minimum detection limit (MDL) and the normalised noise equivalent absorption (NNEA), can be used to evaluate the performance of any PAS system. The MDL represents the minimum gas concentration that the system can detect, while the NNEA quantifies the sensor’s performance independently of the laser power, gas line absorption strength, and equivalent noise bandwidth of the lock-in amplifier, thus allowing for the comparison of different PAS systems even when the test conditions are not identical. The NNEA is expressed as [25]
where is the minimum detectable absorption coefficient of the gas absorption line in , P is the optical power in W, and is the detection bandwidth in Hz, usually decided by the lock-in amplifier. The Allan variance plotted in Figure 15a indicates a strong dependence on the 1/f noise as expected. A gas concentration of around 300 ppb can be measured after an integration time of 100 seconds, and approximately 4 ppm at 1 second. However, the system shows a theoretical MDL of 10 ppb after 50 min.
From the measurements, the system shows a signal of 0.8 μ V for 100% sealed in the detector cell, which defines the noise level of the system. This corresponds to the detection limit of approximately 130 ppm, given the system sensitivity of 6 nV/ppm. The strong noise level is due to the thermal effects of IR absorption by the optical window and the cell walls. Using these values, the NNEA is calculated to be approximately W for our system.
For the long-term stability of the system, the PA signal for 5000 ppm over a period of 2.8 hours was measured, and the data is plotted in Figure 15b. The signal exhibits a slight drift, which may be attributed to gas leaking out of the detector cell at a rate of 0.1-0.2 ppm/min, thereby compromising system stability over the long term. To avoid this in the future, we plan to use a hermetically sealed system that does not utilise the PCB or other lab-based components. The random, noisy peaks in the signal are due to chopper frequency instability, which were carefully filtered out in the data processing for all measurements performed in this work. This drift, together with the high noise level attributed to thermal effects, limits the system’s ability to achieve the theoretically extracted detection limit. This will be improved in the future, as this lies outside the scope of this work, which was to understand the interplay between the different design parameters affecting the integration of the fluidic microphone in the Photoacoustic gas sensing application.
5. Conclusions
This work investigates and successfully validates the feasibility of a novel MEMS fluidic microphone for a non-resonant photoacoustic gas sensing application. The fluidic microphone is based on a thermal sensing principle and measures a PA pressure-generated flux via on-chip perforation, unlike commercial capacitive microphones, which detect PA pressure directly. The primary objective is to develop a MEMS acoustic sensor that performs better in the infrasound regime, where non-resonant systems typically excel. The fluidic microphone exhibits an acoustic sensitivity of 32 μV/Pa, which remains constant for Hz. SNR of 50 dB at 1 Pa, 20 Hz is extracted via acoustic measurements. The integration in a PA cell requires a precisely designed dual-volume system (front and back) for optimal performance.
The performance of the fluidic microphone integrated PA cell is explained using a detailed analytical model that includes all the critical frequency behaviours involved in the system. The system exhibits a broad-band frequency response, with the thermal sensor design, perforation geometry, cell radius, and gas volume influencing the system bandwidth and signal amplitude. For experimental analysis, a PA detector cell (18 μl volume) is designed utilising a lateral cavity approach that provides special consideration for IR interaction with the fluidic microphone. PA measurements are performed using a DFB laser operating at approximately 4228 nm, corresponding to a strong absorption line for gas. Firstly, the optimal operation point for the laser is extracted by performing a current sweep for 5000 ppm of . Secondly, the optimal modulation frequency for the system, approximately 68 Hz, is determined through frequency sweep measurements. The results are fitted to the analytical model to extract specific fit parameters that account for the thermal diffusion effects and the frequency-independent terms. Gas concentration in 1000 ppm steps is easily resolved with a sensitivity of 6 nV/ppm, with the potential to resolve even lower concentrations, down to 250 ppm, with reasonable accuracy. The system shows a linear dependence on the effective volume (a parallel combination of the front and back volumes), as well as the heater temperature. Ultimately, long-term PA measurements are performed, revealing a slight drift in the PA signal, which accounts for the system’s long-term instability due to gas leakage and chopper instability. Allan deviation analysis shows a theoretical limit of detection of 300 ppb in 100 seconds. However, from the measurements, an offset signal (noise) corresponding to around 130 ppm is measured with gas, possibly due to the thermal effects arising from the window absorption and wall heating.
In this work, we presented the impact of all the relevant design parameters on the performance of the fluidic microphone in PA gas sensing applications. The novel detection principle shows significant potential for robust, miniaturised PA gas sensing. In-house fabrication enables flexible system integration while providing the benefit of tunable performance, which is particularly valuable for implementation in various applications. It also provides a cost-effective and commercially viable solution to minimise reliance on traditional MEMS microphones. The sensitivity of the fluidic microphone currently limits the sensitivity of the PA system and will be improved in the future. The cell design will be modified to prevent any gas leakage and to minimise the impact of the window IR absorption on the noise. The effect of variations in gas density, thermal conductivity, and dynamic viscosity resulting from changes in gas concentration on the performance of the fluidic microphone will be investigated in the future.
Funding
Innovative Sensor Technology (iST AG), Switzerland, funded this research.
Data Availability Statement
Not applicable.
Acknowledgments
Not applicable.
Conflicts of Interest
The authors declare no conflict of interest.
Abbreviations
The following abbreviations are used in this manuscript:
| PAS | Photoacoustic Sensing |
| MEMS | Micro electro-mechanical system |
| IR | Infrared |
| PA | Photoacoustic |
| SNR | Signal to noise ratio |
| NNEA | Normalised noise equivalent absorption |
| TPR | Right thermopile |
| Carbon-dioxide | |
| Nitrogen |
References
- Fathy, A.; Sabry, Y.M.; Hunter, I.W.; Khalil, D.; Bourouina, T. Direct Absorption and Photoacoustic Spectroscopy for Gas Sensing and Analysis: A Critical Review. Laser & Photonics Reviews 2022, 16, 2100556. [Google Scholar] [CrossRef]
- Hodgkinson, J.; Tatam, R.P. Optical gas sensing: a review. Measurement science and technology 2012, 24, 012004. [Google Scholar] [CrossRef]
- Kosterev, A.A.; Bakhirkin, Y.A.; Curl, R.F.; Tittel, F.K. Quartz-enhanced photoacoustic spectroscopy. Optics letters 2002, 27, 1902–1904. [Google Scholar] [CrossRef] [PubMed]
- Kauppinen, J.; Wilcken, K.; Kauppinen, I.; Koskinen, V. High sensitivity in gas analysis with photoacoustic detection. Microchemical journal 2004, 76, 151–159. [Google Scholar] [CrossRef]
- Yin, Y.; Ren, D.; Li, C.; Chen, R.; Shi, J. Cantilever-enhanced photoacoustic spectroscopy for gas sensing: A comparison of different displacement detection methods. Photoacoustics 2022, 28, 100423. [Google Scholar] [CrossRef] [PubMed]
- Kuusela, T.; Kauppinen, J. Photoacoustic Gas Analysis Using Interferometric Cantilever Microphone. Applied Spectroscopy Reviews 2007, 42, 443–474. [Google Scholar] [CrossRef]
- Sun, B.; Li, Y.; Gao, Z.; Zhang, M. Quartz-enhanced photoacoustic spectroscopy for SF6 gas matrix based on a T-shaped quartz tuning fork. Frontiers in Physics 2025, 13, 2025. [Google Scholar] [CrossRef]
- Ma, Y. Review of Recent Advances in QEPAS-Based Trace Gas Sensing. Applied Sciences 2018, 8. [Google Scholar] [CrossRef]
- Infineon Technologies, AG. XENSIV™ PAS CO2 Sensor Based on Photoacoustic Spectroscopy. Infineon Technologies AG, 2023. Version 1.0.
- Shubham, S.; Seo, Y.; Naderyan, V.; Song, X.; Frank, A.J.; Johnson, J.T.M.G.; da Silva, M.; Pedersen, M. A Novel MEMS Capacitive Microphone with Semiconstrained Diaphragm Supported with Center and Peripheral Backplate Protrusions. Micromachines 2022, 13. [Google Scholar] [CrossRef] [PubMed]
- Dehé, A.; Wurzer, M.; Füldner, M.; Krumbein, U. The Infineon Silicon MEMS Microphone. 2013.
- Shubham, S.; Nawaz, M.; Song, X.; Seo, Y.; Zaman, M.F.; Kuntzman, M.L.; Pedersen, M. A behavioral nonlinear modeling implementation for MEMS capacitive microphones. Sensors and Actuators A: Physical 2024, 371, 115294. [Google Scholar] [CrossRef]
- Peña-García, N.N.; Aguilera-Cortés, L.A.; González-Palacios, M.A.; Raskin, J.P.; Herrera-May, A.L. Design and Modeling of a MEMS Dual-Backplate Capacitive Microphone with Spring-Supported Diaphragm for Mobile Device Applications. Sensors 2018, 18. [Google Scholar] [CrossRef] [PubMed]
- Bao, M.; Yang, H.; Sun, Y.; Wang, Y. Squeeze-film air damping of thick hole-plate. Sensors and actuators A: Physical 2003, 108, 212–217. [Google Scholar] [CrossRef]
- Tas, N.R.; Lammerink, T.S.J.; Leussink, P.J.; Berenschot, J.W.; de Bree, H.E.; Elwenspoek, M.C. Toward thermal flow-sensing with pL/s resolution. In Proceedings of the Micromachined Devices and Components VI; Peeters, E., Paul, O., Eds.; International Society for Optics and Photonics, SPIE, 2000; Vol. 4176, pp. 106–121. [Google Scholar] [CrossRef]
- Li, Z.; Chang, W.; Gao, C.; Hao, Y. A new 3-hot-wire acoustic particle velocity sensor with improved detection capability. Electronics Letters 2019, 55. [Google Scholar] [CrossRef]
- Honschoten, J.; Svetovoy, V.; Krijnen, G.; Elwenspoek, M. Optimization of a thermal flow sensor for acoustic particle velocity measurements. Microelectromechanical Systems, Journal of 2005, 14, 436–443. [Google Scholar] [CrossRef]
- Benvenuti, L.; Catania, A.; Bruschi, P.; Piotto, M. Modeling and optimization of directive acoustical particle velocity sensors for ultrasonic applications. Sensors and Actuators A: Physical 2021, 318, 112504. [Google Scholar] [CrossRef]
- Gupta, A.; Bittner, A.; Dehé, A. Novel Thermal MEMS Dynamic Pressure Sensor. In Proceedings of the 2023 22nd International Conference on Solid-State Sensors, Actuators and Microsystems (Transducers); 2023; pp. 108–111. [Google Scholar]
- Pao, Y.H. Optoacoustic spectroscopy and detection; Elsevier, 2012.
- Ingle, J.; Crouch, S. Spectrochemical Analysis; Number v. 1 in Spectrochemical Analysis, Prentice Hall, 1988.
- Morse, P.M.; Ingard, K.U. Theoretical acoustics; Princeton university press, 1986.
- Gupta, A.; Bittner, A.; Dehe, A. Frequency Dynamics of Micro-Perforated Thermal Sensors: Unlocking Potential in Acoustic Sensing. In Proceedings of the 2025 23rd International Conference on Solid-State Sensors, Actuators and Microsystems (Transducers); 2025; pp. 1748–1751. [Google Scholar] [CrossRef]
- Gordon, I.E.; Rothman, L.S.; Hargreaves, R.J.; Hashemi, R.; Karlovets, E.V.; Skinner, F.M.; Conway, E.K.; Hill, C.; Kochanov, R.V.; Tan, Y.; et al. The HITRAN2020 molecular spectroscopic database. Journal of Quantitative Spectroscopy and Radiative Transfer 2022, 277, 107949. [Google Scholar] [CrossRef]
- Xiong, S.; Yin, X.; Wang, Q.; Xia, J.; Chen, Z.; Lei, H.; Yan, X.; Zhu, A.; Qiu, F.; Chen, B.; et al. Photoacoustic spectroscopy gas detection technology research progress. Applied spectroscopy 2024, 78, 139–158. [Google Scholar] [CrossRef] [PubMed]
Figure 1.
Electrical symbol, descriptive cross-section and microscopic top view of the fluidic microphone. The PA flow through the slit generates a convective cooling at the right TP, leading to an oscillatory voltage signal.
Figure 1.
Electrical symbol, descriptive cross-section and microscopic top view of the fluidic microphone. The PA flow through the slit generates a convective cooling at the right TP, leading to an oscillatory voltage signal.
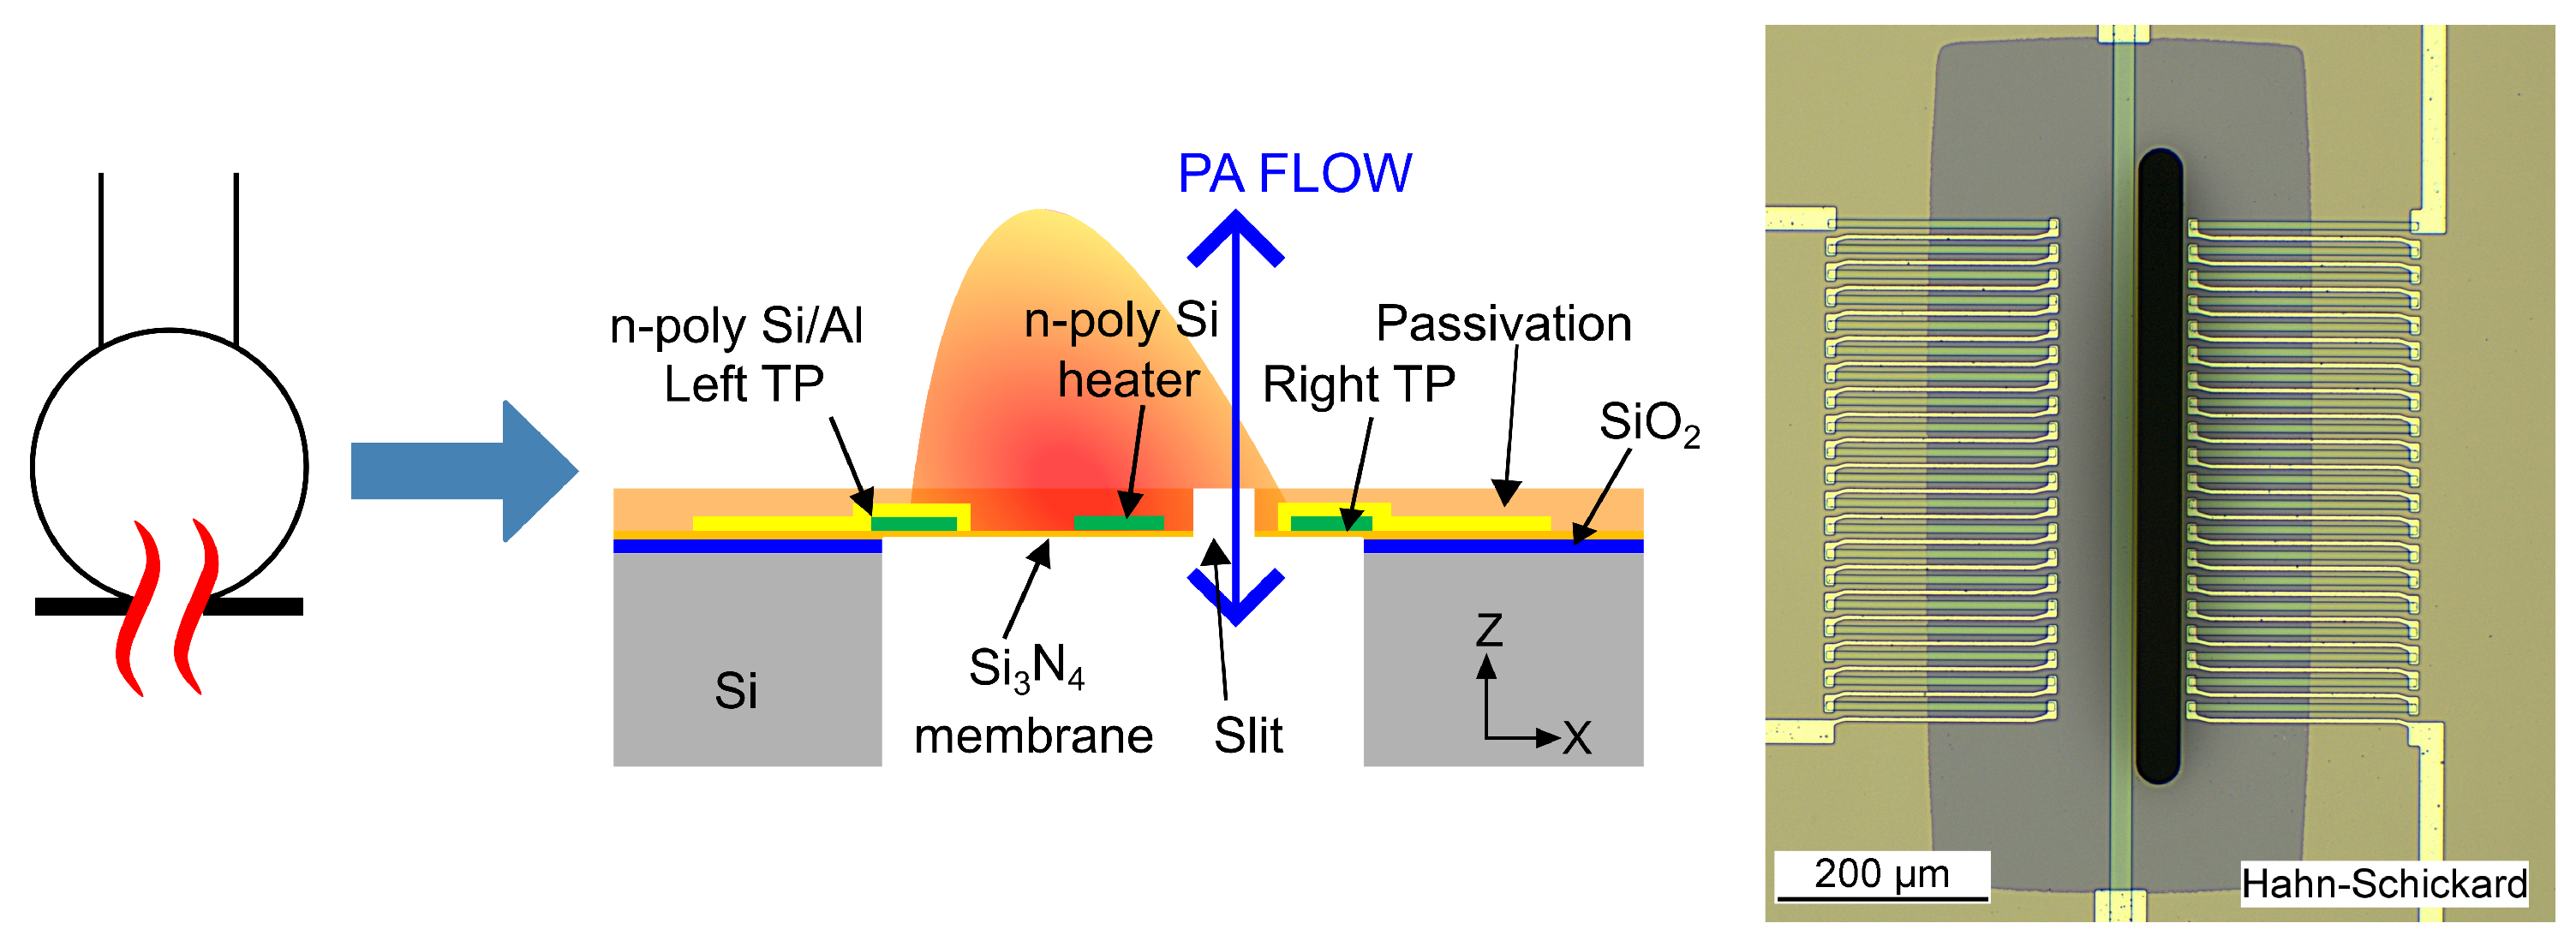
Figure 2.
Acoustic characterisation results for the fluidic microphone. The pressure sweep is measured at a heater current of 2 mA and an acoustic frequency of 20 Hz (). Frequency sweep shows a flat response up to 20 Hz. The noise measurements show a noise of -135 dBV at 20 Hz.
Figure 2.
Acoustic characterisation results for the fluidic microphone. The pressure sweep is measured at a heater current of 2 mA and an acoustic frequency of 20 Hz (). Frequency sweep shows a flat response up to 20 Hz. The noise measurements show a noise of -135 dBV at 20 Hz.
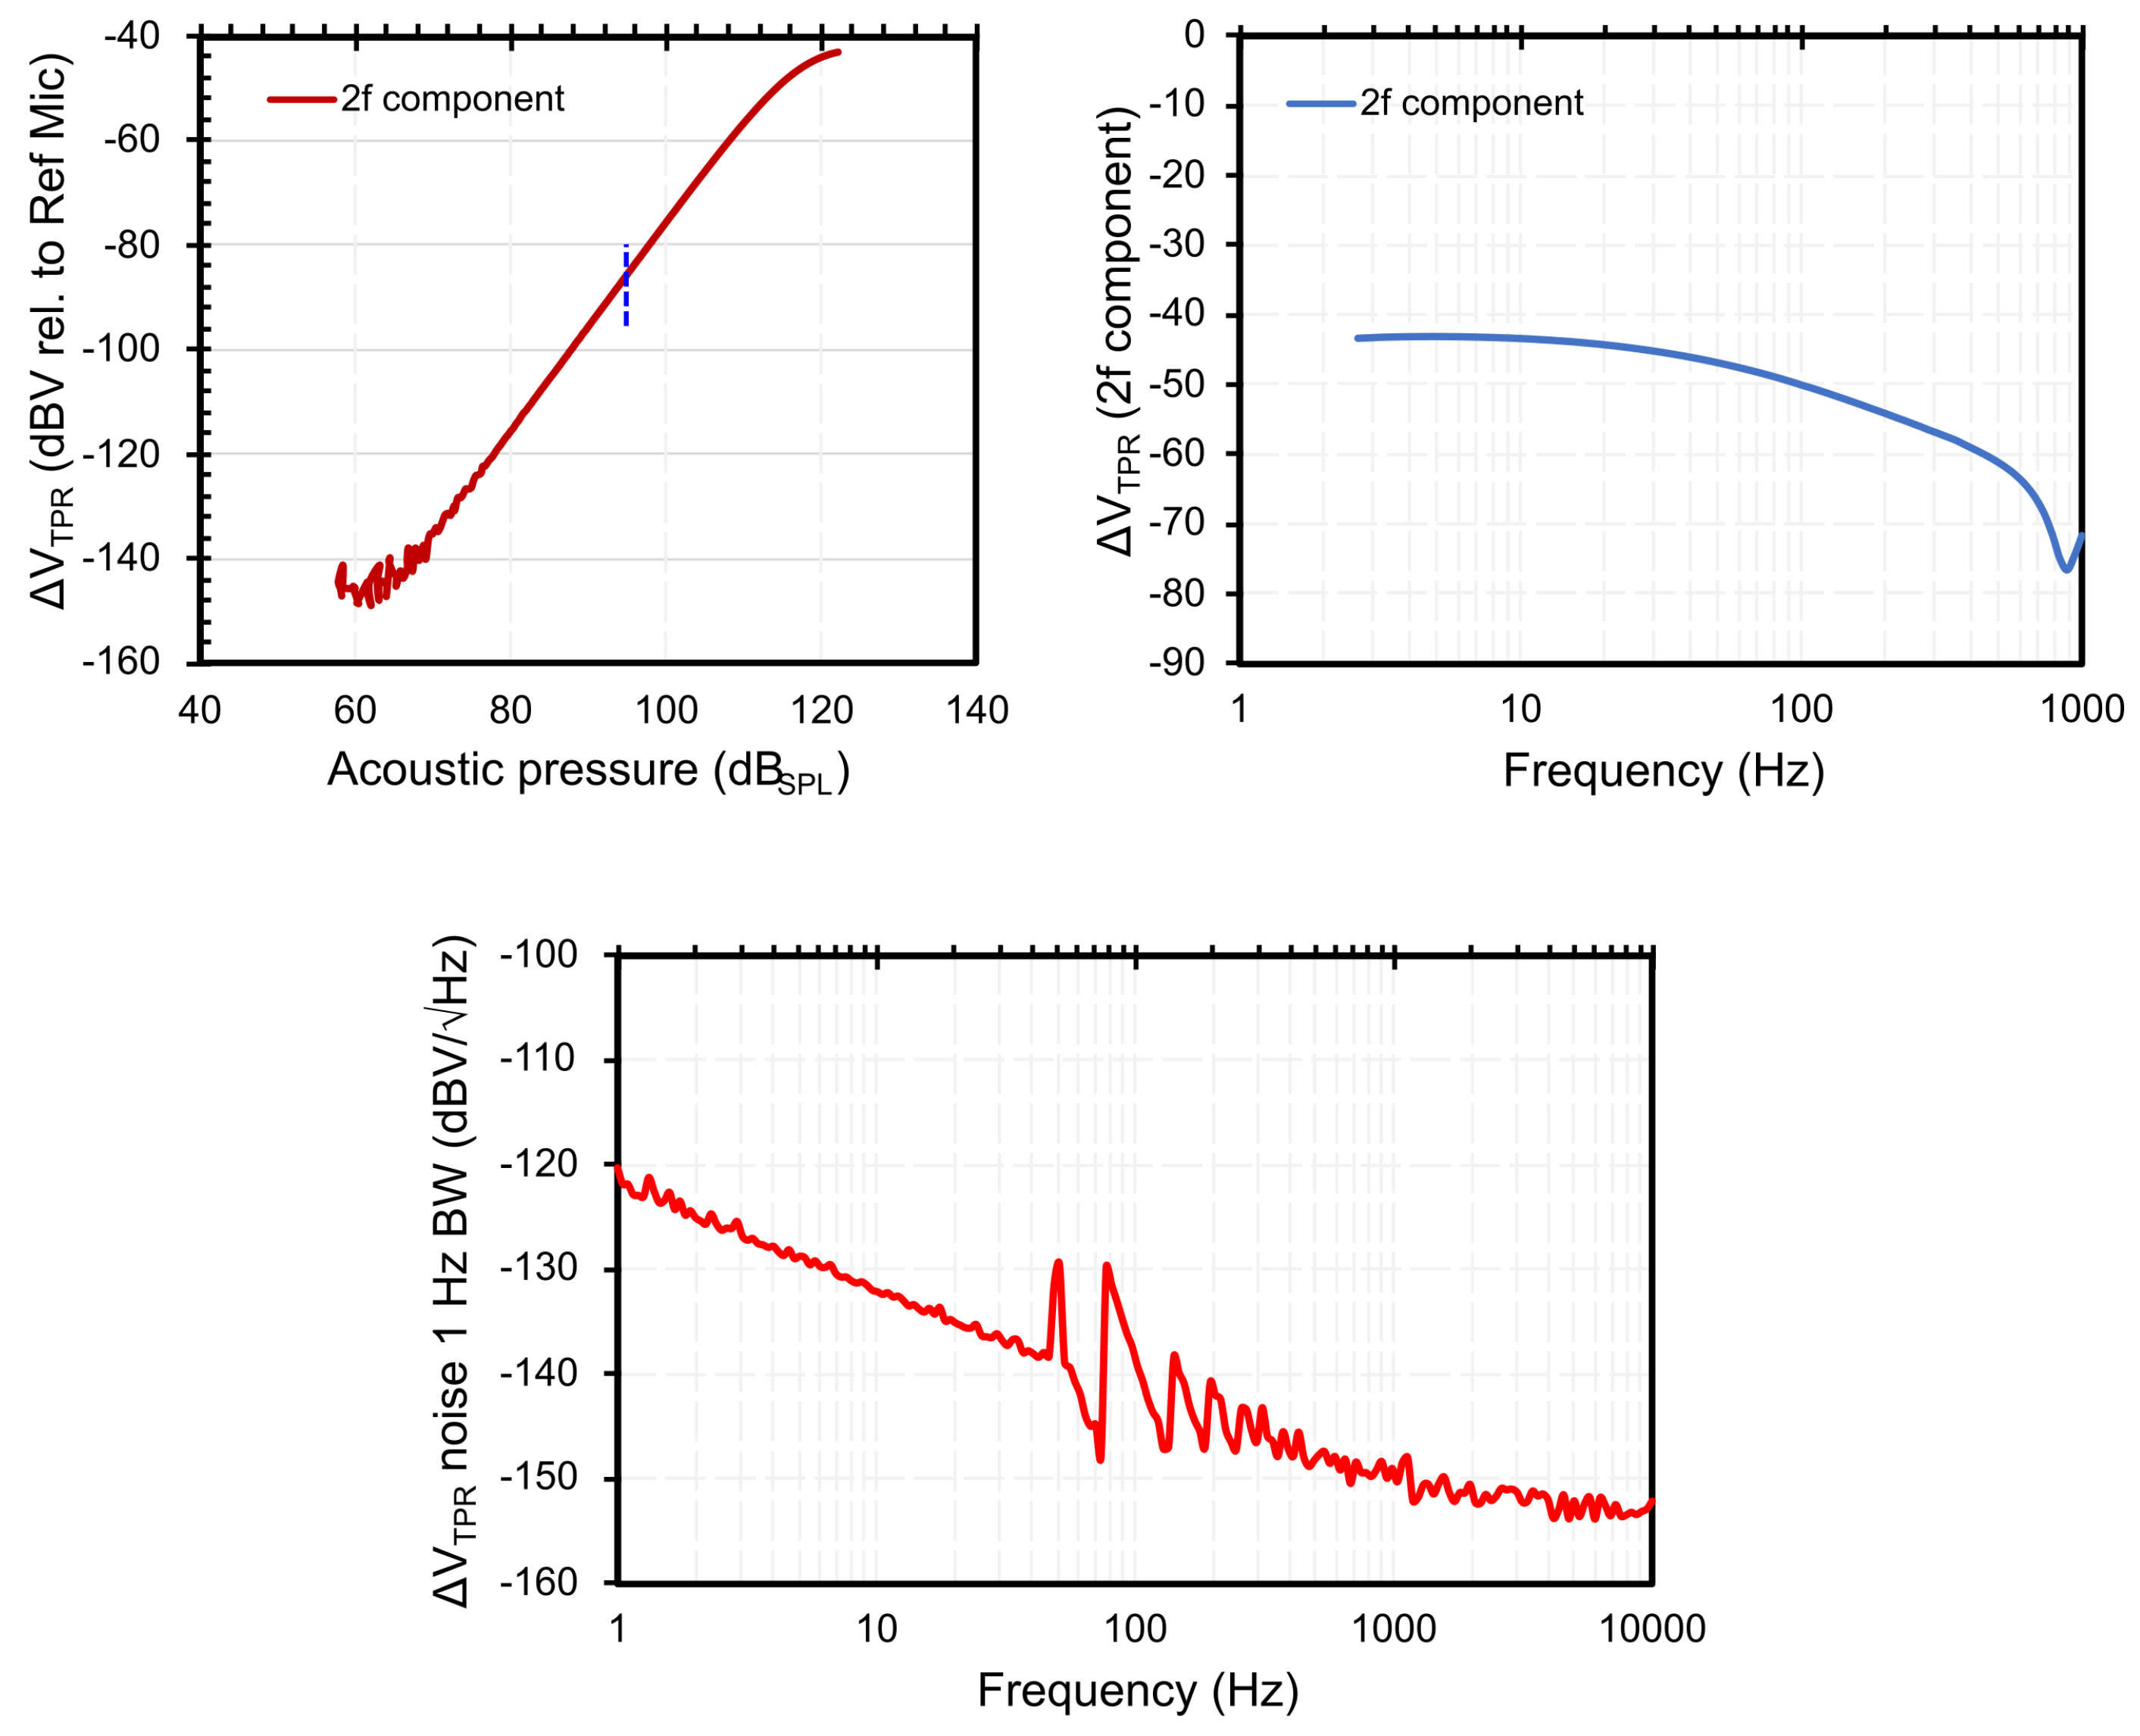
Figure 3.
Photoacoustic pressure detection concept using a conventional microphone (left) vs a fluidic microphone (right). The description is as follows: A = Modulated infrared radiation, B = Optical window, C = Target gas (), D = Active (front) volume, E = PA pressure, F1 = MEMS microphone, F2 = MEMS fluidic microphone (this work) and G = Passive (back) volume.
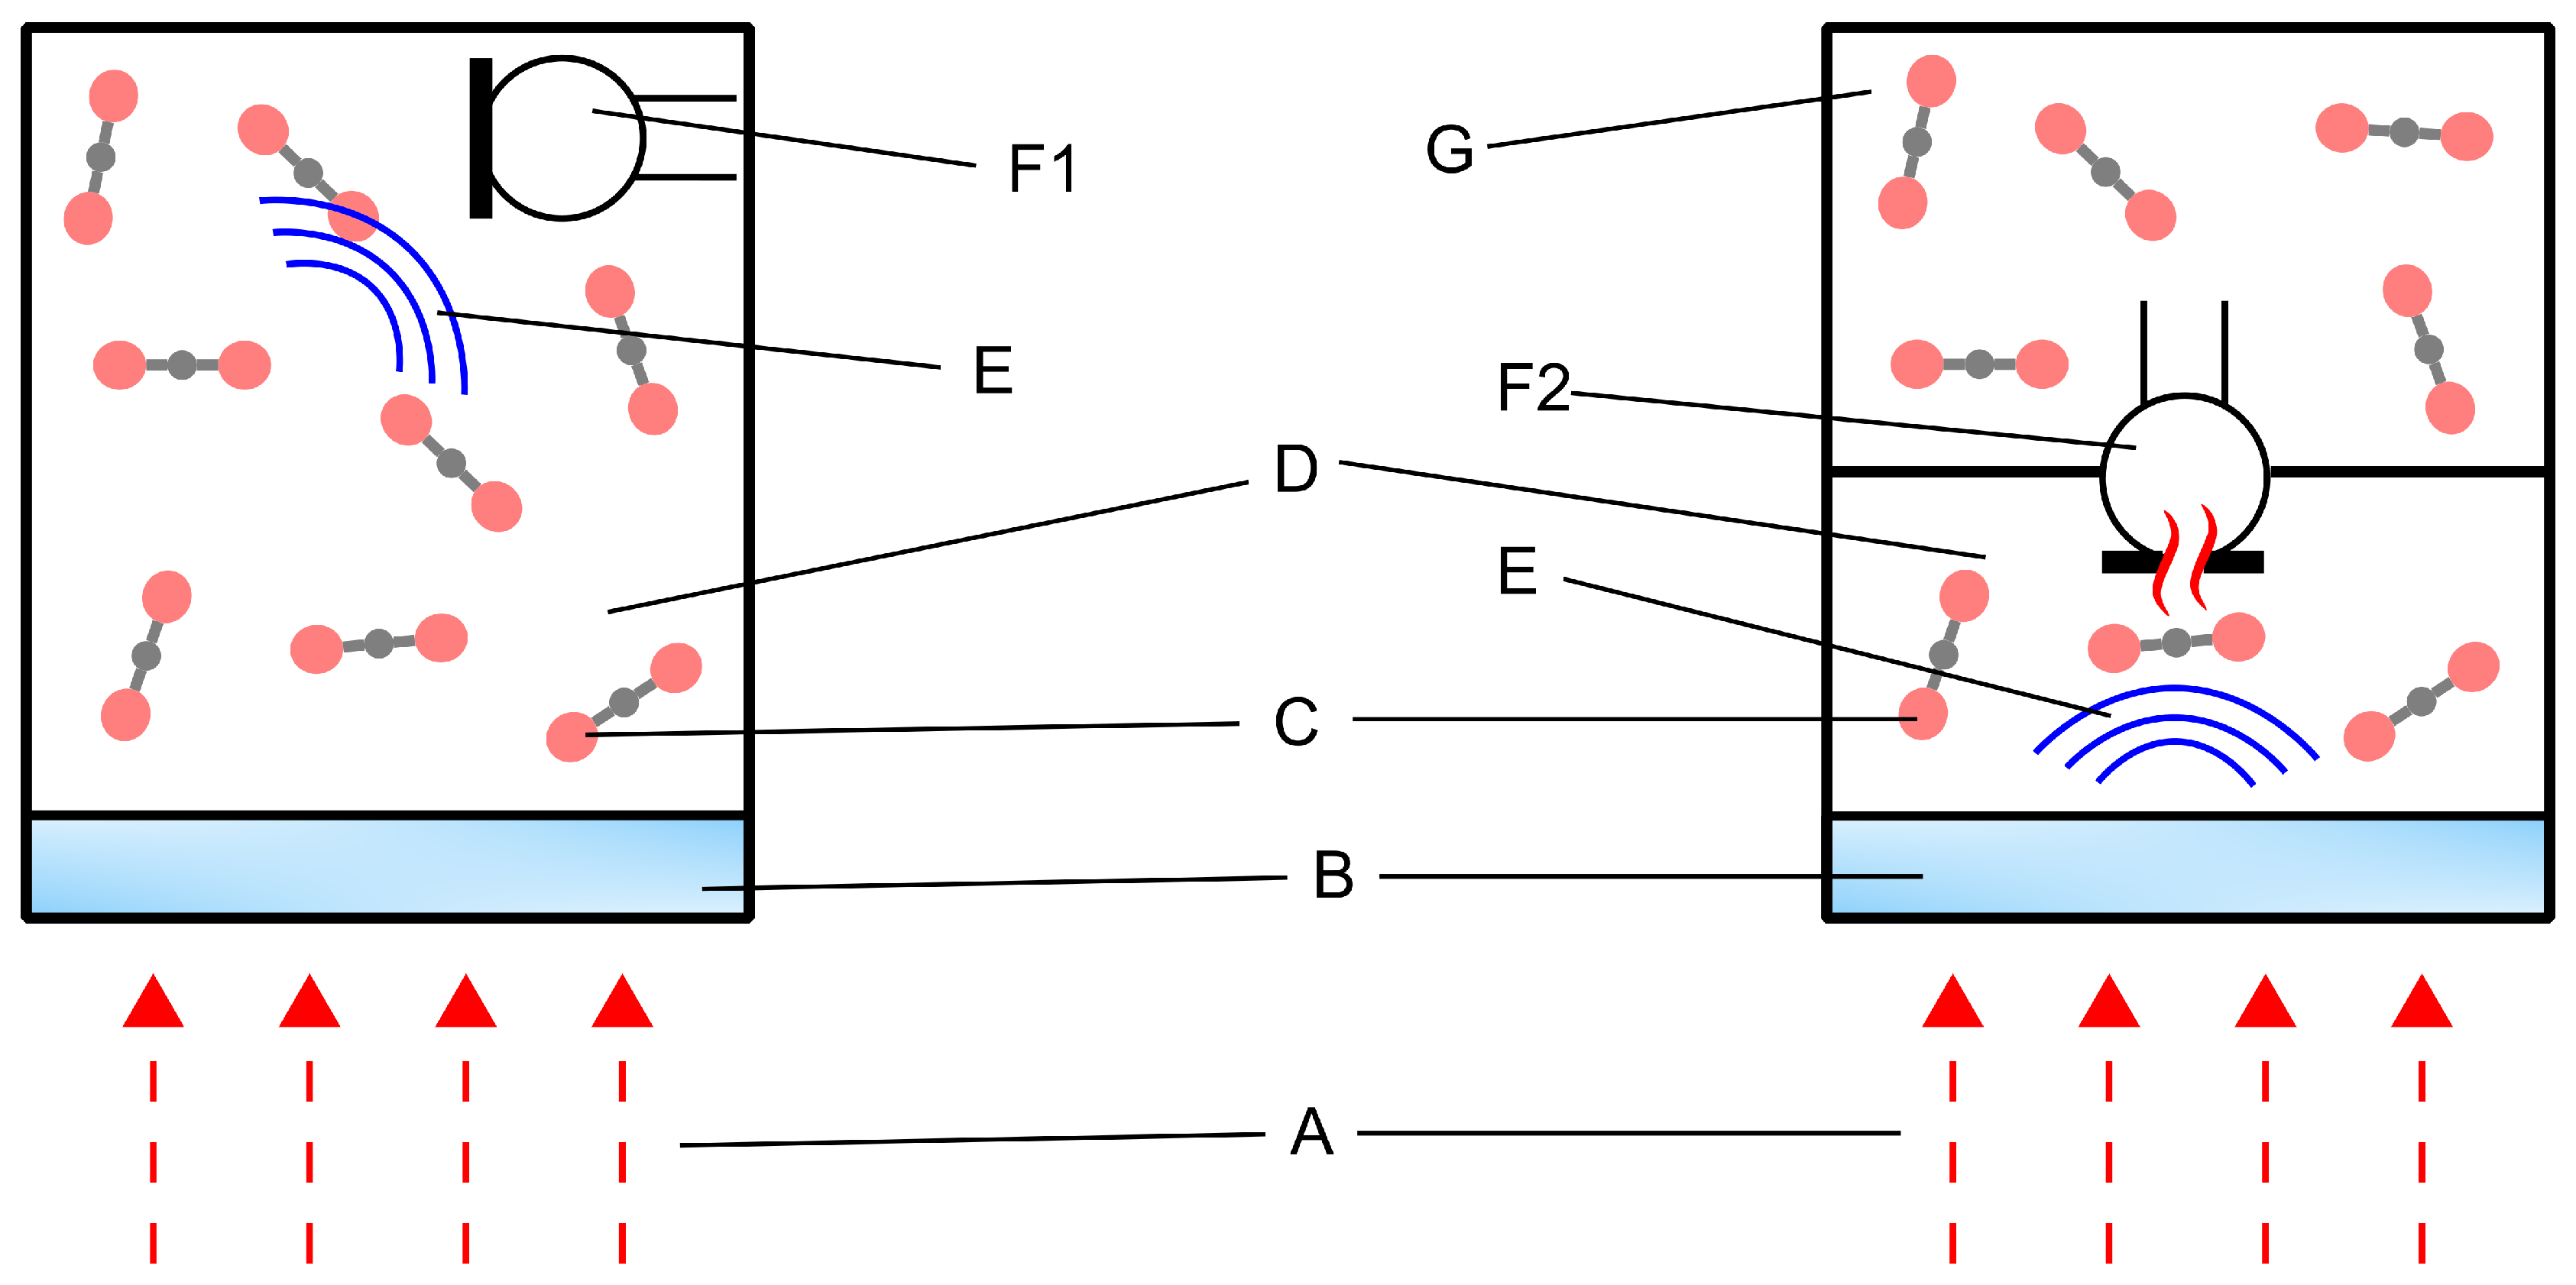
Figure 4.
Block diagram for the complete frequency chain of the fluid microphone integrated PAS detector cell
Figure 4.
Block diagram for the complete frequency chain of the fluid microphone integrated PAS detector cell
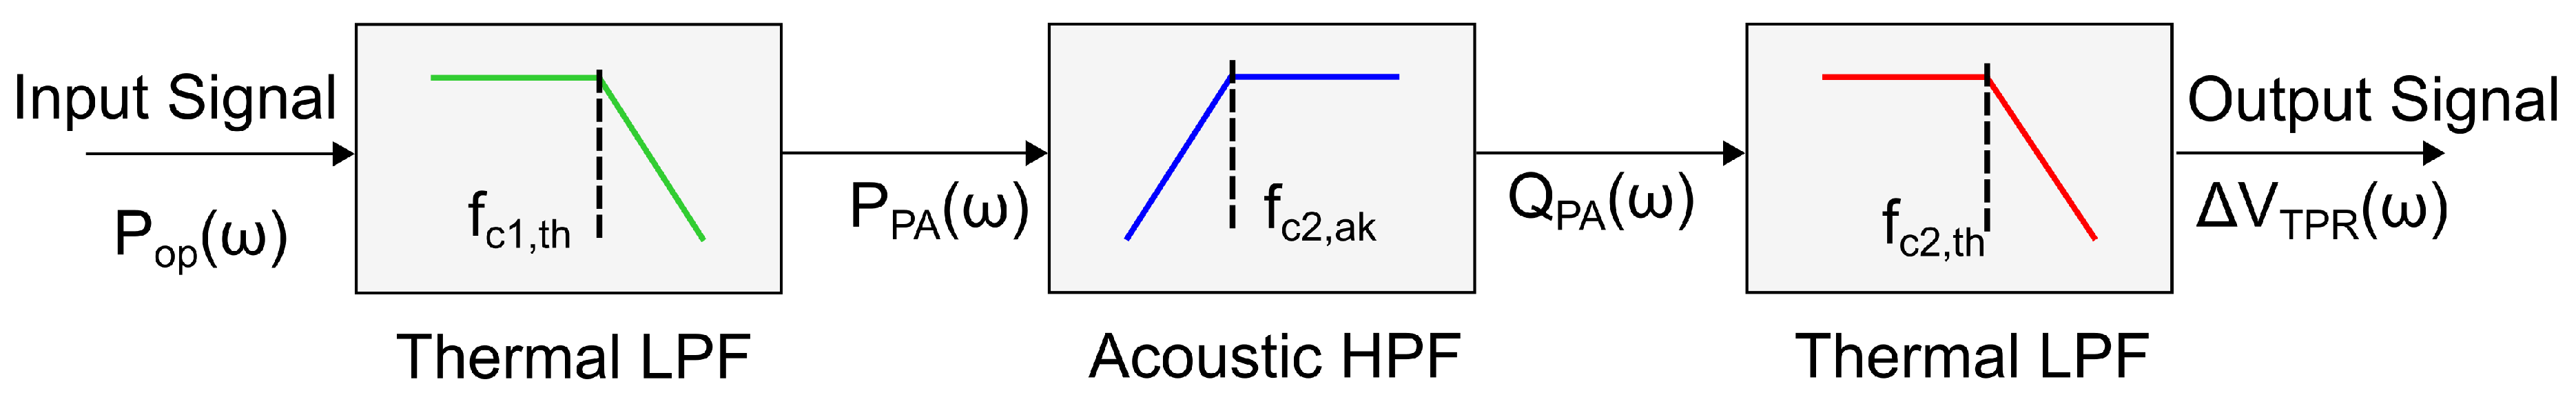
Figure 5.
Simulated frequency effects involved in the fluidic microphone PAS detection
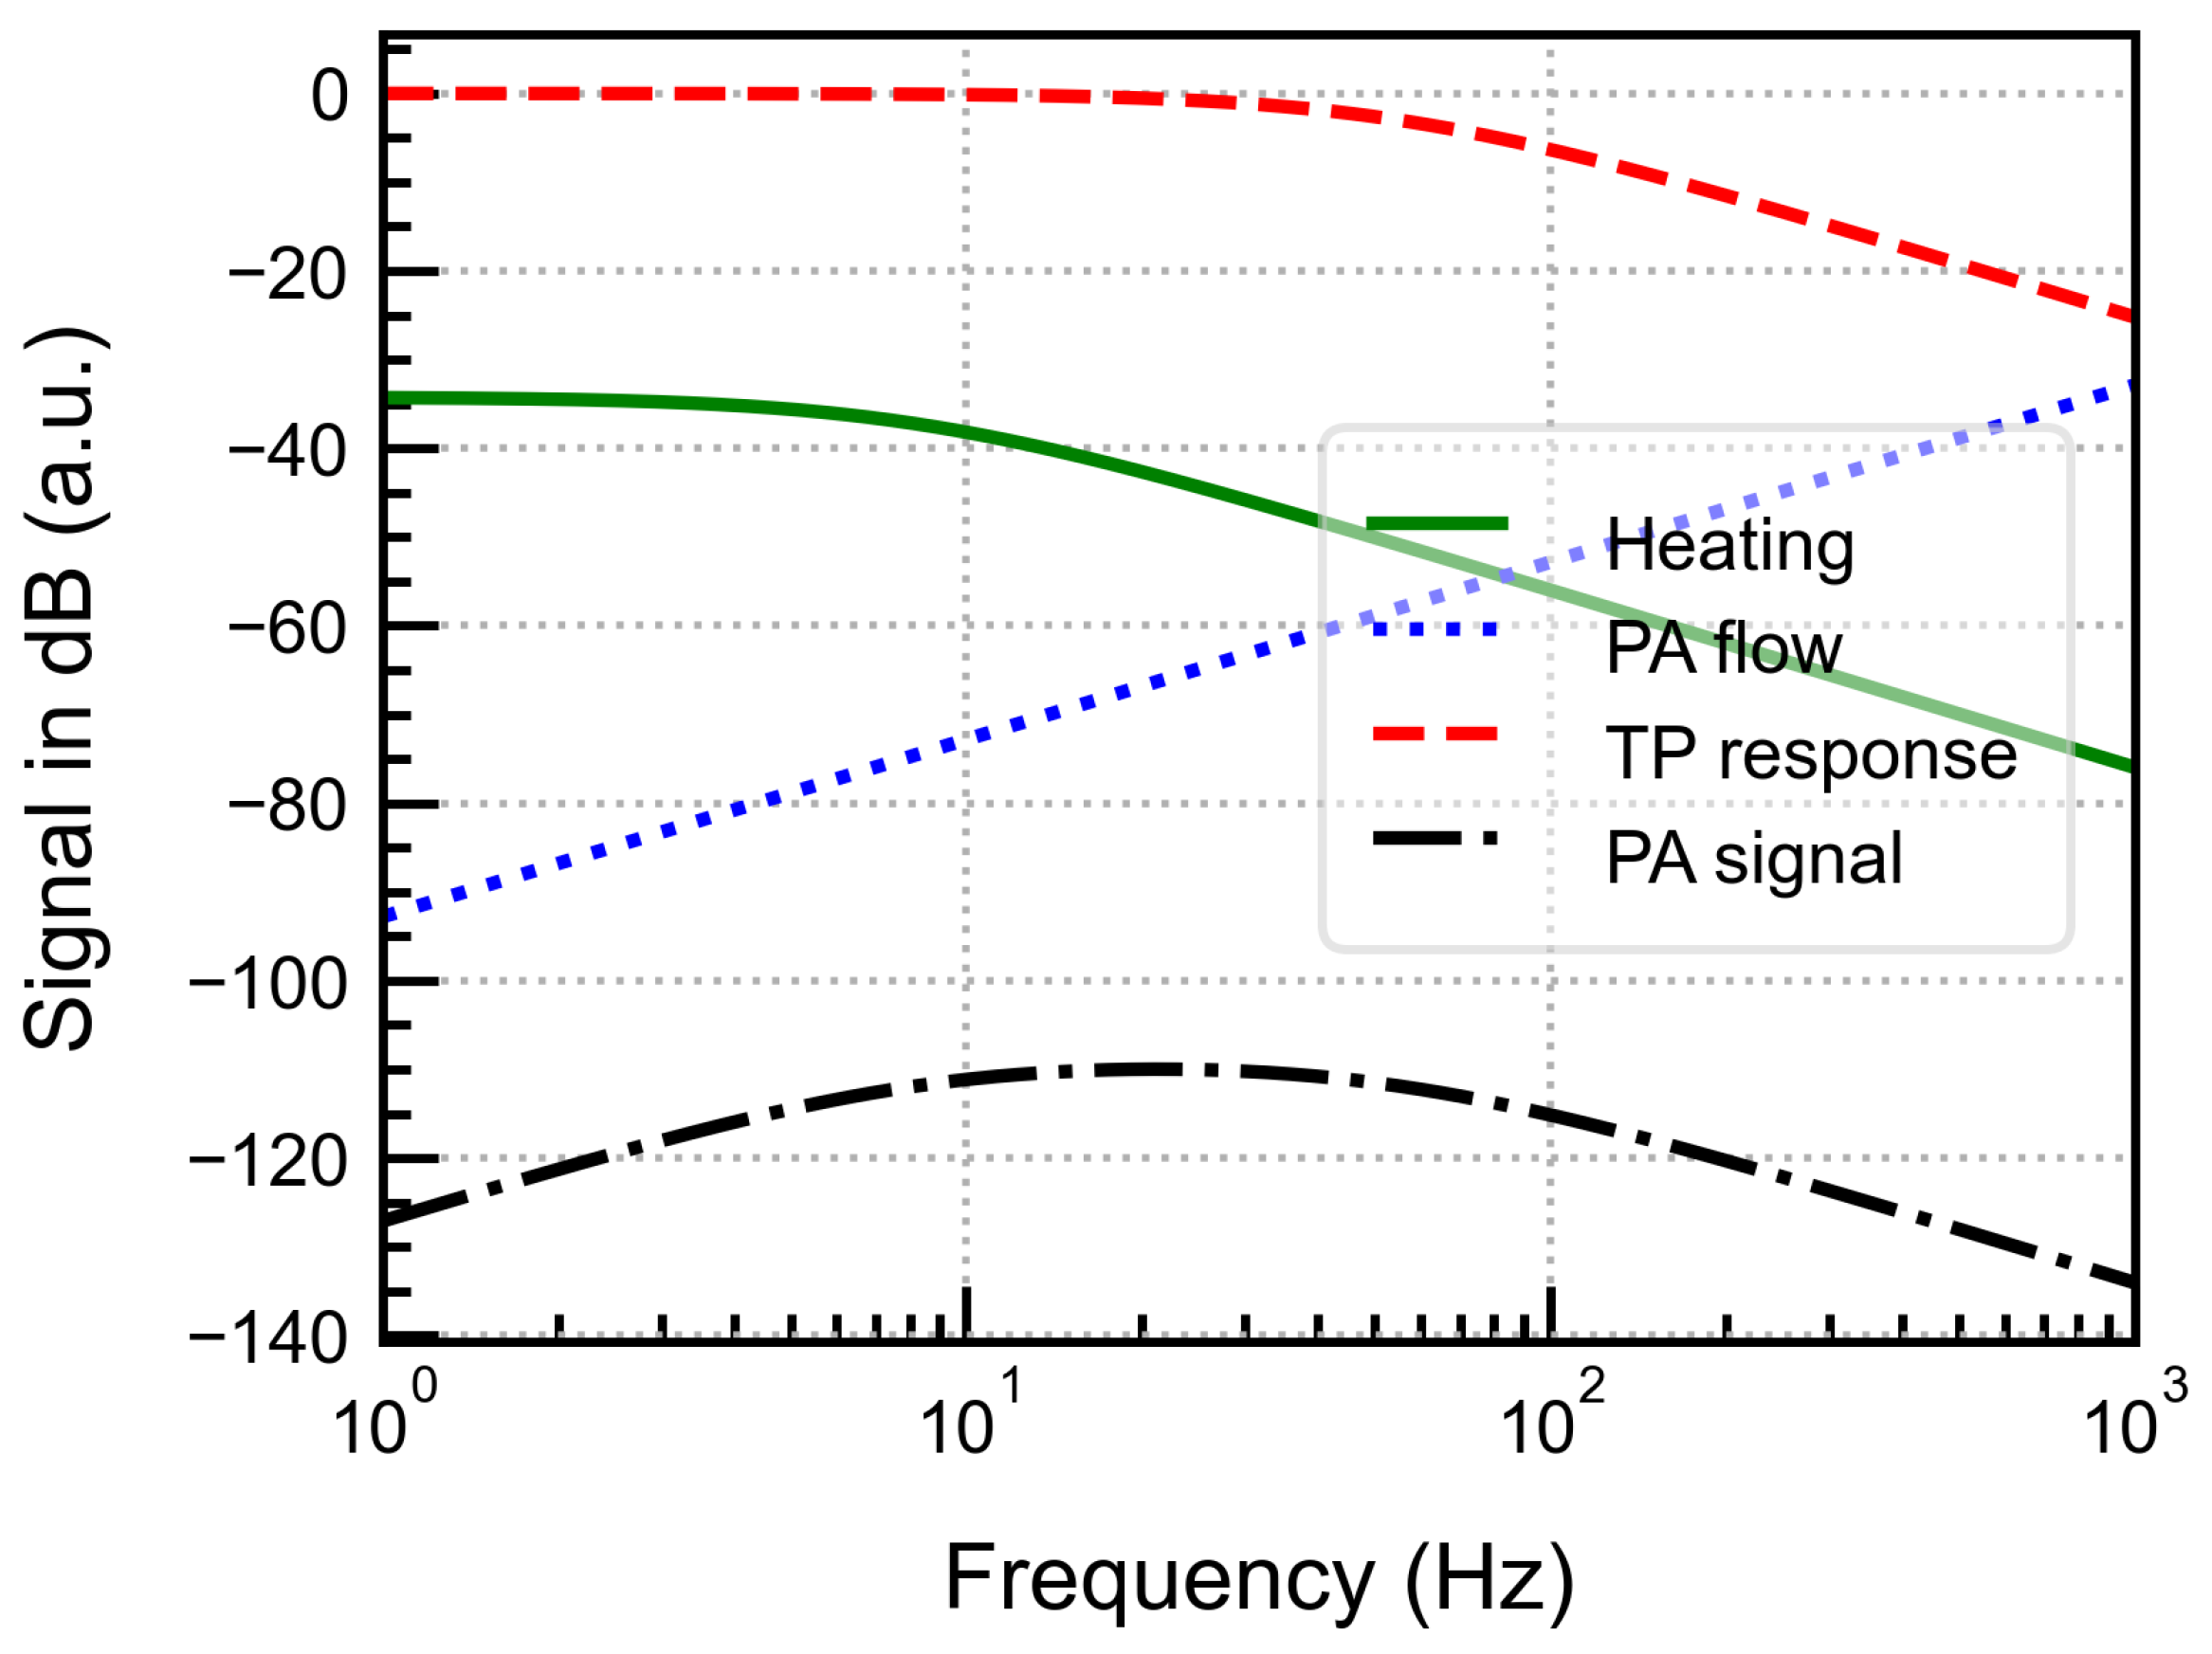
Figure 6.
IR absorption lines for 1000 ppm at 295 K, 1 atm simulated using the HITRAN database [24].
Figure 6.
IR absorption lines for 1000 ppm at 295 K, 1 atm simulated using the HITRAN database [24].
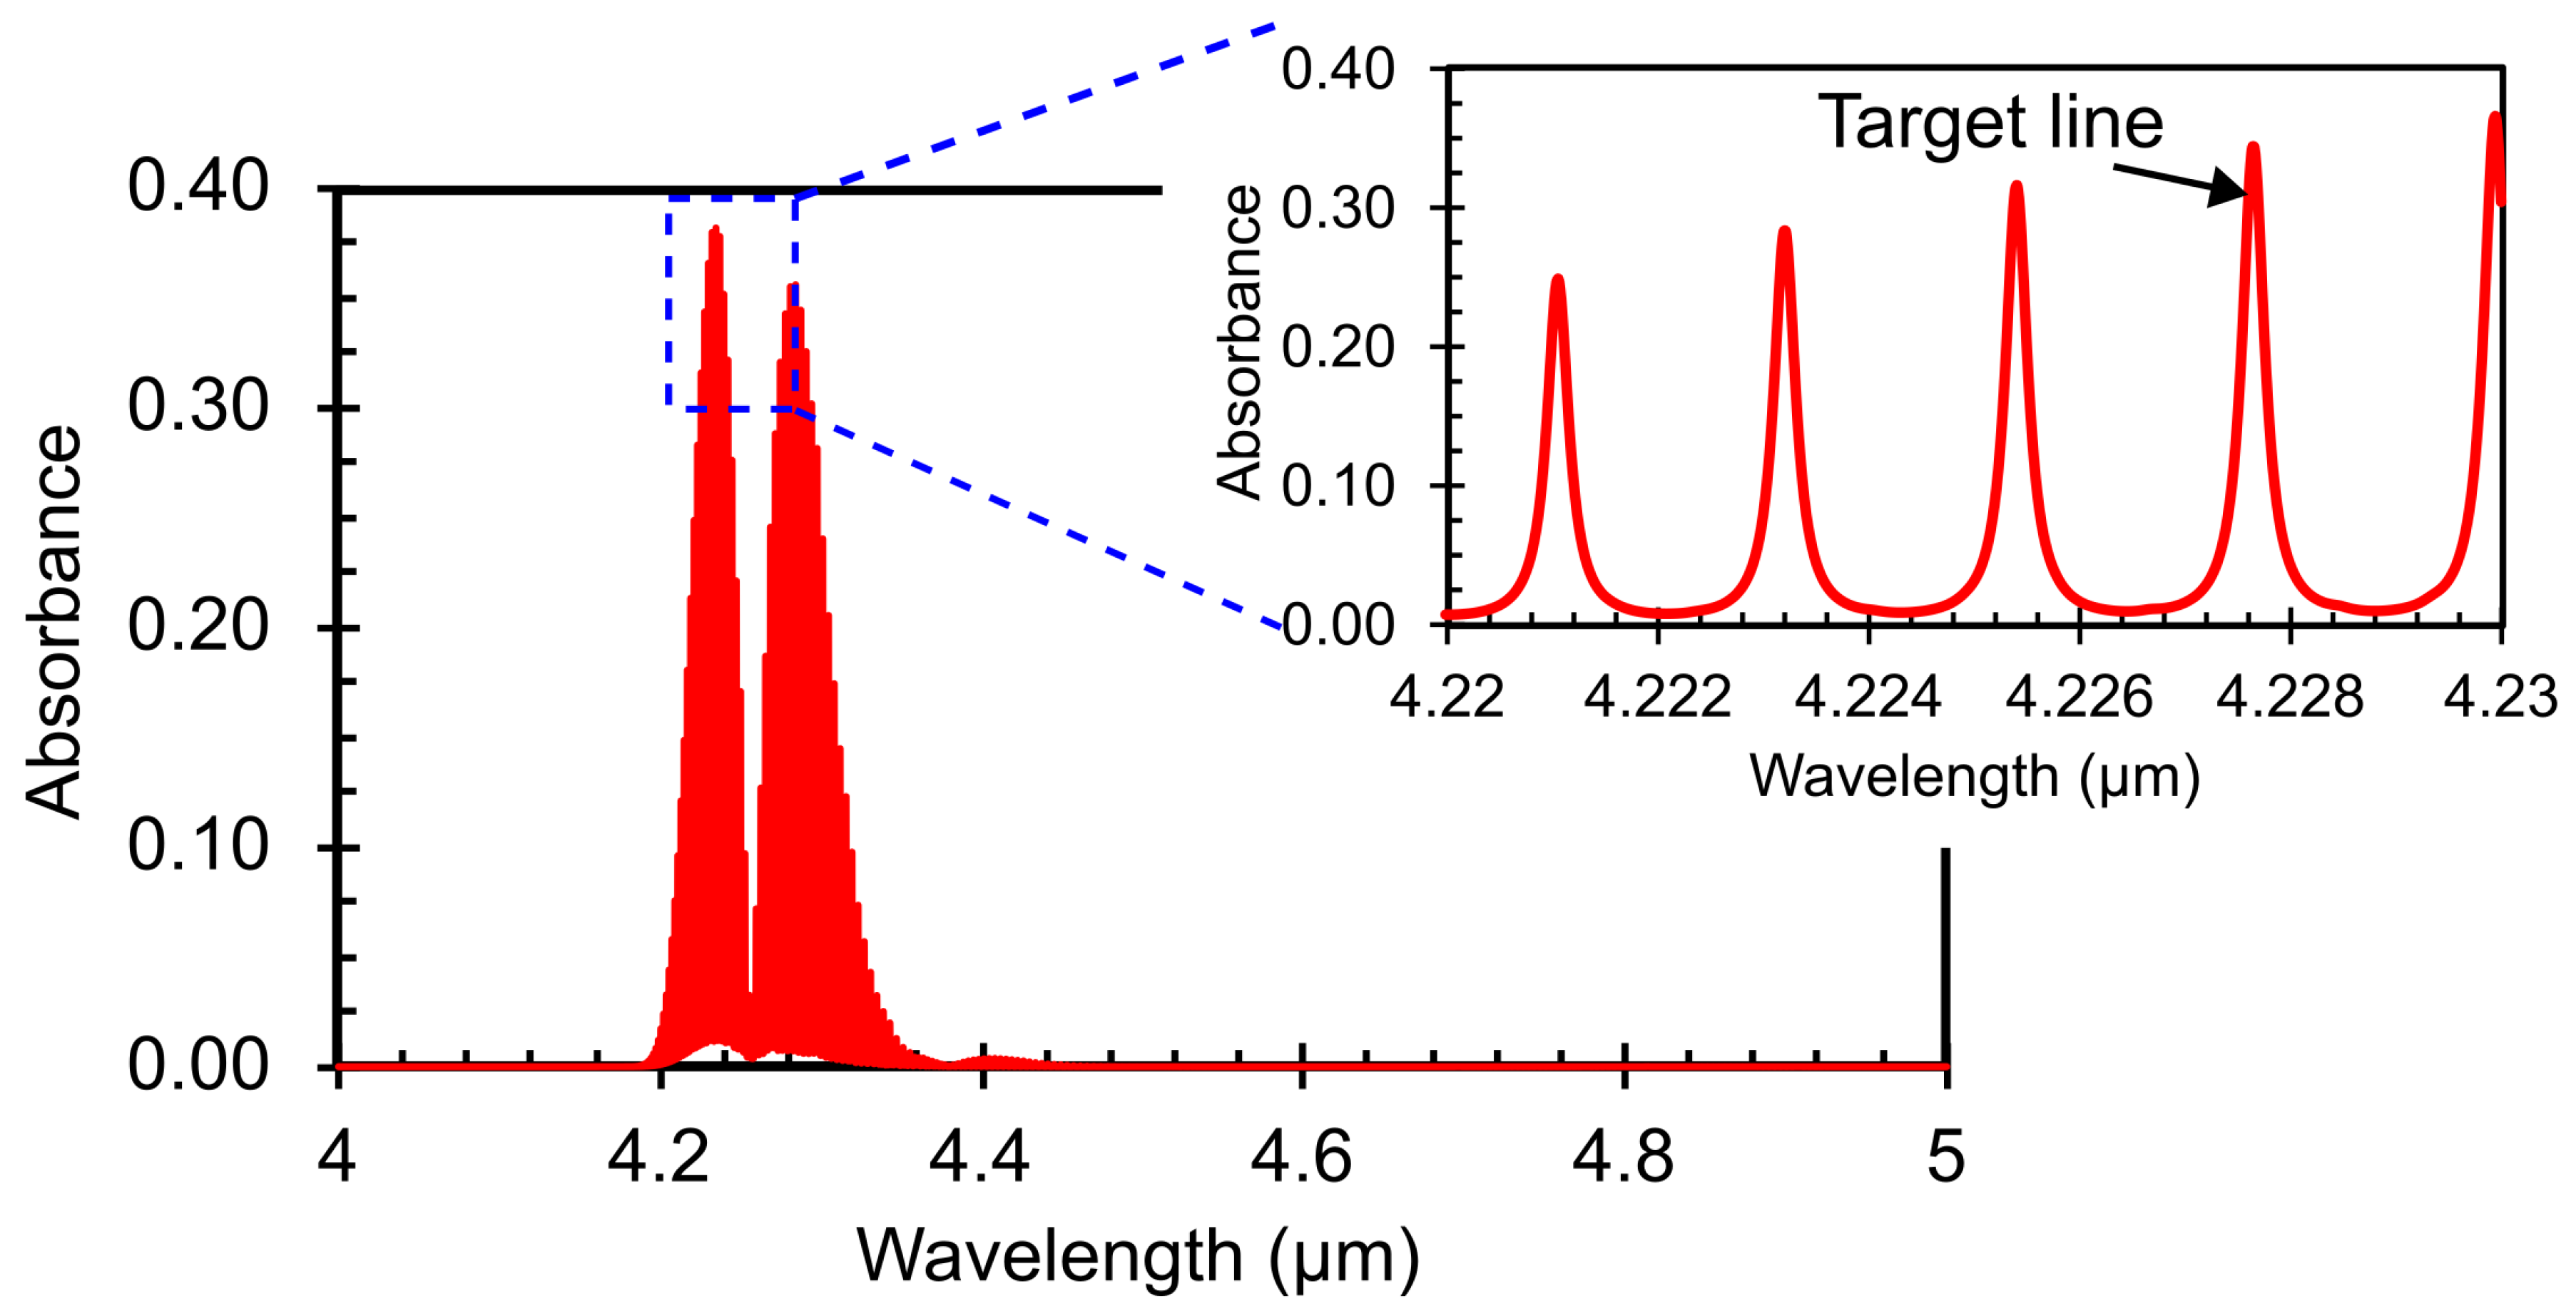
Figure 7.
DFB laser output power at 15°C (left) and emitted wavelength (right) dependence on operating current.
Figure 7.
DFB laser output power at 15°C (left) and emitted wavelength (right) dependence on operating current.
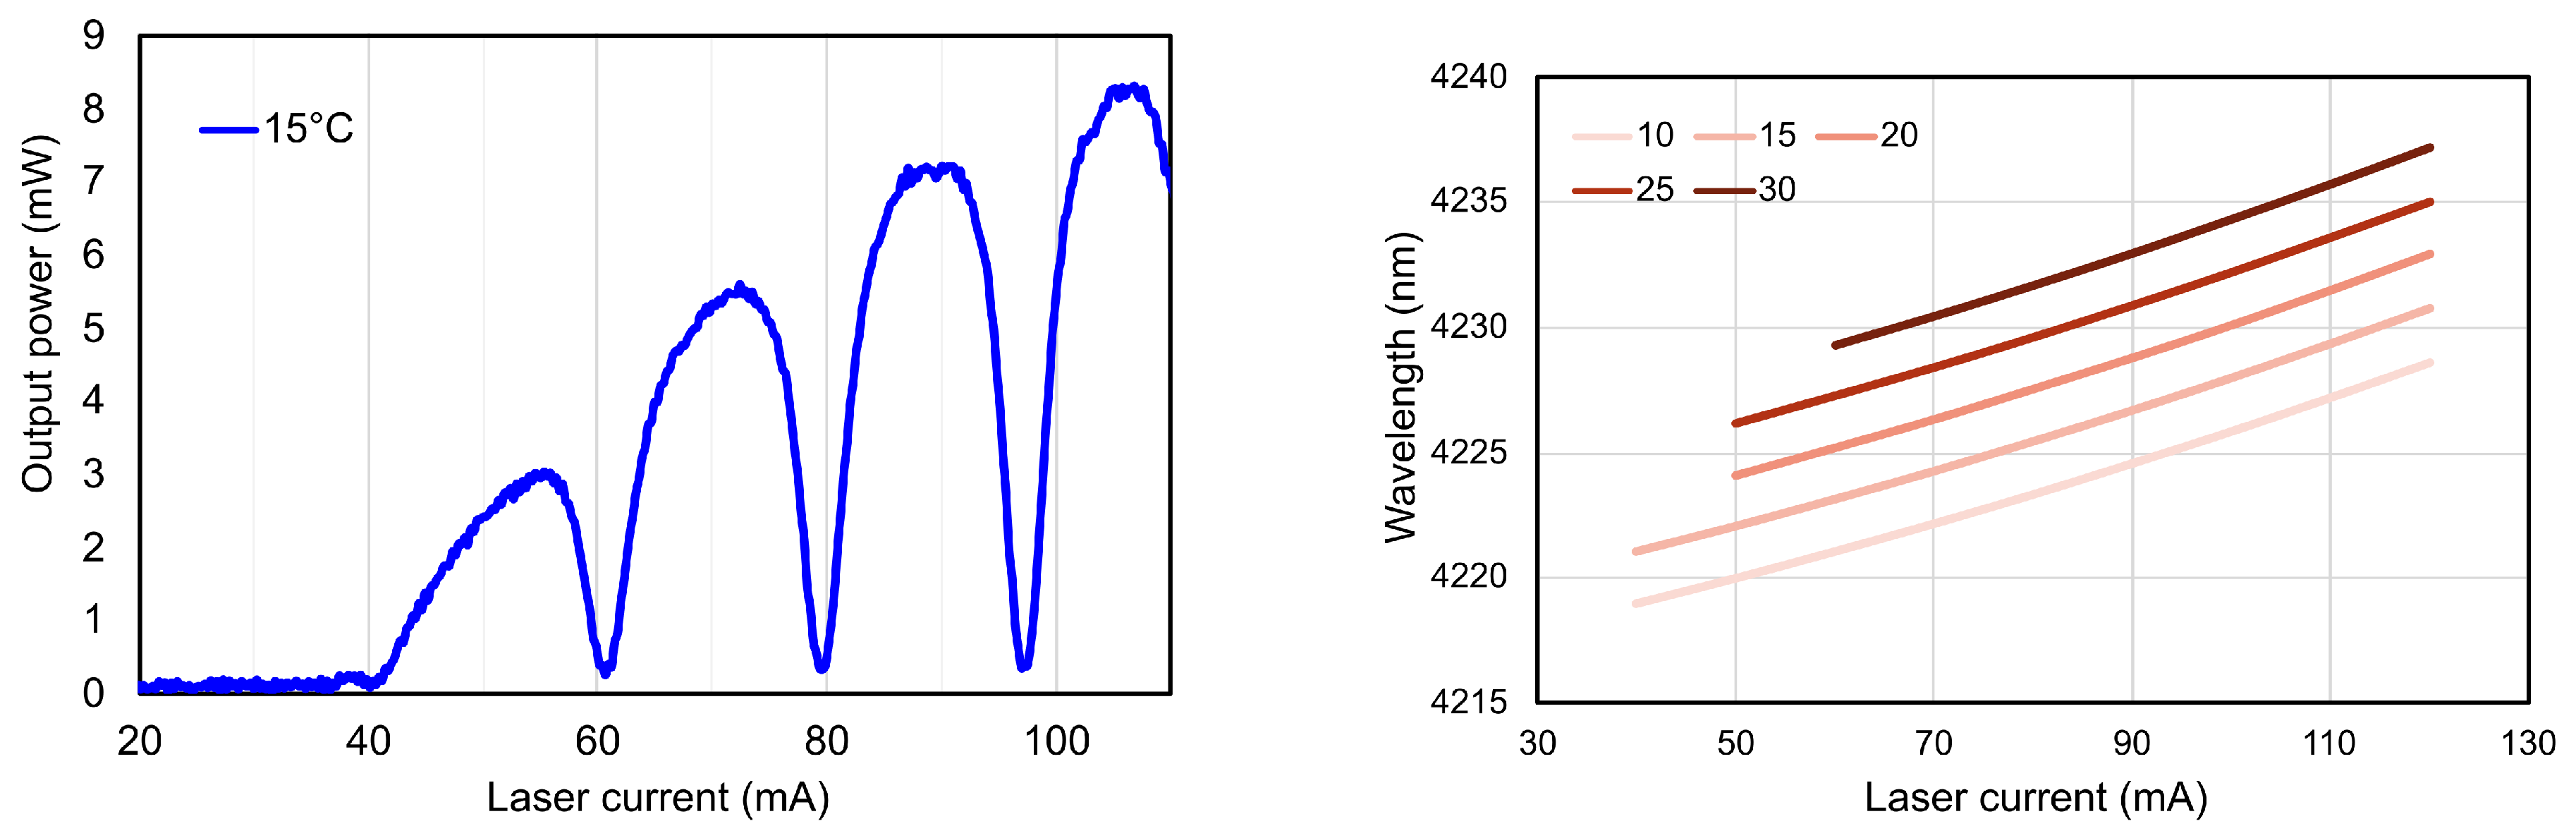
Figure 10.
Block diagram of the PAS measurement setup with the cross-section view of the detector cell.
Figure 10.
Block diagram of the PAS measurement setup with the cross-section view of the detector cell.
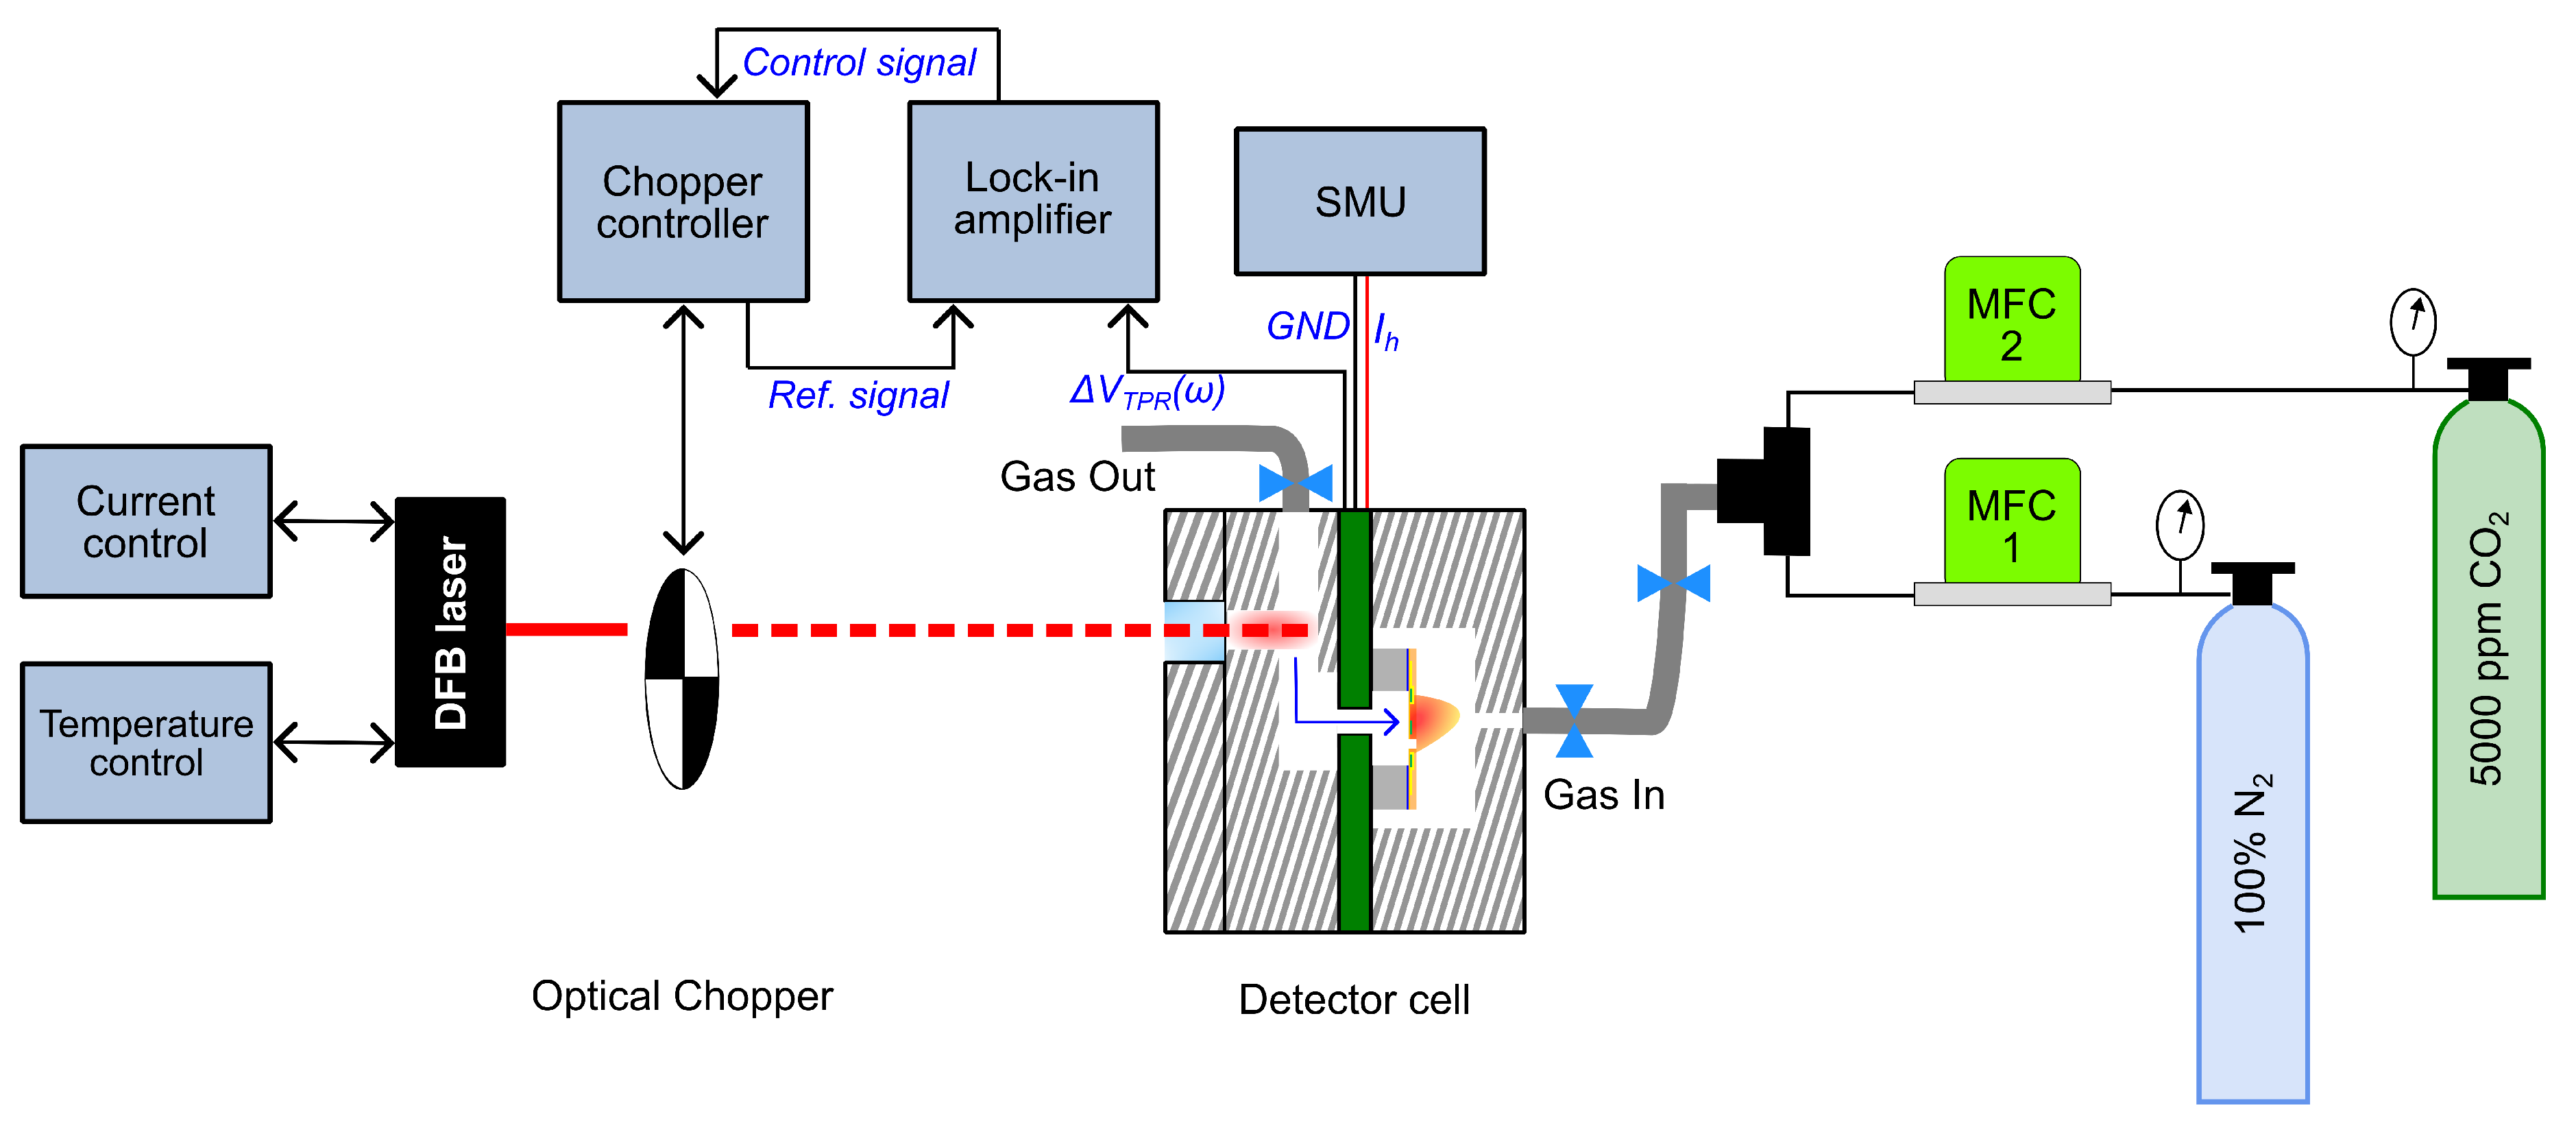
Figure 11.
Dependence of the PA signal on the laser current for 5000 ppm at 40 Hz, 0.5 ml back volume.
Figure 11.
Dependence of the PA signal on the laser current for 5000 ppm at 40 Hz, 0.5 ml back volume.
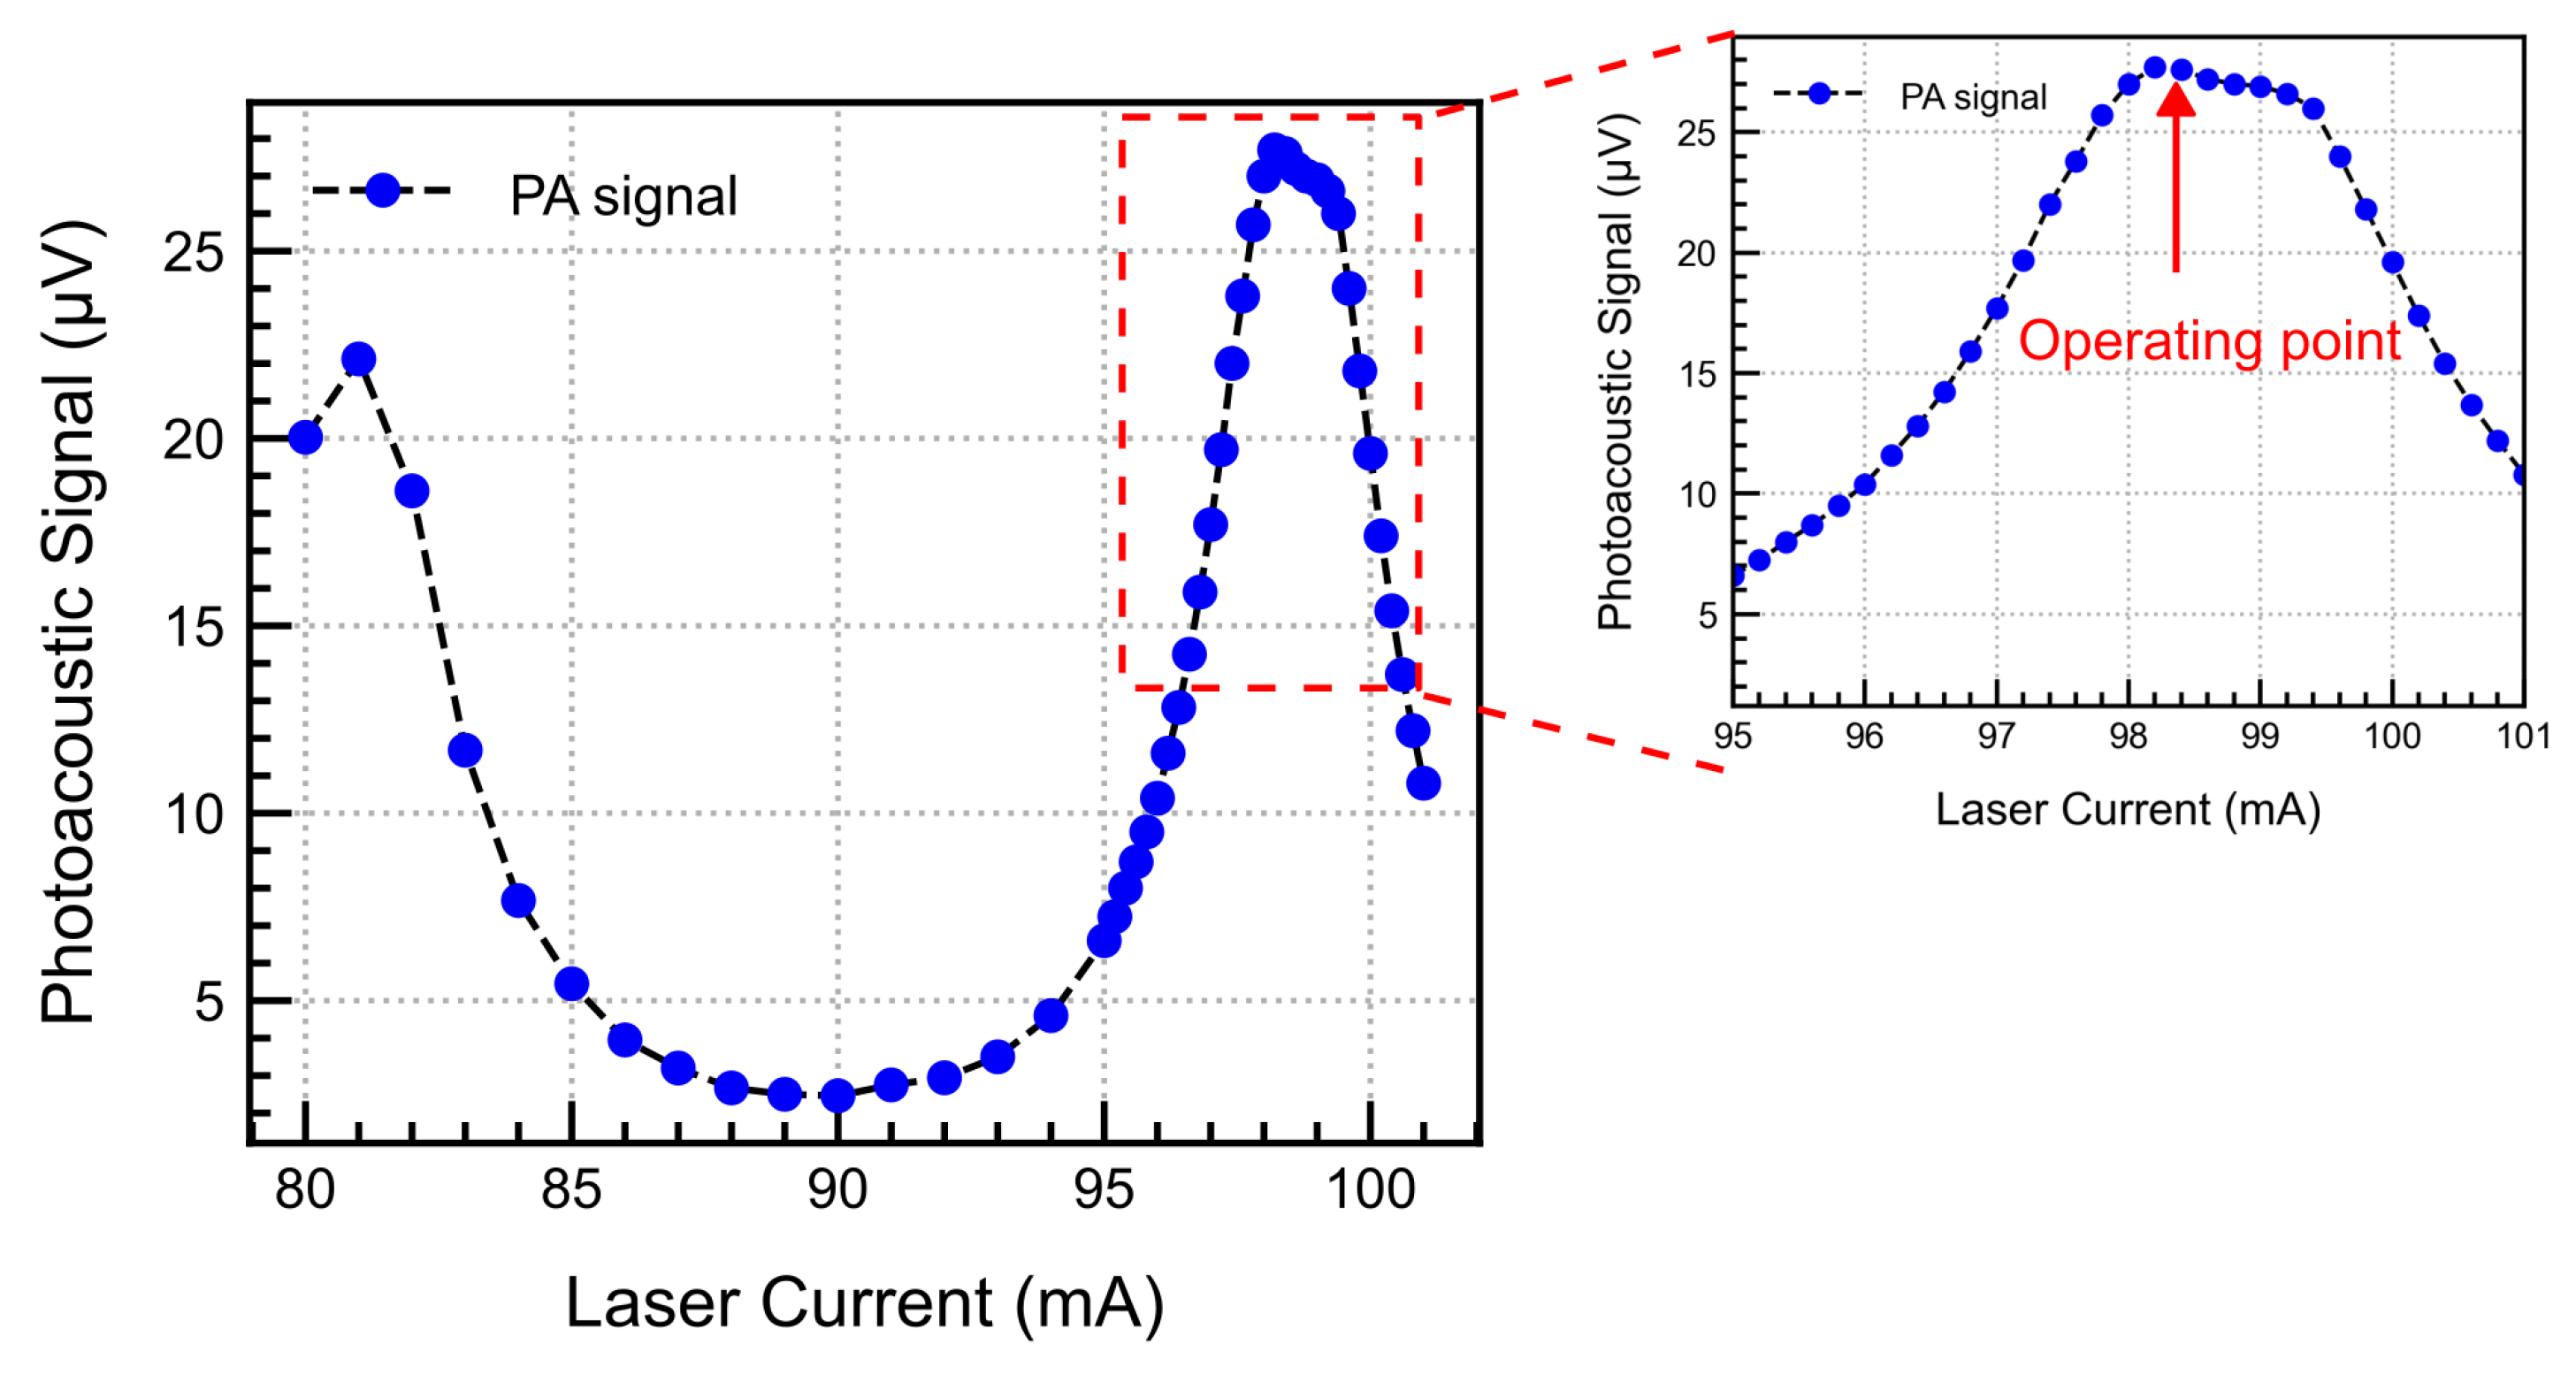
Figure 12.
Frequency dependence of the PA signal measured three times and fitted to the frequency response analytical model.
Figure 12.
Frequency dependence of the PA signal measured three times and fitted to the frequency response analytical model.
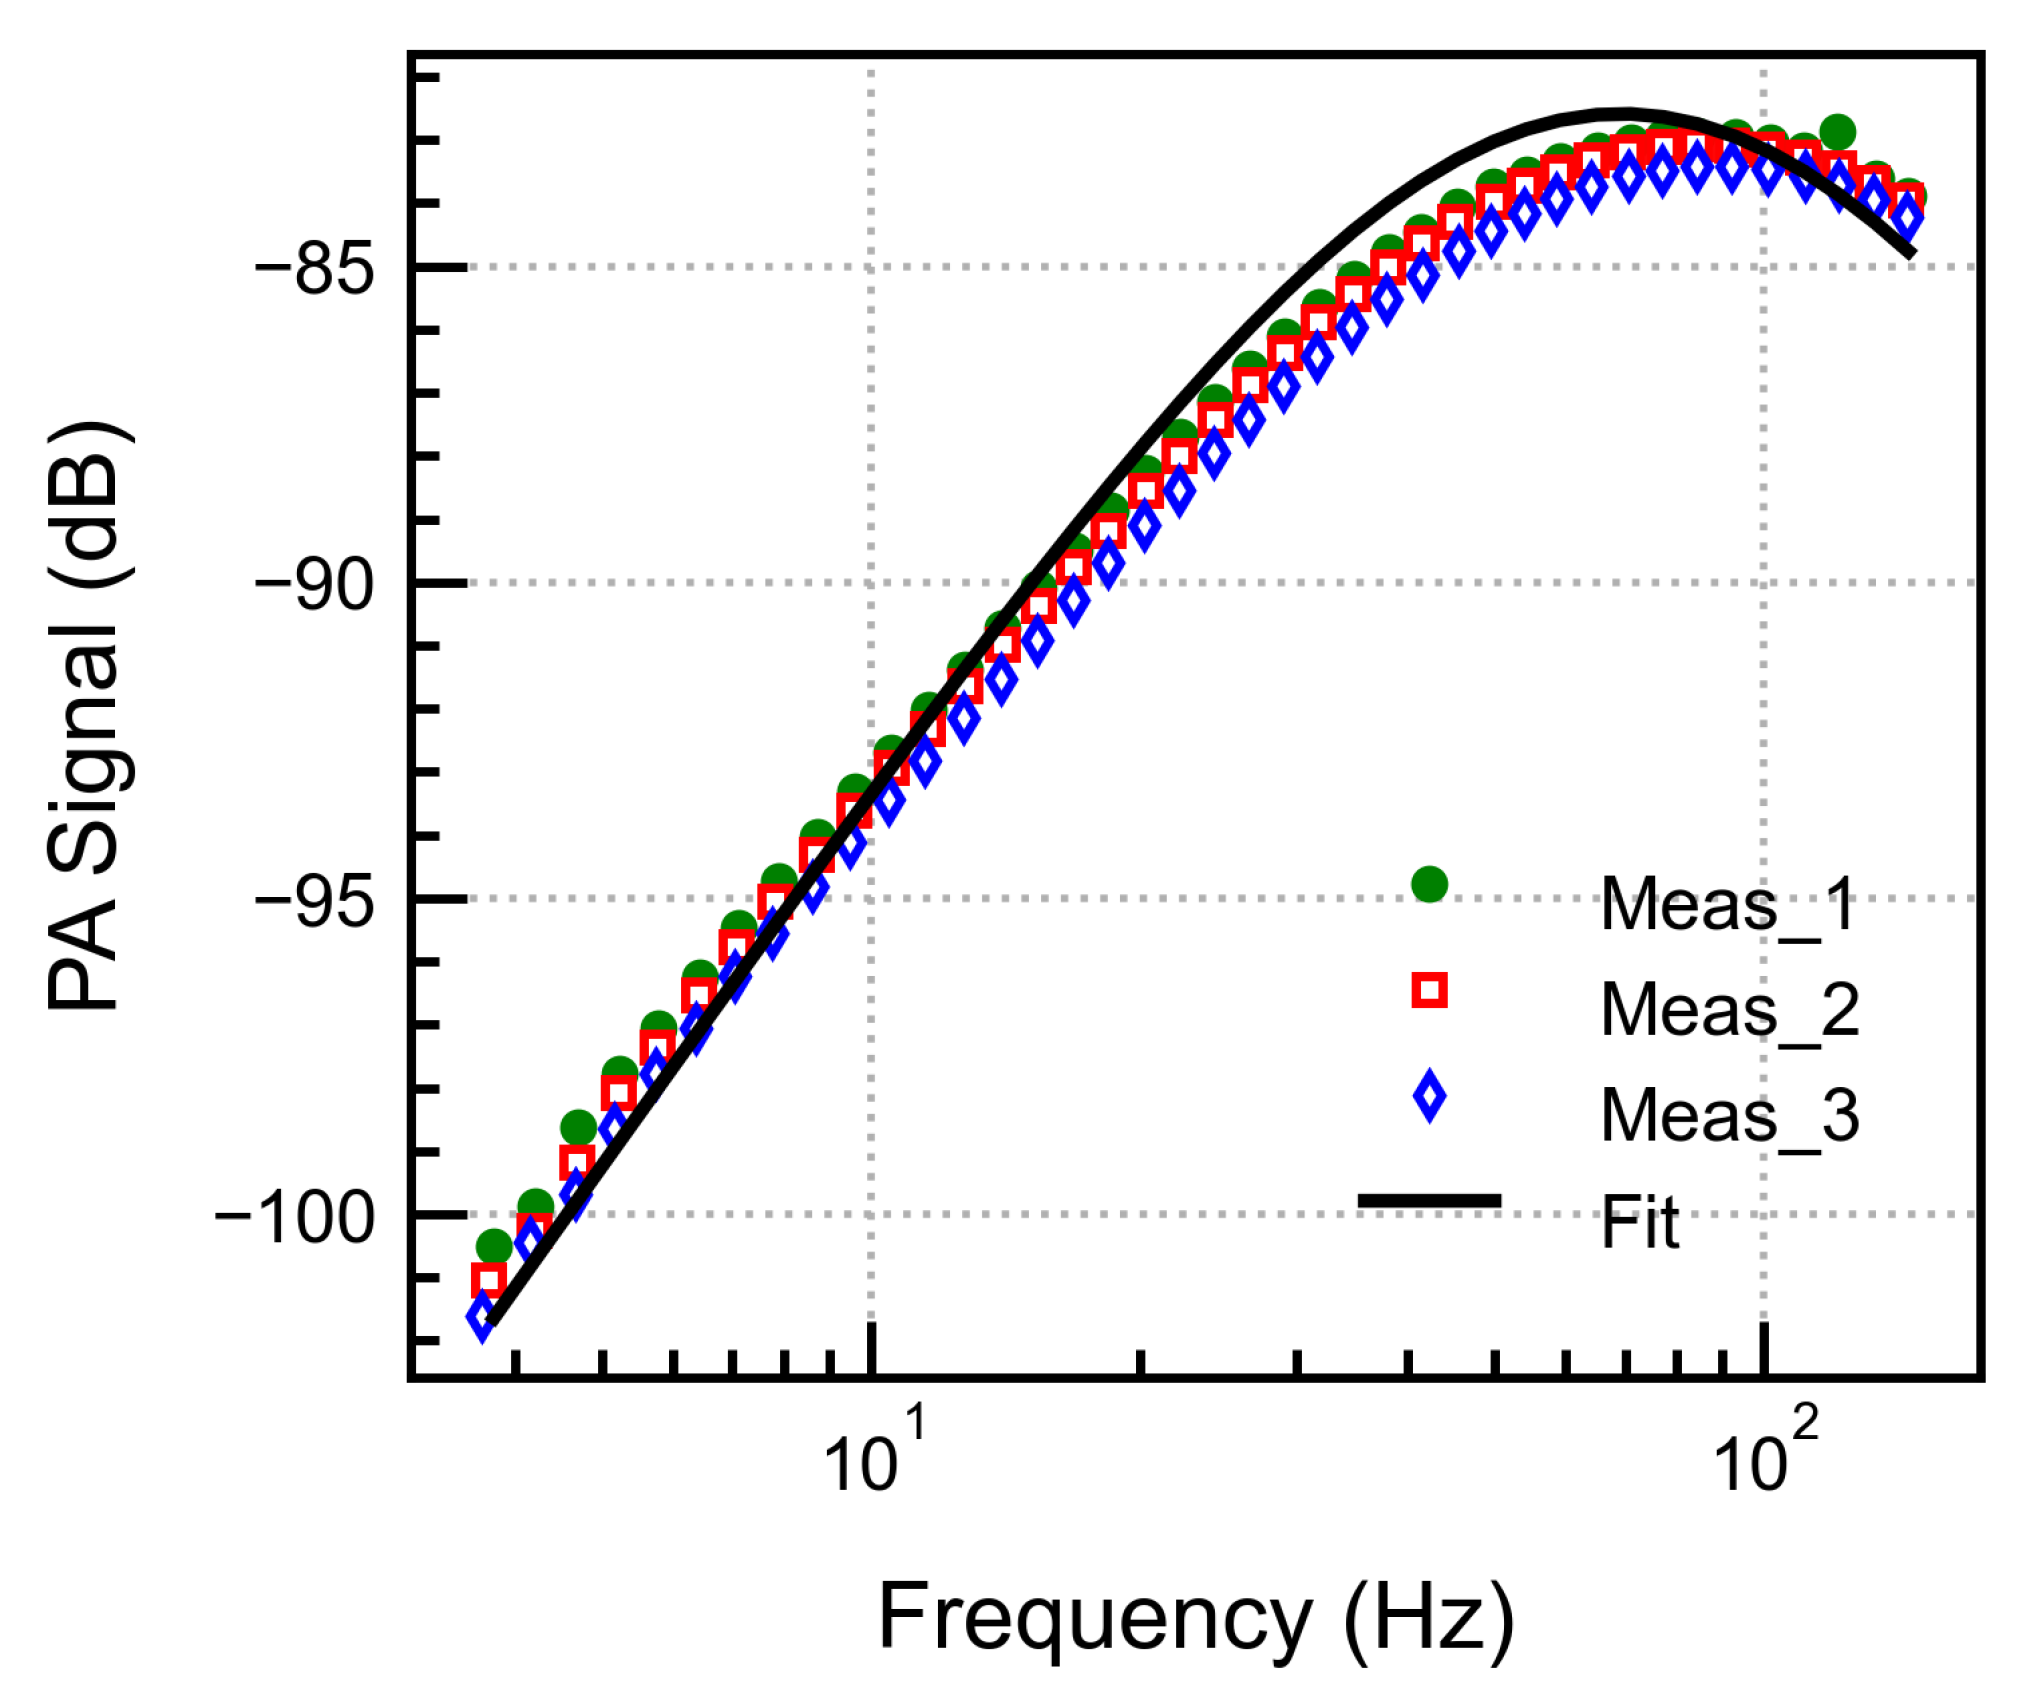
Figure 13.
(a) PA signal dependence on the effective volume (b) and the heater electrical power.
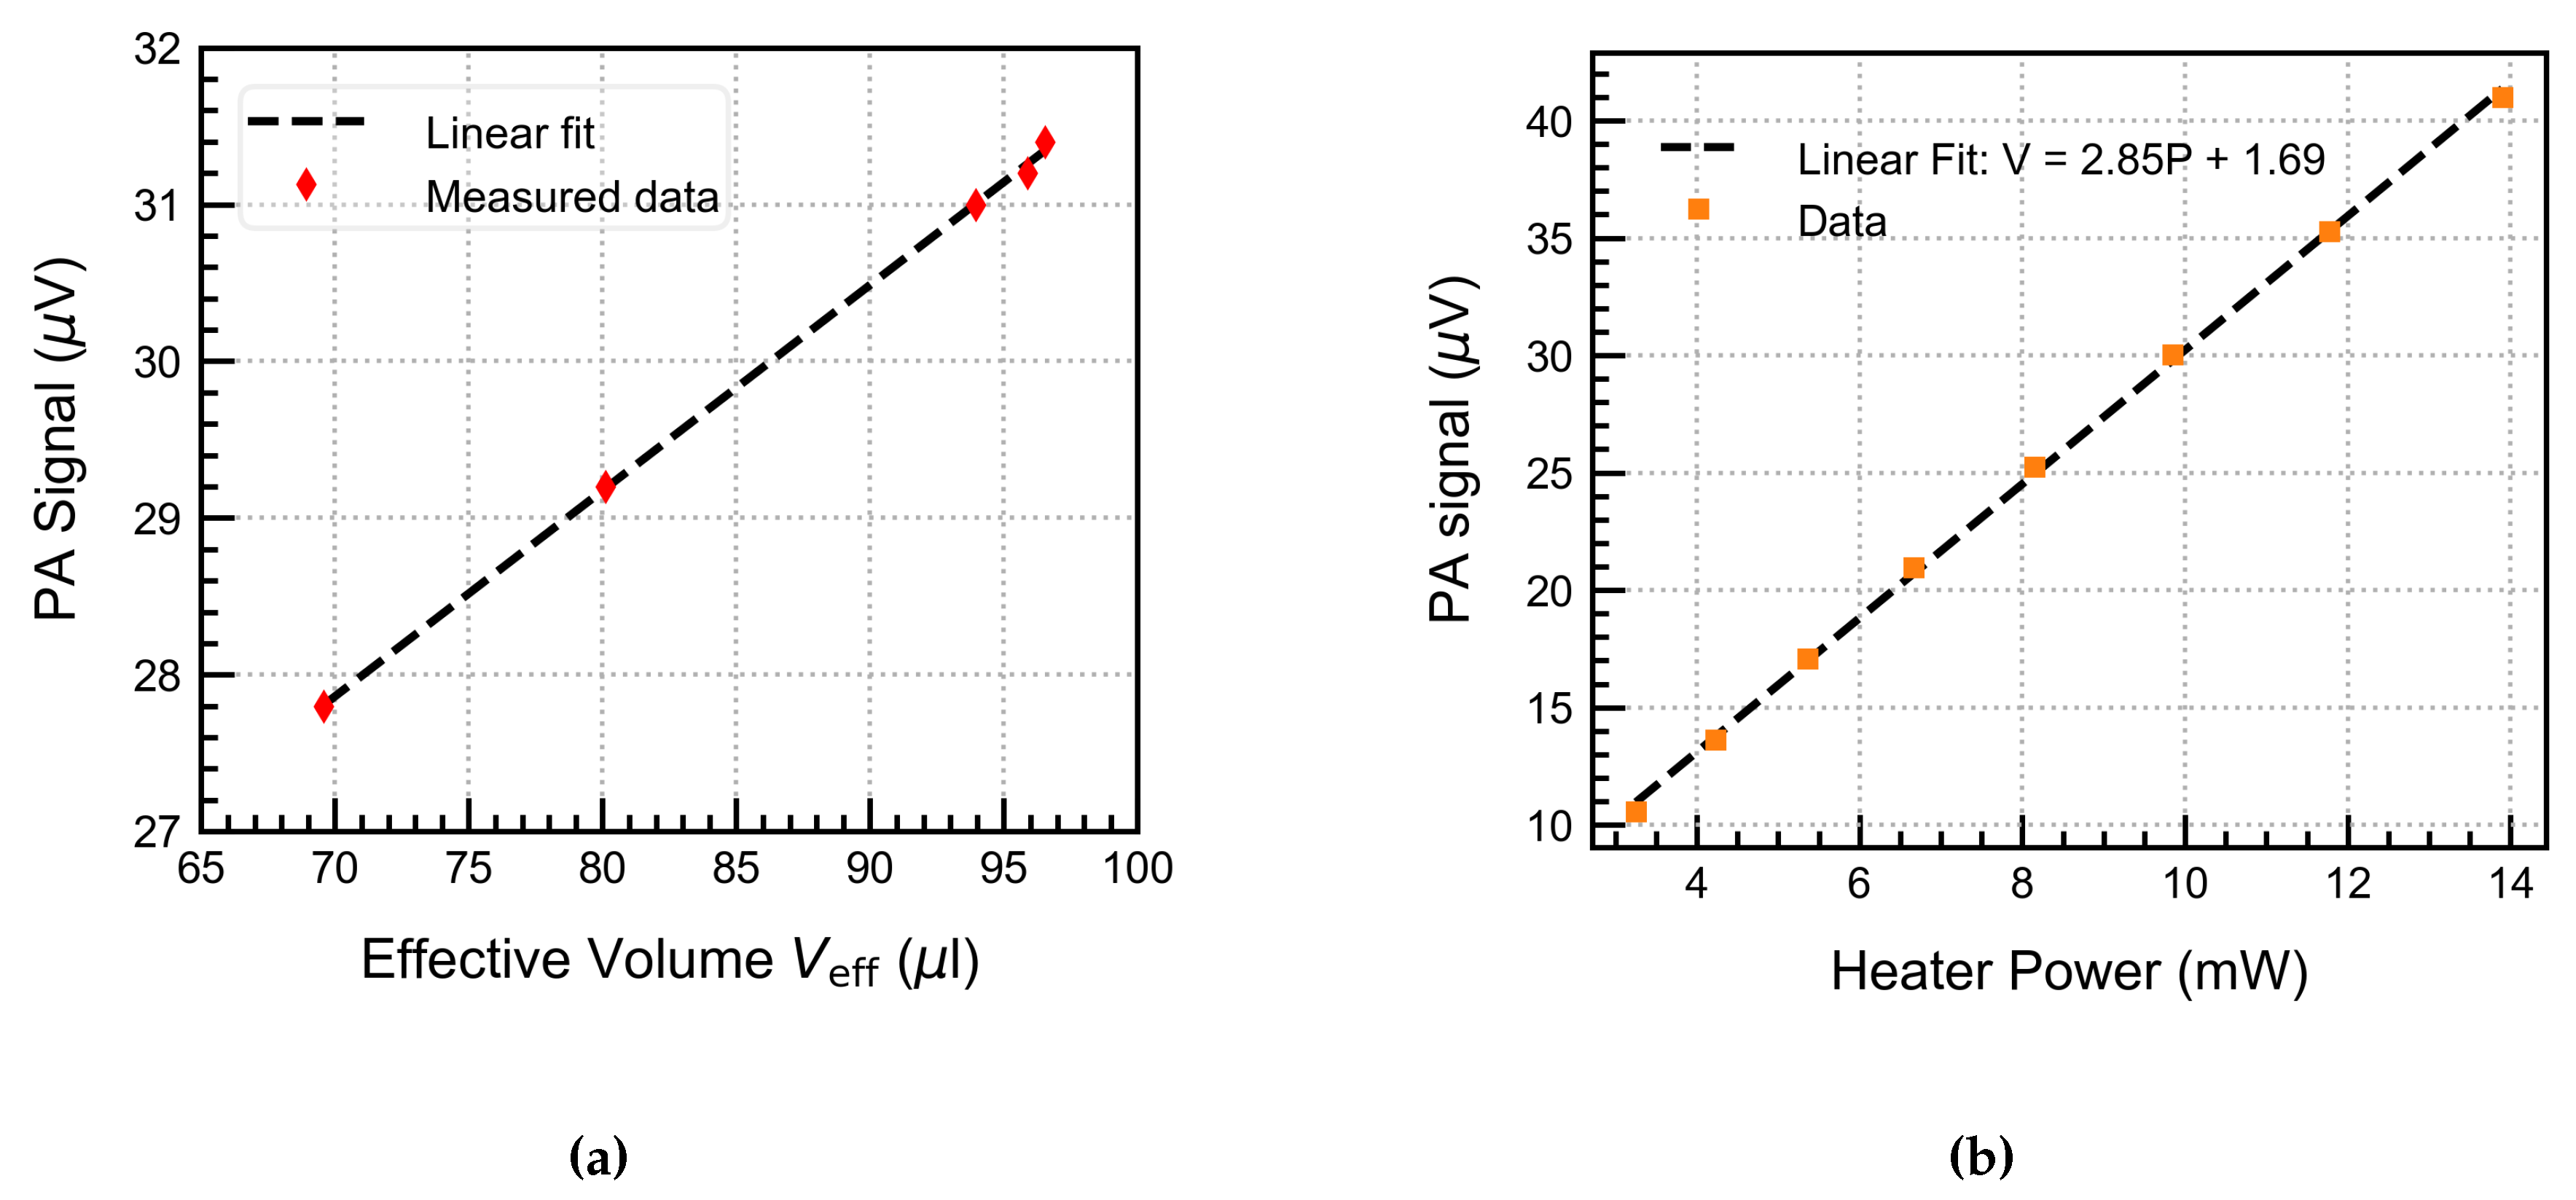
Figure 14.
Gas concentration measurements with linear fit
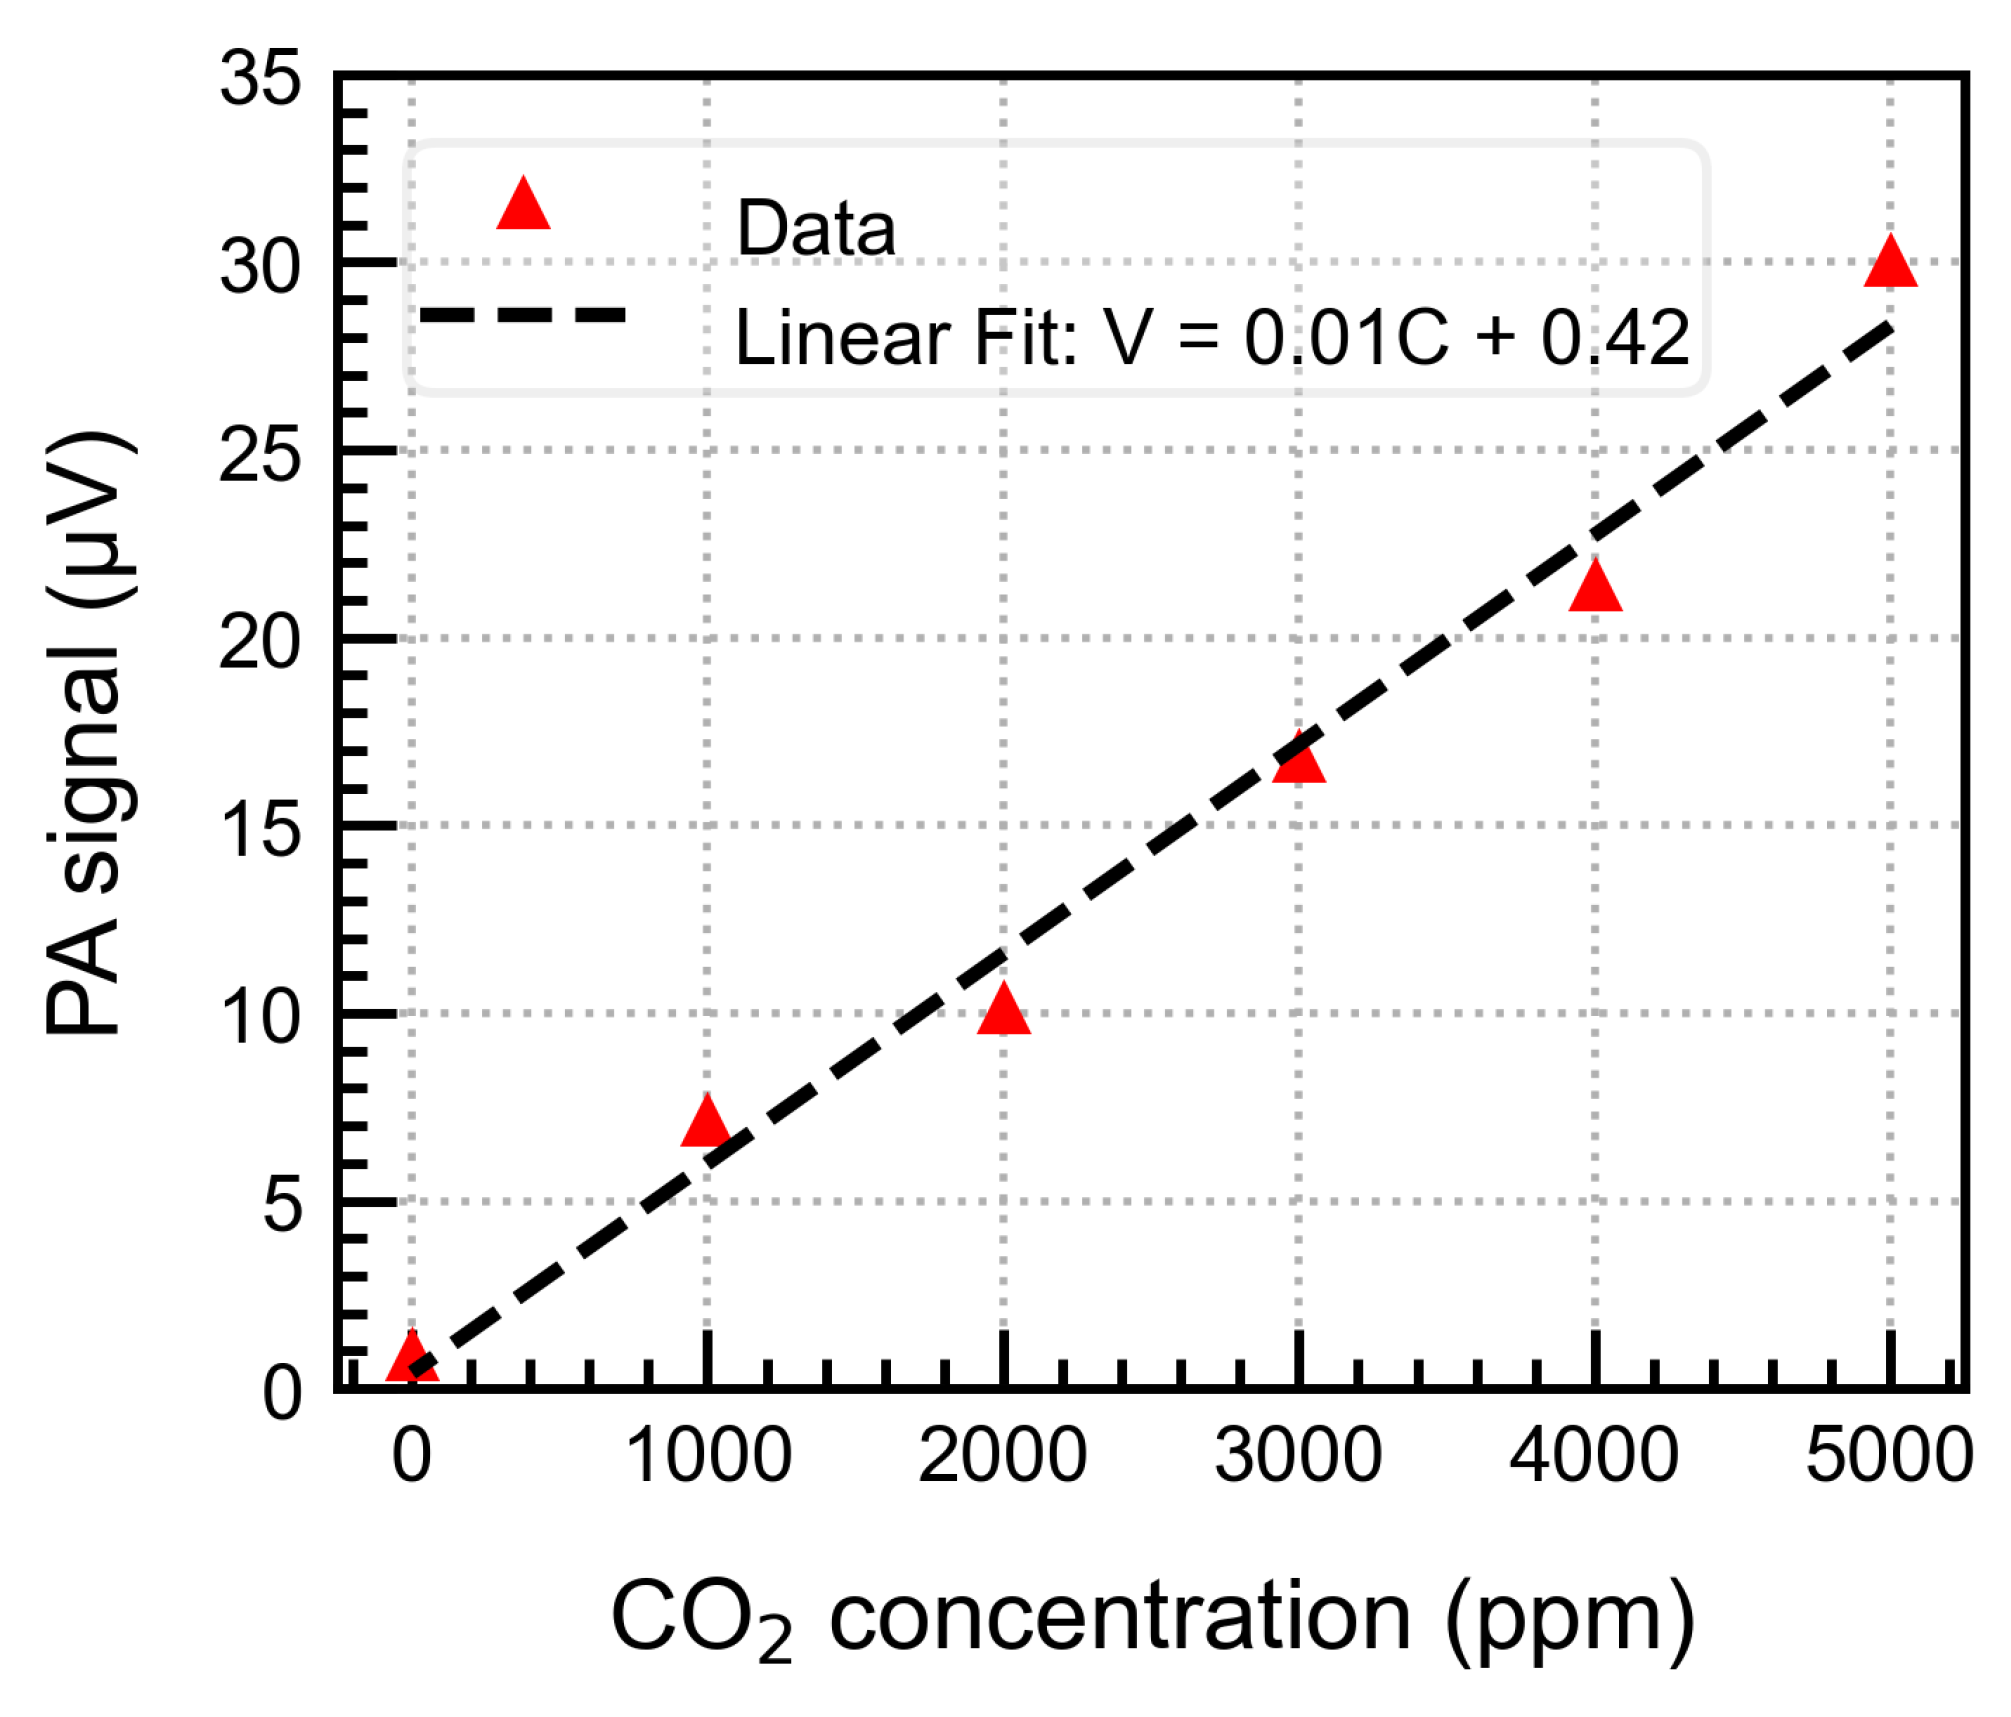
Figure 15.
(a) Allan Deviation plot for the developed PAS system; (b) Continuous time PA signal for around 3 hours. A slight drift is observed, accompanied by noisy peaks, due to chopper instability.
Figure 15.
(a) Allan Deviation plot for the developed PAS system; (b) Continuous time PA signal for around 3 hours. A slight drift is observed, accompanied by noisy peaks, due to chopper instability.
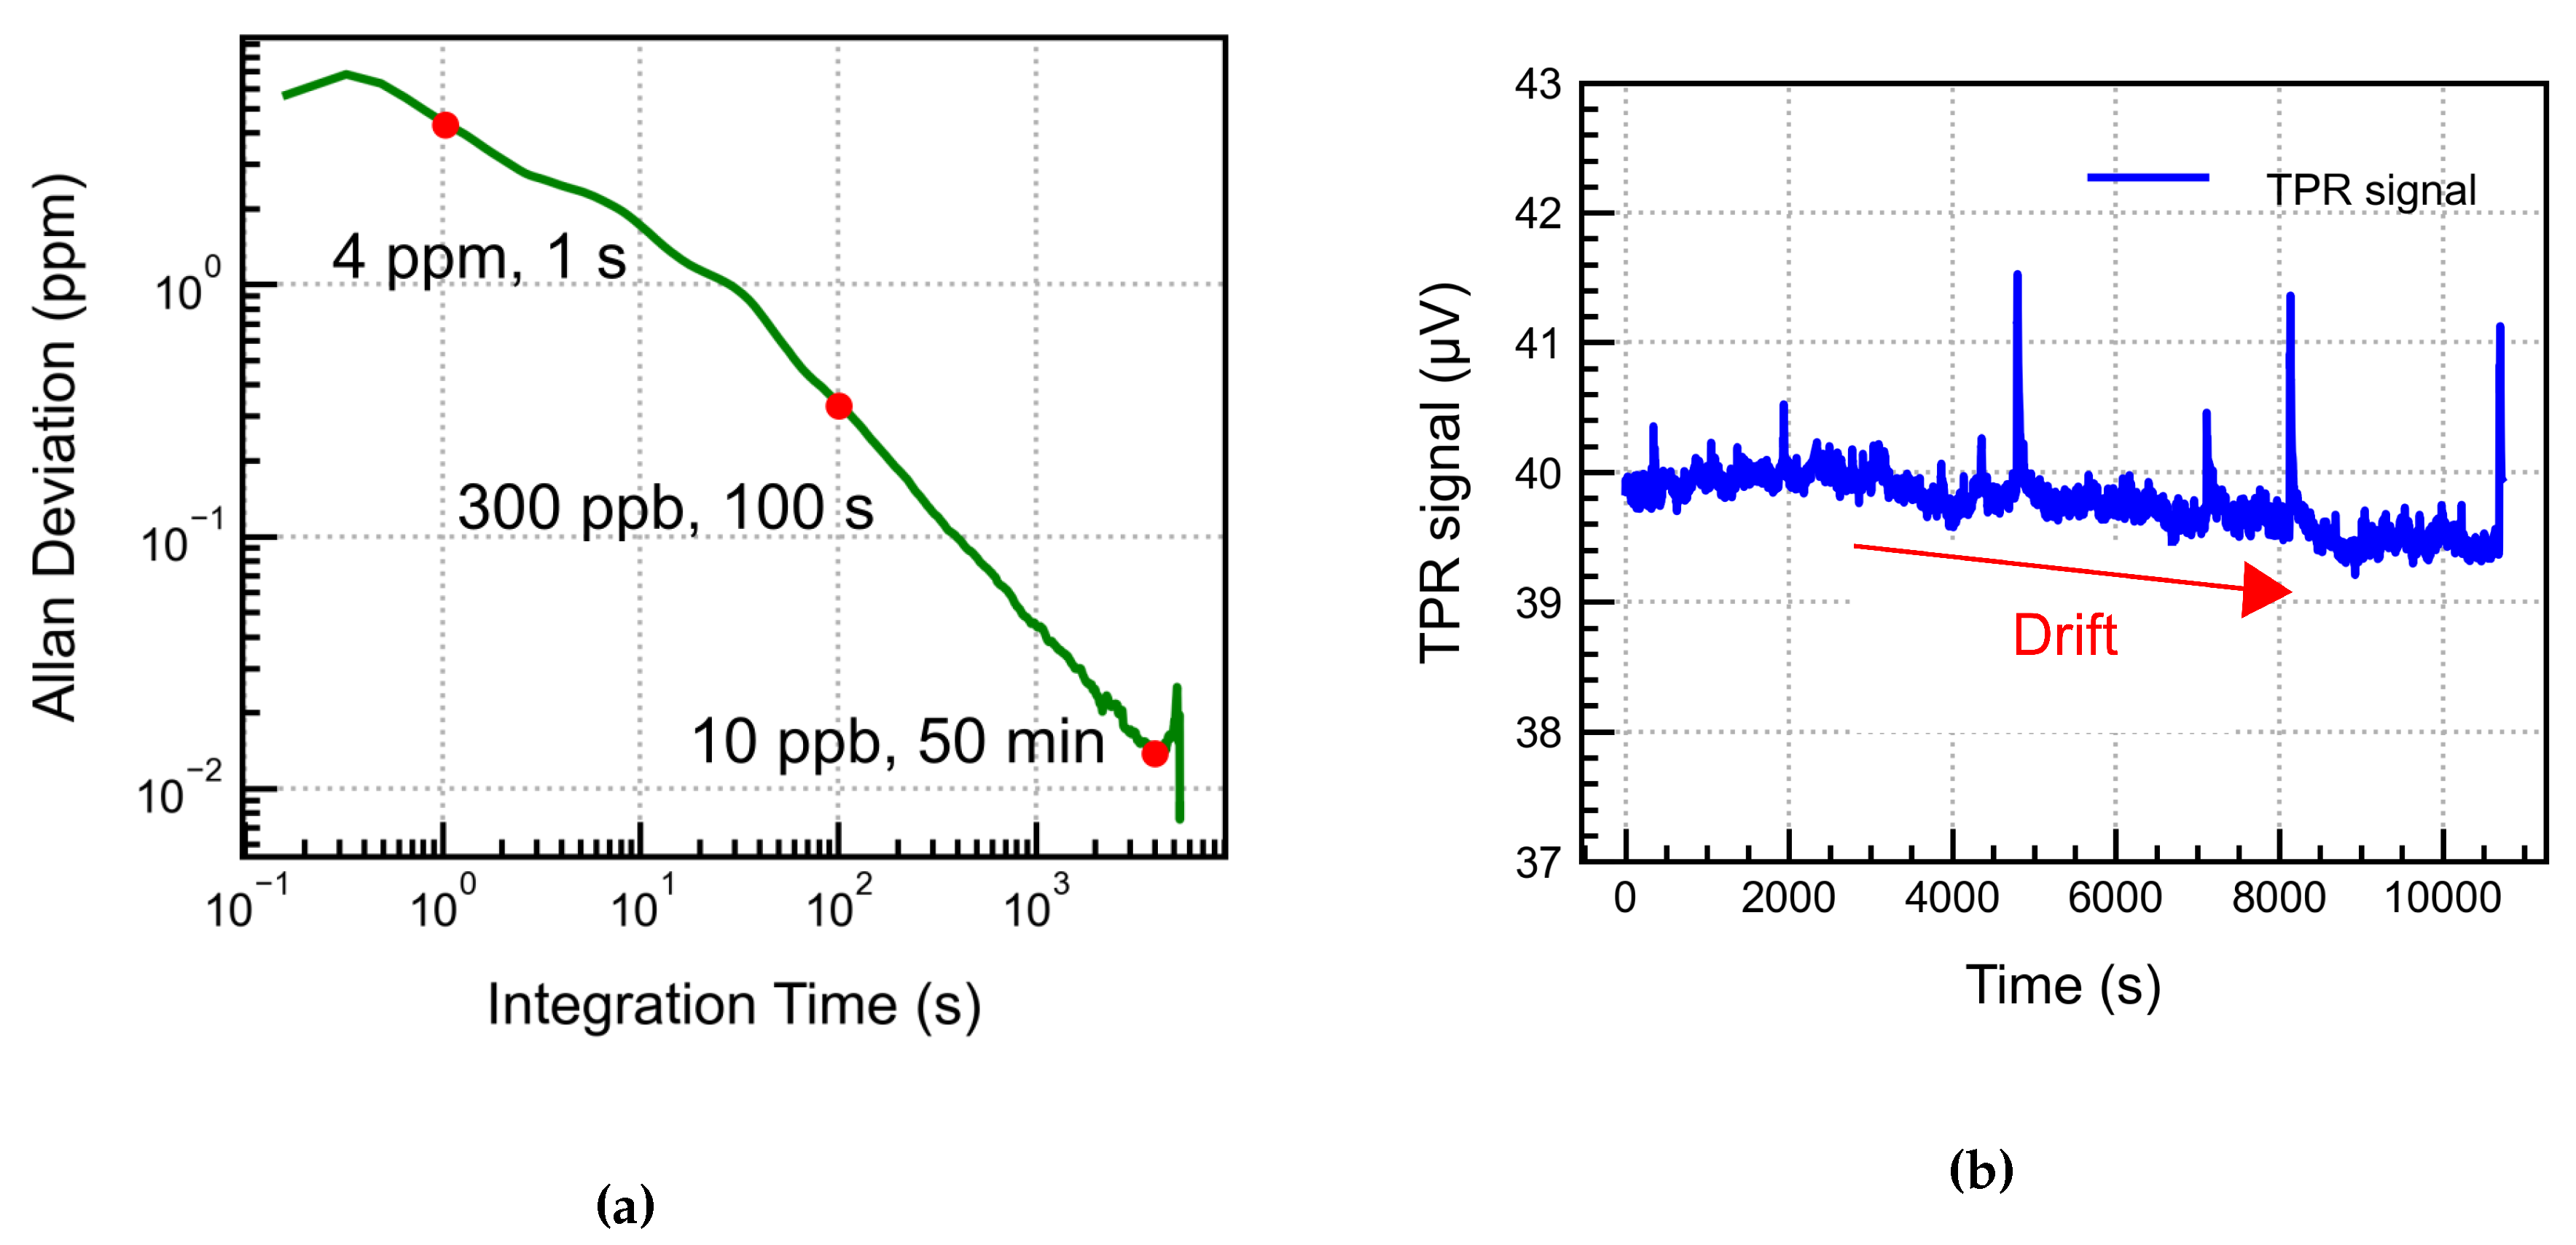

Table 1.
Design parameters used for simulation
| Parameter | Value | Unit |
|---|---|---|
| Pas | ||
| m | ||
| m | ||
| 18.4 | ||
| s | ||
| fit parameter | - | |
| fit parameter | ||
| G | fit parameter | - |
Disclaimer/Publisher’s Note: The statements, opinions and data contained in all publications are solely those of the individual author(s) and contributor(s) and not of MDPI and/or the editor(s). MDPI and/or the editor(s) disclaim responsibility for any injury to people or property resulting from any ideas, methods, instructions or products referred to in the content. |
© 2025 by the authors. Licensee MDPI, Basel, Switzerland. This article is an open access article distributed under the terms and conditions of the Creative Commons Attribution (CC BY) license (http://creativecommons.org/licenses/by/4.0/).
Copyright: This open access article is published under a Creative Commons CC BY 4.0 license, which permit the free download, distribution, and reuse, provided that the author and preprint are cited in any reuse.


