
Submitted:
26 March 2025
Posted:
26 March 2025
You are already at the latest version
Abstract
Noninvasive blood glucose monitoring is crucial for diabetes management, and photoacoustic spectroscopy (PAS) offers a promising solution by detecting glucose levels through the human skin. However, weak acoustic signals in PAS systems require optimized resonator designs for enhanced detection sensitivity. Designing such resonators physically is complex, requiring precise identification of critical parameters before practical implementation. This study focuses on optimizing a T-shaped photoacoustic resonator using finite element modeling in a COMSOL Multiphysics environment. By systematically varying the geometric design parameters of the T-cell resonator, a maximum increase in pressure amplitude of 12.76 times with a quality factor (Q-factor) of 47.5 was achieved to the previously designed reference acoustic resonator. This study takes a significant step forward by identifying key geometric parameters that influence resonator performance, paving the way for more sensitive and reliable noninvasive glucose monitoring systems.
Keywords:
Photoacoustic spectroscopy (PAS)
; acoustic resonator
; T-cell
; mid-infrared (MIR) spectroscopy
; Q-factor
; Photoacoustic resonator (PAR)
1. Introduction
Photoacoustic spectroscopy (PAS) is a promising analytical technique for detecting chemical compositions by measuring the optical absorption properties of samples [1,2,3,4,5]. With its advantages of high sensitivity, specificity, and precision, PAS has found applications in diverse fields, including environmental monitoring [6], industrial safety, biomedical diagnostics [7], and especially gas sensing [8]. In the PAS process, laser radiation is generally used for the excitation of the vibrational states of molecules for noninvasive glucose sensing. For excitation sources, Near-infrared (NIR) and Mid-infrared (MIR) laser sources are generally used because of their strong glucose absorption property in these spectral ranges. Among them, NIR measurements indicate relatively weak glucose absorption compared to MIR-based PAS due to background water absorption and high penetration depth. The accuracy of these measurements is compromised by significant interference from tissue and other blood components with similar absorption spectra. Also, unlike MIR-based PAS measurements, NIR measurements are affected by strong tissue scattering [9,10]. That’s why MIR-based PAS has gathered attention for its potential in noninvasive glucose monitoring by analyzing interstitial fluid (ISF) through the skin [11,12,13]. This approach addresses the growing need for painless, accurate, and real-time monitoring of blood glucose levels in diabetic patients. Despite its advantages, the implementation of PAS for noninvasive glucose detection faces significant challenges, primarily due to the weak acoustic waves generated from the photo-thermal energy conversion process [14].
The sensitivity of a PAS system depends on several factors, including the intensity of the modulated incident light, the sensitivity of the microphone, and the shape and structural design parameters of the resonant cell [15]. Resonant cells, in particular, play a critical role in amplifying the photoacoustic signal and ensuring efficient photo-thermal-acoustic energy conversion [15]. The intensity of the PA signal is greatly increased by the resonator when the modulated frequency of the incident light matches the inherent frequency of the resonator [16]. So far, considerable research has focused on modifying the shape of photoacoustic cells. In 2014, M. A. Pleitez et al. [17] developed a closed T-type cell for noninvasive glucose monitoring. This cell features two cylindrical cavities (resonance and absorption) that are connected perpendicularly. Notably, the absorption cavity has an optical window at one end and is open to samples at the other end. In the same year, they also created a windowless resonant cell that is open at both ends [18]. In contrast to the previously mentioned closed cell, the open cell design helps minimize the effects of temperature fluctuations, changes in air pressure, and the accumulation of humidity. As a result, the sensitivity and long-term stability of the cell are significantly enhanced. Consequently, open-type cells have drawn considerable attention in the field of biological sample detection [19,20,21,22]. For instance, J. Sim et al. [19,20] proposed a dominant resonance mode designed to match a microphone with an open cell. This method effectively improved the signal-to-noise ratio (SNR) and lowered the detection limit. Additionally, optimizing the size and shape of traditional H-type and T-type cells has led to a broader application of Photoacoustic Resonators (PARs) in trace gas detection [23,24,25,26,27]. For instance, X. Yin et al. developed a PA cell capable of detecting nitrogen dioxide (NO2) at sub-ppb levels with a large linear dynamic range [25]. In their studies, researchers have primarily focused on optimizing various PA cell shapes and achieving lower detection limits. However, these efforts have been limited by the absence of a systematic approach to achieve effective conceptual optimization designs.
In general, existing PAS systems often suffer from suboptimal resonator designs, limiting their ability to detect weak signals reliably. To address this limitation, considerable research has focused on optimizing the shape and structural parameters of PAR. In our recently published work [28], we summarized the different types of resonant cells used for non-invasive glucose detection through photoacoustic spectroscopy (PAS). We also highlighted key factors that need to be considered to enhance the system's response. Notably, T-shaped resonators have been commonly used in most cases for their high sensitivity, high Q-factor, and improved signal signal-to-noise ratio and numerical investigations have been also carried out to enhance the sensitivity [29]. In our recent works [30,31], we primarily designed a T-shaped resonator aimed at implementing MIR-based PAS with signal and double excitation wavelengths for noninvasive glucose sensing as a proof of concept. However, there has been no optimization work conducted on this initial PAR design. This acoustic resonator has the potential to amplify the generated signal in the acoustic domain. If the detected signal is amplified using a microphone without prior amplification in the acoustic domain, any noise present will also be amplified alongside the electrical signal, which is highly undesirable. Therefore, it is crucial to amplify the generated ultrasonic sound in the acoustic domain before converting it to an electrical signal. This approach helps extract the accurate information carried by the signal. Consequently, the analysis and optimization of T-shaped resonators serve as a key motivation for this research.
In this study, we focus on enhancing the amplitude of the signal at the resonant frequency using finite element modeling (COMSOL Multiphysics software), while also evaluating the quality (Q) factor with a custom-developed MATLAB script. Furthermore, we propose an optimized T-cell resonator design aimed at improving the sensitivity of PAS for noninvasive glucose detection. Through computational simulations, we demonstrate that optimizations to various parameters in the geometry of the T-type resonator significantly enhance signal strength. Additionally, we have identified a set of these parameters that gives the amplitude of the maximum pressure increases by 12.76 times compared to the reference amplitude. These findings pave the way for more accurate and reliable PAS for noninvasive glucose sensing.
2. General Principle of PAR for Signal Amplification & Simulation Method
2.1. Principle of PAS
Figure 1 shows a schematic view of the experimental setup used for the noninvasive detection of glucose concentration using PAS. A modulated laser light penetrates the skin tissue, causing the generation of an acoustic signal. This acoustic signal is first amplified by a PAR in the acoustic domain and further enhanced by a lock-in amplifier for additional processing in the electric domain. In this study, we primarily focus on the design improvements and analysis of the PAR to achieve a higher output signal, which will contribute to improved detection sensitivity.
2.1.1. Photoacoustic Resonator Model
Figure 2 presents a schematic representation of the PAR model. The dimensions and other parameters have been described in the following Table 1. The red arrow indicates the direction of the incident laser beam. In practical applications, the human fingertip is positioned on top of the absorption cylinder. The modulated laser beam hits the portion of the fingertip and generates acoustic signals.
For simulation purposes, the cavity cylinder, or the specified domain, is coupled in series and driven by a harmonically oscillating pressure, as represented by Eq. (1).
Here, represents a harmonically oscillating pressure wave whose initial value is determined by and , where denotes the frequency range as we have given from 10 to 30 kHz. The function "linper()" in Eq. (2) introduces a linear perturbation, which is a small variation to the initial pressure ="1 Pa" value. Furthermore, the study settings will provide a frequency range for ω. In this work, we set the frequency range from 8 to 32 kHz, as stated in the previous study [31].
2.2 Simulation Procedure
Figure 3 illustrates the process of simulating resonator models, which begins with selecting the appropriate physics. In this case, we used the pressure acoustic frequency domain (ACPR). Next, we choose the appropriate study methods, which include types: frequency sweep, frequency sweep with AWE (Asymptotic Waveform Evaluation), and modal solver frequency sweep. After that, we created the geometry, applied boundary conditions, and generated the mesh. We applied a sound-hard boundary wall condition to simulate a scenario where no signal can escape the enclosure. For meshing, we used a "user-controlled mesh," setting the maximum and minimum element sizes to 0.924 mm and 0.00324 mm, respectively. Finally, we extracted the pressure versus frequency spectrum from the study, along with the various frequency modes identified as described in the following section.
The different types of study procedures are described as follows [32]:
- The Frequency Domain solver addresses problems subjected to harmonic excitation at specified excitation frequencies. It provides a numerically exact solution for each frequency, ensuring that the results are reliable—given that the model converges and the meshing accurately resolves all relevant length scales in the physics;
- The Asymptotic Waveform Evaluation (AWE) does not compute the exact solution for every frequency. Instead, it performs a Taylor expansion of the solution around a few exact solutions, using lower-order approximations (such as Padé or Taylor) to estimate the solution across the desired frequency range;
- Additionally, the Frequency Domain Modal first determines a set of system eigenfrequencies and their corresponding eigenmodes, either by searching within a user-defined range or for a predetermined number of frequencies.
2.2.1. Related Modeling Equations and Variables:
This PAR model is designed to amplify the PA signal in COMSOL Multiphysics by using the “Pressure Acoustic frequency domain” module. For Pressure acoustic, acoustic perturbations, or acoustic changes, to the ambient pressure, are represented by the sound pressure p, which is the result of solving for it in pressure acoustics. The frequency domain, or time-harmonic, formulation uses the inhomogeneous Helmholtz equation [33]:
The total pressure () which is the sum of input pressure () and possible background pressure field ), = ⍴ (density of air), = c (speed of sound), = monopole domain source. The boundary at which the normal component of the acceleration (and thus the speed) is zero:
For zero dipole domain source () and constant fluid density, this means that the normal derivative of the pressure is zero at the boundary.
2.2.2. COMSOL Terminal & Meshed View
Figure 4 presents a model of a PAR that requires a specific set of parameters for accurate simulation. These parameters include resonance cylinder radius (r), length (l), cavity cylinder radius (R), length (L), sound speed (C), minimum frequency (min), and maximum frequency (max), among others. The values of these parameters were taken from the Ref. source [31] and used throughout the modeling process to simulate and compare the behavior of the resonator geometry. It is important to note that these parameters can be optimized to adjust the resonance frequency of the PAR for various applications.
2.2.3. Quality () Factor and Amplification Factor () Determination
A higher Q factor indicates a sharper resonance peak and can be represented as follows:
Where, is the resonance frequency, while the increment ∆f represents the difference in frequencies at which the pressure amplitude value has decreased to half of its resonance value. Improving the shape of the resonator can further optimize the amplification of the photoacoustic signal by enhancing the quality factor through a reduction in losses.
As the main objective of this work is to increase the acoustic signal ( at a resonance frequency and compare it with the signal strength of the reference cell (, we define a parameter amplification factor () as follows:
3. Results & Discussion
3.1. Results Obtained from the Initial Parameter of Reference Cell
In Figure 5(I), the pressure versus frequency response is illustrated. A linear scale was used, and the frequency range was adjusted from 8 kHz to 32 kHz as in the previous work [31], In their experimental setup, they used a single-wavelength quantum cascade laser (QCL) with the laser current modulated from 10 kHz to 30 kHz. In Figure 5(II) mode representation of the corresponding points of the previous figure was illustrated. In sub-figure (a), the antinode (a point in a standing wave where the amplitude of vibration is maximum) is positioned in the bottom portion of the cavity cylinder. For a resonator, placing a component such as the resonance cylinder at an antinode ensures maximum acoustic coupling, resulting in a stronger pressure signal. In sub-figure (b), the antinode is perfectly located at the end of the resonant cylinder where the microphone will be placed. However, the other two mode representations show that the antinode is situated in the middle of the resonant cylinder. One of the main objectives of this work was to amplify the signal amplitudes identified in previous studies, which is why we selected this specific frequency range. In the upcoming section, we will primarily focus on the amplitude difference, which signifies the resonator's ability to facilitate effective non-invasive blood glucose detection. Additionally, we will examine the quality factor and the effects of varying different parameters of our initially designed T-shaped cell.
The Q-factors associated with the designed model are 18.06 and 38.60 for the corresponding frequencies of 16 kHz and 21 kHz.
3.3. Effect of Changing Different Geometrical Parameters
3.3.1. Effect of Changing Resonance Cylinder Parameters
Figure 6 illustrates the effects of varying different geometric parameters of the resonance cylinder. In this context, we define the ratio of the present value to the initial amplitude of the pressure as α. Our analysis indicates that for a specific combination of resonance cylinder parameters, we obtained a value of α equal to 9.07, indicating a significant amplification of the pressure values. By adjusting the parameters further, we achieved a greater amplification in the pressure versus frequency response. A contour plot was also generated to visualize the variation of the Q-factor as a function of l and r. The highest Q-factor (47.5) is observed at l = 13 mm, r = 0.77 mm, marked by a red region. The plot reveals a peak around l = 13 mm, suggesting an optimal geometry for achieving maximum resonance.
3.3.2. Effect of Changing Cavity Cylinder Parameters
From Figure 7, we can observe that the value of α is 12.76, indicating a significant amplification of the initially generated pressure. In this case, for the combination of the values of R and L, which are 1.6 mm and 5 mm, we obtained the highest Q-factor of 47.5 marked in red as shown in Fig. 7(c). Additionally, the mode representation at the corresponding 16 kHz frequency is depicted in Fig. 7(d), showing that, the antinode is spotted at the end of the resonance cylinder.
3.3.2. Effect of Changing the Resonance Cylinder Position
In Figure 8, the 3D surface plot demonstrates the variation of α and Q-factor for the resonator cylinder position. The color gradient emphasizes areas of high and low-pressure amplification, with peak values occurring at specific resonator positions where the Q-factor is optimized. This visualization aids in identifying the optimal placement of the resonance cylinder to achieve maximum pressure enhancement, offering insights into resonance behavior and system efficiency. The maximum value of the Q-factor was observed in the initial position, while the maximum amplification was noted at K of 2.09 mm.
3.3.3. Effect of Changing Both the Resonance & Cavity Cylinder Parameters
From Figure 9, we can observe that at 16 kHz, the maximum pressure value is 121.2 Pa, which is nearly 2.7 times higher than the previous maximum pressure value that was found in the initial parameters. Additionally, we achieved a Q-factor of 42 at 16 kHz, which is significantly greater than the previous Q-factor at this frequency. Also, a mode representation for the corresponding frequencies has been added for better understanding.
Figure 10 shows the comparison of the pressure vs frequency response between the initial parameters and after the modification applied to all the parameters. Here, we can observe that the maximum pressure value that we obtained is 42 Pa, which is less than the maximum pressure of the initial parameters. Also, mode representation at the corresponding frequency has been added in Fig. 10 (b).
The study focused on optimizing the design of a T-shaped PAR to enhance the sensitivity of noninvasive blood glucose detection using photoacoustic spectroscopy (PAS). We conducted computational simulations using COMSOL Multiphysics to systematically investigate how varying geometric parameters, such as the diameter and length of the cavity and resonance cylinders, and the position of the resonant cylinder, affect the resonator's performance. Our results showed that modifying these parameters significantly impacted the amplitude of the photoacoustic signal and the quality factor, both of which are critical for improving detection sensitivity. A key finding was that a slight increase in the length and radius of the cavity cylinder led to a substantial increase in the amplification factor (α) to 12.8, which can be observed for the combination of parameters(b) mentioned in the table. This suggests that the length of the cavity cylinder is a crucial parameter for amplifying the photoacoustic signal. However, the Q-factor did not display a consistent trend with changes in the parameters, indicating that small deviations from the initial settings can significantly affect the resonator's performance. This underscores the importance of precise alignment in practical applications. Additionally, we observed that increasing the diameter of the resonance cylinder from its base value amplified the sound pressure by a factor of 9.07 mentioned in combination(a) of Table 2. This suggests that there is an optimal diameter range for maximizing both signal strength and quality. Overall, the study provides valuable insights into the geometric optimization of T-shaped resonators for PAS-based glucose detection. Finally, in the combination (c) and (d), as mentioned in Table 2, we mainly observe the effect of the amplification factor(α) and Q-factor when we combine the change of all parameters. The findings indicate that careful tuning of the resonator's dimensions and positioning can significantly enhance signal amplification and detection sensitivity, paving the way for more accurate and reliable noninvasive glucose monitoring systems.
4. Conclusion
In conclusion, this study successfully demonstrated the potential of optimizing T-shaped PARs to enhance the sensitivity of noninvasive blood glucose detection using photoacoustic spectroscopy. By systematically varying geometric parameters such as the diameter, length, and position of the cavity and resonance cylinders, we identified key factors that influence both the amplitude of the photoacoustic signal and the quality factor. The results indicated that increasing the length and radius of the cavity cylinder significantly amplified the signal, while the diameter of the resonance cylinder also played a critical role in improving performance. These findings suggest that precise geometric optimization can lead to substantial improvements in signal strength and detection sensitivity, which are essential for developing reliable noninvasive glucose monitoring devices. Future work should focus on further refining the resonator design to minimize losses and enhance the Q-factor, as well as on the experimental validation of the optimized resonator in real-world applications. This research contributes to the ongoing efforts to develop painless, accurate, and real-time glucose monitoring solutions for diabetic patients, ultimately improving their quality of life.
Author Contributions
Conceptualization, M.R.K., and T.M.Z.; data curation, M.R.K., and T.M.Z.; formal analysis, M.R.K.; funding acquisition, D.B.; investigation, M.R.K., T.M.Z., and S.R.; methodology, M.R.K., and T.M.Z.; project administration, D.B.; resources, D.B.; supervision, D.B.; validation, M.R.K.; visualization, M.R.K.; writing—original draft, M.R.K. and T.M.Z.; writing—review and editing, M.R.K., T.M.Z., and S.R. All authors have read and agreed to the published version of the manuscript.
Funding
This research received no external funding.
Data Availability Statement
Not applicable.
Acknowledgments
MRK would like to acknowledge the research support from the UGC through CASR at KUET. SR acknowlegdge the “2024 Seed Grant” Research and Sponsor Program, Tennessee State University.
Conflicts of Interest
The authors declare no conflicts of interest.
References
- T. Han, M. Yang, F. Yang, L. Zhao, Y. Jiang, and C. Li, “A three-dimensional modeling method for quantitative photoacoustic breast imaging with handheld probe,” Photoacoustics, vol. 21, p. 100222, Mar. 2021. [CrossRef]
- V. Zéninari, C. M. Ibrahim, R. Vallon, and B. Parvitte, “Simulation of the non-linearity of photoacoustic signals for the detection of molecules of atmospheric interest,” 2020. [Online]. Available: https://api.semanticscholar.org/CorpusID:225733094.
- A. Bauer, O. Hertzberg, A. Küderle, D. Strobel, M. A. Pleitez, and W. Mäntele, “IR-spectroscopy of skin in vivo : Optimal skin sites and properties for non-invasive glucose measurement by photoacoustic and photothermal spectroscopy,” J. Biophotonics, vol. 11, no. 1, Jan. 2018. [CrossRef]
- P. P. Pai, P. K. Sanki, S. Sarangi, and S. Banerjee, “Modelling, verification, and calibration of a photoacoustics based continuous non-invasive blood glucose monitoring system,” Rev. Sci. Instrum., vol. 86, no. 6, Jun. 2015. [CrossRef]
- Sadiek, T. Mikkonen, M. Vainio, J. Toivonen, and A. Foltynowicz, “Optical frequency comb photoacoustic spectroscopy,” Phys. Chem. Chem. Phys., vol. 20, no. 44, pp. 27849–27855, 2018. [CrossRef]
- M. Siciliani de Cumis et al., “Widely-tunable mid-infrared fiber-coupled quartz-enhanced photoacoustic sensor for environmental monitoring,” Opt. Express, vol. 22, no. 23, p. 28222, Nov. 2014. [CrossRef]
- A. Hussain, W. Petersen, J. Staley, E. Hondebrink, and W. Steenbergen, “Quantitative blood oxygen saturation imaging using combined photoacoustics and acousto-optics,” Opt. Lett., vol. 41, no. 8, p. 1720, Apr. 2016. [CrossRef]
- L. Fu et al., “All-optical non-resonant photoacoustic spectroscopy for multicomponent gas detection based on aseismic photoacoustic cell,” Photoacoustics, vol. 34, p. 100571, Dec. 2023. [CrossRef]
- Yadav, A. Rani, V. Singh, and B. M. Murari, “Prospects and limitations of non-invasive blood glucose monitoring using near-infrared spectroscopy,” Biomed. Signal Process. Control, vol. 18, pp. 214–227, Apr. 2015. [CrossRef]
- J. Burmeister and M. A. Arnold, “Evaluation of Measurement Sites for Noninvasive Blood Glucose Sensing with Near-Infrared Transmission Spectroscopy,” Clin. Chem., vol. 45, no. 9, pp. 1621–1627, Sep. 1999. [CrossRef]
- J. Kottmann, J. M. Rey, J. Luginbühl, E. Reichmann, and M. W. Sigrist, “Glucose sensing in human epidermis using mid-infrared photoacoustic detection,” Biomed. Opt. Express, vol. 3, no. 4, p. 667, Apr. 2012. [CrossRef]
- J. Kottmann, U. Grob, J. Rey, and M. Sigrist, “Mid-Infrared Fiber-Coupled Photoacoustic Sensor for Biomedical Applications,” Sensors, vol. 13, no. 1, pp. 535–549, Jan. 2013. [CrossRef]
- Tachibana, K. Okada, R. Kobayashi, and Y. Ishihara, “Development of a high-sensitivity and portable cell using Helmholtz resonance for noninvasive blood glucose-level measurement based on photoacoustic spectroscopy,” in 2016 38th Annual International Conference of the IEEE Engineering in Medicine and Biology Society (EMBC), IEEE, Aug. 2016, pp. 6477–6480. [CrossRef]
- Z. Tang et al., “Performance Enhancement of Opened Resonance Photoacoustic Cells Based on Three Dimensional Topology Optimization,” Photonics, vol. 8, no. 9, p. 380, Sep. 2021. [CrossRef]
- S. Manohar and D. Razansky, “Photoacoustics: a historical review,” Adv. Opt. Photonics, vol. 8, no. 4, p. 586, Dec. 2016. [CrossRef]
- V. A. Kapitanov, V. Zeninari, B. Parvitte, D. Courtois, and Y. N. Ponomarev, “Optimisation of photoacoustic resonant cells with commercial microphones for diode laser gas detection,” Spectrochim. Acta Part A Mol. Biomol. Spectrosc., vol. 58, no. 11, pp. 2397–2404, Sep. 2002. [CrossRef]
- M. A. Pleitez, T. Lieblein, A. Bauer, O. Hertzberg, H. von Lilienfeld-Toal, and W. Mäntele, “In Vivo Noninvasive Monitoring of Glucose Concentration in Human Epidermis by Mid-Infrared Pulsed Photoacoustic Spectroscopy,” Anal. Chem., vol. 85, no. 2, pp. 1013–1020, Jan. 2013. [CrossRef]
- M. A. Pleitez, T. Lieblein, A. Bauer, O. Hertzberg, H. von Lilienfeld-Toal, and W. Mäntele, “Windowless ultrasound photoacoustic cell for in vivo mid-IR spectroscopy of human epidermis: Low interference by changes of air pressure, temperature, and humidity caused by skin contact opens the possibility for a non-invasive monitoring of glucose in th,” Rev. Sci. Instrum., vol. 84, no. 8, Aug. 2013. [CrossRef]
- J. Y. Sim, C.-G. Ahn, E. Jeong, and B. K. Kim, “Photoacoustic spectroscopy that uses a resonant characteristic of a microphone for in vitro measurements of glucose concentration,” in 2016 38th Annual International Conference of the IEEE Engineering in Medicine and Biology Society (EMBC), IEEE, Aug. 2016, pp. 4861–4864. [CrossRef]
- J. Sim, C.-G. Ahn, C. Huh, K. Chung, E.-J. Jeong, and B. Kim, “Synergetic Resonance Matching of a Microphone and a Photoacoustic Cell,” Sensors, vol. 17, no. 4, p. 804, Apr. 2017. [CrossRef]
- S. A. S. El-Busaidy, B. Baumann, M. Wolff, and L. Duggen, “Modelling of open photoacoustic resonators,” Photoacoustics, vol. 18, p. 100161, Jun. 2020. [CrossRef]
- J. Y. Sim, C.-G. Ahn, E.-J. Jeong, and B. K. Kim, “In vivo Microscopic Photoacoustic Spectroscopy for Non-Invasive Glucose Monitoring Invulnerable to Skin Secretion Products,” Sci. Rep., vol. 8, no. 1, p. 1059, Jan. 2018. [CrossRef]
- B. Kost, B. Baumann, M. Wolff, and H. Groninga, “Towards the optimization of photoacoustic sensors,” in Computer Aided Optimum Design in Engineering X, in WIT Transactions on The Built Environment, Vol 91, vol. I. Southampton, UK: WIT Press, Apr. 2007, pp. 97–106. [CrossRef]
- M. Wolff, B. Kost, and B. Baumann, “Shape-Optimized Photoacoustic Cell: Numerical Consolidation and Experimental Confirmation,” Int. J. Thermophys., vol. 33, no. 10–11, pp. 1953–1959, Nov. 2012. [CrossRef]
- X. Yin et al., “Sub-ppb nitrogen dioxide detection with a large linear dynamic range by use of a differential photoacoustic cell and a 3.5 W blue multimode diode laser,” Sensors Actuators B Chem., vol. 247, pp. 329–335, Aug. 2017. [CrossRef]
- Z. Gong, K. Chen, Y. Chen, L. Mei, and Q. Yu, “Integration of T-type half-open photoacoustic cell and fiber-optic acoustic sensor for trace gas detection,” Opt. Express, vol. 27, no. 13, p. 18222, Jun. 2019. [CrossRef]
- Z. Gong et al., “Ppb-level detection of methane based on an optimized T-type photoacoustic cell and a NIR diode laser,” Photoacoustics, vol. 21, p. 100216, Mar. 2021. [CrossRef]
- M. R. Kaysir, T. M. Zaman, S. Rassel, J. Wang, and D. Ban, “Photoacoustic Resonators for Non-Invasive Blood Glucose Detection Through Photoacoustic Spectroscopy: A Systematic Review,” Sensors, vol. 24, no. 21, p. 6963, Oct. 2024. [CrossRef]
- S. El-Busaidy, B. Baumann, M. Wolff, L. Duggen, and H. Bruhns, “Experimental and Numerical Investigation of a Photoacoustic Resonator for Solid Samples: Towards a Non-Invasive Glucose Sensor,” Sensors, vol. 19, no. 13, p. 2889, Jun. 2019. [CrossRef]
- A. Aloraynan, S. Rassel, M. R. Kaysir, and D. Ban, “Dual quantum cascade lasers for noninvasive glucose detection using photoacoustic spectroscopy,” Sci. Rep., vol. 13, no. 1, p. 7927, May 2023. [CrossRef]
- Aloraynan, S. Rassel, C. Xu, and D. Ban, “A Single Wavelength Mid-Infrared Photoacoustic Spectroscopy for Noninvasive Glucose Detection Using Machine Learning,” Biosensors, vol. 12, no. 3, p. 166, Mar. 2022. [CrossRef]
- “Helmholtz Resonator Analyzed with Different Frequency Domain Solvers.” Accessed: Dec. 25, 2024. [Online]. Available: https://www.comsol.com/model/helmholtz-resonator-analyzed-with-different-frequency-domain-solvers-20263.
- “The Pressure Acoustics, Frequency Domain Interface.” Accessed: Dec. 25, 2024. [Online]. Available: https://doc.comsol.com/5.5/doc/com.comsol.help.aco/aco_ug_pressure.05.002.html.
Figure 1.
The basic experimental setup for generating and detecting acoustic signals in the PAR-based photoacoustic spectroscopy (PAS), the detection arrangement includes a microphone (MIC), a lock-in amplifier, an analog-to-digital converter (A/D converter), a digital filter, integrated into the signal amplifier and analyzer block and a personal computer (PC).
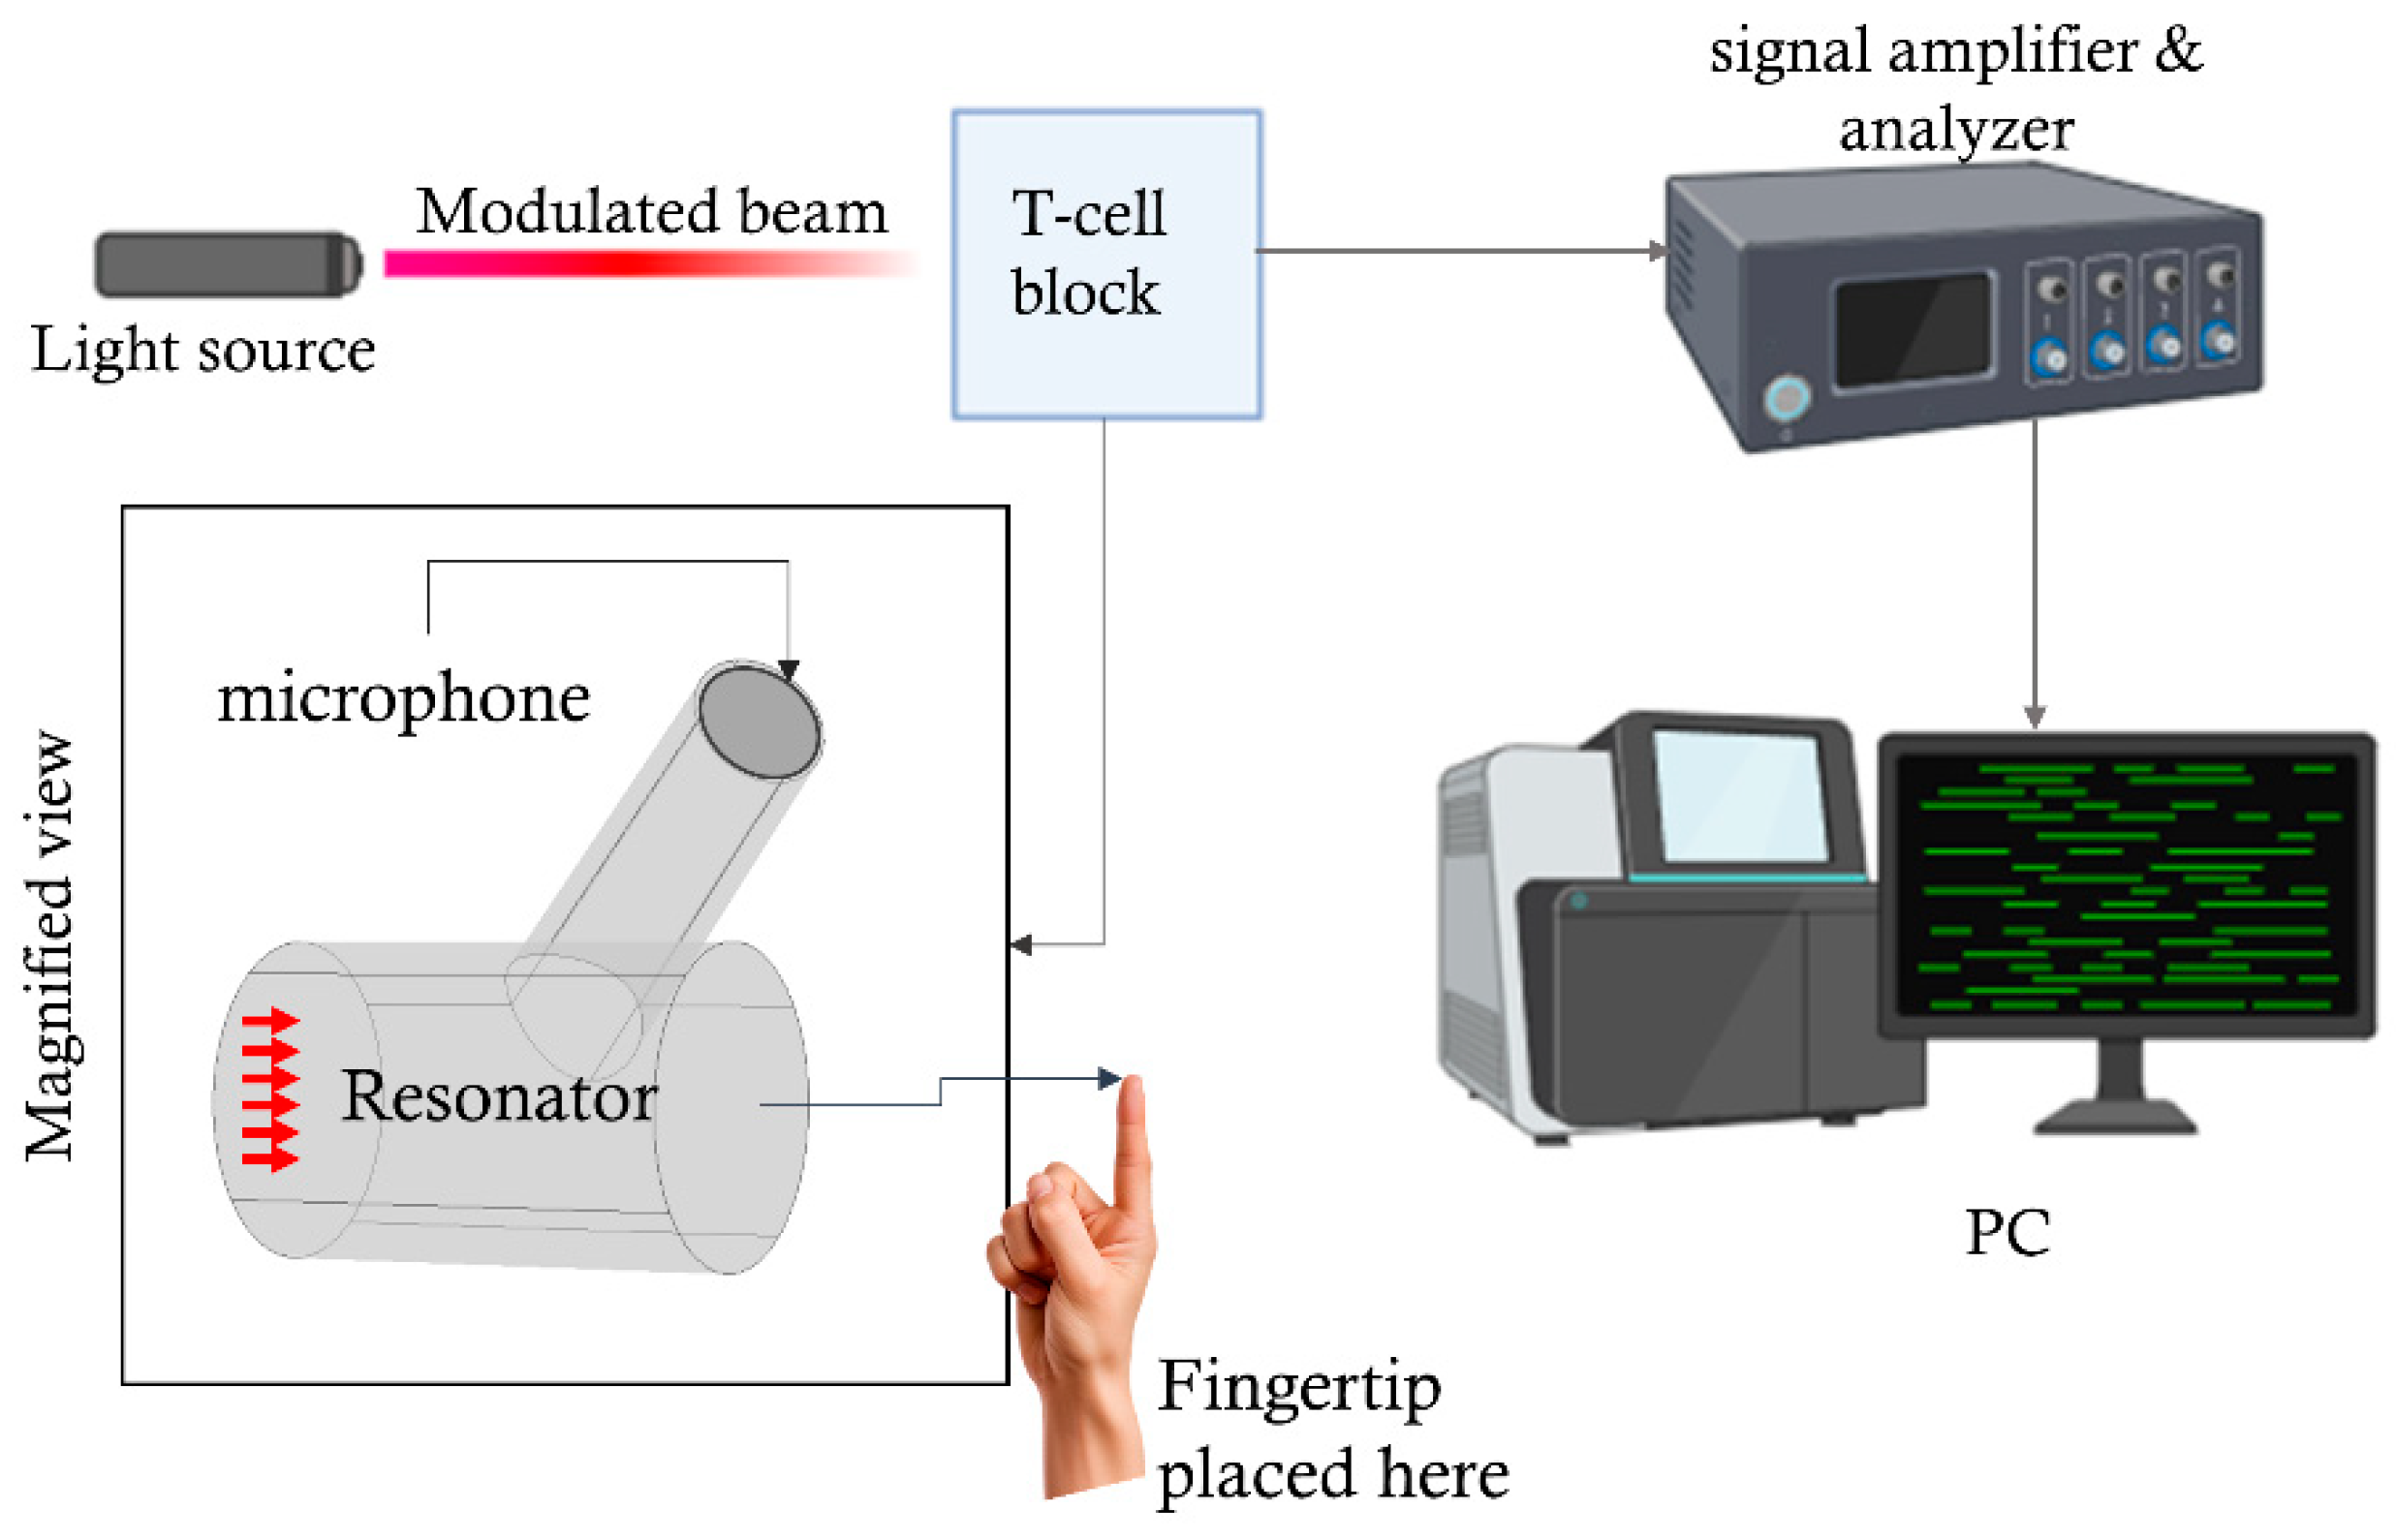
Figure 2.
Schematic representation of T-shaped resonant cell structure with structural design parameters (a) 2D cross-sectional view (b) 3D view [Here: cyl: Cylinder].
Figure 2.
Schematic representation of T-shaped resonant cell structure with structural design parameters (a) 2D cross-sectional view (b) 3D view [Here: cyl: Cylinder].
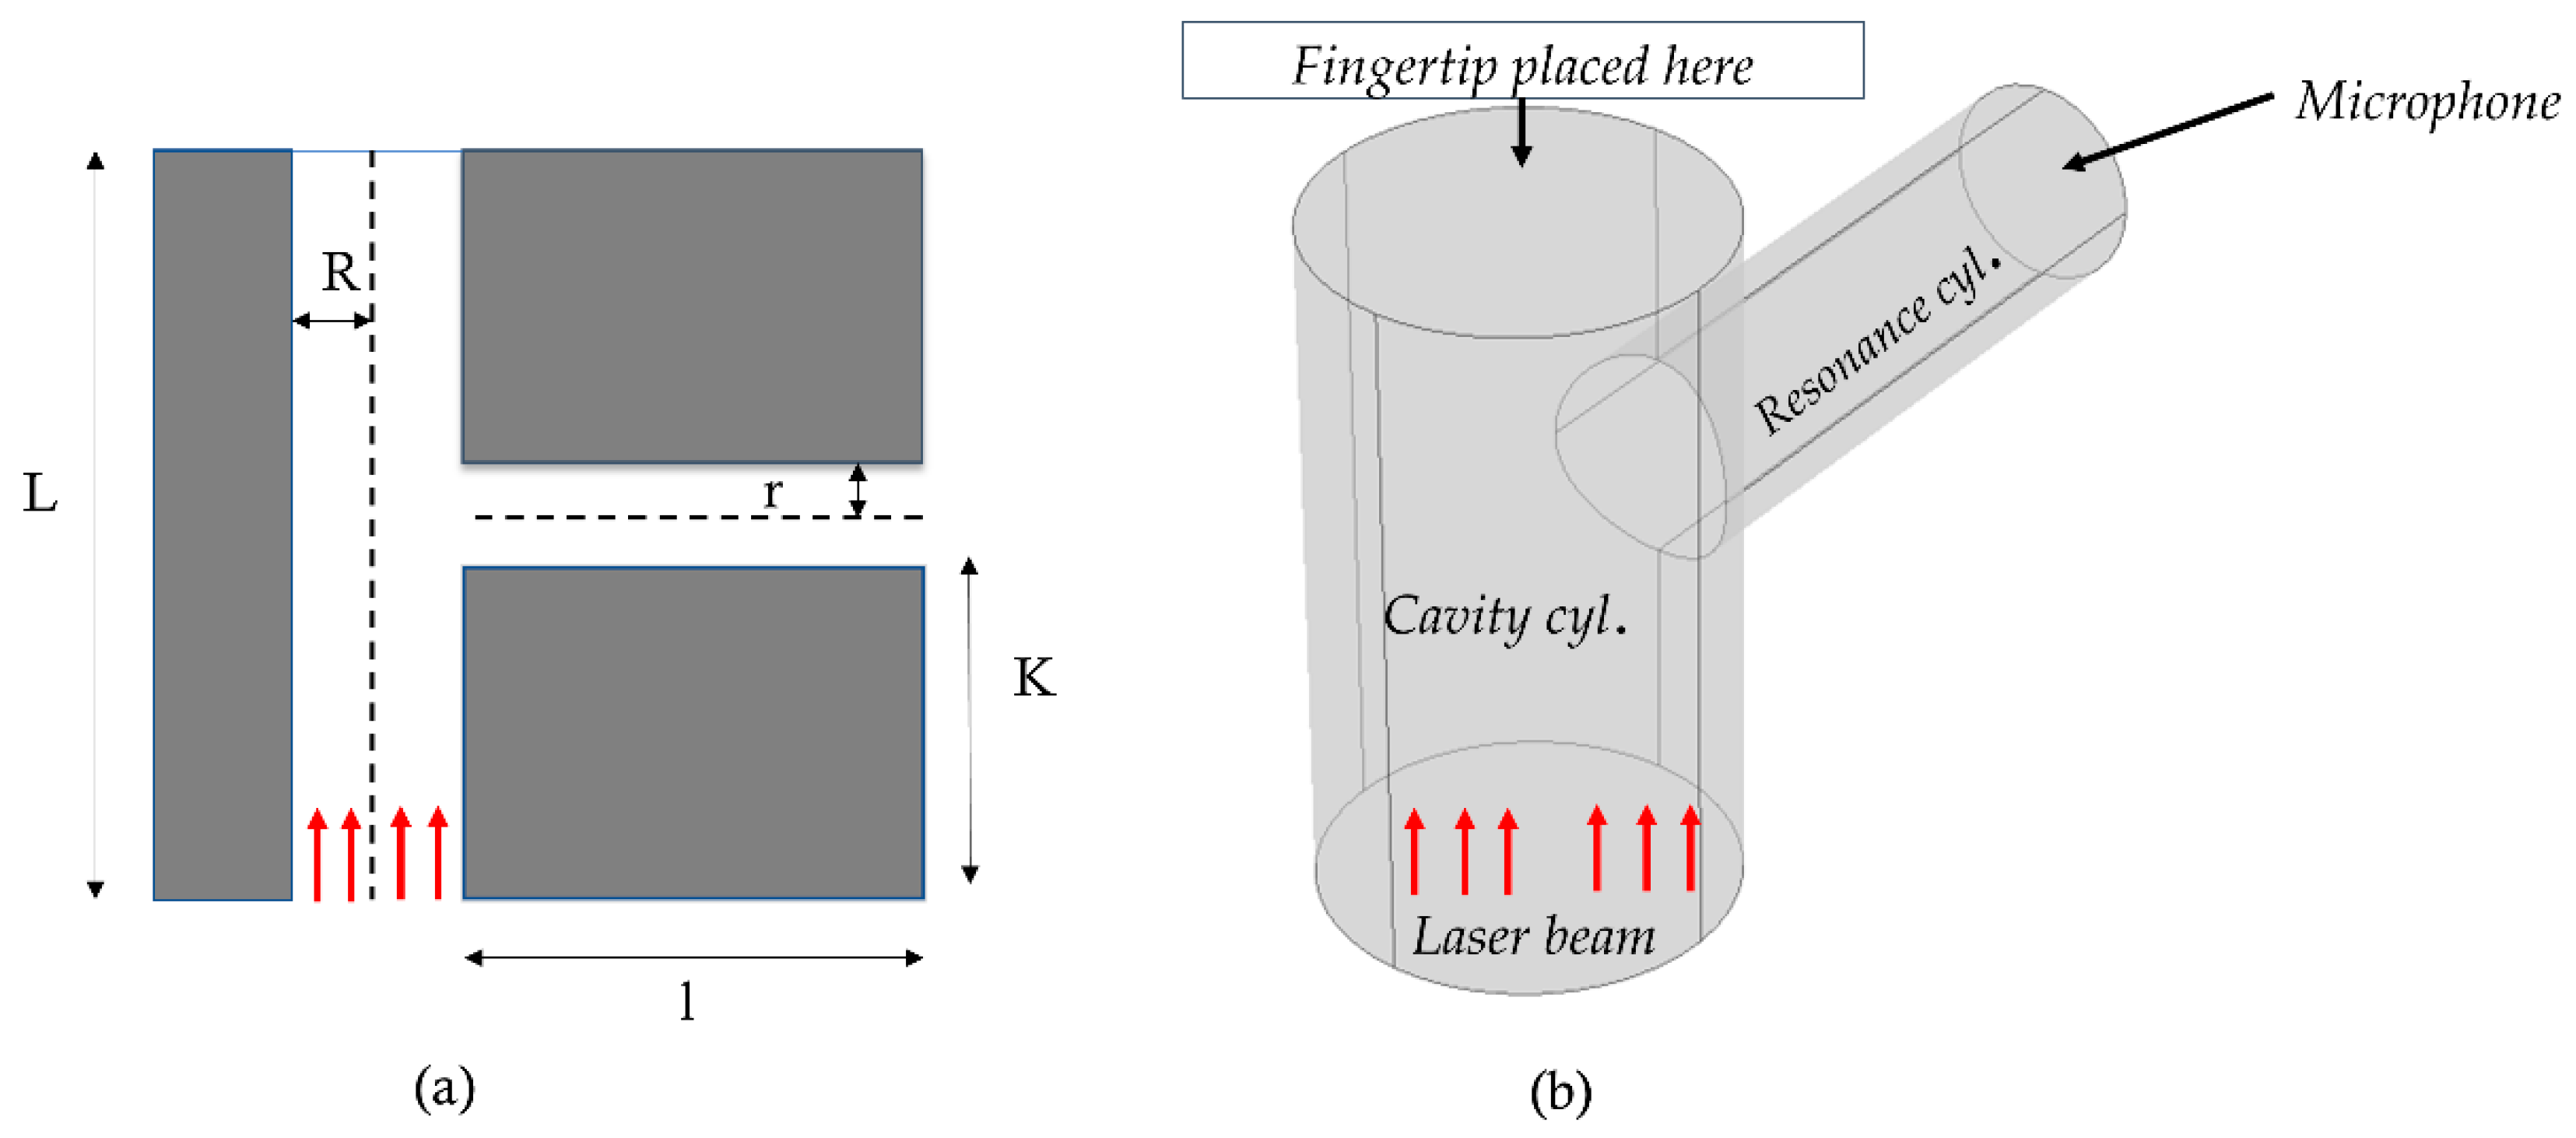
Figure 3.
Flowchart of simulation procedures of modeling PAR.
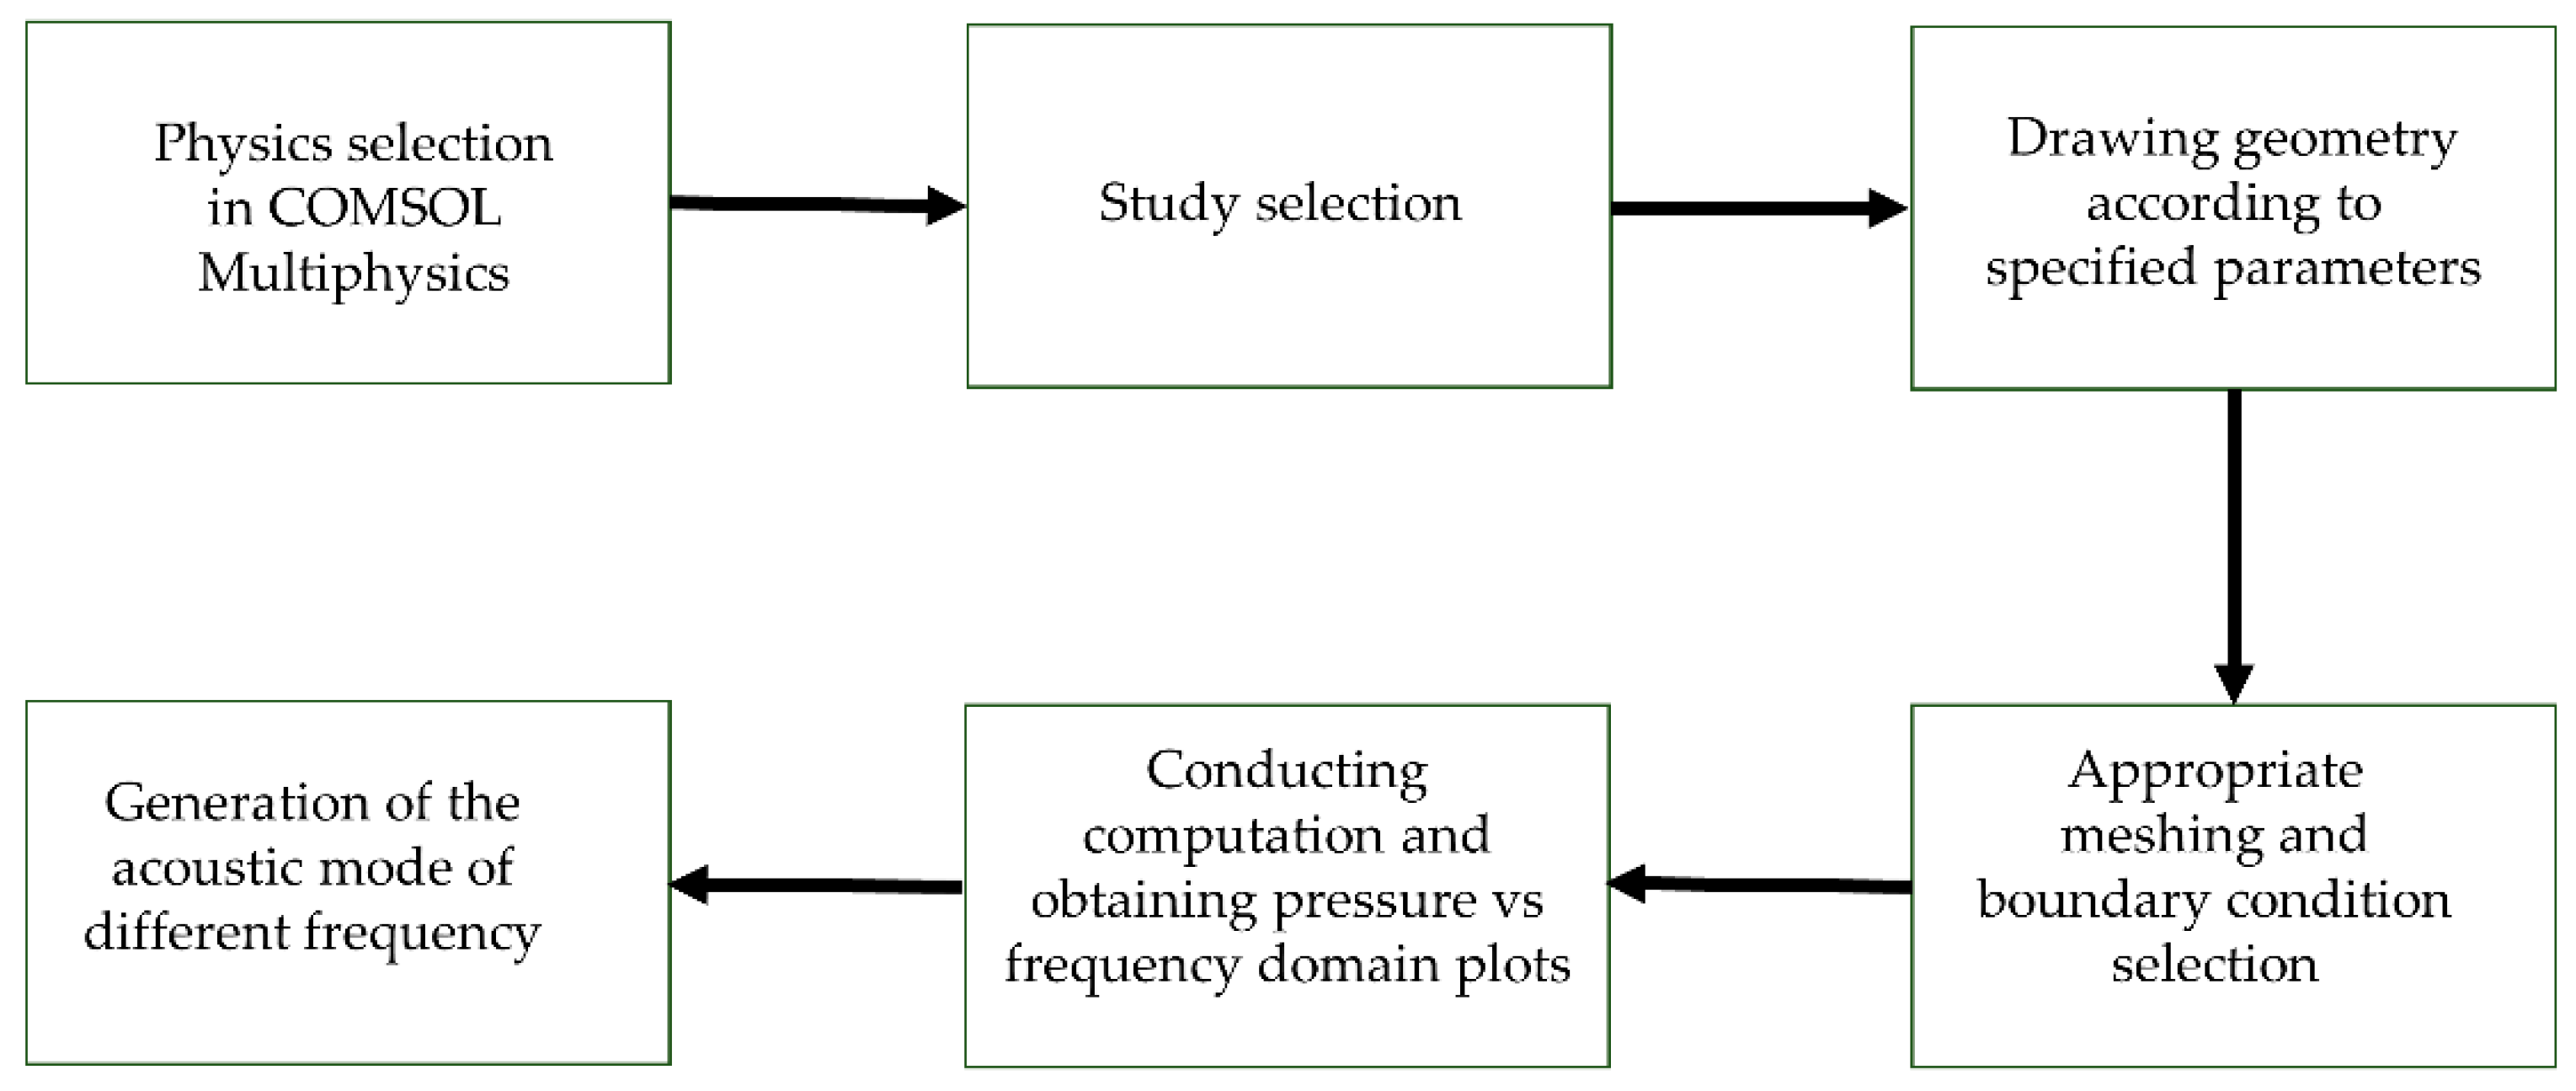
Figure 4.
Pictorial representation of T-shaped resonator (a) Terminal view of COMSOL (b) Meshed representation.
Figure 4.
Pictorial representation of T-shaped resonator (a) Terminal view of COMSOL (b) Meshed representation.
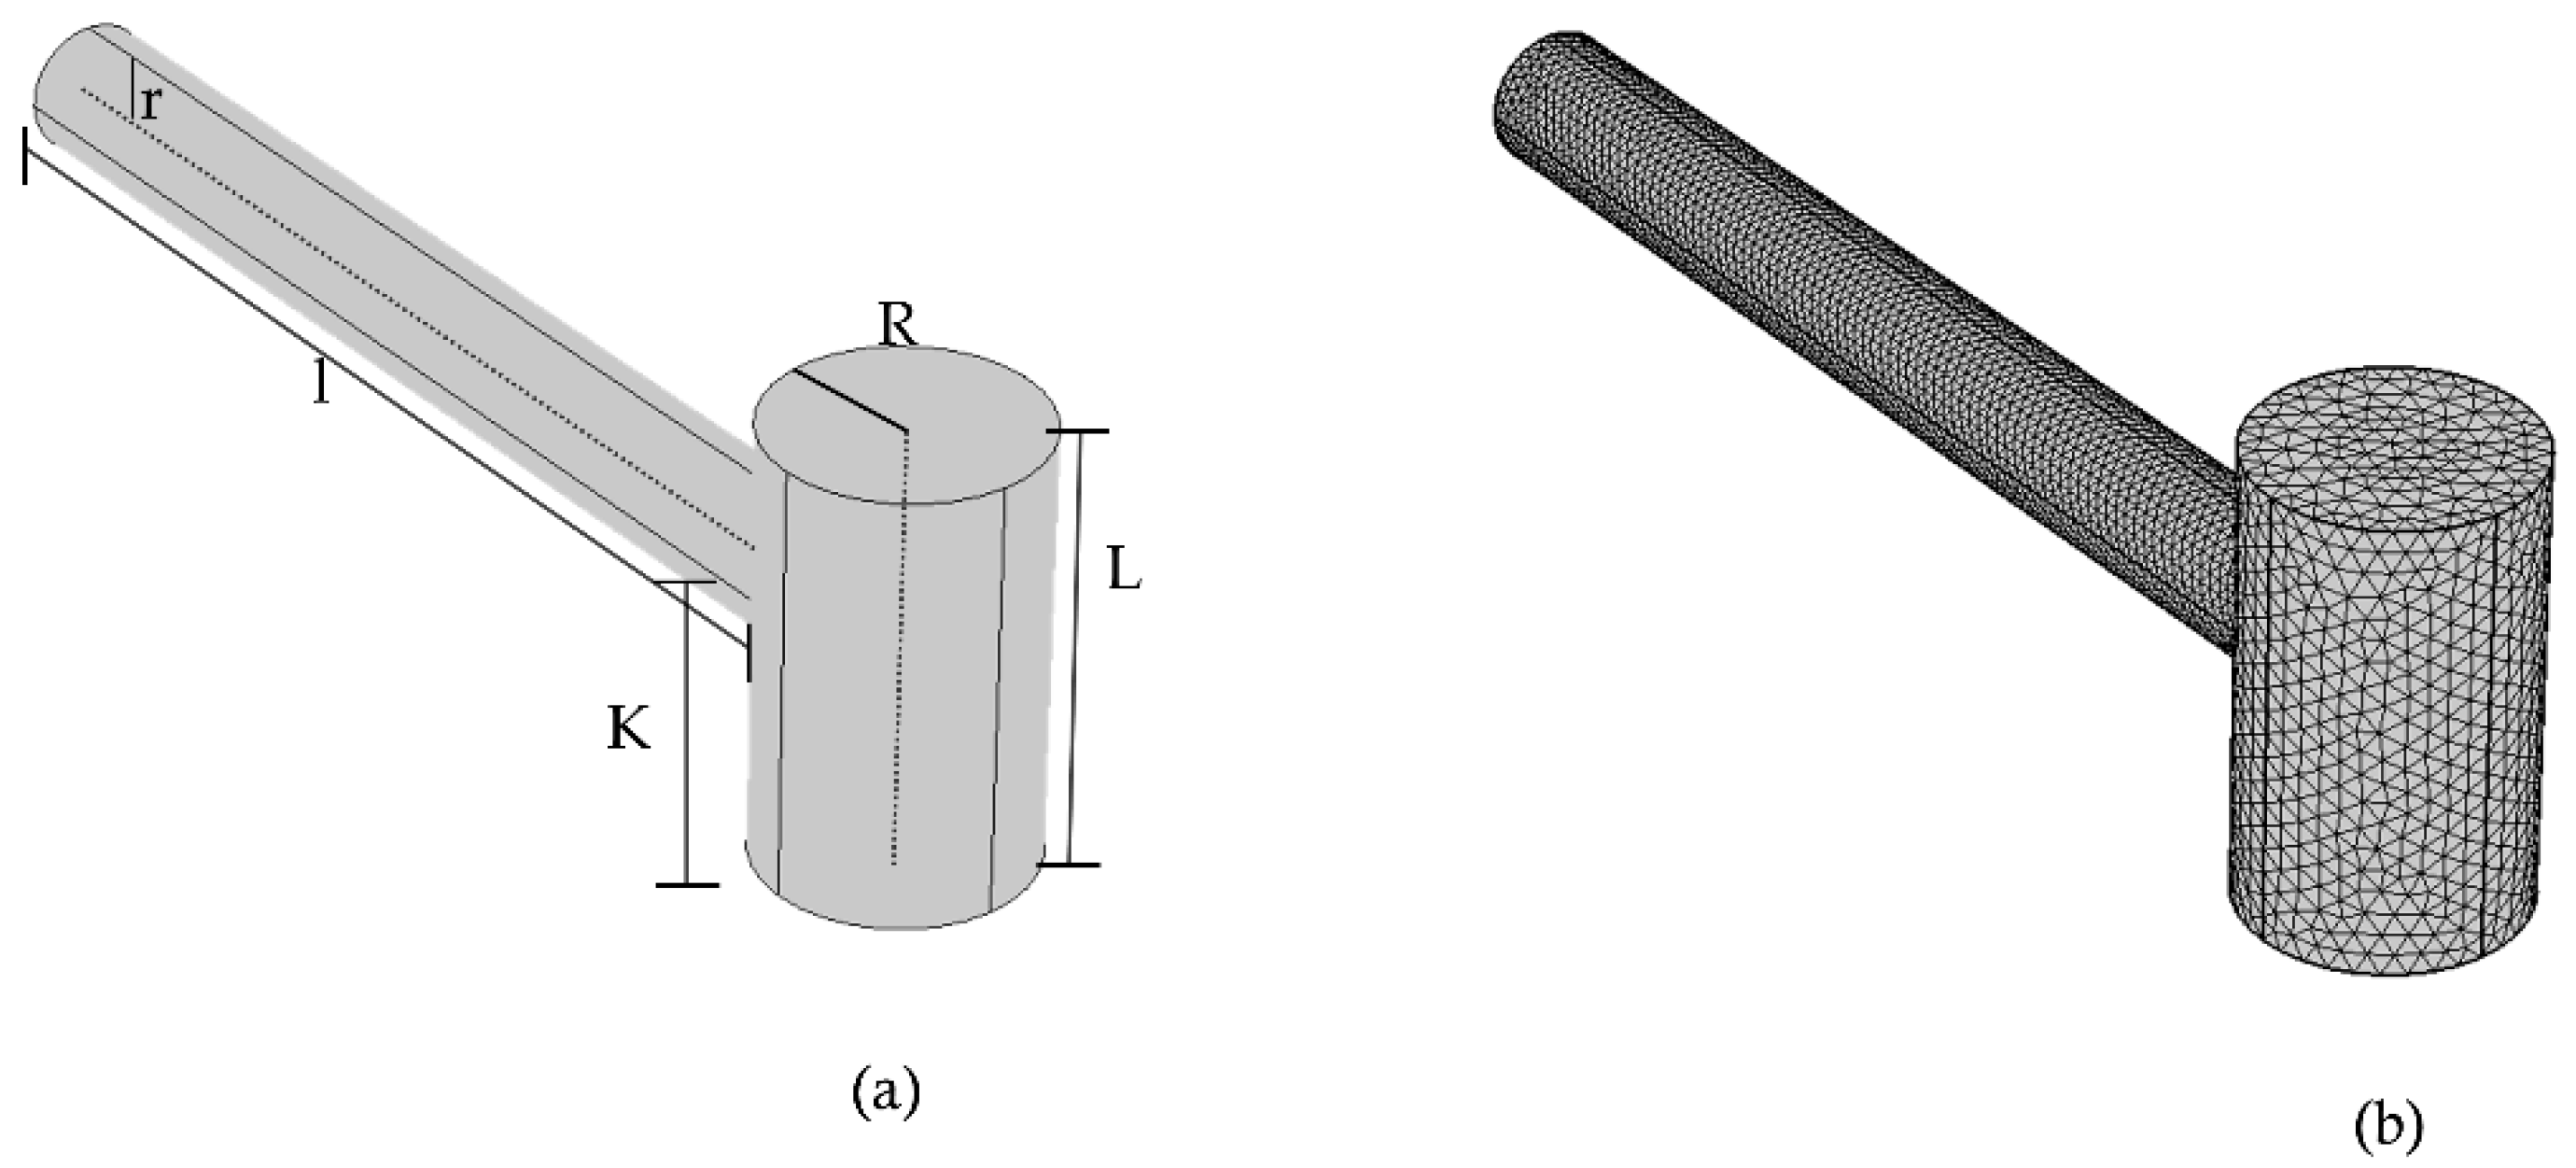
Figure 5.
(I) Pressure versus frequency response of the reference cell, (II) Corresponding mode representation of T-shaped resonator in (Pa) as indicated in four points in Fig. (I) as indicated by red boxes.
Figure 5.
(I) Pressure versus frequency response of the reference cell, (II) Corresponding mode representation of T-shaped resonator in (Pa) as indicated in four points in Fig. (I) as indicated by red boxes.
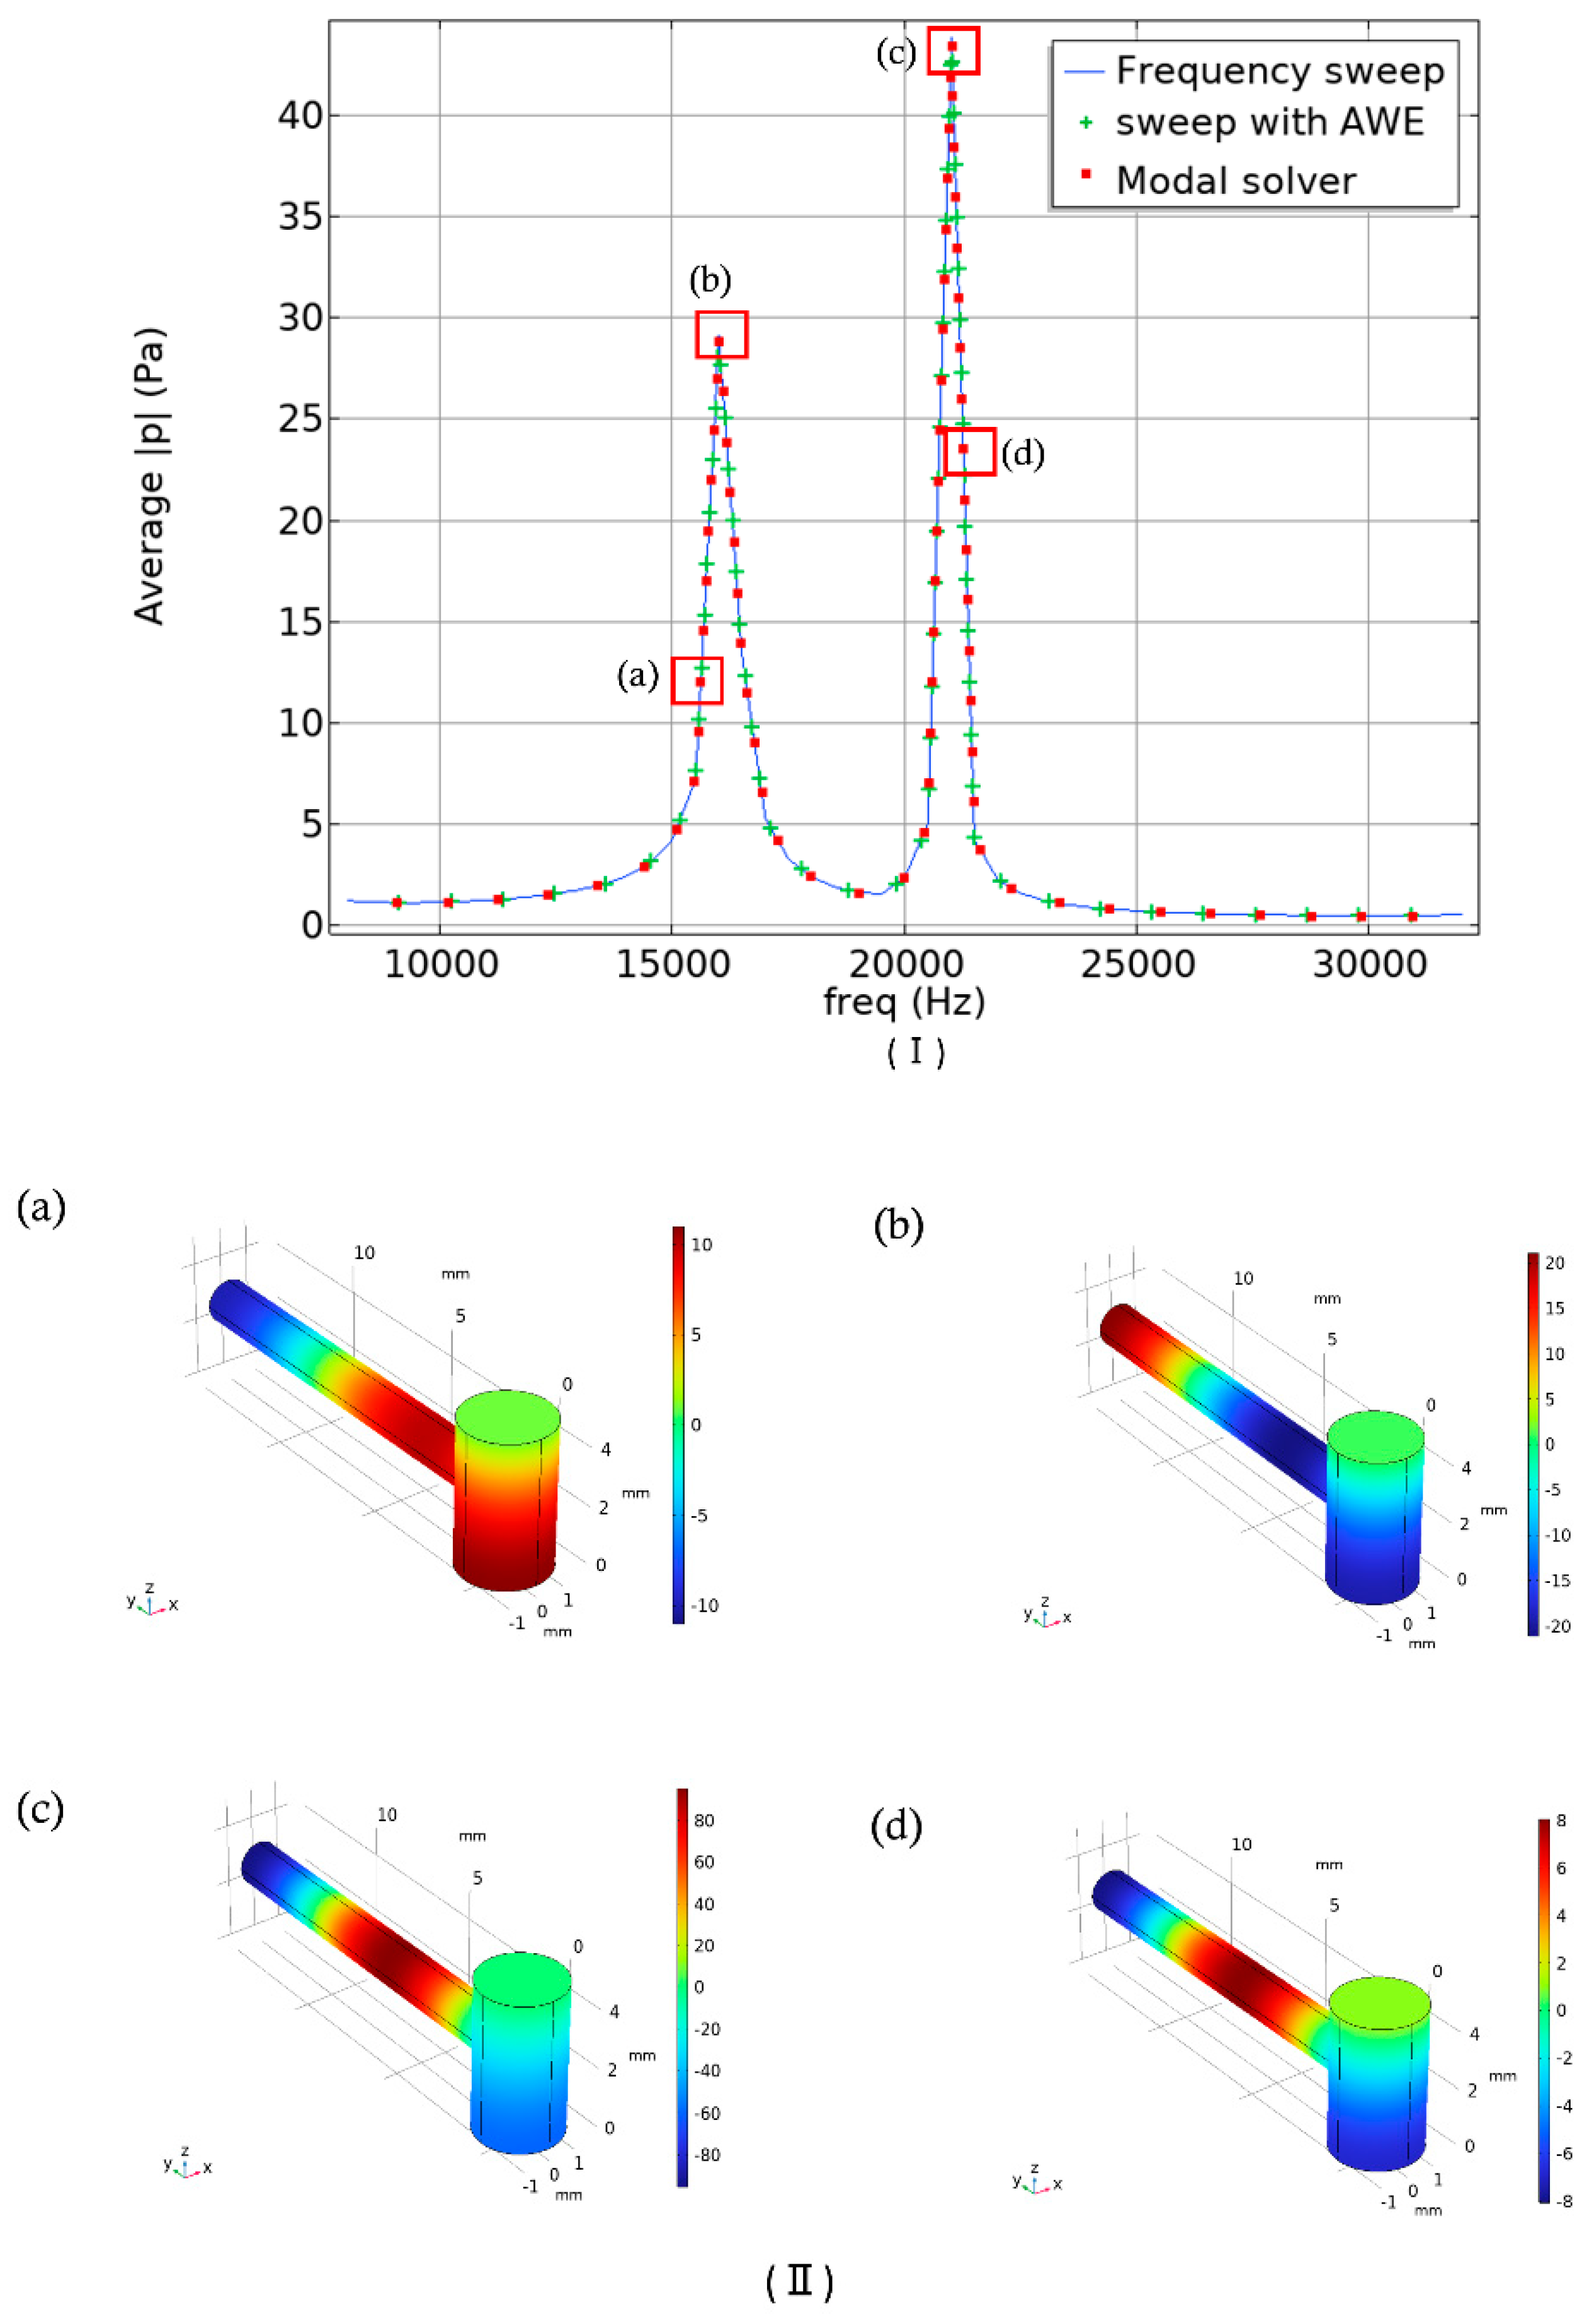
Figure 6.
(a) (b) Representation of pressure amplification relative to maximum pressure using a surface plot and contour plot for varying resonance cylinder parameters (r, l). (c) Contour plot of the Q-factor versus resonance cylinder parameters. (d) Mode representation of the corresponding peak at 21 kHz frequency in Pa, as indicated by the red point in the surface and contour plots of figures (a) and (b).
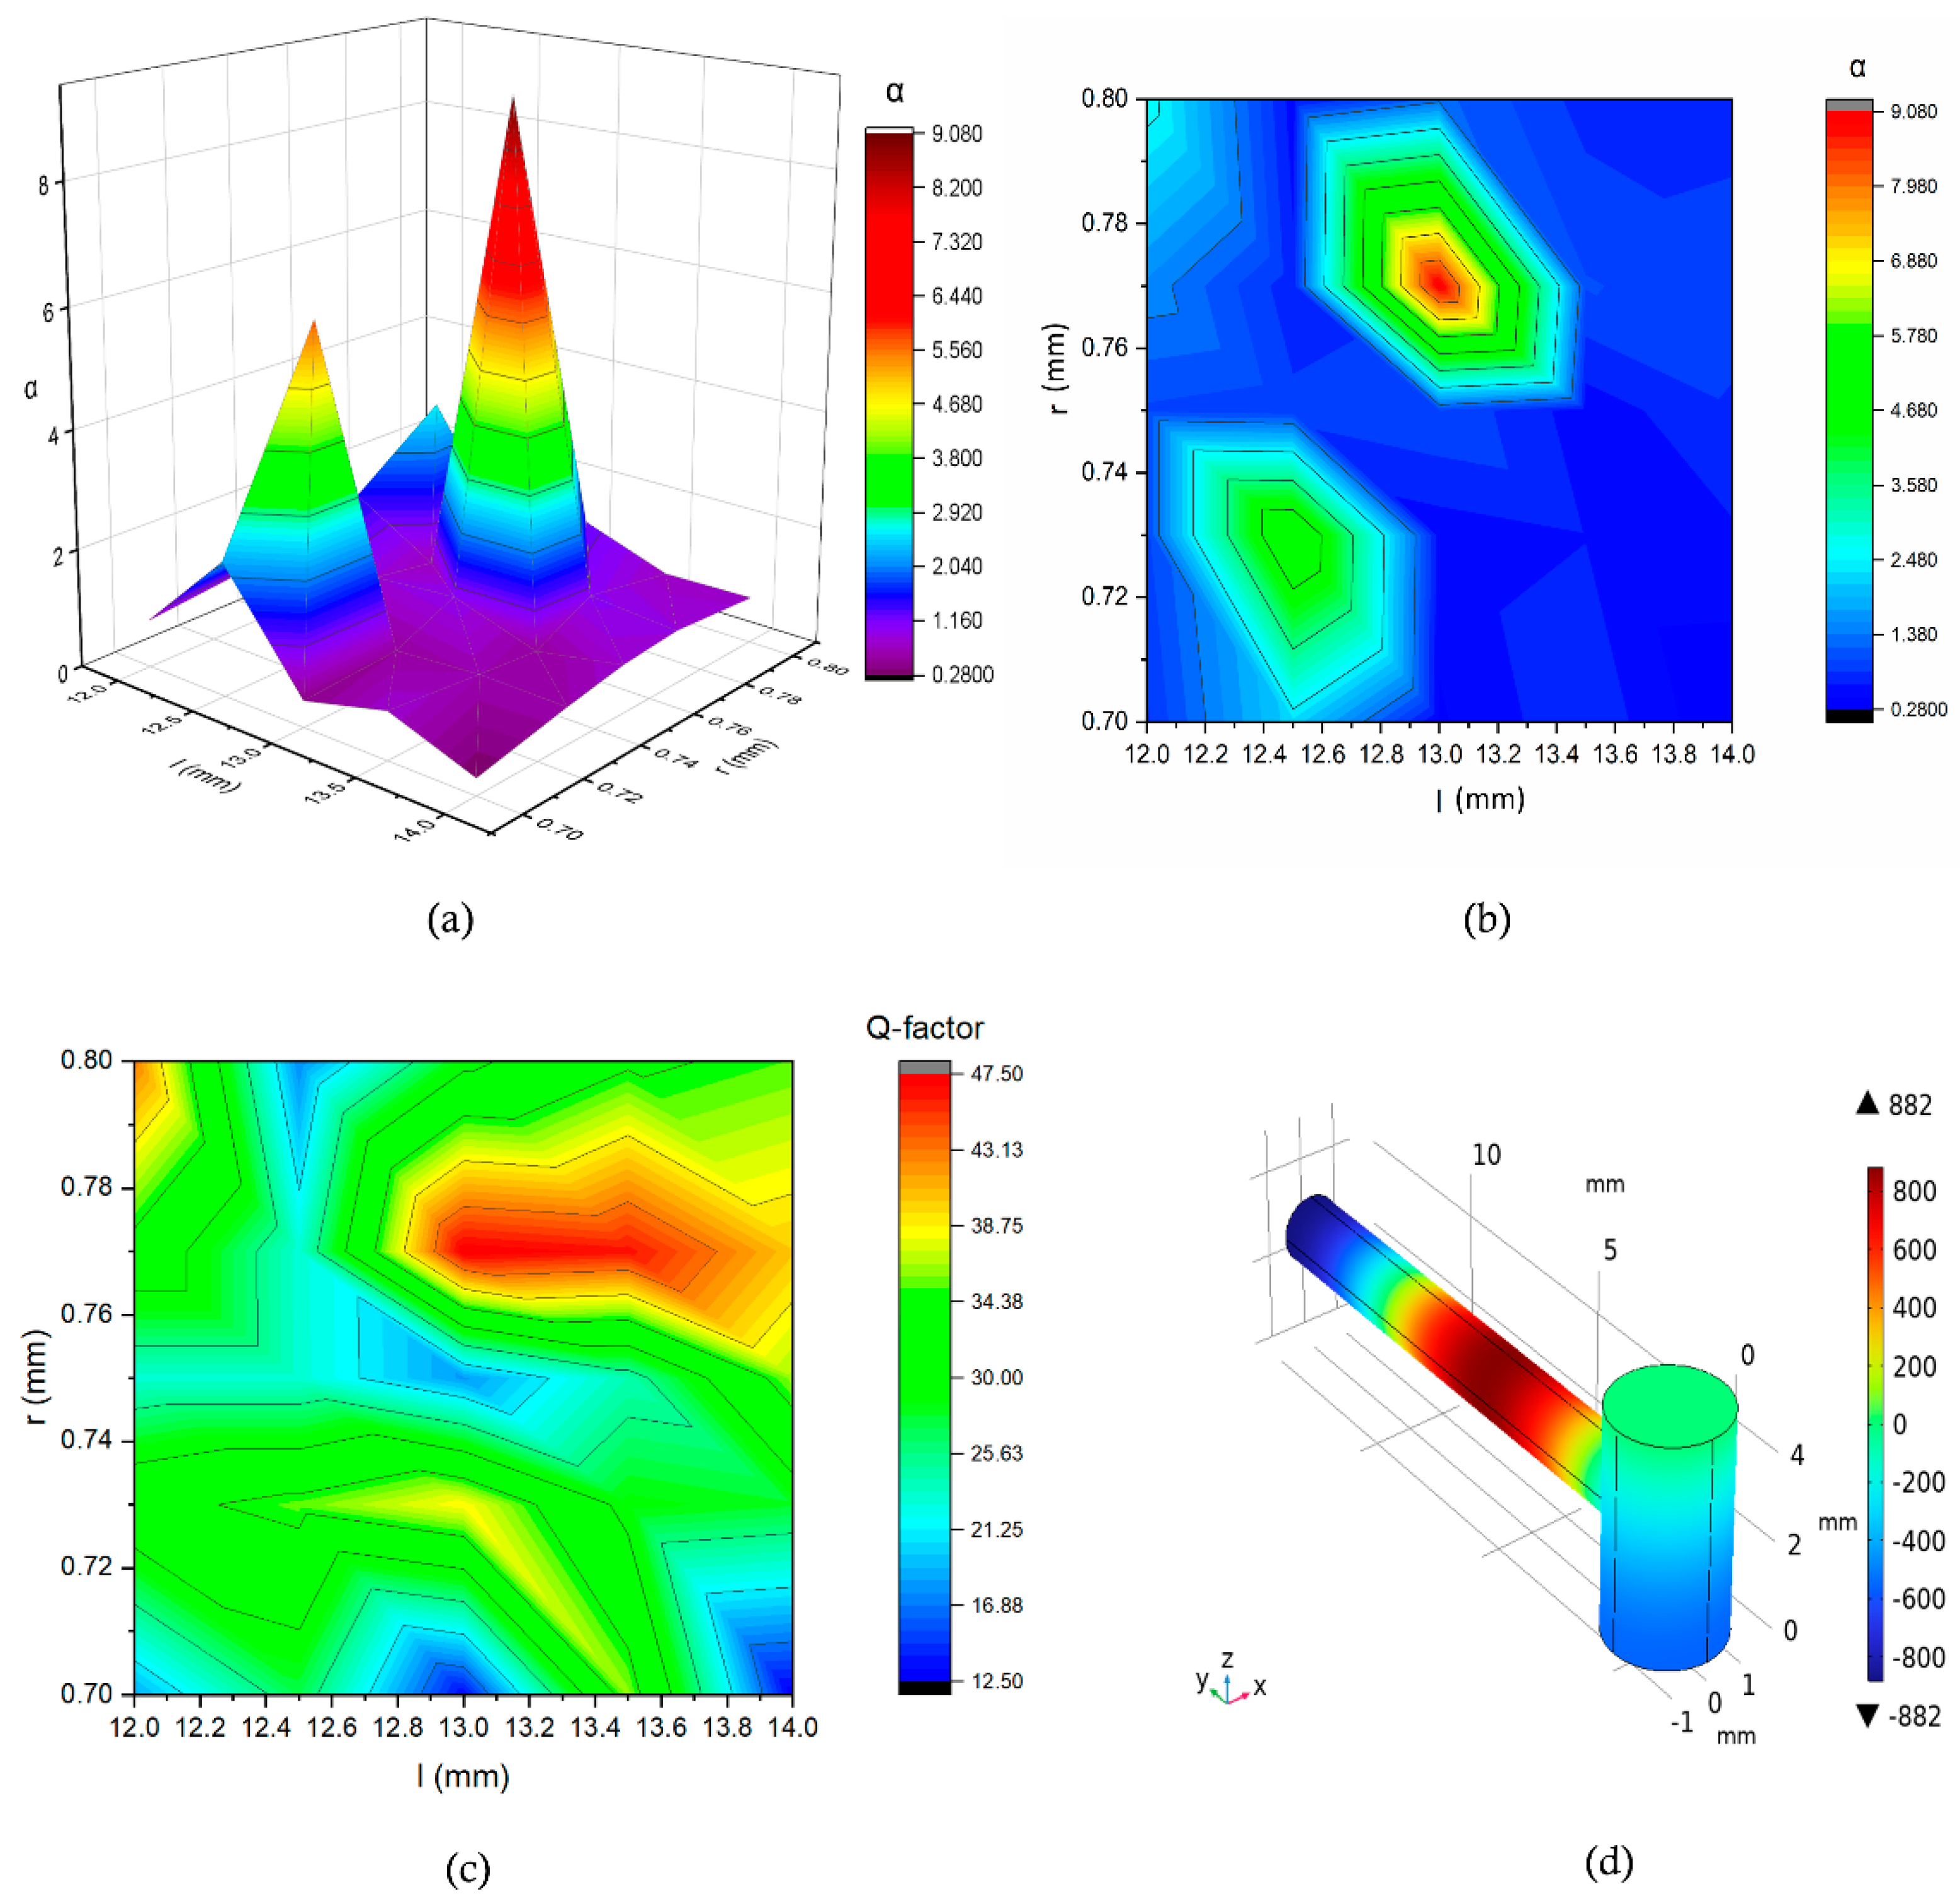
Figure 7.
(a) (b) Representation of pressure amplification relative to maximum pressure using a surface plot and contour plot for varying cavity cylinder parameters (R, L). (c) Contour plot of the Q-factor versus cavity cylinder parameters. (d) Mode representation of the corresponding peak at 16 kHz frequency in Pa, as indicated by the red point in the surface and contour plots of figures (a) and (b).
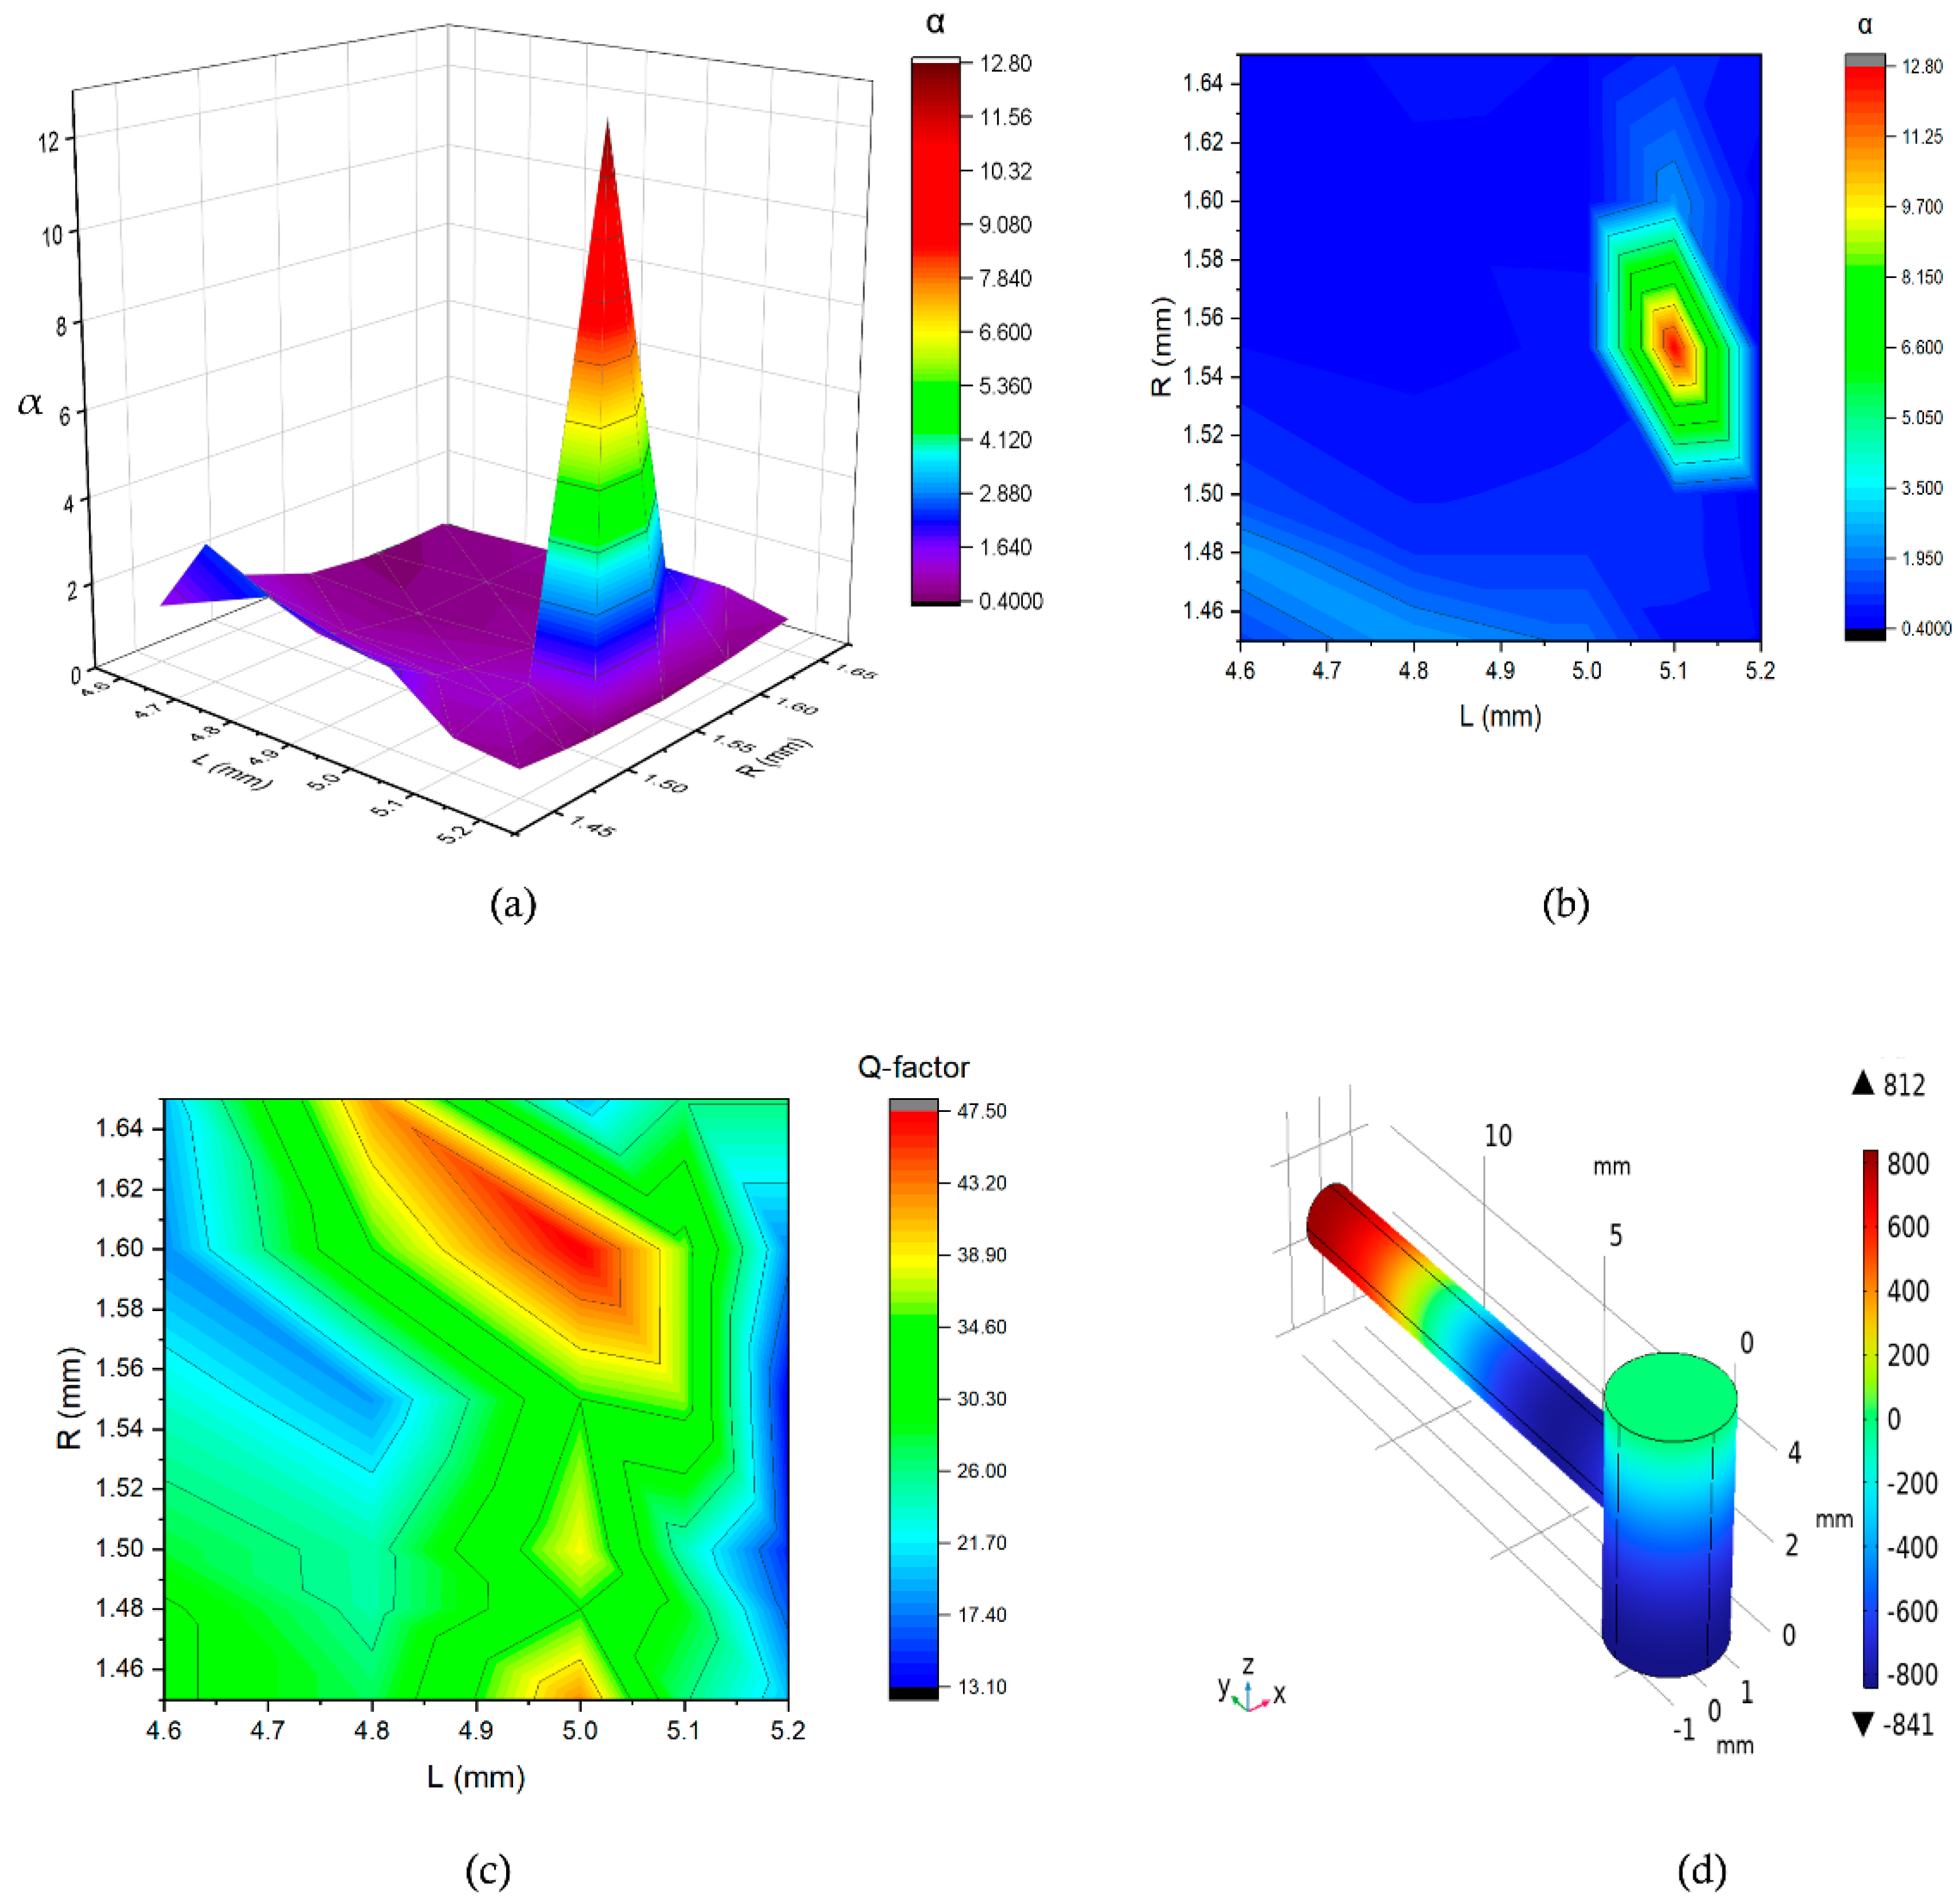
Figure 8.
The variation of amplification factor α and Q-factor w.r.t. resonance cylinder position (K).
Figure 8.
The variation of amplification factor α and Q-factor w.r.t. resonance cylinder position (K).
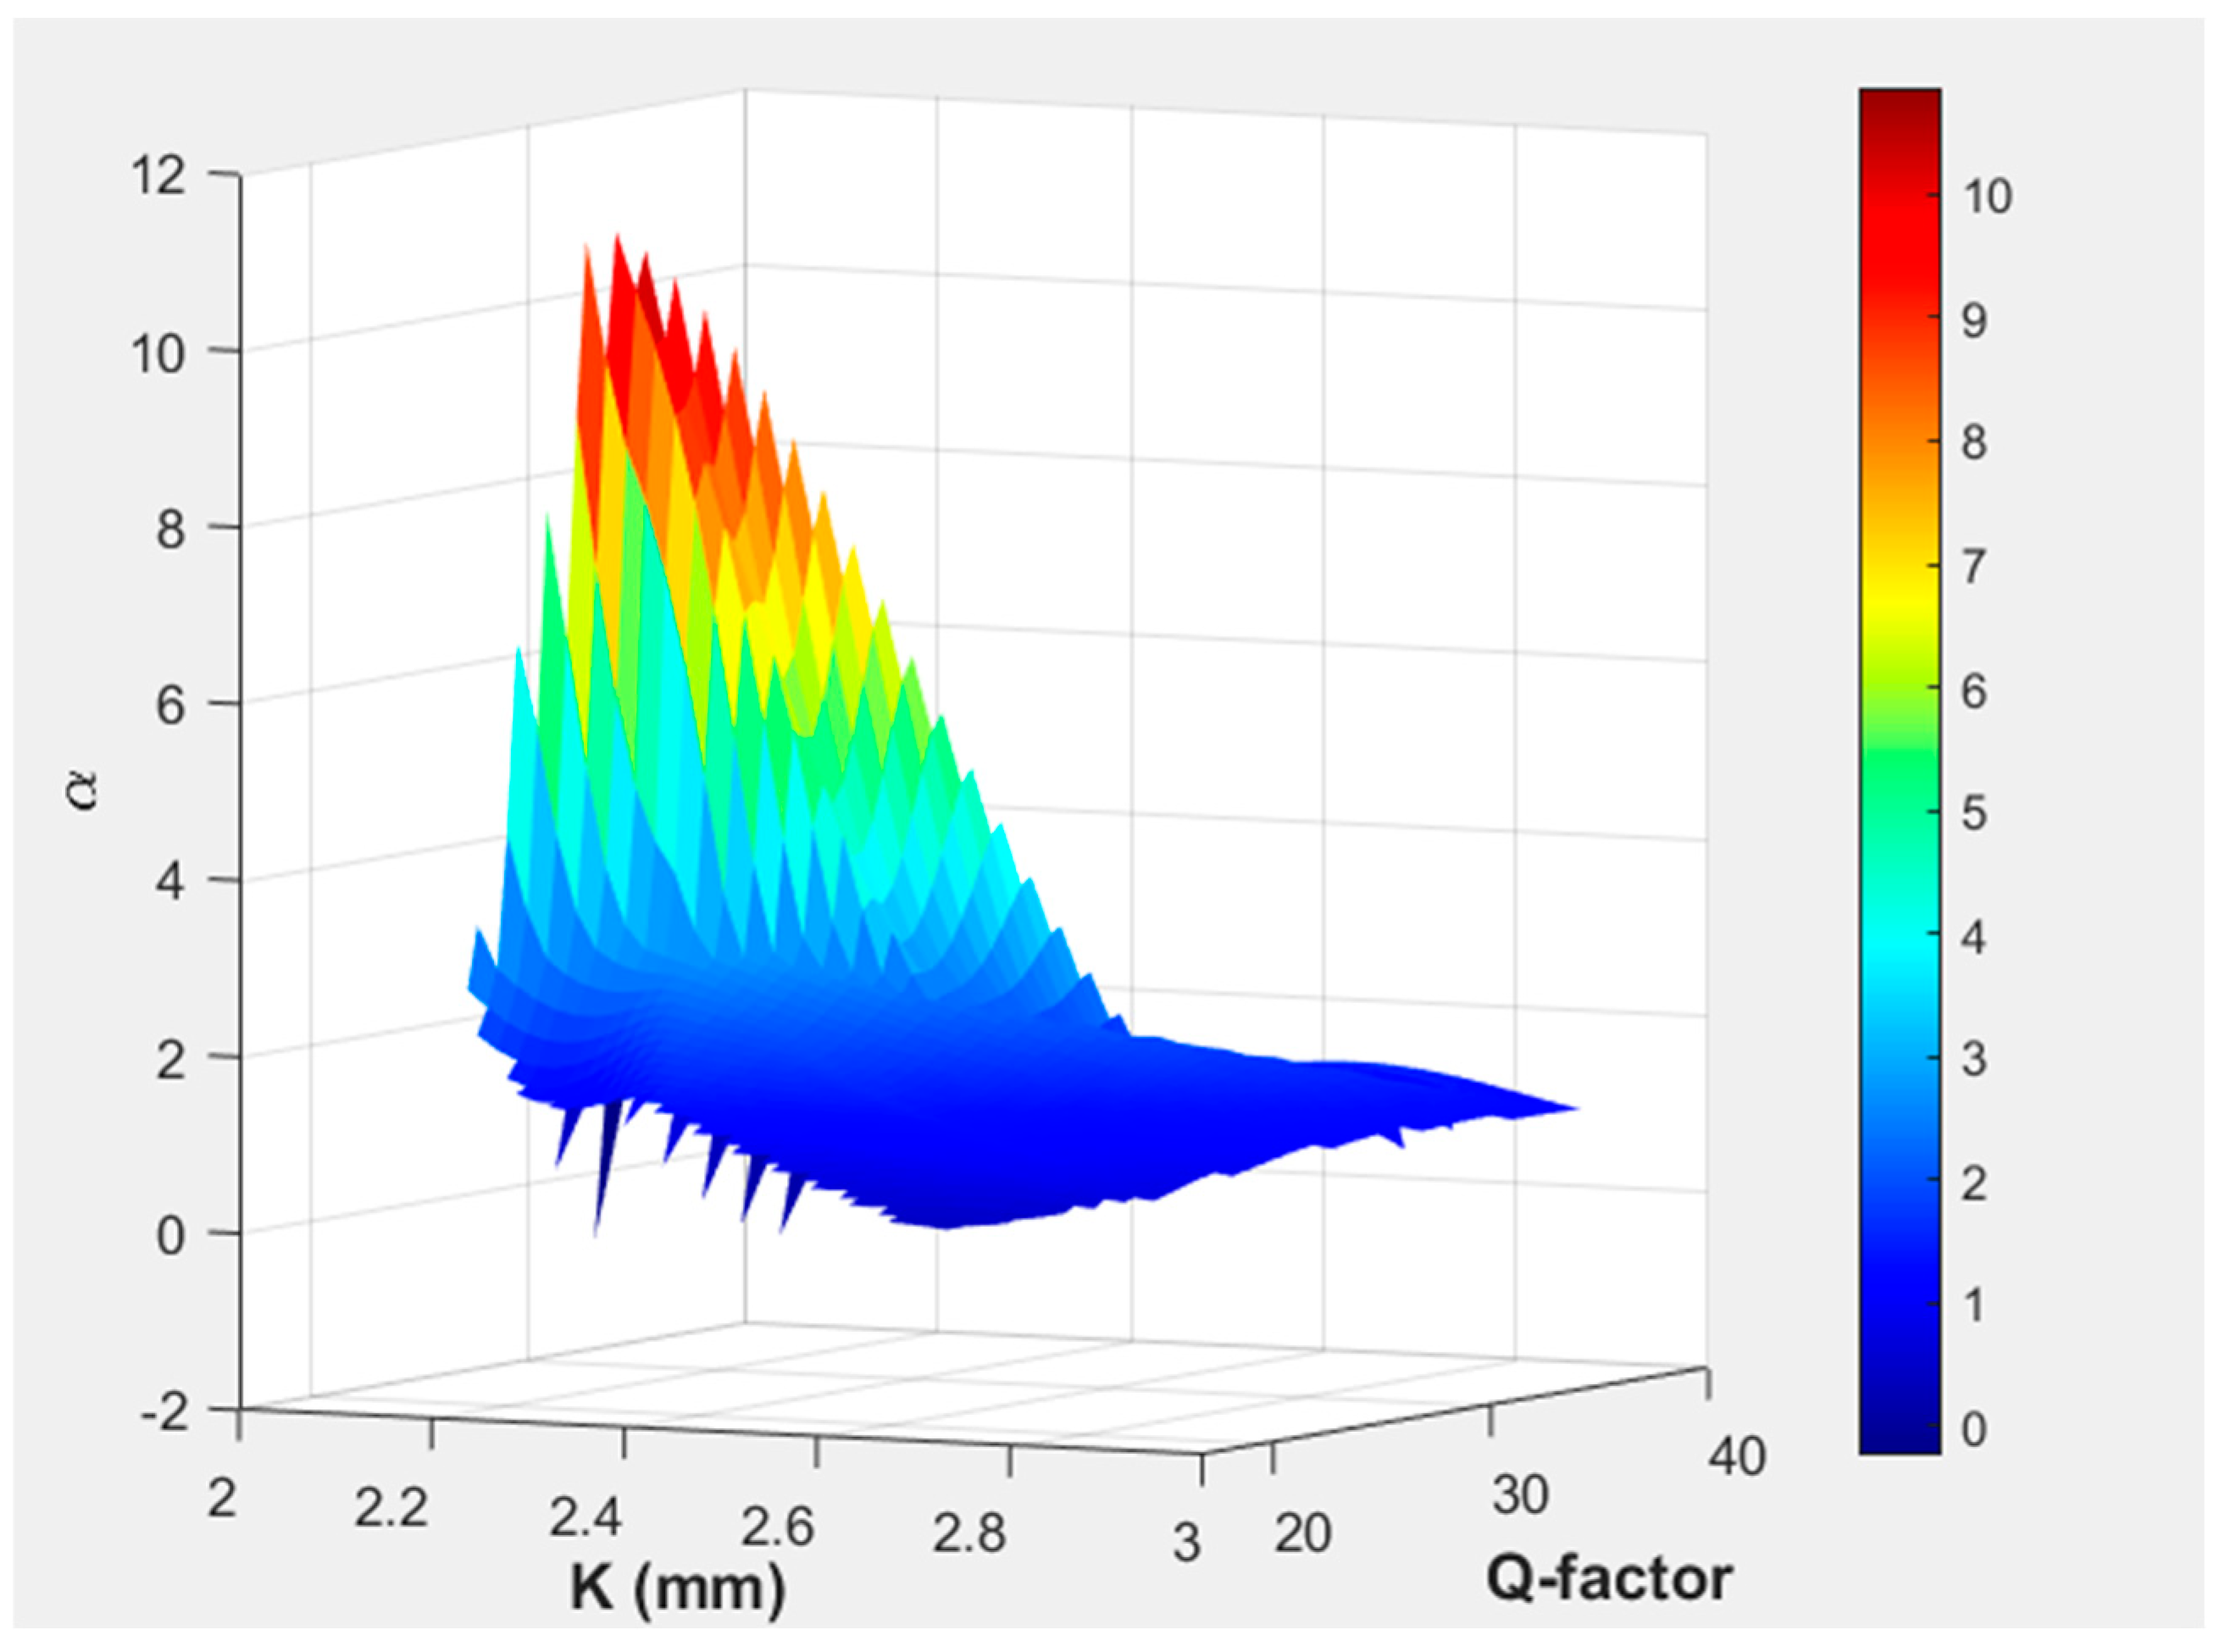
Figure 9.
(a) Representation of pressure vs frequency response for initial and modified parameters(R = 1.55 mm, L = 5.1 mm, r = 0.77 mm, l = 13 mm, K =2.5 mm) of the resonator. (b) Corresponding mode pictures.
Figure 9.
(a) Representation of pressure vs frequency response for initial and modified parameters(R = 1.55 mm, L = 5.1 mm, r = 0.77 mm, l = 13 mm, K =2.5 mm) of the resonator. (b) Corresponding mode pictures.
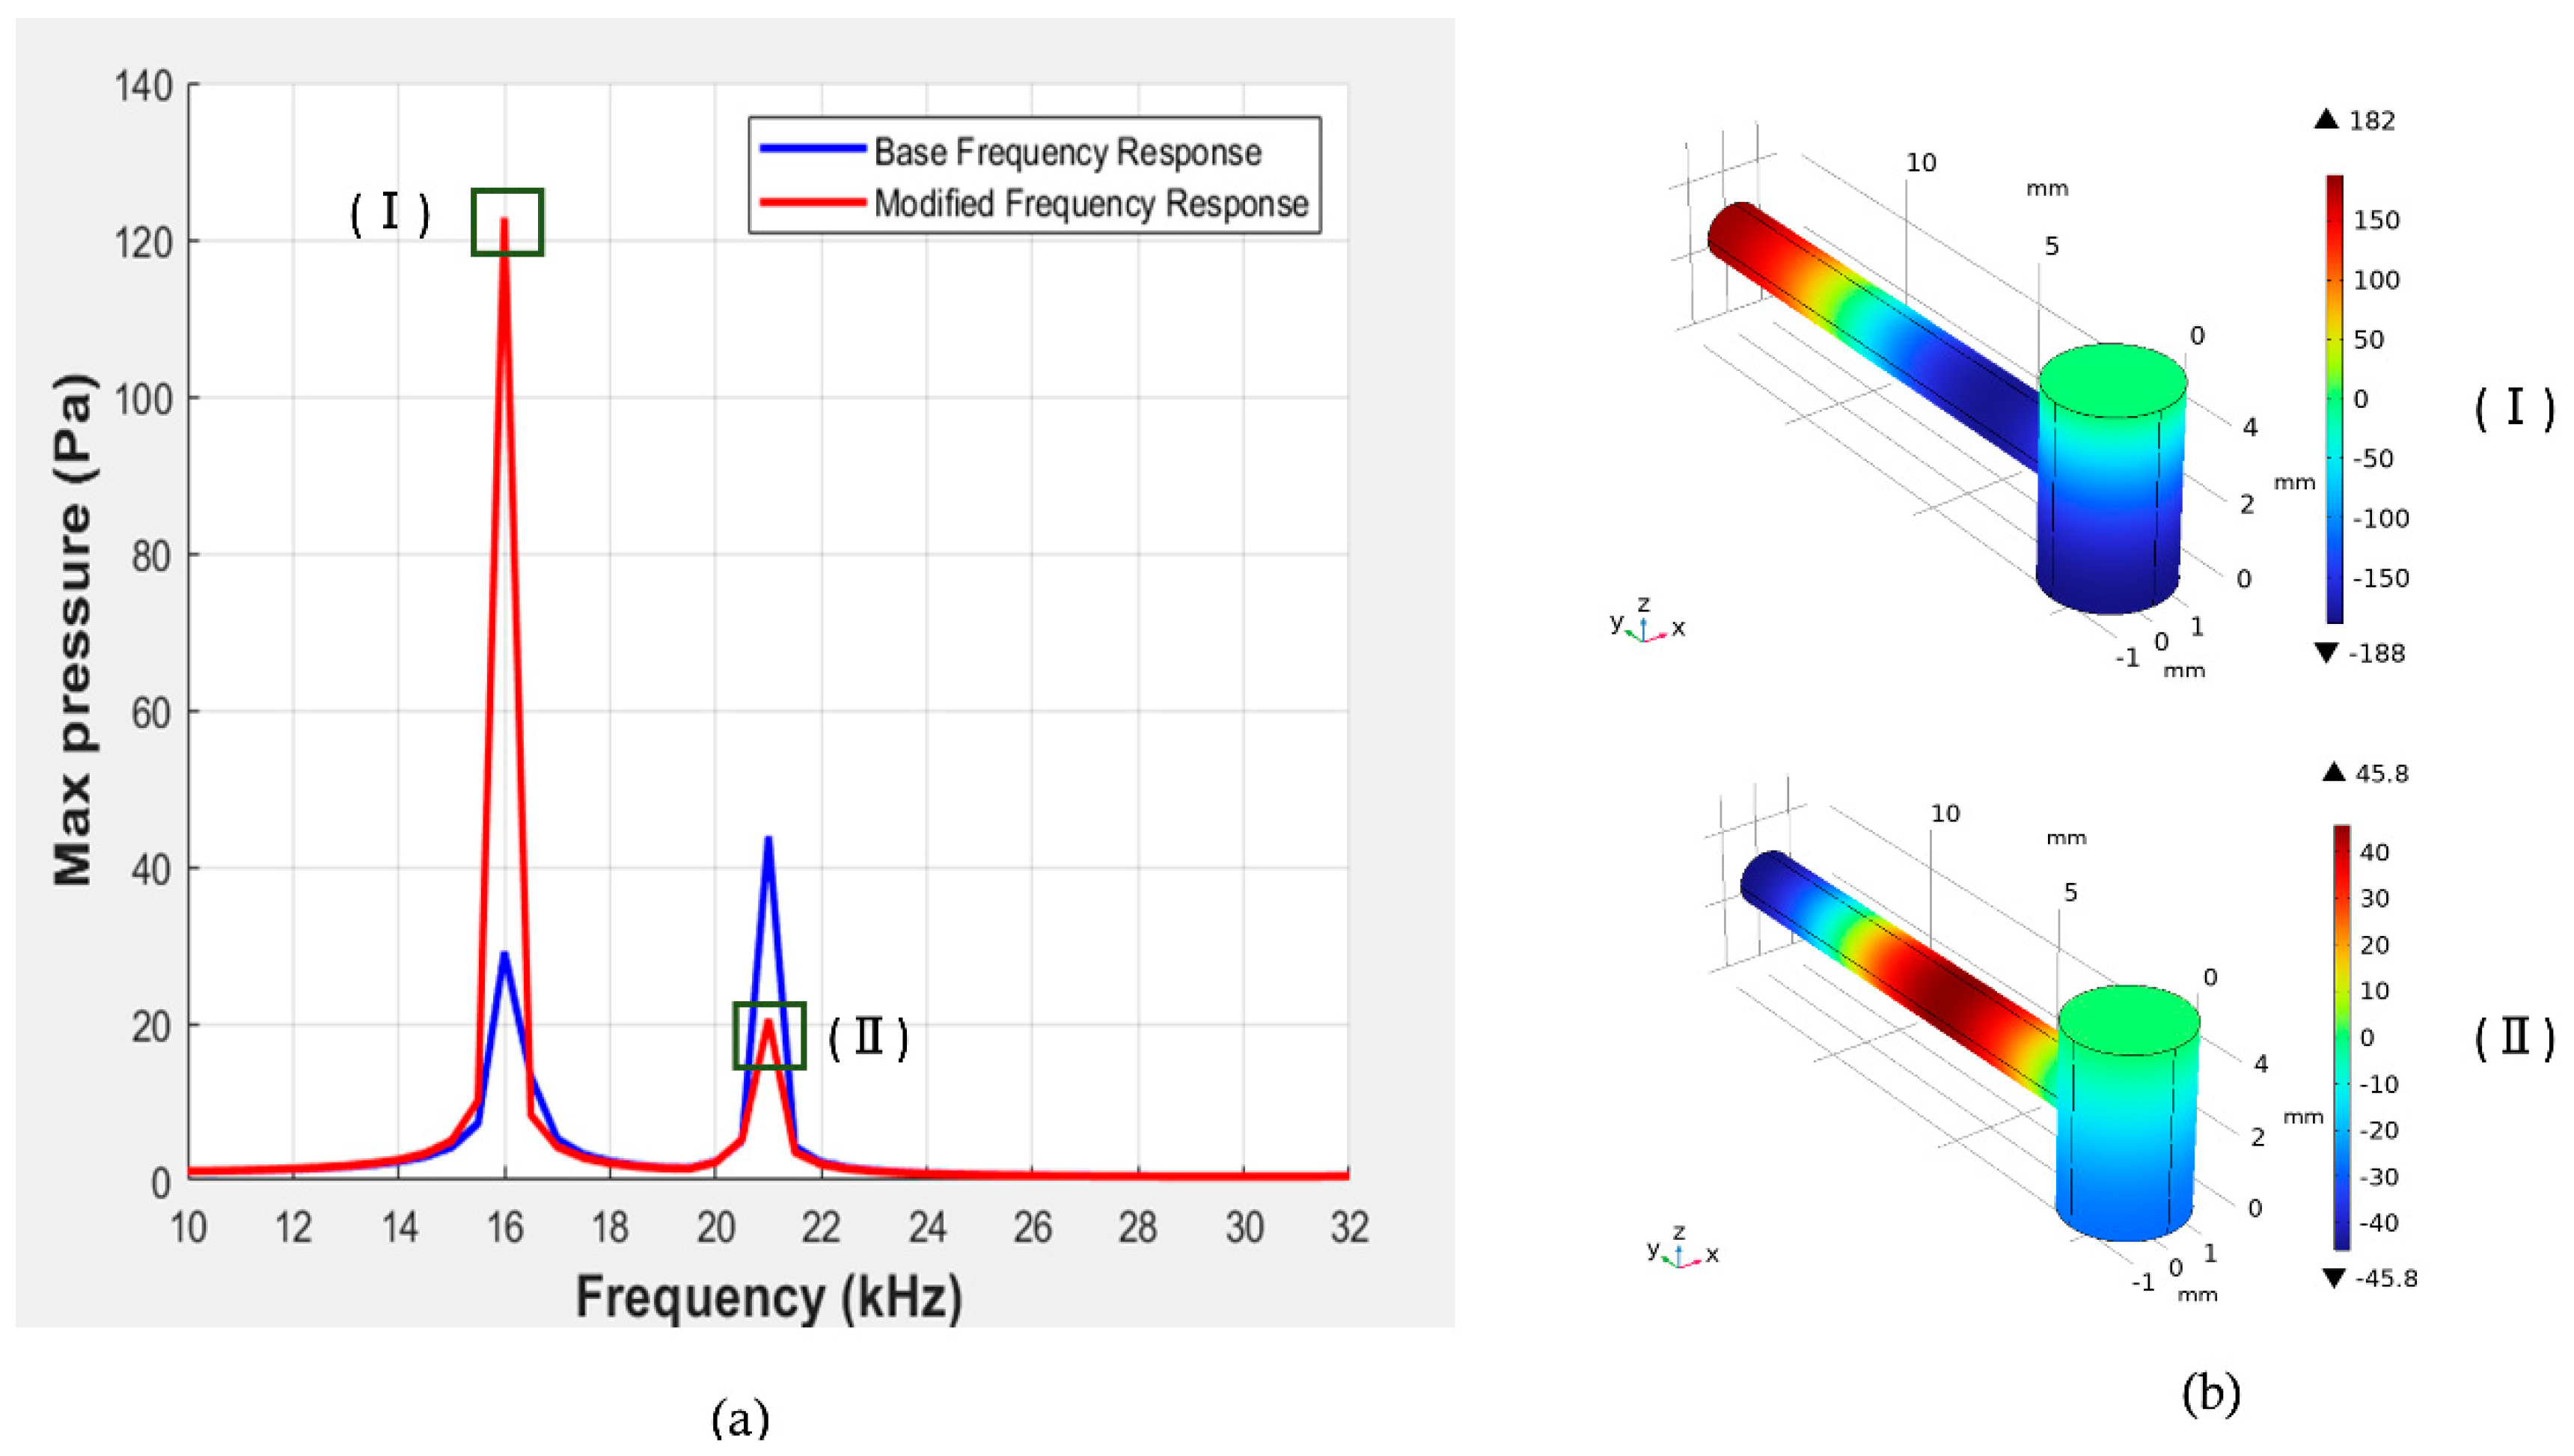
Figure 10.
(a) Representation of pressure vs frequency response for initial and modified parameters(R = 1.55 mm, L = 5.1 mm, r = 0.77 mm, l = 13 mm, K = 2.09 mm) of the resonator (b) Corresponding mode pictures.
Figure 10.
(a) Representation of pressure vs frequency response for initial and modified parameters(R = 1.55 mm, L = 5.1 mm, r = 0.77 mm, l = 13 mm, K = 2.09 mm) of the resonator (b) Corresponding mode pictures.
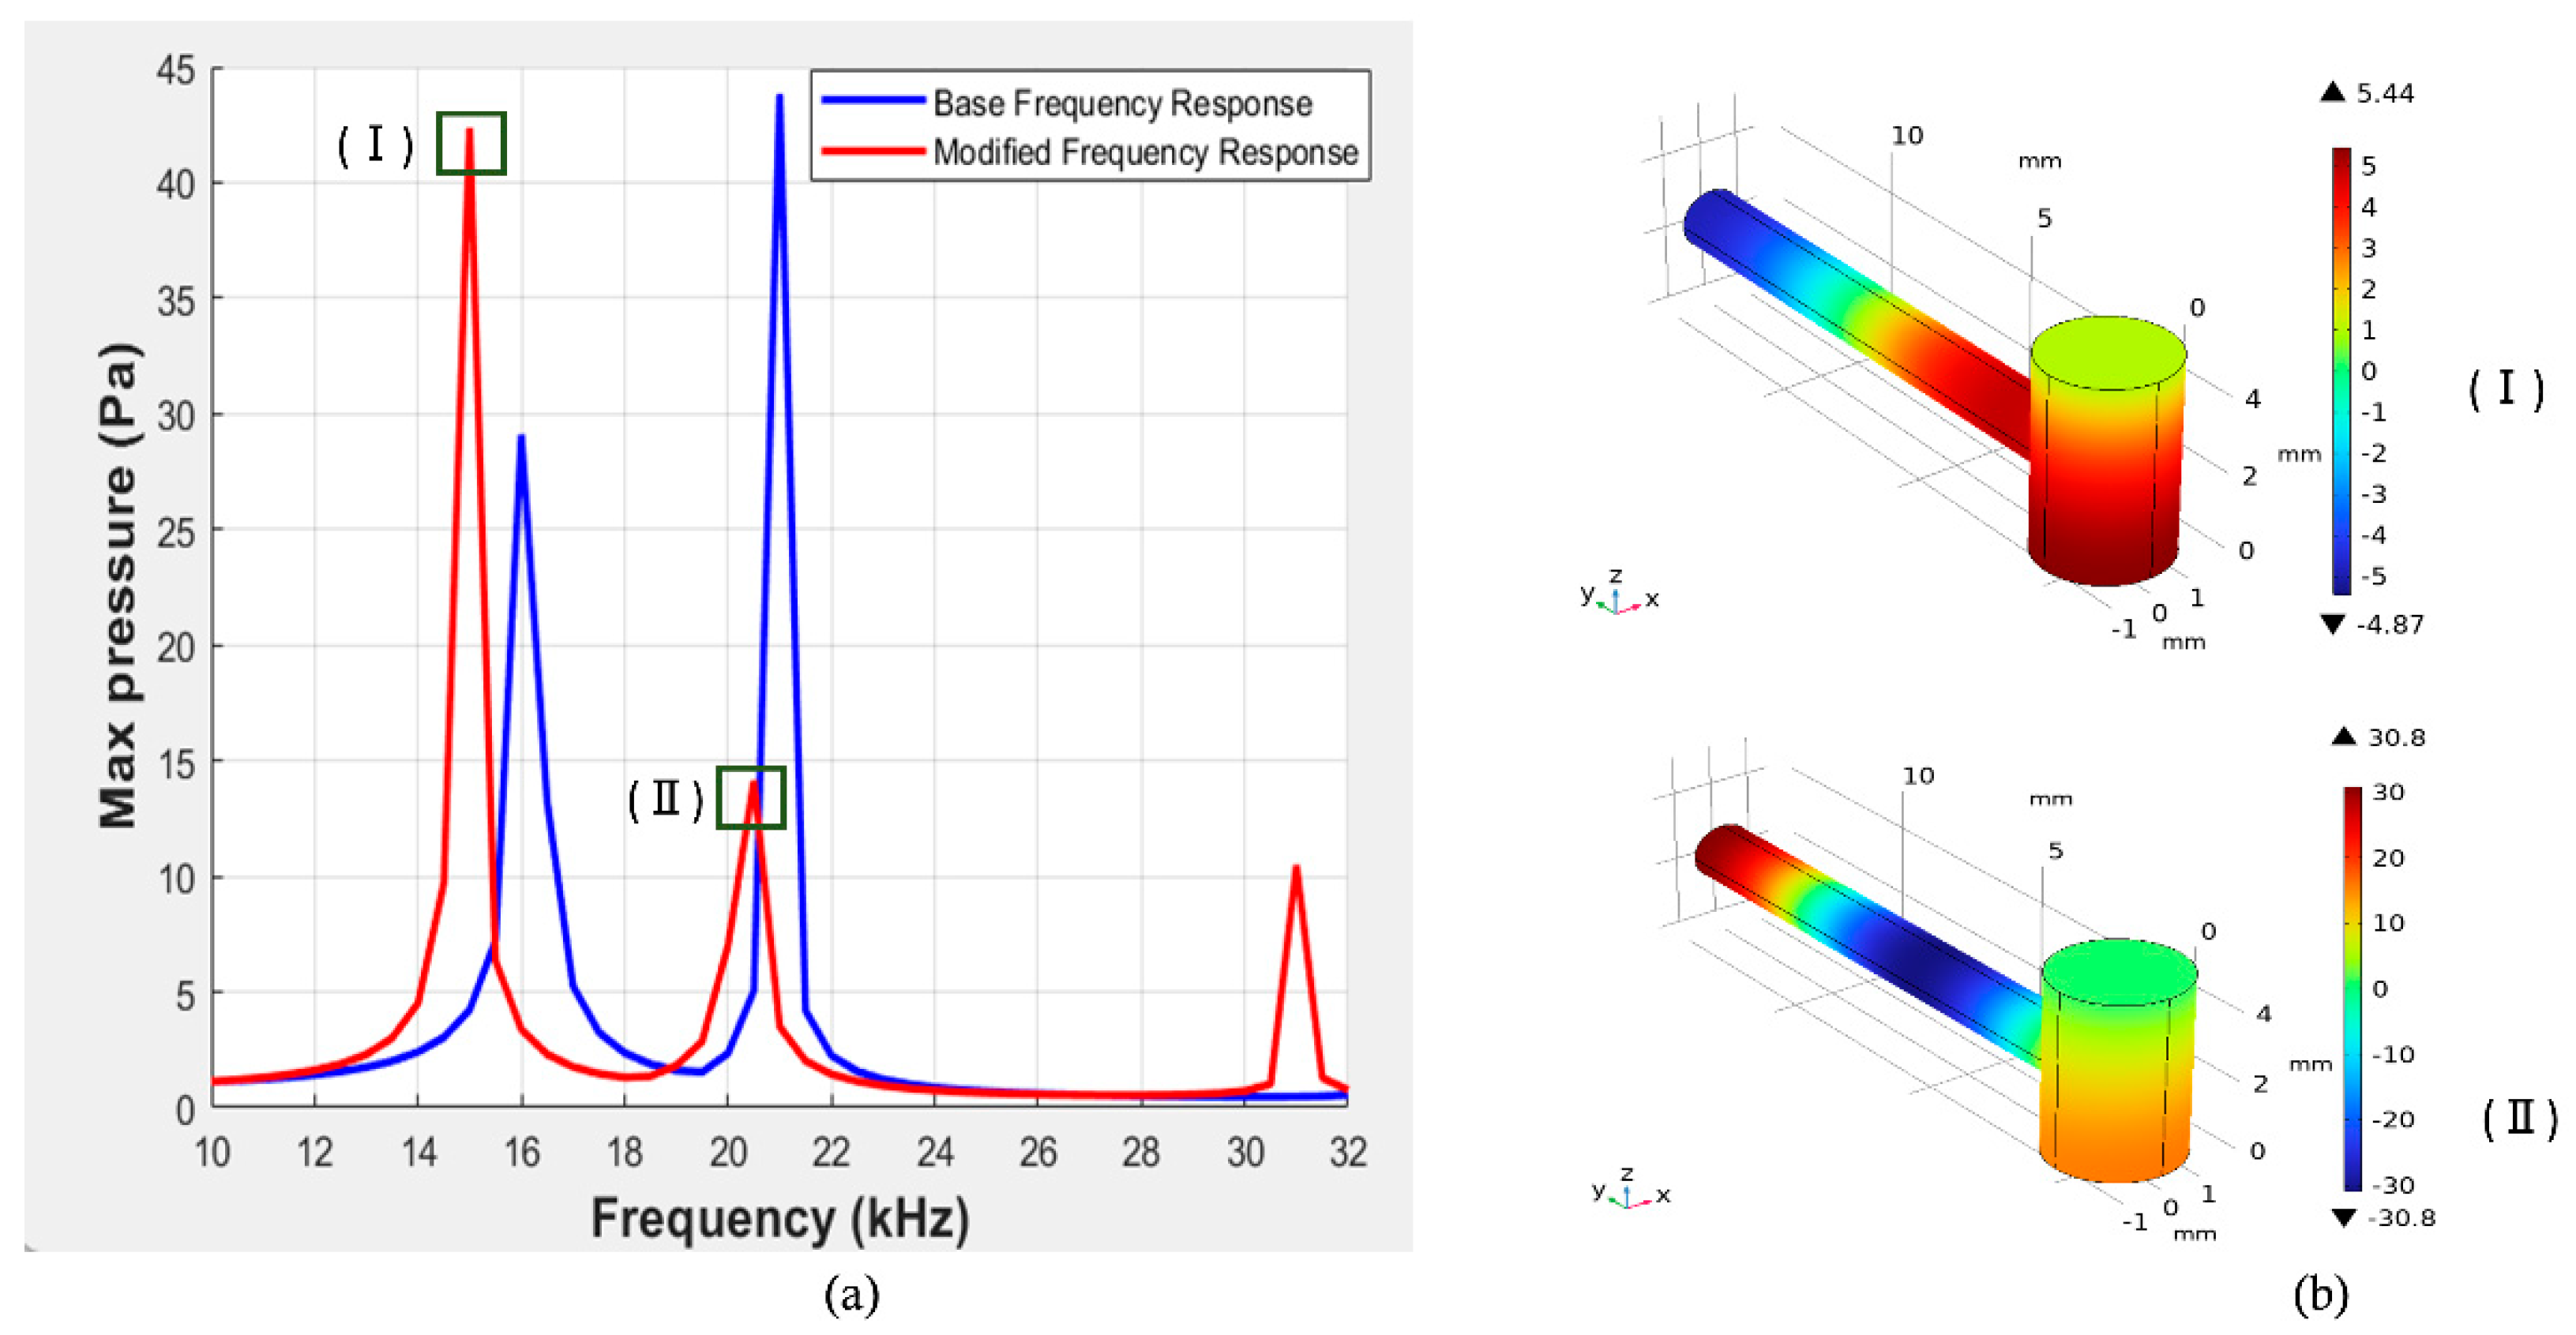

Table 1.
Summary of the parameters that were initially used for the resonator design and further analysis [31].
Table 1.
Summary of the parameters that were initially used for the resonator design and further analysis [31].
| Structural Parameter | Symbol | Values (mm) |
| Position of the Resoonace Cylinder | K | 2.5 |
| Radius of the Cavity Cylinder | R | 1.5 |
| Length of the Cavity Cylinder | L | 5 |
| Radius of the Resoonace Cylinder | r | 0.75 |
| Length of the Resonance Cylinder | l | 13 |
Table 2.
Summary of the effect of changing parameters on the amplification ratio and Q-factor for different combinations of PAR parameters.
Table 2.
Summary of the effect of changing parameters on the amplification ratio and Q-factor for different combinations of PAR parameters.
| Parameters | Amplification ratio (α) | Q-factor | |||||
| Combination | R(mm) | L(mm) | r(mm) | l(mm) | K(mm) | ||
| a | 1.5 | 5.0 | 0.77 | 13 | 2.5 | 9.07 | 47.5 |
| b | 1.55 | 5.1 | 0.75 | 13 | 2.5 | 12.76 | 47.5 |
| c | 1.55 | 5.1 | 0.77 | 13 | 2.5 | 2.7 | 42 |
| d | 1.5 | 5.0 | 0.75 | 13 | 2.09 | 11.6 | 29.42 |
| e | 1.55 | 5.1 | 0.77 | 13 | 2.09 | 0.93 | 42 |
Disclaimer/Publisher’s Note: The statements, opinions and data contained in all publications are solely those of the individual author(s) and contributor(s) and not of MDPI and/or the editor(s). MDPI and/or the editor(s) disclaim responsibility for any injury to people or property resulting from any ideas, methods, instructions or products referred to in the content. |
© 2025 by the authors. Licensee MDPI, Basel, Switzerland. This article is an open access article distributed under the terms and conditions of the Creative Commons Attribution (CC BY) license (http://creativecommons.org/licenses/by/4.0/).
Copyright: This open access article is published under a Creative Commons CC BY 4.0 license, which permit the free download, distribution, and reuse, provided that the author and preprint are cited in any reuse.


