
Submitted:
01 October 2025
Posted:
09 October 2025
You are already at the latest version
Abstract
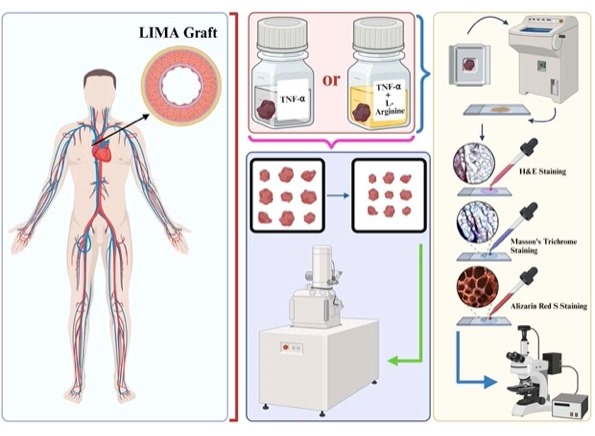
Coronary artery bypass grafting (CABG) is a standard procedure performed for revascularization and left internal mammary artery (LIMA) is the most preferably used graft for CABG, thanks to its long-term patency, and increased survival from myocardial infarction. Although fibrosis and calcification of LIMA grafts are observed less compared to other grafts, which leads to a decrease of graft patency or result in graft fail depending on the excision location, IMA grafts can tend to calcify in the long term. L-Arginine is the precursor of nitric oxide (NO) synthesis which is a regulator of the vascular inflammation. In the study, LIMA grafts harvested from 18 male patients were treated ex vivo with either TNF-α or L-Arginine before cryosectioning. The cryosectioned tissue grafts stained with H&E and Masson’s Trichrome were imaged with a brightfield microscope to observe the effects of the treatments on the grafts’ morphology and collagen composition. LIMA grafts were also stained with Alizarin Red S and imaged with a fluorescence microscope for calcification detection. The effects of the treatments on tissue morphology, and elemental composition were examined with scanning electron microscopy (SEM), and Elemental Dispersive Spectroscopy (EDS), respectively, after tissues were critically dried. Results suggested the potential of L-Arginine for improving the LIMA graft patency in a preliminary manner, since L-Arginine improved graft morphology to be more organized, increased collagen deposition, decreased calcification regardless of the patient age.
Keywords:
coronary artery bypass grafting
; internal mammary artery
; graft patency
; L-arginine
1. Introduction
Cardiovascular diseases (CVDs) are one of the main reasons of death in adults worldwide [1,2]. It is known that CVDs have a higher prevalence in males [3]. Environmental conditions such as air pollution and socioeconomic status, diet, exercise, and some inflammatory diseases such as psoriasis, inflammatory bowel disease, and autoimmune collagen vascular disease are known to affect CVDs’ development and are risk factors [4]. Inflammation increment is associated with higher expression of pro-inflammatory markers such as interleukin-6 (IL-6), tumor necrosis factor- (TNF- ), and C-reactive protein (CRP) and is commonly seen in patients with CVDs [5].
Coronary artery bypass grafting (CABG) is a standard procedure performed for revascularization and mainly there are two grafts used during this procedure; left internal mammary artery (LIMA) and saphenous vein (SV) grafts [6,7,8,9]. Also, the right internal mammary artery (RIMA) graft was used in some procedures, however, the patency of the graft was inconsistent [10]. LIMA is the most preferred and criterion standard vessel for CABG, due to its long-term patency, and increased survival of the graft from myocardial infarction, when compared to SV grafts, although, poor surgical technique can lead to its patency to decrease [11,12]. Even though the success rate is higher with the internal mammary artery (IMA) grafts, approximately 2-9% of the IMA grafts fail in one year after the CABG procedure [13].
IMA grafts consist of tunica intima (TI), tunica media (TM) with smooth muscle cells (SMCs), and tunica adventitia (TA) parts with a layer of endothelial cells [14]. Development of fibrosis and calcification are known to decrease the patency of the grafts for the CABG [9]. Although fibrosis and calcification of IMA grafts are less compared to SVG, IMA grafts cut and removed from the left coronary artery (LAD) or the left circumflex artery (LCX) tend to calcify in the long term when removed for CABG [15]. During the arterialization of the graft after CABG procedure, an endothelial injury might occur resulting in the infiltraion of SMCs, proteoglycan levels and collagen levels (type I/III) [14].
Tumor necrosis factor- (TNF-) is a proinflammatory cytokine, that is associated with organ damage and increased inflammation and is known to increase fibrosis and calcification in arteries. TNF- tend to be increased after CABG procedure [16,17,18]. Nitric oxide (NO) is a regulator of homeostasis and is produced naturally by the activity of the nitric oxide synthases (NOS) [19]. NO is shown to facilitate vasodilation resulting in faster blood flow, and modulate vascular inflammation alongside regulating vascular inflammation [19]. It is also known that NO can prevent vascular damage which can lead to diseases such as atherosclerosis, where lipid accumulation and inflammation occurs in the arteries [20,21]. In some studies, it is shown that NO treatment decreased the vascular calcification which might occur throughout the atherosclerosis disease development via TGF- signaling, therefore, NO can be beneficial to prevent calcification [22,23,24]. L-Arginine is one of the semi-essential amino-acids that is known to have roles in NO level control in the body, since it is the precursor of NO synthesis [19]. Due to being a precursor of NO, L-Arginine is considered to have beneficial effects for cardiovascular health [21].
Scanning electron microscopy (SEM) is used for detecting morphology of the materials or biological samples such as tissue sections. Energy X-ray dispersion spectroscopy (EDS) is used for the detection of the chemical composition of the examined material or the biological sample [25]. In SEM, sent electrons scan the material or the biological sample, and the image is obtained due to the emission of secondary electrons and the backscattered electrons from the specimen [25].
Alizarin Red S is a dye that is used for the detection of macrocalcifications, and calcium deposits in the vascular or bone tissue ex vivo, osteogenic cells, and stains the calcified areas in red [26,27,28].
This study is aimed to investigate the effects of TNF- or TNF- and L-Arginine ex vivo treatment on left internal mammary artery (LIMA) grafts’ by fluorescence microscopy, SEM and EDS. It is believed that this preliminary study has the potential to show the effects of L-Arginine on lengthening LIMA grafts’ patency even further to enhance the success rate of coronary artery bypass grafting (CABG) (Figure ??).
2. Materials and Methods
2.1. Study Population
Eighteen consecutive male patients (n: 18), who underwent coronary artery bypass grafting between April 2023 and April 2024 were included to the study. The patient voluntarily participated in the research after being informed about the study protocol in details, and signing a consent form. Diabetic patients, patients with peripheral arterial disease and emergency cases were excluded from the study populatiion cohort. All patients were considered clinically stable and eligible for elective cardiac surgery, ensuring a relatively uniform clinical baseline but had smoking history (active or past).
The sample size of this study was determined using the "G-Power 3.1" software. A total of 18 patients were randomly allocated into three groups using a computer-generated simple randomization method to treat the tissues ex vivo. Four patients were assigned to the control group, seven patients to Group 1, and seven patients to Group 2. The randomization was performed by a blinded investigator using a random number generator in Microsoft Excel. The harvested samples from the patients were randomly assigned into groups using a computer-based randomization method by a blinded investigator to treat the tissues ex vivo.
2.2. Tissue Harvesting
The left internal thoracic artery (LIMA) was harvested in all patients to be used during the bypass surgery. The distal segments of the artery were resected and eliminated during the graft preparation were collected and divided into 3 groups. Group 1 (n: 4 grafts) included the controls. In Group 2, the grafts were treated with TNF- (10 ng/mL) for 6 hours to create endothelial injury and then stored in heparinized autologous blood. The grafts in Group 3 were treated with the same protocol to create endothelial injury; however, L-Arginine (10 mg/mL) for 6 hours was added to the heparinized autologous blood solution to study the effects of L-Arginine on injured endothelium. All the samples were kept in the refrigerator at 5°C for 3 months in 5% heparinized autologous blood solution for 3 months to induce an ex vivo perfusion model that stimulates physiological conditions and to prevent coagulation. During the 3-month period, the samples were stored under controlled conditions at 5°C in sterile containers and monitored regularly to prevent contamination and to ensure the structural integrity alongside viability. At the end of the 3 months, grafts were freshly investigated under a scanning electron microscope for the ultrastructural properties of the endothelium and were fixed in formaldehyde (4%) for cryosectioning and further investigation.
2.3. Tissue Sectioning
The LIMA grafts were macro sectioned with a scalpel and were cryosectioned utilizing a cryostat machine (Leica-cm-1860-UV, Germany). The grafts were put onto a disk to be frozen fastly at -30°C, and embedded into an optimum cutting temperature (OCT) gel (Sigma-Aldrich, Germany, Cat. #: SLCB3563). The frozen tissue sections were cryosectioned, the thickness was adjusted to 20 μm, and the sections were taken on the microscope slides.
2.4. Tissue Section Staining & Imaging & Image Analysis
For hematoxylin & eosin (H&E) staining, the microscope slides were washed under tap water and incubated inside hematoxylin dye (Bio-Optica, Italy) for 4 minutes before getting washed again and incubated inside the eosin dye (Atom Scientific LTD, UK, Cat. #: RRSP35/E) for 1.5 minutes. The slides were washed under distilled water for 30 seconds and incubated in 85% and 95% ethanol for 30 seconds each. Lastly, the slides were incubated in pure acetone (Sigma-Aldrich, Germany, Cat. #: 179124) to make the slides transparent for approximately 2 minutes. The slides are covered with coverslips using a mounting medium (Fisher Chemical, USA, Cat. #: SP15). For Masson’s Trichrome staining, a staining kit (HistoPlus, Brazil, Cat. #: HST-MTA-0100) was utilized, and after staining slides were covered with coverslips using a mounting medium (Fisher Chemical, USA, #: SP15). Alizarin Red S staining was performed in the dark by incubating the slides with Alizarin Red S fluorescent dye (GBL, Turkey) for 4 minutes and making the slides transparent using pure acetone before they were covered with a coverslip using a mounting medium (Fisher Chemical, USA, Cat. #: SP15).
The H&E or Masson’s Trichrome stained slides were imaged with brightfield microscopy (Zeiss Axio Observer). Alizarin Red S stained slides were imaged with fluorescence microscopy (Zeiss Axio Observer) with excitation of 475 nm at 10X magnification. The images were edited and the fluorescence intensity of the tissues were measured with the Zen Pro 3.6 software. Statistical analysis of the fluorescence intensities were not done since the data pool was not big to perform statistical tests (n: 4 for each tissue).
2.5. Scanning Electron Microscopy & Energy Dispersive Spectroscopy
Tissue grafts were imaged with SEM and EDS, for obtaining morphological and elemental information, respectively.
Selected IMA grafts depending on the age and ex vivo treatment (n = 2 for each group, one graft from younger, one graft from older patient) were sectioned not exceeding 0.5 cm in size and were dried under carbon dioxide using acetone in a critical point dryer device (Leica© EM CPD300 Critical Point Dryer). The critical drying was completed at 40°C without damaging the sections to not interfere with their morphology and for them to be imaged under high vacuum with scanning electron microscopy (SEM).
The dried tissue sections were placed on carbon tapes adhered to the aluminum mount for SEM (Thermo Scientific™ Quattro ESEM) and EDS after being coated with gold (40 nm, 3 flashes) utilizing Leica EM ACE 200 instrument.
Elemental analyses of the tissue sections were made with the EDAX brand Energy Dispersive Spectroscopy (EDS) detector using the APEX software. Before analyses, the EDAX EDS device was calibrated by referring aluminium (Al) and copper (Cu) standard samples automatically, and EDS analysis was performed from a suitable area at 1000 times magnification to determine the average percentages of the elements by atom. The spectra of carbon (C), nitrogen (N), oxygen (O), sodium (Na), sulfur (S), and calcium (Ca) elements were measured in percentage by atomic percentage. The statistical analysis of the elemental composition percentages were not performed because of the small population of data (3 measurements/tissue).
3. Results
The LIMA grafts that are used in the study are numbered and presented in Table 1 with the ages of the patients and the treatment of the graft.
The images of H&E or Masson’s Trichrome stained control group’s tissue sections’ with different magnifications are presented in Figure 1, Figure 2, and Figure 3 for control, TNF-, and TNF-& L-Arginine treated group, respectively.
The images of the H&E and Masson’s Trichrome stained LIMA grafts of treated groups are presented in Figure 4 and Figure 5 depending on the treatment type and the age of the patients.
The images of the Alizarin Red S stained and imaged with fluorescence microscope LIMA grafts of treated groups are presented in Figure 6A depending on the treatment type and the age of the patients. The fluorescent intensity of the tissues were measured using Zen Pro 3.6 software (Figure 6B). Since age 60 did not have any control groups, Alizarin Red S staining was not performed for grafts obtained from patients who were at age of 60.
To observe the effects of treatment and age on the LIMA graft morphology, SEM images of the grafts were obtained from patients of age around 50 (Figure 7), and patients of age around 70 (Figure 8) with 2 different magnifications.
The raw data of atomic percentage (%) with their uncertainty values obtained by the EDS analysis of the LIMA grafts with different age and treatment are presented in Table 2. The atomic percentage (%) of the carbon (C), nitrogen (N), oxygen (O) for patients of ages 50 and 70 depending on the treatment type are presented in Figure 9A, and Figure 9B, respectively. The atomic percentage (%) of the carbon (C), nitrogen (N), oxygen (O) for the control group, TNF- treated group, and TNF-& L-Arginine treated group are presented in Figure 10A, Figure 10B, and Figure 10C, respectively. The comparison of the phosphorus (P), and calcium (Ca) atomic percentage (%) of patients of different ages and treatments is presented in Figure 10D.
4. Discussion
In this study, it was aimed to observe how TNF- or TNF- and L-Arginine ex vivo administration alongside age affected the morphology, histology, calcification, and elemental composition of LIMA grafts that were obtained from male patients.
L-Arginine co-administered TNF- treated and control (non-treated) grafts showed more compact and organized vascular structure compared to TNF- treated grafts in general, when the H&E stained tissues were compared, suggesting the possible effects of L-Arginine on tissue reorganization (Figure 1,Figure 2,Figure 3).
Masson’s Trichrome staining showed, regardless of the type of treatment, that generally with increasing patient age, more vascular fibrosis was present which can be associated with tissue aging, high levels of oxidative stress, genetics, and salt consumption (Figure 1, Figure 2 and Figure 3) [29].
As it can be seen Figure 1 in the images of patient 4’s and patient 10’s which are 72 and 48 years old, respectively, higher fibrosis was observed in the patient 10 which might have been resulted from the lifestyle, and genetics of the patients since pathological background affect the artery health and properties majorly [29,30].
Also when age and the treatment type dependence on grafts were examined, consistent with the literature, as the age increases more vascular fibrosis was observed in the tissue sections, which can lead to decreased graft patency, and can cause vascular stiffening alongside extracellular matrix (ECM) decomposition (Figure 4,Figure 5) [16,29,31].
When co-administered with TNF- ex vivo, L-Arginine increased the collagen levels, and decreased visible fibrosis, as can be seen in Figure 5, regardless of the patient age, showing it might have a potential as a treatment option for fibrosis and increasing LIMA graft patency [19,21]. Even though there was an increase in the collagen deposition on the tissues with L-Arginine administration, further investigation of the effects of L-Arginine on the collagen levels should be quantified with instruments such as mass spectrometry or tests such as ELISA or hydroxyproline assay [32].
Alizarin Red S staining was performed on 6 different tissue sections to compare how age difference and treatment affected the calcification of the LIMA grafts, since this staining is effective to stain and observe macrocalcifications [26]. Detecting calcification levels or calcified areas are important to check the artery graft patency/quality [9]. When the images were compared, it was observed that TNF- administered grafts had more calcified areas (red) compared to the control group and L-Arginine co-administered with TNF- (Figure 6A) in general regardless of the age. In age 70, more calcified areas were observed compared to the suggesting with the increment of the age and TNF- treatment calcified areas can be increased (Figure 6A) which was also supported by the EDS results for atomic calcium levels shown in Table 2. The qunatification of the Alizarin Red S stained tissues showed that when TNF-% L-Arginine co-administered together, less fluorescent signals were observed, suggesting less calcification (Figure 6B). The standard deviations of the fluorescent intensity being high might be resulted from the fact that these intensities were measured from images which makes it semi-quantitative instead of quantitative (Figure 6B).
In SEM images, when the grafts morphology that were obtained from patients of different ages with the same ex vivo treatment were compared, grafts obtained from patients that were at age of 50 displayed a more organized morphology compared to the grafts obtained from patients that were at age of 70 (Figure 7,Figure 8), suggesting as age increases LIMA grafts lose organized/compact morphology. With TNF- treatment, structural disruptions were observed in grafts’ morphology regardless of the age of the patients and co-administration of L-Arginine with TNF- enabled grafts’ morphologies to be more similar to the control groups, and more organized when compared with the TNF- treated grafts again regardless of the patient age, suggesting vascular damage decrement (Figure 7,Figure 8) [18,21].
Grafts obtained from patients that were in the age 50 range generally displayed higher atomic % of C and O suggesting abundance of collagen in the structure regardless of the treatment (Figure 9, Figure 10A-C) [33].
LIMA graft obtained from patient 11 (TNF- treated) displayed the highest atomic % of Ca and P which was confirmed by the lipidic structure observed by Masson’s Trichrome staining (Figure 2, Figure 10D). Overall, TNF- treated grafts displayed higher atomic % of Ca and P, suggesting TNF- level increment in the tissue can result in calcification [18]. L-Arginine co-administration generally resulted in an increase in atomic % N and O levels, suggesting possible NO synthesis since L-Arginine is the precursor of NO [19].
This study was only conducted with the grafts obtained from limited male patients and can be conducted with grafts obtained from females in the future and/or with bigger sample size, since cardiovascular symptoms present later in women than men and the operational alongside post-operational mortality rate is higher in females compared to males and increasing the graft patency has potential to expand the lifespan after CABG [34].
Since lifestyle and genetic tendencies affect artery health, in a future study, these factors should also be studied in similar but bigger patient groups [30]. Overall, the sample size should be extended of the tissues with grouping considering the pathological history of the patients, and the experiments should be repeated to obtain more data and perform statistical tests.
To understand the effects of the treatments on the graft patency on a molecular level, mRNA or protein levels of type I/III collagen, proteoglycan, and other ECM components should be examined and quantified [14].
In this study, the potential of L-Arginine when co-administered with TNF- was observed, further investigations of molecular levels of NO, oxidative stress markers, and inflammatory markers are needed to understand the full potential and effect of L-Arginine when co-administered with TNF- ex vivo [19,21].
The calcified areas of the grafts were able to be imaged with Alizarin Red S staining and elemental composition analysis obtained by EDS, however, since Alizarin Red S staining cannot detect microcalcifications, in further studies, Raman spectroscopy can be used to further investigate the calcification status of the grafts and how age alongside treatment type affect the calcification of the grafts [35].
TNF- is known to have the potential to increase vascular stiffness, the effect of TNF- on vascular stiffness can be quantified and examined with scanning acoustic microscopy (SAM) in future studies, since by acoustic wave speed values the arterial stiffness can be quantified [29,36].
The effects of L-arginine or TNF- treatment on the elemental composition of the tissue grafts were examined with the EDS analysis, however, to obtain a statistical scientific outcome, the graft samples should be extended, and this was planned for future studies to obtain a statistical outcome of the treatment’s effects on the grafts’ elemental composition levels.
Overall, this study provides preliminary results about how L-Arginine treatment affects LIMA graft patency on histological, morphological, and chemical level, however, in the future, the sample size should be extended, the effects of L-Arginine should be examined more at the molecular level, and the grouping of the tissue samples should be made in a more specific manner to obtain more accurate results.
5. Conclusion
In this preliminary study, the effects of TNF- or TNF- and L-Arginine ex vivo treatment alongside age, on the morphology, histology, collagen levels, calcification, and elemental composition of LIMA grafts obtained from male patients, were investigated to understand whether L-Arginine treatment could improve LIMA graft patency or not. This preliminary study overall suggested the potential usage of L-Arginine for improving the LIMA graft patency, since generally it lead to more organized morphology of the grafts, more collagen, less calcification when compared with TNF- treated grafts but further investigation is needed.
Author Contributions
Conceptualization, U.M. and T.B.; methodology, U.M. and T.B.; validation, U.M. and T.B.; investigation, D.B., T.K.A., O.G., O.M.D.; data curation, D.B., T.K.A., O.G.; writing—original draft preparation, D.B., T.K.A., O.G., O.M.D., U.M. and T.B.; writing—review and editing, D.B., U.M. and T.B.; visualization, D.B., T.K.A., O.G.; supervision, A.S., U.M. and T.B.; project administration, U.M. and T.B.. All authors have read and agreed to the published version of the manuscript.
Institutional Review Board Statement
The study was approved by the institutional review board of Istanbul Medipol University (No: E-10840098-772.02-2162).
Informed Consent Statement
Informed consent was obtained from all subjects involved in the study.
Data Availability Statement
The raw data supporting the conclusions of this article will be made available by the authors on request.
Acknowledgments
The authors would like to thank Acıbadem University for the usage of the facilities.
Conflicts of Interest
The authors declare no conflicts of interest.
Abbreviations
The following abbreviations are used in this manuscript:
| CABG | Coronary Artery Bypass Grafting |
| LIMA | Left Internal Mammary Artery |
| IMA | Internal Mammary Artery |
| CVDs | Cardiovascular Diseases |
| TNF- | Tumor Necrosis Factor Alpha |
| CRP | C-Reactive Protein |
| IL-6 | Interleukin-6 |
| SV | Saphenous Vein |
| TI | Tunica Intima |
| TM | Tunica Media |
| SMCs | Smooth Muscle Cells |
| TA | Tunica Adventita |
| LAD | Left Coronary Artery |
| LCX | Left Circumflex Artery |
| NO | Nitric Oxide |
| NOS | Nitric Oxide Synthase |
| SEM | Scanning Electron Micrsocopy |
| EDS | Energy X-Ray Dispersion Spectroscopy |
| H&E | Hematoxylin & Eosin |
| ECM | Extracellular Matrix |
| SAM | Scanning Acoustic Microscopy |
References
- Ansari, S. Heart health and nutraceuticals. In Preparation of Phytopharmaceuticals for the Management of Disorders; Elsevier, 2021; pp. 255–272. [CrossRef]
- Vaduganathan, M.; Mensah, G.A.; Turco, J.V.; Fuster, V.; Roth, G.A. The global burden of cardiovascular diseases and risk: a compass for future health, 2022. [CrossRef]
- Suman, S.; Pravalika, J.; Manjula, P.; Farooq, U. Gender and CVD-does it really matters? Current Problems in Cardiology 2023, 48, 101604. [Google Scholar] [CrossRef] [PubMed]
- Alpert, J.S. New coronary heart disease risk factors. The American Journal of Medicine 2023, 136, 331–332. [Google Scholar] [CrossRef] [PubMed]
- Rodgers, J.L.; Jones, J.; Bolleddu, S.I.; Vanthenapalli, S.; Rodgers, L.E.; Shah, K.; Karia, K.; Panguluri, S.K. Cardiovascular risks associated with gender and aging. Journal of cardiovascular development and disease 2019, 6, 19. [Google Scholar] [CrossRef] [PubMed]
- Gharibeh, L.; Ferrari, G.; Ouimet, M.; Grau, J.B. Conduits’ biology regulates the outcomes of coronary artery bypass grafting. Basic to Translational Science 2021, 6, 388–396. [Google Scholar] [CrossRef]
- Alexander, J.H.; Smith, P.K. Coronary-artery bypass grafting. New England Journal of Medicine 2016, 374, 1954–1964. [Google Scholar] [CrossRef]
- Julian, D.; Cowan, J.; McLenachan, J. Cardiology; Elsevier Saunders, 2005.
- Otsuka, F.; Yahagi, K.; Sakakura, K.; Virmani, R. Why is the mammary artery so special and what protects it from atherosclerosis? Annals of cardiothoracic surgery 2013, 2, 519. [Google Scholar] [CrossRef]
- Ryaan, E.A.; Fialka, N.M.; Bozso, S.J.; Nagendran, J. Bilateral internal mammary arteries for coronary artery bypass grafting: One size does not fit all. International Journal of Cardiology. Heart & Vasculature 2023, 47. [Google Scholar] [CrossRef]
- Weiss, A.J.; Zhao, S.; Tian, D.H.; Taggart, D.P.; Yan, T.D. A meta-analysis comparing bilateral internal mammary artery with left internal mammary artery for coronary artery bypass grafting. Annals of cardiothoracic surgery 2013, 2, 390. [Google Scholar] [CrossRef]
- Khan, Y.; Shahabuddin, S.; Hashmi, S.; Sami, S. Comparing outcomes in patients undergoing coronary artery bypass grafting with and without using the internal mammary artery in a tertiary care hospital. Cureus 2020, 12. [Google Scholar] [CrossRef]
- Masroor, M.; Ahmad, A.; Wang, Y.; Dong, N. Assessment of the graft quality and patency during and after coronary artery bypass grafting. Diagnostics 2023, 13, 1891. [Google Scholar] [CrossRef]
- Shadrin, I.Y.; Holmes, D.R.; Behfar, A. Left internal mammary artery as an endocrine organ: insights into graft biology and long-term impact following coronary artery bypass grafting. In Proceedings of the Mayo Clinic Proceedings. Elsevier, Vol. 98; 2023; pp. 150–162. [Google Scholar]
- Wolny, R.; Mintz, G.S.; Matsumura, M.; Kim, S.Y.; Ishida, M.; Fujino, A.; Lee, T.; Shlofmitz, E.; Goldberg, A.; Liu, Y.; et al. Left coronary artery calcification patterns after coronary bypass graft surgery: An in-vivo optical coherence tomography study. Catheterization and Cardiovascular Interventions 2021, 98, 483–491. [Google Scholar] [CrossRef]
- Diegeler, A.; Doll, N.; Rauch, T.; Haberer, D.; Walther, T.; Falk, V.; Gummert, J.; Autschbach, R.; Mohr, F. Humoral Immune Response During Coronary Artery Bypass Grafting : A Comparison of Limited Approach, "Off-Pump" Technique, and Conventional Cardiopulmonary Bypass. Circulation 2000, 102, III95–100. [Google Scholar] [CrossRef]
- Wan, S.; Marchant, A.; DeSmet, J.M.; Antoine, M.; Zhang, H.; Vachiery, J.L.; Goldman, M.; Vincent, J.L.; LeClerc, J.L. Human cytokine responses to cardiac transplantation and coronary artery bypass grafting. The Journal of Thoracic and Cardiovascular Surgery 1996, 111, 469–477. [Google Scholar] [CrossRef]
- Gonzalez Rodriguez, A.; Schroeder, M.E.; Grim, J.C.; Walker, C.J.; Speckl, K.F.; Weiss, R.M.; Anseth, K.S. Tumor necrosis factor-α promotes and exacerbates calcification in heart valve myofibroblast populations. The FASEB Journal 2021, 35, e21382. [Google Scholar] [CrossRef] [PubMed]
- Kurhaluk, N.; Tkaczenko, H. L-Arginine and Nitric Oxide in Vascular Regulation—Experimental Findings in the Context of Blood Donation. Nutrients 2025, 17, 665. [Google Scholar] [CrossRef] [PubMed]
- Björkegren, J.L.; Lusis, A.J. Atherosclerosis: recent developments. Cell 2022, 185, 1630–1645. [Google Scholar] [CrossRef]
- Oyovwi, M.O.; Atere, A.D. Exploring the medicinal significance of l-Arginine mediated nitric oxide in preventing health disorders. European Journal of Medicinal Chemistry Reports 2024, 12, 100175. [Google Scholar] [CrossRef]
- Kanno, Y.; Into, T.; Lowenstein, C.J.; Matsushita, K. Nitric oxide regulates vascular calcification by interfering with TGF-β signalling. Cardiovascular research 2008, 77, 221–230. [Google Scholar] [CrossRef]
- Oe, Y.; Mitsui, S.; Sato, E.; Shibata, N.; Kisu, K.; Sekimoto, A.; Miyazaki, M.; Sato, H.; Ito, S.; Takahashi, N. Lack of endothelial nitric oxide synthase accelerates ectopic calcification in uremic mice fed an adenine and high phosphorus diet. The American Journal of Pathology 2021, 191, 283–293. [Google Scholar] [CrossRef]
- Neels, J.G.; Leftheriotis, G.; Chinetti, G. Atherosclerosis calcification: focus on lipoproteins. Metabolites 2023, 13, 457. [Google Scholar] [CrossRef]
- Girão, A.V.; Caputo, G.; Ferro, M.C. Application of scanning electron microscopy–energy dispersive X-ray spectroscopy (SEM-EDS). In Comprehensive analytical chemistry; Elsevier, 2017; Vol. 75, pp. 153–168. [CrossRef]
- Smith, E.R.; Hewitson, T.D.; Holt, S.G. Diagnostic tests for vascular calcification. Advances in Chronic Kidney Disease 2019, 26, 445–463. [Google Scholar] [CrossRef]
- Mukherjee, S.; Sharma, S.; Soni, V.; Joshi, A.; Gaikwad, A.; Bellare, J.; Kode, J. Improved osteoblast function on titanium implant surfaces coated with nanocomposite Apatite–Wollastonite–Chitosan–an experimental in-vitro study. Journal of Materials Science: Materials in Medicine 2022, 33, 25. [Google Scholar] [CrossRef]
- Pizzicannella, J.; Marconi, G.D.; Pierdomenico, S.D.; Cavalcanti, M.F.; Diomede, F.; Trubiani, O. Bovine pericardium membrane, gingival stem cells, and ascorbic acid: a novel team in regenerative medicine. European Journal of Histochemistry: EJH 2019, 63, 3064. [Google Scholar] [CrossRef]
- Harvey, A.; Montezano, A.C.; Lopes, R.A.; Rios, F.; Touyz, R.M. Vascular fibrosis in aging and hypertension: molecular mechanisms and clinical implications. Canadian Journal of Cardiology 2016, 32, 659–668. [Google Scholar] [CrossRef]
- Khera, A.V.; Emdin, C.A.; Drake, I.; Natarajan, P.; Bick, A.G.; Cook, N.R.; Chasman, D.I.; Baber, U.; Mehran, R.; Rader, D.J.; et al. Genetic risk, adherence to a healthy lifestyle, and coronary disease. New England Journal of Medicine 2016, 375, 2349–2358. [Google Scholar] [CrossRef]
- Rolski, F.; Tkacz, K.; Węglarczyk, K.; Kwiatkowski, G.; Pelczar, P.; Jaźwa-Kusior, A.; Bar, A.; Kuster, G.M.; Chłopicki, S.; Siedlar, M.; et al. TNF-α protects from exacerbated myocarditis and cardiac death by suppressing expansion of activated heart-reactive CD4+ T cells. Cardiovascular Research 2024, 120, 82–94. [Google Scholar] [CrossRef] [PubMed]
- Bielajew, B.J.; Hu, J.C.; Athanasiou, K.A. Collagen: quantification, biomechanics and role of minor subtypes in cartilage. Nature Reviews Materials 2020, 5, 730–747. [Google Scholar] [CrossRef]
- Chinh, N.T.; Nghia, T.H.; Tuan, H.H.; Manh, V.Q.; Trung, V.Q.; Doanh, T.C.; Hoang, T. Study on characteristic of collagen extracted from fresh-water fish scales by bio-chemical method. skin (Pangasius hypophthalmus) 2020, 8, 9. [Google Scholar]
- Harik, L.; Perezgrovas-Olaria, R.; Dimagli, A.; Alzghari, T.; An, K.R.; Cancelli, G.; Gaudino, M.; et al. Sex differences in coronary artery bypass graft surgery outcomes: a narrative review. Journal of Thoracic Disease 2023, 15, 5041. [Google Scholar] [CrossRef] [PubMed]
- You, A.Y.; Bergholt, M.S.; St-Pierre, J.P.; Kit-Anan, W.; Pence, I.J.; Chester, A.H.; Yacoub, M.H.; Bertazzo, S.; Stevens, M.M. Raman spectroscopy imaging reveals interplay between atherosclerosis and medial calcification in the human aorta. Science advances 2017, 3, e1701156. [Google Scholar] [CrossRef]
- Akhtar, R.; Cruickshank, J.K.; Zhao, X.; Derby, B.; Weber, T. A pilot study of scanning acoustic microscopy as a tool for measuring arterial stiffness in aortic biopsies. Artery Research 2016, 13, 1–5. [Google Scholar] [CrossRef] [PubMed]
Figure 1.
10X and 20X Images of Hematoxylin & Eosin (H&E) or Masson’s Trichrome Stained Control Group LIMA Grafts. (Scale bar = 100 m and 50 m for 10X and 20X, respectively)
Figure 1.
10X and 20X Images of Hematoxylin & Eosin (H&E) or Masson’s Trichrome Stained Control Group LIMA Grafts. (Scale bar = 100 m and 50 m for 10X and 20X, respectively)
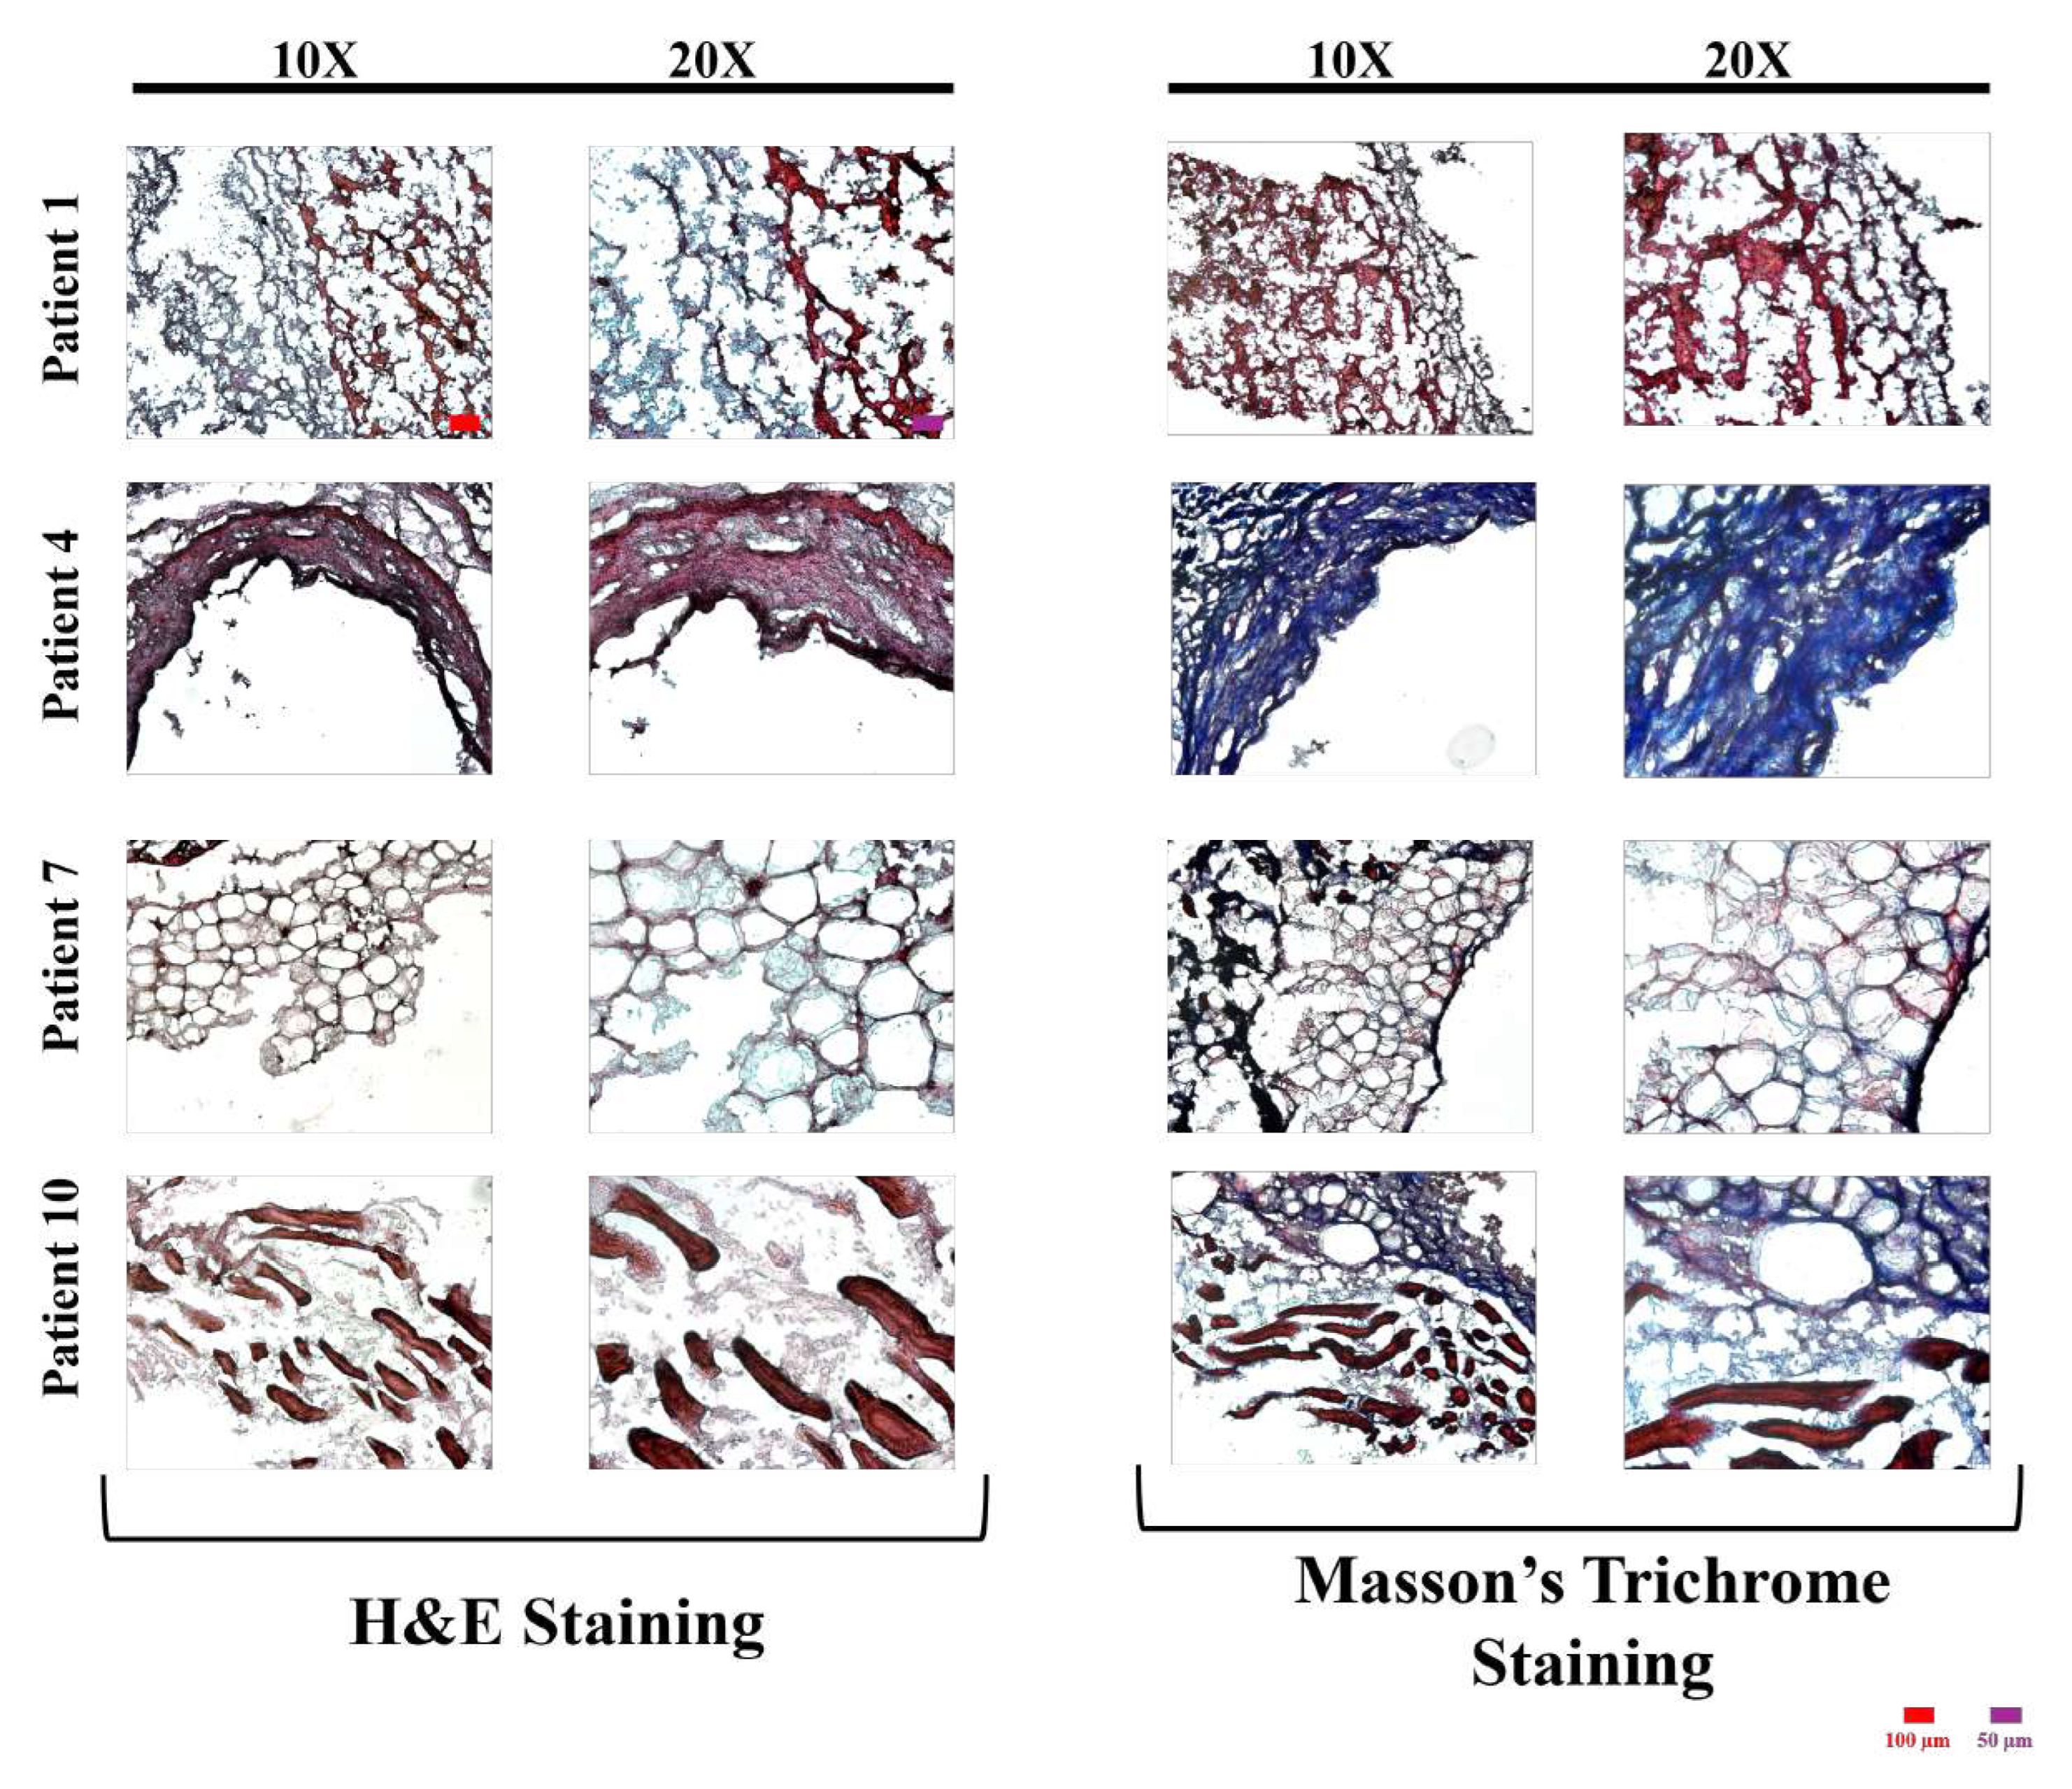
Figure 2.
10X and 20X Images of Hematoxylin & Eosin (H&E) or Masson’s Trichrome Stained TNF- Treated Group LIMA Grafts. (Scale bar = 100 m and 50 m for 10X and 20X, respectively)
Figure 2.
10X and 20X Images of Hematoxylin & Eosin (H&E) or Masson’s Trichrome Stained TNF- Treated Group LIMA Grafts. (Scale bar = 100 m and 50 m for 10X and 20X, respectively)
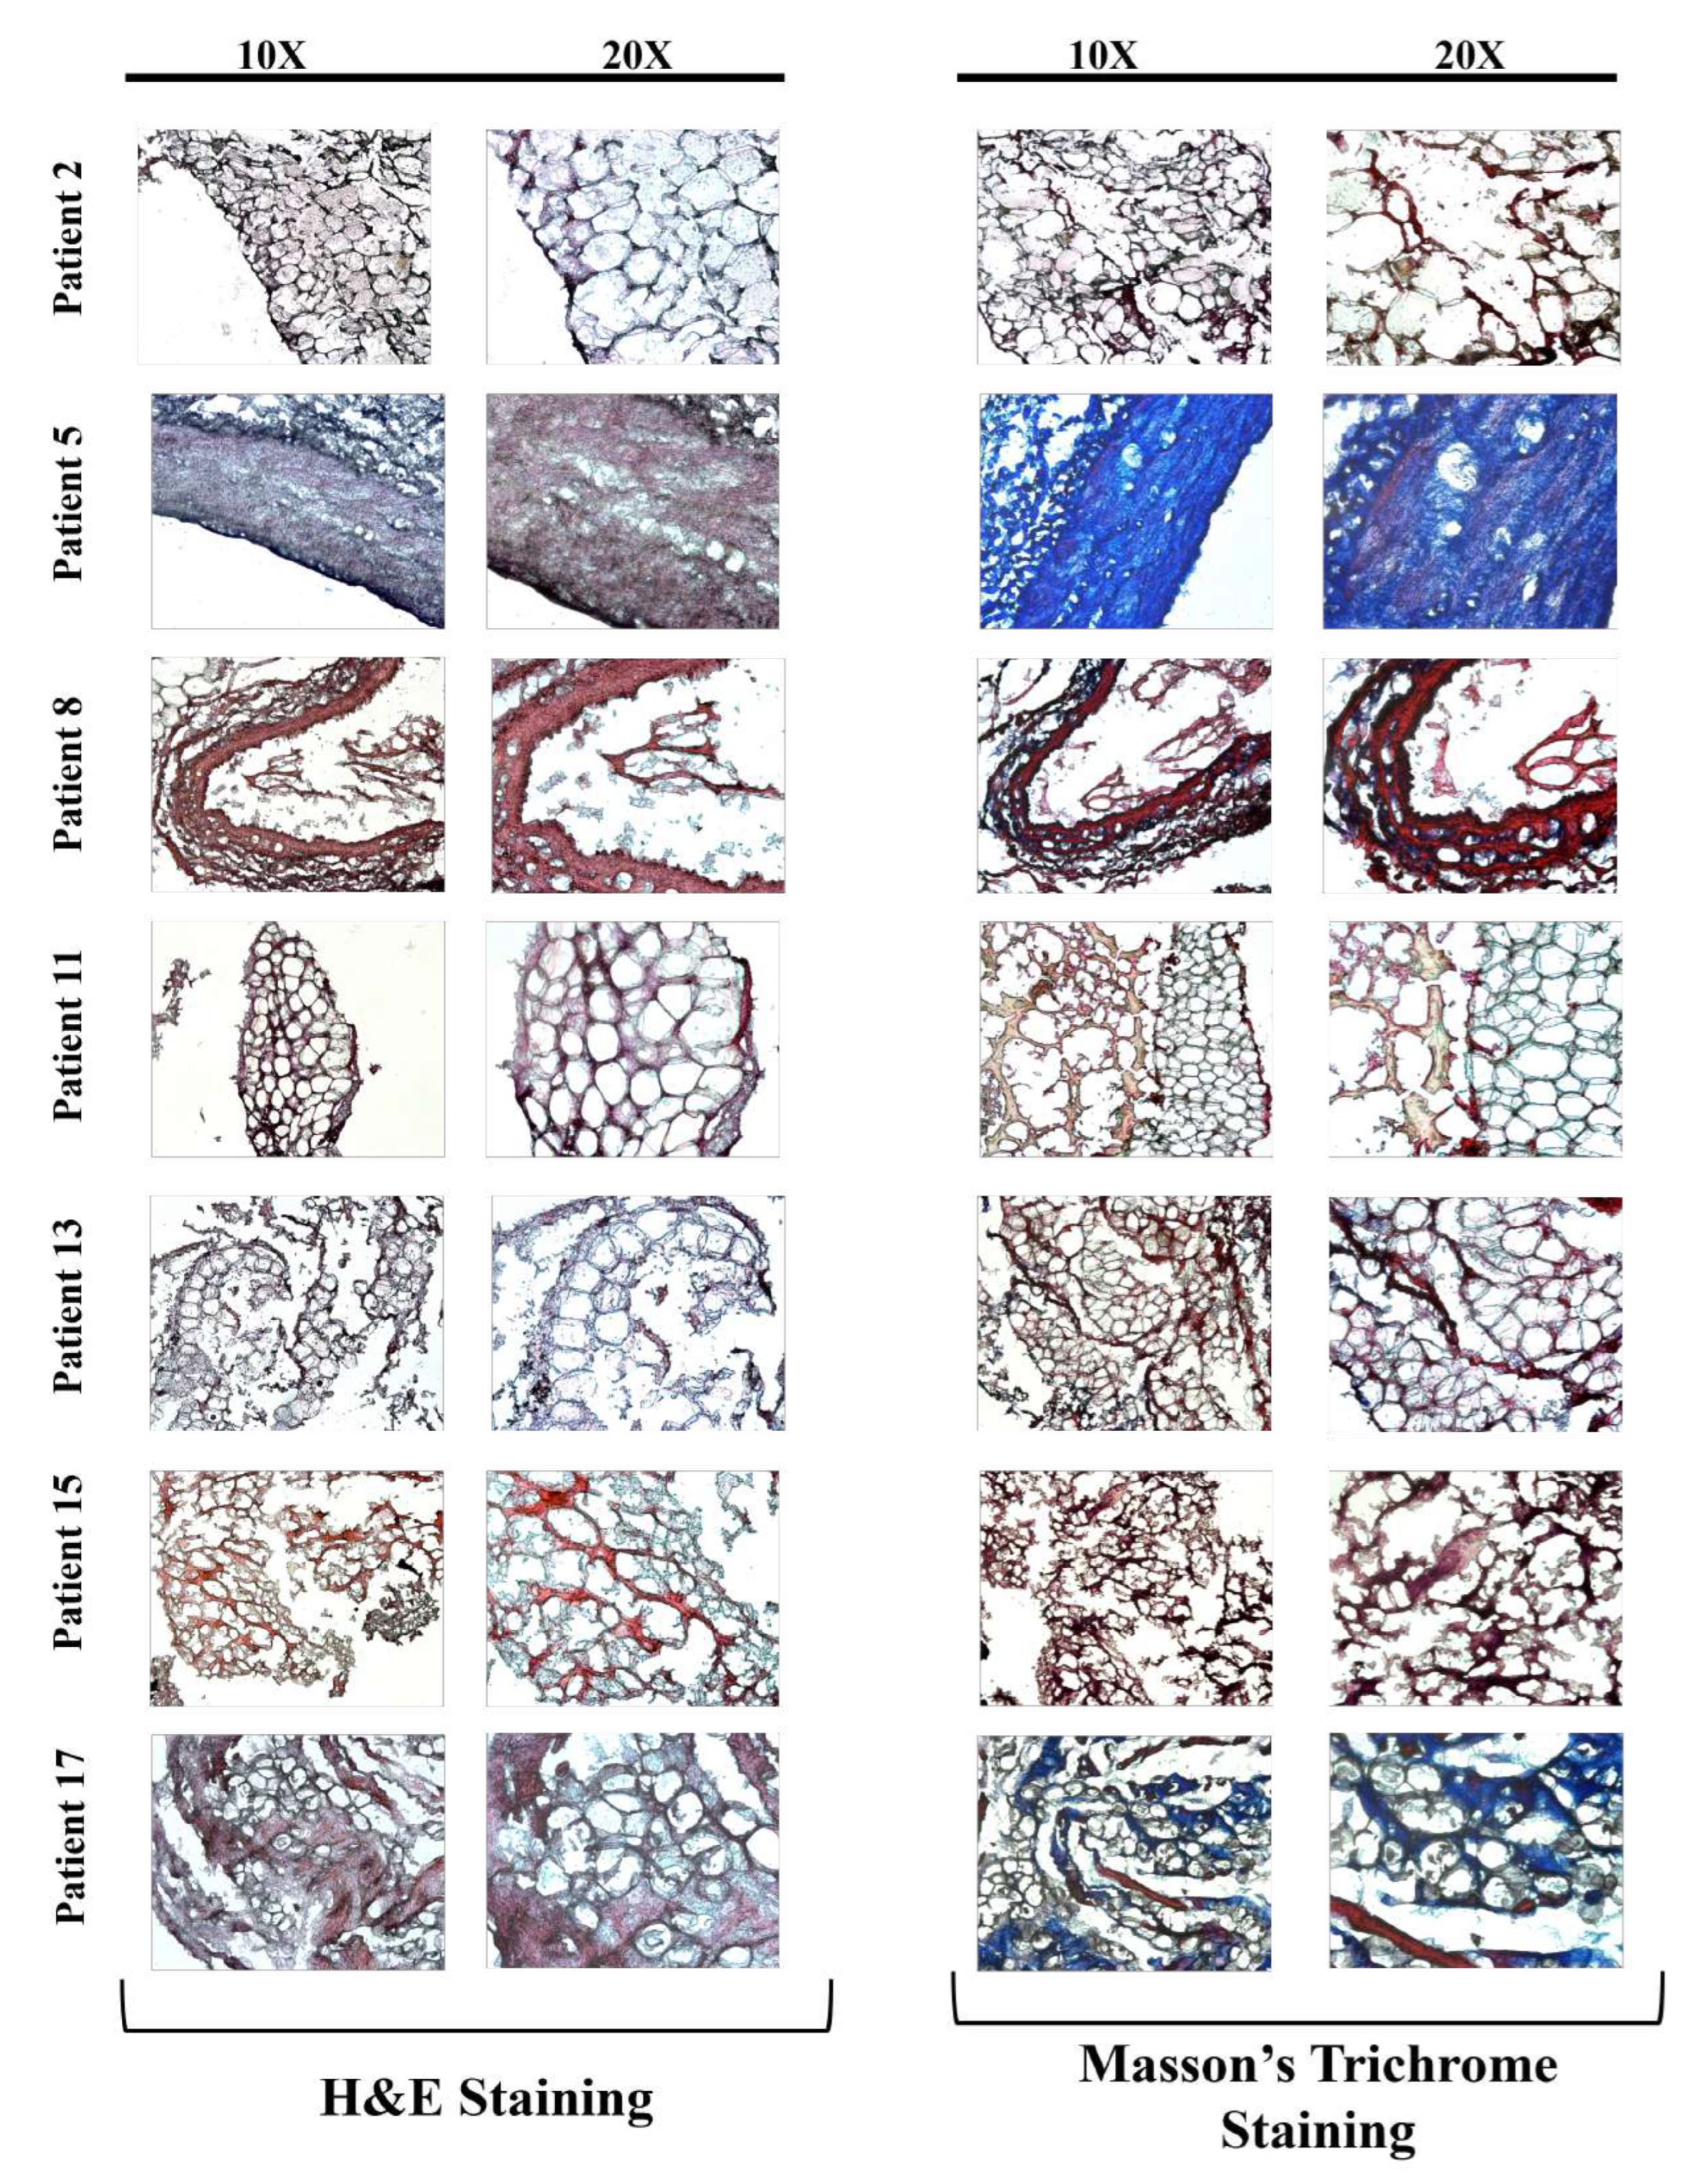
Figure 3.
10X and 20X Images of Hematoxylin & Eosin (H&E) or Masson’s Trichrome Stained TNF-& L-Arginine Treated Group LIMA Grafts. (Scale bar = 100 m and 50 m for 10X and 20X, respectively)
Figure 3.
10X and 20X Images of Hematoxylin & Eosin (H&E) or Masson’s Trichrome Stained TNF-& L-Arginine Treated Group LIMA Grafts. (Scale bar = 100 m and 50 m for 10X and 20X, respectively)
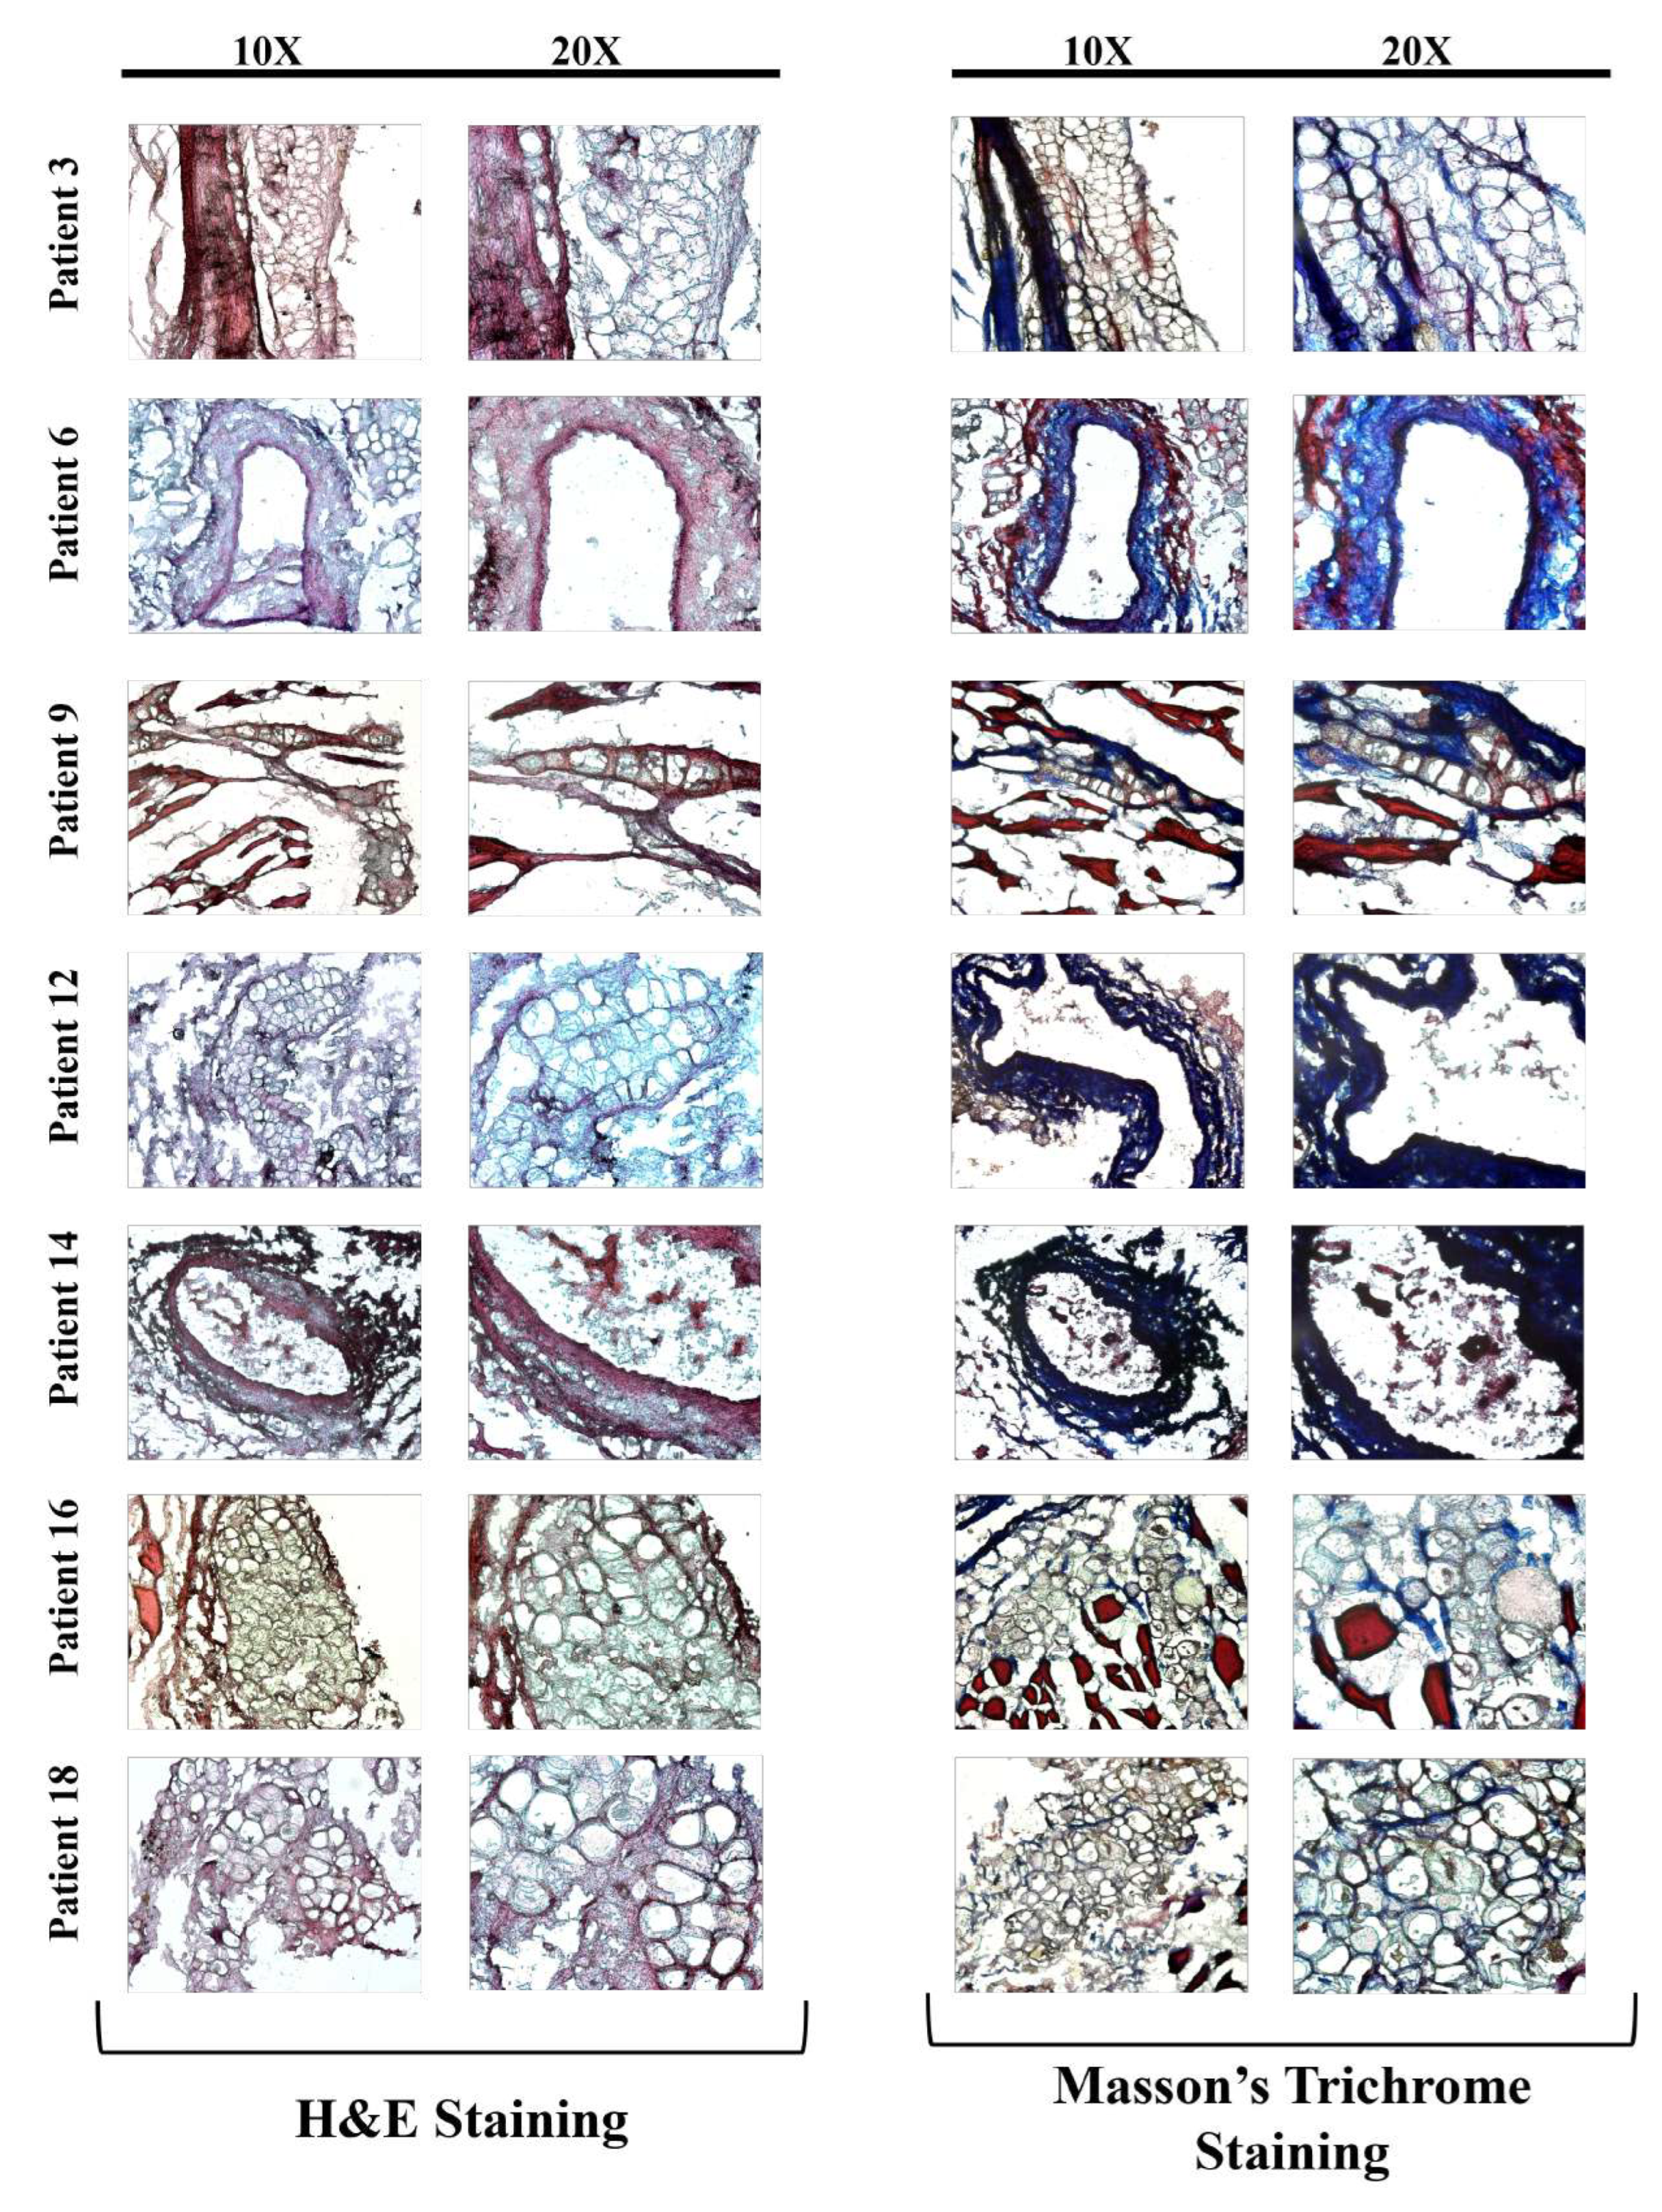
Figure 4.
10X Images of H&E Stained Control, TNF-, and TNF-& L-Arginine ex vivo Treated Group LIMA Grafts for patients at the age of 50, 60 and 70. (Scale bar = 100 m for 10X)
Figure 4.
10X Images of H&E Stained Control, TNF-, and TNF-& L-Arginine ex vivo Treated Group LIMA Grafts for patients at the age of 50, 60 and 70. (Scale bar = 100 m for 10X)
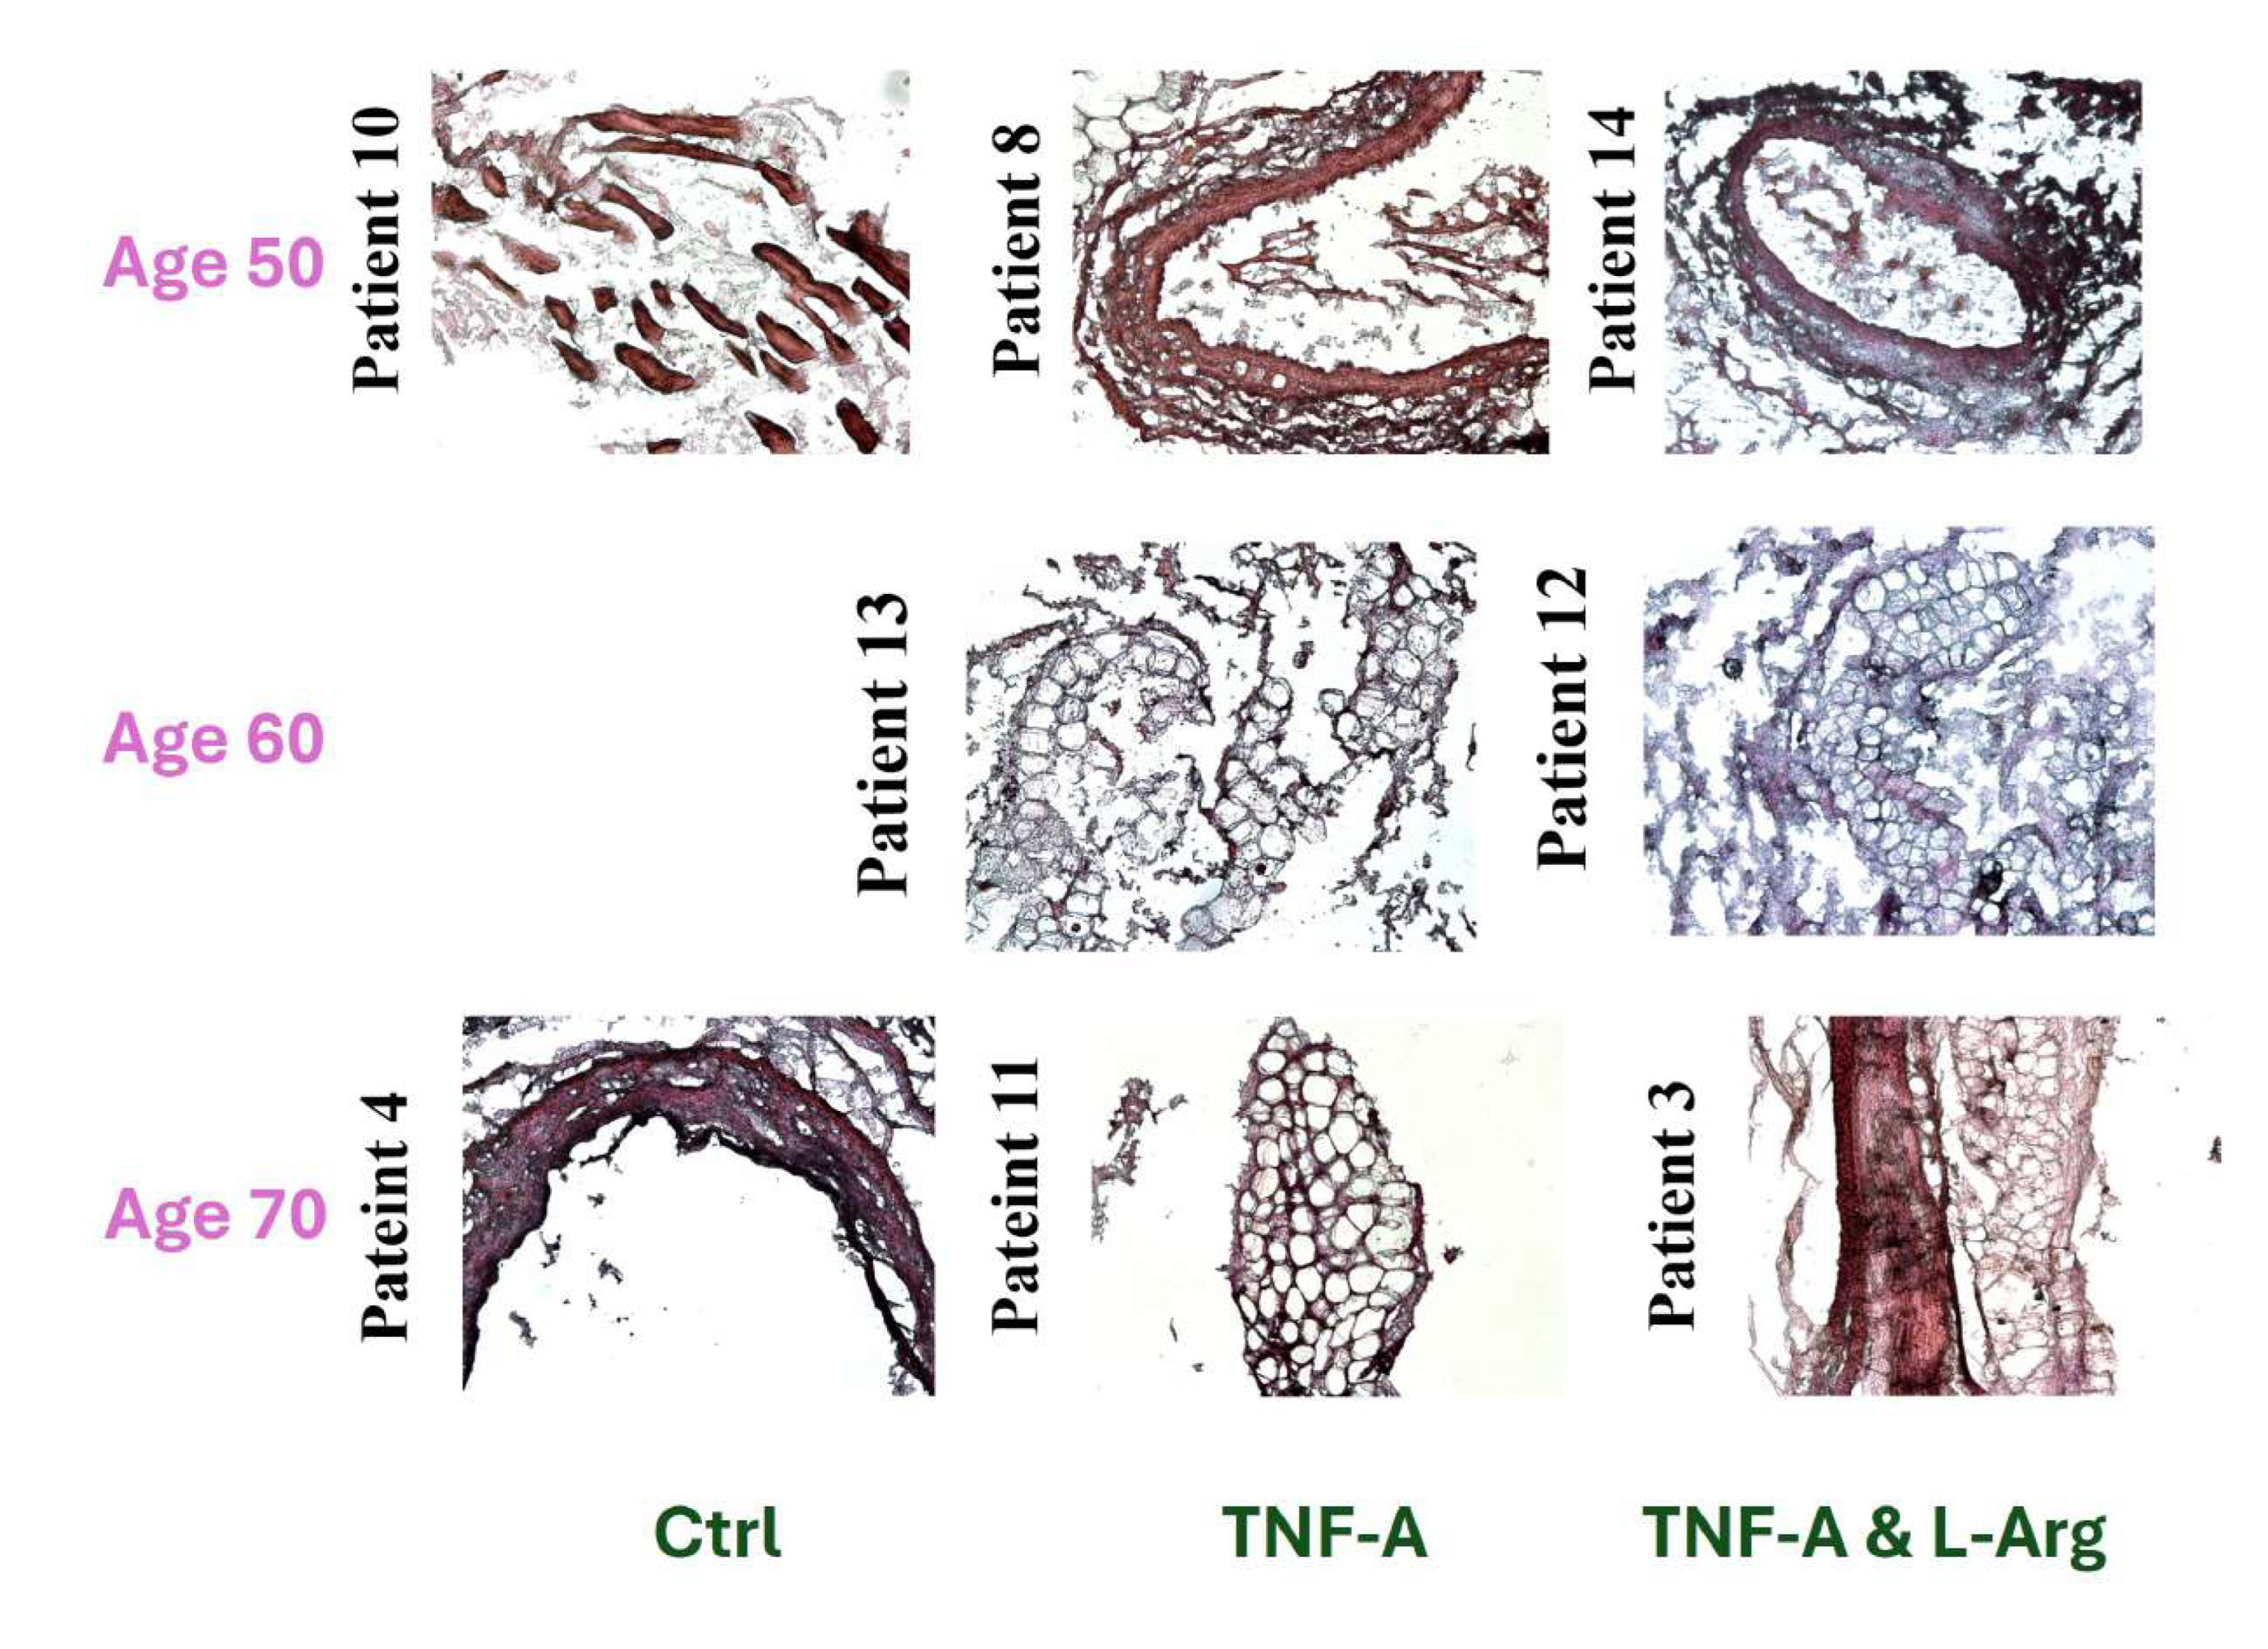
Figure 5.
10X Images of Masson’s Trichrome Stained Control, TNF-, and TNF-& L-Arginine Treated Group LIMA Grafts for patients at Age of 50, 60 and 70. (Scale bar = 100 m for 10X)
Figure 5.
10X Images of Masson’s Trichrome Stained Control, TNF-, and TNF-& L-Arginine Treated Group LIMA Grafts for patients at Age of 50, 60 and 70. (Scale bar = 100 m for 10X)
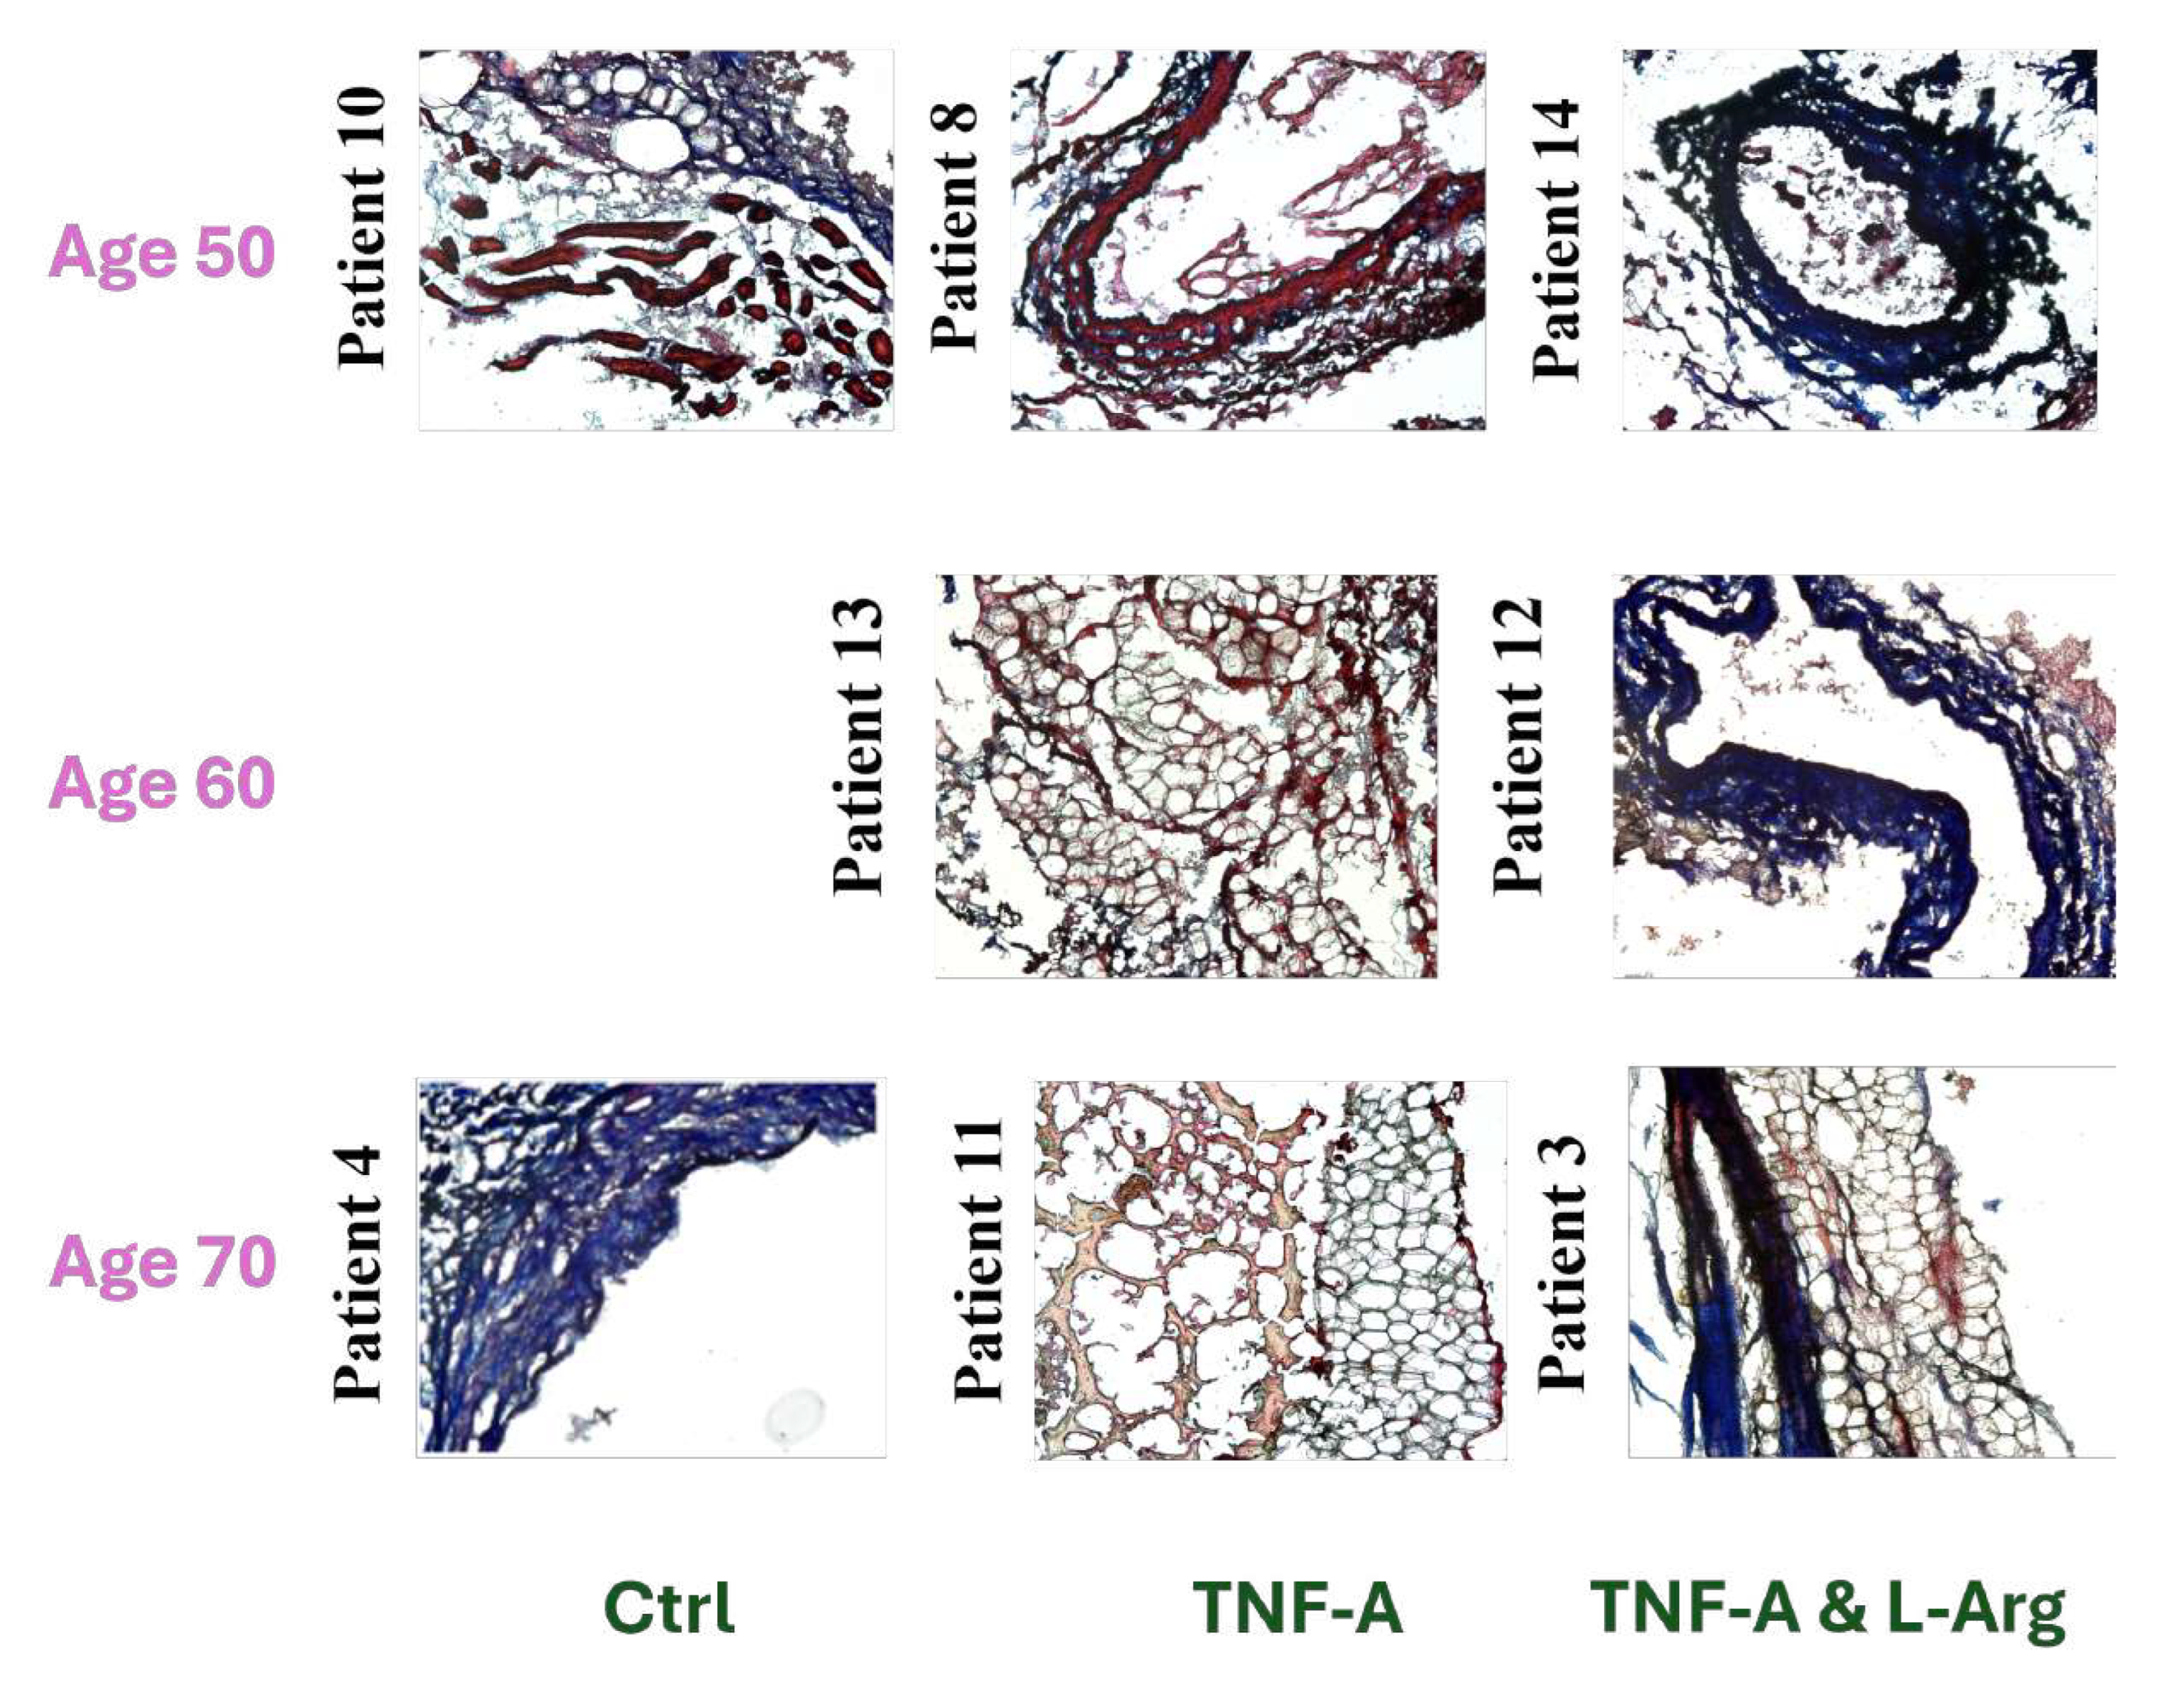
Figure 6.
Alizarin Red S stained LIMA grafts. A:10X Images of Alizarin Red S Stained Control, TNF-, and TNF-& L-Arginine Treated Group LIMA Grafts for patients at Age of 50 and 70. (Scale bar = 100 m for 10X), B:Fluorescence intensity of the stained tissues with their standard deviations.
Figure 6.
Alizarin Red S stained LIMA grafts. A:10X Images of Alizarin Red S Stained Control, TNF-, and TNF-& L-Arginine Treated Group LIMA Grafts for patients at Age of 50 and 70. (Scale bar = 100 m for 10X), B:Fluorescence intensity of the stained tissues with their standard deviations.
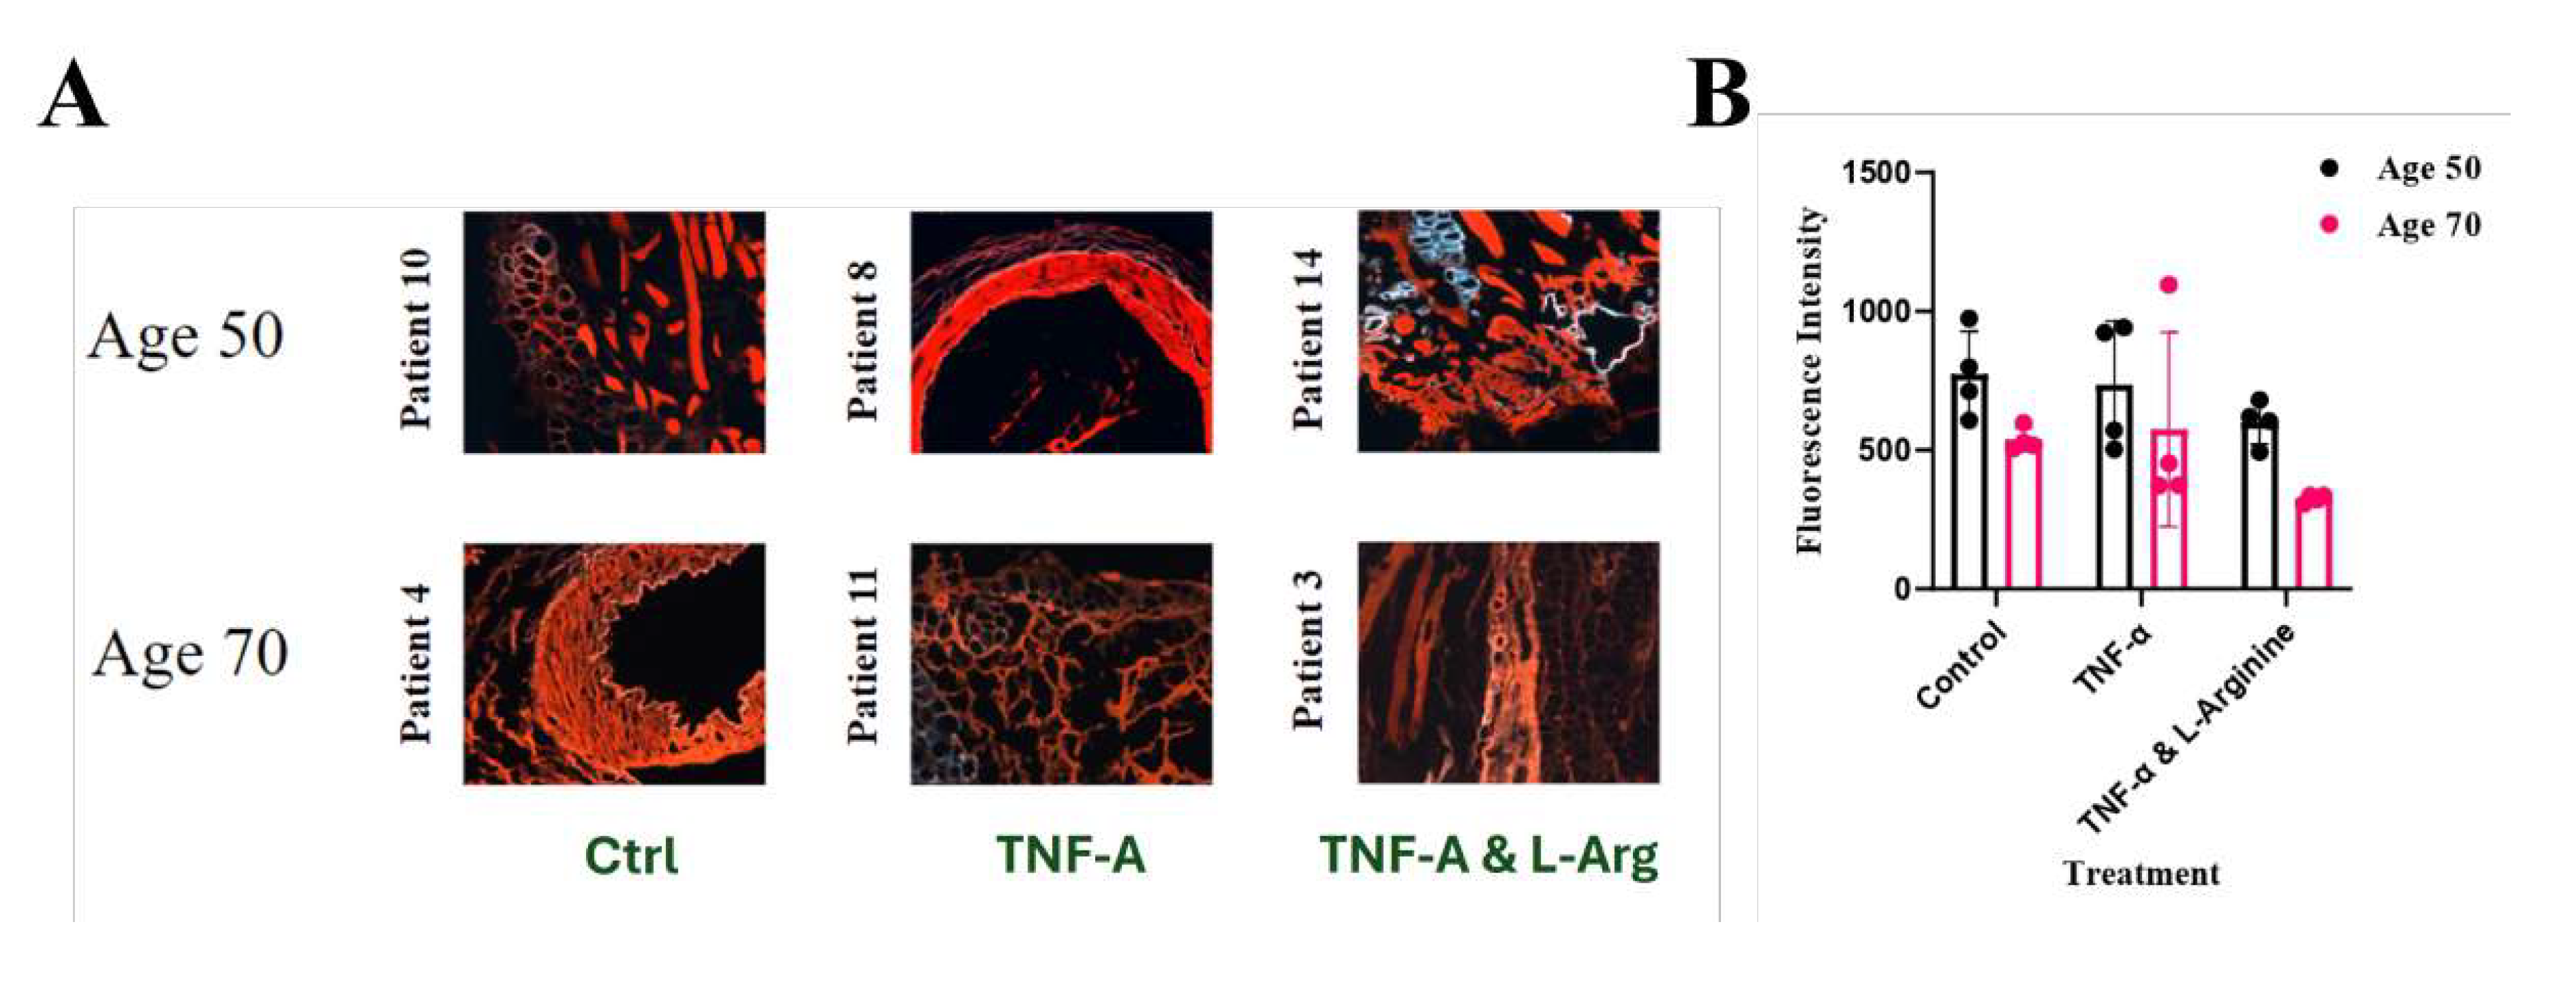
Figure 7.
SEM Images of Control, TNF-, and TNF-& L-Arginine Treated LIMA Grafts for patients at Age of 50 (Scale bar = 100 m and 50 m)
Figure 7.
SEM Images of Control, TNF-, and TNF-& L-Arginine Treated LIMA Grafts for patients at Age of 50 (Scale bar = 100 m and 50 m)

Figure 8.
SEM Images of Control, TNF-, and TNF-& L-Arginine Treated LIMA Grafts for patients at Age of 70 (Scale bar = 100 m and 50 m)
Figure 8.
SEM Images of Control, TNF-, and TNF-& L-Arginine Treated LIMA Grafts for patients at Age of 70 (Scale bar = 100 m and 50 m)
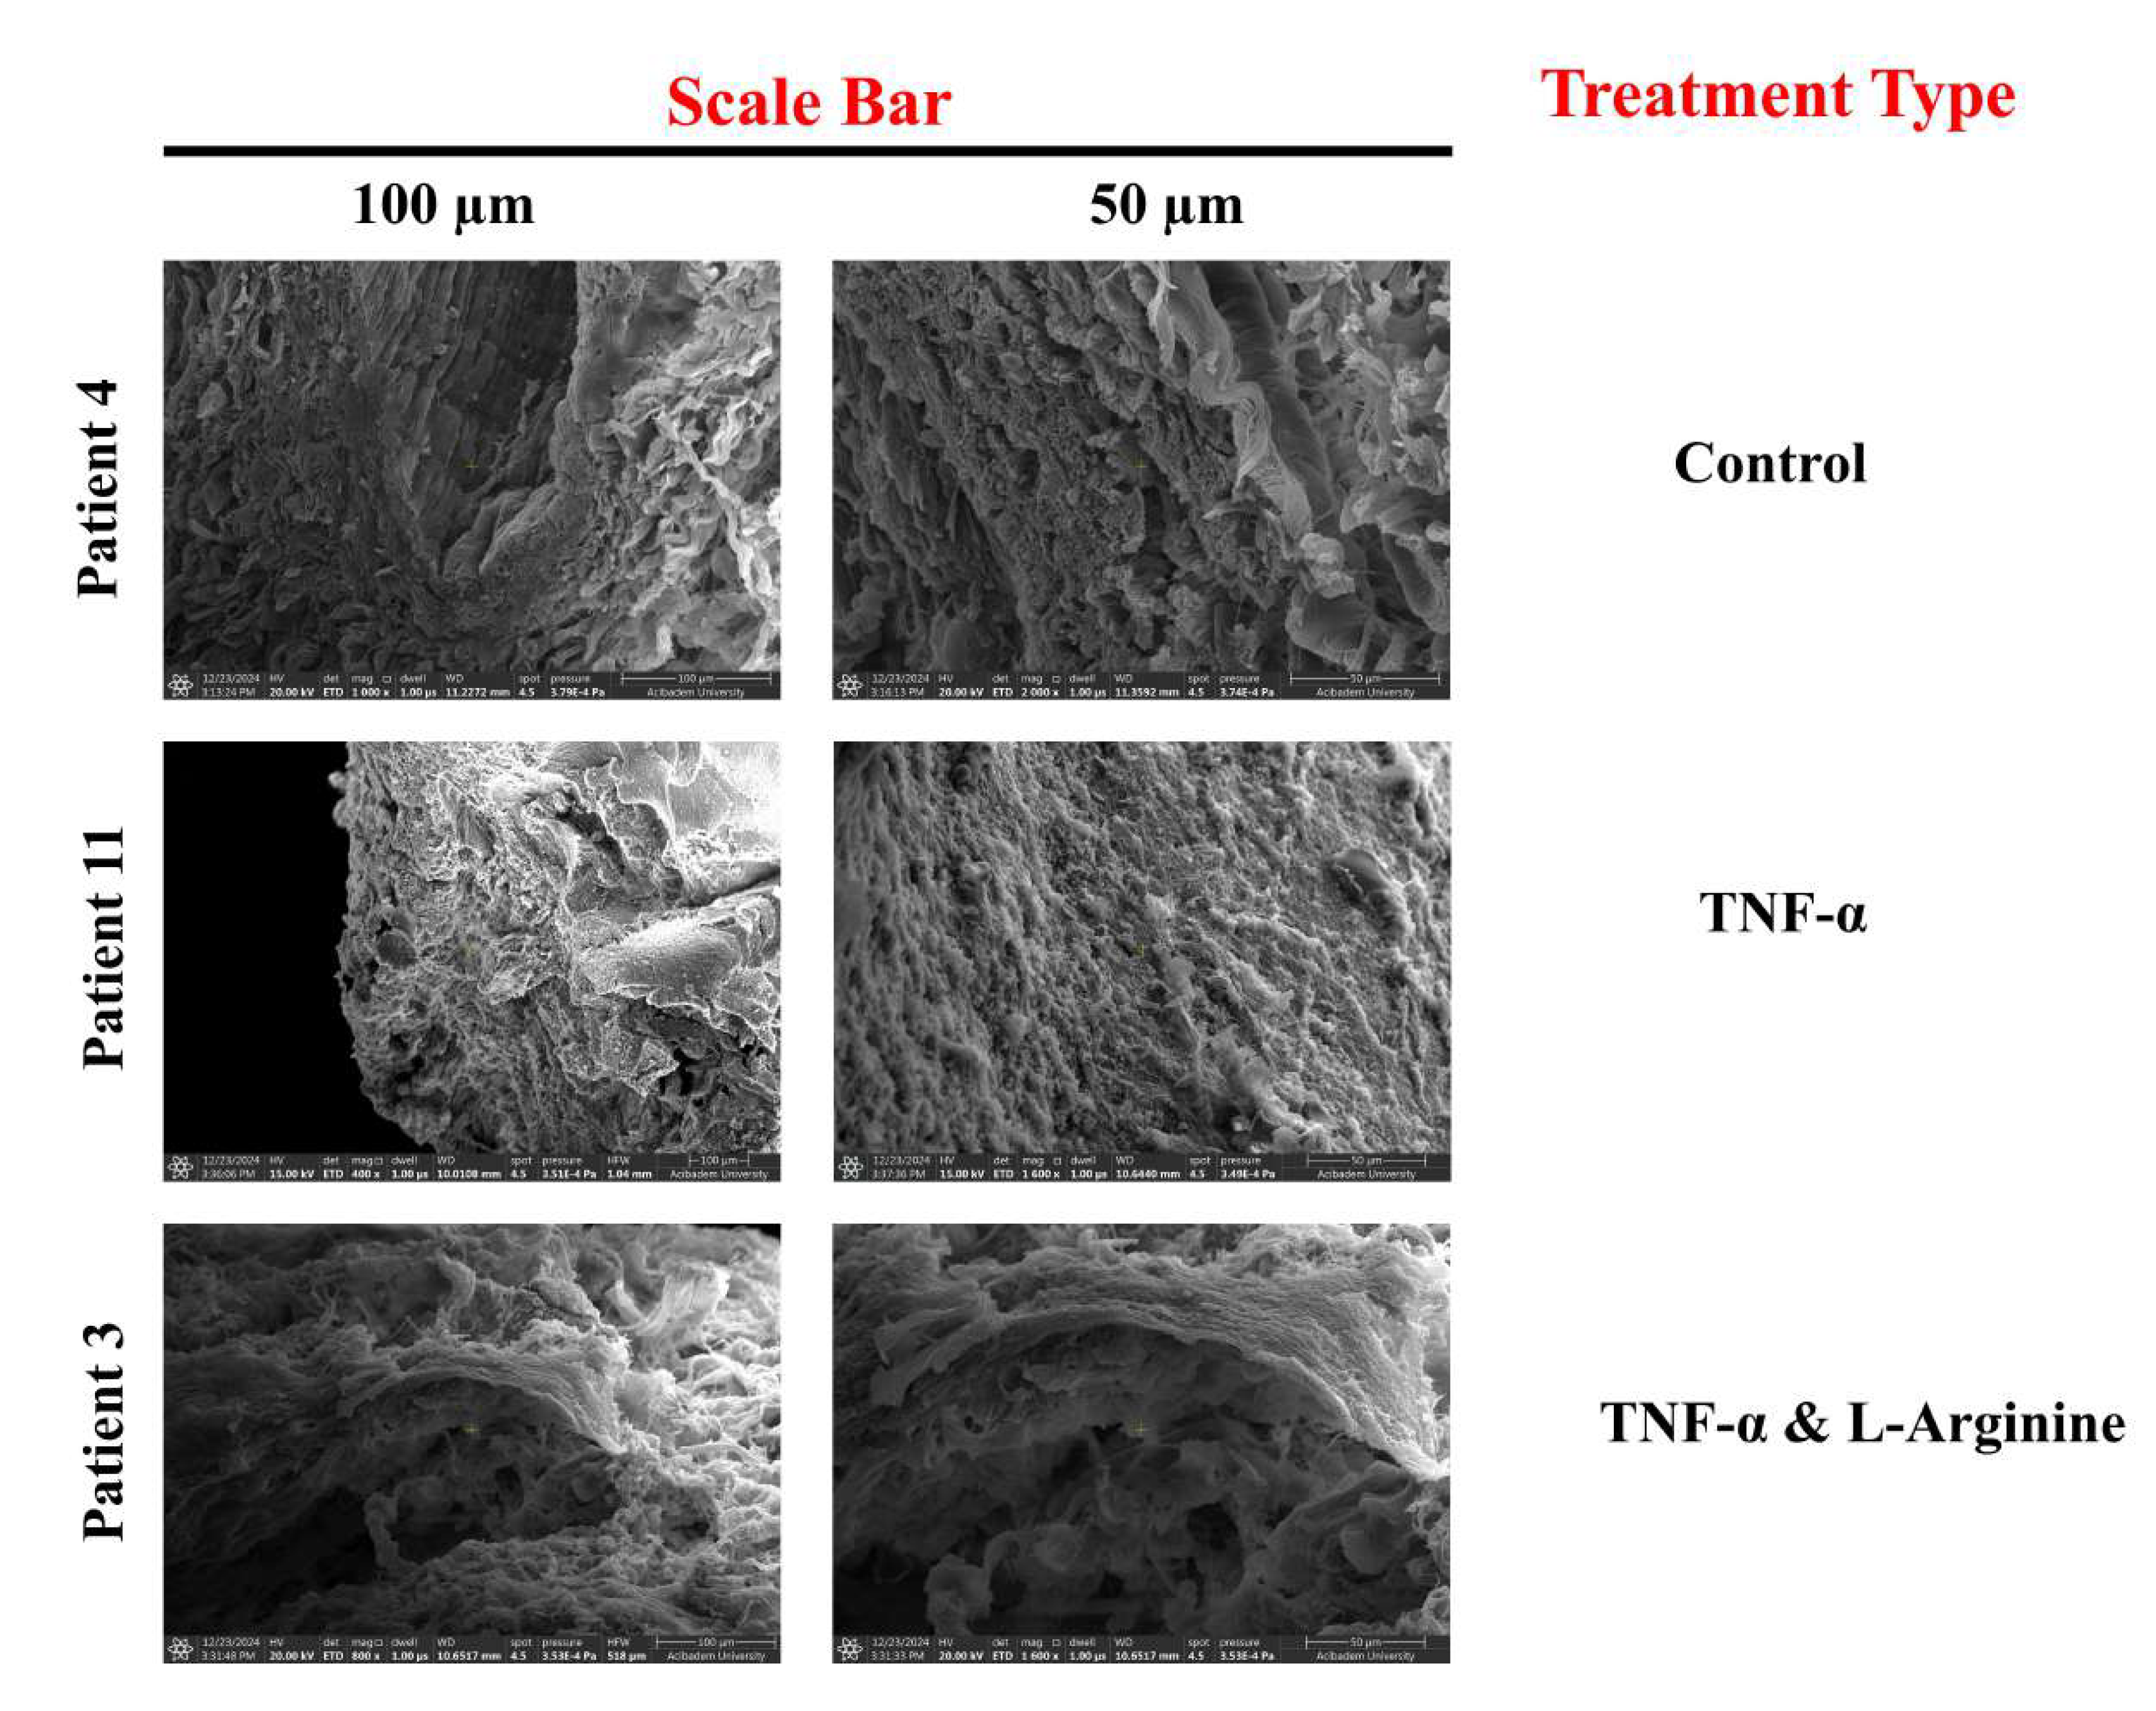
Figure 9.
Atomic percentage (%) of carbon, oxygen, nitrogen, phosphate, and calcium elements of LIMAGs of patients of different ages and treatments. A: Age 50, B: Age 70, Blue: Control, Purple: TNF- treatment, Pink: TNF-& L-Arginine treatment.
Figure 9.
Atomic percentage (%) of carbon, oxygen, nitrogen, phosphate, and calcium elements of LIMAGs of patients of different ages and treatments. A: Age 50, B: Age 70, Blue: Control, Purple: TNF- treatment, Pink: TNF-& L-Arginine treatment.
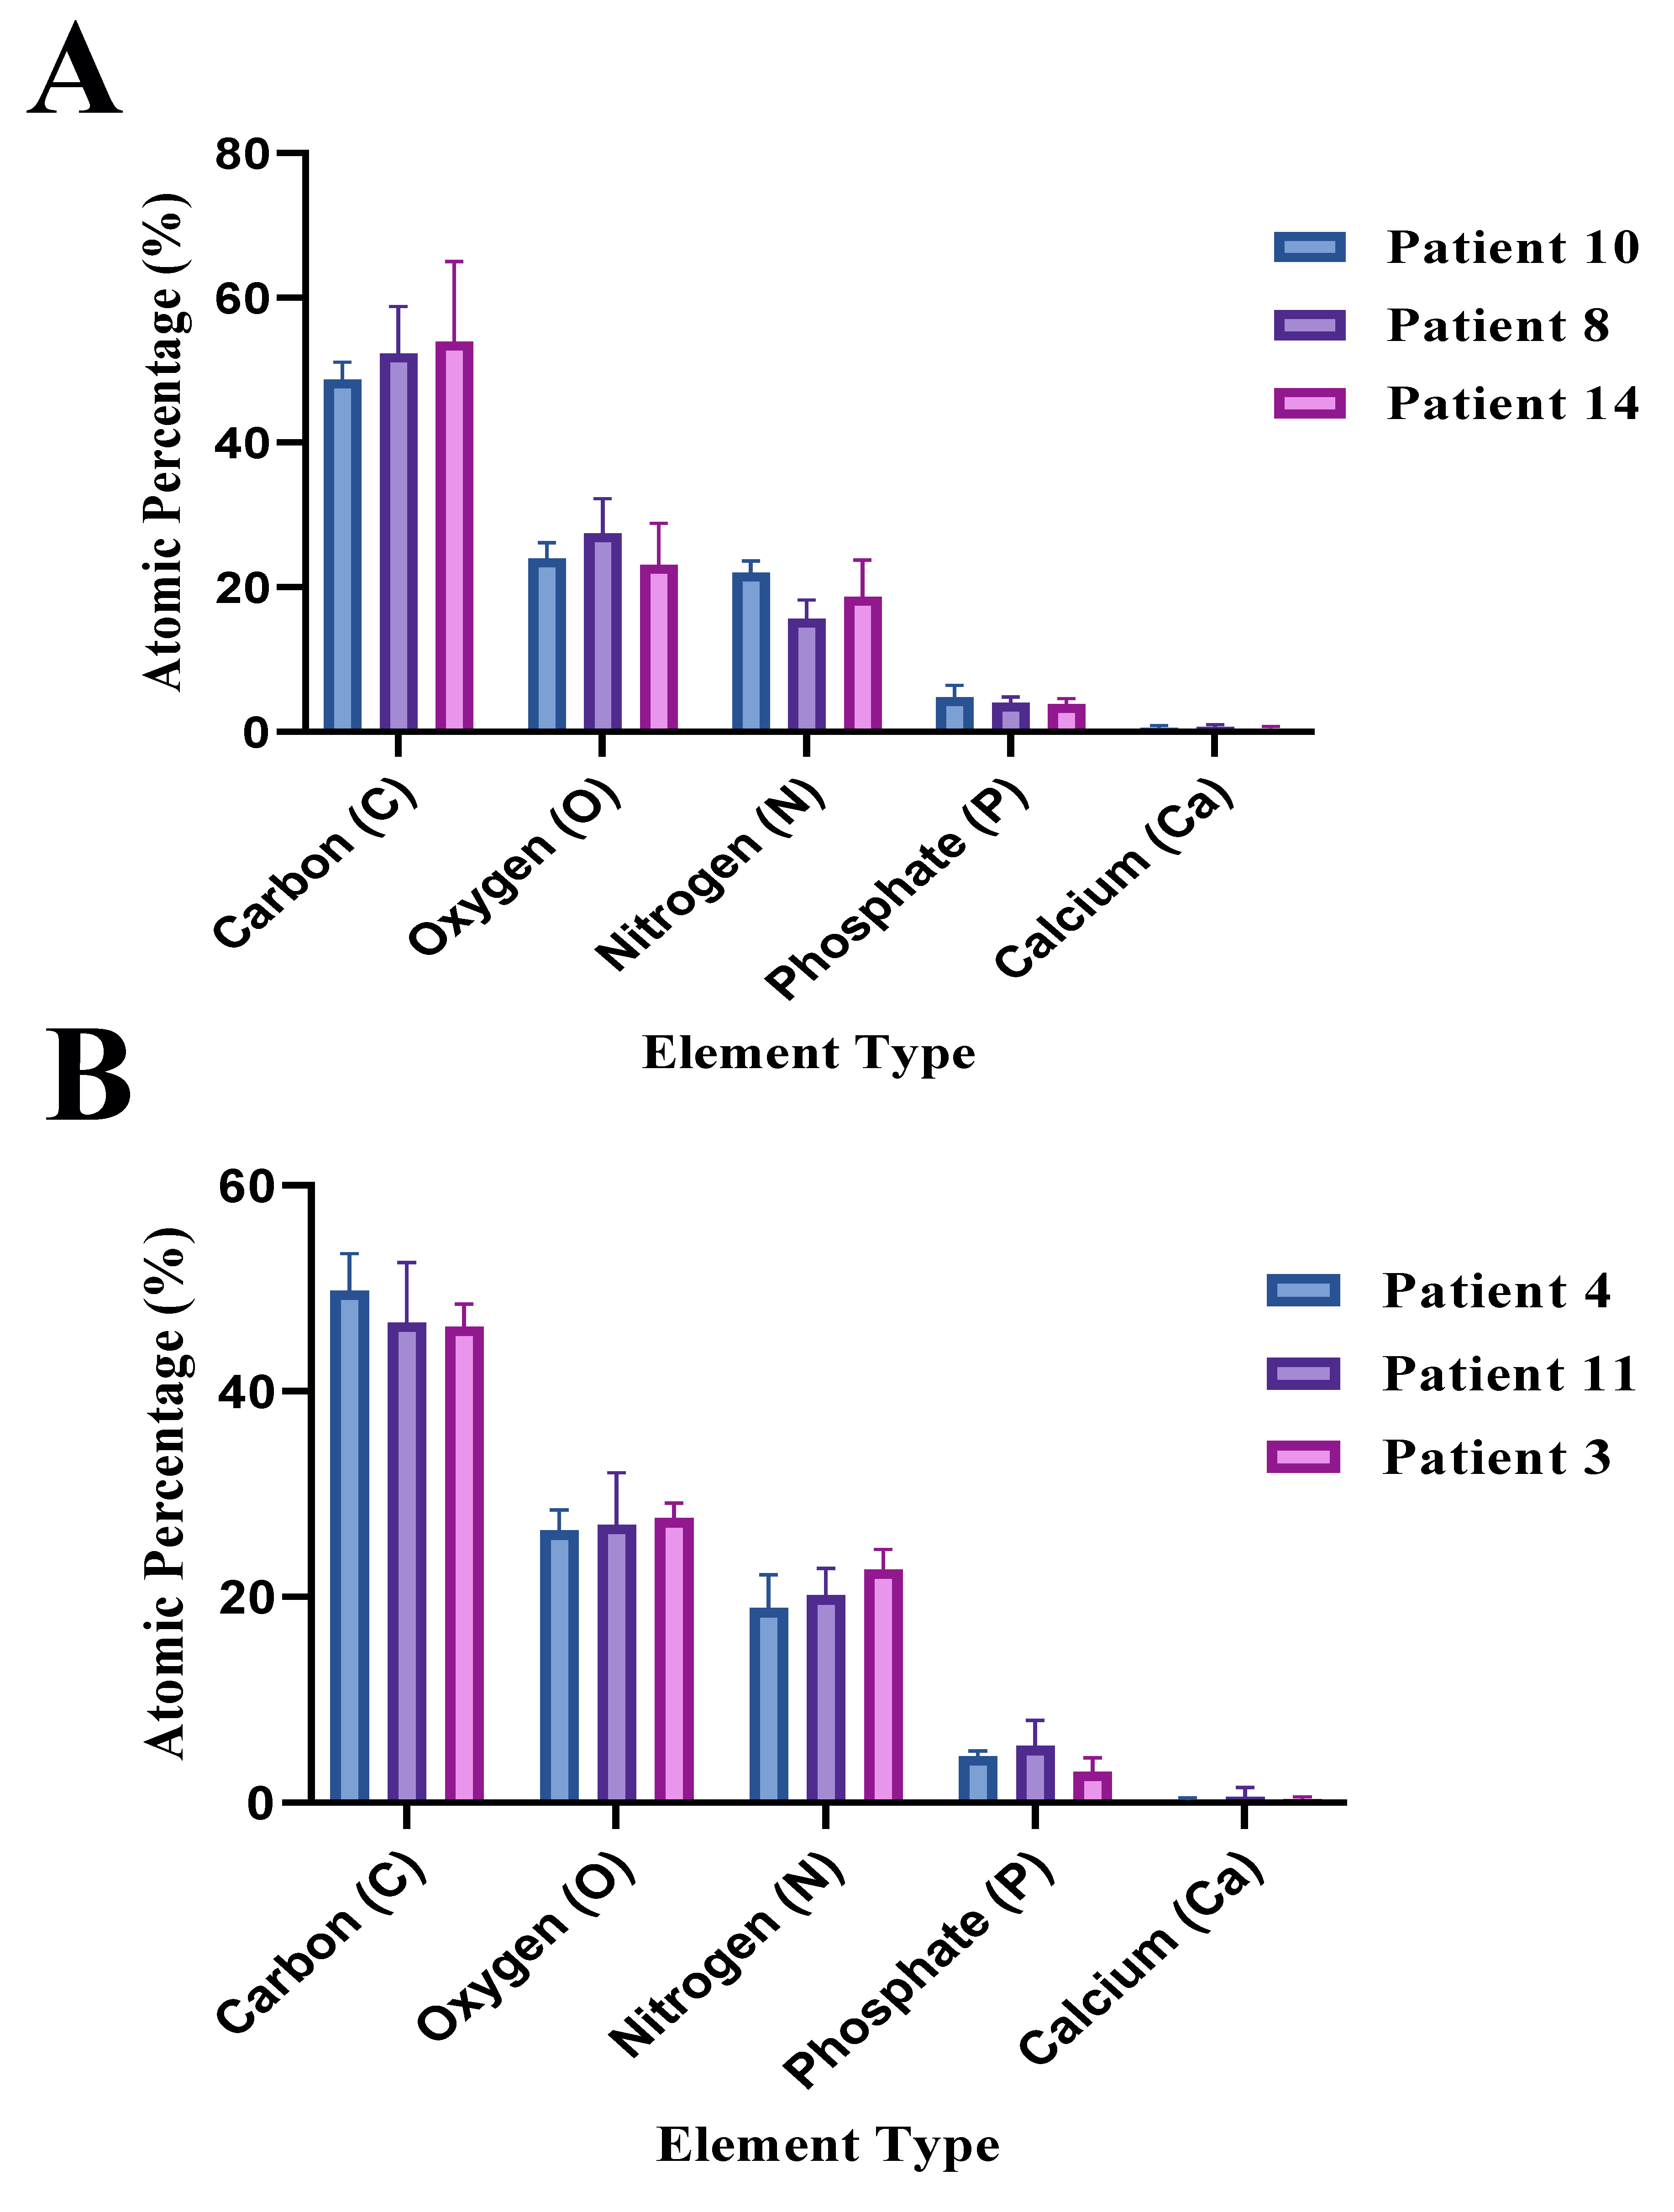
Figure 10.
EDS analysis results of atomic percentage (%) and comparison of different elements of LIMAGs of patients with different treatment type and age. A: Control group, B: TNF- treated group, C: TNF-& L-Arginine treated group, D: P & Ca atomic percentage (%).
Figure 10.
EDS analysis results of atomic percentage (%) and comparison of different elements of LIMAGs of patients with different treatment type and age. A: Control group, B: TNF- treated group, C: TNF-& L-Arginine treated group, D: P & Ca atomic percentage (%).


Table 1.
Patient numbers, ages, tissue treatment type, and labeling group of LIMA Grafts.
| Patient Number | Patient Age | Tissue Treatment |
|---|---|---|
| 1 | 51 | Control |
| 2 | 69 | TNF- |
| 3 | 70 | TNF- & L-Arginine |
| 4 | 72 | Control |
| 5 | 52 | TNF- |
| 6 | 74 | TNF- & L-Arginine |
| 7 | 73 | Control |
| 8 | 54 | TNF- |
| 9 | 70 | TNF- & L-Arginine |
| 10 | 48 | Control |
| 11 | 70 | TNF- |
| 12 | 65 | TNF- & L-Arginine |
| 13 | 58 | TNF- |
| 14 | 52 | TNF- & L-Arginine |
| 15 | 68 | TNF- |
| 16 | 55 | TNF- & L-Arginine |
| 17 | 66 | TNF- |
| 18 | 53 | TNF- & L-Arginine |
Table 2.
Raw data, atomic percentage (%) results of elements of left internal mammary artery grafts (LIMAs) with their uncertainty values obtained by energy dispersive spectroscopy (EDS) analysis.
Table 2.
Raw data, atomic percentage (%) results of elements of left internal mammary artery grafts (LIMAs) with their uncertainty values obtained by energy dispersive spectroscopy (EDS) analysis.
| Patient | Graft | Atomic | Atomic | Atomic | Atomic | Atomic |
| Number | Treatment | % Carbon | % Nitrogen | % Oxygen | % Phosphorus | % Calcium |
| 3 | TNF- & L-Arginine | 46.9 ± 0.107 | 21.4 ± 0.187 | 26.6 ± 0.141 | 4.5 ± 0.037 | 0.6 ± 0.222 |
| 3 | TNF- & L-Arginine | 43.8 ± 0.072 | 24.9 ± 0.120 | 29.3 ± 0.112 | 1.8 ± 0.029 | 0.3 ± 0.188 |
| 3 | TNF- & L-Arginine | 48.1 ± 0.082 | 21.7 ± 0.140 | 27.1 ± 0.120 | 2.8 ± 0.030 | 0.2 ± 0.331 |
| 4 | Control | 50.6 ± 0.089 | 20.9 ± 0.146 | 24.3 ± 0.122 | 4.0 ± 0.029 | 0.2 ± 0.425 |
| 4 | Control | 45.8 ± 0.103 | 20.7 ± 0.175 | 28.3 ± 0.131 | 4.7 ± 0.033 | 0.5 ± 0.347 |
| 4 | Control | 52.9 ± 0.092 | 15.1 ± 0.171 | 26.8 ± 0.118 | 4.9 ± 0.028 | 0.2 ± 0.353 |
| 8 | TNF- | 57.4 ± 0.082 | 12.7 ± 0.193 | 26.3 ± 0.121 | 3.4 ± 0.032 | 0.3 ± 0.344 |
| 8 | TNF- | 54.5 ± 0.101 | 16.6 ± 0.211 | 23.2 ± 0.141 | 4.9 ± 0.039 | 0.7 ± 0.326 |
| 8 | TNF- | 44.9 ± 0.127 | 17.6 ± 0.302 | 32.7 ± 0.170 | 3.8 ± 0.070 | 1.0 ± 0.348 |
| 10 | Control | 51.3 ± 0.089 | 20.1 ± 0.131 | 22.0 ± 0.114 | 6.4 ± 0.025 | 0.3 ± 0.406 |
| 10 | Control | 48.2 ± 0.093 | 22.8 ± 0.157 | 23.4 ± 0.131 | 4.8 ± 0.039 | 0.9 ± 0.307 |
| 10 | Control | 46.7 ± 0.097 | 23.1 ± 0.176 | 26.4 ± 0.139 | 3.2 ± 0.043 | 0.5 ± 0.267 |
| 11 | TNF- | 51.7 ± 0.078 | 20.8 ± 0.112 | 22.6 ± 0.105 | 4.9 ± 0.021 | 0.1 ± 0.677 |
| 11 | TNF- | 40.3 ± 0.157 | 17.3 ± 0.287 | 32.5 ± 0.160 | 8.3 ± 0.049 | 1.6 ± 0.331 |
| 11 | TNF- | 48.1 ± 0.073 | 22.4 ± 0.107 | 26.0 ± 0.102 | 3.4 ± 0.022 | 0.1 ± 0.323 |
| 14 | TNF- & L-Arginine | 66.4 ± 0.076 | 13.8 ± 0.211 | 16.5 ± 0.147 | 3.1 ± 0.026 | 0.2 ± 0.239 |
| 14 | TNF- & L-Arginine | 50.2 ± 0.090 | 18.2 ± 0.145 | 26.5 ± 0.117 | 4.7 ± 0.027 | 0.3 ± 0.252 |
| 14 | TNF- & L-Arginine | 45.3 ± 0.118 | 24.0 ± 0.223 | 26.3 ± 0.173 | 3.6 ± 0.065 | 0.8 ± 0.297 |
Disclaimer/Publisher’s Note: The statements, opinions and data contained in all publications are solely those of the individual author(s) and contributor(s) and not of MDPI and/or the editor(s). MDPI and/or the editor(s) disclaim responsibility for any injury to people or property resulting from any ideas, methods, instructions or products referred to in the content. |
© 2025 by the authors. Licensee MDPI, Basel, Switzerland. This article is an open access article distributed under the terms and conditions of the Creative Commons Attribution (CC BY) license (http://creativecommons.org/licenses/by/4.0/).
Copyright: This open access article is published under a Creative Commons CC BY 4.0 license, which permit the free download, distribution, and reuse, provided that the author and preprint are cited in any reuse.


