Submitted:
06 October 2025
Posted:
10 October 2025
You are already at the latest version
Abstract
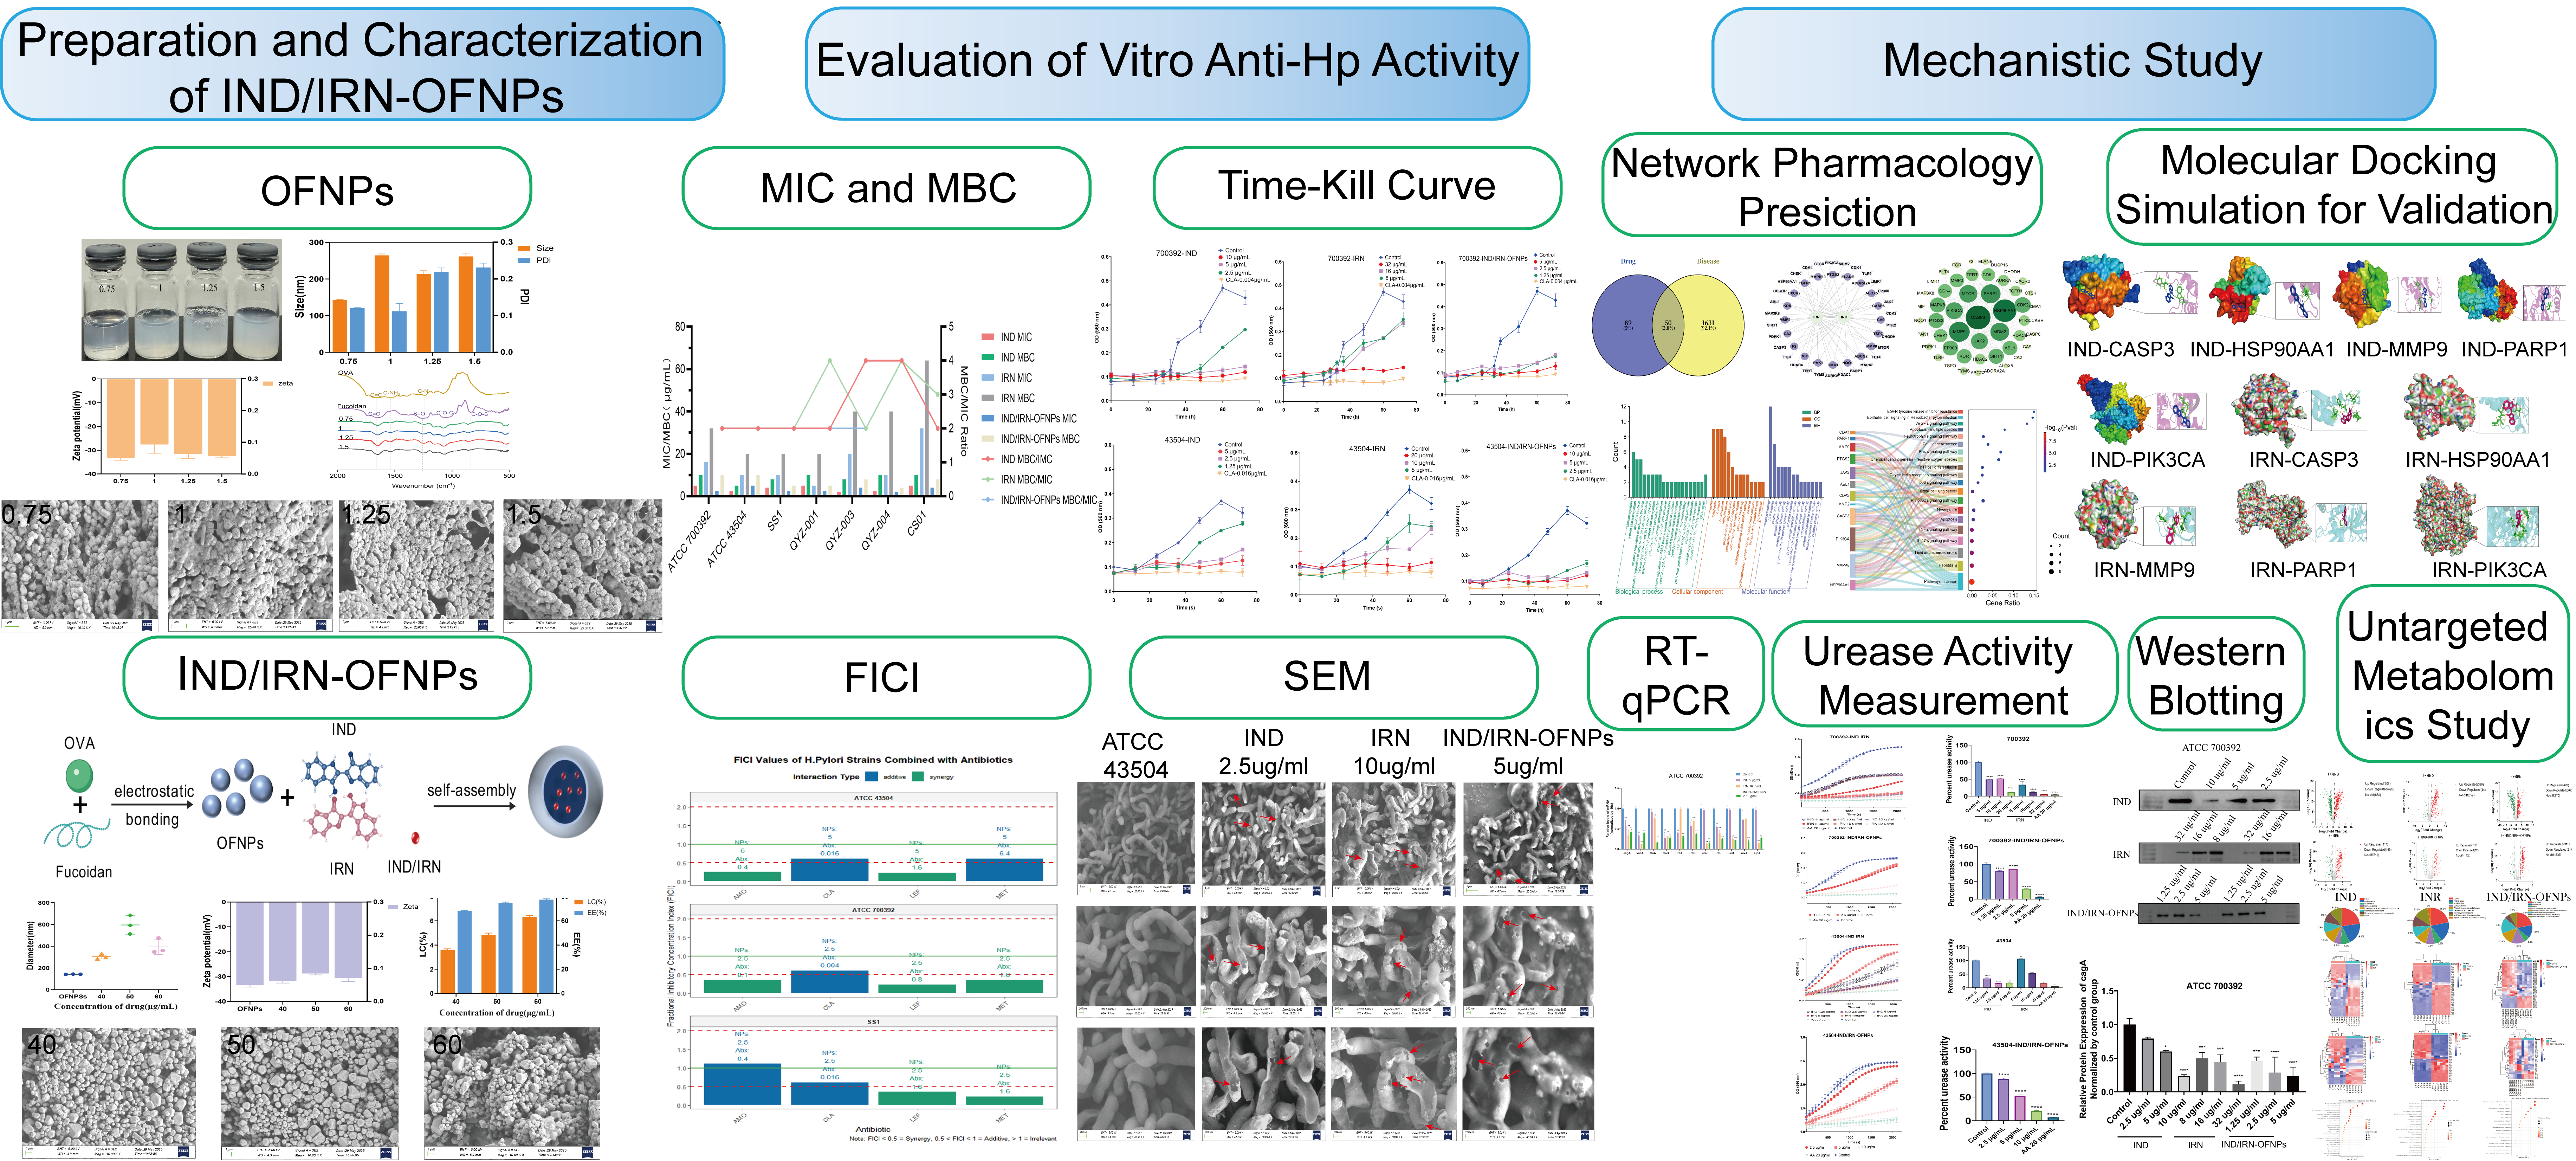
Background and Objective: Indigo and indirubin are the main active components of the traditional Chinese medicine Qingdai, known for their heat-clearing, detoxifying, antibacterial, and anti-inflammatory effects. Indirubin has already been applied clinically with proven safety. Both compounds show potential against drug-resistant Helicobacter pylori infection; however, their strong hydrophobicity limits further application. This study aimed to construct food-grade self-assembled nanoparticles using electrostatic and hydrophobic interactions between ovalbumin and fucoidan to efficiently encapsulate indigo and indirubin, thereby improving their solubility and evaluating the in vitro anti- Helicobacter pylori activity and underlying mechanisms of the three formulations. Methods: Nanoparticles were prepared and characterized. The antibacterial activity was assessed using the broth microdilution and checkerboard methods. The mechanisms were further investigated through network pharmacology, molecular docking, electron microscopy, urease activity assay, RT-qPCR, Western blotting, and untargeted metabolomics analyses. Results: At a carrier concentration of 0.75 mg/mL and a drug loading concentration of 40 μg/mL, the nanoparticles exhibited optimal stability, with an encapsulation efficiency of 68.64% and a loading capacity of 3.66%. Indigo, indirubin, and their nanoparticles showed significant inhibitory and bactericidal effects against both sensitive and drug-resistant Helicobacter pylori strains, with minimum inhibitory concentration ranges of 2.5–5, 5–32, and 2.5–5 μg/mL, respectively. The nanoparticles demonstrated superior efficacy and exhibited synergistic or additive effects when combined with antibiotics. The underlying mechanisms involved disruption of bacterial structures; downregulation of virulence genes related to flagella, adhesion, urease, and VacA; inhibition of urease activity and CagA expression; and interference with key metabolic pathways. Conclusion: Encapsulation of indigo and indirubin by the ovalbumin/fucoidan nanoparticle system significantly enhanced their solubility and anti-Helicobacter pylori activity, providing an experimental basis for developing novel natural therapeutics against Helicobacter pylori infection.
Keywords:
indigo
; indirubin
; Helicobacter pylori
; self-assembled nanoparticles
; network pharmacology
; molecular docking
; metabolomics
; in vitro antibacterial
1. Introduction
Helicobacter pylori (Hp) is a Gram-negative bacterium classified by the World Health Organization as a Group I carcinogen[1], and its infection is closely associated with the development of chronic gastritis, peptic ulcers, and gastric cancer[2]. Approximately 50% of the global population is infected with this bacterium, with infection rates in China ranging from 40% to 60% [3,4], Currently, the first-line clinical treatment for Hp infection is the “proton pump inhibitor + bismuth agent + two antibiotics” quadruple therapy, or the “proton pump inhibitor + two antibiotics” triple therapy [5]. However, in recent years, the drawbacks of antibiotic therapy have become increasingly evident. Due to its single target, it can lead to bacterial resistance, disrupt gut microbiota balance, and reduce patient compliance, ultimately causing decreased eradication rates and even relapse [6]. Studies show that the resistance rate to clarithromycin exceeds 20% [7], and the relapse rate after Hp eradication failure is about 1% to 5%, while the emergence of multidrug-resistant strains further reduces the success rate of subsequent treatments [8]. Therefore, finding non-antibiotic alternatives with multiple targets, pathways, and high activity is of significant clinical importance.
In recent years, with the continuous advancement of research on traditional Chinese medicine (TCM), the development of active monomer components with clear pharmacological activity from TCM has become an important global direction in drug development. The successful development of active monomer compounds from plant medicines, such as artemisinin for malaria treatment, berberine for intestinal infections, triptolide for immune diseases, and anticancer drugs like paclitaxel and vincristine [9], has provided valuable examples for drug development. In this context, indigo (IND) and indirubin (IRN) have considerable development potential and application value.
IND and IRN are primarily derived from Polygonaceae plants such as Isatis tinctoria [10], Brassicaceae plants such as Isatis indigotica [11], and Plumbaginaceae plants such as Plumbago species [12], with the dried roots (Banlangen) and leaves (Daqingye) of Isatis indigotica serving as their main medicinal sources. Its processed product, Qingdai (with IND content ≥5%), has been used as a dye and medicinal material since the Xia Dynasty. According to the 2020 edition of the Chinese Pharmacopoeia (2020 edition), IND is listed as a quality control marker for Qingdai and Daqingye. Traditionally, IND-containing plants have been used for clearing heat and detoxification, antibacterial and anti-inflammatory purposes, anti-infection, and anticancer effects [13,14], and their related compound preparations are widely applied in the treatment of gastric-heat type ulcers, oral mucosal diseases, and various infectious inflammations. They have also shown certain therapeutic effects in improving right ventricular function in patients with acute pulmonary embolism [15]. Modern pharmacological studies have demonstrated that IND possesses anti-inflammatory and antioxidant activities [16], exhibits broad-spectrum antibacterial activity against Staphylococcus aureus and Escherichia coli (MIC: 64–128 µg/mL), and shows antiviral activity against influenza virus and herpes virus [17,18]. Additionally, IND can inhibit cell proliferation and protect against ultraviolet-induced damage [19,20].
As a metabolite of IND, IRN exhibits even broader pharmacological potential. IRN has been approved as a marketed drug for the treatment of chronic myeloid leukemia and has shown efficacy in inflammatory diseases such as liver-stomach heat-type gastritis, psoriasis, and ulcerative colitis [21]. Studies have found that IRN exerts a more potent inhibitory effect on S. aureus (MIC: 8 µg/mL) [22] and can attenuate inflammation in LPS-induced mouse mastitis models by downregulating IL-1β, IL-6, and TNF-α levels and inhibiting the TLR4/NF-κB/MAPKs signaling pathway [23]. Furthermore, IRN and its derivatives have additional activities, including platelet regulation, antiviral effects, and neuroprotection [24,25,26]. Overall, both IND and IRN exhibit favorable clinical safety and broad-spectrum antibacterial potential. However, despite their confirmed activity against infections—particularly bacterial, viral, and inflammatory responses—their direct inhibitory effects on Hp and the associated mechanisms remain poorly understood and have not been systematically investigated.
Recent results from our research group have shown that extracts from different parts of Isatis indigotica (Da Qing Ye, Ban Lan Gen, Qingdai) exhibit strong inhibitory activity against Hp, but whether their core bis-indole components, IND and IRN, are involved in this antibacterial process remains to be systematically studied. It is noteworthy that as isomers (molecular formula C16H10N2O2), the structural-activity differences between them arise from the spatial specificity of their indole ring coupling sites. IND forms a linear coupling structure through the C3-C3’ position, while IRN constructs an angularly deflected structure through the C3-C2’ position. This structural difference may result in significant variations in their target affinity and biological activity. Although the two structures are complementary, whether their combination produces a synergistic antibacterial effect remains unknown.
In this study, we found that the MIC of IND and IRN against the standard strain ATCC 43504 of Hp were 2.5 µg/mL and 10 µg/mL, respectively, significantly better than the natural berberine (MIC: 16 µg/mL). However, their high hydrophobicity severely limits their clinical application potential.
Nanocarriers, due to their ability to penetrate biological membrane barriers, have become an important strategy for the delivery of drugs and functional components. Among these, protein-polysaccharide complex nanodelivery systems show great potential in improving the solubility and bioavailability of hydrophobic molecules, due to their unique physicochemical properties and biocompatibility. This study focuses on employing such composite carriers to encapsulate IND and IRN, with the aim of overcoming their high hydrophobicity and exploring the potential of their combined application in enhancing Hp activity.
Ovalbumin (OVA) was chosen as one of the core carrier materials due to its strong amphiphilicity [27]. OVA can form self-assembled structures with hydrophobic “pockets” through precise spatial amphiphilic distribution [28], efficiently encapsulating hydrophobic drugs and significantly improving their solubility and bioavailability. Numerous studies have confirmed the effectiveness of OVA composite carriers in encapsulating hydrophobic drugs. OVA-oligosaccharide complexes significantly improve the stability, controlled release, and bioavailability of quercetin [29]. OVA-carboxymethyl cellulose sodium achieves more than 90% encapsulation of curcumin and enhances its antioxidant activity [30]. OVA-carvone nanoparticles have an encapsulation rate of 91.86% at pH 9.0 and show antimicrobial activity against both Gram-positive and Gram-negative bacteria [31]. OVA-sodium fucoidan composite nanocarriers encapsulating sennoside and tannic acid form delivery systems that enhance inhibition against Escherichia coli [32].
Fucoidan was selected as another key component due to its excellent carrier properties and significant bioactivities. Clinical studies have shown that the combination of fucoidan with standard quadruple therapy can increase the Hp eradication rate to 76.67% and alleviate antibiotic-associated gut microbiota dysbiosis [33,34]. Mechanistic studies have demonstrated that its Hp effects involve downregulating urease activity, regulating gastric pepsinogen levels, interfering with Hp adhesin alpA function, and reducing the expression of pro-inflammatory factors such as TNF-α and IL-6, thus mitigating gastric inflammatory damage [35]. In addition, fucoidan exhibits a wide range of bioactivities, including antitumor and gut regulatory effects [36]. Previous studies have also reported that OVA and fucoidan can undergo electrostatic and hydrophobic interactions to form self-assembled nanostructures for the delivery of nicotinamide mononucleotide (NMN), significantly enhancing its efficacy [37], suggesting the great potential of this system for co-loading hydrophobic drugs such as IND and IRN. Similarly, chitosan–β-lactoglobulin self-assembled systems have verified the feasibility of co-delivering hydrophilic and hydrophobic compounds, such as egg white peptides and curcumin [38].
Therefore, the present study aims to construct food-grade self-assembled nanoparticles based on the electrostatic and hydrophobic interactions between OVA and fucoidan, to efficiently encapsulate the hydrophobic drugs IND and IRN and thereby improve their solubility. Leveraging the intrinsic anti-Hp, anti-inflammatory, and gut-regulatory activities of fucoidan, this strategy is expected to achieve multi-target synergistic interventions against Hp infection and enhance therapeutic efficacy. The resulting nanoparticles will be subjected to physicochemical characterization, followed by systematic evaluation of the antibacterial activity and synergistic potential of the drug monomers and their nanoformulations against both sensitive and drug-resistant Hp strains using network pharmacology, molecular docking, in vitro assays, and untargeted metabolomics, with a preliminary exploration of the underlying mechanisms. This study is expected to provide an important theoretical foundation for the application of the hydrophobic drugs IND and IRN in Hp treatment. It also offers a potential mechanistic explanation for the high sensitivity and specificity demonstrated by FDA-approved contrast agent IND Carmine in the detection of Hp-related gastritis [39]. Moreover, the nanoparticle-based strategy to enhance drug solubility provides a novel perspective for the structural optimization of indole-based compounds and their potential in the development of anti-Hp therapeutics.
2. Materials and Methods
2.1. Materials
2.1.1. Drugs and Reagents
IND (purity ≥ 98%, CAS: 482-89-3), IRN (purity ≥ 95%, CAS: 479-41-4) were purchased from Shanghai McLean Biochemical Technology Co., Ltd. Fucoidan was purchased from Qingdao Mingyue Hailin Fucoidan Biotechnology Co., Ltd. OVA (biotech grade, CAS: 9006-59-1) was purchased from Shanghai McLean Biochemical Technology Co., Ltd. PBS buffer 1X was purchased from Cytiva, Columbia Blood Agar Base, Brain Heart Infusion Broth (BHI) was purchased from Oxoid, sterile defibrinated sheep blood was purchased from Guangzhou Hongquan Biotechnology Co., Ltd., fetal bovine serum (FBS) was purchased from Inner Mongolia Jinyuankang Biological Engineering Co.,Ltd. Clarithromycin, amoxicillin, levofloxacin, urea, acetohydroxamic acid were purchased from Shanghai MACKLIN, metronidazole, phenol red were purchased from Sigma-Aldrich, electron microscope fixative (2.5% glutaraldehyde) was purchased from Wuhan Servicebio, Tween-20 was purchased from Blotopped USA, anhydrous ethanol, and dimethyl sulfoxide (DMSO) were purchased from Xilong Scientific Co., Ltd., RIPA lysis buffer, 5×SDS-PAGE protein sample buffer, 100mM PMSF, phosphatase inhibitor mixture A, BCA protein concentration assay kit, SDS-PAGE gel preparation kit, BeyoECL Star (high-sensitivity ECL chemiluminescent reagent kit), PVDF membrane were purchased from Biotian Biotechnology Co., Ltd., PureLinkTM RNA Mini Kit was purchased from Thermo USA, PrimeScriptTM RT Master Mix (Perfect Real Time) was purchased from Takara Japan.
2.1.2. Source and Culturing Conditions of Hp
The strains used in this study were provided by Shandong New Era Pharmaceutical Co., Ltd. The standard strains ATCC 700392 and ATCC 43504, as well as clinical strains CS01, SS1, QYZ-001, QYZ-003, QYZ-004 were used. The strains were cultured on Columbia agar base (containing 10% sterile defibrinated sheep blood) at 37 °C in a microaerophilic environment (10% CO2, 5% O2, 85% N2) for 48-72 h. For liquid culture, the strains were inoculated into BHI medium supplemented with 10% or 20% FBS.
2.2. Construction and Analysis of IND/IRN-loaded OFNPs
2.2.1. Preparation of OVA-Fucoidan Nanoparticles
With slight modifications based on a previous study [37], OVA and fucoidan were separately dissolved in PBS (1X, pH 7.4) and a mixed solution of DMSO and PBS (v/v = 1:1) to prepare stock solutions at different concentrations (0.75, 1, 1.25, and 1.5 mg/mL). After magnetic stirring at 800 rpm for 5 h, the solutions were left at 4 °C overnight. The two stock solutions were then mixed at a 1:1 volume ratio and stirred for an additional 2 h. The pH of the mixture was adjusted to 4.0 using 0.1 M HCl. The resulting mixture was heated in a water bath at 90 °C for 5 minutes and then rapidly cooled in an ice bath to room temperature, yielding OVA-Fucoidan Nanoparticles (OFNPs) samples. These nanoparticles could be used directly or lyophilized for further characterization and experimental analysis.
2.2.2. Preparation of IND/IRN-loaded OFNPs
Based on the optimal synergistic ratio determined in Section 3.3.3 of this study, IND and IRN were dissolved in DMSO at a mass ratio of 2:1 to prepare a high-concentration stock solution (4 mg/mL). Under magnetic stirring at 800 rpm, the stock solution was added dropwise to a pre-mixed OVA–fucoidan solution to obtain final IND/IRN concentrations of 40, 50, and 60 µg/mL in the resulting IND/IRN-OFNPs composite solutions. The pH was then adjusted to 4.0 using 0.1 M HCl, followed by heating the mixture in a 90 °C water bath for 5 minutes and rapidly cooling it in an ice bath to room temperature. The resulting IND/IRN-OFNPs nanoparticles were either used directly or lyophilized for subsequent characterization and experimental analysis.
2.2.3. Particle Size Measurement
Samples were characterized using a Zeta PALS potentiometer analyzer. Dynamic light scattering (DLS) technology was employed at a constant temperature of 25 °C, using a 90° scattering angle to perform three independent measurements on OFNPs and IND/IRN-OFNPs (40, 50, 60 µg/mL) with a measurement duration of 2 minutes each. The particle size and polydispersity index (PDI) were obtained. Under the same temperature (25 °C), Zeta potential analysis of OFNPs was conducted using electrophoretic light scattering (ELS) mode with a 90° scattering angle electrode. Each sample was measured three times to ensure data reproducibility.
2.2.4. Drug Loading Capacity and Encapsulation Efficiency Measurement
Nanoparticles were separated by centrifugation [40]: A suspension of IND/IRN-loaded nanoparticles was centrifuged at 12,000 rpm for 10 minutes to separate unencapsulated drugs. The supernatant was collected, and the free IND and IRN content was determined using high-performance liquid chromatography (HPLC). The drug loading capacity (LC) and encapsulation efficiency (EE) were calculated based on the amount of free drug measured. The HPLC conditions were as follows: Column: YMC-AC-ODSA (250mm×4.6mm, 5µm); mobile phase: methanol: water = 7:3; detection wavelength: 600nm; flow rate: 1mL/min. Formulas:
EE (%) = (Total IND/IRN- Free IND/IRN)/OFNPs weight×100%
LC (%) = ((Total IND/IRN- Free IND/IRN)/ Total IND/IRN×100%
2.2.5. FTIR Analysis
Fourier transform infrared spectroscopy (FTIR) was used to analyze the interactions between OVA and fucoidan. The samples were uniformly mixed with potassium bromide (KBr) at a mass ratio of 1:100, and tablets were prepared using the pellet method. The test conditions were as follows: Wavenumber range: 4000–400 cm−1, resolution: 4 cm−1, number of scans: 16, and data saved as transmittance (%).
2.2.6. SEM Analysis
The lyophilized powders of OFNPs and IND/IRN-OFNPs were evenly coated onto glass slides and subjected to gold sputtering. Subsequently, their surface morphology was observed and analyzed using scanning electron microscopy (SEM).
2.3. In Vitro Anti-Hp Activity Evaluation
2.3.1. MIC and MBC
Minimum Inhibitory Concentration (MIC) and Minimum Bactericidal Concentration (MBC) were determined using the broth dilution method. IND and IRN were dissolved in DMSO to prepare high-concentration stock solutions, while OFNPs and IND/IRN-OFNPs were diluted as complete nanocarrier systems in a series of concentrations, starting at 40 µg/mL and following a twofold serial dilution. In 96-well plates, each well received 50 µL of drug-containing medium and 50 µL of bacterial suspension (final concentration 1×10⁶ CFU/mL). Clarithromycin was used as the positive control [41], the drug solvent containing 20% FBS as the negative control, and drug-free bacterial suspension as the growth control. Each treatment was tested in three parallel wells, and the experiment was repeated three times. MIC was defined as the lowest concentration at which no visible bacterial growth was observed. For MBC determination, bacterial suspensions corresponding to 2×, 4×, and 8× MIC were plated on Columbia agar containing 5% sterile defibrinated sheep blood and incubated under microaerophilic conditions at 37 °C for 72 h. MBC was defined as the lowest concentration resulting in a ≥99.9% reduction in colony count compared with the control.
2.3.2. Time-Kill Curve
Hp (ATCC 700392 and ATCC 43504) was inoculated respectively in BHI medium containing 10% FBS, and in the drug solutions containing 2MIC, MIC, 1/2MIC, and clarithromycin. The cultures were placed in a shaking incubator at 37 °C, with microaerophilic conditions, for a total of 72 h. Samples were taken at 0, 12, 24, 36, 48, 60, and 72 h, with 100 µL bacterial suspension drawn at each time point. The optical density at 560 nm (OD560) was measured. Three parallel wells were used for each group, and the experiment was independently repeated three times.
2.3.3. Drug Combination Effect Evaluation
Drug combination susceptibility was evaluated using the checkerboard dilution method to assess the MIC of the physical mixture of IND and IRN against Hp, as well as the combined antibacterial effects of IND/IRN-OFNPs with metronidazole, levofloxacin, amoxicillin, and clarithromycin. The strains tested were ATCC 700392, ATCC 43504, and SS1. Drugs and antibiotics were prepared at 1/2–8× MIC stock solutions and added to 96-well plates at a volume ratio of 1:1:2 (drug: antibiotic: bacterial suspension), with a final bacterial concentration of 1×10⁶ CFU/mL. Plates were incubated under microaerophilic conditions at 37 °C with shaking at 120 rpm for 72 h. The combined antibacterial effect was expressed as the fractional inhibitory concentration index (FICI), calculated as:
FICI=(MIC of Drug 1 (Combination)/ MIC of Drug 1 (Single))+(MIC of Drug 2(or antibiotics)(Combination)/ MIC of Drug 2(or antibiotics)(Single)).
FICI≤0.5: Synergistic effect;0.5 < FICI ≤ 4: Additive effect; FICI>4: Antagonistic effect.
2.3.4. SEM
The morphological effects of IND, IRN, and IND/IRN-OFNPs on Hp ATCC 43504 were examined by SEM. Bacteria were cultured in BHI medium with 10% FBS to 1 McFarland and incubated under microaerophilic conditions at 37 °C for 24 h. Then, 1 mL of the suspension was added to 49 mL of BHI containing the extracts at their MIC (control without drug) and incubated at 37 °C, 120 rpm for 12 h. Bacterial cells were collected by centrifugation (6,000 rpm, 3 min, 4 °C), washed twice with PBS (pH 7.4), and fixed in 2.5% glutaraldehyde at 4 °C overnight. Samples were rinsed with 0.1 M PBS, dehydrated through a graded ethanol series (30–100%), subjected to tert-butanol exchange, critical point dried, sputter-coated with gold, and observed under SEM.
2.4. Network Pharmacology Combined with Molecular Docking and In Vitro Experiments to Validate Mechanisms of Action
2.4.1. Prediction of Targets for IND, IRN, and Hp-Related Diseases
SMILES structures of IND and IRN were obtained from PubChem and imported into Swiss Target Prediction for target prediction. Hp infection–related targets were retrieved from the GeneCards, OMIM, and DisGeNET databases. The intersection of drug and disease targets was identified using Venny 2.1 as the potential key targets for IND and IRN in treating Hpinfection, and a drug–disease common target Venn diagram was generated. Ovalbumin and fucoidan, as macromolecules, were not included in this stage of analysis.
2.4.2. Construction of the Drug-Disease-Target Network
A drug–disease–target network was constructed using Cytoscape 3.7.0, with nodes representing IND, IRN, and potential Hp infection targets, and edges indicating interactions between the drugs and targets.
2.4.3. PPI Network Construction
The predicted targets of IND and IRN for Hp infection were imported into STRING (species: Homo sapiens) to obtain PPI data, which were exported as TSV files. The files were imported into Cytoscape 3.7.0 to construct the protein-protein interaction (PPI) network, with node size and color adjusted based on degree to visually represent interactions among targets.
2.4.4. GO Functional Analysis and KEGG Pathway Enrichment Analysis
Core targets were subjected to GO enrichment analysis—including biological process (BP), cellular component (CC), and molecular function (MF)—as well as KEGG pathway analysis using DAVID, and the results were visualized on a bioinformatics platform.
2.4.5. Target-BP/KEGG Network
Based on 12 core genes and their top 10 significantly enriched GO BP terms and KEGG pathways, a Sankey diagram was constructed to visualize the gene–function module–pathway relationships, revealing the potential molecular mechanisms of IND and IRN in treating Hp infection.
2.4.6. Molecular Docking Simulation for Validation
The top five targets ranked by degree in the PPI network were selected for molecular docking. High-resolution crystal structures of these targets were downloaded from RCSB PDB, and the 2D structures of IND and IRN were obtained and converted to PDB format, followed by energy minimization. Molecular docking was performed using AutoDockTools 1.5.7 after protein preparation, and the docking results were visualized with PyMOL 2.5.
2.5. RT-qPCR
The effects of IND, IRN, and IND/IRN-OFNPs on the expression of Hp virulence factors were evaluated according to previously described methods [42]. As outlined in Section 2.3.4, ATCC 700392 strains were treated with control, IND, IRN, or IND/IRN-OFNPs, followed by centrifugation to collect bacterial cells. Total RNA was extracted using the PureLink® RNA Mini Kit, and RNA concentration and purity were determined with a NanoDrop™ spectrophotometer (A260/A280 ≥ 1.8). cDNA was synthesized by reverse transcription using the PrimeScript™ RT reagent kit, and quantitative real-time PCR was performed on the Applied Biosystems 7500 system, with four technical replicates per sample. Relative expression levels of target genes were calculated using the 2^-ΔΔCt method with 16S as the internal reference. Primer design was referenced from [43], and the sequences are listed in Table 1.
2.6. Urease Activity Measurement
Urease activity was measured as previously described [44]. Hp strains ATCC 700392 and ATCC 43504 were adjusted to 1 McFarland, mixed 1:1 with various concentrations of IND, IRN, or IND/IRN-OFNPs, and cultured in 6-well plates with growth and acetohydroxamic acid positive controls. After 24 h incubation at 37 °C under microaerobic conditions, bacterial cells were collected, washed twice with PBS, and resuspended to an OD600 ≥ 0.3. Then, 50 μL of bacterial suspension was mixed with an equal volume of reagent A (25 mM PBS, pH 6.8, 0.2% Tween-20), and 25 μL of this mixture was added to 150 μL of indicator B (25 mM PBS, pH 6.8, 250 μM phenol red), incubated at 37 °C for 5 min, followed by addition of 75 μL 0.5 M urea to initiate the reaction. Absorbance at 560 nm was recorded every 72 s for 30 cycles. Urease activity was expressed as a percentage relative to the control. Each group included ≥3 technical replicates, and the experiment was repeated three times.
2.7. Effect on CagA Protein Expression (Western Blotting)
Hp ATCC 700392 was treated with various concentrations of IND, IRN, or IND/IRN-OFNPs for 12 h. Bacteria were collected, washed twice with PBS, and lysed on ice for 30 min in pre-chilled RIPA buffer containing 1 mM phosphatase inhibitor and 1% protease inhibitor. Lysates were centrifuged at 12,000 rpm for 15 min at 4 °C, and supernatants collected. Protein concentrations were determined by BCA assay and equal amounts loaded for SDS-PAGE. Proteins were transferred to PVDF membranes, blocked with 5% skim milk for 2 h at room temperature, incubated with primary antibody overnight at 4 °C, washed with TBST, and incubated with secondary antibody for 2 h at room temperature. Signals were detected using ECL and CagA relative expression quantified by ImageJ.
2.8. Untargeted Metabolomics Study
2.8.1. Metabolite Preparation
Following the protocol described in Section 2.3.4, Hp ATCC 700392 was treated with IND, IRN, IND/IRN-OFNPs, or vehicle control for 12 h. Bacterial cells were collected, washed twice with PBS, and quenched with PBS and ice-cold methanol (-80 °C) for 30 min. After centrifugation, the pellet was resuspended in 53% methanol-water and lysed by sonication (35% amplitude, 2 s on/3 s off, 10 min). Lysates were centrifuged at 12,000 rpm for 3 min at 4 °C, and the supernatant collected for LC-MS non-targeted metabolomic analysis.
2.8.2. LC-MS Metabolomics Analysis
LC-MS analysis was performed using a Hypesil Gold C18 column (100 × 2.1 mm, 1.9 µm) at 40 °C with a flow rate of 0.2 mL/min. In positive mode, mobile phases were 0.1% formic acid in water (A) and methanol (B); in negative mode, 5 mM ammonium acetate (pH 9.0, A) and methanol (B), with gradient programs shown in Table 2. MS was operated with an ESI source, m/z 100–1500, spray voltage 3.5 kV, sheath gas 35 L/min, auxiliary gas 10 L/min, capillary temperature 320 °C, S-lens RF 60 V, and auxiliary gas heater 350 °C. Data-dependent acquisition was performed in both modes, including full MS and triggered MS/MS scans.
2.8.3. Metabolomics Data Processing
Raw MS data were processed using Compound Discoverer 3.1 for peak extraction, retention time alignment, and quantification. Metabolites were preliminarily identified via mzCloud, mzVault, and Masslist, and annotated using HMDB, METLIN, and LipidMaps. The quality control (QC) samples were analyzed to ensure method reliability. Principal component analysis (PCA) and orthogonal partial least squares discriminant analysis (OPLS-DA) were performed. Variable importance projection (VIP) values and fold changes (FC) were calculated, and OPLS-DA models were validated using sevenfold cross-validation and 200 permutation tests. Differential metabolites were defined as |log2FC| ≥1, p <0.05, and VIP >1, and significantly altered metabolites were subjected to KEGG pathway enrichment analysis, with p <0.05 considered significantly enriched.
2.9. Data Statistics and Analysis
All data were analyzed using GraphPad Prism 8.0 and are presented as mean ± standard deviation (x̄ ± SD), with each experiment performed in triplicate (n = 3). Group comparisons were conducted using one-way ANOVA, followed by Dunnett’s post hoc test if variance homogeneity was satisfied. P < 0.05 was considered statistically significant, with significance indicated by *.
3. Results
3.1. Preparation and Characterization of OFNPs
OFNPs were successfully prepared based on electrostatic and hydrophobic interactions between OVA and fucoidan (Figure 1A). At pH 4.0 and a 1:1 mass ratio, all tested concentrations (0.75-1.5 mg/mL) formed homogeneous dispersions (Figure 1B), with particle sizes ranging from 140 to 260 nm, PDI 0.119–0.240, and negative Zeta potentials (Figure 1D, E); PDI increased significantly with concentration. The 0.75 mg/mL group showed optimal characteristics, with a particle size of 142.6 ± 1.2 nm, PDI 0.120 ± 0.001, and Zeta potential of -33.4 ± 0.8 mV, indicating good stability (|Zeta|≥30 mV) [45]. FTIR analysis revealed a shift and broadening of the OVA amide I band (1656-1648 cm−1) and decreased tyrosine signals, while the fucoidan S=O stretching intensity decreased and a shoulder appeared at 1200 cm−1; the C=O (1664 cm−1) and C-O-C (1074 cm−1) peaks were retained (Figure 1C), indicating molecular interactions between OVA and fucoidan. SEM images showed that the dried OFNPs were spherical, with the 0.75 mg/mL group exhibiting the most uniform size distribution (Figure 1F); therefore, this concentration was selected as the optimized condition for subsequent drug-loading experiments.
3.2. Preparation and Characterization of IND/IRN-OFNPs
SEM images showed that IND/IRN-OFNPs were typically spherical, with particle size increasing as the drug loading increased, and aggregation observed at higher loading concentrations (Figure 2A-C). DLS analysis indicated that at a fixed carrier concentration (0.75 mg/mL), the 40 µg/mL group had a uniform particle size of 298.6 nm, whereas the 50–60 µg/mL groups exhibited larger particle sizes (513.4-682.3 nm) with broader distributions (Figure 2D). Zeta potential measurements showed the highest absolute value in the 40 µg/mL group (-31.67 ± 0.97 mV), suggesting optimal colloidal stability (Figure 2E). Encapsulation efficiency (EE) and loading content (LC) increased with drug concentration, with EE rising from 68.64% to 78.07% and LC from 3.66% to 6.25% (Figure 2F). Further pharmacological evaluation revealed MICs against Hp ATCC 43504 of 2.5 µg/mL for the 40 µg/mL group (DMSO content < 2%) and 5 µg/mL for the 60 µg/mL group. Considering both physicochemical properties and biological activity, 40 µg/mL was selected as the optimized drug-loading concentration for subsequent experiments.
3.3. In Vitro Anti-Hp Activity Evaluation Results
3.3.1. MIC and MBC
As shown in Figure 3 and Table 3, IND, IRN, and IND/IRN-OFNPs exhibited significant in vitro antibacterial activity against all seven tested Hp strains, including two standard strains (ATCC 700392, ATCC 43504) and five clinical multidrug-resistant strains. The MIC of IND ranged from 2-5 µg/mL, with the highest sensitivity observed for the multidrug-resistant strain QYZ-003 (2 µg/mL); IRN MIC ranged from 5-32 µg/mL, with QYZ-001 being most sensitive (5 µg/mL). The MIC of IND/IRN-OFNPs were significantly reduced to 2-5 µg/mL, and their activity against clinical multidrug-resistant strains was higher than that against standard strains, suggesting greater therapeutic potential for treating Hp infections. Notably, the MICs of IND/IRN-OFNPs were equal to or lower than those of the IRN group across all strains, and lower than IND alone in six strains. The MIC of the blank carrier OFNPs was greater than 375 µg/mL, indicating negligible antibacterial activity; therefore, no further experimental evaluation was conducted for OFNPs. These results demonstrate that the overall antibacterial efficacy of IND/IRN-OFNPs is markedly superior to that of the individual drugs, suggesting that nanoencapsulation not only enhances drug activity but also confers greater inhibitory effects when IND and IRN are used in combination. Moreover, after 72 h of treatment, all groups showed MBC/MIC ratios ≤4, confirming bactericidal activity.
3.3.2. Time-Kill Curves
Time-kill curve analysis showed that IND, IRN, and IND/IRN-OFNPs inhibited the growth of Hp ATCC 700392 and ATCC 43504 in a dose-dependent manner at 1/2 MIC, MIC, and 2 MIC, with inhibitory effects varying by drug and strain. Specifically, IND at 1.25 µg/mL (1/2 MIC) inhibited the relatively less sensitive ATCC 43504(Figure 4D), while 2.5 µg/mL produced significant inhibition of ATCC 700392(Figure 4A); IRN exhibited effective inhibition at concentrations ≥5 µg/mL for both strains(Figure 4B、E). Notably, IND/IRN-OFNPs consistently yielded lower OD values than the control throughout the incubation period, with stronger inhibition at corresponding time points(Figure 4C、F). At 1.25 µg/mL, the inhibitory effect on ATCC 700392 was comparable to that of the positive control, clarithromycin, further indicating a synergistic antibacterial effect of the IND and IRN combination.
3.3.3. Drug Combination Effect Evaluation
Checkerboard microdilution assays showed that the physical combination of IND and IRN exhibited synergistic or additive effects against Hp (Table 4). Similarly, IND/IRN-OFNPs combined with all tested antibiotics also demonstrated synergistic or additive effects (Figure 5). Specifically, IND and IRN showed synergy against the ATCC 700392 strain (FICI = 0.375), which was therefore adopted as the drug ratio for OFNPs encapsulation, whereas additive effects were observed for ATCC 43504 and SS1. Further analysis revealed that the MICs of the IND and IRN physical combination were 3.25, 5.31, and 5.50 µg/mL, respectively, lower than those of the single-drug groups but still higher than those of the IND/IRN-OFNPs group; the MIC of the blank carrier was extremely high and could be disregarded. These findings indicate that nanoencapsulation markedly enhanced the antibacterial activity of IND and IRN and further confirmed the synergistic inhibitory effect of their combination. In combinations of IND/IRN-OFNPs with antibiotics, synergy predominated, with FICI values ranging from 0.25 to 0.375, and the lowest FICI (0.25) observed with LEF. Notably, the MICs in the combination groups were significantly lower than those in the single-antibiotic groups, particularly when combined with MET and LEF, where the MICs were reduced to half of the single-drug values. Detailed FICI and MIC values are provided in Table 5.
3.3.4. SEM
SEM results (Figure 6A-L) showed that in the control group, Hp maintained its typical helical and short rod shape, with a smooth and intact surface, with no significant structural damage. However, after treatment with IND (2.5 µg/mL), IRN (10 µg/mL), and IND/IRN-OFNPs (5 µg/mL), the bacterial cells exhibited significant structural damage features, including surface shrinkage, rupture, and localized membrane collapse, along with noticeable cytoplasmic leakage.
3.4. Network Pharmacology Combined with Experimental Validation of Mechanisms of Action
3.4.1. Prediction of Potential Targets for IND, IRN, and Hp
By integrating drug and disease databases, 139 targets of IND and IRN and 1,682 Hp-related targets were identified, with 50 overlapping targets representing potential therapeutic targets against Hp (Figure 7).
3.4.2. Analysis of Drug-Disease-Target Network
The constructed “drug–disease–target” network comprised 52 nodes (IND and IRN each representing 1 node, and 50 potential targets) and 70 edges (Figure 8). Among them, 20 dark purple nodes were identified as hub nodes, with IND and IRN fully connected to these hubs. Additionally, IND extended to 13 non-hub targets and IRN to 17 non-hub targets, suggesting that both drugs may exert anti-Hp effects through multi-target synergistic regulation.
3.4.3. PPI Network Analysis and Core Target Screening
In the PPI network, nodes represent proteins and edges represent interactions between them, with node Degree reflecting the number of connections and functional centrality. The network comprised 50 nodes and 328 edges (Figure 9), with an average Degree of 13.12. Using Degree >13.12 as the threshold, 12 hub nodes were identified, including CASP3, HSP90AA1, PARP1, PIK3CA, MMP9 and others (Table 6), which are considered key targets through which IND and IRN exert anti-Hp effects.
3.4.4. GO Functional Analysis and KEGG Pathway Enrichment Analysis
GO enrichment analysis (Figure 10A) showed that the 12 hub targets were enriched in the cytosol, nucleus, and mitochondria at the CC level; primarily involved in ATP binding, protein phosphatase binding, protein binding, and protein kinase activity at the MF level; and associated with reactive oxygen species response, negative regulation of apoptosis, inflammation regulation, DNA damage repair, and TNF response at the BP level. KEGG analysis (Figure 10B) indicated that these hub targets were significantly enriched in Hp infection-related pathways, cancer-related pathways, TNF, IL-17, PI3K-Akt, and apoptosis signaling pathways, with the cancer-related pathway containing the most targets (10), followed by TNF and IL-17 pathways (5 targets each).
3.4.5. Target-BP/KEGG Network Construction
Theoretically, target genes involved in both key BP and KEGG pathways are more likely to exert central regulatory roles during treatment. Integration of BP and KEGG pathways via a Sankey diagram showed that all 12 core genes were involved in all pathways (Figure 11). Ranked by the number of connected pathways, the core genes were: MAPK8 (11), CASP3 (9), PIK3CA (8), JAK2 (8), MMP9 (6), CDK1 (6), CDK2 (6), ABL1 (6), PTGS2 (5), HSP90AA1 (4), PARP1 (3), and MMP2 (3). Notably, MAPK8 covered over 50% of key functional modules, indicating its hub role in the IND/IRN therapeutic system.
3.4.6. Molecular Docking Simulation Validation
Docking results (Table 7) showed that the top five core targets (CASP3, HSP90AA1, PARP1, PIK3CA, and MMP9) exhibited binding energies (ΔG) ≤ −5.0 kcal/mol with IND and IRN, indicating feasible binding activity [46]. Among them, IND showed the strongest binding with PARP1 and MMP9 (ΔG = −6.99 kcal/mol), mainly mediated by MMP9 residues PRO-246, GLY-186, and TYR-248; IRN exhibited the lowest binding energy with PARP1 (ΔG = −7.46 kcal/mol), primarily via interaction with PARP1 residue GLY-863. Visualization (Figure 12A, B) confirmed that both compounds could stably occupy the active sites of the target proteins.
3.5. Inhibition of Hp Virulence Gene Expression
RT-qPCR results (Figure 13) revealed that IND, IRN, and their IND/IRN-OFNPs significantly inhibited the transcription levels of key virulence genes in Hp strain ATCC 700392 after 12 h of treatment at MIC concentrations. Specifically, IND (5 µg/mL) and IRN (10 µg/mL) significantly suppressed the expression of key virulence genes, including CagA, VacA, flagella gene flaB, and urease-related genes ureA, ureH. Moreover, the two single agents exhibited different inhibitory effects on the same virulence factors. Notably, IND/IRN-OFNPs exhibited stronger inhibition of most virulence factors, not only affecting a broader range of genes but also significantly reducing the expression of the flagellar gene flaA and urease-related genes ureA, ureB, ureH, ureI, and nixA compared with single-drug treatments. Even at a lower concentration (2.5 µg/mL), the combination outperformed higher doses of the individual drugs. This suggests that the combination of IND and IRN may synergistically enhance the suppression of Hp virulence factor expression.
3.6. Urease Activity Inhibition
The results showed that, within the concentration range of 1/2 MIC to 2 MIC, all treatment groups significantly inhibited the growth of ATCC 700392 and ATCC 43504, with partial concentration-dependent effects and sustained inhibition over time. For ATCC 700392, low concentrations of IND (5 µg/mL) and IRN (8 µg/mL, 1/2 MIC) already suppressed over 50% of bacterial growth, with IRN showing a clear dose-dependent effect (Figure 14B); the positive control acetohydroxamic acid (AA, 40 µg/mL) strongly inhibited both strains, while IRN at 2 MIC (32 µg/mL) exhibited comparable efficacy to AA. IND/IRN-OFNPs markedly reduced bacterial viability even at ultra-low concentrations (1.25 µg/mL) (Figure 14D), highlighting its high-efficiency inhibition at low doses. For the resistant strain ATCC 43504, IND showed stronger antibacterial activity than IRN (Figure 14F), and the combination further decreased urease activity and increased inhibition rates at the same concentration (Figure 14H). These results were consistent with the downregulation of urease gene transcription, suggesting that IND and IRN synergistically and differentially inhibit urease expression and activity. Moreover, as shown in Figure 14A, C, E, G, the slopes of the growth curves in all treatment groups were lower than the control and became progressively flatter with increasing concentrations, indicating that urease inhibition was sustained over time rather than transient.
3.7. Inhibition of CagA Protein Expression
This study assessed the effects of drug treatments on the key virulence factor CagA using Western blot. The same control sample was used for the IND, IRN, and IND/IRN-OFNPs groups, with normalization performed under identical control conditions despite being run on separate gels. Compared with the control, treatment with IND, IRN, or IND/IRN-OFNPs for 12 h significantly downregulated CagA expression in a dose-dependent manner (Figure 15A). Notably, IND/IRN-OFNPs exhibited markedly stronger inhibition than either single drug, achieving over 50% suppression at 1.25 µg/mL, further confirming a synergistic effect between IND and IRN (Figure 15 B). The original, unprocessed images are available in the Supplementary Materials (Supplementary Rawlmages.zip).
3.8. Untargeted Metabolomics Analysis
3.8.1. Methodological Validation
The total ion chromatogram (TIC) profiles (Figure 16A, B) showed stable peak shapes and retention times, indicating good system performance. In both positive and negative ion modes, QC sample correlations were ≥0.96 (Figure 16C), and over 90% of metabolites had RSDs <30% (Figure 16D), confirming acceptable reproducibility and precision.
3.8.2. Establishment and Validation of Multivariate Statistical Models
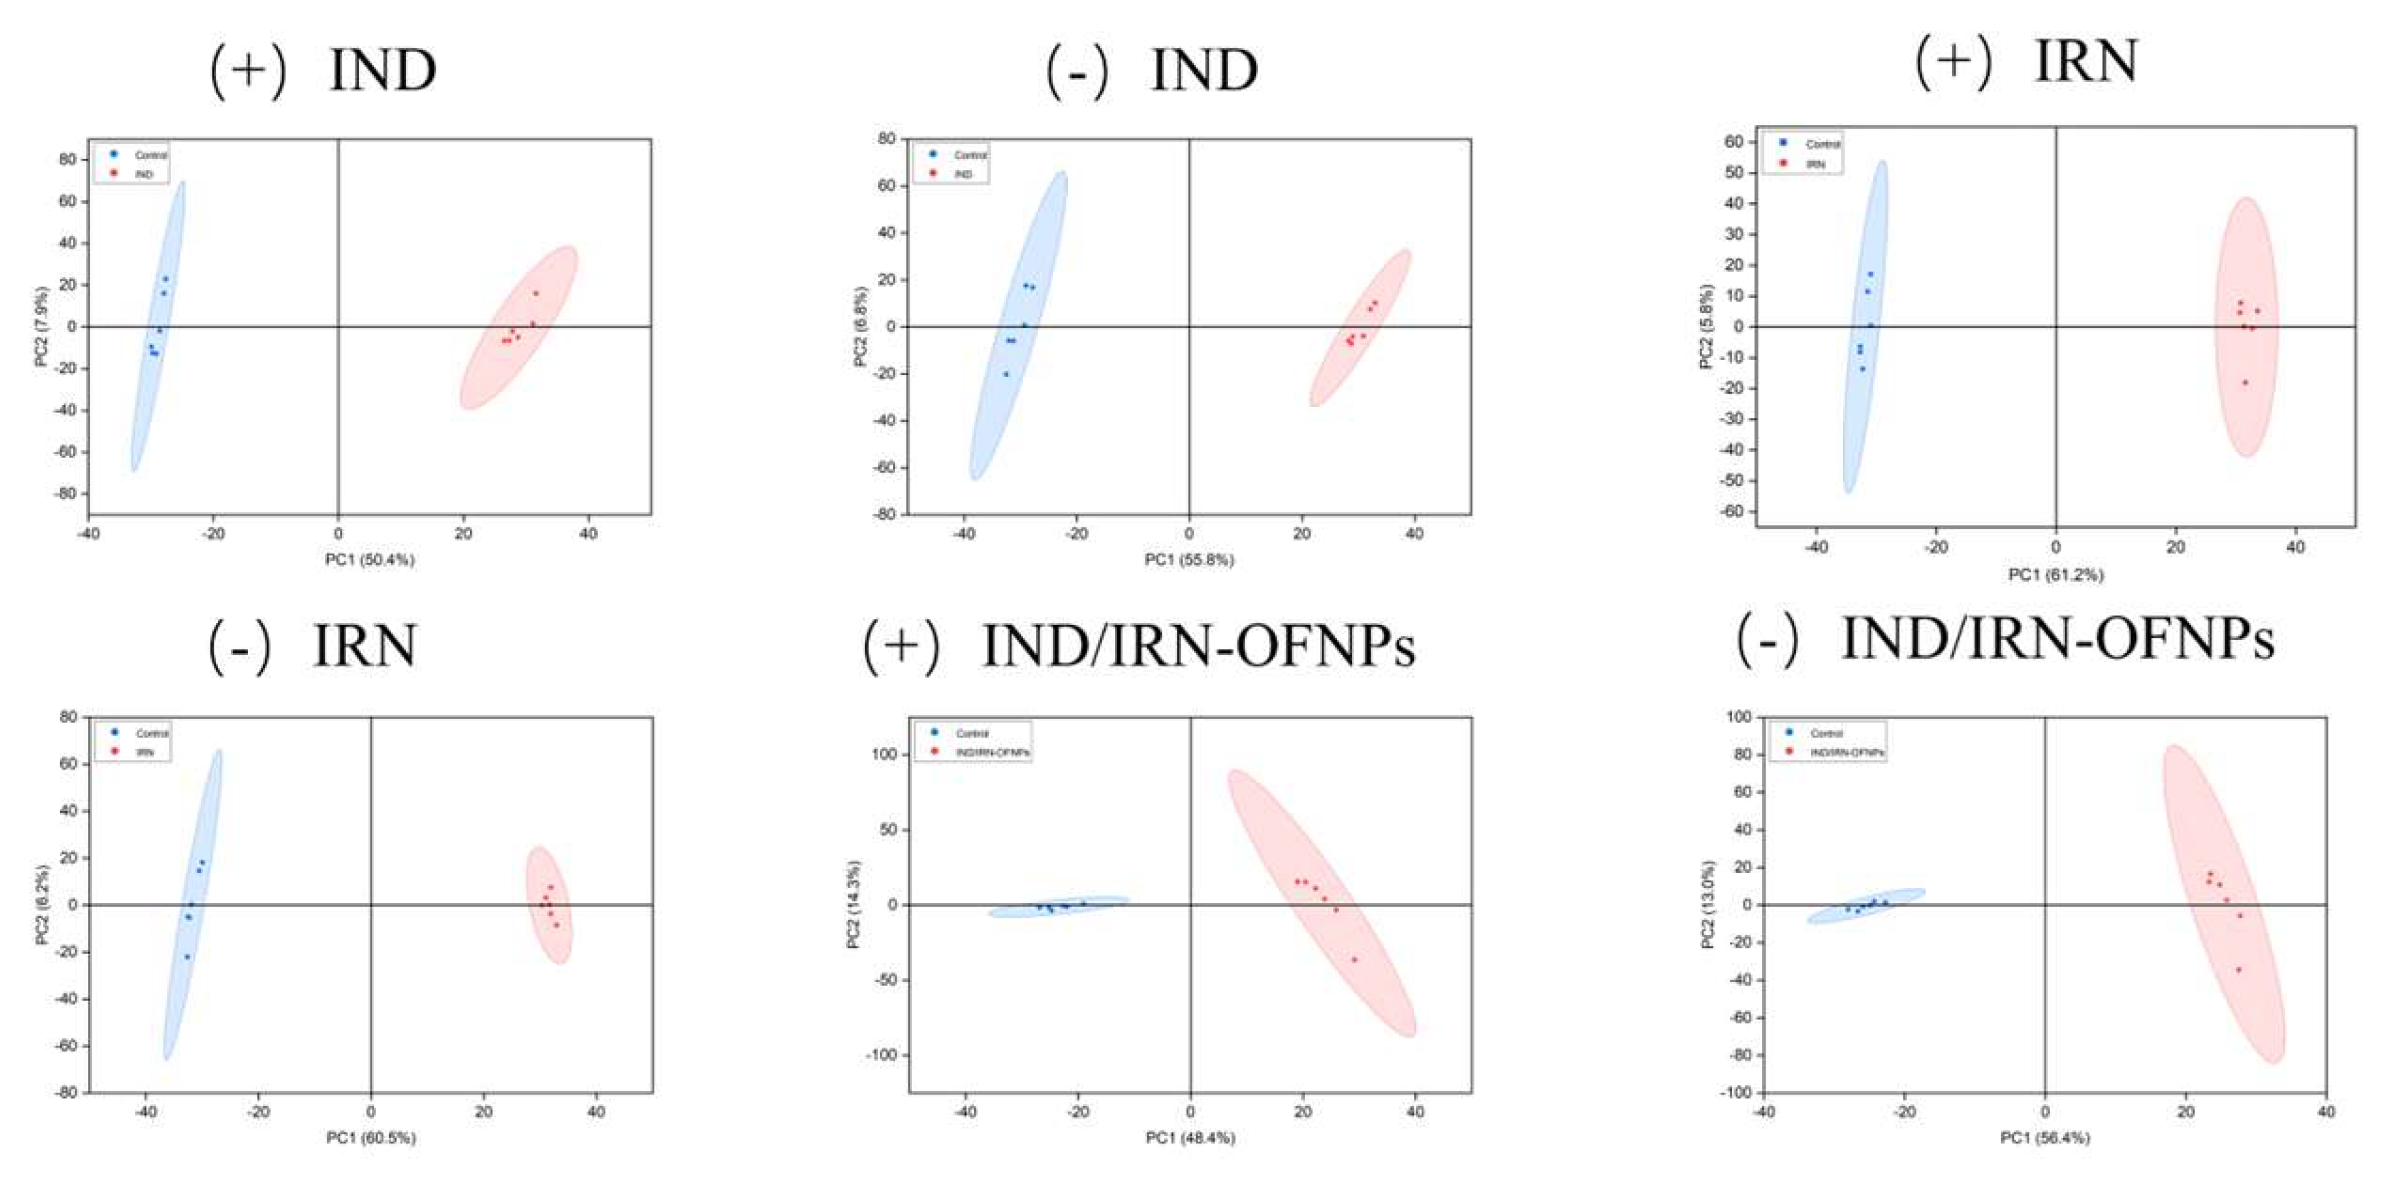
PCA revealed clear separation between drug-treated (IND, IRN, IND/IRN-OFNPs) and control groups along PC1/PC2 (Figure 5E), indicating significant metabolic alterations in HP.
Figure 17.
PCA score plot of IND, IRN, and IND/IRN-OFNPs groups, with blue representing the control group and red representing the treatment group. Symbols “+” and “−” indicate positive and negative ion modes, respectively.
Figure 17.
PCA score plot of IND, IRN, and IND/IRN-OFNPs groups, with blue representing the control group and red representing the treatment group. Symbols “+” and “−” indicate positive and negative ion modes, respectively.
OPLS-DA further confirmed distinct clustering (Figure 18A), with cross-validation yielding R2Y and Q2 (p1) >0.9(Figure 18B), supporting model reliability. Permutation tests (n=200) showed stable results (positive mode: –0.333 to –0.513; negative mode: –0.383 to –0.648; R2 = 0.415–0.892), excluding overfitting (Figure 18C).
3.8.3. Screening and Functional Analysis of Differential Metabolites
Volcano plots demonstrated that drug treatments induced bidirectional regulation of Hp metabolites under both positive and negative ion modes (Figure 19), indicating extensive perturbation of the metabolic network.
Using |log2FC| ≥1, p<0.05, and VIP>1 as thresholds, 104 and 51 differential metabolites were identified in the IND group, with lipids being the most enriched (22.95%)(Figure 20A). The IRN group yielded 180 differential metabolites, predominantly lipids (20.22%) and amino acids (18.06%)(Figure 20B), whereas the IND/IRN-OFNPs group identified 101 differential metabolites, with amino acids accounting for the largest proportion (22.22%) (Figure 20C). These findings suggest that perturbations in amino acid and lipid metabolism represent key targets of the drug interventions. The detailed information on differential metabolites is provided in the Supplementary Materials(see Supplementary Table S1-S6).
Correlation analysis revealed subsets of metabolites with significant positive or negative correlations (Figure 21), reflecting either consistent or opposing regulatory patterns and highlighting coordinated disruptions of metabolic pathways.
This network-level feature was further validated by clustering heatmaps (Figure 22), where the distribution of the top 30 metabolites clearly distinguished treatment groups. For instance, M264(D-Tryptophan)and M238(Bicinchoninic acid)were markedly upregulated in the IND/IRN-OFNPs group, whereas M310(S-[(2E,6E)-farnesyl]-L-cysteine methyl ester)and M341(Beta-Phenylethyl propionamide)were highly expressed in the control group(Figure 22E), indicating that drug treatments substantially reshaped the overall metabolic profile of Hp.
Importantly, several differential metabolites were shared among treatment groups, but their expression trends varied. For example, M38(HAD), M119((1R_2S)-1-Hydroxypropane-1_2_3-tricarboxylate), and M140(3-methoxy-1,4,8-trihydroxy-5-(1’,3’,4’-trihydroxybutan-2-yl) xanthone)exhibited higher expression in the IND/IRN-OFNPs group than in the IND group, whereas M216 was more abundant in the IND group (Figure 23A); similar trends were observed in the comparison between the IRN and IND/IRN-OFNPs groups (Figure 23B). Likewise, M24(4-(4-chlorophenoxy)-3,5-dimethyl-1H-pyrazole) and M109(D-Gluconic acid) displayed distinct expression patterns between the IND and IRN groups. Collectively, these findings indicate that IND, IRN, and their nanoformulation exert distinct and non-overlapping effects on metabolic regulation.
KEGG enrichment analysis of differential metabolites integrated from positive and negative ion modes revealed significant metabolic perturbations in all three treatment groups, with distinct metabolic features. The IND group was enriched in 26 pathways(Figure 24A), primarily involving phenylalanine/tyrosine/tryptophan biosynthesis, arginine biosynthesis, phenylalanine metabolism, pyruvate metabolism, glyoxylate and dicarboxylate metabolism, and riboflavin metabolism. Key metabolites, including L-phenylalanine (M214, log2FC=4.7), L-glutamic (M368, log2FC=4.8), and L-arginine (M219, log2FC=6), were significantly upregulated, whereas flavin mononucleotide (FMN, M69, log2FC=-3.7) and DL-malic acid (M72, log2FC=-7.6) were significantly downregulated. The IRN group was enriched in 21 pathways(Figure 24B), including arginine biosynthesis, butanoate metabolism, histidine metabolism, arginine/proline metabolism, phenylalanine/tyrosine/tryptophan biosynthesis, and nitrogen metabolism, with L-phenylalanine (M214, log2FC=-4.3), L-arginine (M219, log2FC=-7.3), and L-glutamic (M368, log2FC=-4.7) significantly downregulated, while 2-(5-Methyl-2H-[1,2,4]triazol-3-ylsulfanyl)-ethylamine (M158, log2FC=1.8) and butyric acid (M69, log2FC=1.3) were upregulated. The IND/IRN-OFNPs group was enriched in 12 pathways(Figure 24C), mainly involving phenylalanine/tyrosine/tryptophan biosynthesis, phosphate metabolism, and phenylalanine metabolism, with significant upregulation of L-phenylalanine (M99, log2FC=1.5), D-phenylalanine (M483, log2FC=1.7), and [(6-Oxo-1,6-dihydro-9H-purin-9-yl) methyl] phosphonic acid (M55, log2FC=1.8).
Further integration of commonly enriched pathways and analysis of representative metabolites revealed that boxplots more clearly illustrated differential trends across treatment groups(Figure 25). For example, L-phenylalanine(Figure 25A) levels were higher in the IND/IRN-OFNPs group than in the IRN group, suggesting a stronger inhibitory effect of IRN; conversely, L-lysine(Figure 25B) levels were higher in the IRN group, indicating a more pronounced suppression by IND/IRN-OFNPs. The differential expression patterns of key metabolites within these pathways not only further confirmed the non-equivalence of IND, IRN, and combination treatments but also revealed the distinct modulation of the core metabolic network of Helicobacter pylori by each treatment.
4. Discussion
Hp infection is a common chronic bacterial infection worldwide, associated with gastritis, peptic ulcers, and gastric cancer [47]. Although proton pump inhibitor-based antibiotic therapy remains the first-line treatment [48], antibiotic resistance significantly reduces its efficacy. Screening TCM active monomers with multi-target effects and low resistance potential represents a promising strategy. IND and IRN are bis-indole TCM monomers with heat-clearing, detoxifying, anti-inflammatory, and antibacterial properties, and good safety profiles, but their hydrophobicity limits bioavailability. To improve solubility, this study encapsulated IND and IRN in OVA/fucoidan self-assembled nanoparticles, enhancing drug loading and stability through electrostatic, hydrophobic, and hydrogen-bond interactions, while leveraging the intrinsic antibacterial activity of the carriers.
OFNPs form at pH 4.0, below the isoelectric point of OVA (pI ≈ 4.5), rendering OVA positively charged. It self-assembles with negatively charged fucoidan through electrostatic and hydrophobic interactions, ultimately forming stable nanoparticles. Experiments showed that at a total concentration of 0.75 mg/mL, OFNPs exhibited optimal dispersibility, with a particle size of 142.6 ± 1.2 nm, PDI of 0.120 ± 0.001, and a Zeta potential of -33.4 ± 0.8 mV. Increasing the concentration elevated collision frequency, promoting fucoidan aggregation on the OVA surface, resulting in larger particle sizes and broader distribution. [49]. FTIR analysis showed that the amide I band shifted from 1656 cm−1 to 1648 cm−1 and broadened, indicating hydrogen bond formation between OVA and fucoidan [50] possibly accompanied by partial α-helix to β-sheet transition in the secondary structure [51]. The weakening of the tyrosine peak suggested exposure of hydrophobic groups, enhancing hydrophobic interactions. The decrease in the S=O peak intensity and the appearance of a shoulder peak indicated electrostatic interactions between fucoidan sulfate groups and positively charged OVA residues. Additionally, the retention of C=O and C–O–C characteristic peaks, along with amide I/II band shifts, further confirmed multiple molecular interactions during complex formation. These interactions increased the rigidity of the protein secondary structure and suppressed molecular motion via hydrogen bonding, enhancing nanoparticle stability. Drug loading experiments revealed that increasing IND/IRN concentrations led to larger particle sizes, broader distributions, and reduced absolute Zeta potential, indicating a higher tendency for aggregation, consistent with SEM observations. At a loading concentration of 40 µg/mL, the particles exhibited optimal stability, with EE (68.64%) and LC (3.66%) at desirable levels, along with the strongest antibacterial activity. Notably, IND and IRN are normally soluble only in 100% DMSO, whereas the nanosystem developed in this study achieved effective encapsulation and loading under 50% DMSO, significantly improving their solubility. Overall, a preparation concentration of 0.75 mg/mL combined with a drug loading of 40 µg/mL provided the optimal balance of particle stability, uniformity, and anti-HP activity, offering ideal conditions for subsequent drug delivery.
In vitro anti-Hp results showed that IND, IRN, and IND/IRN-OFNPs (without removal of free drugs) exhibited significant inhibitory and bactericidal effects against both standard and clinically resistant strains. The blank carrier OFNPs had an MIC >375 µg/mL, indicating negligible antibacterial activity. Among the single drugs, IND had an MIC of 2-5 µg/mL, and IRN had an MIC of 5-32 µg/mL; in contrast, the MIC of IND/IRN-OFNPs was 2-5 µg/mL, lower than that of most single drugs, with stronger inhibitory effects against clinical strains, indicating that nanoencapsulation of the combined drugs markedly enhances antibacterial activity and holds greater potential for treating clinical Hp infections. Time-kill assays further demonstrated that IND/IRN-OFNPs at 1.25 µg/mL could inhibit the growth of ATCC 700392, with dose-dependent effects clearly superior to single drugs, reflecting both the high antibacterial efficiency at low concentrations and providing dynamic evidence of the synergistic effect of IND and IRN. After 72 h of treatment, all drug groups exhibited MBC/MIC ≤4, indicating not only growth inhibition but also complete eradication of Hp, confirming the efficacy and potential clinical value of IND, IRN, and the nano-drug delivery system in anti-Hp therapy.
Considering the issue of clinical antibiotic resistance, this study employed the checkerboard dilution method to systematically evaluate the combined effects of IND/IRN-OFNPs with four commonly used antibiotics, while also assessing the intrinsic synergistic effect of IND and IRN. The results showed that IND/IRN-OFNPs generally exhibited synergistic interactions with the antibiotics, and when combined with MET or LEF, the MIC values decreased to half of those observed with single-drug use, demonstrating inhibitory effects that exceeded simple additive outcomes. This indicates that the regimen not only has potential for dose optimization but may also reduce antibiotic-related side effects and lower the risk of resistance in clinical settings. The antibacterial effect of the physical combination of IND and IRN was superior to that of the individual drugs, exhibiting synergistic or additive effects, while the blank carrier showed no significant activity. Nanoencapsulation further enhanced the antibacterial efficacy of IND/IRN-OFNPs, confirming that nanoencapsulation can significantly improve the combined synergistic antibacterial effect of the two drugs.
Both single compounds and crude extracts from traditional Chinese medicine exhibit multi-target and multi-pathway regulatory characteristics. In this study, a combination of network pharmacology and experimental validation was used to preliminarily elucidate the anti-Hp mechanisms of IND and IRN. Integration of drug and disease databases identified 50 shared potential targets for IND/IRN. The constructed “drug–disease–target” network revealed that the two compounds form a complementary, multidimensional network through core and specific targets, reflecting systematic and synergistic regulatory features.
Molecular functions in biological systems typically rely on the coordinated action of proteins, mediated through dynamic PPI networks [52]. In this study, network topology analysis identified 12 core targets, with the top five by degree-CASP3, HSP90AA1, PARP1, PIK3CA, and MMP9-potentially playing key roles in the anti-Hp activity of IND and IRN.CASP3 (Caspase-3), a member of the cysteine-aspartic protease family, is a key executor of apoptosis, inducing DNA fragmentation and cell disassembly by cleaving PARP1 and cytoskeletal proteins [53,54]. During Hp infection, CASP3 can be activated via the death receptor-mediated pathway through Caspase-8 [55,56] or the mitochondrial pathway involving cytochrome c release and Apaf-1/Caspase-9 complex activation [57,58]. Moderate activation helps eliminate infected cells, whereas excessive apoptosis may compromise the mucosal barrier, promoting chronic inflammation and precancerous lesions. [59]. Heat shock protein 90 alpha family member 1 (HSP90AA1) is a highly conserved chaperone protein that plays an important role in cell cycle regulation, gene modification, DNA damage response, and the development of various human cancers [60]. The Hp virulence factor CagA relies on HSP90AA1 for stability and promotes host inflammatory responses. Inhibiting HSP90AA1 can reduce the activity of Hp virulence proteins and reshape the host immune response [61]. PARP1 (Poly ADP-ribose polymerase 1) is involved in DNA damage repair, and it regulates inflammation and cell death [62]. Recent studies have found that PARP1 activates the AMPKα pathway to extend lifespan [63]. In Hp infection, excessive PARP1 activation may promote the release of the inflammatory factor NF-κB, exacerbating gastric mucosal damage [64]. PIK3CA (Phosphoinositide 3-kinase catalytic subunit alpha), a member of the PI3K family, is the second most common mutated cancer gene [65], with mutations detected in over 10% of eight types of cancers. This gene promotes cell proliferation, survival, and metabolism by activating the PI3K/AKT/mTOR signaling pathway [66]. Upon infection of gastric epithelial cells by Hp, PI3K/AKT/mTOR and MAPK signaling pathways are activated, inducing malignant transformation of epithelial cells through processes such as apoptosis, proliferation, and differentiation [67]. Matrix metalloproteinases (MMPs) are enzymes that degrade the extracellular matrix and are involved in various degenerative and inflammatory diseases. In Hp infection, they are closely associated with the progression of gastritis, gastric/duodenal ulcers, and gastric cancer. MMP9 mediates Hp-induced gastric cancer invasion and metastasis via signal protein 5A, with its expression depending on the integrity of Hp’s cag pathogenicity island (cag-PAI) [68]. These key proteins play central roles in signal transduction, metabolic homeostasis, DNA repair, and the balance between proliferation and apoptosis in host cells. They are likely involved in multiple pathogenic processes during Hp infection. IND and IRN may exert their effects through multi-target synergy, interfering with the activity and expression of these proteins, thereby affecting Hp’s invasion, virulence factor secretion, and bacterial metabolic pathways. This, in turn, inhibits Hp’s infection and reproduction in the gastric mucosa, achieving an anti-Hp effect.
GO enrichment analysis indicated that IND and IRN primarily target the cytoplasmic matrix, nucleoplasm, nucleus, and mitochondria, suggesting that they may exert anti-Hp effects by modulating cellular structure and function. Their molecular functions involve ATP binding, protein phosphatase binding, protein binding, and protein kinase activity, indicating potential regulation of downstream biological processes through target modulation. Furthermore, IND and IRN affect negative regulation of apoptosis, cellular responses to reactive oxygen species, inflammation regulation, DNA damage repair, and tumor necrosis factor-mediated responses, suggesting that they may inhibit Hp growth and alleviate gastrointestinal mucosal inflammation by suppressing inflammatory responses and preventing genomic instability.
KEGG enrichment analysis indicates that the effects of IND and IRN against Hp are mediated through synergistic regulation of multiple targets and pathways, primarily involving Hp–infected epithelial cell signaling, TNF signaling, PI3K-Akt signaling, IL-17 signaling, Th17 cell differentiation, and cancer-related pathways. Hp infection activates these signaling networks, modulating epithelial cell proliferation, apoptosis, and differentiation, while creating a microenvironment favorable for bacterial colonization and pathogenicity [69]. Studies have shown that Hp infection significantly upregulates pro-inflammatory cytokine TNF-α in the gastric mucosa [70] and induces local differentiation and activation of Th17 cells. Activated Th17 cells secrete large amounts of IL-17, and the concomitant elevation of TNF-α and IL-17 synergistically exacerbates inflammation and is closely associated with gastric precancerous lesions [71,72]. Aberrant activation of PI3K-Akt signaling promotes AKT phosphorylation, regulating cell survival and proliferation, and represents a key mechanism in Hp–induced early gastric carcinogenesis [73,74]. Epidemiological data indicate that approximately 90% of non-cardia gastric cancers are associated with Hp infection, which has been classified as a Group I carcinogen by the IARC. Previous studies have demonstrated that IND and IRN exhibit anticancer activity against various cancers [75,76], and their anticancer properties align with the cancer-related pathways enriched in this study, suggesting that they may exert therapeutic effects by blocking Hp–driven carcinogenesis.
Notably, MAPK8 plays a critical regulatory role, participating in over 50% of the core biological processes and KEGG pathways. Molecular docking demonstrates that IND and IRN bind well to core targets such as PARP1 and MMP9, supporting their potential to inhibit Hp–related pathological progression through modulation of these targets. Overall, the core targets of IND and IRN may achieve multi-dimensional intervention in Hp infection and associated pathological damage via synergistic regulation of multi-target, multi-pathway signaling networks.
Studies have shown that Hp can be eradicated by altering bacterial morphology and disrupting cell membrane integrity [77]. SEM observations revealed that after 12 h of IRN or IND treatment, Hp exhibited shrinkage, cytoplasmic leakage, and cell fragmentation, suggesting that these compounds may exert bactericidal effects by compromising membrane integrity. This mechanism differs from antibiotics like clarithromycin, which act indirectly by inhibiting protein synthesis [78], further supporting the multi-target antibacterial properties of IRN and IND, consistent with network pharmacology predictions.
Network pharmacology analysis suggested that IND and IRN may interfere with epithelial cell signaling pathways associated with Hp infection, thereby affecting bacterial colonization and pathogenicity. AlpA mediates specific adhesion to gastric epithelial cells and is essential for initial colonization [79]; the urease system (ureA, ureB, ureE, ureH, ureI, nixA) maintains acid resistance and nitrogen metabolism homeostasis(Marais et al., 1999), in which the catalytic subunits (ureA, ureB) hydrolyze urea to produce ammonia and form a protective “ammonia cloud” [80], the accessory genes (ureE, ureH, ureI) participate in nickel activation and enzyme maturation [81], and nixA ensures nickel uptake [82]; while flagellar genes (flgA, flgB) drive bacterial motility and gastric dissemination [83].
RT-qPCR results showed that under MIC conditions, IND, IRN, and IND/IRN-OFNPs significantly downregulated urease gene transcription. The two single agents exerted differential effects on virulence factors, whereas the combination exhibited the strongest inhibition, indicating a synergistic effect. Urease activity assays further confirmed this: all three treatments effectively suppressed urease activity in both the standard strain (ATCC 700392) and the resistant strain (ATCC 43504), and IND/IRN-OFNPs maintained potent inhibition even at low concentrations. These findings suggest that IND and IRN attenuate Hp acid tolerance through dual mechanisms at both the transcriptional and enzymatic levels, thereby disrupting the infection process.
In addition, IND, IRN, and IND/IRN-OFNPs markedly downregulated the transcription of flagellar genes (flaA, flaB) and the adhesion gene alpA, thereby impairing bacterial motility and colonization. Consistent with previous studies, these genes are closely associated with adhesion [84], motility [85], and inflammation [86], and their suppression would directly weaken colonization capacity and alleviate host inflammatory responses [87].
Notably, CagA and VacA are key virulence factors in persistent Hp infection and gastric carcinogenesis [88,89], and network pharmacology identified them as critical regulatory nodes. RT-qPCR revealed that IND, IRN, and IND/IRN-OFNPs significantly downregulated their transcription, which was further confirmed by Western blot. Among them, IND/IRN-OFNPs achieved over 50% inhibition of CagA expression at 1.25 µg/mL, showing the strongest effect. These findings suggest that IND and IRN may mitigate gastric mucosal inflammation and tissue damage, and potentially block the initiation and progression of Hp–associated gastric cancer by interfering with CagA/VacA-mediated pathogenic signaling.
Using untargeted metabolomics, this study analyzed the significant metabolic profile alterations of Hp induced by IND, IRN, and IND/IRN-OFNPs, preliminarily revealing their antibacterial metabolic regulation and differential mechanisms.
In the phenylalanine/tyrosine/tryptophan biosynthesis pathway, amino acids serve not only as key substrates for Hp energy metabolism and nitrogen supply but also as essential molecules for protein synthesis, colonization, and virulence regulation [90]. L-phenylalanine, an essential amino acid for Hp, was significantly upregulated after IND and IND/IRN-OFNPs treatment. Since Hp cannot synthesize phenylalanine and depends on exogenous uptake [91], its accumulation suggests a blockade in downstream conversion, leading to impaired utilization of this essential amino acid, thereby inhibiting protein synthesis and bacterial growth. L-arginine, the central substrate of the arginine deiminase pathway, was downregulated after IRN treatment, suggesting impaired arginine metabolism [92], which may reduce acid resistance and bacterial growth capacity.
In the arginine biosynthesis pathway, arginine functions not only as a substrate for protein synthesis but also participates in the urea cycle and the generation of signaling molecules (e.g., NO). Moreover, it can act as a urease activator, enabling bacteria to neutralize gastric acid. Its precursor, L-glutamic acid, is a crucial component of peptidoglycan in the bacterial cell wall, essential for cell wall integrity and acid resistance [93]. After IND/IRN-OFNPs treatment, both L-glutamic acid and L-arginine were downregulated, indicating impaired acid resistance and cell wall biosynthesis, thereby weakening bacterial survival. In contrast, IND treatment upregulated both metabolites, which may reflect a stress-induced compensatory mechanism to sustain urease activity and energy metabolism.
Pyruvate metabolism represents a central hub for Hp energy acquisition and carbon flux distribution. Pyruvate, as the end product of glycolysis, can be converted into malate, feeding into the tricarboxylic acid (TCA) cycle, amino acid metabolism, and acid resistance regulation [94]. Given that Hp lacks a complete glycolytic pathway, its energy generation mainly depends on amino acid and organic acid metabolism to replenish pyruvate and its downstream products. Following IND treatment, DL-malic acid, a critical intermediate of the TCA cycle, was markedly downregulated, indicating TCA cycle blockade, energy deficiency, and consequent growth inhibition.
The glyoxylate/dicarboxylate metabolism pathway, which interlinks fatty acid metabolism, acetyl-CoA, and other organic acids, plays a particularly important role under carbon-limited conditions [95,96], supporting Hp survival in the nutrient-restricted gastric mucosa. IND treatment led to DL-malic acid downregulation, reflecting impaired carbon flux and failed energy compensation, thereby suppressing bacterial growth. This metabolic crisis and depletion of intermediates compromise Hp survival, acid resistance, and pathogenicity, consistent with the observed growth arrest and bacteriostatic phenotype.
In the riboflavin metabolism pathway, flavin mononucleotide (FMN) functions as a vital cofactor in respiratory chain complexes I (NADH dehydrogenase) and II (succinate dehydrogenase) [97], as well as in certain antioxidant enzymes [98,99]. IND treatment significantly reduced FMN levels, suggesting impaired electron transport and diminished reactive oxygen species scavenging, rendering Hp more vulnerable to host oxidative stress and reducing its survival capacity.
In the butyrate ester metabolism pathway, butyrate can serve as an energy substrate, but its excessive accumulation may exert toxic effects [100]. IRN treatment induced metabolic dysregulation and led to a significant increase in butyrate levels, indicating the accumulation of endogenous toxic metabolites and impairment of downstream energy metabolism, thereby reflecting the failure of compensatory energy mechanisms.
In the histidine metabolism pathway, histidine can be converted into histamine, contributing to acid–base regulation and signaling, facilitating Hp survival in acidic environments. L-glutamic acid serves as an important substrate, while ethylamine is a downstream metabolite. IRN treatment downregulated L-glutamic acid, suggesting disrupted metabolic flux and reduced acid resistance, while ethylamine accumulation may cause local pH imbalance and react with nitrites to form carcinogenic nitrosamines [101], synergistically damaging membrane structures and DNA, consistent with electron microscopy observations of bacterial lysis.
In the arginine/proline metabolism pathway, both amino acids are critical for energy generation, urease activity, and antioxidant defense [102]. IRN treatment downregulated L-glutamic acid and L-arginine, indicating dual suppression of nitrogen and energy metabolism, consistent with the experimentally observed decrease in urease activity.
Nitrogen metabolism regulates amino acid synthesis, the urea cycle, and nitrogen utilization [103], playing a central role in ammonia production, urease activity, and gastric acid neutralization in Hp. IRN treatment downregulated L-glutamic acid, suggesting impaired nitrogen metabolism and restricted nitrogen utilization, further confirming disruption of bacterial nitrogen homeostasis.
In the phosphate metabolism pathway, phosphate is essential for energy synthesis, signal transduction, and nucleic acid metabolism [104]. After IND/IRN-OFNPs treatment, phosphate levels increased, suggesting that the combined treatment interferes with phosphorylation processes and energy metabolism, thereby suppressing bacterial growth.
More importantly, metabolomics analysis revealed that although IND, IRN monotherapy, and IND/IRN-OFNPs groups shared certain metabolites, their abundances differed significantly, and pronounced metabolic heterogeneity was observed between the monotherapy groups. This indicates that the groups differ in their modes of metabolic pathway regulation and their capacities to modulate metabolites, reflecting variations in binding patterns, affinities, and metabolic characteristics with biological targets, thereby leading to mechanistic divergence.
IND carmine, a commonly used endoscopic contrast agent, enhances color contrast between lesions and normal tissue, thereby improving the detection rate of early Hp–associated lesions. This study demonstrates that IND itself possesses anti-Hp activity, while whether IND carmine, as its derivative, affects diagnostic accuracy or subsequent treatment requires further investigation. More importantly, IND and IRN are indole isomers, and their combined use significantly enhances antibacterial activity, providing a rationale for the development of Hp therapeutics and the rational design of synergistic agents based on shared indole scaffolds.
5. Conclusions
This study developed a food-safe self-assembled nanocarrier, IND/IRN-OFNPs, which effectively enhanced the solubility of hydrophobic drugs IND and IRN. In vitro, IND, IRN, and their nanocomposite exhibited potent antibacterial and bactericidal effects against multiple Hp strains, with the combination showing clear synergism. When combined with conventional antibiotics, IND/IRN-OFNPs also displayed additive or synergistic effects. Network pharmacology and experimental validation revealed that their mechanisms involve disruption of bacterial cell structure, inhibition of virulence gene transcription, reduction of urease activity, downregulation of CagA, and interference with multiple metabolic pathways. Notably, IND and IRN possess distinct molecular mechanisms, and their co-encapsulation in the nanocarrier further enhances overall antibacterial efficacy. Overall, IND and IRN emerge as promising multi-target, multi-mechanism anti-Hp candidates, providing new insights for the translational application of natural compounds and supporting further clinical development of IND and IRN as primary or adjuvant therapeutics.
Supplementary Materials
Supplementary Materials to this article can be found online at https://docs.google.com/document/d/1-dk8eQmWqa9irJRIJGg56DxJIxY7AHJHcwOUSYWYyaw/edit?usp=sharing; https://docs.google.com/document/d/1c0XcZx38Msfx3nGYnnmsC4_51BcE2Y41G89uIo3bWps/edit?usp=sharing.
Author Contributions
Fengli Lin and Meiyun Chen conceived the idea; Fengli Lin designed and performed the experiments; Yanqi Li, Haonan Li, Tianyi Zhang, Jie Cui, Xiaoyan Shi, He Xiao, Junwei Jia and Ruixia Wei participated in the experiments; Fengli Lin and Meiyun Chen wrote the manuscript; Guimin Zhang, Meicun Yao, and Zhong Feng revised the manuscript. All authors have read and approved the final manuscript.
Ethics Contributions
Not applicable.
Data Availability
Data will be made available upon request.
Acknowledgments
We sincerely thank Luneng Pharmaceutical Group Co., Ltd. and the State Key Laboratory of Integration and Innovation of Classic Formula and Modern Chinese Medicine for providing experimental materials and funding, as well as all the staff involved in this study. This work was supported by the Taishan Industrial Experts Program (No. tscx202306086) Fund.
Conflicts of Interest
The authors declare that they have no conflicts of interest.
Abbreviations
The following abbreviations are used in this manuscript:
| GO | Genome ontology |
| KEGG | Kyoto encyclopedia of genes and genomes |
| RT-qPCR | Reverse-transcription quantitative polymerase chain reaction |
References
- Malfertheiner, P.; Megraud, F.; O’Morain, C.; Bazzoli, F.; El-Omar, E.; Graham, D.; Hunt, R.; Rokkas, T.; Vakil, N.; Kuipers, E.J. Current concepts in the management of Helicobacter pylori infection: the Maastricht III Consensus Report. Gut 2007, 56, 772–781. [Google Scholar] [CrossRef]
- de Martel, C.; Georges, D.; Bray, F.; Ferlay, J.; Clifford, G.M. Global burden of cancer attributable to infections in 2018: a worldwide incidence analysis. Lancet Glob. Health 2020, 8, e180–e190. [Google Scholar] [CrossRef]
- Miller, A.K.; Williams, S.M. Helicobacter pylori infection causes both protective and deleterious effects in human health and disease. Genes Immun. 2021, 22, 218–226. [Google Scholar] [CrossRef]
- Nagy, P.; Johansson, S.; Molloy-Bland, M. Systematic review of time trends in the prevalence of Helicobacter pylori infection in China and the USA. Gut Pathog. 2016, 8, 8. [Google Scholar] [CrossRef]
- Sukri, A.; Lopes, B.S.; Hanafiah, A. The Emergence of Multidrug-Resistant Helicobacter pylori in Southeast Asia: A Systematic Review on the Trends and Intervention Strategies Using Antimicrobial Peptides. Antibiot. Basel Switz. 2021, 10, 1061. [Google Scholar] [CrossRef]
- Treatment of Helicobacter pylori infection: current status and future concepts - PubMed Available online:. Available online: https://pubmed.ncbi.nlm.nih.gov/24833858/ (accessed on Oct 4, 2025).
- Helicobacter pylori infection and antibiotic resistance - from biology to clinical implications - PubMed Available online:. Available online: https://pubmed.ncbi.nlm.nih.gov/34002081/ (accessed on Oct 4, 2025).
- Prevalence of Antibiotic Resistance in Helicobacter pylori: A Systematic Review and Meta-analysis in World Health Organization Regions - PubMed Available online:. Available online: https://pubmed.ncbi.nlm.nih.gov/29990487/ (accessed on Oct 4, 2025).
- Mann, J. Natural products in cancer chemotherapy: past, present and future. Nat. Rev. Cancer 2002, 2, 143–148. [Google Scholar] [CrossRef]
- Li, Q.; Huang, H.; Fan, R.; Ye, Q.; Hu, Y.; Wu, Z.; Zhang, C.; Wang, Y. Chromosome-level genome assembly of the tetraploid medicinal and natural dye plant Persicaria tinctoria. Sci. Data 2024, 11, 1440. [Google Scholar] [CrossRef]
- Feng, J.; Huang, D.; Yang, Y.; Chen, J.; Qiu, S.; Lv, Z.; Ma, X.; Li, Y.; Li, R.; Xiao, Y.; et al. Isatis indigotica: from (ethno) botany, biochemistry to synthetic biology. Mol. Hortic. 2021, 1, 17. [Google Scholar] [CrossRef] [PubMed]
- Zeng, M.; Zhong, Y.; Guo, Z.; Yang, H.; Zhu, H.; Zheng, L.; Diao, Y. Expression and Functional Study of BcWRKY1 in Baphicacanthus cusia (Nees) Bremek. Front. Plant Sci. 2022, 13, 919071. [Google Scholar] [CrossRef] [PubMed]
- Stasiak, N.; Kukuła-Koch, W.; Głowniak, K. Modern industrial and pharmacological applications of indigo dye and its derivatives--a review. Acta Pol. Pharm. 2014, 71, 215–221. [Google Scholar] [PubMed]
- Li, R.; Xue, C.; Pan, Y.; Li, G.; Huang, Z.; Xu, J.; Zhang, J.; Chen, X.; Hou, L. Research on different compound combinations of Realgar-Indigo naturalis formula to reverse acute promyelocytic leukemia arsenic resistance by regulating autophagy through mTOR pathway. J. Ethnopharmacol. 2024, 326, 117778. [Google Scholar] [CrossRef] [PubMed]
- Sista, A.K.; Horowitz, J.M.; Tapson, V.F.; Rosenberg, M.; Elder, M.D.; Schiro, B.J.; Dohad, S.; Amoroso, N.E.; Dexter, D.J.; Loh, C.T.; et al. Indigo Aspiration System for Treatment of Pulmonary Embolism: Results of the EXTRACT-PE Trial. JACC Cardiovasc. Interv. 2021, 14, 319–329. [Google Scholar] [CrossRef] [PubMed]
- Zhao, G.; Li, T.; Qu, X.; Zhang, N.; Lu, M.; Wang, J. Optimization of ultrasound-assisted extraction of indigo and indirubin from Isatis indigotica Fort. and their antioxidant capacities. Food Sci. Biotechnol. 2017, 26, 1313–1323. [Google Scholar] [CrossRef]
- Andreazza, N.L.; de Lourenço, C.C.; Stefanello, M.É.A.; Atvars, T.D.Z.; Salvador, M.J. Photodynamic antimicrobial effects of bis-indole alkaloid indigo from Indigofera truxillensis Kunth (Leguminosae). Lasers Med. Sci. 2015, 30, 1315–1324. [Google Scholar] [CrossRef]
- Lin, C.-W.; Tsai, F.-J.; Tsai, C.-H.; Lai, C.-C.; Wan, L.; Ho, T.-Y.; Hsieh, C.-C.; Chao, P.-D.L. Anti-SARS coronavirus 3C-like protease effects of Isatis indigotica root and plant-derived phenolic compounds. Antiviral Res. 2005, 68, 36–42. [Google Scholar] [CrossRef]
- Wang, S.Q.; Kopf, A.W.; Marx, J.; Bogdan, A.; Polsky, D.; Bart, R.S. Reduction of ultraviolet transmission through cotton T-shirt fabrics with low ultraviolet protection by various laundering methods and dyeing: clinical implications. J. Am. Acad. Dermatol. 2001, 44, 767–774. [Google Scholar] [CrossRef] [PubMed]
- Y, X.; Y, L.; C, M.; Z, Y.; W, W.; Z, Z.; G, G.; X, L.; H, Y.; R, C.; et al. Indirubin-3’-oxime inhibits c-Jun NH2-terminal kinase: anti-apoptotic effect in cerebellar granule neurons. Neurosci. Lett. 2004, 367. [Google Scholar] [CrossRef]
- Ponnusamy, K.; Ramasamy, M.; Savarimuthu, I.; Paulraj, M.G. Indirubin potentiates ciprofloxacin activity in the NorA efflux pump of Staphylococcus aureus. Scand. J. Infect. Dis. 2010, 42, 500–505. [Google Scholar] [CrossRef]
- Ponnusamy, K.; Ramasamy, M.; Savarimuthu, I.; Paulraj, M.G. Indirubin potentiates ciprofloxacin activity in the NorA efflux pump of Staphylococcus aureus. Scand. J. Infect. Dis. 2010, 42, 500–505. [Google Scholar] [CrossRef]
- Lai, J.-L.; Liu, Y.-H.; Liu, C.; Qi, M.-P.; Liu, R.-N.; Zhu, X.-F.; Zhou, Q.-G.; Chen, Y.-Y.; Guo, A.-Z.; Hu, C.-M. Indirubin Inhibits LPS-Induced Inflammation via TLR4 Abrogation Mediated by the NF-kB and MAPK Signaling Pathways. Inflammation 2017, 40, 1–12. [Google Scholar] [CrossRef]
- Indirubin, a bisindole alkaloid from Isatis indigotica, reduces H1N1 susceptibility in stressed mice by regulating MAVS signaling - PubMed Available online:. Available online: https://pubmed.ncbi.nlm.nih.gov/29285277/ (accessed on Oct 4, 2025).
- Novel and Potential Small Molecule Scaffolds as DYRK1A Inhibitors by Integrated Molecular Docking-Based Virtual Screening and Dynamics Simulation Study - PubMed Available online:. Available online: https://pubmed.ncbi.nlm.nih.gov/35208955/ (accessed on Oct 4, 2025).
- Shao, K.; Wang, T.; Li, T.; Zhang, A.; Cai, M.; Zhao, G.; Fu, Q.; Wang, Q.; Liu, X.; Hou, M. Indirubin regulates MPL and TNF expression in peripheral blood mononuclear cells from patients with primary immune thrombocytopenia. Exp. Hematol. 2019, 73, 18–24. [Google Scholar] [CrossRef]
- Duan, W.; Chen, L.; Liu, F.; Li, X.; Wu, Y.; Cheng, L.; Liu, J.; Ai, C.; Huang, Q.; Zhou, Y. The properties and formation mechanism of ovalbumin-fucoidan complex. Int. J. Biol. Macromol. 2023, 241, 124644. [Google Scholar] [CrossRef]
- Shao, K.; Wang, T.; Li, T.; Zhang, A.; Cai, M.; Zhao, G.; Fu, Q.; Wang, Q.; Liu, X.; Hou, M. Indirubin regulates MPL and TNF expression in peripheral blood mononuclear cells from patients with primary immune thrombocytopenia. Exp. Hematol. 2019, 73, 18–24. [Google Scholar] [CrossRef]
- Liu, L.; Chen, H.; Wang, Y.; Cheng, W.; He, J.; Xiao, F.; Li, S. Characterization of quercetin-ovalbumin complexes stabilizing emulsions: A perspective on the complex binding mechanism. Int. J. Biol. Macromol. 2025, 307, 141970. [Google Scholar] [CrossRef]
- Niu, F.; Hu, D.; Gu, F.; Du, Y.; Zhang, B.; Ma, S.; Pan, W. Preparation of ultra-long stable ovalbumin/sodium carboxymethylcellulose nanoparticle and loading properties of curcumin. Carbohydr. Polym. 2021, 271, 118451. [Google Scholar] [CrossRef]
- Rao, S.-Q.; Xu, G.-W.; Zeng, H.-W.; Zheng, X.-F.; Hu, Q.; Wang, Q.-Y.; Yang, Z.-Q.; Jiao, X.-A. Physicochemical and antibacterial properties of fabricated ovalbumin-carvacrol gel nanoparticles. Food Funct. 2020, 11, 5133–5141. [Google Scholar] [CrossRef] [PubMed]
- Tao, X.; Shi, H.; Cao, A.; Cai, L. Understanding of physicochemical properties and antioxidant activity of ovalbumin-sodium alginate composite nanoparticle-encapsulated kaempferol/tannin acid. RSC Adv. 2022, 12, 18115–18126. [Google Scholar] [CrossRef] [PubMed]
- Effects of fucoidan and synbiotics supplementation during bismuth quadruple therapy of Helicobacter pylori infection on gut microbial homeostasis: an open-label, randomized clinical trial - PubMed Available online:. Available online: https://pubmed.ncbi.nlm.nih.gov/39010853/ (accessed on Oct 4, 2025).
- Wang, S.; Tian, Z.B.; Chen, J.W.; Cong, P.S.; Ding, X.L.; Zhang, C.P.; Yin, X.Y.; Yang, L.; Jing, X.; Mao, T.; et al. Effect of fucoidan on gut microbiota and its clinical efficacy in Helicobacter pylori eradication: A randomized controlled trial. J. Dig. Dis. 2023, 24, 461–471. [Google Scholar] [CrossRef]
- Wang, S.; Tian, Z.B.; Chen, J.W.; Cong, P.S.; Ding, X.L.; Zhang, C.P.; Yin, X.Y.; Yang, L.; Jing, X.; Mao, T.; et al. Effect of fucoidan on gut microbiota and its clinical efficacy in Helicobacter pylori eradication: A randomized controlled trial. J. Dig. Dis. 2023, 24, 461–471. [Google Scholar] [CrossRef] [PubMed]
- O’Shea, C.J.; O’Doherty, J.V.; Callanan, J.J.; Doyle, D.; Thornton, K.; Sweeney, T. The effect of algal polysaccharides laminarin and fucoidan on colonic pathology, cytokine gene expression and Enterobacteriaceae in a dextran sodium sulfate-challenged porcine model. J. Nutr. Sci. 2016, 5, e15. [Google Scholar] [CrossRef]
- Sun, S.; Zhang, X.; Li, J.; Li, Y.; Zhou, C.; Xiang, S.; Tan, M. Preparation and evaluation of ovalbumin-fucoidan nanoparticles for nicotinamide mononucleotide encapsulation with enhanced stability and anti-aging activity. Food Chem. 2023, 418, 135982. [Google Scholar] [CrossRef] [PubMed]
- Du, Z.; Liu, J.; Zhang, H.; Wu, X.; Zhang, B.; Chen, Y.; Liu, B.; Ding, L.; Xiao, H.; Zhang, T. N-Acetyl-l-cysteine/l-Cysteine-Functionalized Chitosan-β-Lactoglobulin Self-Assembly Nanoparticles: A Promising Way for Oral Delivery of Hydrophilic and Hydrophobic Bioactive Compounds. J. Agric. Food Chem. 2019, 67, 12511–12519. [Google Scholar] [CrossRef]
- Gonen, C.; Simsek, I.; Sarioglu, S.; Akpinar, H. Comparison of high resolution magnifying endoscopy and standard videoendoscopy for the diagnosis of Helicobacter pylori gastritis in routine clinical practice: a prospective study. Helicobacter 2009, 14, 12–21. [Google Scholar] [CrossRef]
- Urinary Xist is a potential biomarker for membranous nephropathy - PubMed Available online:. Available online: https://pubmed.ncbi.nlm.nih.gov/25157805/ (accessed on Oct 4, 2025).
- Wylie, M.R.; Windham, I.H.; Blum, F.C.; Wu, H.; Merrell, D.S. In vitro antibacterial activity of nimbolide against Helicobacter pylori. J. Ethnopharmacol. 2022, 285, 114828. [Google Scholar] [CrossRef]
- Lu, L.; Zhao, Y.; Yi, G.; Li, M.; Liao, L.; Yang, C.; Cho, C.; Zhang, B.; Zhu, J.; Zou, K.; et al. Quinic acid: a potential antibiofilm agent against clinical resistant Pseudomonas aeruginosa. Chin. Med. 2021, 16, 72. [Google Scholar] [CrossRef]
- Phellodendron chinense, C.K. Schneid: An in vitro study on its anti-Helicobacter pylori effect - PubMed Available online:. Available online: https://pubmed.ncbi.nlm.nih.gov/38823658/ (accessed on Oct 4, 2025).
- Debowski, A.W.; Walton, S.M.; Chua, E.-G.; Tay, A.C.-Y.; Liao, T.; Lamichhane, B.; Himbeck, R.; Stubbs, K.A.; Marshall, B.J.; Fulurija, A.; et al. Helicobacter pylori gene silencing in vivo demonstrates urease is essential for chronic infection. PLoS Pathog. 2017, 13, e1006464. [Google Scholar] [CrossRef]
- Mishra, P.R.; Al Shaal, L.; Müller, R.H.; Keck, C.M. Production and characterization of Hesperetin nanosuspensions for dermal delivery. Int. J. Pharm. 2009, 371, 182–189. [Google Scholar] [CrossRef]
- Systems pharmacology exploration of botanic drug pairs reveals the mechanism for treating different diseases - PubMed Available online:. Available online: https://pubmed.ncbi.nlm.nih.gov/27841365/ (accessed on Oct 4, 2025).
- Helicobacter pylori and gastric cancer: mechanisms and new perspectives - PubMed Available online:. Available online: https://pubmed.ncbi.nlm.nih.gov/39849657/ (accessed on Oct 4, 2025).
- Gong, Y.; Yuan, Y. Resistance mechanisms of Helicobacter pylori and its dual target precise therapy. Crit. Rev. Microbiol. 2018, 44, 371–392. [Google Scholar] [CrossRef]
- Gao, J.; Liu, C.; Shi, J.; Ni, F.; Shen, Q.; Xie, H.; Wang, K.; Lei, Q.; Fang, W.; Ren, G. The regulation of sodium alginate on the stability of ovalbumin-pectin complexes for VD3 encapsulation and in vitro simulated gastrointestinal digestion study. Food Res. Int. Ott. Ont 2021, 140, 110011. [Google Scholar] [CrossRef] [PubMed]
- Duan, W.; Chen, L.; Liu, F.; Li, X.; Wu, Y.; Cheng, L.; Liu, J.; Ai, C.; Huang, Q.; Zhou, Y. The properties and formation mechanism of ovalbumin-fucoidan complex. Int. J. Biol. Macromol. 2023, 241, 124644. [Google Scholar] [CrossRef] [PubMed]
- Sun, S.; Zhang, X.; Li, J.; Li, Y.; Zhou, C.; Xiang, S.; Tan, M. Preparation and evaluation of ovalbumin-fucoidan nanoparticles for nicotinamide mononucleotide encapsulation with enhanced stability and anti-aging activity. Food Chem. 2023, 418, 135982. [Google Scholar] [CrossRef]
- Wang, R.; Ma, H.; Wang, C. An Improved Memetic Algorithm for Detecting Protein Complexes in Protein Interaction Networks. Front. Genet. 2021, 12, 794354. [Google Scholar] [CrossRef]
- Cohen, G.M. Caspases: the executioners of apoptosis. Biochem. J. 1997, 326 ( Pt 1) Pt 1, 1–16. [Google Scholar] [CrossRef]
- Simbulan-Rosenthal, C.M.; Rosenthal, D.S.; Iyer, S.; Boulares, A.H.; Smulson, M.E. Transient poly(ADP-ribosyl)ation of nuclear proteins and role of poly(ADP-ribose) polymerase in the early stages of apoptosis. J. Biol. Chem. 1998, 273, 13703–13712. [Google Scholar] [CrossRef]
- Halenbeck, R.; MacDonald, H.; Roulston, A.; Chen, T.T.; Conroy, L.; Williams, L.T. CPAN, a human nuclease regulated by the caspase-sensitive inhibitor DFF45. Curr. Biol. CB 1998, 8, 537–540. [Google Scholar] [CrossRef]
- Mitamura, S.; Ikawa, H.; Mizuno, N.; Kaziro, Y.; Itoh, H. Cytosolic nuclease activated by caspase-3 and inhibited by DFF-45. Biochem. Biophys. Res. Commun. 1998, 243, 480–484. [Google Scholar] [CrossRef]
- Liu, X.; Kim, C.N.; Yang, J.; Jemmerson, R.; Wang, X. Induction of apoptotic program in cell-free extracts: requirement for dATP and cytochrome c. Cell 1996, 86, 147–157. [Google Scholar] [CrossRef]
- Yang, J.; Liu, X.; Bhalla, K.; Kim, C.N.; Ibrado, A.M.; Cai, J.; Peng, T.I.; Jones, D.P.; Wang, X. Prevention of apoptosis by Bcl-2: release of cytochrome c from mitochondria blocked. Science 1997, 275, 1129–1132. [Google Scholar] [CrossRef] [PubMed]
- Ashktorab, H.; Neapolitano, M.; Bomma, C.; Allen, C.; Ahmed, A.; Dubois, A.; Naab, T.; Smoot, D.T. In vivo and in vitro activation of caspase-8 and -3 associated with Helicobacter pylori infection. Microbes Infect. 2002, 4, 713–722. [Google Scholar] [CrossRef] [PubMed]
- Chen, X.; Zhu, Y.; Song, C.; Chen, Y.; Wang, Y.; Lai, M.; Zhang, C.; Fang, X. MiR-424-5p targets HSP90AA1 to facilitate proliferation and restrain differentiation in skeletal muscle development. Anim. Biotechnol. 2023, 34, 2514–2526. [Google Scholar] [CrossRef] [PubMed]
- Lang, B.J.; Gorrell, R.J.; Tafreshi, M.; Hatakeyama, M.; Kwok, T.; Price, J.T. The Helicobacter pylori cytotoxin CagA is essential for suppressing host heat shock protein expression. Cell Stress Chaperones 2016, 21, 523–533. [Google Scholar] [CrossRef] [PubMed]
- de Brito, B.B.; da Silva, F.A.F.; Soares, A.S.; Pereira, V.A.; Santos, M.L.C.; Sampaio, M.M.; Neves, P.H.M.; de Melo, F.F. Pathogenesis and clinical management of Helicobacter pylori gastric infection. World J. Gastroenterol. 2019, 25, 5578–5589. [Google Scholar] [CrossRef] [PubMed]
- Guo, S.; Zhang, S.; Zhuang, Y.; Xie, F.; Wang, R.; Kong, X.; Zhang, Q.; Feng, Y.; Gao, H.; Kong, X.; et al. Muscle PARP1 inhibition extends lifespan through AMPKα PARylation and activation in Drosophila. Proc. Natl. Acad. Sci. U. S. A. 2023, 120, e2213857120. [Google Scholar] [CrossRef] [PubMed]
- An, C.-X.; Xie, S.-P.; Li, H.-L.; Hu, Y.-H.; Niu, R.; Zhang, L.-J.; Jiang, Y.; Li, Q.; Zhou, Y.-N. Knockdown of Microtubule Associated Serine/threonine Kinase Like Expression Inhibits Gastric Cancer Cell Growth and Induces Apoptosis by Activation of ERK1/2 and Inactivation of NF-κB Signaling. Curr. Med. Sci. 2021, 41, 108–117. [Google Scholar] [CrossRef]
- Arafeh, R.; Samuels, Y. PIK3CA in cancer: The past 30 years. Semin. Cancer Biol. 2019, 59, 36–49. [Google Scholar] [CrossRef]
- Morgos, D.-T.; Stefani, C.; Miricescu, D.; Greabu, M.; Stanciu, S.; Nica, S.; Stanescu-Spinu, I.-I.; Balan, D.G.; Balcangiu-Stroescu, A.-E.; Coculescu, E.-C.; et al. Targeting PI3K/AKT/mTOR and MAPK Signaling Pathways in Gastric Cancer. Int. J. Mol. Sci. 2024, 25, 1848. [Google Scholar] [CrossRef]
- Morgos, D.-T.; Stefani, C.; Miricescu, D.; Greabu, M.; Stanciu, S.; Nica, S.; Stanescu-Spinu, I.-I.; Balan, D.G.; Balcangiu-Stroescu, A.-E.; Coculescu, E.-C.; et al. Targeting PI3K/AKT/mTOR and MAPK Signaling Pathways in Gastric Cancer. Int. J. Mol. Sci. 2024, 25, 1848. [Google Scholar] [CrossRef]
- Niu, F.; Hu, D.; Gu, F.; Du, Y.; Zhang, B.; Ma, S.; Pan, W. Preparation of ultra-long stable ovalbumin/sodium carboxymethylcellulose nanoparticle and loading properties of curcumin. Carbohydr. Polym. 2021, 271, 118451. [Google Scholar] [CrossRef]
- Shibayama, K.; Arakawa, Y. [Helicobacter pylori infection and epithelial cell signaling in gastric pathogenesis]. Nihon Saikingaku Zasshi Jpn. J. Bacteriol. 2004, 59, 415–424. [Google Scholar] [CrossRef]
- Xiao, Z.; Hao, Y.; Liu, B.; Qian, L. Indirubin and meisoindigo in the treatment of chronic myelogenous leukemia in China. Leuk. Lymphoma 2002, 43, 1763–1768. [Google Scholar] [CrossRef]
- Brackman, L.C.; Jung, M.S.; Green, E.H.; Joshi, N.; Revetta, F.L.; McClain, M.S.; Markham, N.O.; Piazuelo, M.B.; Scott Algood, H.M. IL-17 signaling protects against Helicobacter pylori-induced gastric cancer. Gut Microbes 2024, 16, 2430421. [Google Scholar] [CrossRef]
- Duan, Y.; Xu, Y.; Dou, Y.; Xu, D. Helicobacter pylori and gastric cancer: mechanisms and new perspectives. J. Hematol. Oncol.J Hematol Oncol 2025, 18, 10. [Google Scholar] [CrossRef]
- Fuqua, S.A.W.; Gu, G.; Rechoum, Y. Estrogen receptor (ER) α mutations in breast cancer: hidden in plain sight. Breast Cancer Res. Treat. 2014, 144, 11–19. [Google Scholar] [CrossRef]
- PI3K/AKT/mTOR signaling transduction pathway and targeted therapies in cancer - PubMed Available online:. Available online: https://pubmed.ncbi.nlm.nih.gov/37596643/ (accessed on Oct 4, 2025).
- Thompson, E.; Prior, S.; Brüning-Richardson, A. Traditional Plant-Derived Compounds Inhibit Cell Migration and Induce Novel Cytoskeletal Effects in Glioblastoma Cells. J. Xenobiotics 2024, 14, 613–633. [Google Scholar] [CrossRef]
- Rahiminejad, A.; Dinarvand, R.; Johari, B.; Nodooshan, S.J.; Rashti, A.; Rismani, E.; Mahdaviani, P.; Saltanatpour, Z.; Rahiminejad, S.; Raigani, M.; et al. Preparation and investigation of indirubin-loaded SLN nanoparticles and their anti-cancer effects on human glioblastoma U87MG cells. Cell Biol. Int. 2019, 43, 2–11. [Google Scholar] [CrossRef]
- Bittencourt, M.L.F.; Rodrigues, R.P.; Kitagawa, R.R.; Gonçalves, R. de C.R. The gastroprotective potential of silibinin against Helicobacter pylori infection and gastric tumor cells. Life Sci. 2020, 256, 117977. [Google Scholar] [CrossRef]
- Bittencourt, M.L.F.; Rodrigues, R.P.; Kitagawa, R.R.; Gonçalves, R. de C.R. The gastroprotective potential of silibinin against Helicobacter pylori infection and gastric tumor cells. Life Sci. 2020, 256, 117977. [Google Scholar] [CrossRef]
- Helicobacter pylori BabA in adaptation for gastric colonization - PubMed Available online:. Available online: https://pubmed.ncbi.nlm.nih.gov/28694656/ (accessed on Oct 4, 2025).
- Hu, L.T.; Foxall, P.A.; Russell, R.; Mobley, H.L. Purification of recombinant Helicobacter pylori urease apoenzyme encoded by ureA and ureB. Infect. Immun. 1992, 60, 2657–2666. [Google Scholar] [CrossRef] [PubMed]
- Fong, Y.H.; Wong, H.C.; Chuck, C.P.; Chen, Y.W.; Sun, H.; Wong, K.-B. Assembly of preactivation complex for urease maturation in Helicobacter pylori: crystal structure of UreF-UreH protein complex. J. Biol. Chem. 2011, 286, 43241–43249. [Google Scholar] [CrossRef] [PubMed]
- Mobley, H.L.; Garner, R.M.; Bauerfeind, P. Helicobacter pylori nickel-transport gene nixA: synthesis of catalytically active urease in Escherichia coli independent of growth conditions. Mol. Microbiol. 1995, 16, 97–109. [Google Scholar] [CrossRef] [PubMed]
- Fagoonee, S.; Pellicano, R. Helicobacter pylori: molecular basis for colonization and survival in gastric environment and resistance to antibiotics. A short review. Infect. Dis. Lond. Engl. 2019, 51, 399–408. [Google Scholar] [CrossRef]
- Fagoonee, S.; Pellicano, R. Helicobacter pylori: molecular basis for colonization and survival in gastric environment and resistance to antibiotics. A short review. Infect. Dis. Lond. Engl. 2019, 51, 399–408. [Google Scholar] [CrossRef]
- Li, Y.; Yao, H.; Liu, S.; Song, D.; Wu, C.; Zhang, S.; Gao, Q.; Zhang, L. The role of flagellin F in Vibrio Parahaemolyticus-induced intestinal immunity and functional domain identification. Int. J. Biol. Macromol. 2023, 244, 125404. [Google Scholar] [CrossRef]
- Oberhuber, G.; Kranz, A.; Dejaco, C.; Dragosics, B.; Mosberger, I.; Mayr, W.; Radaszkiewicz, T. Blood groups Lewis(b) and ABH expression in gastric mucosa: lack of inter-relation with Helicobacter pylori colonisation and occurrence of gastric MALT lymphoma. Gut 1997, 41, 37–42. [Google Scholar] [CrossRef] [PubMed]
- Functional and intracellular signaling differences associated with the Helicobacter pylori AlpAB adhesin from Western and East Asian strains - PubMed Available online:. Available online: https://pubmed.ncbi.nlm.nih.gov/17202133/ (accessed on Oct 4, 2025).
- Camilo, V.; Sugiyama, T.; Touati, E. Pathogenesis of Helicobacter pylori infection. Helicobacter, 1. [CrossRef]
- Son, Y.S.; Kwon, Y.H.; Lee, M.-S.; Kwon, O.; Jeong, Y.-J.; Mun, S.J.; Jeon, S.; Park, J.H.; Han, M.-H.; Bae, J.-S.; et al. Helicobacter pylori VacA-induced mitochondrial damage in the gastric pit cells of the antrum and therapeutic rescue. Biomaterials 2025, 314, 122842. [Google Scholar] [CrossRef] [PubMed]
- Leduc, D.; Gallaud, J.; Stingl, K.; de Reuse, H. Coupled amino acid deamidase-transport systems essential for Helicobacter pylori colonization. Infect. Immun. 2010, 78, 2782–2792. [Google Scholar] [CrossRef] [PubMed]
- Nagata, K.; Nagata, Y.; Sato, T.; Fujino, M.A.; Nakajima, K.; Tamura, T. L-Serine, D- and L-proline and alanine as respiratory substrates of Helicobacter pylori: correlation between in vitro and in vivo amino acid levels. Microbiol. Read. Engl. 2003, 149, 2023–2030. [Google Scholar] [CrossRef]
- Helicobacter pylori-Mediated Genetic Instability and Gastric Carcinogenesis - PubMed Available online:. Available online: https://pubmed.ncbi.nlm.nih.gov/28124159/ (accessed on Oct 4, 2025).
- Shibayama, K.; Wachino, J.; Arakawa, Y.; Saidijam, M.; Rutherford, N.G.; Henderson, P.J.F. Metabolism of glutamine and glutathione via gamma-glutamyltranspeptidase and glutamate transport in Helicobacter pylori: possible significance in the pathophysiology of the organism. Mol. Microbiol. 2007, 64, 396–406. [Google Scholar] [CrossRef]
- The dual role of citrate in cancer - PubMed Available online:. Available online: https://pubmed.ncbi.nlm.nih.gov/37717858/ (accessed on Oct 4, 2025).
- Duggleby, S.L.; Jackson, A.A. Protein, amino acid and nitrogen metabolism during pregnancy: how might the mother meet the needs of her fetus? Curr. Opin. Clin. Nutr. Metab. Care 2002, 5, 503–509. [Google Scholar] [CrossRef]
- Pitson, S.M.; Mendz, G.L.; Srinivasan, S.; Hazell, S.L. The tricarboxylic acid cycle of Helicobacter pylori. Eur. J. Biochem. 1999, 260, 258–267. [Google Scholar] [CrossRef]
- Fassbinder, F.; Kist, M.; Bereswill, S. Structural and functional analysis of the riboflavin synthesis genes encoding GTP cyclohydrolase II (ribA), DHBP synthase (ribBA), riboflavin synthase (ribC), and riboflavin deaminase/reductase (ribD) from Helicobacter pylori strain P1. FEMS Microbiol. Lett. 2000, 191, 191–197. [Google Scholar] [CrossRef] [PubMed]
- Shimizu, T.; Chiba, T.; Marusawa, H. Helicobacter pylori-Mediated Genetic Instability and Gastric Carcinogenesis. Curr. Top. Microbiol. Immunol. 2017, 400, 305–323. [Google Scholar] [CrossRef]
- Matnuri, M.; Zheng, C.; Sidik, D.; Bai, G.; Abdukerim, M.; Abdukadier, A.; Ahmat, K.; Ma, Y.; Eli, M. Correlation analysis of riboflavin, RFT2 and Helicobater pylori in gastric carcinoma. Int. J. Clin. Exp. Pathol. 2015, 8, 13339–13345. [Google Scholar]
- Thiele Orberg, E.; Meedt, E.; Hiergeist, A.; Xue, J.; Heinrich, P.; Ru, J.; Ghimire, S.; Miltiadous, O.; Lindner, S.; Tiefgraber, M.; et al. Bacteria and bacteriophage consortia are associated with protective intestinal metabolites in patients receiving stem cell transplantation. Nat. Cancer 2024, 5, 187–208. [Google Scholar] [CrossRef]
- Histidine Phosphorylation: Protein Kinases and Phosphatases - PubMed Available online:. Available online: https://pubmed.ncbi.nlm.nih.gov/39063217/ (accessed on Oct 4, 2025).
- Shibayama, K.; Wachino, J.; Arakawa, Y.; Saidijam, M.; Rutherford, N.G.; Henderson, P.J.F. Metabolism of glutamine and glutathione via gamma-glutamyltranspeptidase and glutamate transport in Helicobacter pylori: possible significance in the pathophysiology of the organism. Mol. Microbiol. 2007, 64, 396–406. [Google Scholar] [CrossRef] [PubMed]
- Wang, H.; Shou, Y.; Zhu, X.; Xu, Y.; Shi, L.; Xiang, S.; Feng, X.; Han, J. Stability of vitamin B12 with the protection of whey proteins and their effects on the gut microbiome. Food Chem. 2019, 276, 298–306. [Google Scholar] [CrossRef] [PubMed]
- Glucose utilization and lactate production by Helicobacter pylori - PubMed Available online:. Available online: https://pubmed.ncbi.nlm.nih.gov/8126428/ (accessed on Oct 4, 2025).
Figure 1.
(A) Schematic illustration of the preparation of IND/IRN-loaded OFNPs. (B) Photographs of OFNPs solutions after heating at 90 °C for 5 min and adjusting the pH to 4 at different concentrations. (C) FTIR spectra of free OVA, fucoidan, and OFNPs at concentrations of 0.75, 1, 1.25, and 1.5 µg/mL. (D) Particle size and PDI, and (E) zeta potential of OFNPs at different concentrations (0.75, 1, 1.25, and 1.5 µg/mL). (F-I) SEM images of OFNPs at concentrations of 0.75, 1, 1.25, and 1.5 µg/mL.
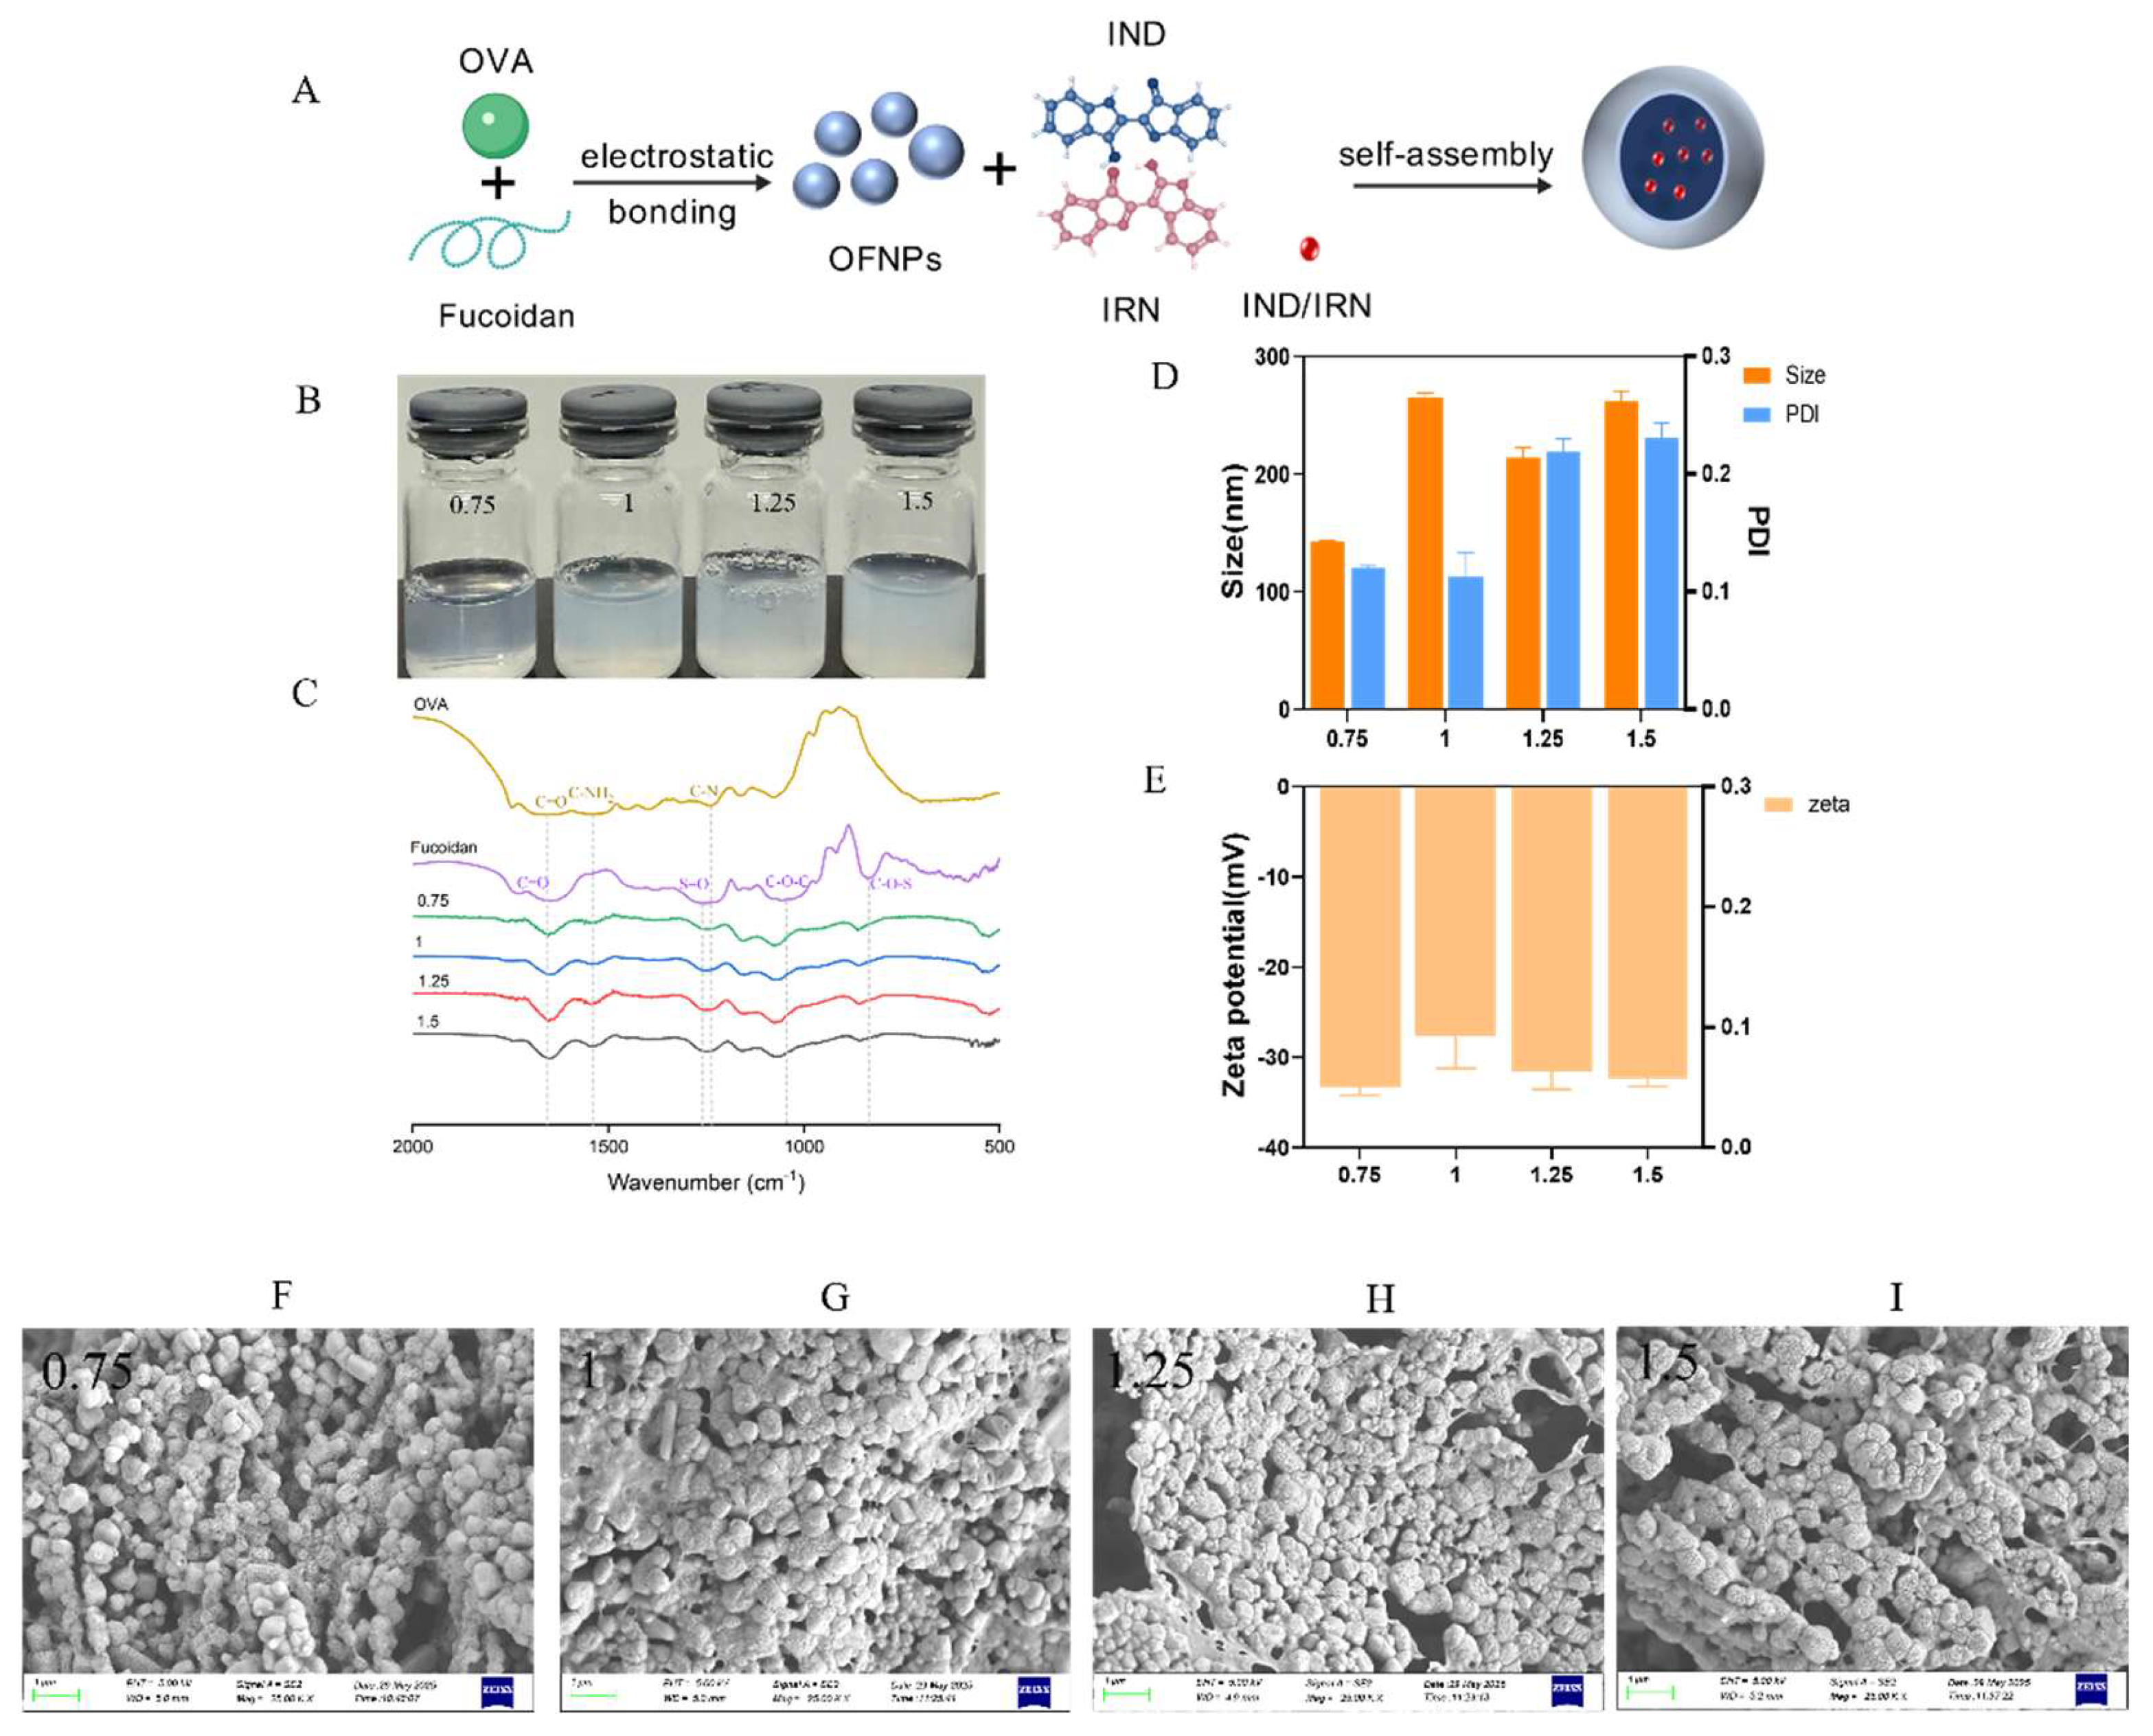
Figure 2.
(A-C) SEM images of IND/IRN-OFNPs with different drug loadings (40, 50, and 60 µg/mL). (D)Particle size and (E) zeta potential of free OFNPs and IND/IRN-OFNPs with different drug loadings. (F) Drug loading content and encapsulation efficiency of IND/IRN-OFNPs with different drug loadings.
Figure 2.
(A-C) SEM images of IND/IRN-OFNPs with different drug loadings (40, 50, and 60 µg/mL). (D)Particle size and (E) zeta potential of free OFNPs and IND/IRN-OFNPs with different drug loadings. (F) Drug loading content and encapsulation efficiency of IND/IRN-OFNPs with different drug loadings.
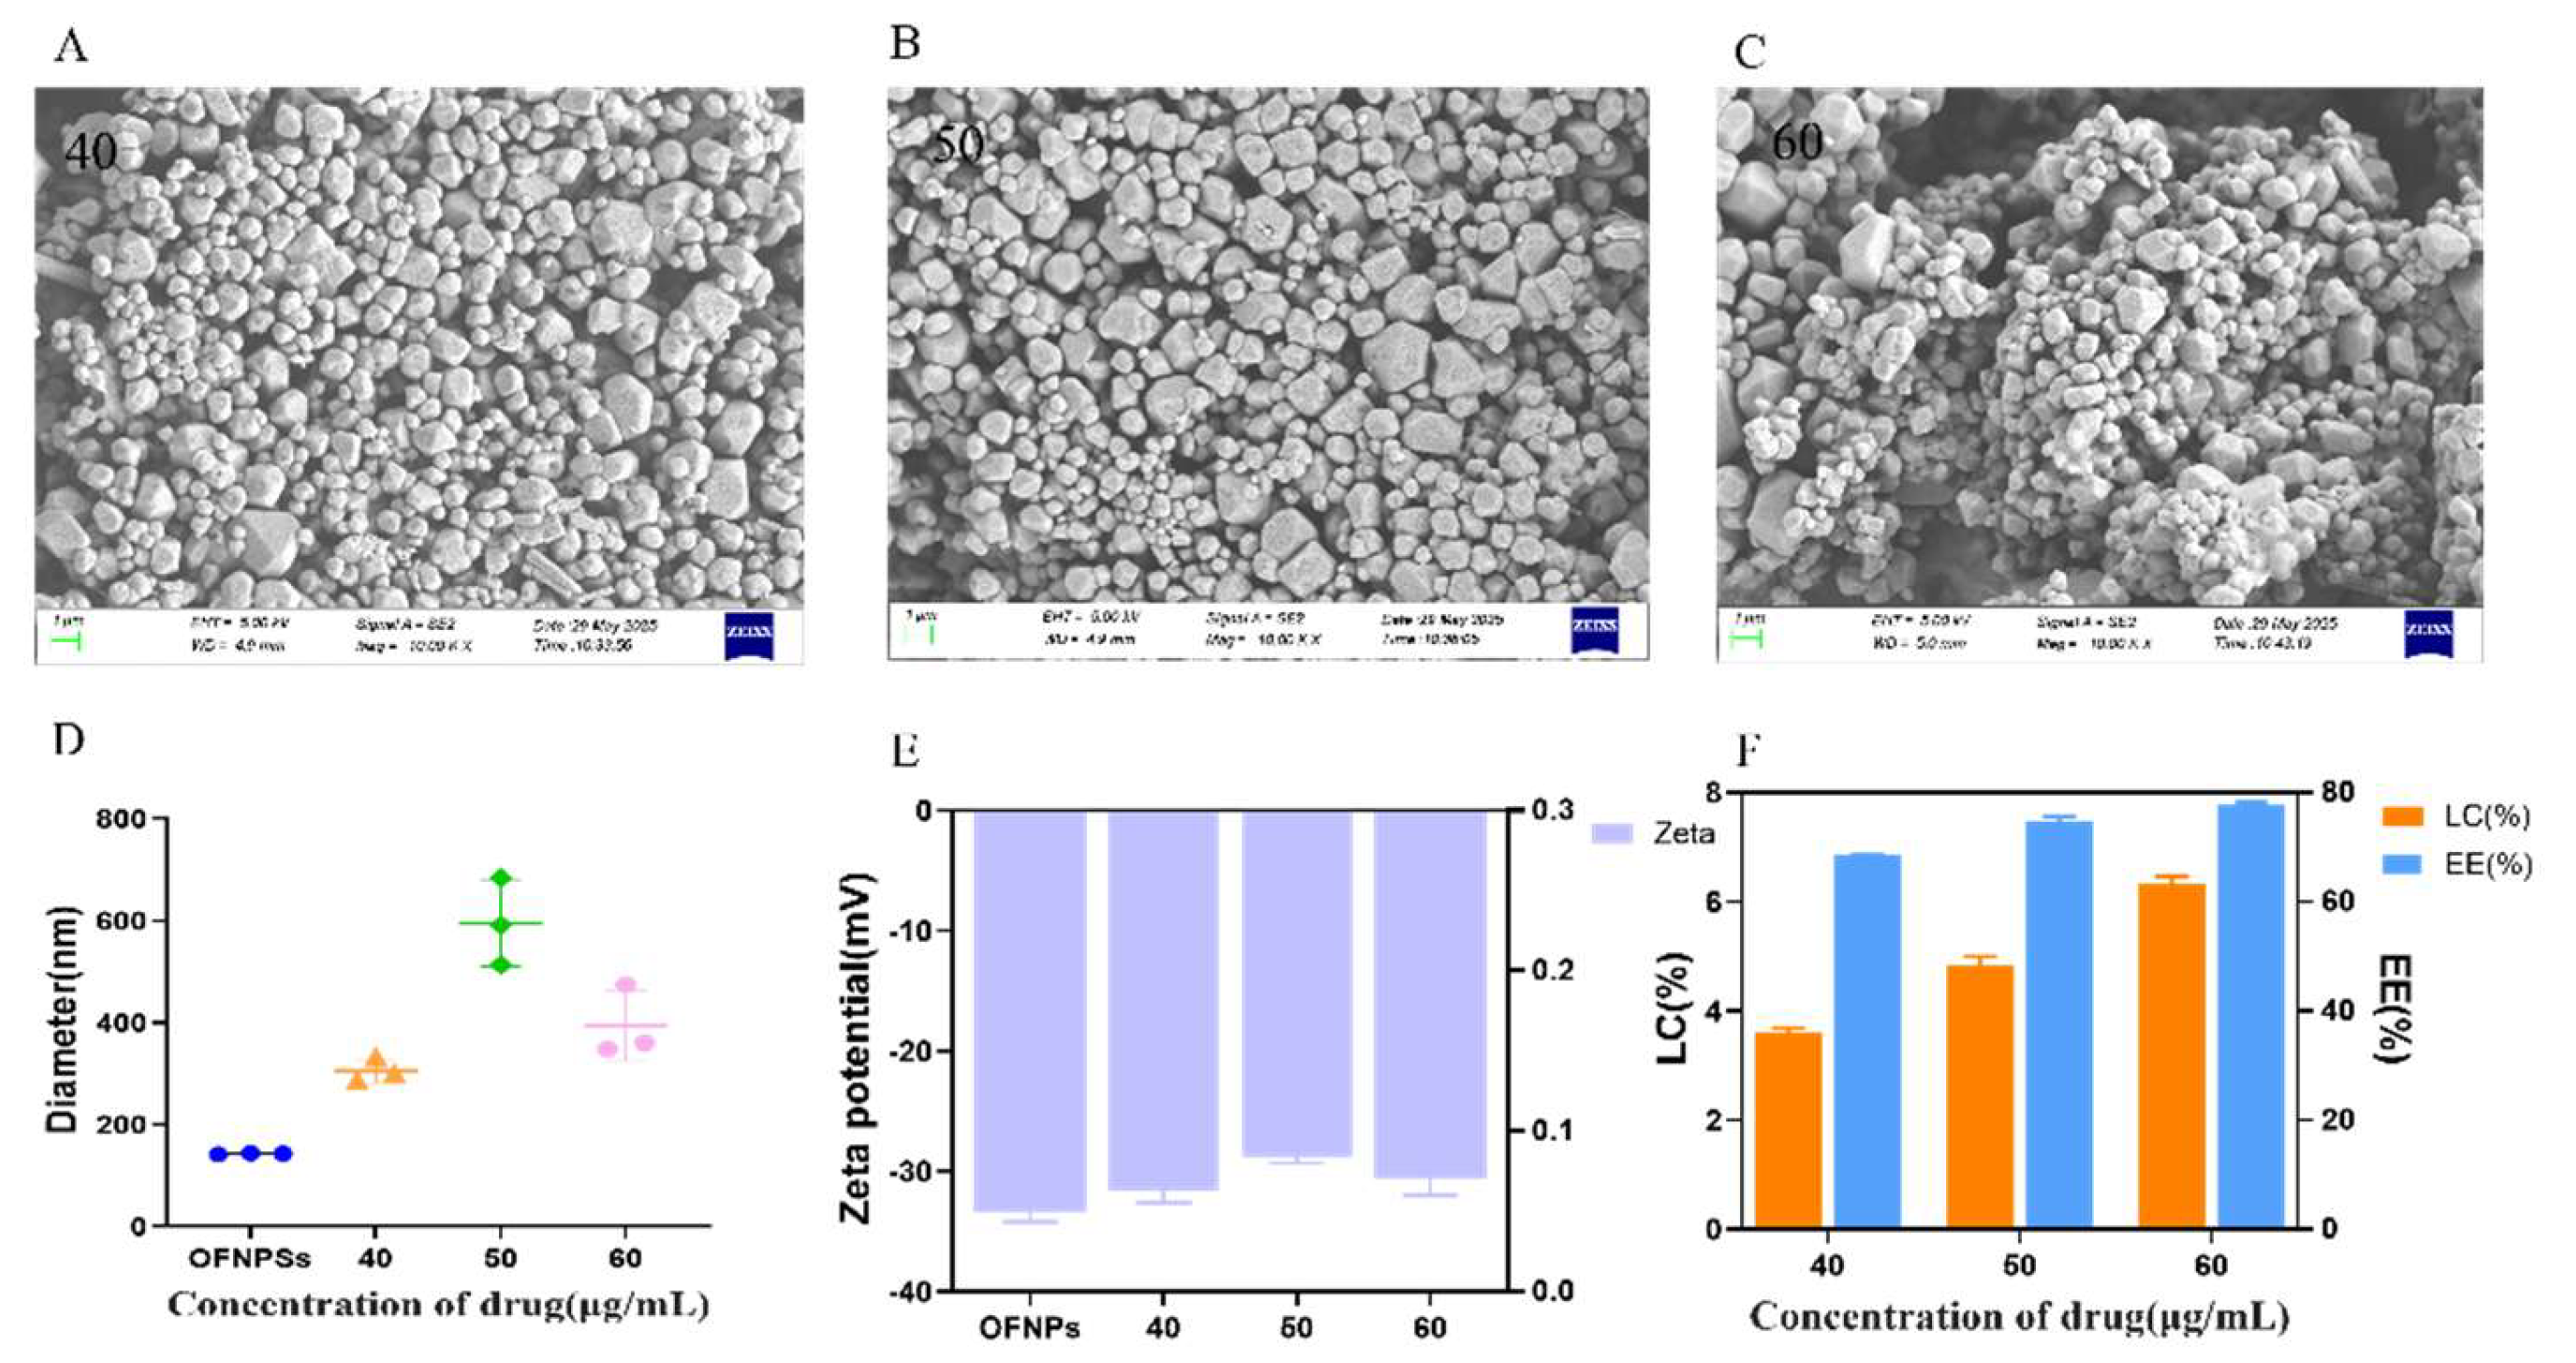
Figure 3.
(A) MIC and MBC values of IND, IRN, and IND/IRN-OFNPs against different Hp strains. Standard strains: ATCC 700392 and ATCC 43504; clinical multidrug-resistant strains: SS1, QYZ-001, QYZ-003, QYZ-004, and CS01.
Figure 3.
(A) MIC and MBC values of IND, IRN, and IND/IRN-OFNPs against different Hp strains. Standard strains: ATCC 700392 and ATCC 43504; clinical multidrug-resistant strains: SS1, QYZ-001, QYZ-003, QYZ-004, and CS01.
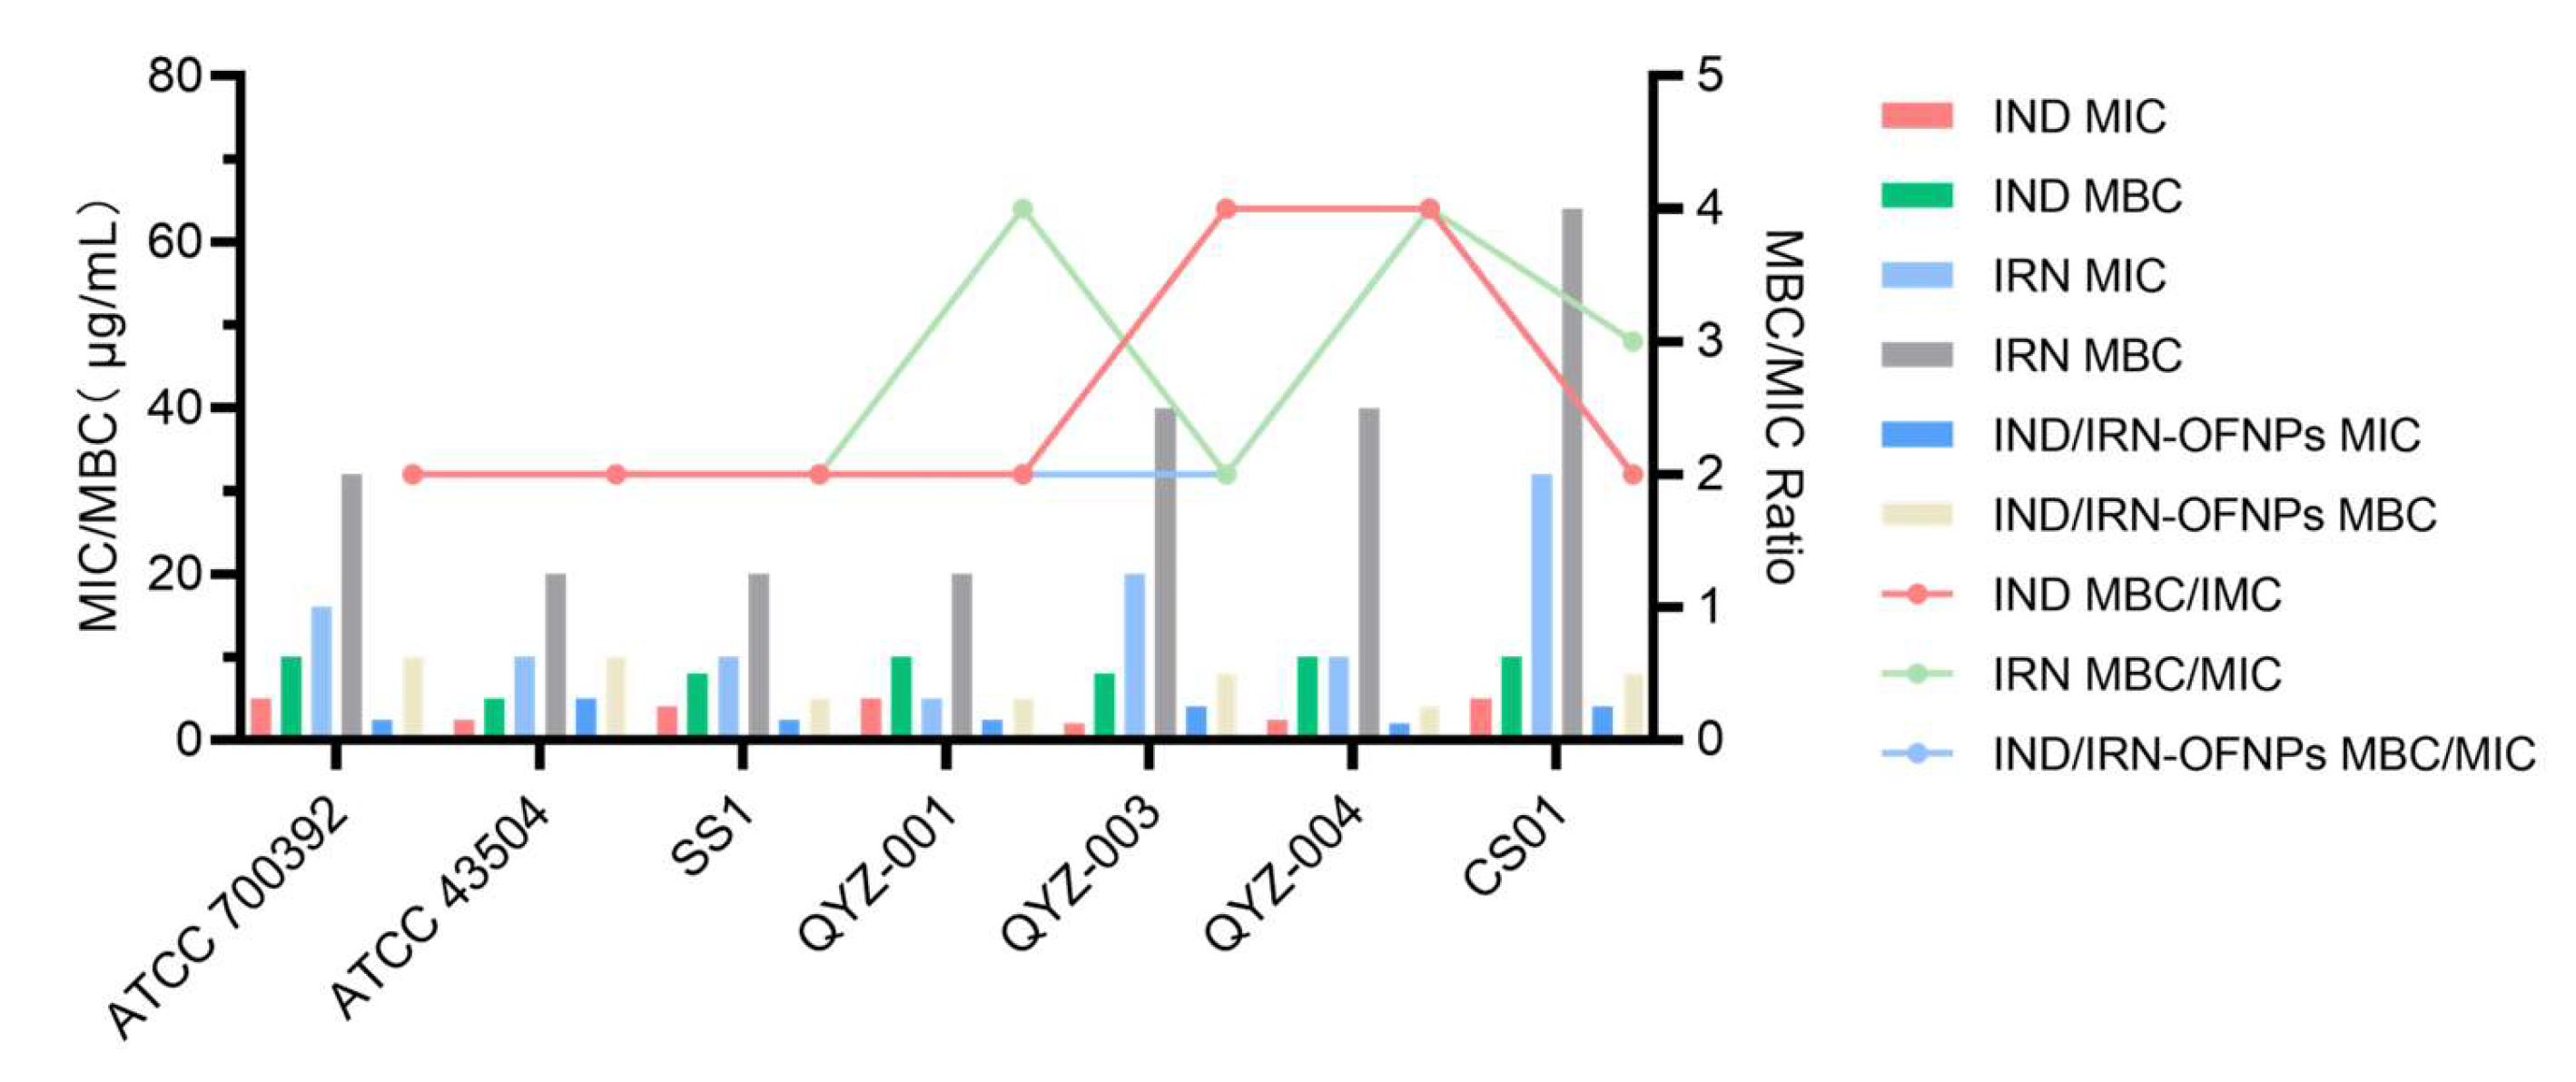
Figure 4.
Time–kill curves of IND (A), IRN (B), and IND/IRN-OFNPs (C) against ATCC 700392, and of IND (D), IRN (E), and IND/IRN-OFNPs (F) against ATCC 43504.
Figure 4.
Time–kill curves of IND (A), IRN (B), and IND/IRN-OFNPs (C) against ATCC 700392, and of IND (D), IRN (E), and IND/IRN-OFNPs (F) against ATCC 43504.
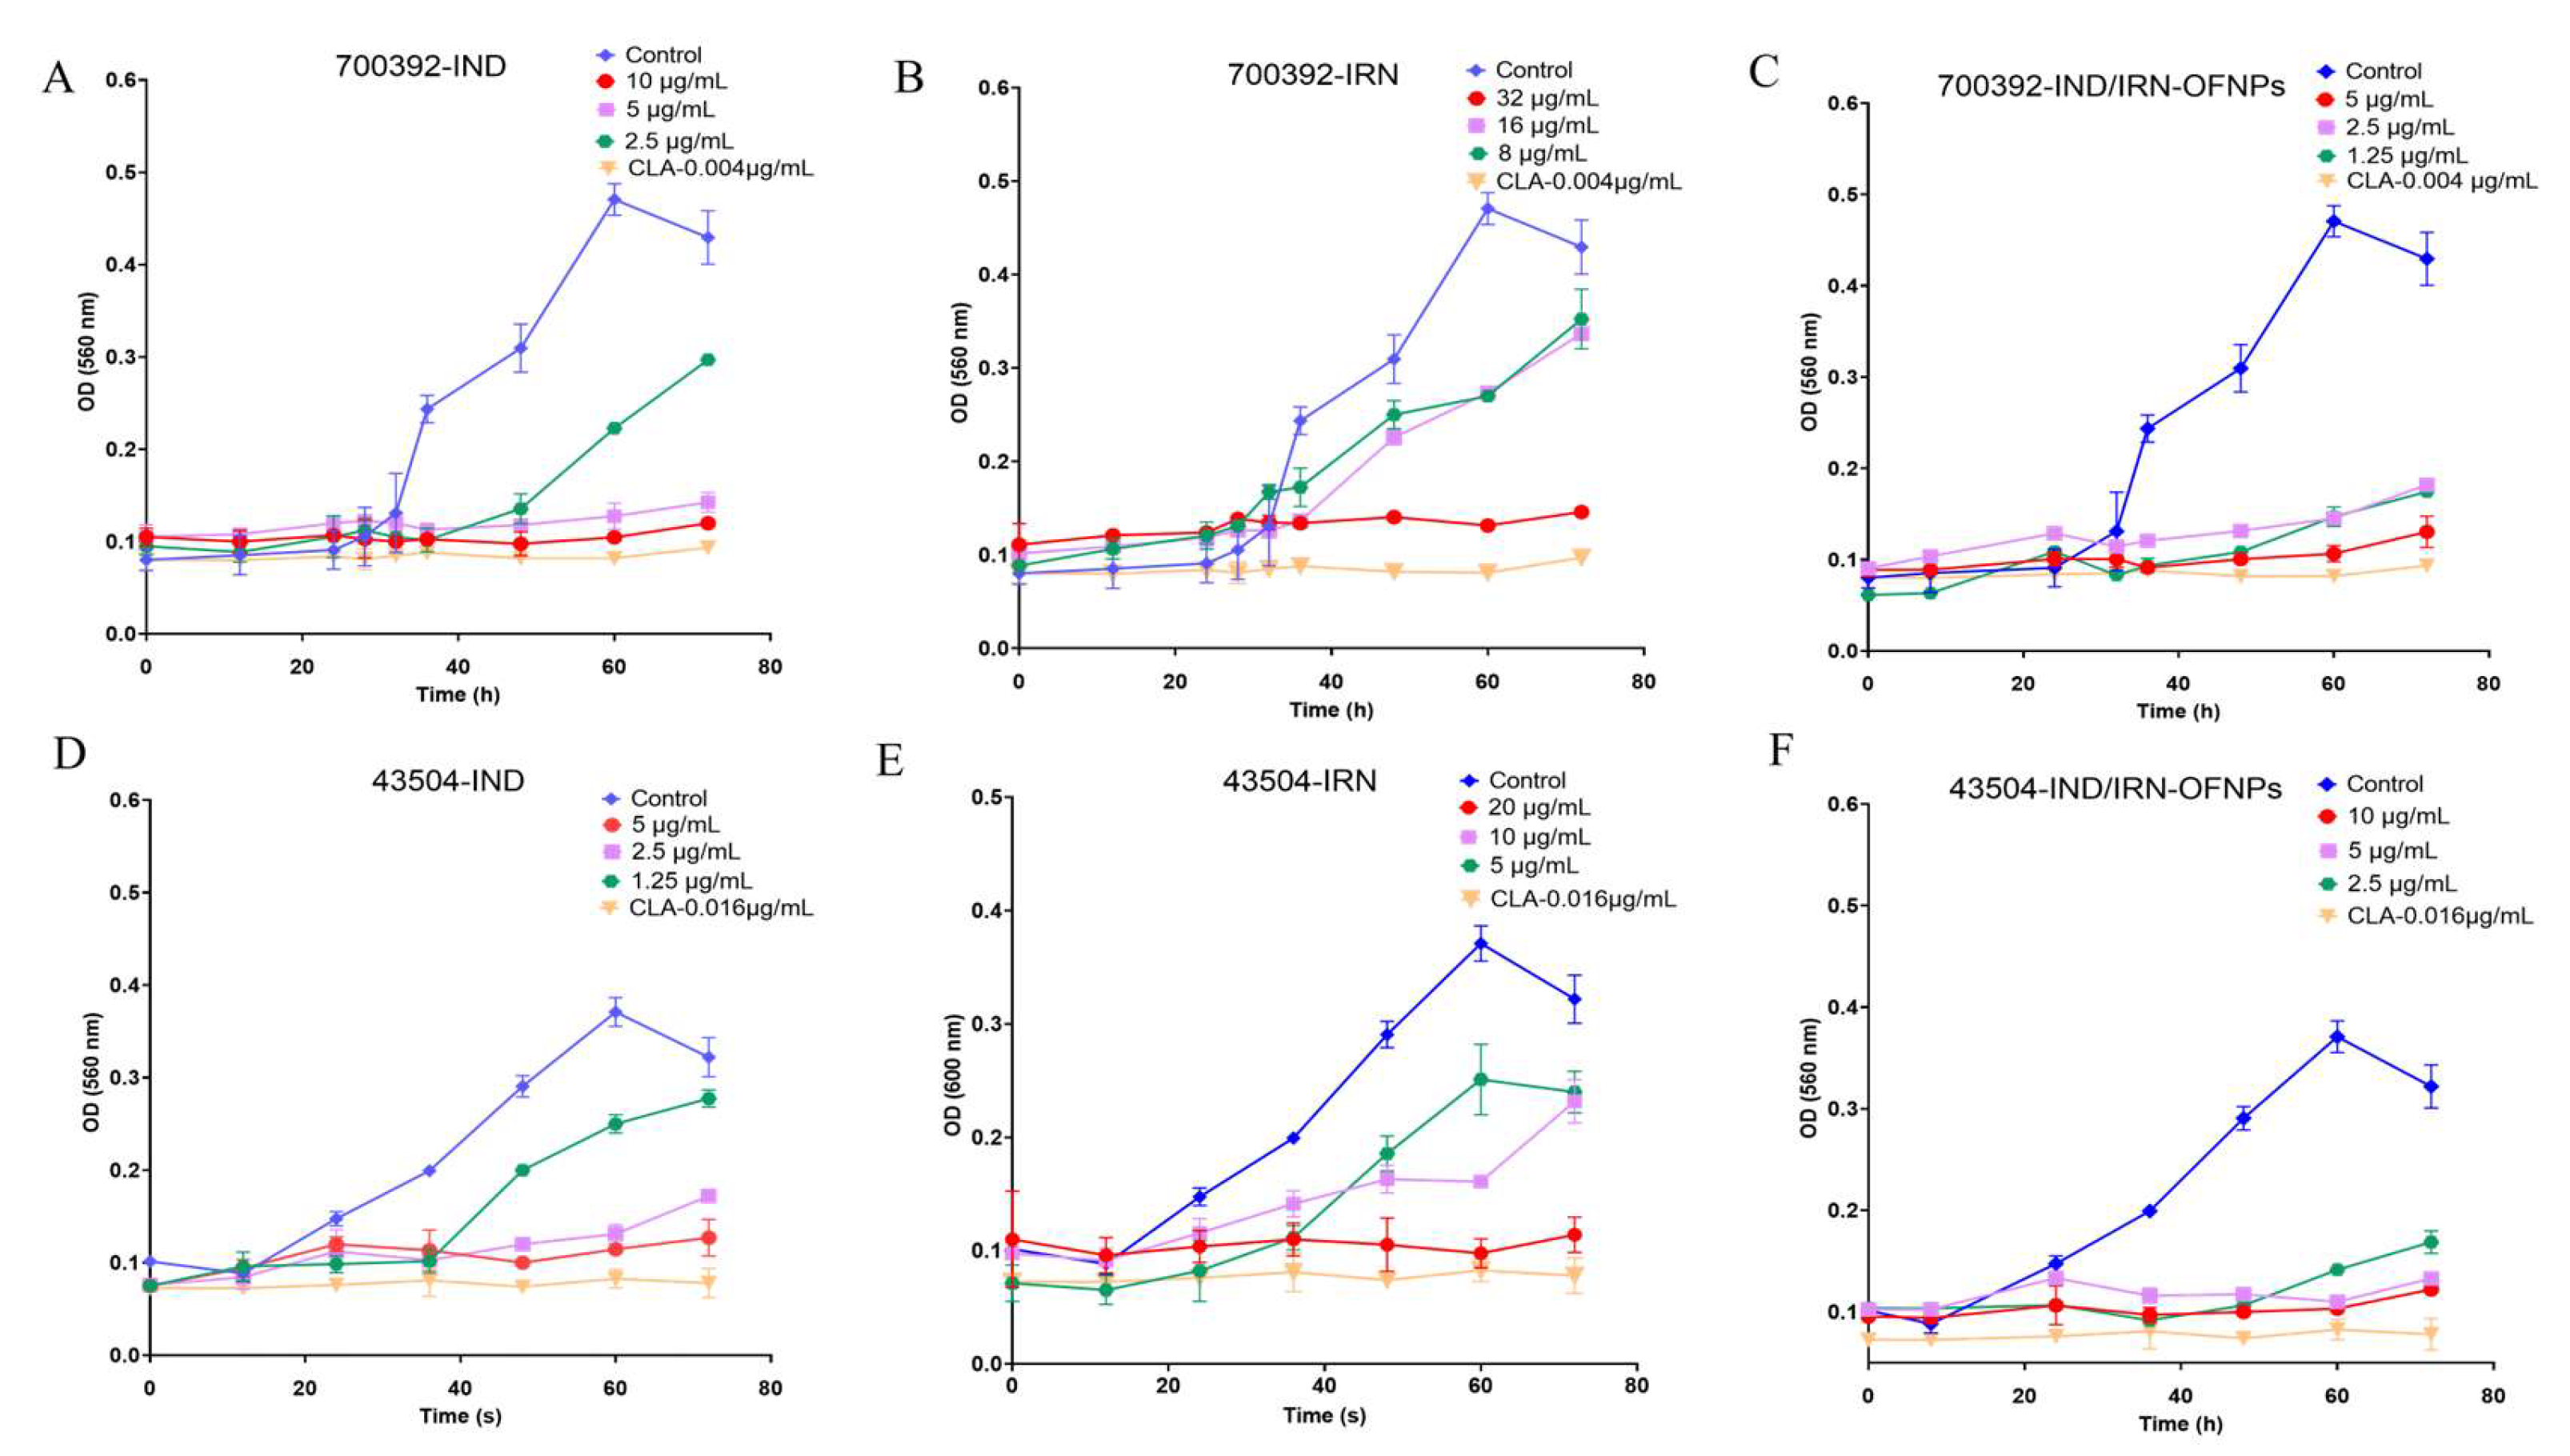
Figure 5.
MIC values of IND/IRN-OFNPs in combination with four antibiotics. NPs indicate IND/IRN-OFNPs; Abx indicate antibiotics.
Figure 5.
MIC values of IND/IRN-OFNPs in combination with four antibiotics. NPs indicate IND/IRN-OFNPs; Abx indicate antibiotics.
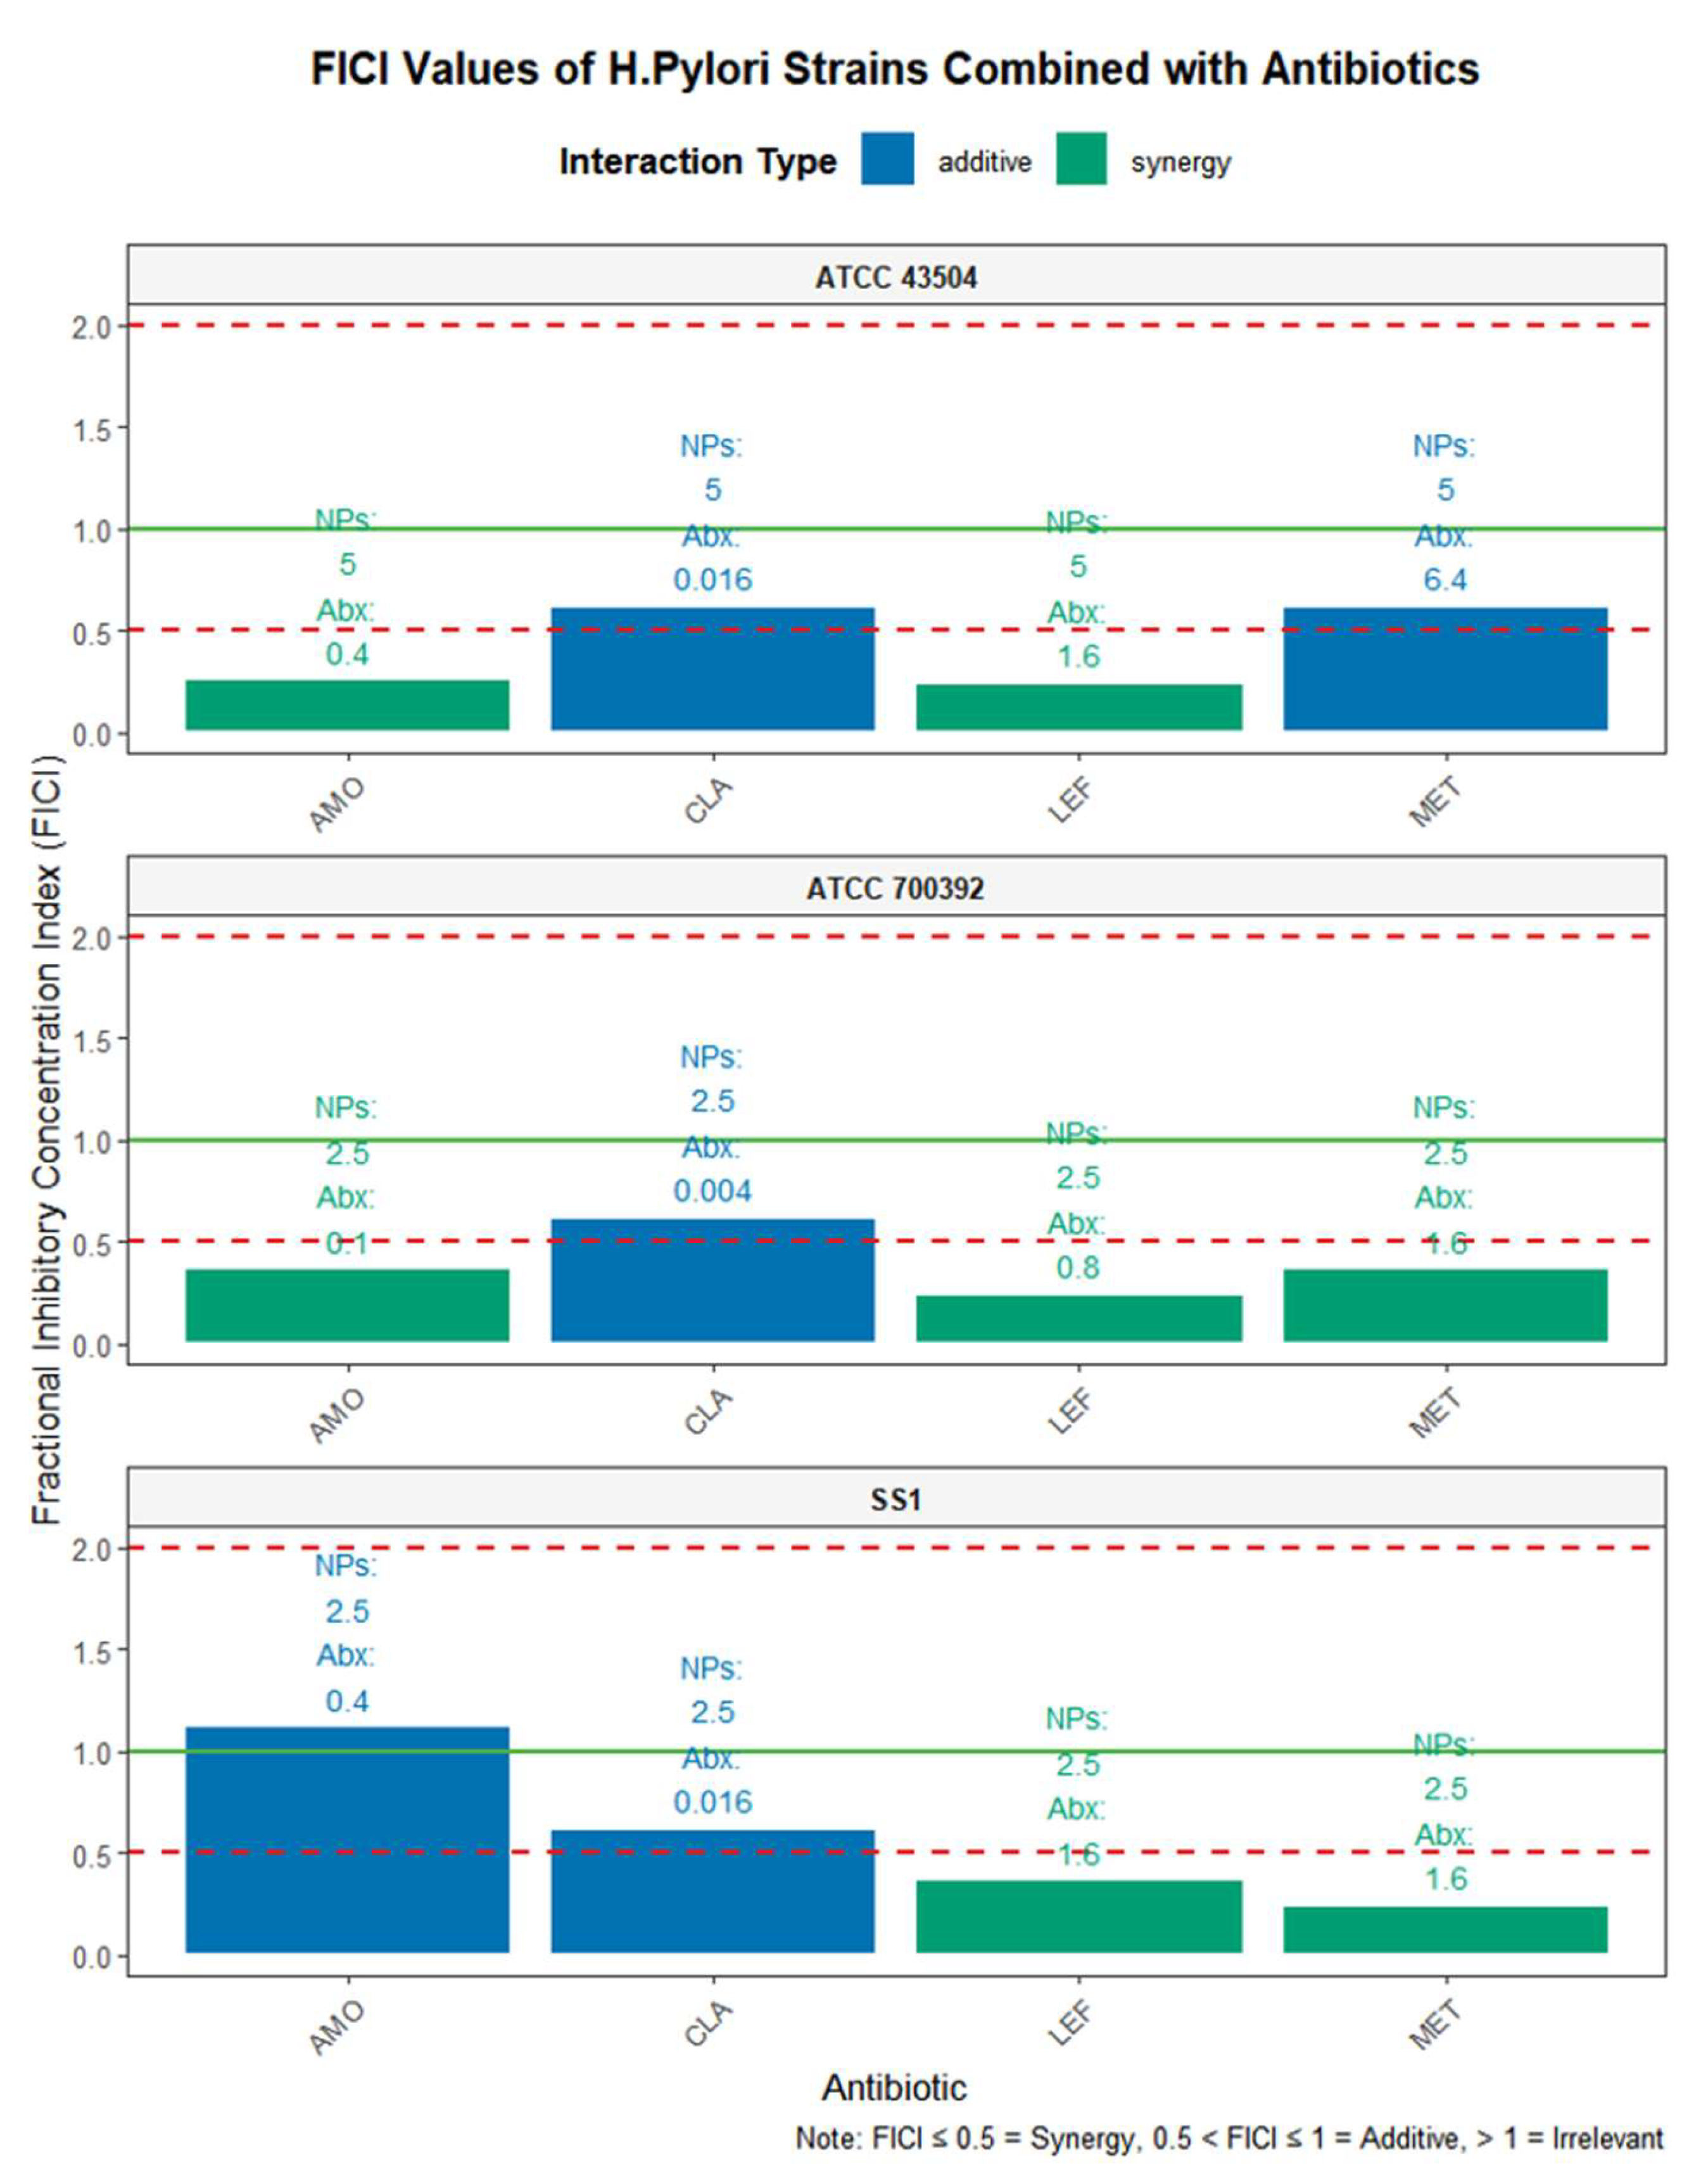
Figure 6.
SEM images showing the morphology of Hp ATCC 43504 after 12 h treatment at MIC concentrations: control group (A-C), IND group (D-F), IRN group (G-I), and IND/IRN-OFNPs group (J-L).
Figure 6.
SEM images showing the morphology of Hp ATCC 43504 after 12 h treatment at MIC concentrations: control group (A-C), IND group (D-F), IRN group (G-I), and IND/IRN-OFNPs group (J-L).
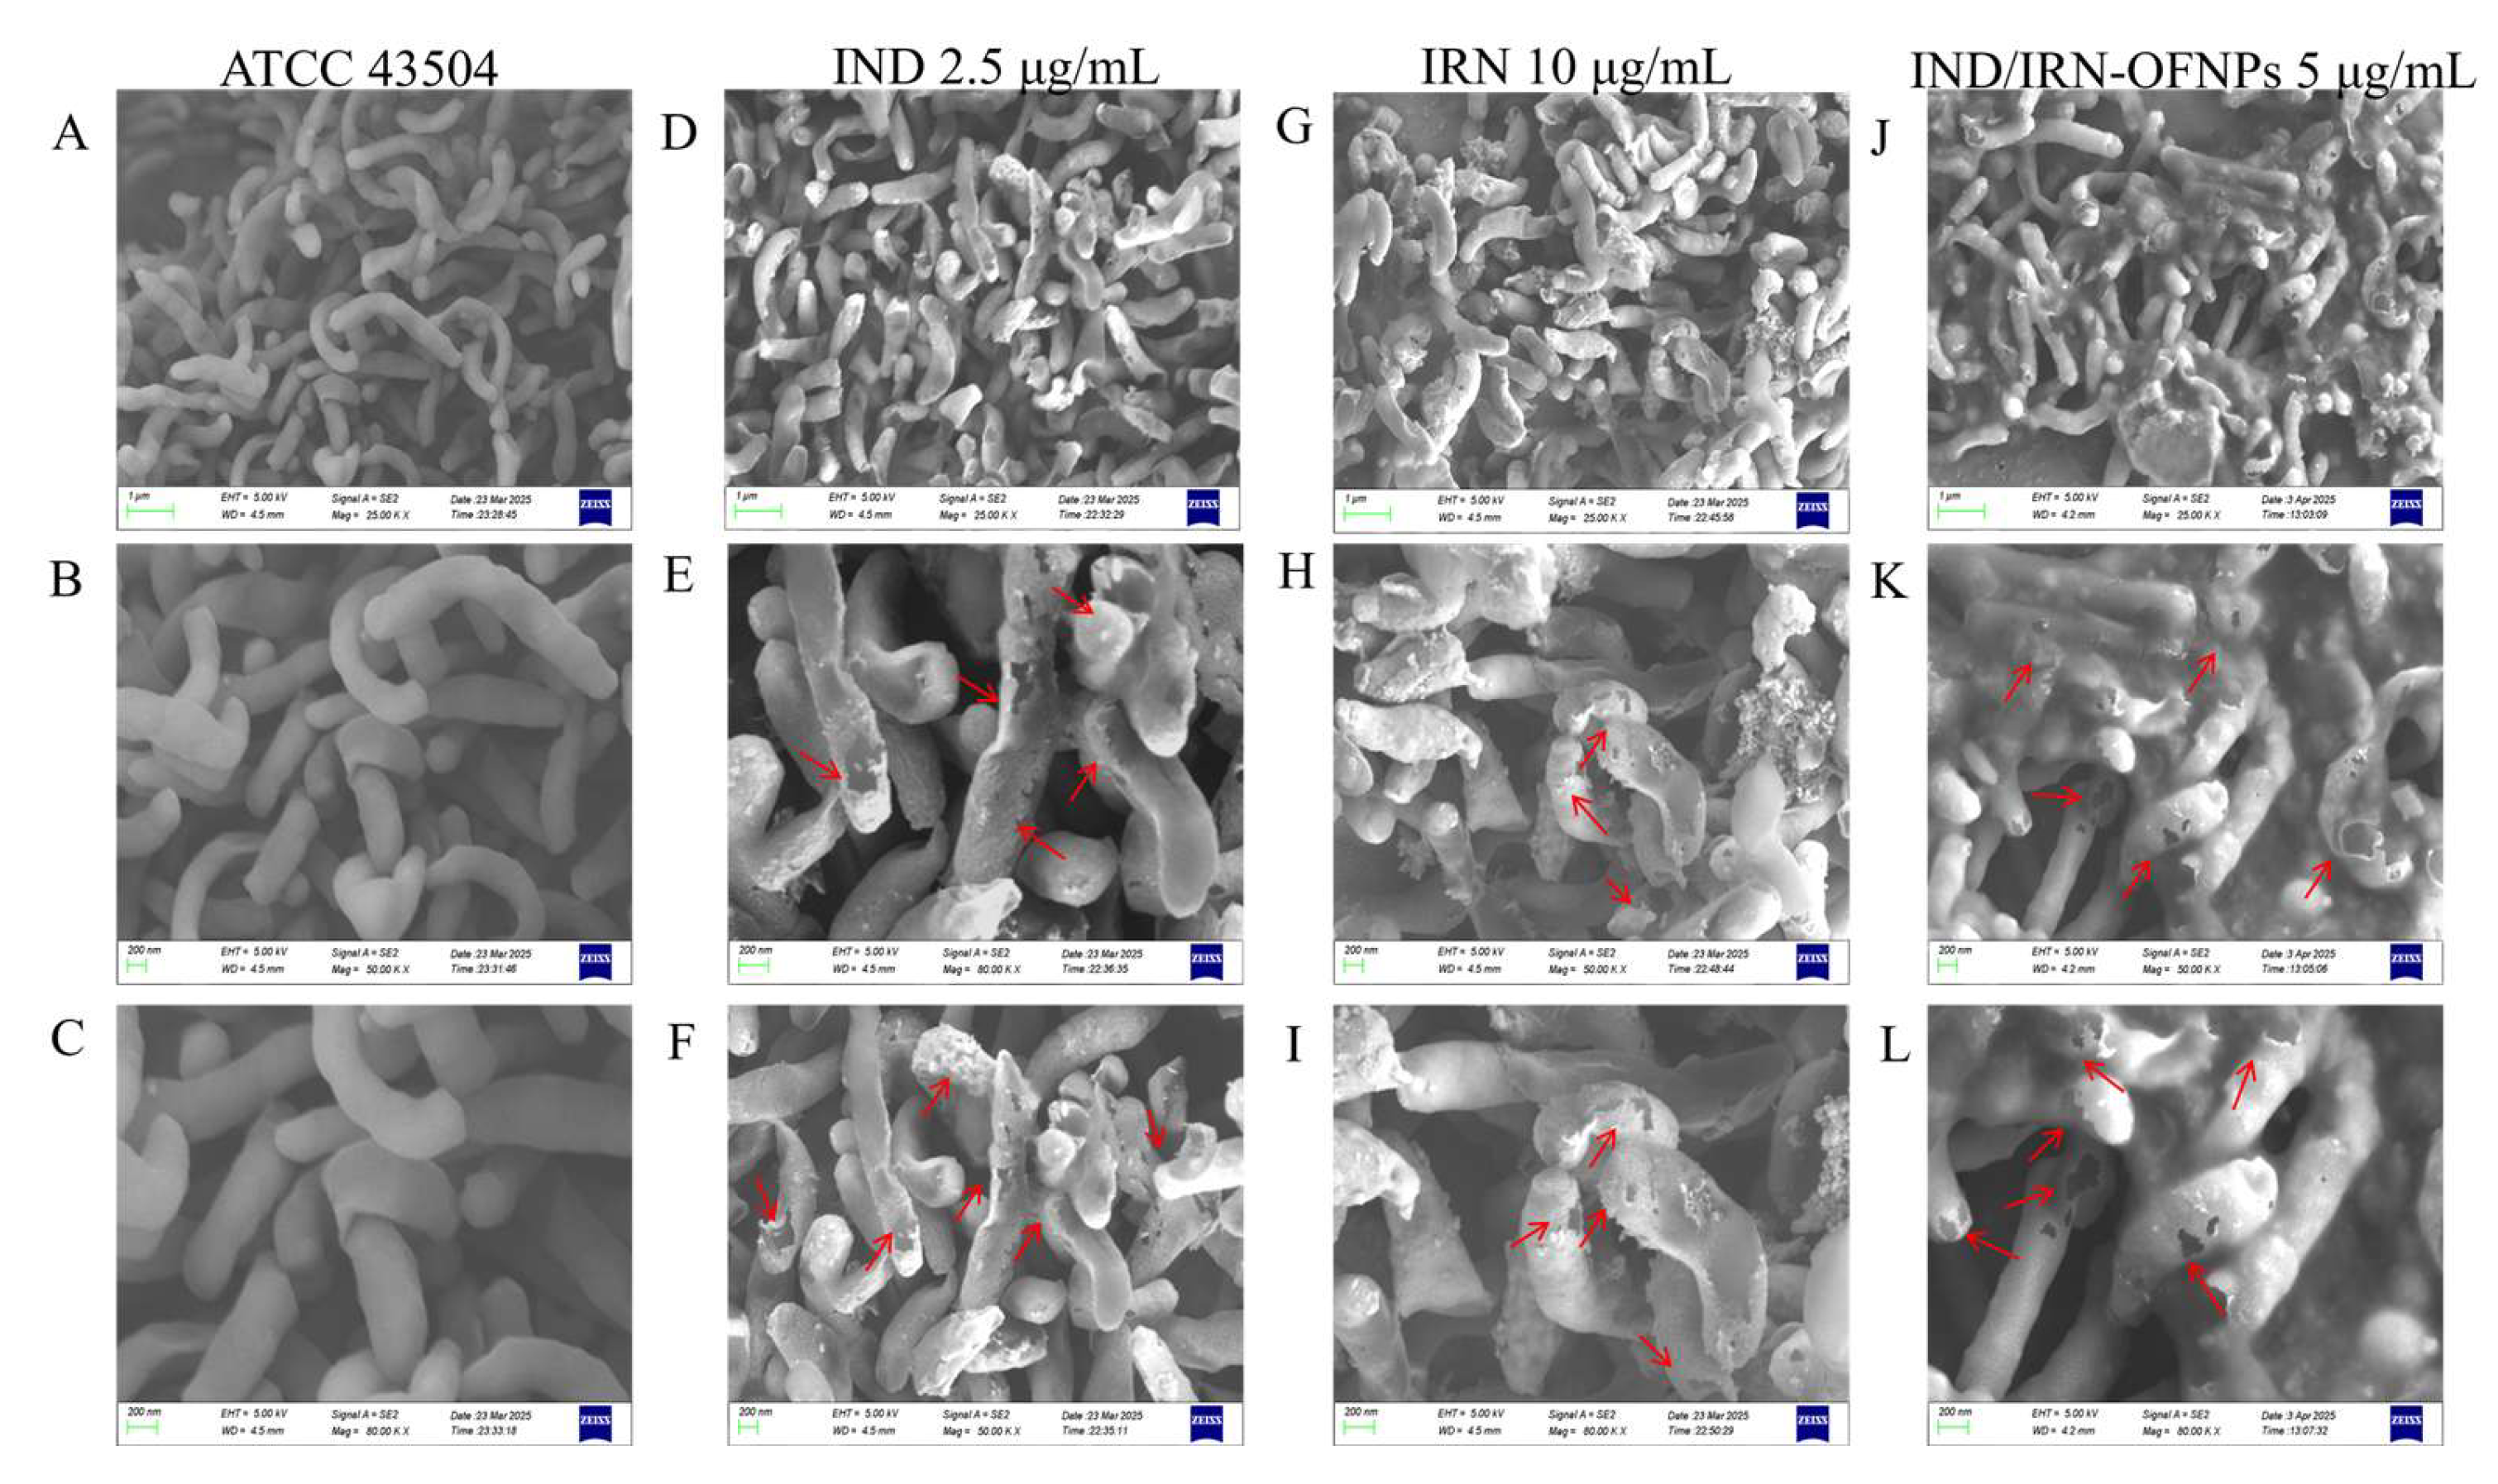
Figure 7.
Venn diagram of potential targets of IND and IRN.
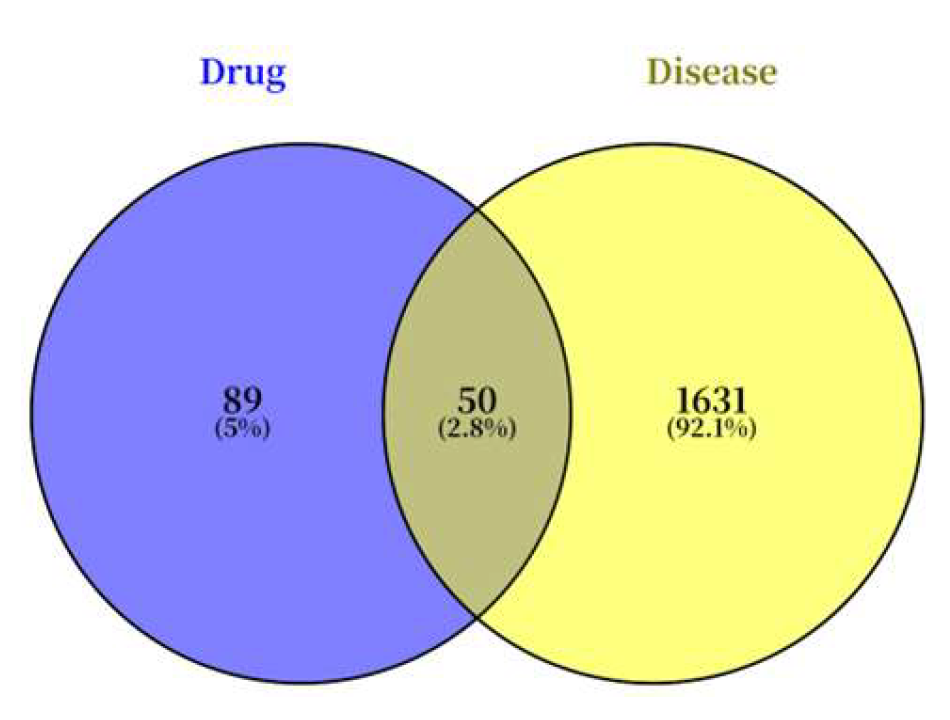
Figure 8.
Drug–Disease–Target Network.
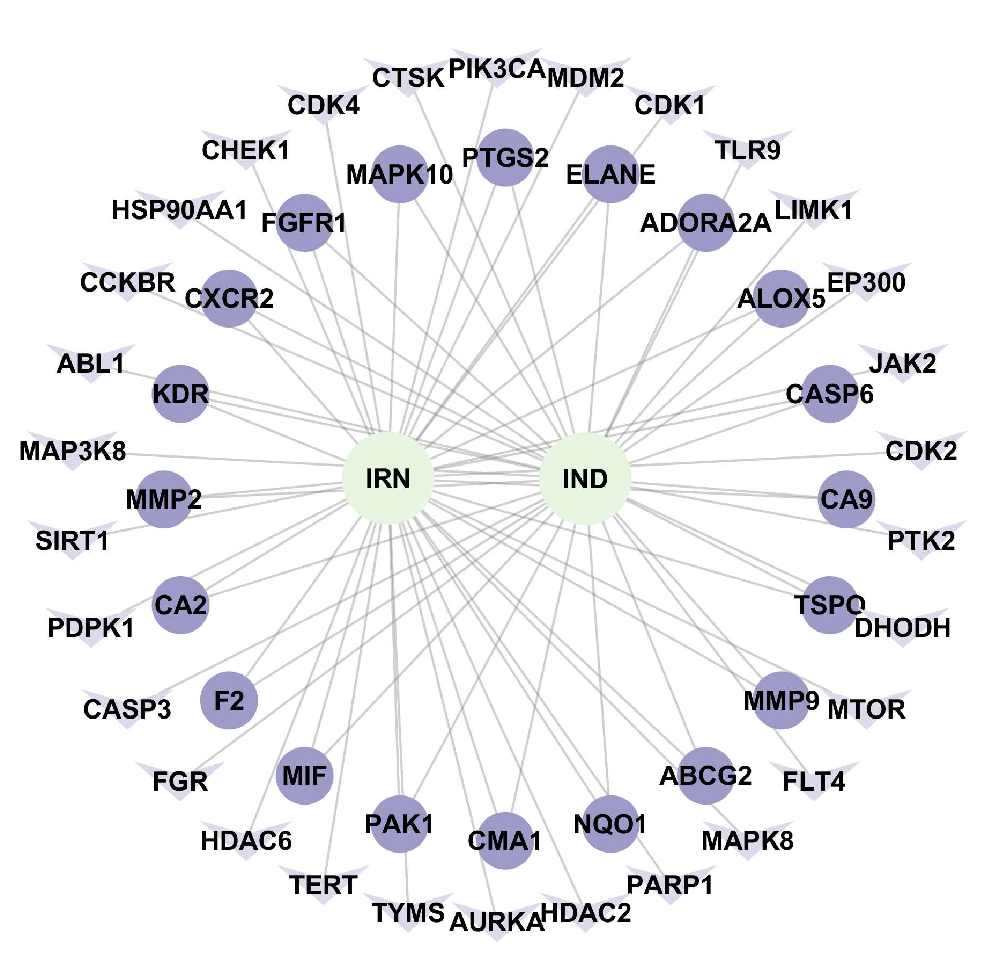
Figure 9.
PPI network.
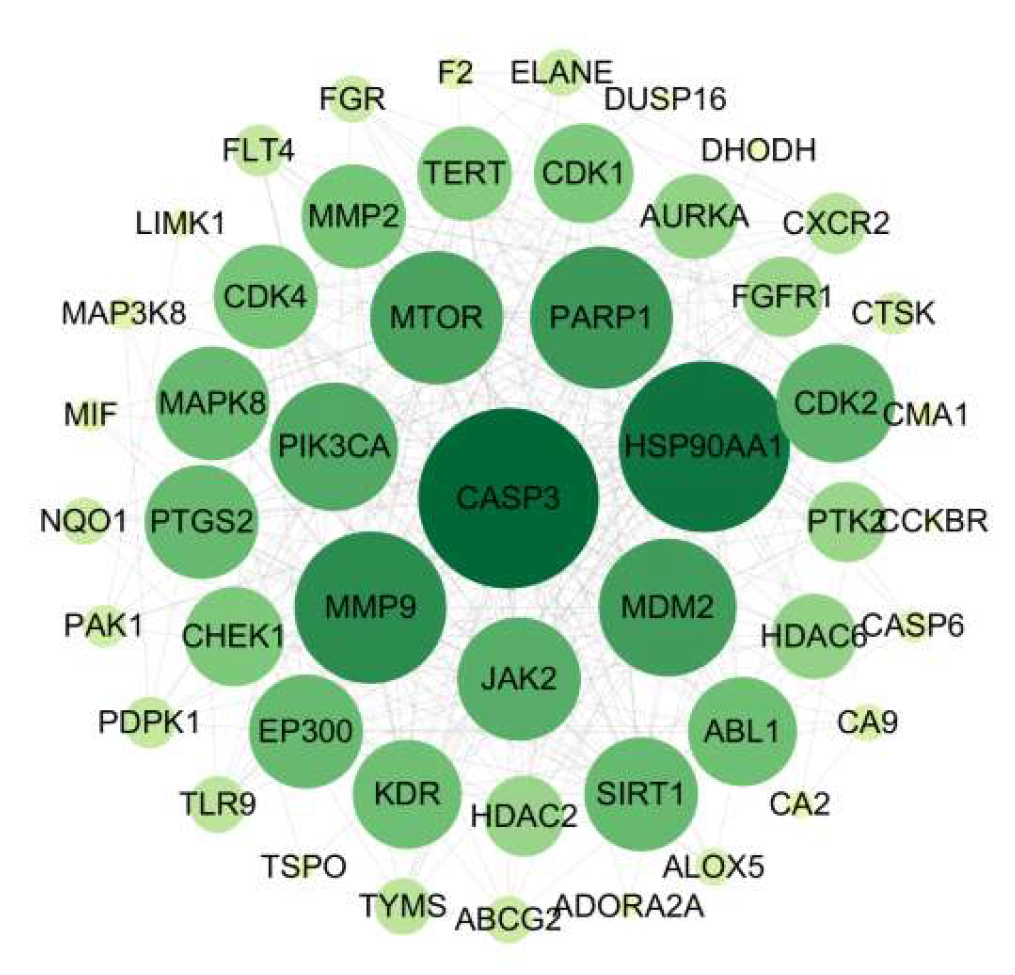
Figure 10.
(A) GO functional enrichment of core targets. (B) KEGG pathway enrichment of core targets.
Figure 10.
(A) GO functional enrichment of core targets. (B) KEGG pathway enrichment of core targets.
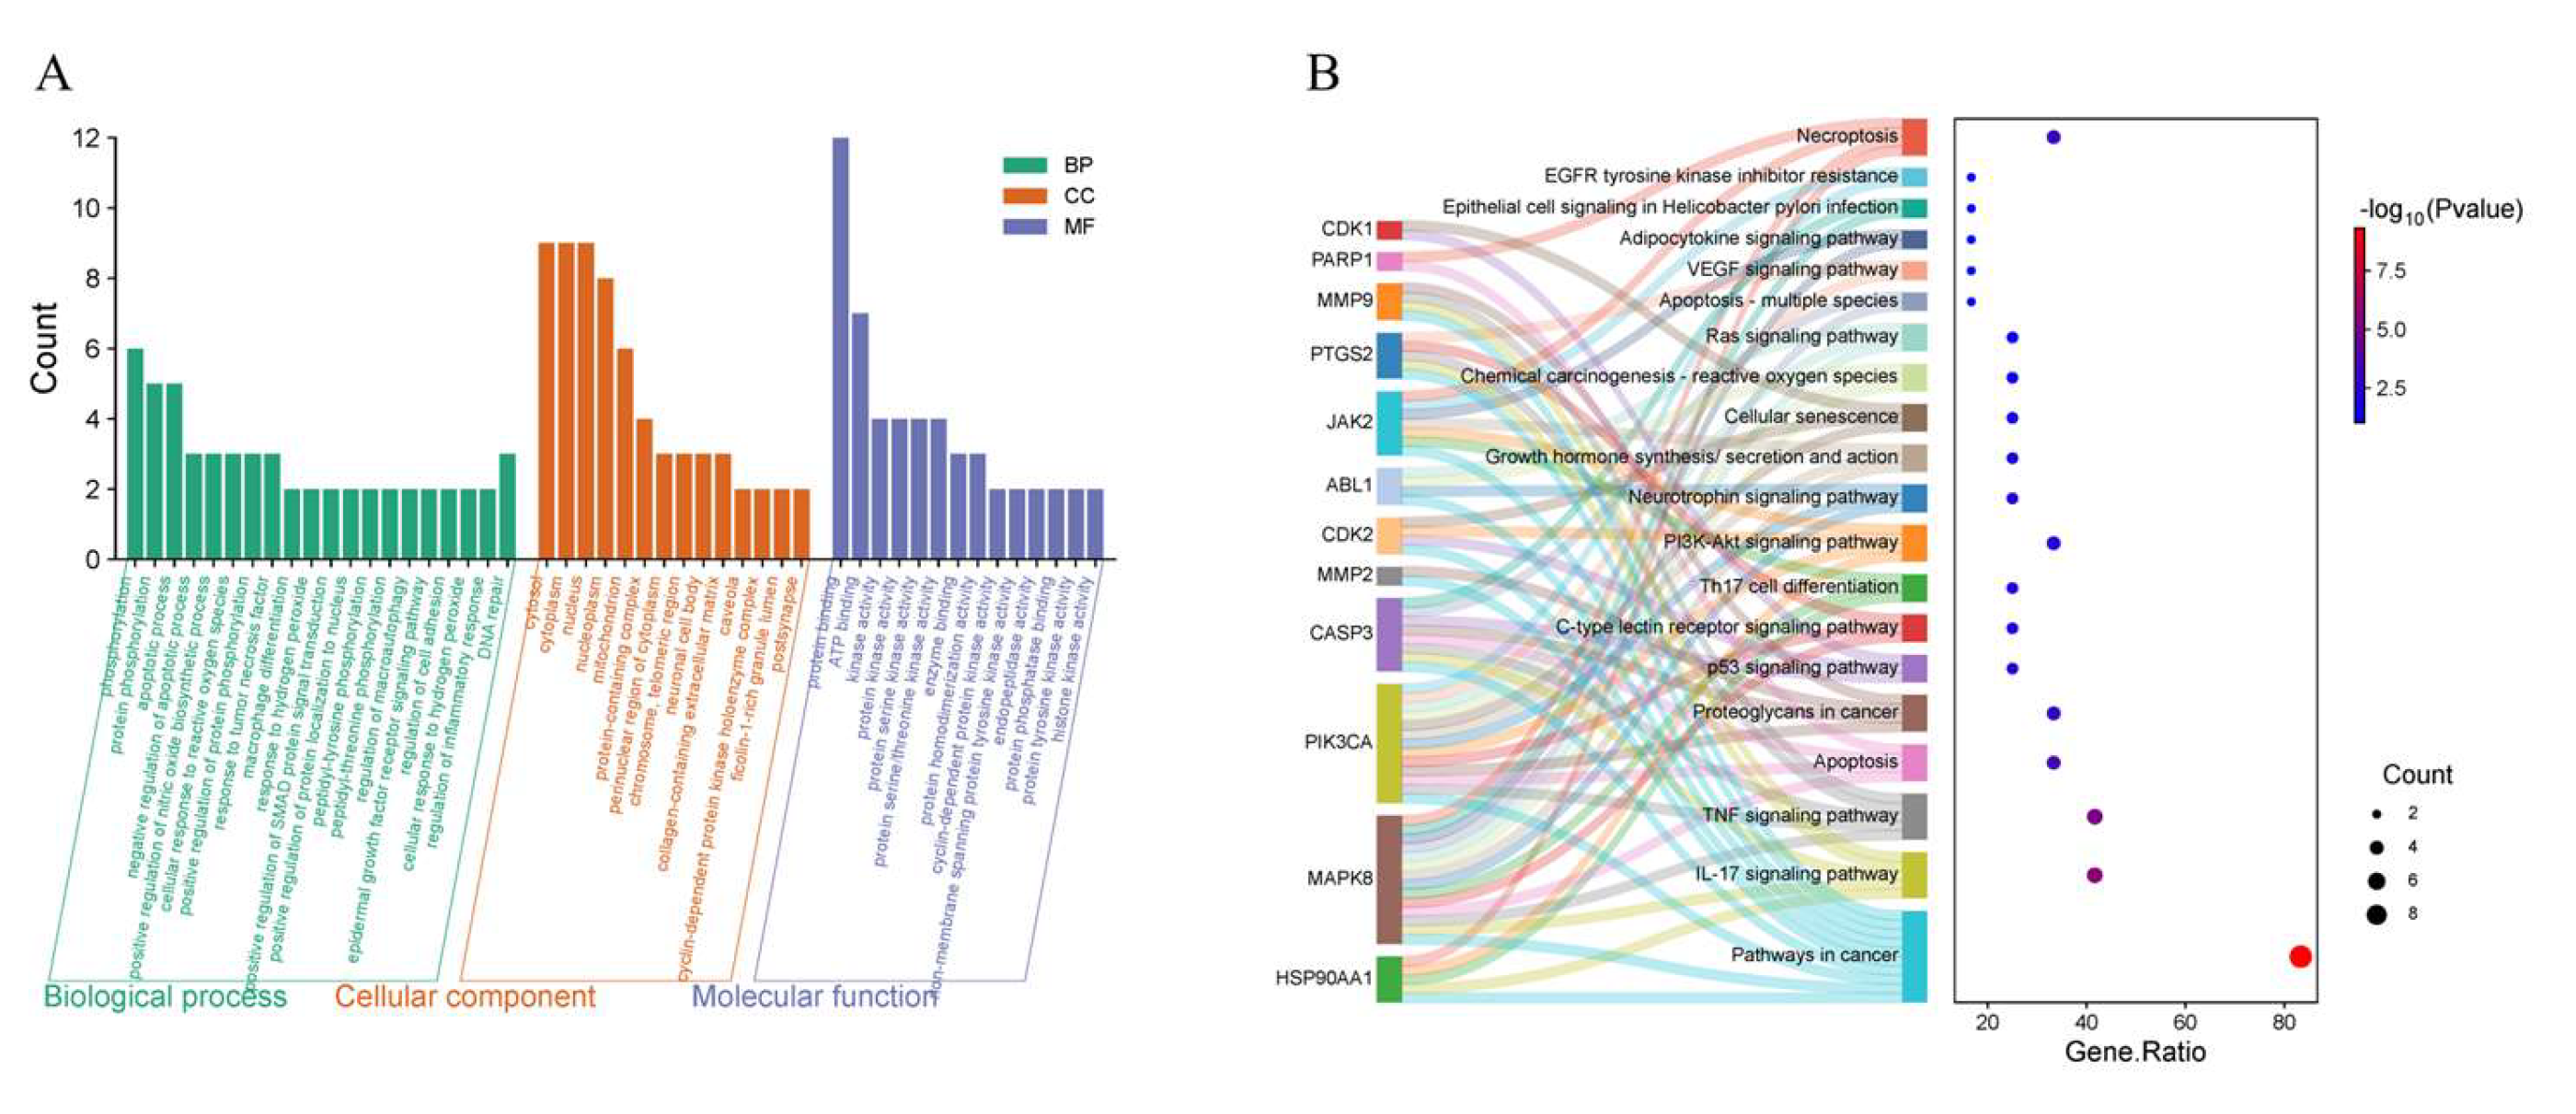
Figure 11.
Sankey diagram of core targets–BP/KEGG pathways, with 12 core targets on the left and the top 20 significantly enriched GO-BP and KEGG terms on the right.
Figure 11.
Sankey diagram of core targets–BP/KEGG pathways, with 12 core targets on the left and the top 20 significantly enriched GO-BP and KEGG terms on the right.
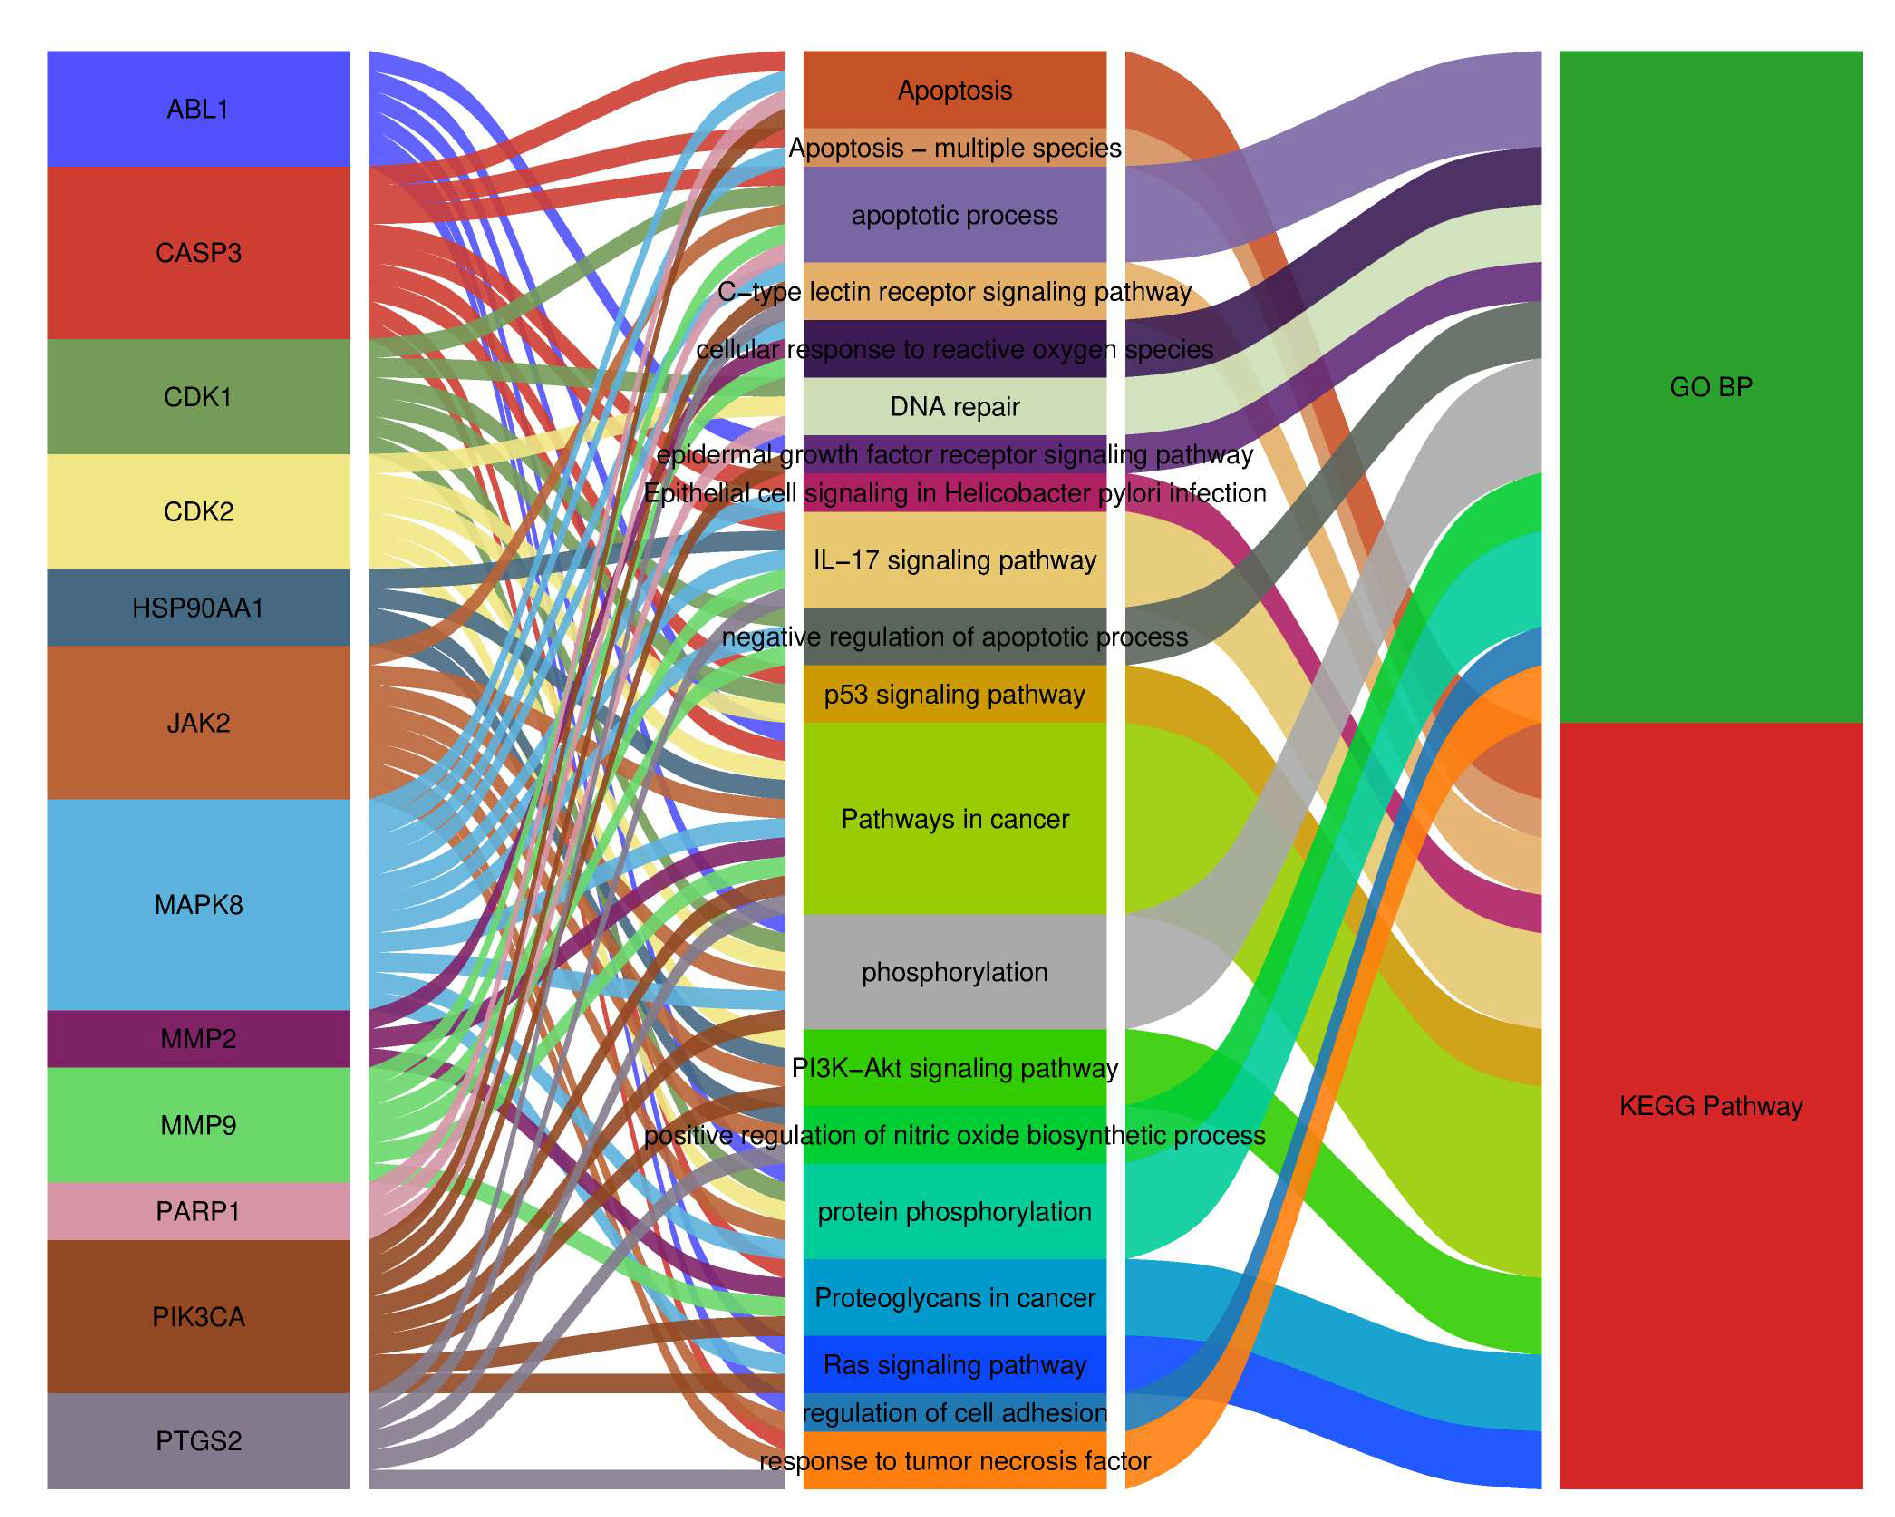
Figure 12.
(A) molecular docking models of IND with the top 5 core targets ranked by Degree. (B) molecular docking models of IRN with the top 5 core targets ranked by Degree.
Figure 12.
(A) molecular docking models of IND with the top 5 core targets ranked by Degree. (B) molecular docking models of IRN with the top 5 core targets ranked by Degree.

Figure 13.
Expression of multiple Hp virulence factors after 12 h treatment under MIC conditions with IND, IRN, or IND/IRN-OFNPs. *P < 0.05, **P < 0.01 compared with the control.
Figure 13.
Expression of multiple Hp virulence factors after 12 h treatment under MIC conditions with IND, IRN, or IND/IRN-OFNPs. *P < 0.05, **P < 0.01 compared with the control.
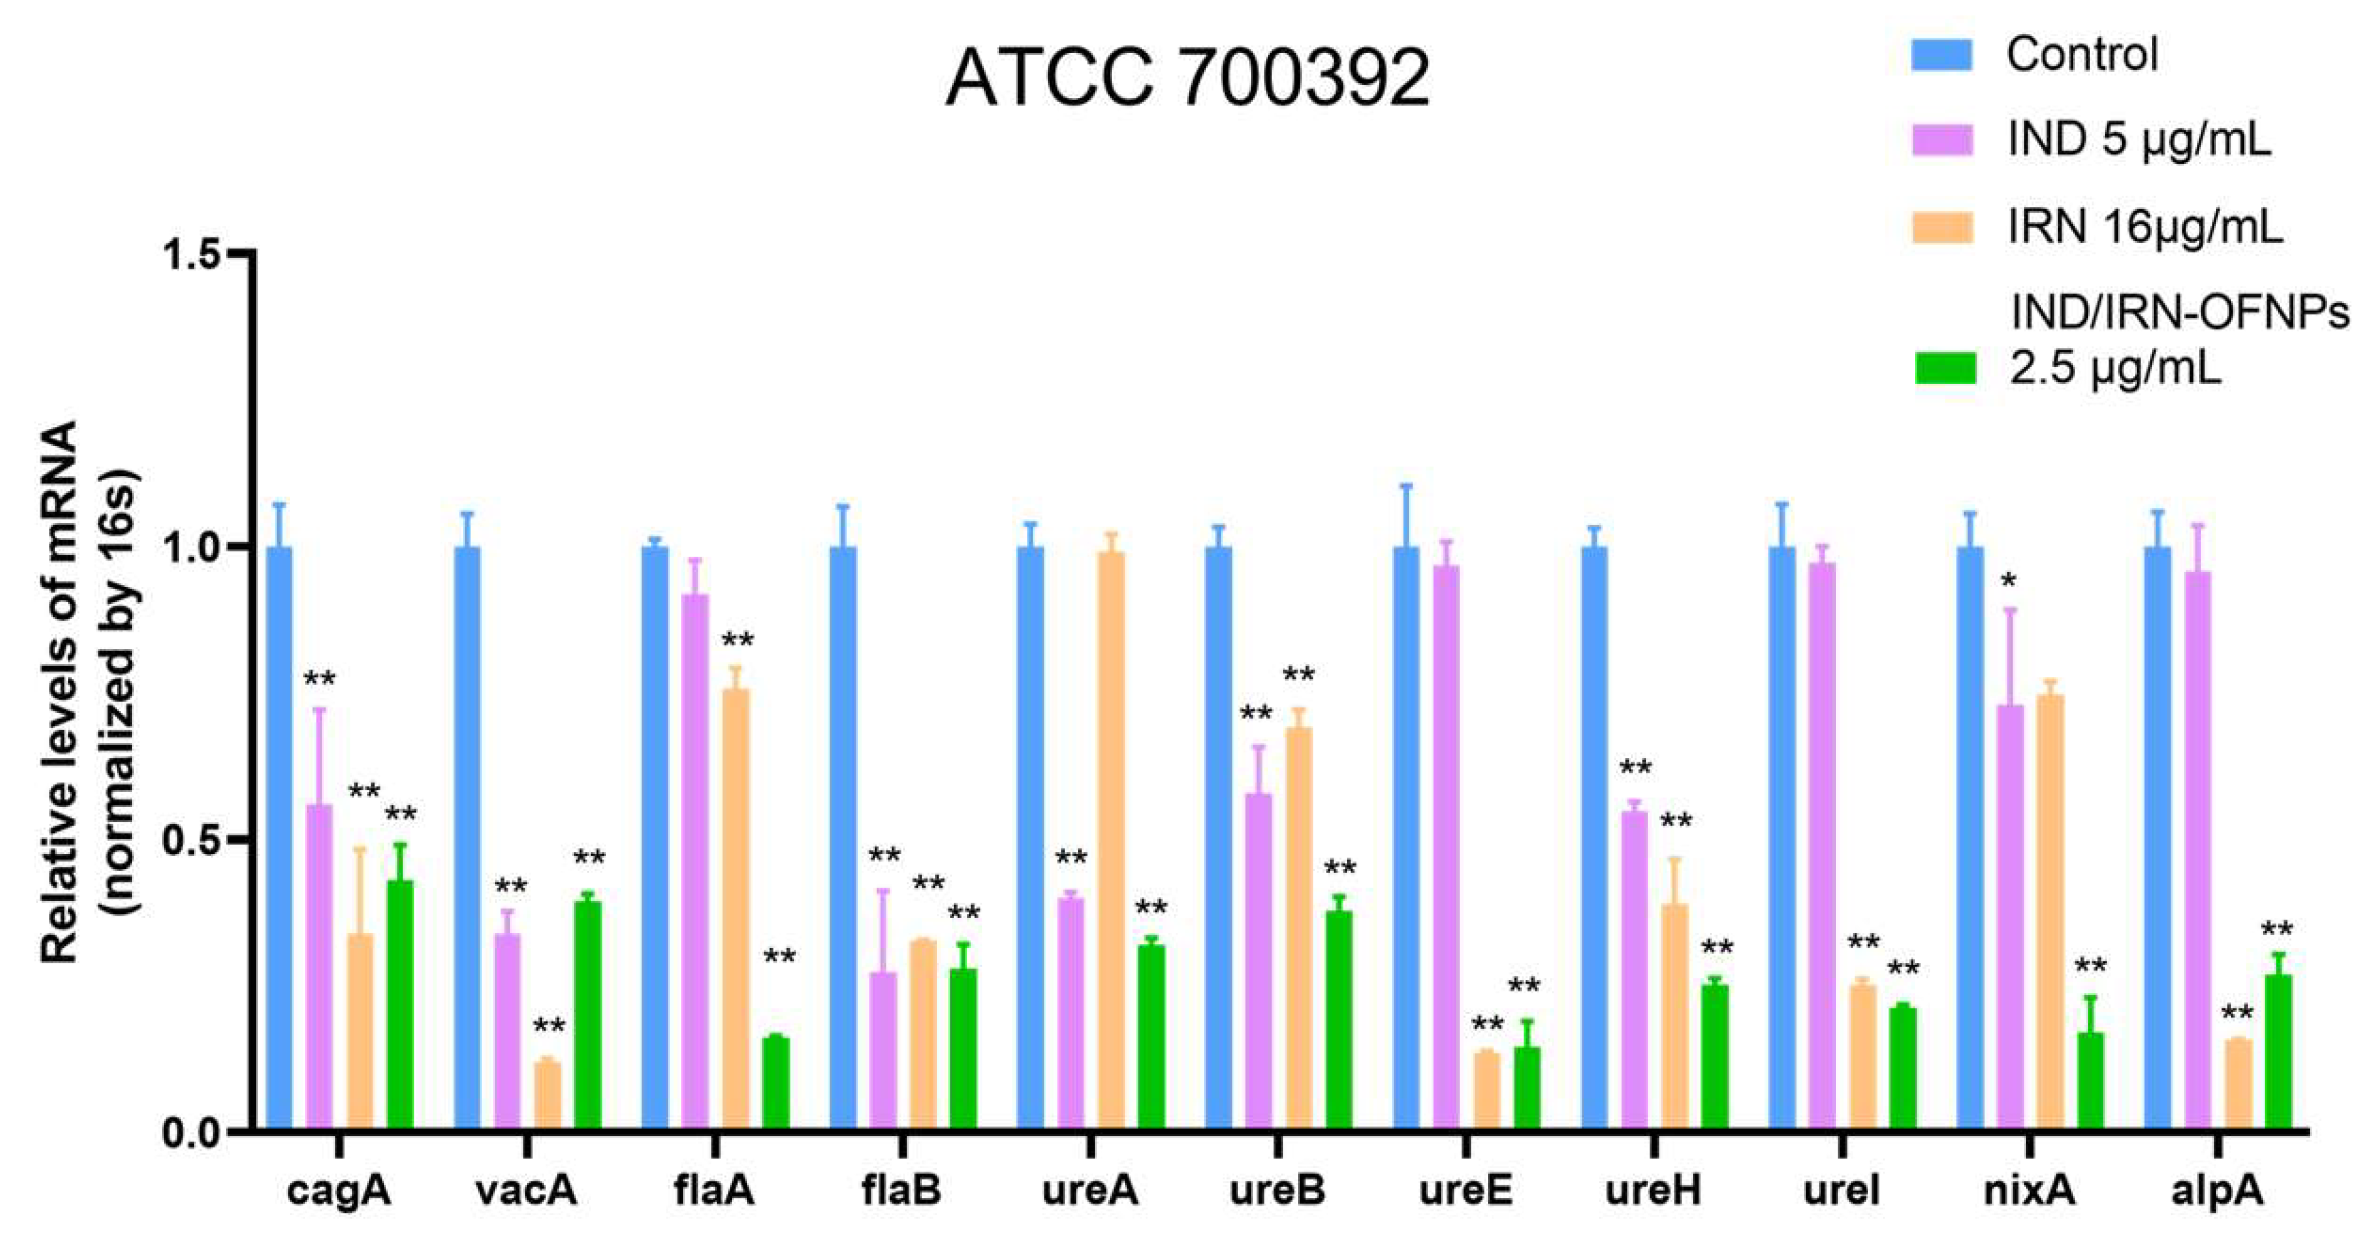
Figure 14.
(A, B) Effects of IND and IRN on urease activity of ATCC 700392. (C, D) Effects of IND/IRN-OFNPs on urease activity of ATCC 700392. (E, F) Effects of IND and IRN on urease activity of ATCC 43504. (G, H) Effects of IND/IRN-OFNPs on urease activity of ATCC 43504. *P < 0.05, **P < 0.01, ***P < 0.001, ****P < 0.0001 compared with the control.
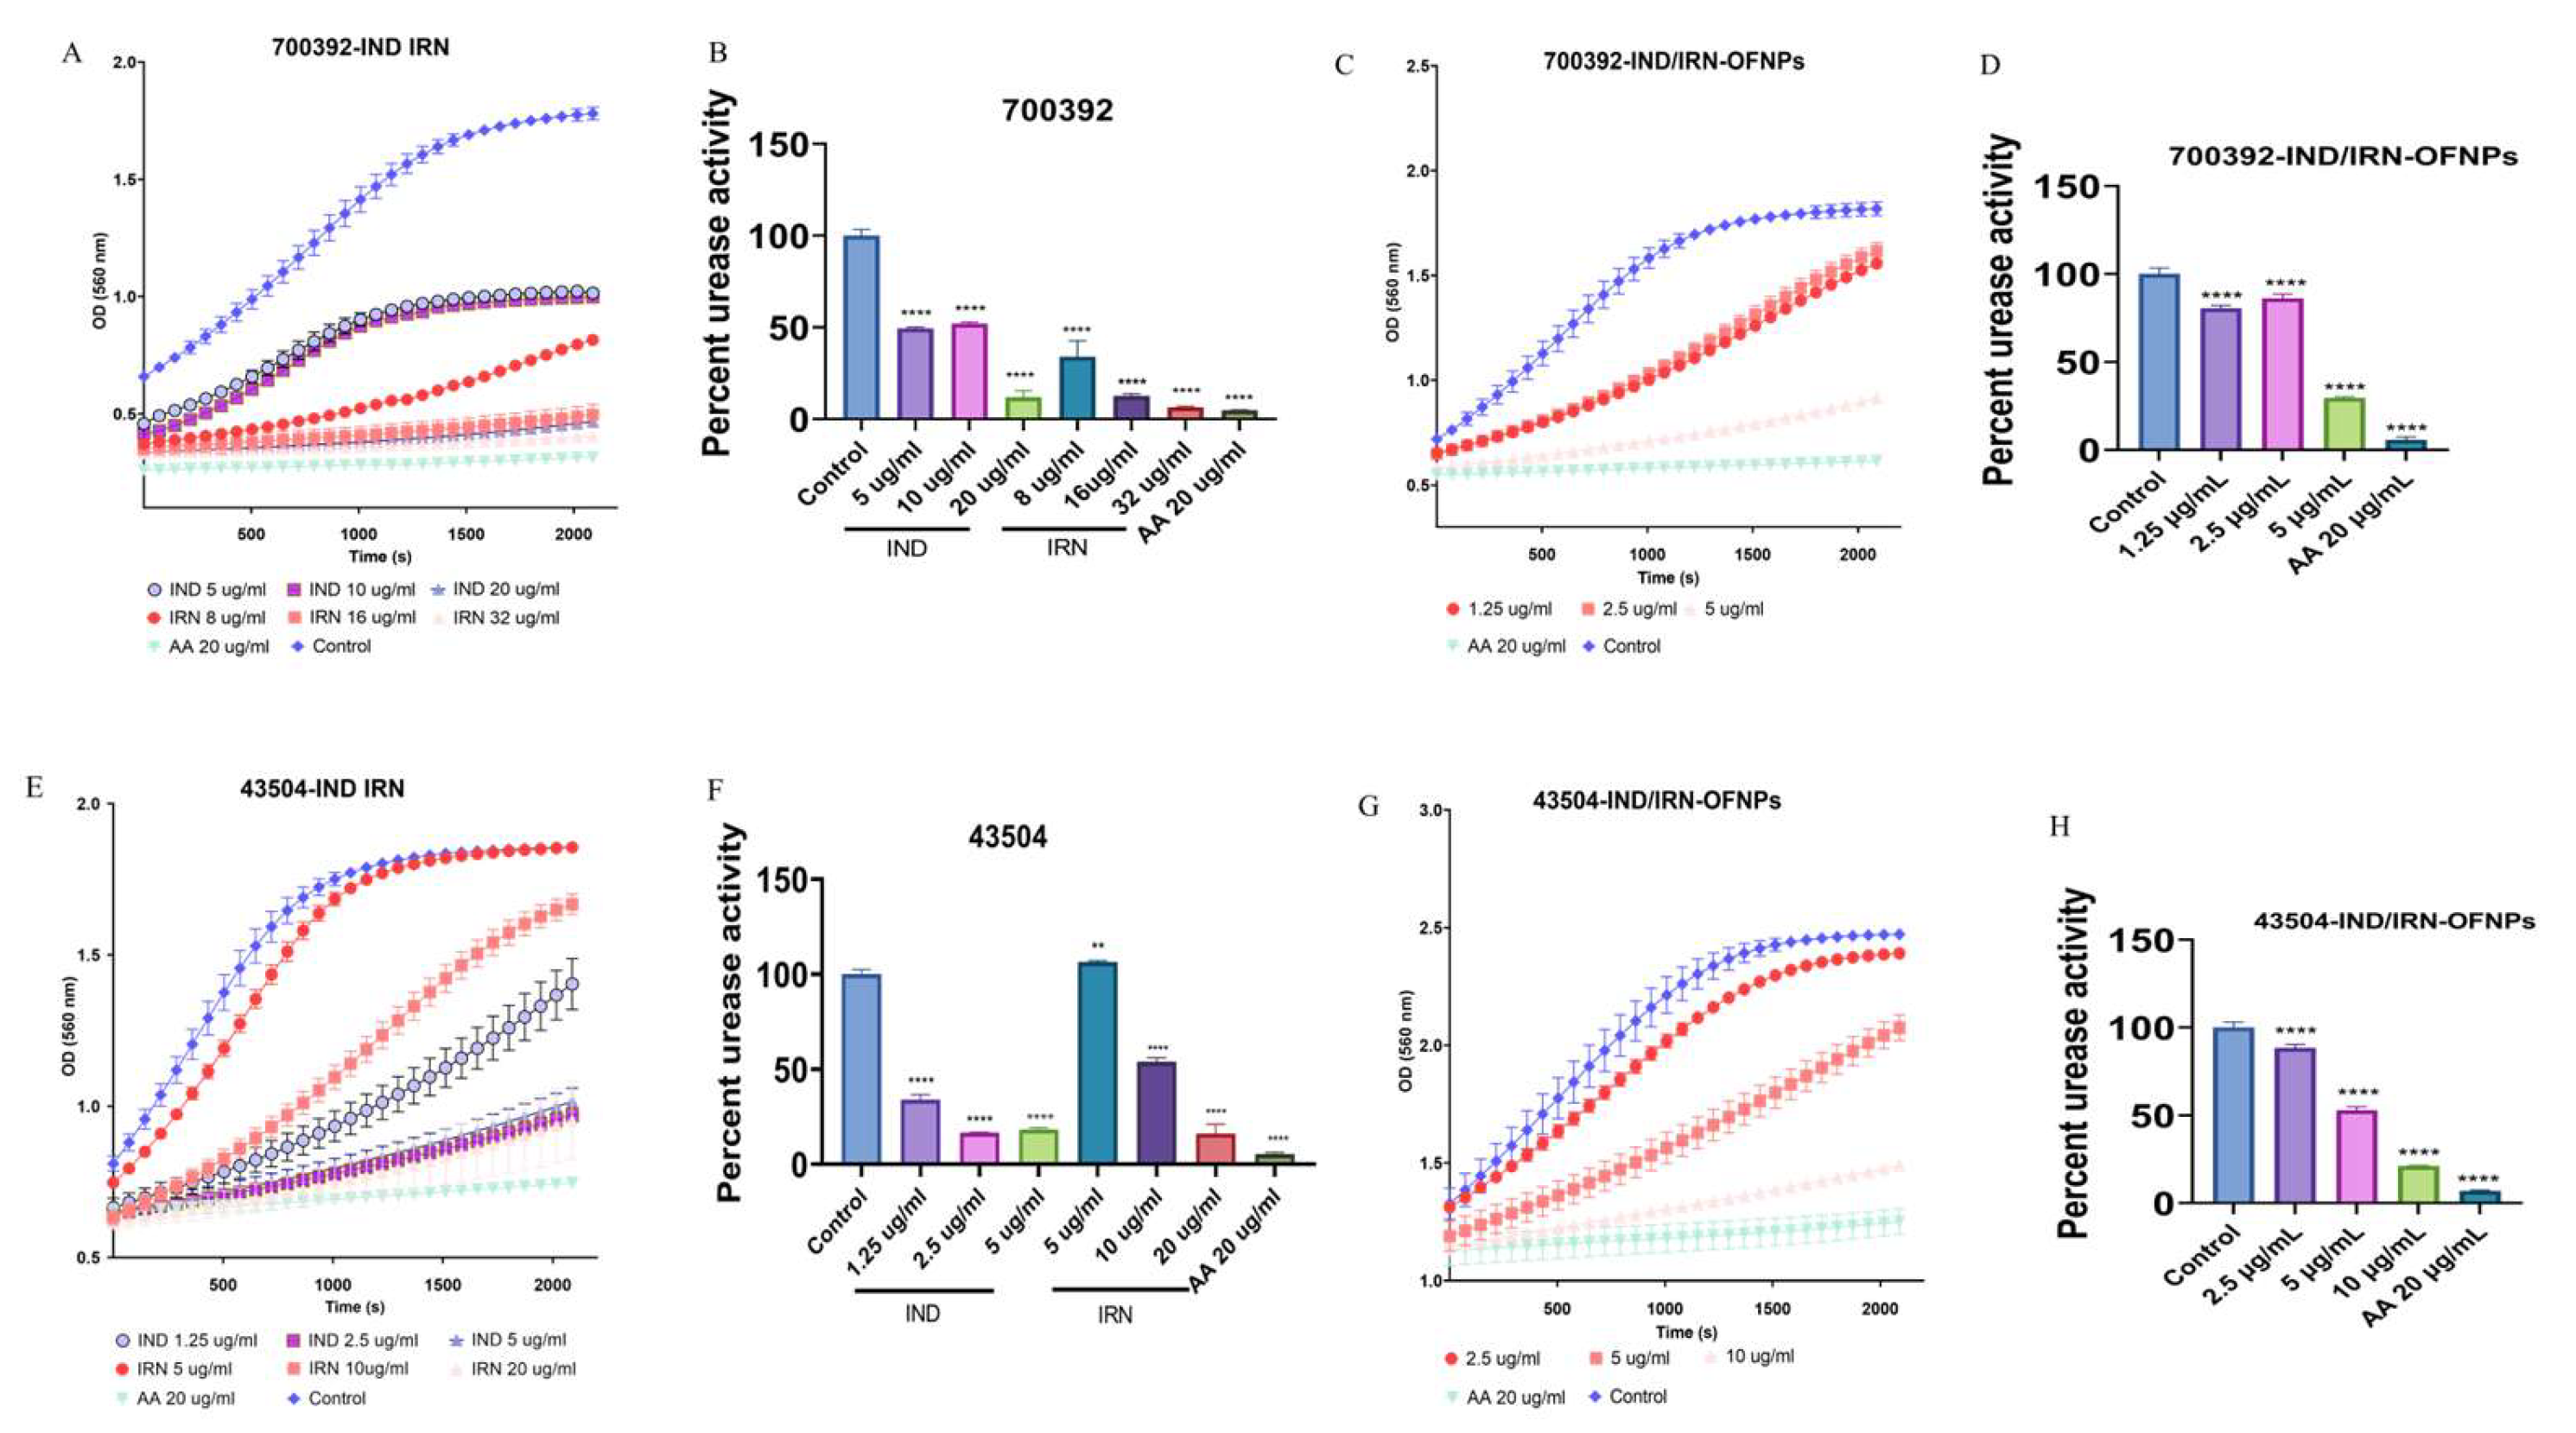
Figure 15.
(A) Representative Western blot images showing CagA protein expression in Hp treated with different concentrations (1/2× MIC, MIC, and 2× MIC) of IND, IRN, and IND/IRN-OFNPs. (B) Quantitative analysis of CagA protein expression in Hp following treatment with different concentrations (1/2× MIC, MIC, and 2× MIC) of IND, IRN, and IND/IRN-OFNPs. *P < 0.05, **P < 0.01, ***P < 0.001, ****P < 0.0001 compared with the control.
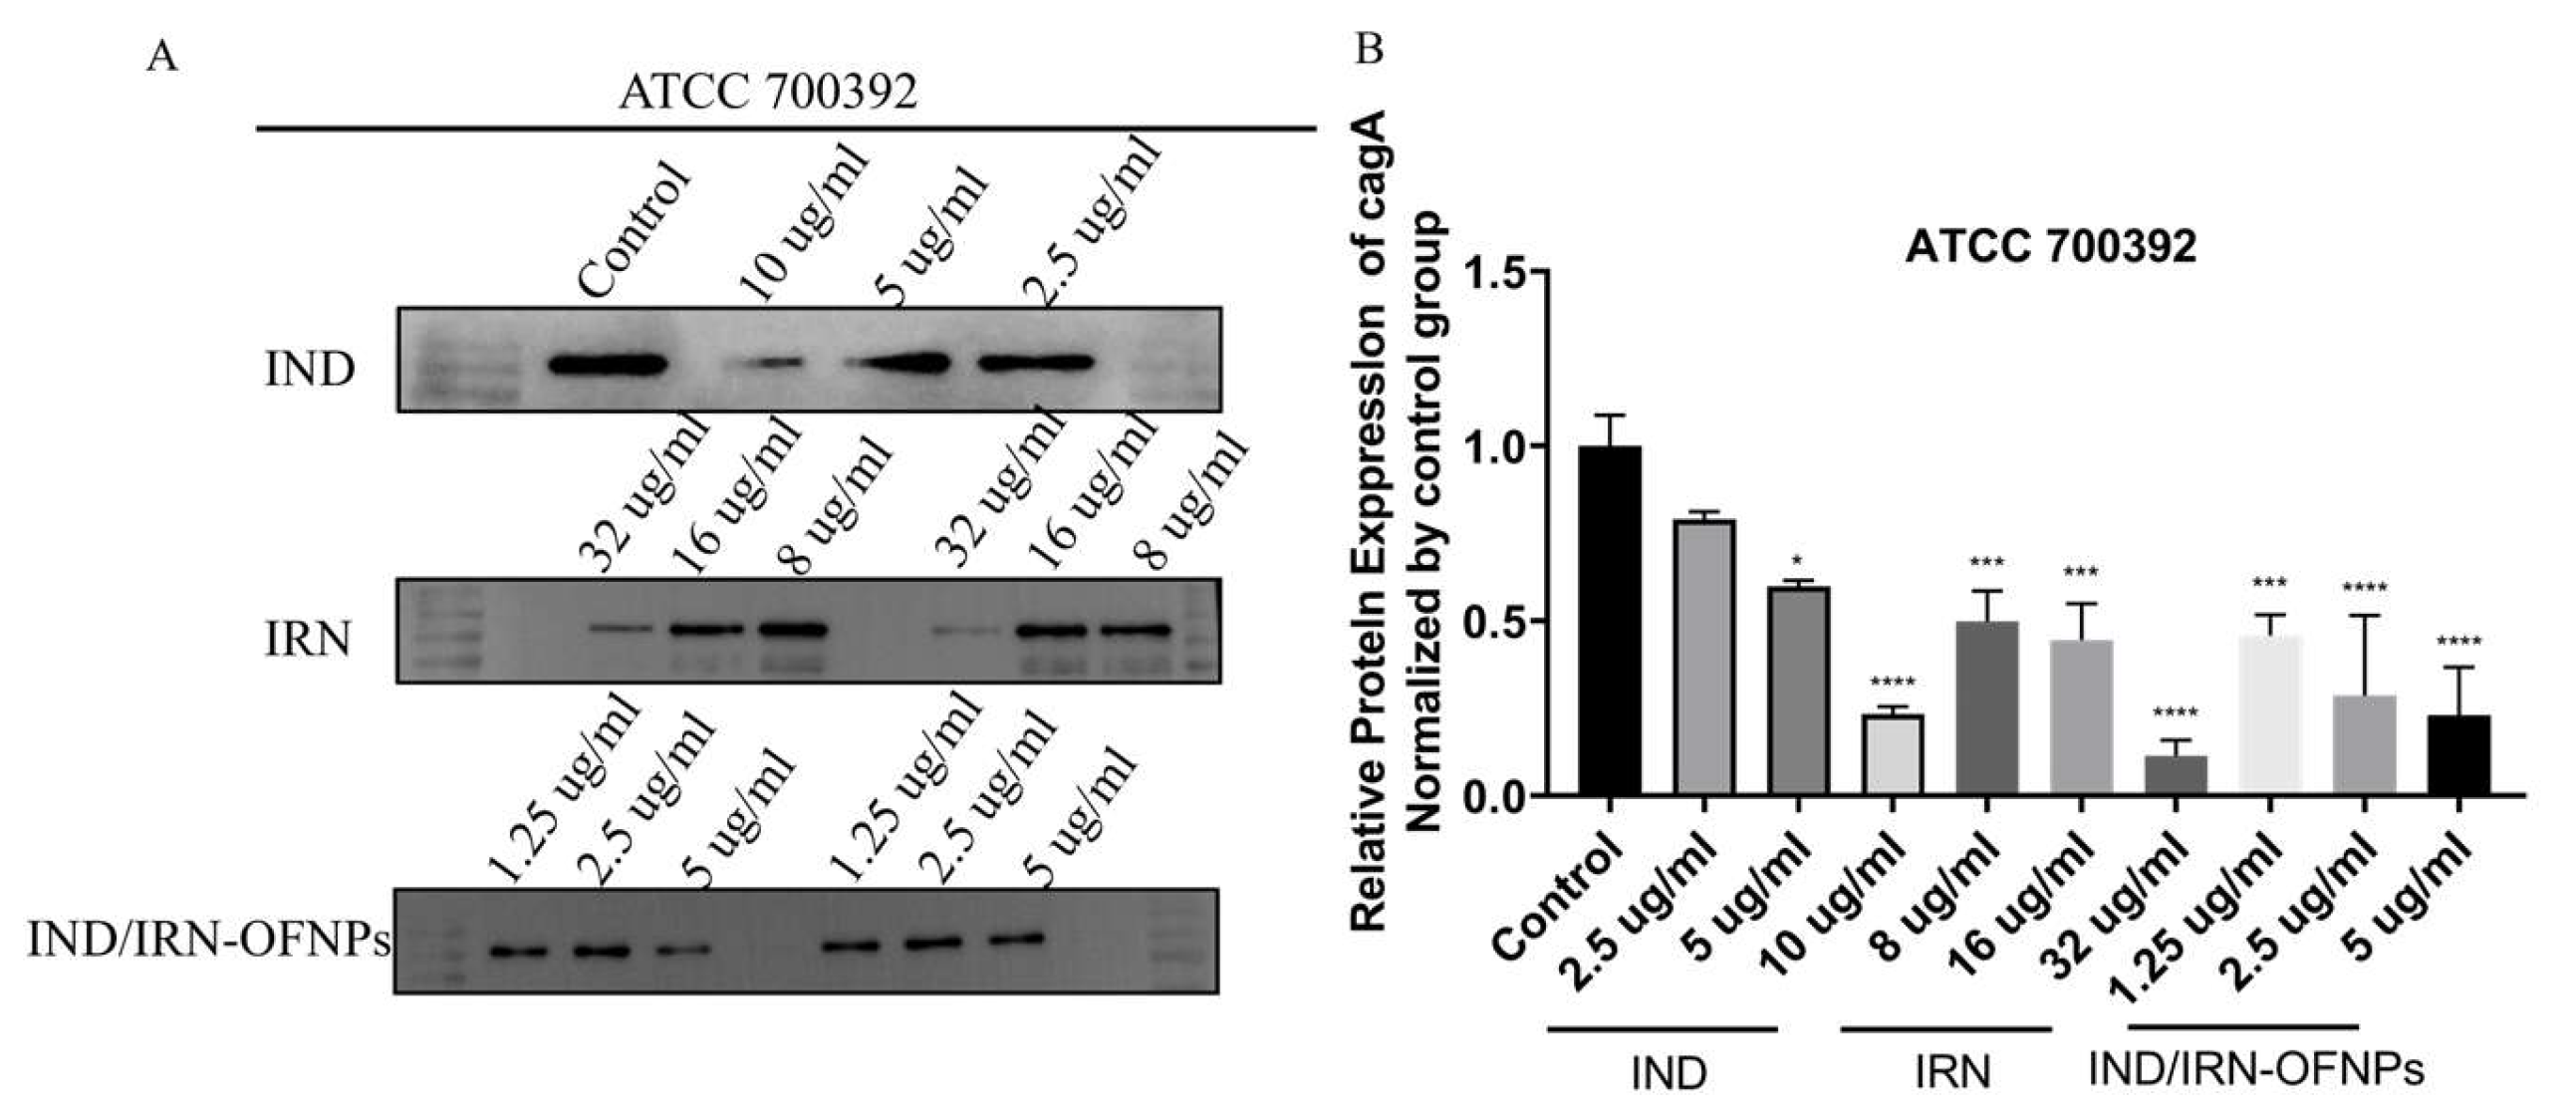
Figure 16.
(A) TIC of IND/IRN and IND/IRN-OFNPs groups. (B) TIC of QC samples from IND/IRN and IND/IRN-OFNPs groups. (C) Pearson correlation heatmap of QC samples. (D) RSD distribution histogram of QC samples. Symbols “+” and “−” indicate positive and negative ion modes, respectively.
Figure 16.
(A) TIC of IND/IRN and IND/IRN-OFNPs groups. (B) TIC of QC samples from IND/IRN and IND/IRN-OFNPs groups. (C) Pearson correlation heatmap of QC samples. (D) RSD distribution histogram of QC samples. Symbols “+” and “−” indicate positive and negative ion modes, respectively.
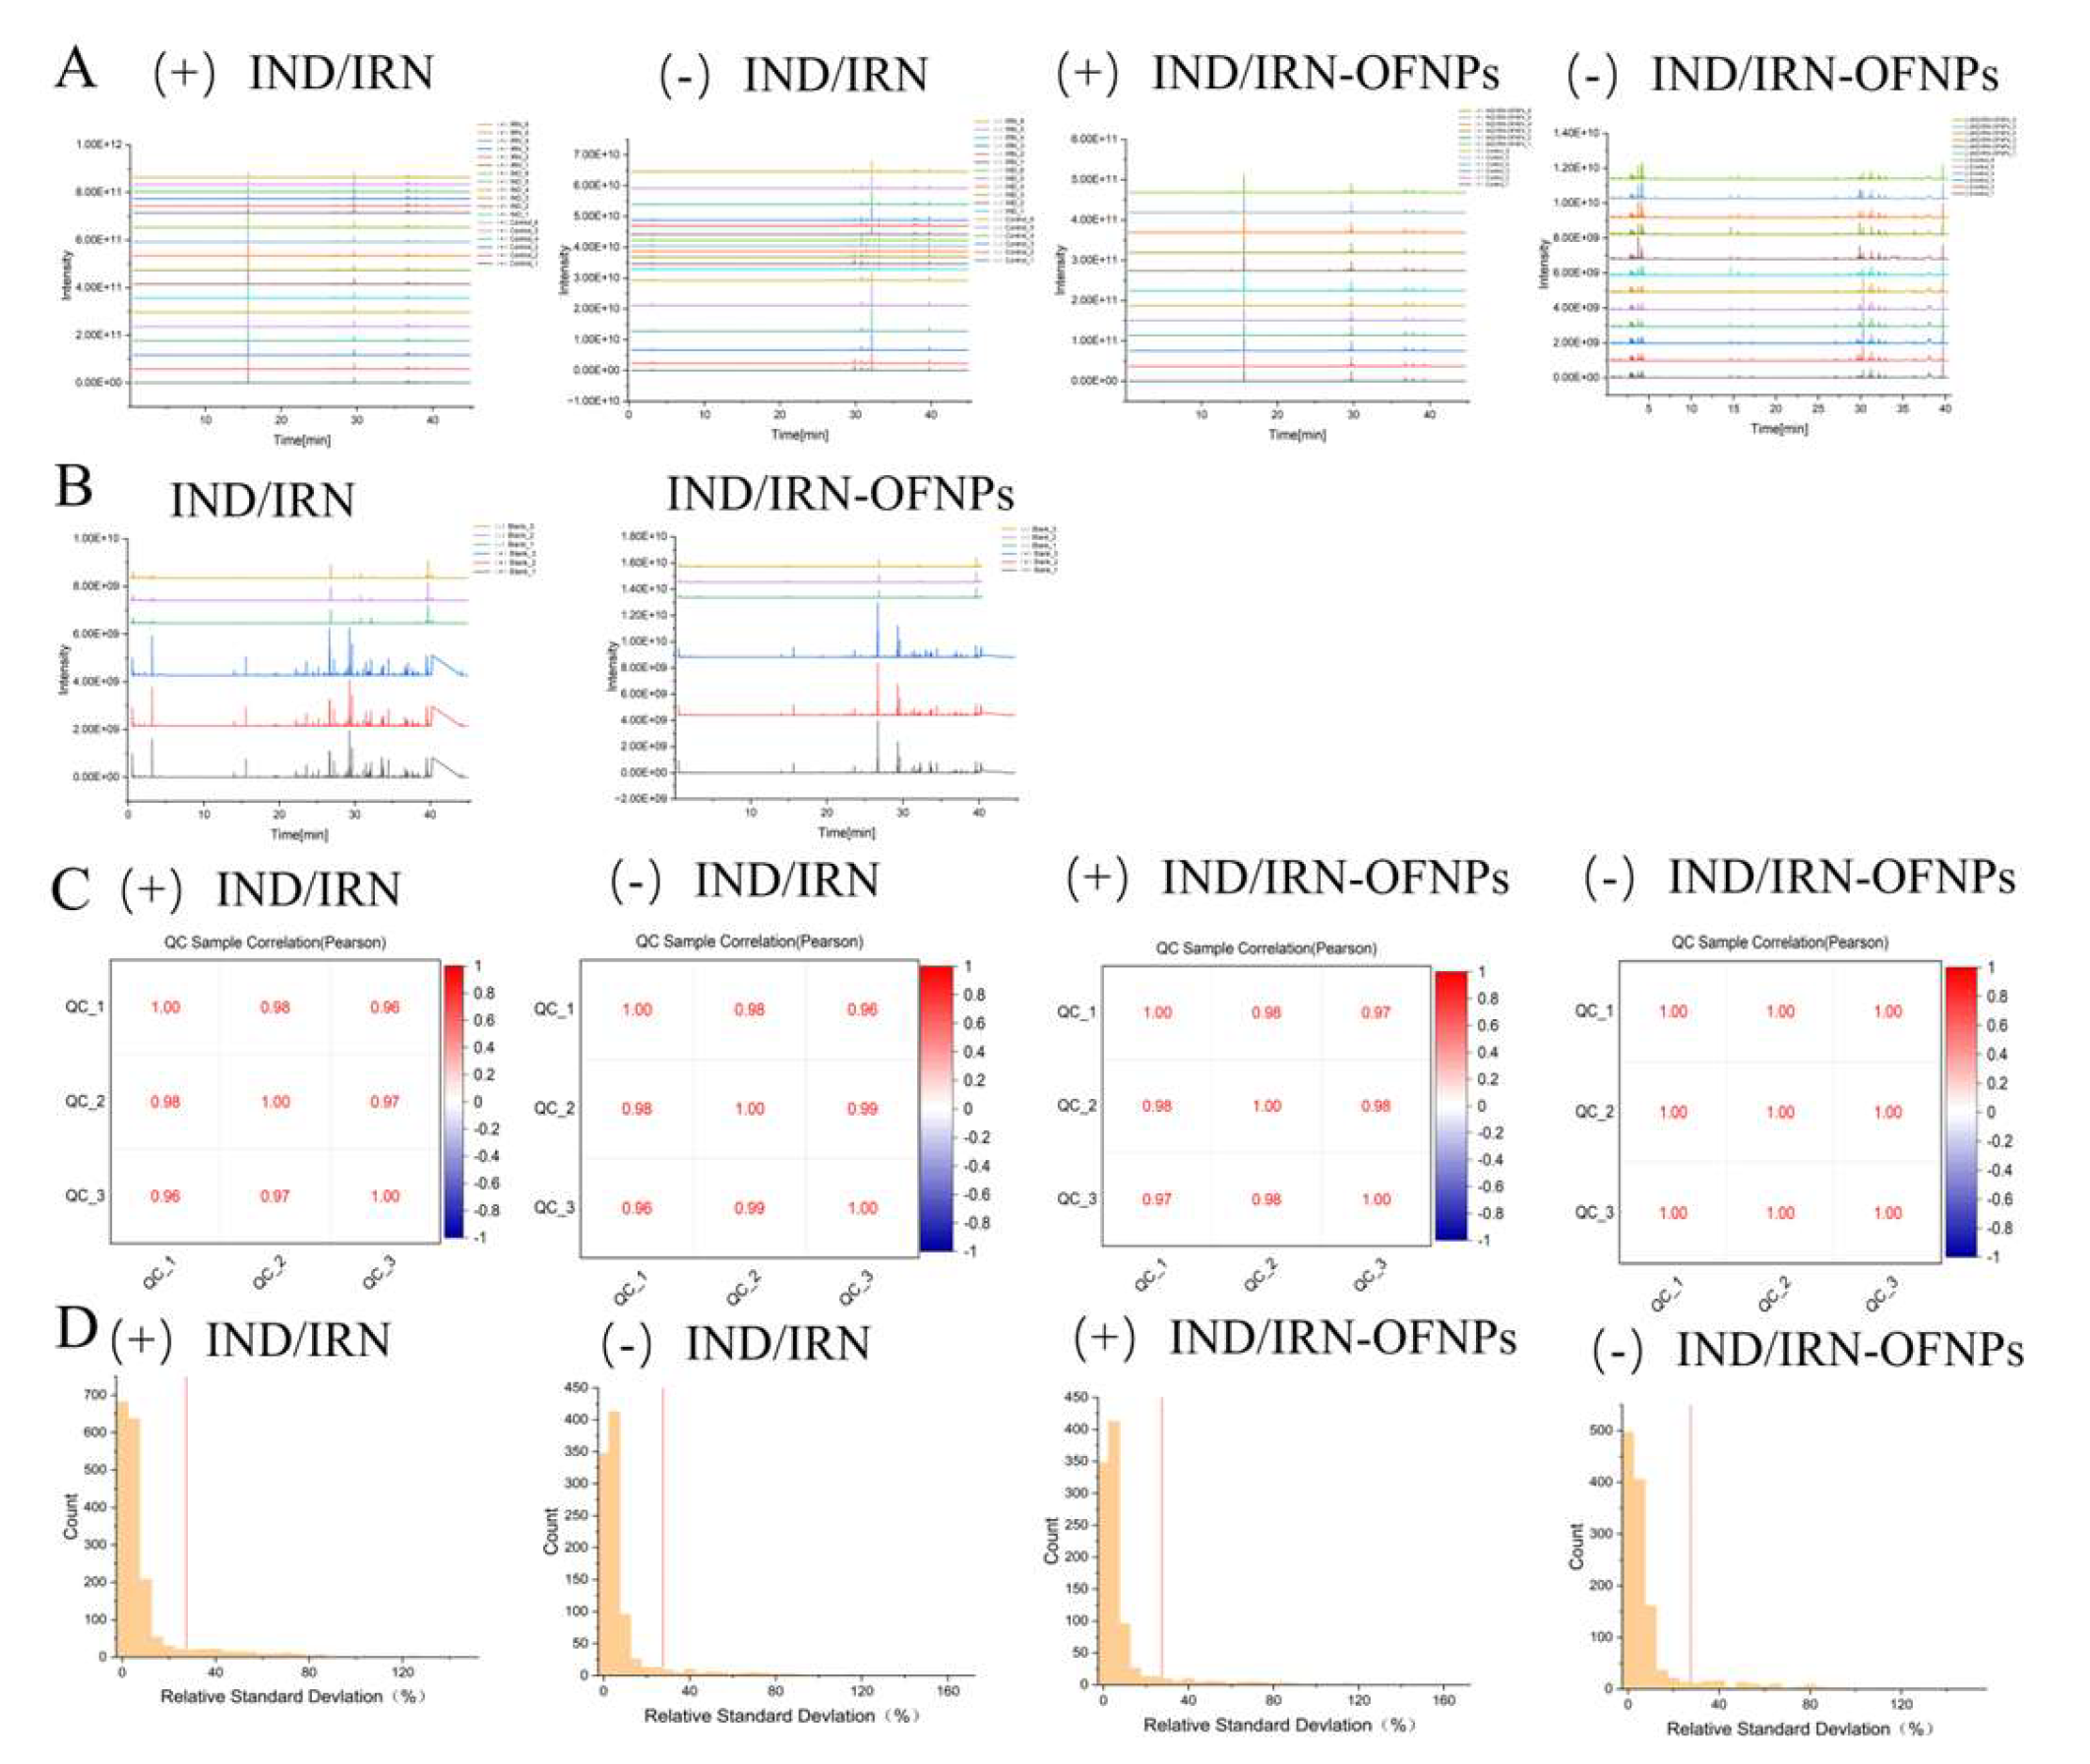
Figure 18.
(A) OPLS-DA score plots for each group, with red representing the control group and green representing the treatment group; (B) OPLS-DA model validation plots for each group; (C) OPLS-DA permutation test results for each group. Symbols “+” and “−” indicate positive and negative ion modes, respectively.
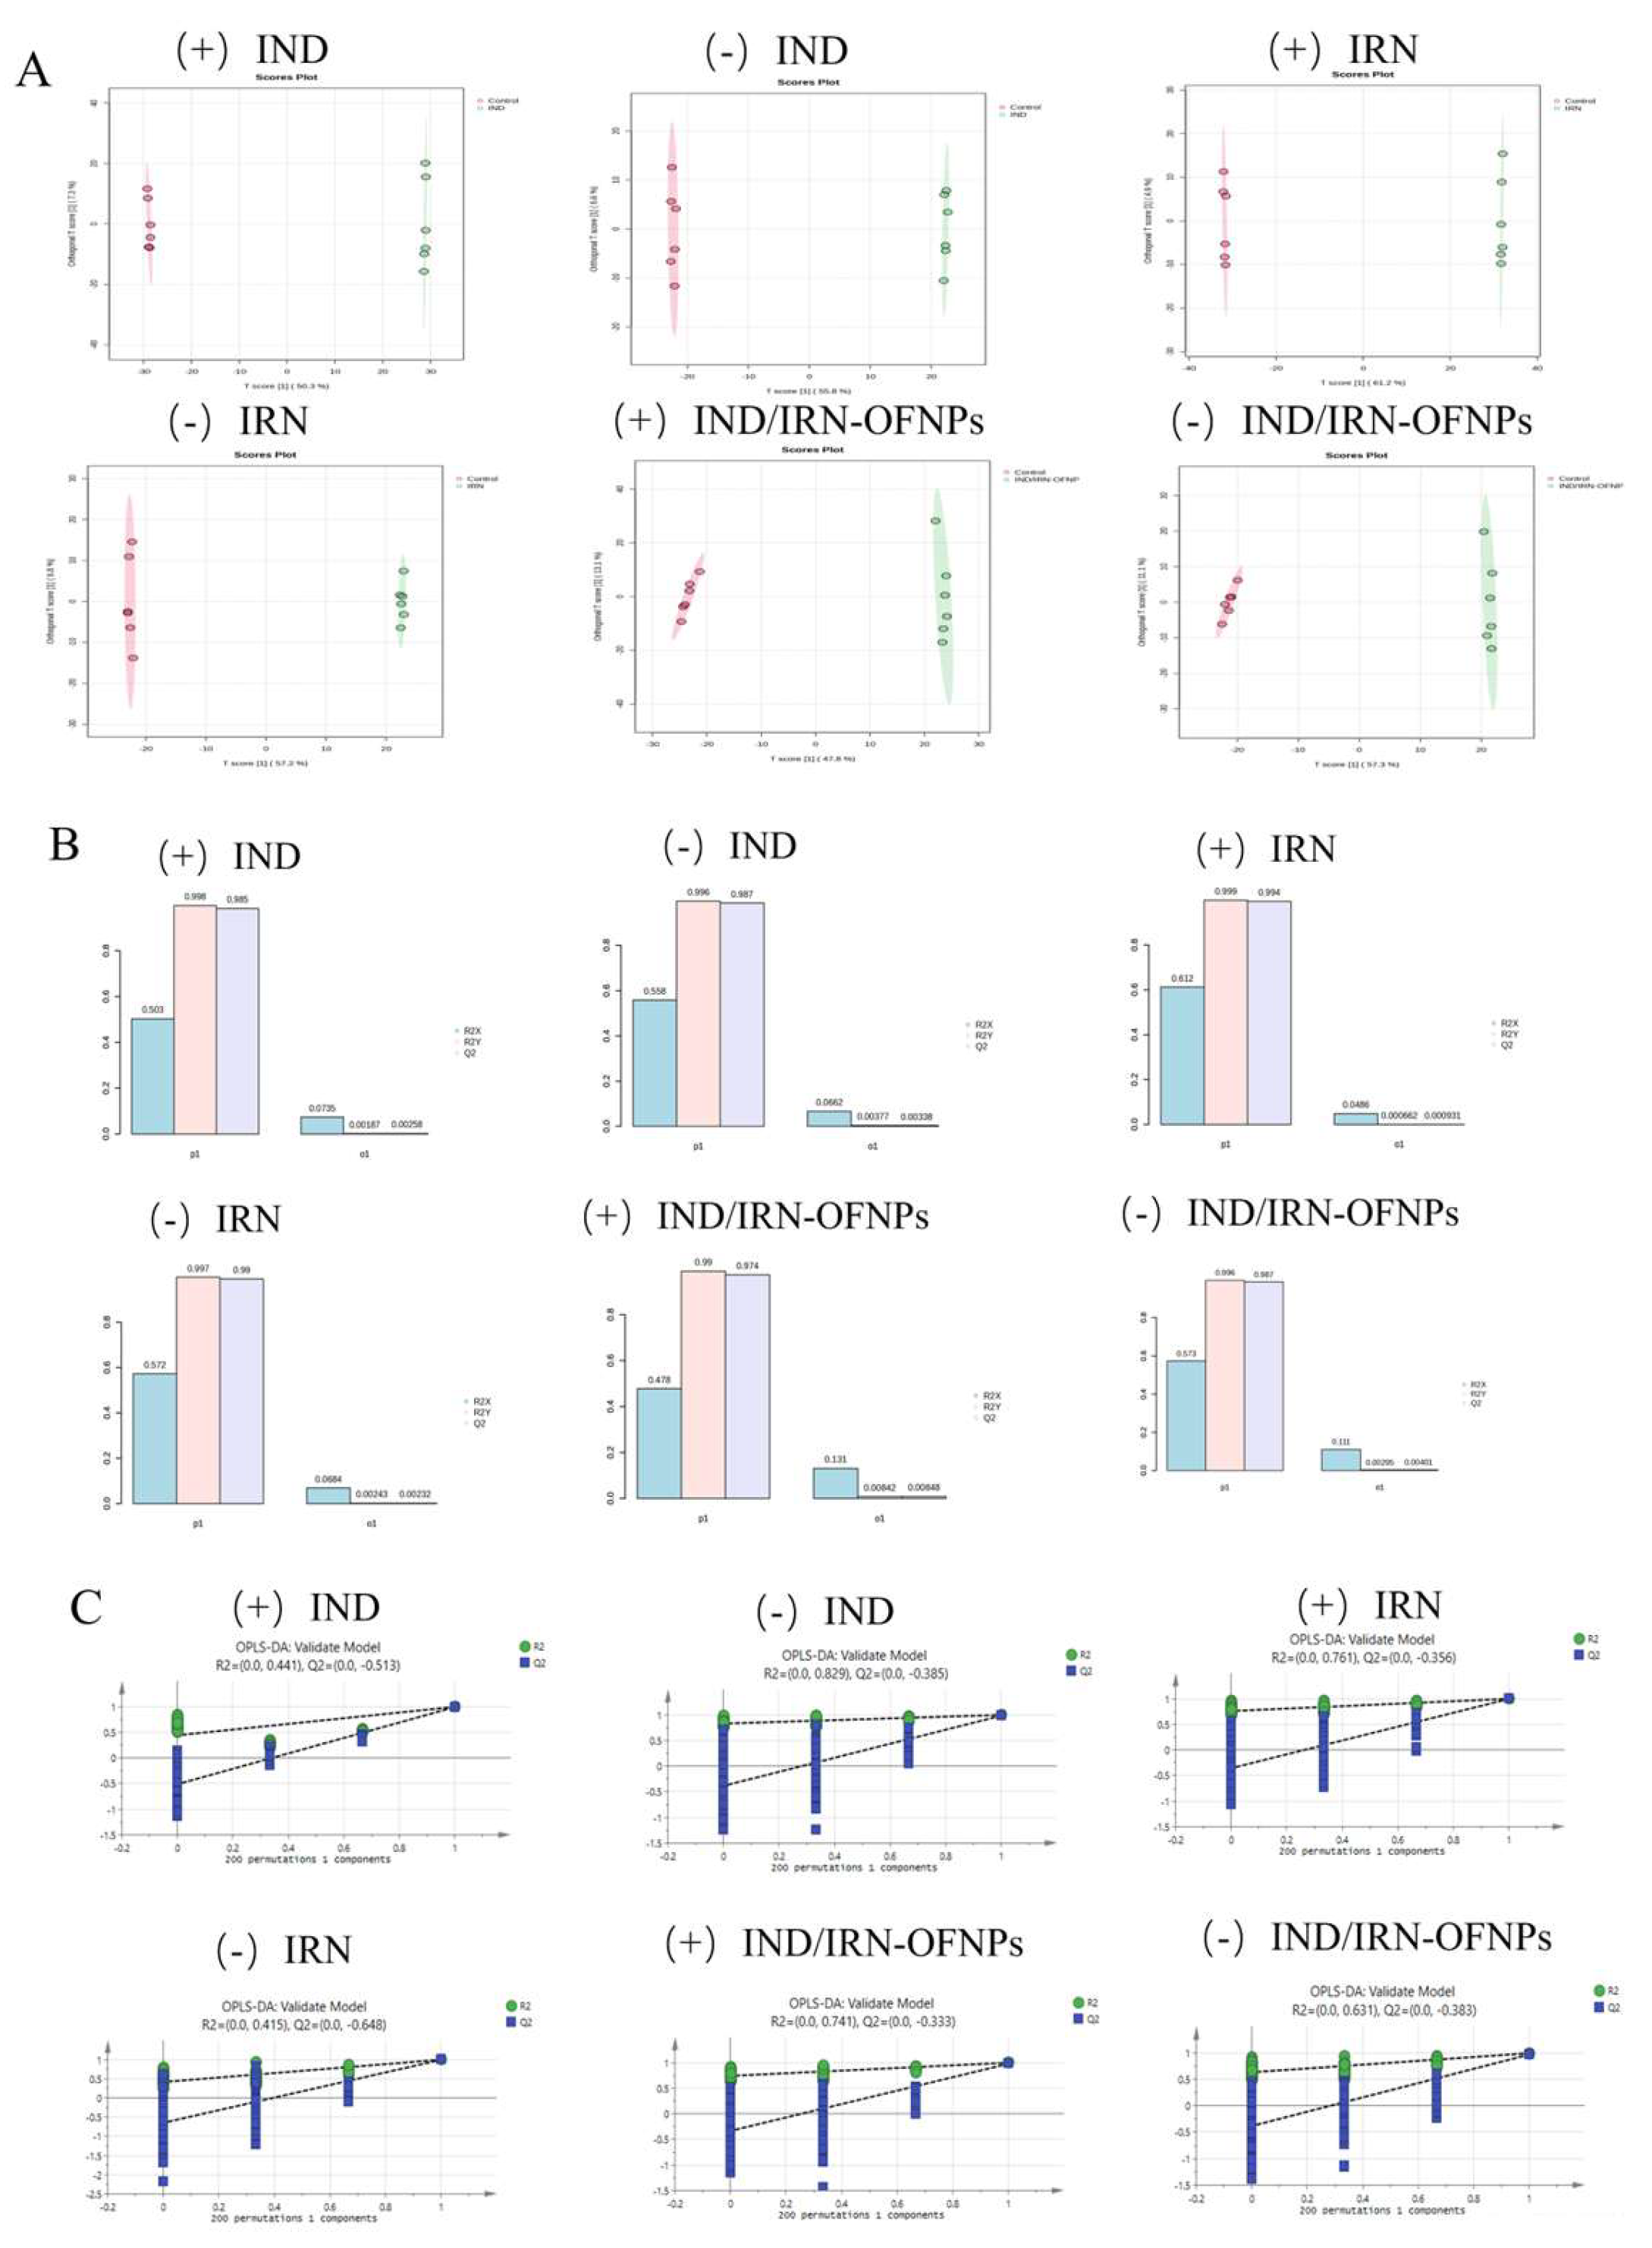
Figure 19.
(A) Volcano plot of metabolites in the IND group under positive ion mode, and (B) under negative ion mode. (C) Volcano plot of metabolites in the IRN group under positive ion mode, and (D) under negative ion mode. (E) Volcano plot of metabolites in the IND/IRN-OFNPs group under positive ion mode, and (F) under negative ion mode.
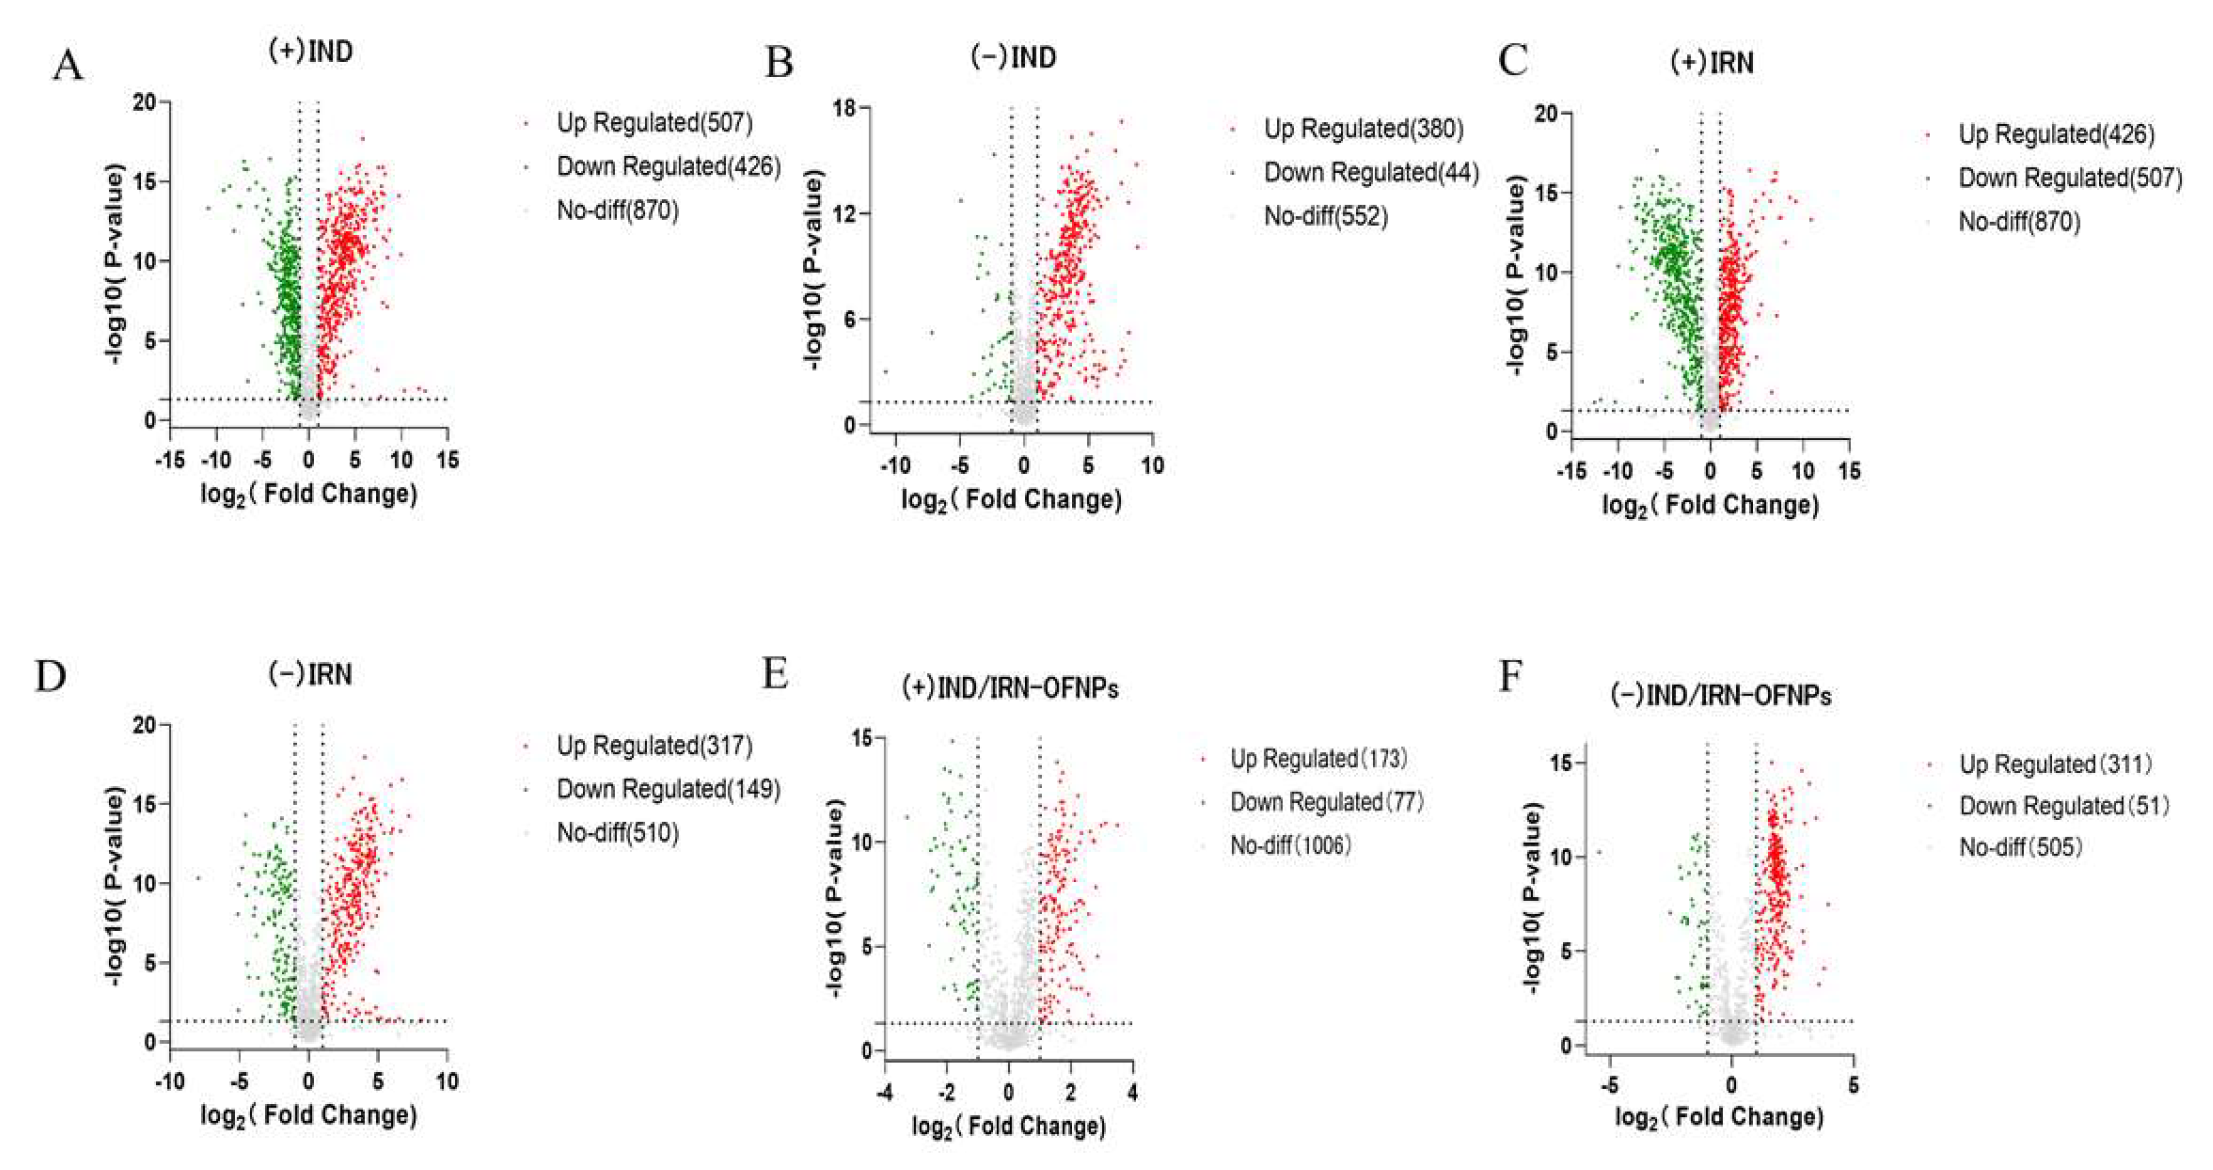
Figure 20.
Integrated classification of differential metabolites combining positive and negative ion modes. (A) A total of 155 metabolites were identified in the IND group. (B) 180 metabolites in the IRN group. (C) 101 metabolites in the IND/IRN-OFNPs group.
Figure 20.
Integrated classification of differential metabolites combining positive and negative ion modes. (A) A total of 155 metabolites were identified in the IND group. (B) 180 metabolites in the IRN group. (C) 101 metabolites in the IND/IRN-OFNPs group.
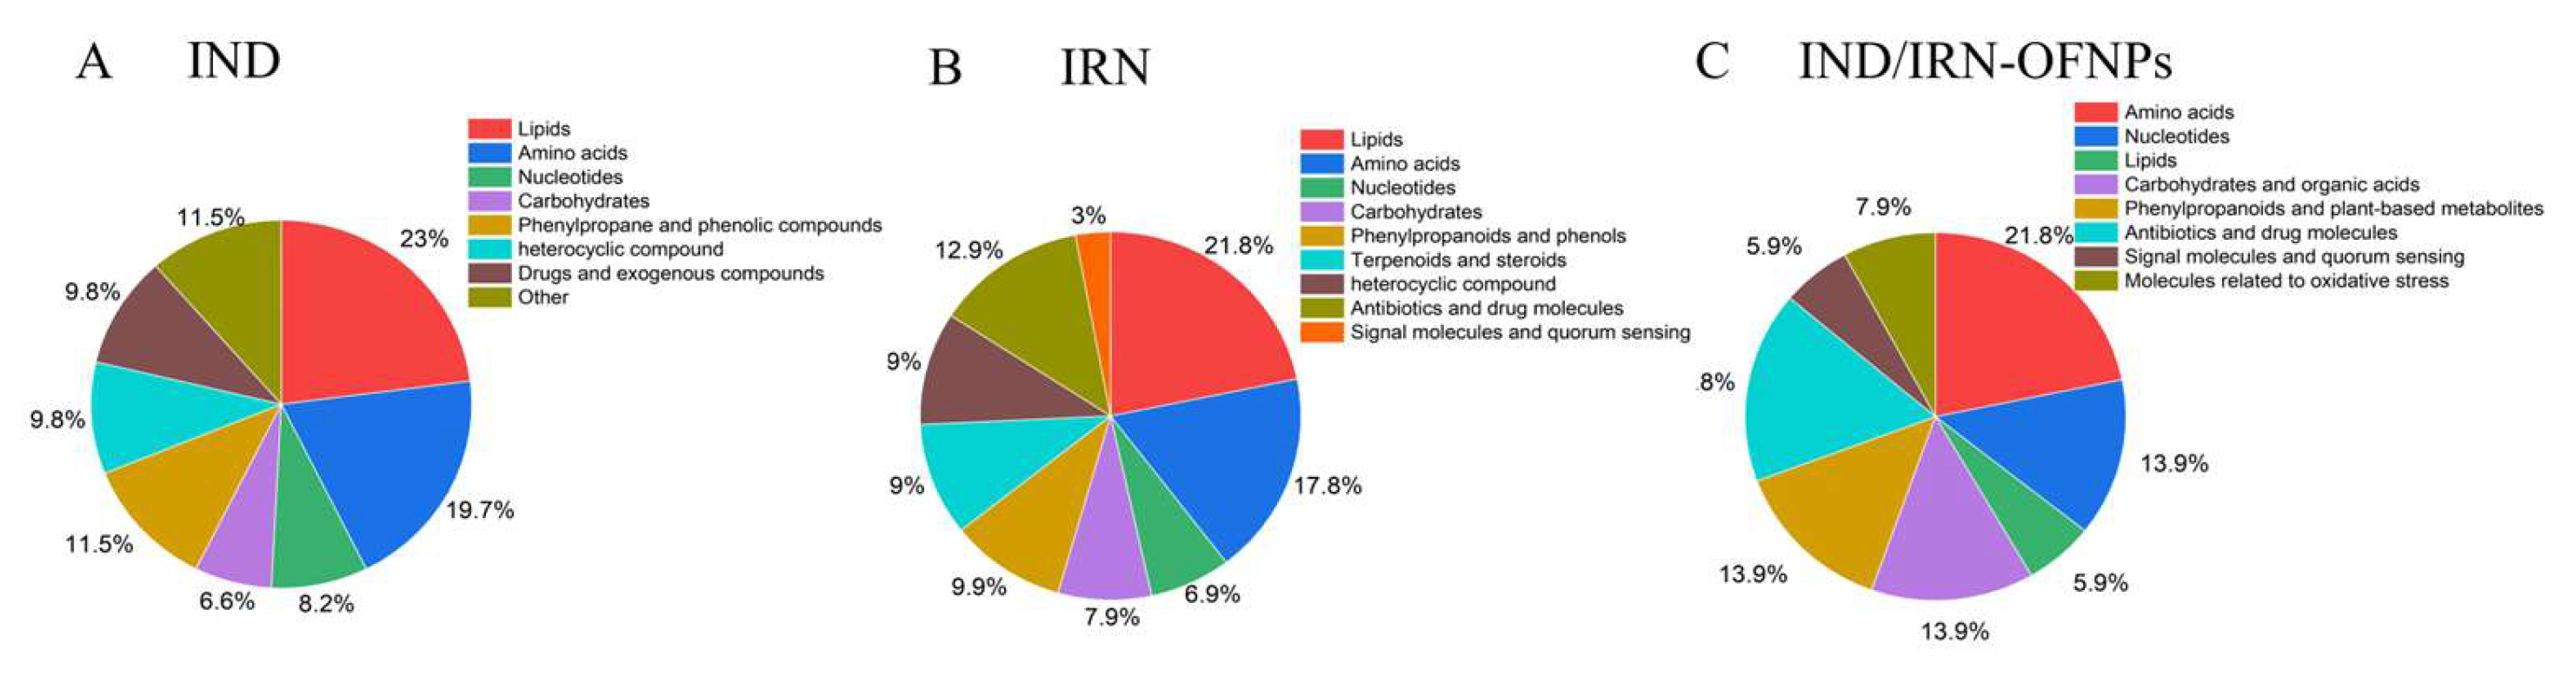
Figure 21.
Correlation analysis of the top 20 differential metabolites for each group, with red indicating positive correlation and blue indicating negative correlation. Symbols “+” and “−” indicate positive and negative ion modes, respectively.
Figure 21.
Correlation analysis of the top 20 differential metabolites for each group, with red indicating positive correlation and blue indicating negative correlation. Symbols “+” and “−” indicate positive and negative ion modes, respectively.
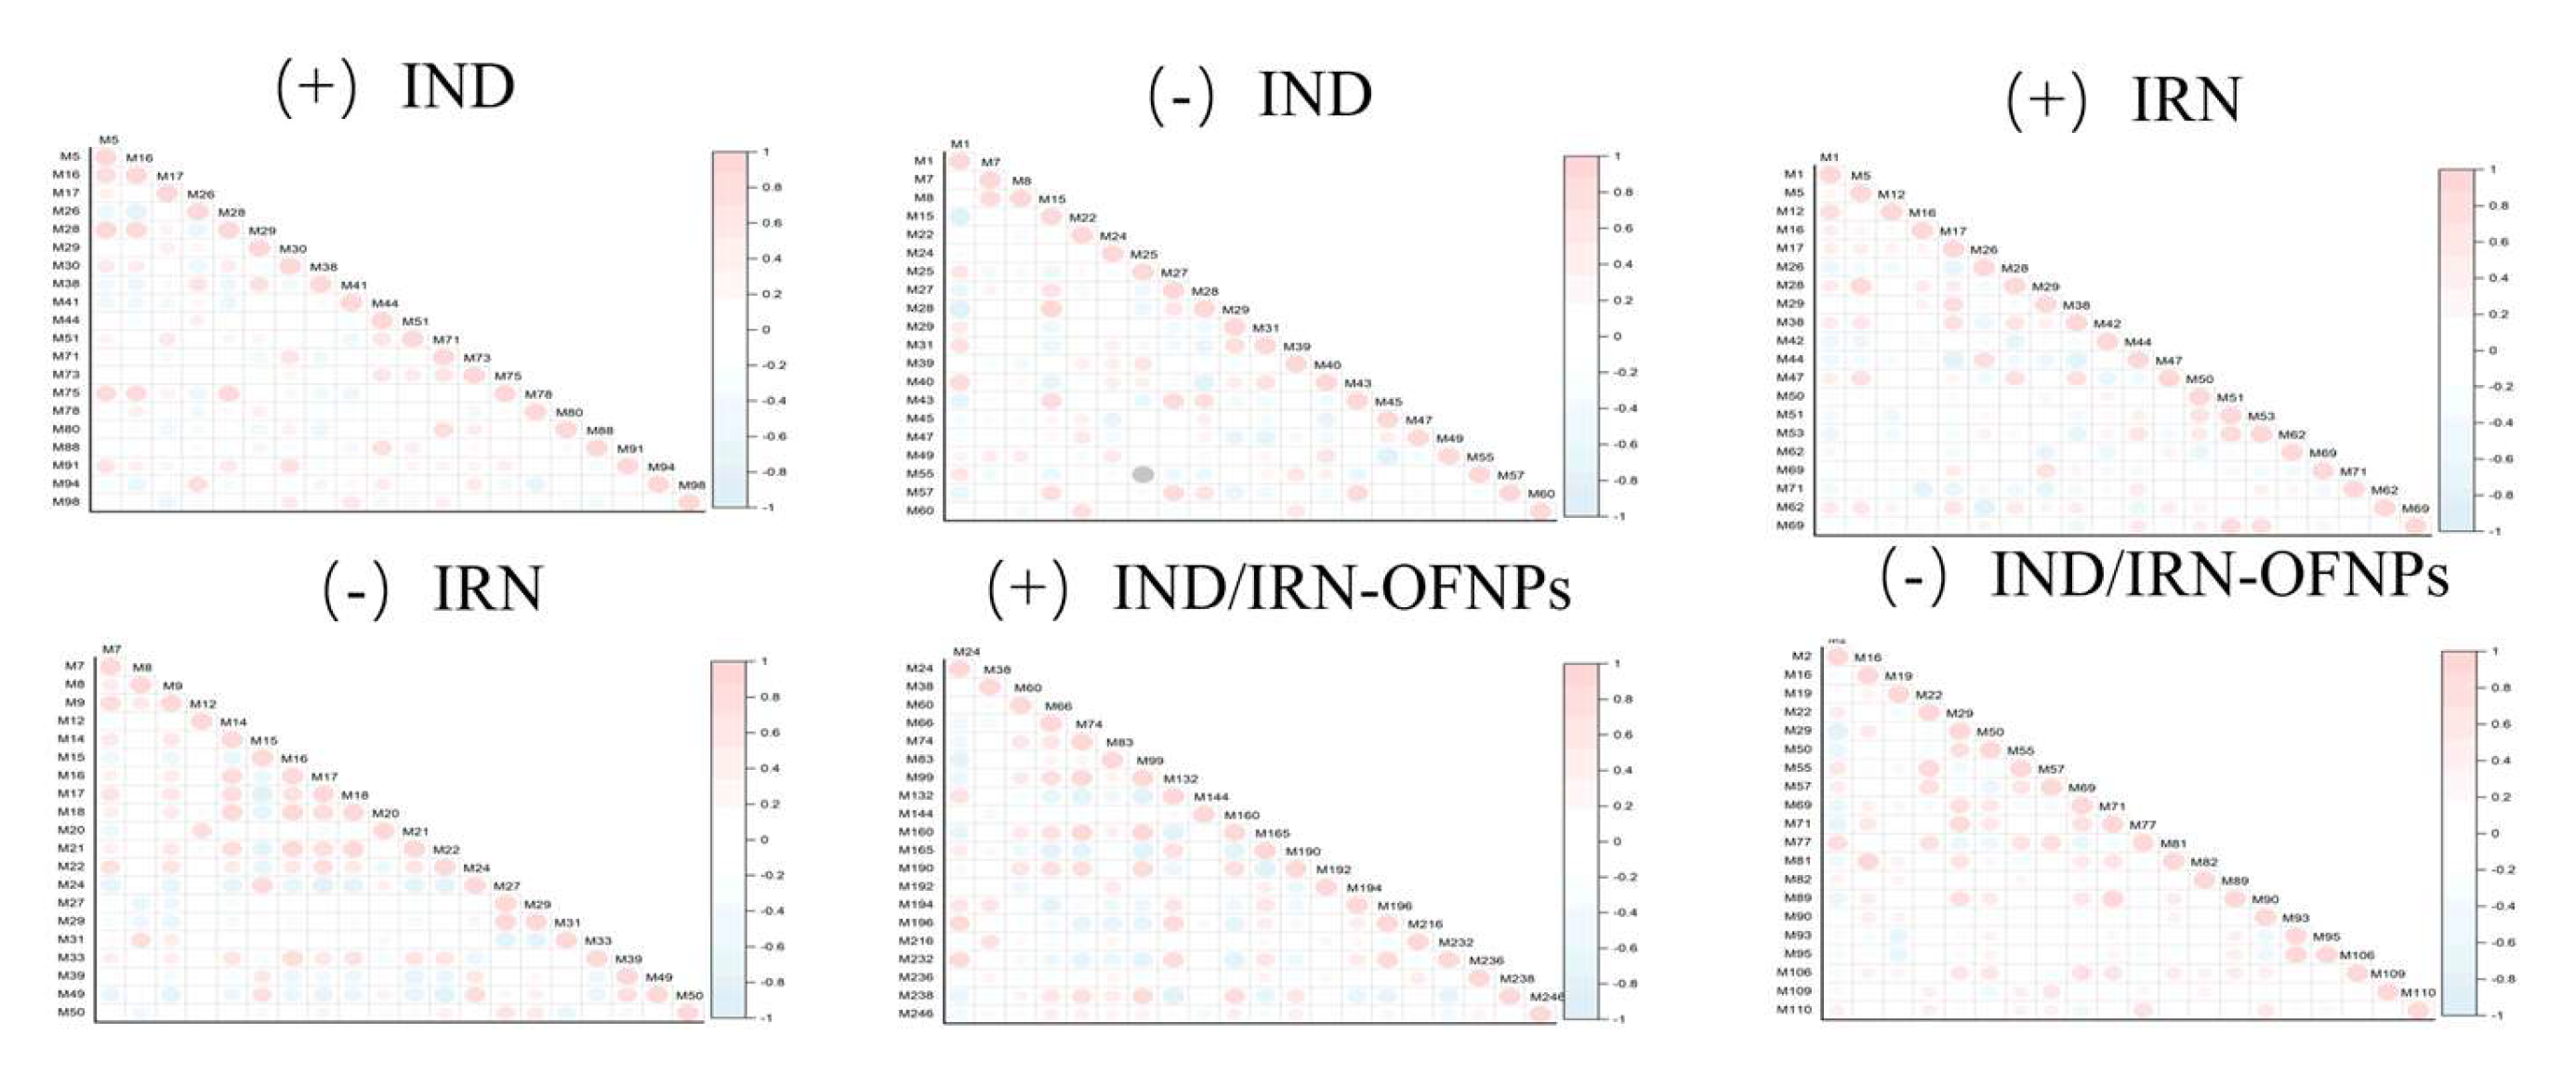
Figure 22.
Cluster analysis of the top 30 differential metabolites for each group. (A) Hierarchical clustering heatmap of differential metabolites in the IND group under positive ion mode, and (B) under negative ion mode. (C) Hierarchical clustering heatmap of differential metabolites in the IRN group under positive ion mode, and (D) under negative ion mode. (E) Hierarchical clustering heatmap of differential metabolites in the IND/IRN-OFNPs group under positive ion mode, and (F) under negative ion mode.
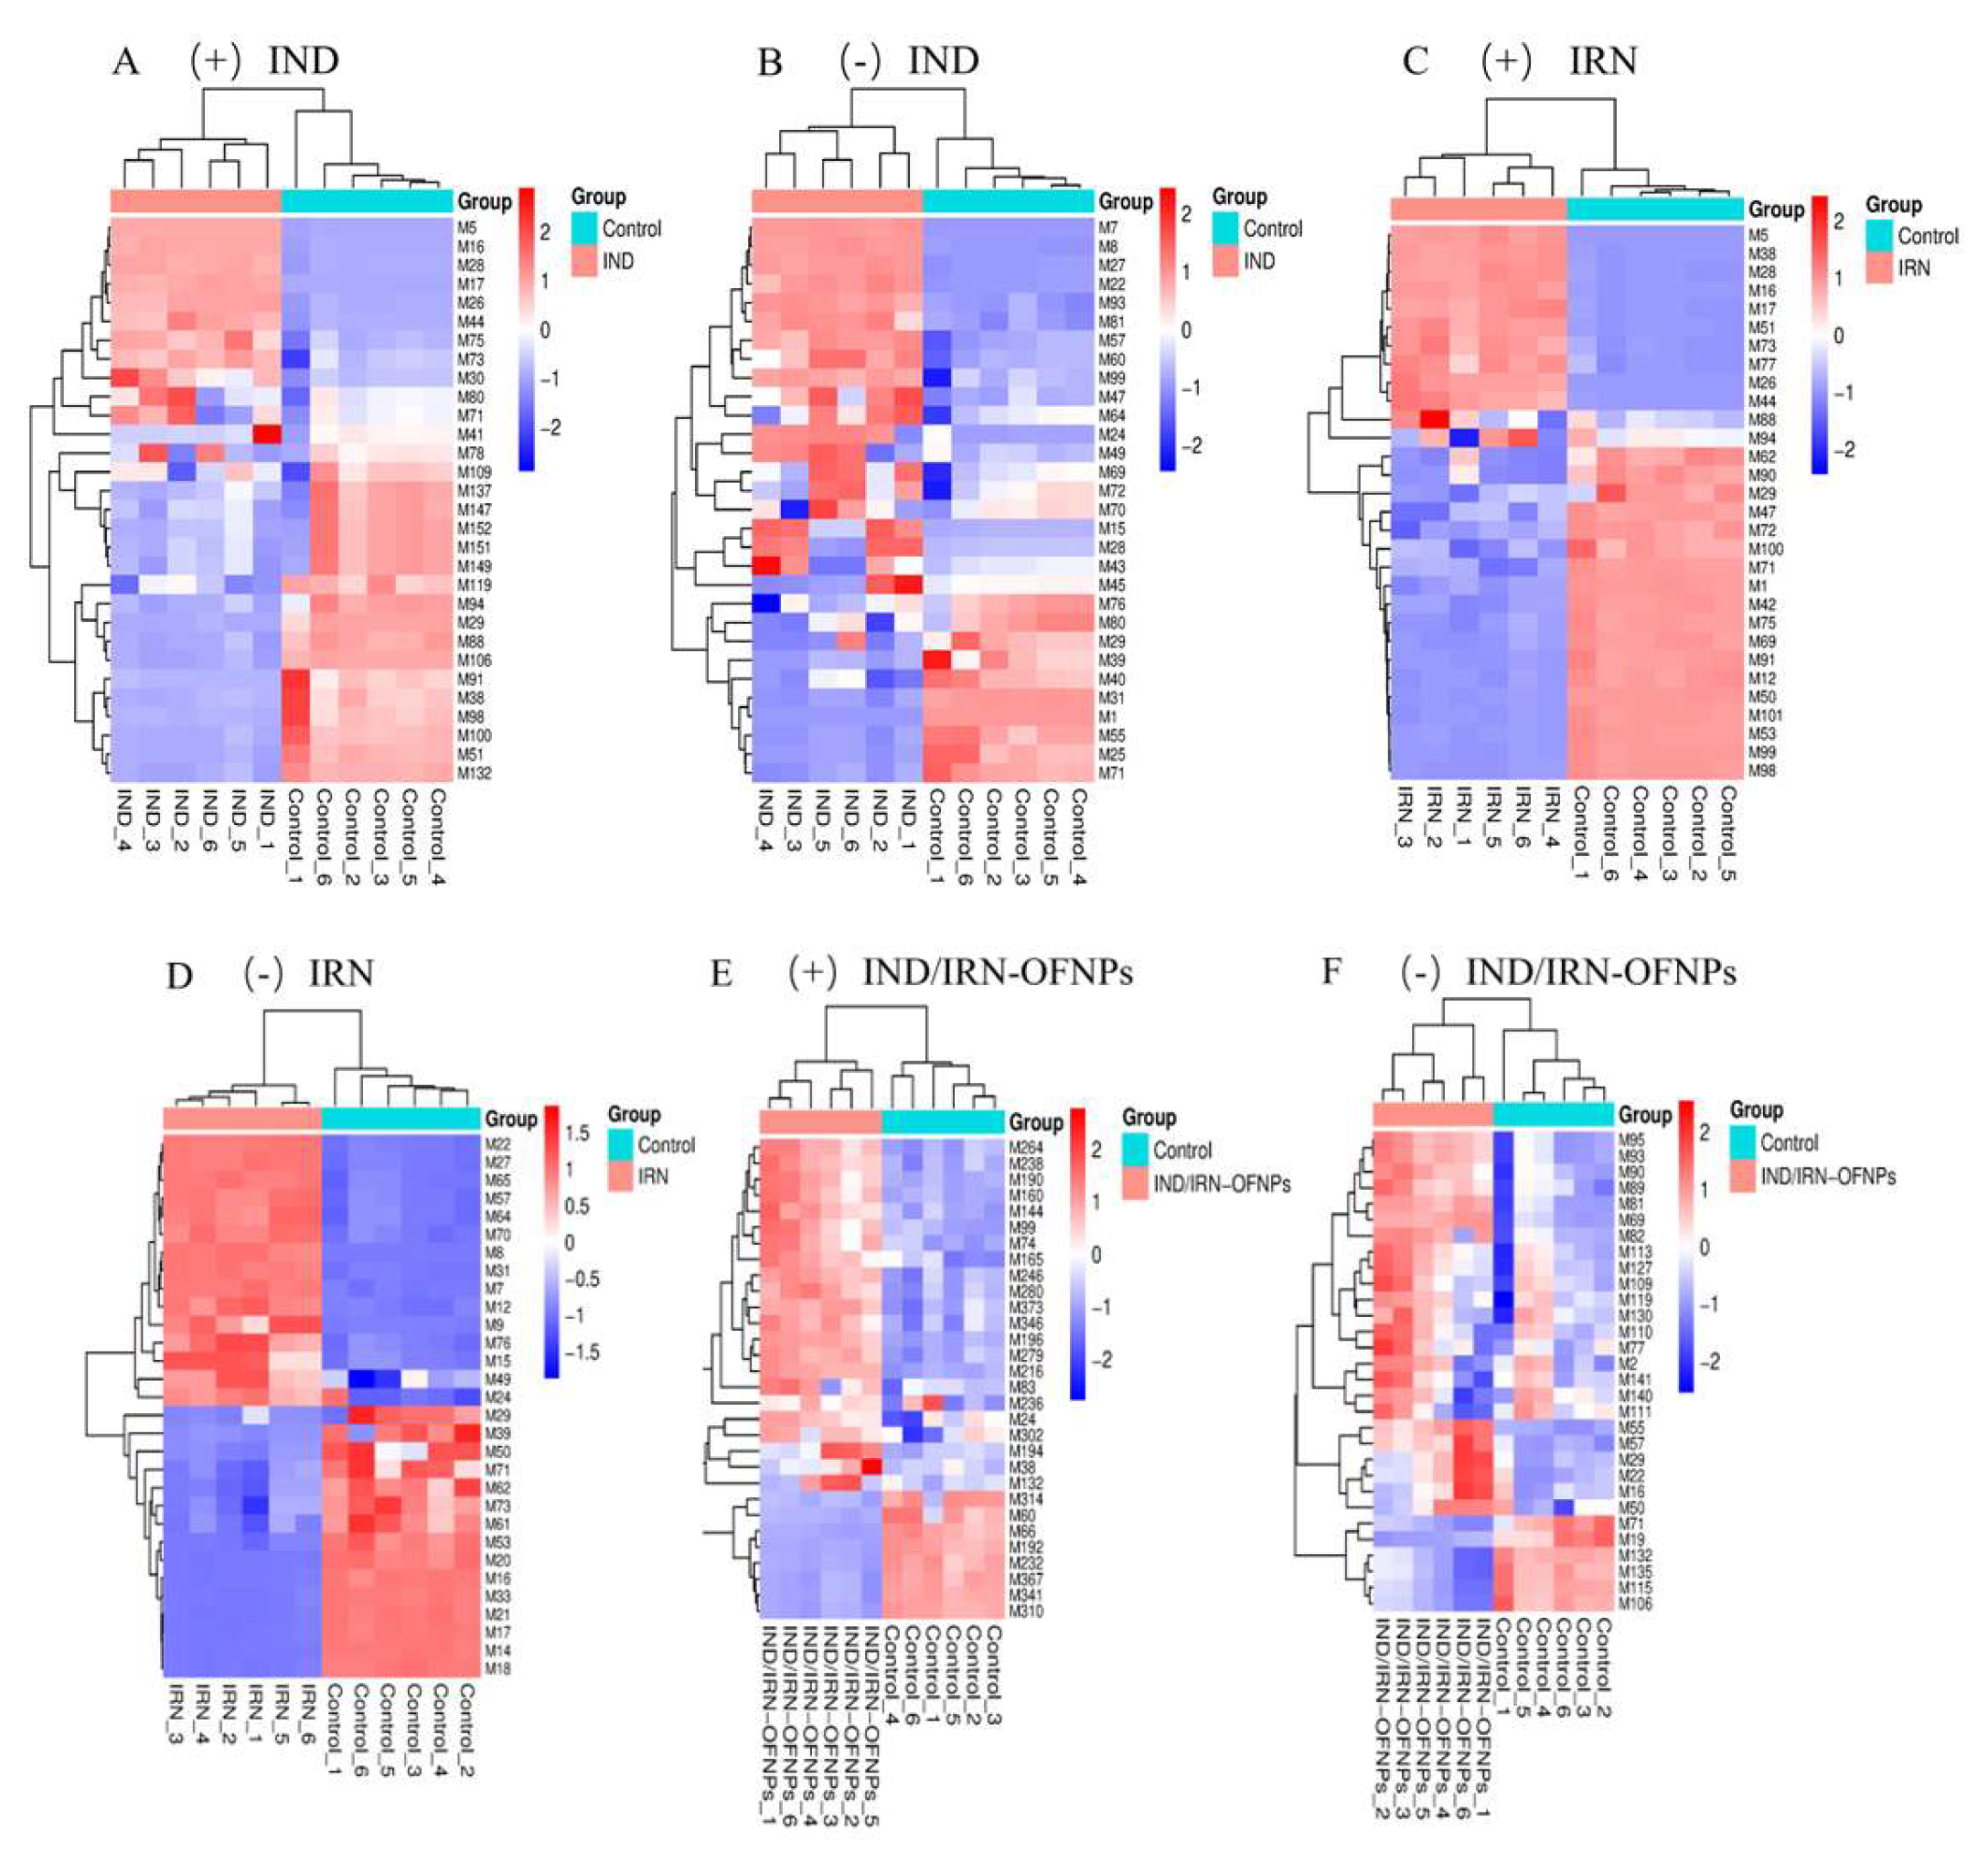
Figure 23.
(A) Boxplots showing expression differences of 14 shared metabolites between IND/IRN-OFNPs and IND groups. (B) Boxplots showing expression differences of 12 shared metabolites between IND/IRN-OFNPs.
Figure 23.
(A) Boxplots showing expression differences of 14 shared metabolites between IND/IRN-OFNPs and IND groups. (B) Boxplots showing expression differences of 12 shared metabolites between IND/IRN-OFNPs.
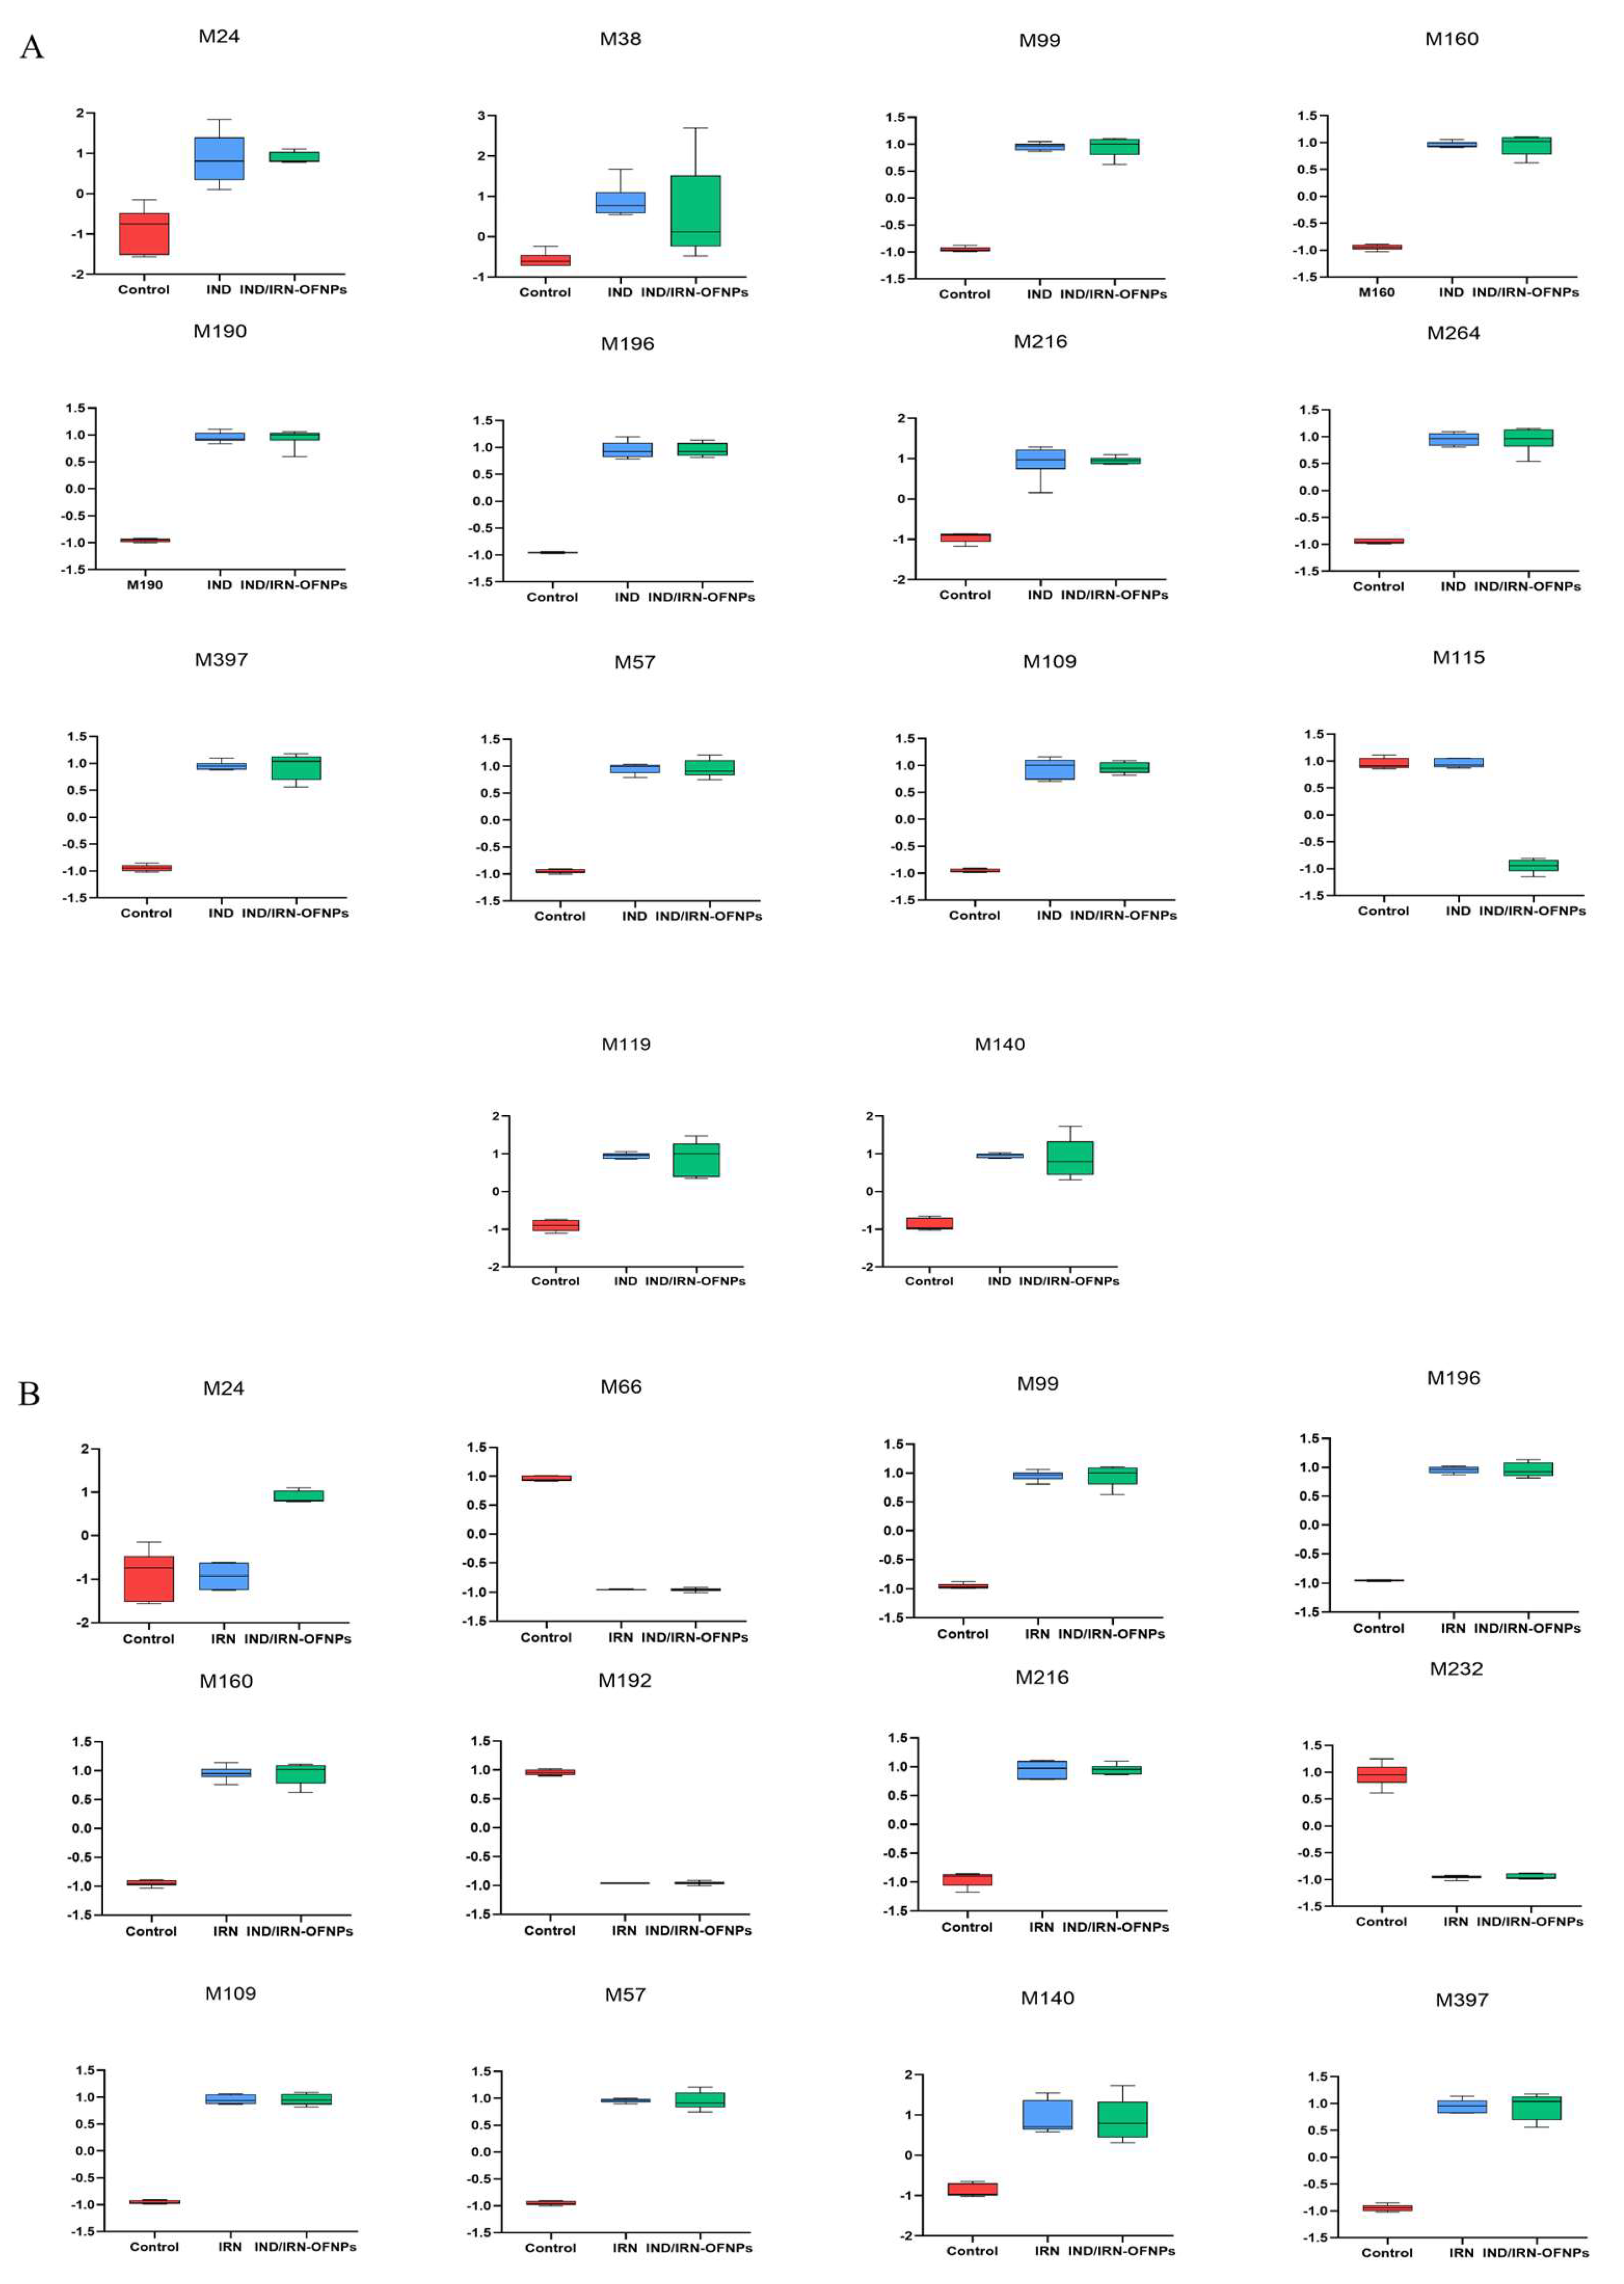
Figure 24.
KEGG pathway enrichment bubble plot of differential metabolites in IND(A), IRN(B), and IND/IRN-OFNPs groups(C).
Figure 24.
KEGG pathway enrichment bubble plot of differential metabolites in IND(A), IRN(B), and IND/IRN-OFNPs groups(C).
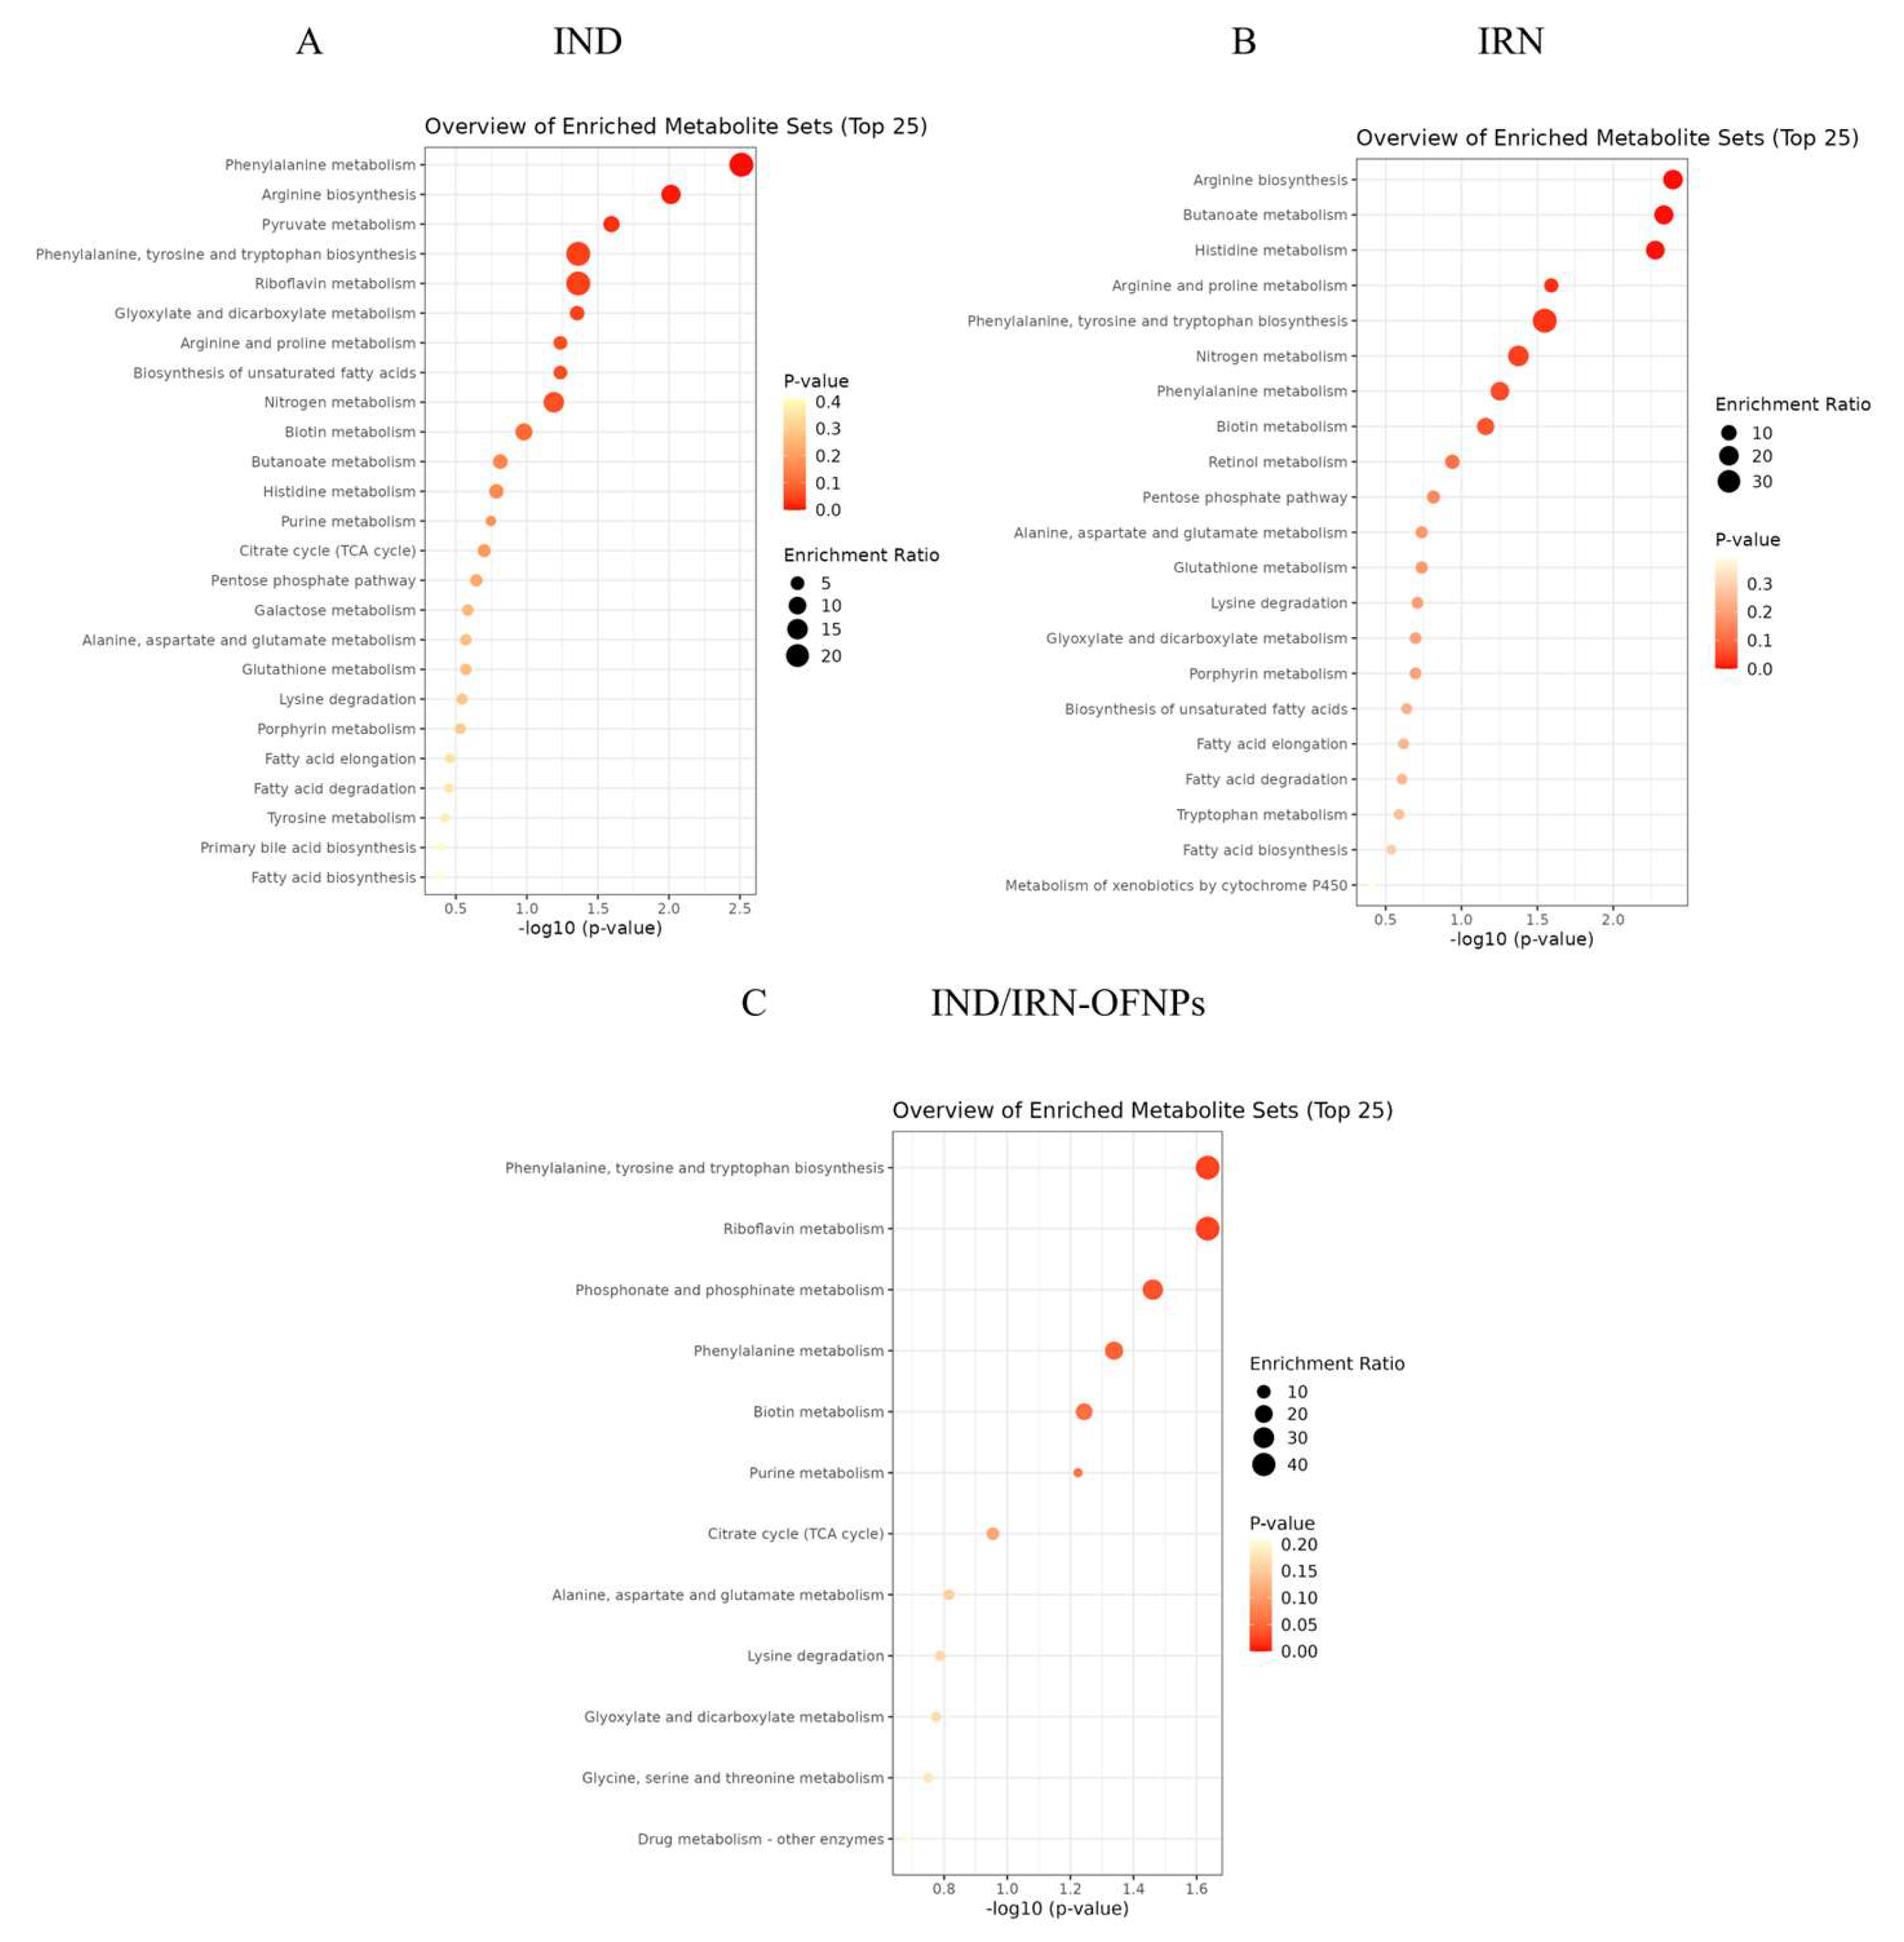
Figure 25.
(A-C) Boxplots of expression differences of shared metabolites between IND/IRN-OFNPs and IRN groups within KEGG pathways. (D, E) Boxplots of expression differences of shared metabolites between IND/IRN-OFNPs and IND groups within KEGG pathways. (F-J) Boxplots of expression differences of shared metabolites between IND and IRN groups within KEGG pathways.
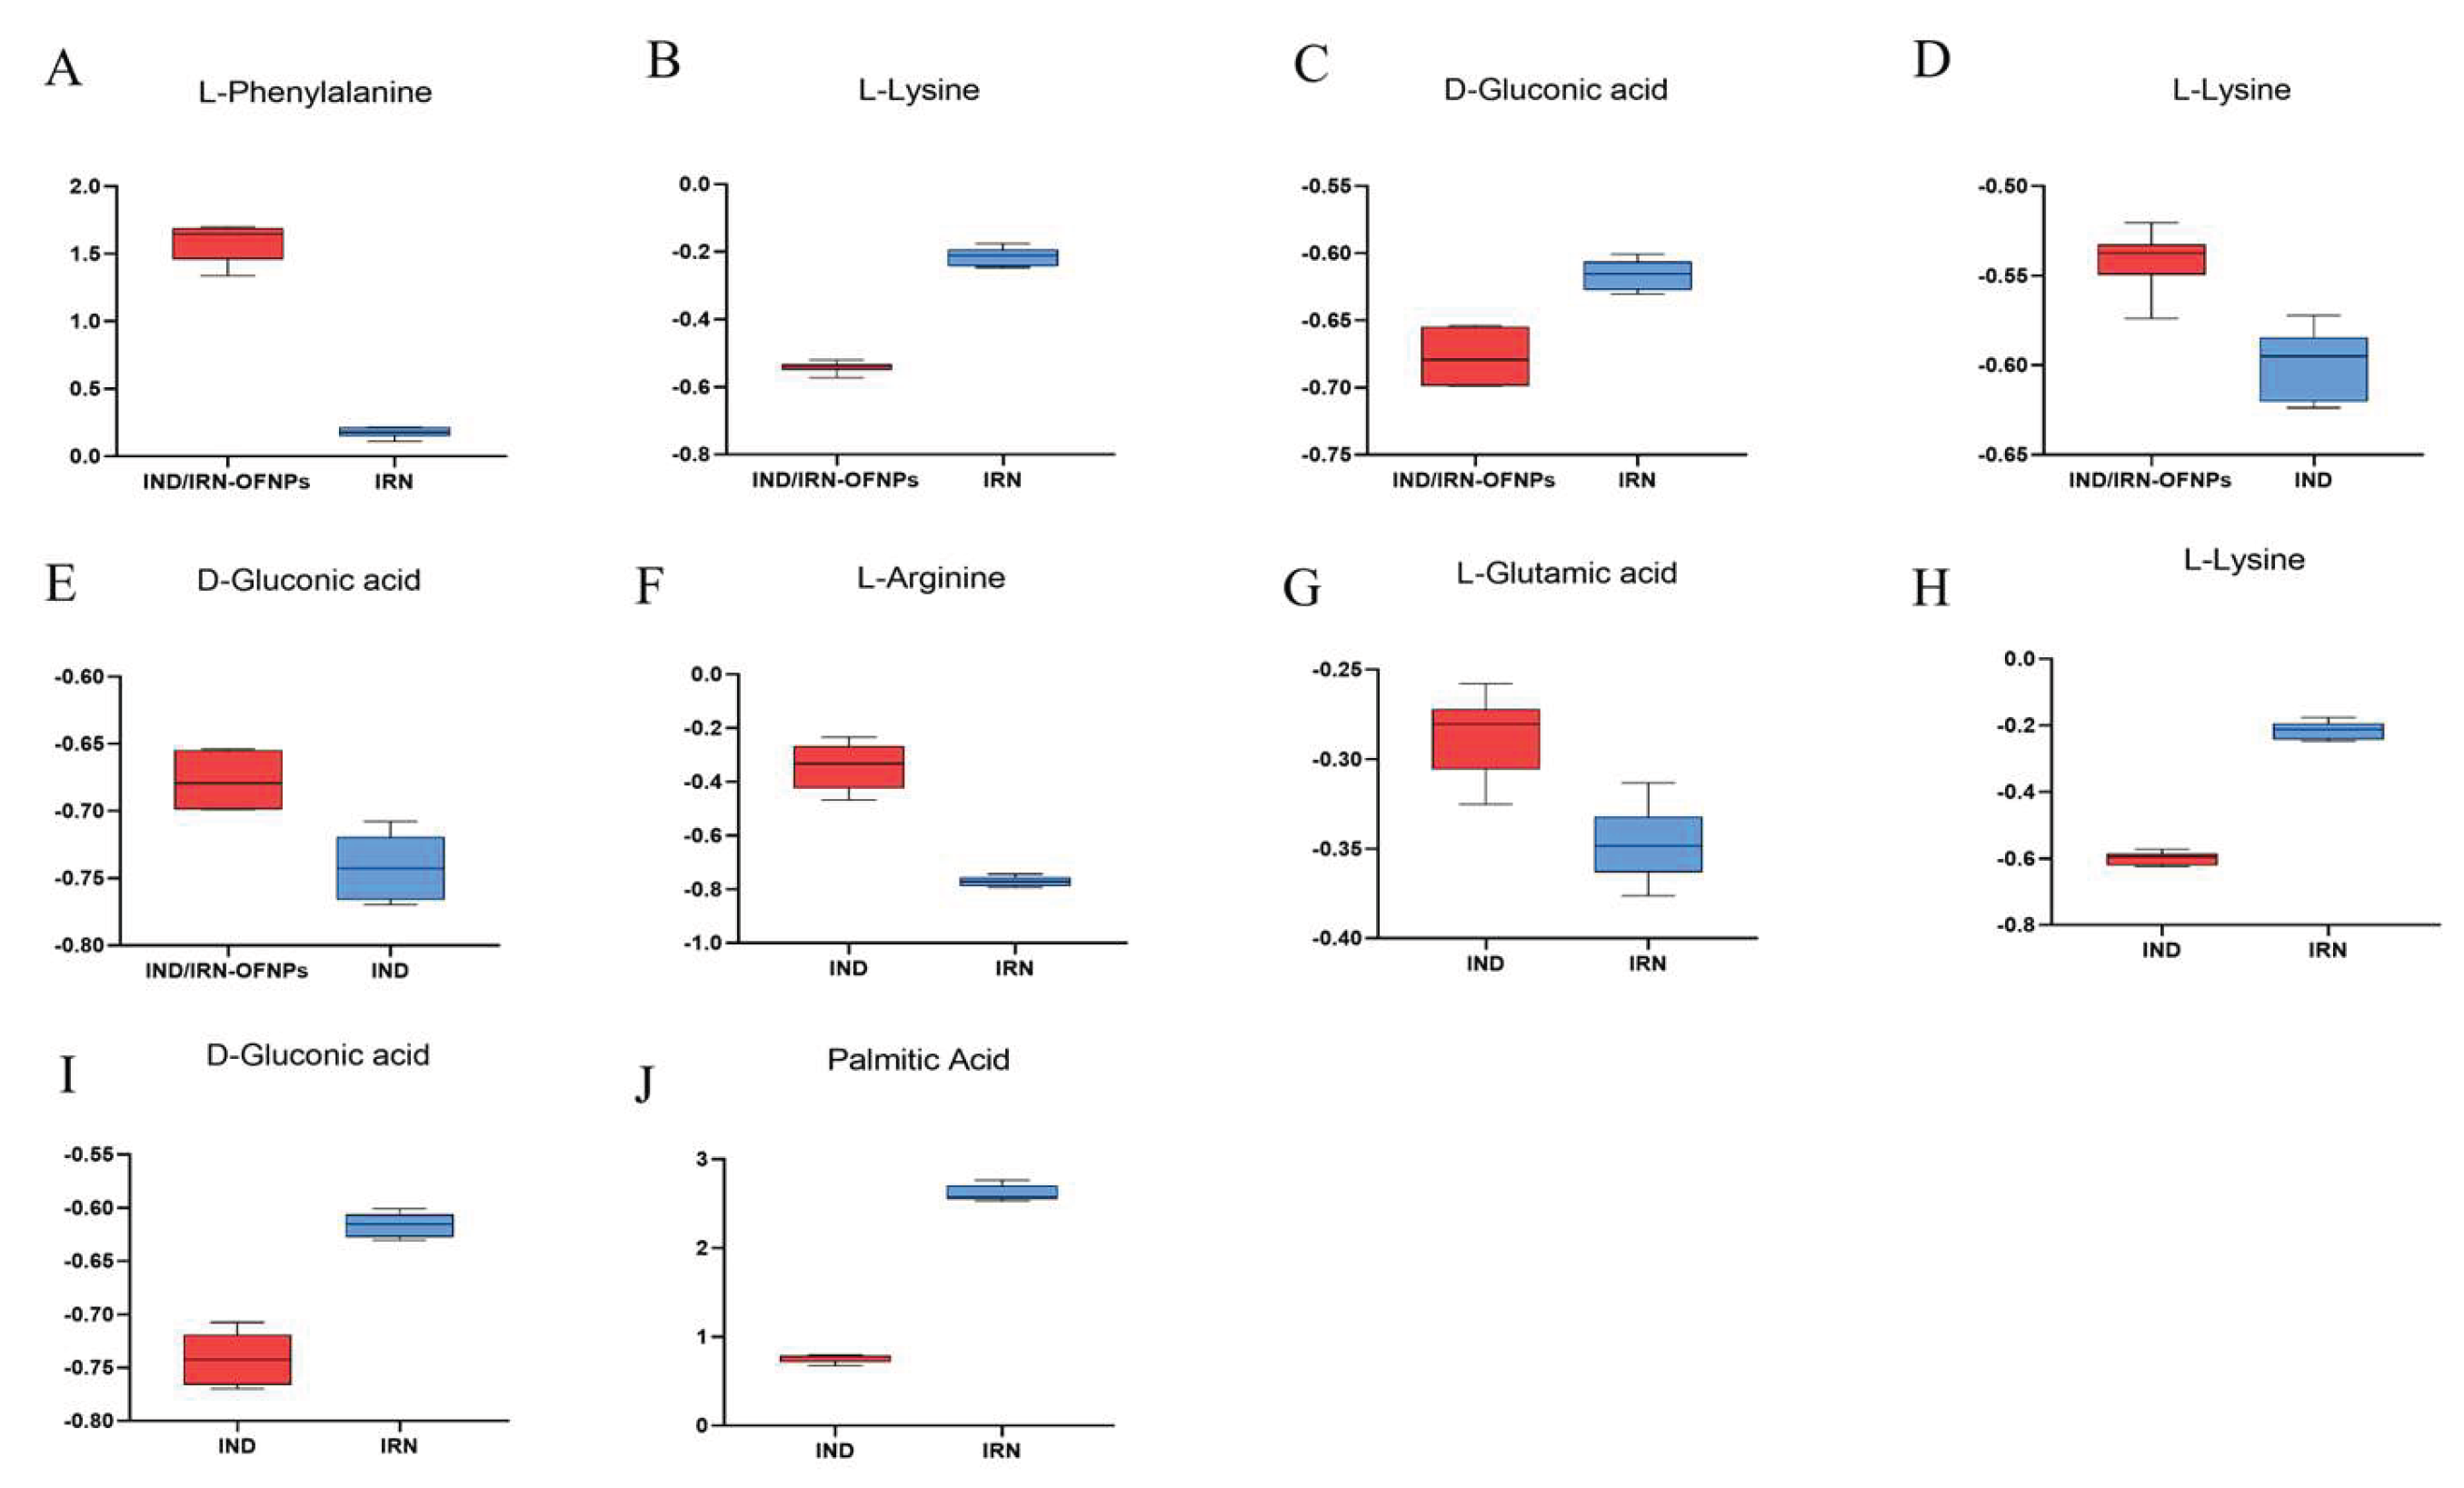

Table 1.
RT-qPCR Primer sequences.
| Gene name | Sequences forward (F) | Sequences reverse (R) |
|---|---|---|
| 16S rRNA | CCGCCTACGCGCTCTTTAC | CTAACGAATAAGCACCGGCTAAC |
| cagA | ATAATGCTAAATTAGACAACTTGAGCGA | TTAGAATAATCAACAAACATCACGCCAT |
| vacA | CTGGAGCCGGGAGGAAAG | GGCGCCATCATAAAGAGAAATTT |
| flgA | ATTGGCGTGTTAGCAGAAGTGA | TGACTGGACCGCCACATC |
| flgB | ACATCATTGTGAGCGGTGTGA | GCCCCTAACCGCTCTCAAAT |
| ureA | ACCGGTTCAAATCGGCTCAC | CAAACCTTACCGCTGTCCCG |
| ureB | GGAATGGTTTGAAACGAGGA | CCGCTTCCACTAACCCCACTA |
| ureE | TCTTGGCTTGGATGTGAATG | GGAATGGTTTGAAACGAGGA |
| ureH | AGATCCCAAAACCACCGACTT | ACGGCTCCATCCACTCCTT |
| ureI | CCCCTGTAGAAGGTGCTGAA | GCCGCATACAAGTAGGTGAAAC |
| nixA | CATATGATCATAGAGCGTTTAATG | CTCGAGTTTCATGACCACTTTAAA |
| alpA | GCACGATCGGTAGCCAGACT | ACACATTCCCCGCATTCAAG |
Table 2.
Chromatographic Gradient Elution Conditions.
| Time/min | 0~1.5 | 1.5~3 | 3~10 |
| Moving phase | 98%A+2%B | 100%B | 100%B |
Table 3.
MIC and MBC results of different drug treatments against different Hp strains. S: Sensitive to the drug, R: Resistant to the drug, MTZ: Metronidazole, LEF: Levofloxacin, AMO: Amoxicillin, CLA: Clarithromycin.
Table 3.
MIC and MBC results of different drug treatments against different Hp strains. S: Sensitive to the drug, R: Resistant to the drug, MTZ: Metronidazole, LEF: Levofloxacin, AMO: Amoxicillin, CLA: Clarithromycin.
| Hp strains | Drug sensitivity | MIC(µg/mL) | MBC(µg/mL) | |||||
|---|---|---|---|---|---|---|---|---|
| IND | IRN | OFNPs | IND/IRN-OFNPs | IND | IRN | IND/IRN-OFNPs | ||
| ATCC 700392 | S | 5 | 16 | >375 | 2.5 | 10 | 32 | 5 |
| ATCC 43504 | R(MTZ) | 2.5 | 10 | >375 | 5 | 5 | 20 | 10 |
| SS1 | S | 4 | 10 | >375 | 2.5 | 8 | 20 | 5 |
| QYZ-001 | R(MTZ) | 5 | 5 | >375 | 2.5 | 10 | 20 | 5 |
| QYZ-003 | R(MTZ,CLA,LEF) | 2 | 20 | >375 | 2 | 8 | 40 | 8 |
| QYZ-004 | R(MTZCLA,LEF,AMO) | 2.5 | 10 | >375 | 2 | 10 | 40 | 4 |
| CS01 | R(CLA) | 5 | 32 | >375 | 4 | 10 | 64 | 8 |
Table 4.
Results from the checkerboard dilution method, showing MIC and FICI values for the physical mixture of IND and IRN against Hp.
Table 4.
Results from the checkerboard dilution method, showing MIC and FICI values for the physical mixture of IND and IRN against Hp.
| Hp strains | MIC (µg/mL) | FICI | Interaction | ||
|---|---|---|---|---|---|
| IND | IRN | IND+IRN | |||
| ATCC 700392 | 5 | 16 | 1.25+2 | 0.375 | synergy |
| ATCC 43504 | 2.5 | 10 | 0.3125+5 | 0.625 | additive |
| SS1 | 4 | 10 | 0.5+5 | 0.625 | additive |
Table 5.
Results from the checkerboard dilution method, showing MIC and FICI values for IND/IRN-OFNPs alone or in combination with four antibiotics.
Table 5.
Results from the checkerboard dilution method, showing MIC and FICI values for IND/IRN-OFNPs alone or in combination with four antibiotics.
| Hp Strains | Antibiotics | MIC (µg/mL) | FICI | Interaction | ||
|---|---|---|---|---|---|---|
| IND/IRN-OFNPs | antibiotics | IND/IRN-OFNPs+ antibiotics | ||||
| ATCC 700392 | MET | 2.5 | 1.6 | 0.3125+0.4 | 0.375 | synergy |
| AMO | 2.5 | 0.1 | 0.3125+0.25 | 0.375 | synergy | |
| LEF | 2.5 | 0.8 | 0.3125+0.1 | 0.25 | synergy | |
| CLA | 2.5 | 0.004 | 0.3125+0.008 | 0.625 | additive | |
| ATCC 43504 | MET | 5 | 6.4 | 2.5+0.8 | 0.625 | additive |
| AMO | 5 | 0.4 | 1.25+0.005 | 0.2625 | synergy | |
| LEF | 5 | 1.6 | 0.625+0.2 | 0.25 | synergy | |
| CLA | 5 | 0.016 | 2.5+0.002 | 0.625 | additive | |
| SS1 | MET | 2.5 | 1.6 | 0.3125+0.2 | 0.25 | synergy |
| AMO | 2.5 | 0.4 | 2.5+0.005 | 1.125 | additive | |
| LEF | 2.5 | 1.6 | 0.3125+0.4 | 0.375 | synergy | |
| CLA | 2.5 | 0.016 | 0.3125+0.008 | 0.625 | additive | |
Table 6.
Core target proteins for IND and IRN in anti-Hp infection.
| Uniprot ID | Gene | Protein | Degree value |
|---|---|---|---|
| P42574 | CASP3 | Caspase-3 | 35 |
| P07900 | HSP90AA1 | Heat shock protein HSP 90-alpha | 33 |
| P14780 | MMP9 | Matrix metalloproteinase-9 | 29 |
| P09874 | PARP1 | Poly [ADP-ribose] polymerase 1 | 27 |
| P42336 | PIK3CA | Phosphatidylinositol 4,5-bisphosphate 3-kinase catalytic subunit alpha isoform | 24 |
| O60674 | JAK2 | Tyrosine-protein kinase JAK2 | 23 |
| P24941 | CDK2 | Cyclin-dependent kinase 2 | 22 |
| P35354 | PTGS2 | Prostaglandin G/H synthase | 21 |
| P45983 | MAPK8 | Mitogen-activated protein kinase 8 | 21 |
| P00519 | ABL1 | Tyrosine-protein kinase ABL1 | 20 |
| P08253 | MMP2 | 72 kDa type IV collagenase | 19 |
| P06493 | CDK1 | Cyclin-dependent kinase 1 | 18 |
Table 7.
Molecular docking information for IND, IRN, and core targets.
| No. | Gene ID | Protein ID | Binding energy (kcal/mol) |
|
|---|---|---|---|---|
| IND | IRN | |||
| 1 | CASP3 | 1GFW | -5.80 | -6.05 |
| 2 | HSP90AA1 | 5J80 | -6.30 | -6.17 |
| 3 | MMP9 | 6ESM | -6.99 | -6.56 |
| 4 | PARP1 | 1UK1 | -6.00 | -7.46 |
| 5 | PIK3CA | 4JPS | -5.57 | -5.66 |
Disclaimer/Publisher’s Note: The statements, opinions and data contained in all publications are solely those of the individual author(s) and contributor(s) and not of MDPI and/or the editor(s). MDPI and/or the editor(s) disclaim responsibility for any injury to people or property resulting from any ideas, methods, instructions or products referred to in the content. |
© 2025 by the authors. Licensee MDPI, Basel, Switzerland. This article is an open access article distributed under the terms and conditions of the Creative Commons Attribution (CC BY) license (http://creativecommons.org/licenses/by/4.0/).
Copyright: This open access article is published under a Creative Commons CC BY 4.0 license, which permit the free download, distribution, and reuse, provided that the author and preprint are cited in any reuse.


