
Submitted:
05 October 2025
Posted:
08 October 2025
You are already at the latest version
Abstract
We compared five nonlinear models (Brody, von Bertalanffy, Gompertz, logistic, Richards) to describe growth and carcass protein, ash, and fat deposition in Japanese quail (1–36 days). Two hundred and twenty-five females were reared with ad libitum access to feed and water; body weight was recorded every three days, and serial slaughter provided body composition. Models were fitted in SAS (PROC NLIN; Levenberg–Marquardt). Model fit was assessed via coefficient of determination (R²), Akaike (AIC), Bayesian (BIC) information criteria, and Asymptotic Index (AI). All models showed high R² (≥97%). For body weight, Gompertz provided the best information criteria and biologically plausible parameters (inflection 15.7 days). logistic best described protein (lowest AIC/BIC/AI; inflection 17.5 days). For ash, Gompertz balanced fit and parsimony (inflection 15.1 days). The Richards model best captured fat (R² ≈ 0.98; lowest AIC; inflection at 35.6 days), indicating late fat accretion. Protein and ash peaked at 15–18 days of age, followed by rising fat accretion. Gompertz best described body weight and ash, logistic best described protein, and Richards best described fat. These results support a three-phase feeding program (1–18, 19–29, 30–36 days): emphasize amino acids/minerals early; balance diets mid-phase; and moderate energy later.
Keywords:
Ash deposition
; Fat deposition
; Gompertz
; Growth Curve
; Information Criteria (AIC/BIC)
; Japanese quail
; logistic
; Protein deposition
; Richards
1. Introduction
Nutrient formulation for quail still relies largely on two national references [1] and the Brazilian Tables for Poultry and Swine [2] yet species-specific estimates for Coturnix japonica remain scarce, motivating the adaptation of methodologies established for broilers and layers [3,4].
Among these, the factorial approach and the mathematical modelling of growth and body composition (protein, fat, and ash) underpin requirement estimation and precision feeding, with evidence that accurate curve description improves productive efficiency [5,6].
Nonlinear functions widely used in poultry include the Brody, von Bertalanffy, Gompertz, logistic, and Richards models, which provide biologically interpretable parameters—weight asymptote (A), growth rate (k), and age at the inflection point (tᵢ)—to elucidate growth tempo and tissue prioritization [7,8,9].
Model choice should balance goodness-of-fit and parsimony using information criteria such as AIC and BIC, and, where appropriate, multimodel inference [10,11,12]. Prior evidence in broilers and quail indicates that Gompertz, logistic, and Richards often outperform alternatives for body weight and component deposition, whereas Brody (and sometimes von Bertalanffy) may overestimate asymptotes or yield less plausible inflection points [13,14,15,16].
Accordingly, we compare these nonlinear functions to describe body-weight growth and deposition of protein, fat, and ash in Japanese quail from 1 to 36 d, aiming to identify models with strong statistical performance and sound biological interpretation to support species-specific nutritional recommendations.
2. Materials and Methods
2.1. Experimental Design and Diets
2.2. Quail and Housing
A total of 300 one-day-old Japanese quail females were acquired (Fujikura®). Fifteen galvanized-wire cages (0.75 × 0.80 × 0.20 m) arranged in batteries were used, housing 15 quail per cage (400 cm²/quail), totaling 225 quail. Each cage had nipple drinkers, trough feeders, and a 60 W incandescent lamp.
The remaining 75 quail from the original purchase were reared concurrently under identical housing and husbandry conditions and fed the same diet described in Table 1. They served solely as replacements for potential losses during the first 3 days of the trial. At 15 days of age, surplus quail were sold locally; none were included in the dataset.
A lighting program was adopted to prevent the onset of lay before 36 days. During the first two weeks, a 24-h photoperiod was maintained. From week three to five, lights-off times were advanced progressively: 16 h (week three), 15 h 30 min (week four), and 15 h (week five). Lights were controlled by an analog timer. Lights were controlled using an analog timer. Temperature and humidity were recorded with a digital thermo-hygrometer at cage height.
2.3. Sampling for Body Composition and Slaughter Procedures
For body-component determination, a group of quail (Table 2) with average body weight (±5%) of the replicate was weighed on days (1, 3, 6, 9, 12, 15, 18, 21, 24, 27, 30, 33, and 36 days), fasted for 15 h, and slaughtered the following day at 8:00. Body composition results were attributed to the age at weighing (day X).
Eviscerated carcasses were identified and frozen at −20 °C. After partial thawing, carcasses were coarsely ground in an industrial meat grinder to homogenize, spread in thin layers on aluminum trays, and dried in a forced-air oven at 55 °C for 72 h. Drying then continued at 55 °C to constant mass (mass change <1% over an additional 24 h check). Dried material was cooled in a desiccator, weighed on an analytical balance (0.001 g), and finely ground for subsequent chemical analyses. For moisture determination of analytical subsamples, duplicate aliquots were further oven-dried at 105 °C to constant mass. Samples were then milled for laboratory analyses of dry matter, nitrogen, fat, and ash at the Animal Nutrition Laboratory, CCA/UFNT.
2.4. Nonlinear Models and Statistical Analysis
Nonlinear models were fitted in SAS (PROC NLIN, SAS OnDemand for Academics [17]. Parameters were estimated by the Levenberg–Marquardt algorithm.
In the presented equations, parameter A is the asymptotic body weight; k is the maturation rate (larger values indicate greater precocity); tᵢ is the inflection point; and m is the shape parameter. In Richards, the shape parameter m is estimated; the other functions used here do not include a free shape parameter [18].
Selection criteria were: (1) coefficient of determination (R²); (2) Akaike information criterion (AIC); and (3) Bayesian information criterion (BIC). AIC and BIC were computed using standard expressions [10,11] and interpreted within a model-selection framework.

Table 3.
General equation of each growth model used for analysis.
| Model | Equation |
| von Bertalanffy | Y(t) = A × {1 – ³ |
| Gompertz | Y(t) = A × |
| logistic | Y(t) = |
| Richards | Y(t) = A × {1 + m × (-1/m) |
| Brody | Y(t)=A × {1 - |
In order to select the best model, the asymptotic index (AI), described by [19] was used, combining the Asymptotic Standard Deviation (ASD), Mean Absolute Deviation of residuals (MAD) and R² criteria, scaling each criterion to 100 at its best value and weighting others relative to that; AI was computed as AI = (ASD + MAD) − R²; lower AI indicates better overall fit. The lower the index, the better the adjustment of the model. The best model showed the lowest AI [20], together with biologically plausible parameters.
3. Results
The coefficient of determination (R²) was high across all models (>96%) for describing body weight, indicating good fitting capacity (Table 4). Gompertz and Richards yielded the highest R² (99.29%), followed by von Bertalanffy (99.28%) and logistic (99.25%). The Brody model, in turn, showed the lowest fit (96.95%), being less efficient at explaining the variation in the data. Similar results were reported by [13] in broilers and by [15] in quail, in which the Brody model presented inferior performance.
Regarding the Akaike information criterion (AIC), Gompertz presented the lowest value (261.85) and was therefore the statistically most adequate model. Close values were observed for von Bertalanffy (263.44) and Richards (263.76), whereas logistic (265.38) showed intermediate performance. Brody, once again, showed the worst fit, with the highest AIC (274.84).
A similar ranking was observed for BIC (Gompertz, 268.38), followed by von Bertalanffy (269.96), logistic (271.90), and Richards (272.45).
In the present study, the Gompertz model exhibited the lowest AIC and BIC, confirming its statistical superiority over the others. Similar outcomes were reported by [8] in broilers and by [16] in quail (meat-type/cutting), where information criteria helped identify Gompertz as the most appropriate model to describe the growth curve.
All models for describing carcass protein deposition (Table 5) presented high coefficients of determination (R² > 97%), as well as consistent AIC, BIC, and AI values, demonstrating good statistical fit quality. However, the biological applicability of parameters varied among models.
The model proposed by von Bertalanffy produced an asymptote of 33.93 g, close to the expected body protein in quail. However, the inflection point was negative (ti = −3.76 days), which disqualifies its use because it implies accelerated growth prior to hatching. A similar issue was reported by [5] when fitting body-composition curves in birds.
Brody overestimated body protein (a = 78.9 g), far above the expected value for the species, and showed a high AI (102.53), indicating low overall fit quality. This behavior has also been described in broilers [8], where the Brody model was not efficient for describing body components in fast-growing quail.
The Gompertz curve yielded biologically plausible parameters (a = 30.81 g; ti = 14.84 days; k = 0.0884), consistent with the experimentally observed phase of greatest protein deposition. Studies in broilers [13] and quail [15] likewise identified Gompertz as effective for representing protein deposition because it better reflects growth.
The logistic model provided the best overall fit for protein (AI = 38.81; lowest AIC and BIC), with a plausible asymptote (a = 27.30 g) and an inflection at 17.49 days within the experimental range. This performance supports its applicability for describing carcass protein deposition, and it agrees with evidence that the logistic curve can adequately represent nutrient deposition in birds when growth is approximately symmetrical [7].
Richards estimated a realistic asymptote (a = 27.16 g) and an inflection at 18.10 days; however, inclusion of the additional shape parameter m did not provide expressive gains over the logistic model, a result similar to that reported for broilers [4].
Taken together, Brody and von Bertalanffy should not be used to describe protein deposition in quail due to unrealistic asymptotes or biologically inconsistent inflection points. In contrast, Gompertz, logistic, and Richards presented consistent and statistically robust parameters, with logistic emerging as the most adequate because it combined better fit (lower AIC, BIC, and AI) with biological plausibility. Similar findings have been reported previously in quail [15], reinforcing the applicability of the logistic model to describe protein deposition in birds.
All models for describing carcass ash deposition (Table 6) presented high coefficients of determination (R² > 95%), with Gompertz, logistic, and Richards standing out (99%). The AIC, BIC, and AI values reinforce that these three models performed better than von Bertalanffy and, especially, Brody, which again showed the lowest fit (AI = 108.24).
For von Bertalanffy, the asymptote of 5.44 g is close to the biological reality for ash deposition in quail. However, the inflection point was negative (ti = −3.47 days), which makes biological interpretation infeasible because it implies accelerated growth before hatching—a result also found by [5] in broilers, who reported difficulties with this model during early growth.
Brody estimated a very high asymptote (a = 14.71 g), above the expected values for ash deposition in laying-type quail. This overestimation has likewise been reported in broilers [8], where the Brody model proved inefficient for body components.
For the Gompertz curve, the asymptote was plausible (a = 4.99 g), the growth rate was consistent (k = 0.0886), and the inflection occurred at 15.12 days, within the critical growth range. This is biologically coherent, indicating that the greatest ash deposition took place during the same phase of accelerated muscle growth (Table 4), as also described in broilers [13].
The logistic model also presented realistic parameters (a = 4.34 g; ti = 17.67 days) and a solid fit (AI = 77.44). As pointed out by [7], the logistic curve tends to represent nutrient deposition well when the growth trajectory is approximately symmetric.
The Richards curve estimated an asymptote of 4.55 g and an inflection at 10.49 days, values that are plausible and compatible with species biology. Its fit (AI = 74.15) was the best among the models, suggesting greater flexibility to describe the ash-deposition curve. A similar situation was reported in quail by [15], where Richards performed well for body ash. Overall, the Brody and von Bertalanffy models exhibited distortions—either an overestimated asymptote or a negative inflection point—and are therefore inadequate for ash deposition.
Gompertz, logistic, and Richards stood out with realistic parameters and statistical consistency. Among them, Richards presented the lowest AI (74.15), adequate statistical fit, and biological plausibility, making it, up to this point in the study, the most indicated for describing ash deposition in quail. However, Richards includes an extra parameter (m). Because information criteria such as AIC [10,11] already penalize additional complexity, model selection should prefer the simpler model when the gain in fit is small [12].
A large variation among models was observed for describing fat deposition (Table 7), with some presenting values that were statistically and biologically incoherent.
The von Bertalanffy curve estimated an extremely high asymptote (a = 13,912.6 g), incompatible with biological reality. The inflection point was also negative (ti = −1.09 days), making biological interpretation impossible. A similar situation was reported in broilers by [5] and [13], where von Bertalanffy overestimated fat-deposition parameters.
For Brody, the asymptote was likewise incoherent (a = 931.6 g) and the statistical fit was worse (AIC = 179.89; BIC = 186.41; AI = 200), confirming its inadequacy for describing fat deposition in growing quail; similar limitations were noted by [8].
The logistic model yielded a biologically realistic asymptote (a = 29.27 g) and an inflection at 38.28 days, just after the experimental window, consistent with the low initial fat deposition. Its statistical fit was strong (R² = 0.970; AIC = −4.40; BIC = 2.21; AI = −56.60), making logistic one of the most consistent models for this component.
The Gompertz model returned out-of-range parameters (a = 1,538.3 g; k = 0.0183; ti = 121.7 days). Although the asymptote remained overestimated relative to quail biology, the statistical fit was acceptable (R² = 0.969; AIC = −2.55). The inflection projected beyond the experimental period indicates slow, protracted fat deposition, compatible with quail physiology, in which fat accumulation intensifies in adulthood [6].
Results for Richards highlighted the best overall fit (R² = 0.979; AIC = −24.93; BIC = −16.23; AI = −63.38). The asymptote was plausible (a = 11.70 g) and the inflection occurred at 35.59 days, both biologically consistent with the fat-deposition profile of growing quail. The additional shape parameter (m = 142.2) afforded greater flexibility and improved description of fat growth, in line with findings for broilers [4].
From the selected equations (Table 8), we derived daily and cumulative deposition estimates (Table 9).
Using a Gompertz model, the present study estimated a maximum body weight of 138.09 g/quail for Japanese quails. For comparison, [6] reported weights at 35 days for females of the red and yellow strains of 130.79 and 119.73 g/quail, respectively. [22] found 156.48 and 110.25 g/quail at the same age for two strains developed in Japan by Gompertz model. [6] observed for a meat-type quail strain an estimated weight by the Gompertz equation of 236.61 g/quail for females and 216.09 g/quail for males.
We observed (Figure 1) peaks at 18 days for protein (≈1.082 g/day) and 15 days for ash (≈0.16 g/day), followed by an intensification of fat deposition (1.241 g/day) near 35 days. The maximum weight gain occurred at 16 days of age in Japanese quails (4.86 g/day). [6] reported, for the yellow strain, peak deposition at 18.4 days for protein (≈0.83 g/day) and 30 days for ash (≈0.24 g/day), with maximum weight gain at 21 days (4.10 g/day). For the red strain, peaks occurred at 17.8 days for protein (≈0.93 g/day) and 21.8 days for ash (≈0.23 g/day), and maximum weight gain was also reached at 21 days (4.52 g/day).
We normalized the variables to an index of 100, allowing a straightforward comparison of weight and nutrient deposition trajectories (Figure 2).
The trajectories (Figure 2) show clear inflection points and crossovers. Protein deposition peaks earlier (18 days), whereas fat deposition intensifies later (35 days). Two key inversions stand out: fat surpasses protein at 29.3 days, and the protein curve intersects body weight at 24.9 days.
These crossovers indicate a biological shift in nutrient use—protein predominates during early growth, while fat becomes proportionally more important at later stages. This pattern reflects the metabolic priorities of Japanese quails during ontogeny and aligns with reports for other poultry species.
4. Discussion
Model adequacy was assessed using R², AIC, BIC, and the Asymptotic Index (AI). AIC and BIC penalize over-parameterization, helping to avoid choices based solely on R² which can appear high even under unrealistic fits thereby promoting models that balance goodness-of-fit with biological coherence and statistical parsimony [13,15]. The information-theoretic framework for AIC and BIC followed [12]. The AI, originally proposed as a composite criterion for nonlinear regression, has been further validated for animal-science applications through simulation studies [19,20]. Under these criteria, the best-supported models in our data were Gompertz for body weight, logistic for protein, and Richards for fat.
The asymptotic index (AI) was used in this study as an integrating metric to simultaneously evaluate different statistical fit criteria such as the asymptotic standard deviation (ASD), the mean absolute deviation (MAD) of the residuals, and the coefficient of determination (R²). AI makes it possible to synthesize, into a single value, the global quality of fit, considering not only statistical precision but also the stability of the estimated parameters [7].
Lower AI values indicate more adequate models, as they reflect greater consistency between the adjusted parameters and the observed data. One of AI’s main differentiators relative to criteria such as AIC and BIC is that it not only penalizes model complexity but also integrates the variability of the estimated parameters, providing a more complete view of fit quality.
In our data, Gompertz showed the lowest AI and the most coherent parameters, aligning with prior reports in quail and broilers. Similar results were reported by [4], who emphasized AI’s efficiency as a comparative tool in broiler growth curves. Likewise, [15] observed that AI was decisive in identifying more consistent models in Japanese quail, reinforcing its applicability in avian species. These results confirm the greater robustness of the Gompertz model, which had already been pointed out as the most adequate by [14] in quail.
Thus, AI complements analyses based on R², AIC, and BIC, reducing the risk of selecting models with high explanatory power but biologically incoherent parameters. Its use is particularly relevant in animal science, where the biological interpretation of parameters (asymptote, growth rate, and inflection point) is just as important as statistical fit quality.
After the statistical analysis of the models, it becomes necessary to evaluate the biology of the estimated parameters, since a statistically well-fitted model does not always correspond to the reality of avian growth. The main parameters of interest are the asymptotic value (a), the growth rate (k), the curve’s inflection point (ti), and, in the case of the Richards model, the additional parameter m, which adjusts the curve’s shape.
Von Bertalanffy presented an asymptote of 193.1 g/quail, slightly above the final body weight expected for Japanese quail (140-160 g/quail). Nevertheless, the inflection point was negative (t = −5.81 days), which makes no biological sense because it suggests that the phase of greatest growth would have occurred even before hatching. This type of distortion has already been reported by [5,13], evidencing limitations of the model during early rapid growth.
For the Brody model, the estimated asymptote is completely unrealistic (a = 931.6 g/quail), far above the weight of any quail strain. This compromises its applicability, although it estimated an inflection point close to the start of the experimental period (ti = 0.60 day). Studies with broilers [8] and in quail (meat-type) [16] have also indicated that the Brody model tends to overestimate the asymptotic weight, being inadequate for short-cycle birds.
The Gompertz curve presented biologically consistent parameters, with an asymptote of 169.7 g/quail, within the real range observed for quail, and an inflection point at 15.65 days, a period compatible with the phase of greatest nutrient deposition. The growth rate (k = 0.0778) also remained within the expected range, consistent with other quail studies [15]. This shows the model’s good ability to describe the biological pattern of growth.
The logistic model produced plausible asymptotes and a symmetric curve, but did not capture the observed asymmetry of growth as well as Gompertz, which indicates a more symmetrical curve. According to [7], this behaviour is expected in the logistic model but does not always adequately reflect the asymmetry of real avian growth.
By contrast, Richards presented a plausible asymptote (a = 164.6 g/quail) but a negative inflection point (ti = −9.0 days), which compromises its biological interpretation. The additional parameter m could make the curve more flexible and improve the fit, but in this case yielded incoherent behaviour, as also described by [4] in broilers.
The joint analysis of the statistical and biological parameters shows that, although the von Bertalanffy, logistic, and Richards models presented acceptable fits and Brody was clearly inadequate the Gompertz model best described the body-weight curve of Japanese quail from 1 to 36 days of age. This model not only presented the best statistical indicators (lowest AIC, BIC, and AI, in addition to high R²) but also provided biologically plausible parameters: an asymptote compatible with the expected final weight, a consistent growth rate, and an inflection point at the critical developmental period (15 days of age). These results corroborate previous studies in different avian species, in which Gompertz was identified as the most consistent model to describe growth curves.
Evaluation of the different nonlinear models (Table 8) applied to growth and nutrient-deposition curves in Japanese quail from 1 to 36 d reveals important differences in both statistical fits and biological plausibility of parameters. It is observed that model choice varied according to the body component evaluated. The curves obtained allow direct relationships between body weight, nutrient deposition, and nutritional management of Japanese quail.
For body weight, the Gompertz model estimated an inflection point at 15.7 days (Table 8), indicating that the phase of greatest growth rate occurs precisely at the transition between the nutritional periods routinely adopted in practice (1–14 and 15–36 days). This reinforces the importance of nutrient-dense diets in the initial phase, ensuring adequate support for accelerated growth prior to the peak of deposition.
In protein deposition, the logistic model indicated an inflection point at 17.5 days (Table 8), coinciding with the phase of greatest protein requirement for muscle formation. This demonstrates that protein requirements increase at the start of the second phase (15–36 days). Thus, the curves obtained support adjusting protein and essential amino acid levels at this critical stage. Studies by [6] in quail had already highlighted the need to align protein-deposition inflection points with diet formulation.
For ash deposition, the Gompertz model estimated an inflection point at 15.1 days (Table 8), also in the intermediate stage of development. This reinforces the need for adequate supplementation of calcium and available phosphorus right after 14 days, ensuring support for skeletal growth and bone mineralization.
Studies by [7,15] confirm that the initial phase is marked by higher bone deposition, but maintaining adequate ash levels to the end of the second phase is essential to prevent structural problems and, for quail entering lay, to promote greater persistence of production, heavier eggs, and a longer peak of lay.
In fat deposition, the Richards model estimated an inflection point at 35.6 d (Table 8), indicating significant fat accumulation only at the end of the period studied. This pattern confirms that young quail prioritize protein and ash deposition in the first weeks, whereas fat accumulates later. In growers (30–36 days), the observed increase in fat deposition only suggests a higher dietary energy pull; however, energy increases should be limited to avoid unnecessary adiposity. The nutritional emphasis remains on meeting amino acid and mineral requirements while preventing excess energy supply. After the onset of lay, an appropriate energy-to-protein balance contributes to persistence of egg production
The estimated deposition of protein and ash (Table 9), as well as the ages at which maximum daily gain occurs in quail, fall around 15–18 days. These estimates were derived from the fitted equations in Table 8, which adequately describe growth and body nutrient deposition. Using mathematical models for this purpose is recommended because they enable the estimation of critical inflection points and maxima in nutrient deposition information essential for designing more efficient nutritional plans.
Several authors have already highlighted the importance of this approach. [3] emphasize that modelling growth and body composition allows identifying phases of higher protein and energy demand, optimizing diet formulation. The aforementioned studies also showed that nonlinear models (Gompertz, logistic, von Bertalanffy, Richards) are effective tools to predict nutritional requirements and adjust feeding programs according to productive goals (rapid growth, lean meat deposition, or control of excess fat).
Daily protein deposition peaked (1.082 g/day), at 18 days of age (Figure 1), whereas ash deposition (0.162 g/day) stabilizes a few days earlier, around 15–16 days (within the 15–18 days window). From this period onward, there is a progressive decline in daily protein and ash deposition rates, while fat deposition (1.241 g/day) increases sharply, reaching an asymptote at 35 days (Figure 1). Similar results were described by [6].
The inversion of the deposition pattern (Figure 1), when fat deposition surpasses ash deposition, occurs at about 18.6 days, evidencing the moment when ash demand for ossification has been largely met [21]. However, the general metabolism of quail starts to prioritize energy storage at about 28.7 days, when protein and fat deposition rates are inverted. This transition, already described in broilers by [13], coincides with the decline in the efficiency of dietary protein use and the increase in lipogenesis.
Maximum carcass ash deposition occurred at 15 days (Figure 1), slightly before the protein peak at 18 days, however, these events are closely related. This indicates that during the first weeks of life, the supply of protein and ash (calcium and phosphorus) is critical for the optimal growth of quail. This represents a strategic point to better prepare the quail for ovarian development and to ensure a more persistent and prolonged laying period.
Nutrient deposition data, originally expressed in g, were normalized to a relative scale (0-100%) to enable direct biological comparison among components. This approach allows for the identification of the periods during which protein and fat deposition exert greater influence on overall growth. By standardizing deposition curves, it becomes possible to highlight the temporal relationship between protein accretion and fat deposition (Figure 2), providing insights into the physiological priorities for growth and body composition development in Japanese quail.
From 24.9 to 29.3 days, the fat deposition curve becomes steeper, with daily fat deposition increasing from 28.36 to 46.98% of the 35-days peak, a 65.66% increase. This pattern indicates a shift in which body-weight gain begins to be supported not only by protein intake but also increasingly by energy intake. During this interval, quail reach 75.66% (104.48 g/quail) to 86.14% (118.95 g/quail) of the 36-day body weight (138.09 g/quail). It is worth noting that, although in decline, protein deposition still sustains body-weight gain during this period; compared with the peak at 18 days, protein deposition has already fallen by 19.61 percentage points at 24.99 days (80.4 vs 100%; 0.870 vs 1.082 g/day).
From 29.3 to 36 days, the fat deposition curve becomes even steeper: daily fat deposition increases from 46.98% (at 29.3 days) to 100% at 35 days, an additional gain of 53.02 percentage points, or a 113% increase. Over the same period, protein deposition decreases from 50.65% (0.548 g/day) to 23.66% (0.256 g/day) relative to the maximum already reached at 18 days of age (100% – 1.082 g/day), a 53% reduction. During this stage, quail increase in body weight from 118.95 to 135.81 g/bird by 35 days.
The intersection point (29.3 days) represents a physiological milestone, at which protein demand declines and energy demand increases. It is important to note that this increase corresponds to only 14.17%. In other words, the growth rate is extremely low, and at this age, most of the energy consumed is used for maintenance rather than for body-weight gain. As a result, the dietary energy-to-protein ratio reaches its maximum during the initial 36 days of life. The diet should ensure at least a minimal weight gain so that the birds can sustain persistence and egg production during the laying phase. After lay begins, maintaining an appropriate energy-to-protein balance supports persistence of egg production [9].
The joint analysis of the fitted equations (Table 8) and the estimated values (Table 9) allow nutritional strategies to be inferred from Figure 1 and Figure 2. The results presented here confirm the relevance of modelling growth and deposition curves as a tool for decision-making in quail nutrition. We propose changing the nutritional plan for growing Japanese quail from the current scheme (1–14 and 15–36 days), as recommended by the Brazilian Tables for Poultry and Swine [2], to 1–18, 19–29, and 30–36 days.
5. Conclusions
The Gompertz model was the most consistent for describing body-weight growth: BW(t) = 169.7 × and for ash deposition: Ad(t) = 4.99 × . For protein deposition (Pd), the logistic model showed the best fit: Pd(t) = . The Richards model best described fat deposition (Fd): Fd(t) = 11.70 × [1 + 142.2 × ]-1/142.2.
Taken together, these patterns support a three-phase, data-driven feeding program: (I) 1–18 d—amino-acid dense; (II) 19-29 d—transitional balance; (III) 30-36 d—a slightly higher energy-to-protein ratio with restrained energy increases to limit fat gain, while prioritizing amino acids and minerals. After the onset of lay, an appropriate energy balance supports the persistence of egg production.
Author Contributions
Conceptualization, D.V., F.C.; Methodology, D.V., J.R., J.S., D.C., A.C., A.F.; Formal analysis, A.C., D.V.; Investigation, J.R., J.S., A.F., V.B., A.L., C.N., E.S.; Data curation, J.R., V.B., C.N., E.S.; Resources, W.P., F.C.; Writing—original draft, D.V.; Writing—review & editing, D.V., R.G., F.C., M.L., D.C., A.L.; Visualization, J.R., M.L.; Supervision, D.V., F.C.; Project administration, D.V.; Funding acquisition, D.V., R.G., W.P., F.C. All authors have read and agreed to the published version of the manuscript.
Funding
The authors declare that financial support was received for the research and/or publication of this article. Granja Fujikura® provided the animals used in the experi-ments; PROPESQ/UFNT granted a research scholarship; and the Federal University of Paraíba (UFPB) supported the laboratory analyses. The funders had no role in study design, data collection and analysis, decision to publish, or preparation of the manu-script.
Institutional Review Board Statement
The project was reviewed and approved by the Ethics Committee on the Use of Animals in Research at the Federal University of Northern Tocantins (UFNT) under protocol no. 11/2024 and complied with national and international standards for animal experimentation. The study was conducted in accordance with local legislation and institutional requirements.
Informed Consent Statement
Not applicable.
Data Availability Statement
The data supporting the findings of this study are available upon request from the corresponding author.
Acknowledgments
We express our sincere gratitude to the Office for Research (PROPESQ/UFNT) and to the Poultry Studies and Research Group (GEPA/UFNT) for their essential support in conducting this experiment. We gratefully acknowledge the Scientific Initiation fellowships granted by the Tocantins Research Foundation (FAPT) and the Brazilian National Council for Scientific and Technological Development (CNPq). We are thankful to Fujikura® and Granforte® Nutrição Animal for their partnership, which made this study possible. Finally, we thank the Poultry Study Group (GETA/UFPB) for their valuable collaboration.
Conflicts of Interest
The authors declare that the research was conducted in the absence of any commercial or financial relationships that could be construed as a potential conflict of interest.
References
- Silva, J.H.V.; Costa, F.G.P. Tables for Japanese and European Quail; FUNEP: Jaboticabal, Brazil, 2009.
- Rostagno, H.S.; Albino, L.F.T.; Hannas, M.I.; Donzele, J.L.; Sakomura, N.K.; Perazzo, F.G.; et al. Brazilian Tables for Poultry and Pigs: Composition of Feedstuffs and Nutrient Requirements; 5th ed.; UFV: Viçosa, MG, Brazil, 2024. [Google Scholar]
- Sakomura, N.K.; Rostagno, H.S. Growth models and nutrient requirements. In Nutrição de Não Ruminantes; Sakomura, N.K., Rostagno, H.S., Albino, L.F.T., Gomes, P.C., Eds.; FUNEP: Jaboticabal, Brazil, 2016; pp. 283–310. [Google Scholar]
- Cassiano, F.R.; Sáfadi, T. Animal growth models for irregular times. Pesqui. Agropecu. Bras. 2015, 50, 1114–1119. [Google Scholar] [CrossRef]
- Neme, R.; Sakomura, N.K.; Fukayama, E.H.; Freitas, E.R. Growth curves and deposition of body components in pullets of different strains. Rev. Bras. Zootec. 2006, 35, 1421–1430. [Google Scholar] [CrossRef]
- Grieser, D.O.; Marcato, S.M.; Furlan, A.C.; Zancanela, V.; Gasparino, E.; Del Vesco, A.P.; et al. Adjustment of nonlinear models and growth parameters and body nutrient deposition in meat-type and laying quail. Rev. Bras. Zootec. 2018, 47, e20170244. [Google Scholar] [CrossRef]
- Tholon, P.; Queiroz, S.A. Mathematic models applied to describe growth curves in poultry applied to animal breeding. Ciênc. Rural 2009, 39, 2261–2269. [Google Scholar] [CrossRef]
- Darmani-Kuhi, H.; Porter, T.; López, S.; Kebreab, E.; Strathe, A.B.; Dumas, A.; et al. A review of mathematical functions for the analysis of growth in poultry. Worlds Poult. Sci. J. 2010, 66, 227–239. [Google Scholar] [CrossRef]
- Gous, R.M. Modelling as a research tool for poultry scientists. Poult. Sci. 2014, 93, 1–7. [Google Scholar] [CrossRef] [PubMed]
- Akaike, H. A new look at statistical model identification. IEEE Trans. Autom. Control 1974, 19, 716–723. [Google Scholar] [CrossRef]
- Schwarz, G. Estimating the dimension of a model. Ann. Stat. 1978, 6, 461–464. [Google Scholar] [CrossRef]
- Burnham, K.P.; Anderson, D.R. Model Selection and Multimodel Inference: A Practical Information-Theoretic Approach; 2nd ed.; Springer: New York, NY, USA, 2002. [Google Scholar] [CrossRef]
- Marcato, S.M.; Sakomura, N.K.; Munari, D.P.; Fernandes, J.B.K.; Siqueira, J.C.; Bonato, M.A. Growth and nutrients deposition on organs of two commercial strains of broiler chickens. Rev. Bras. Zootec. 2010, 39, 1082–1091. [Google Scholar] [CrossRef]
- Nahashon, S.N.; Aggrey, S.E.; Adefope, N.A.; Amenyenu, A.; Wright, D. Growth characteristics of pearl gray guinea fowl as predicted by the Richards, Gompertz, and logistic models. Poult. Sci. 2006, 85, 359–363. [Google Scholar] [CrossRef] [PubMed]
- Finco, E.M.; Marcato, S.M.; Furlan, A.C.; Rossi, R.M.; Grieser, D.O.; Zancanela, V.; et al. Adjustment of four growth models through Bayesian inference on weight and body nutrient depositions in laying quail. Rev. Bras. Zootec. 2016, 45, 737–744. [Google Scholar] [CrossRef]
- Ton, A.P.S.; Laureano, M.M.M.; Araújo, S.I.; Menezes, F.L.; Araújo, C.V. Adjustment of growth curves in cutting quails by Bayesian inference. Res. Soc. Dev. 2021, 10, e8910615530. [Google Scholar] [CrossRef]
- SAS Institute. SAS/STAT User’s Guide; Version 8; SAS Institute Inc.: Cary, NC, USA, 2000. [Google Scholar]
- Brody, S. Bioenergetics and Growth; Reinhold: New York, NY, USA, 1945. [Google Scholar]
- Ratkowsky, D.A. Principles of nonlinear regression modeling. J. Ind. Microbiol. 1993, 12, 195–199. [Google Scholar] [CrossRef]
- Silva, C.E.M.; Silva, J.A. II; Oliveira, H.R.; de Oliveira, H.C.; Paiva, M.A.R.; Nascimento, M.; Silva, F.F. Asymptotic index: An alternative model selection criterion in nonlinear regression by Monte Carlo simulation. Acta Sci. Technol. 2024, 46, e68341. [Google Scholar] [CrossRef]
- Henn, J.D.; Bockor, L.I.; Ribeiro, A.M.L.; Coldebella, A.; Kessler, A. de M. Growth and deposition of body components of intermediate and high-performance broilers. Braz. J. Poult. Sci. 2014, 16, 319–328. [Google Scholar] [CrossRef]
- Haqani, B. , Narinc, D., Mikami, O., & Takahashi, H. (2021). Growth performance and nonlinear growth curve functions of large- and normal-sized Japanese quail (Coturnix japonica). The Journal of Poultry Science, 58(2), 73–81. [CrossRef]
- Vieira, D. V. G.; Oliveira, E. J. N.; Souza, R. G. Mathematical models to predict Japanese quail crude protein requirements from 01 to 35 days old. Research, Society and Development. 2020, 9(8), e763986160. [CrossRef]
Figure 1.
Nutrient deposition (g/day) in Japanese quail from 1 to 36 days of age.
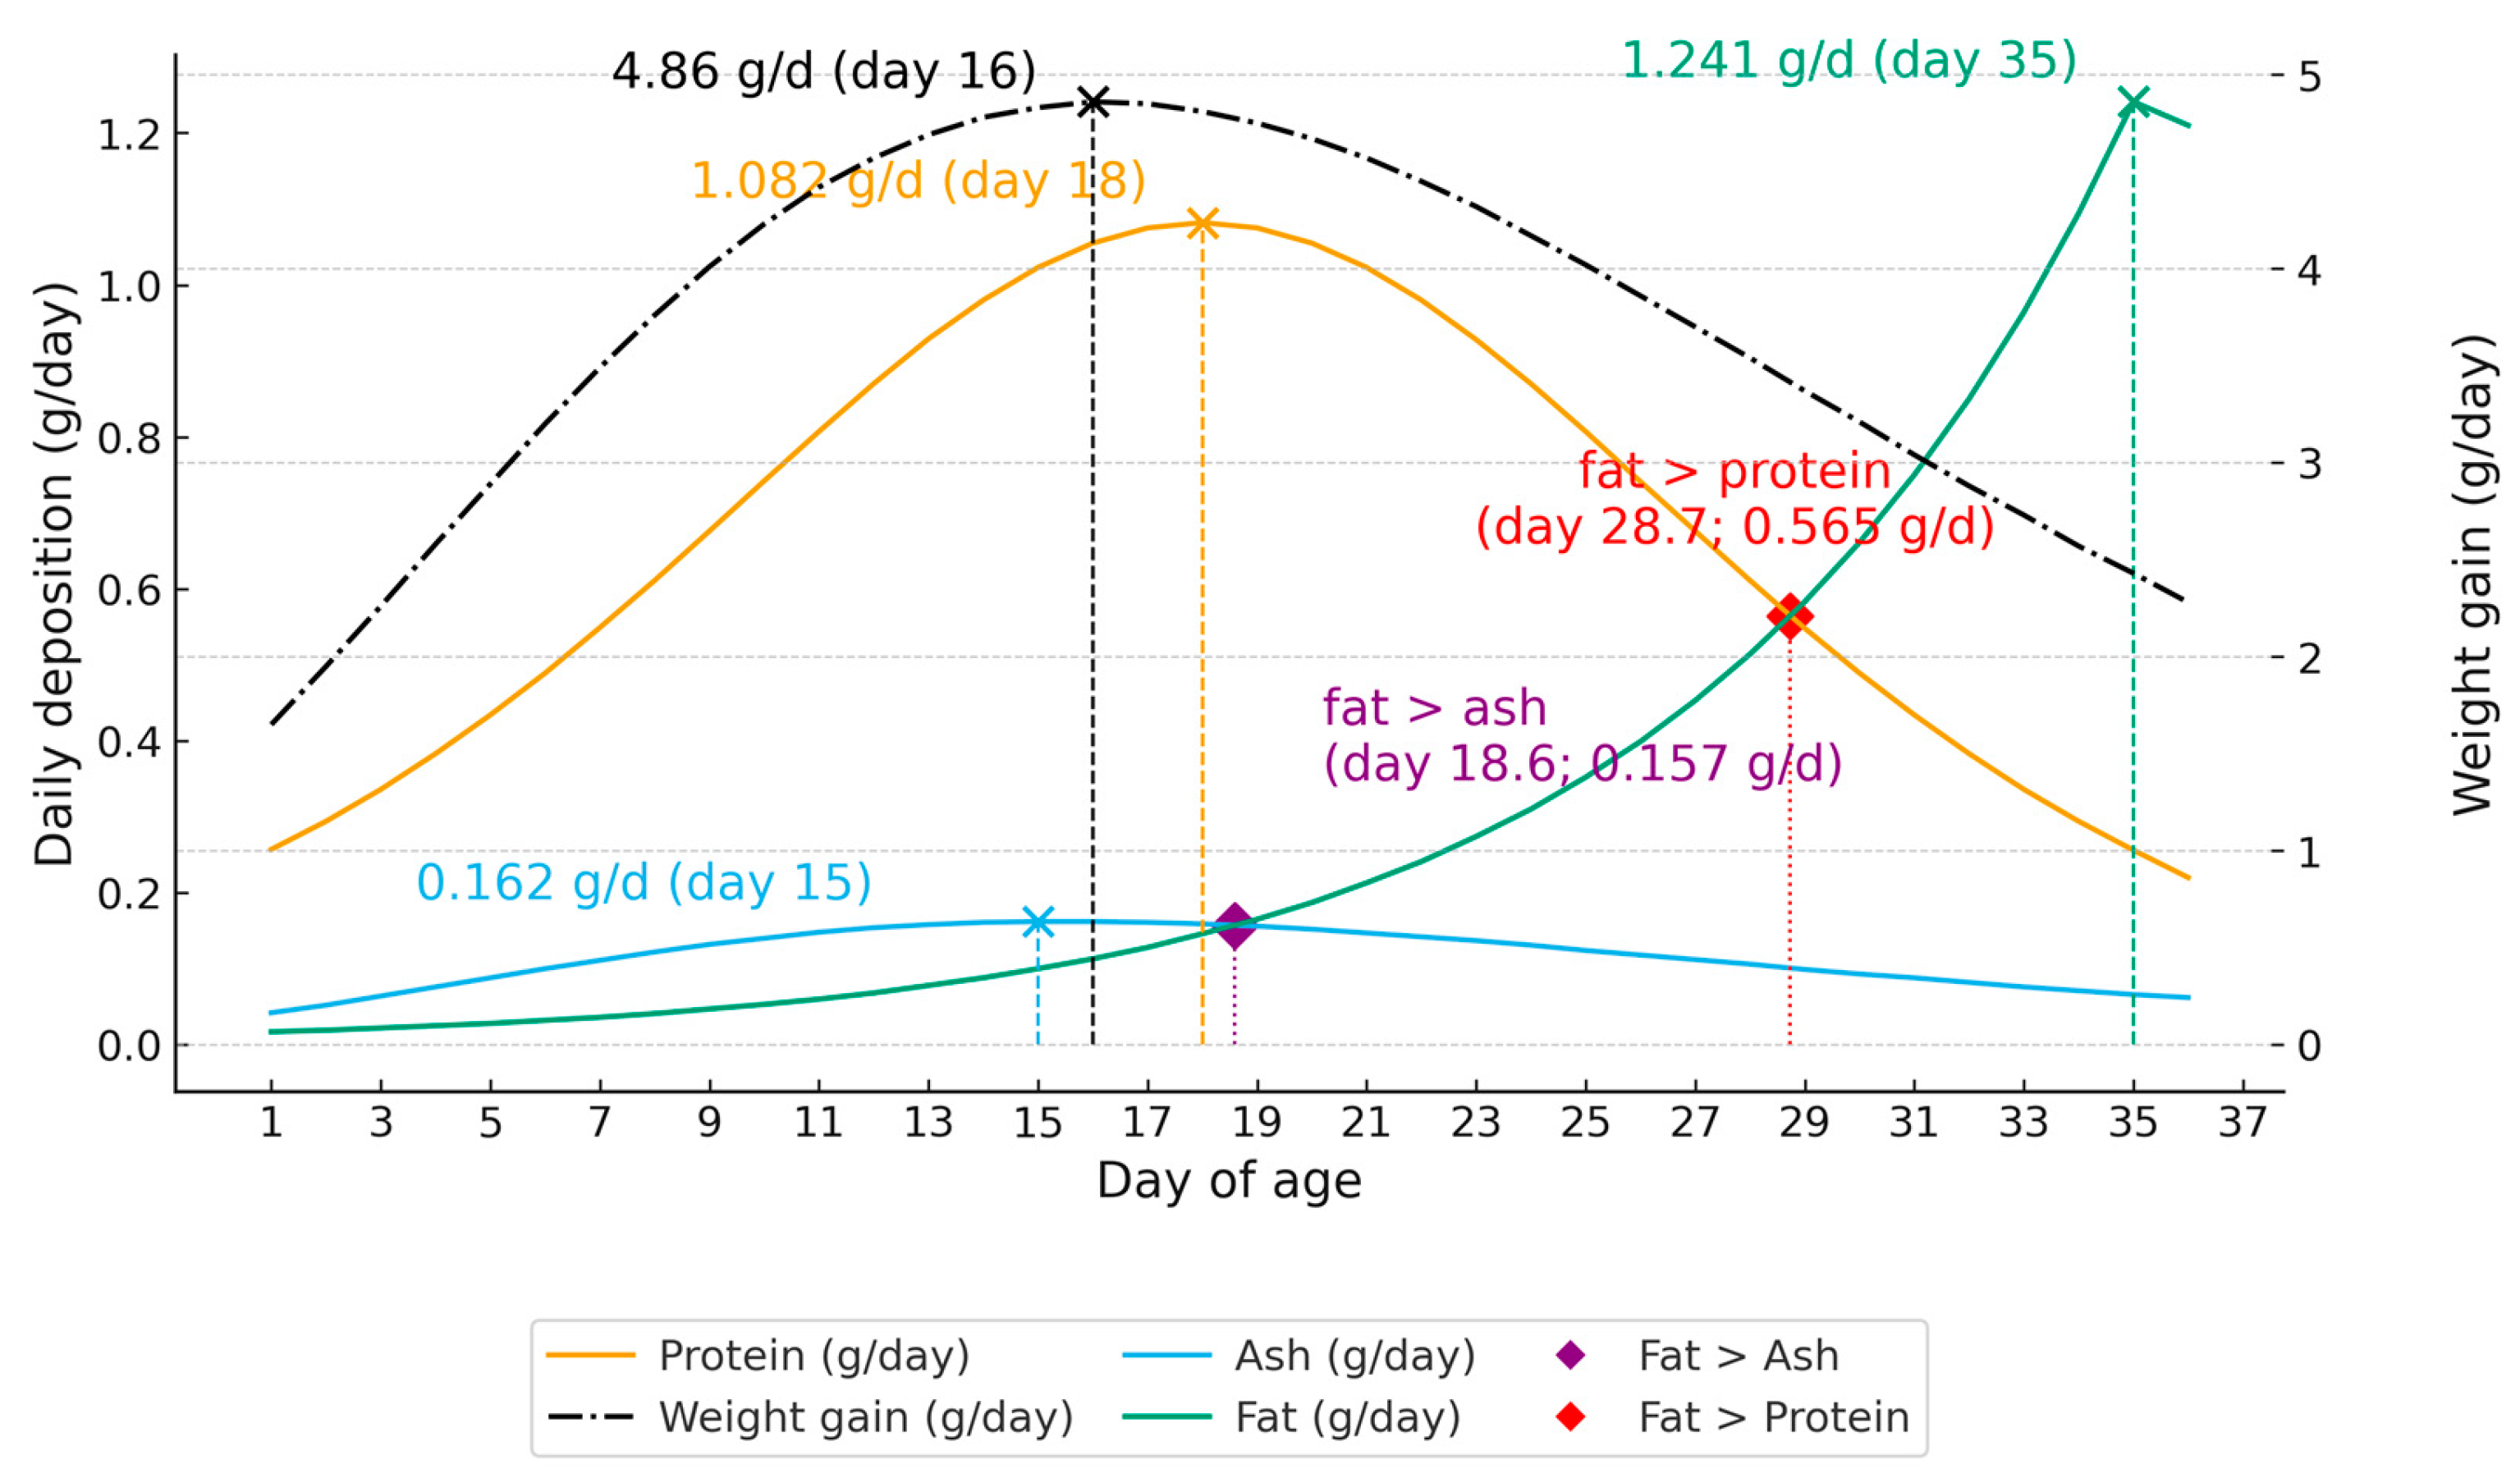
Figure 2.
Nutrient deposition (%) in Japanese quail from 1 to 36 days of age.
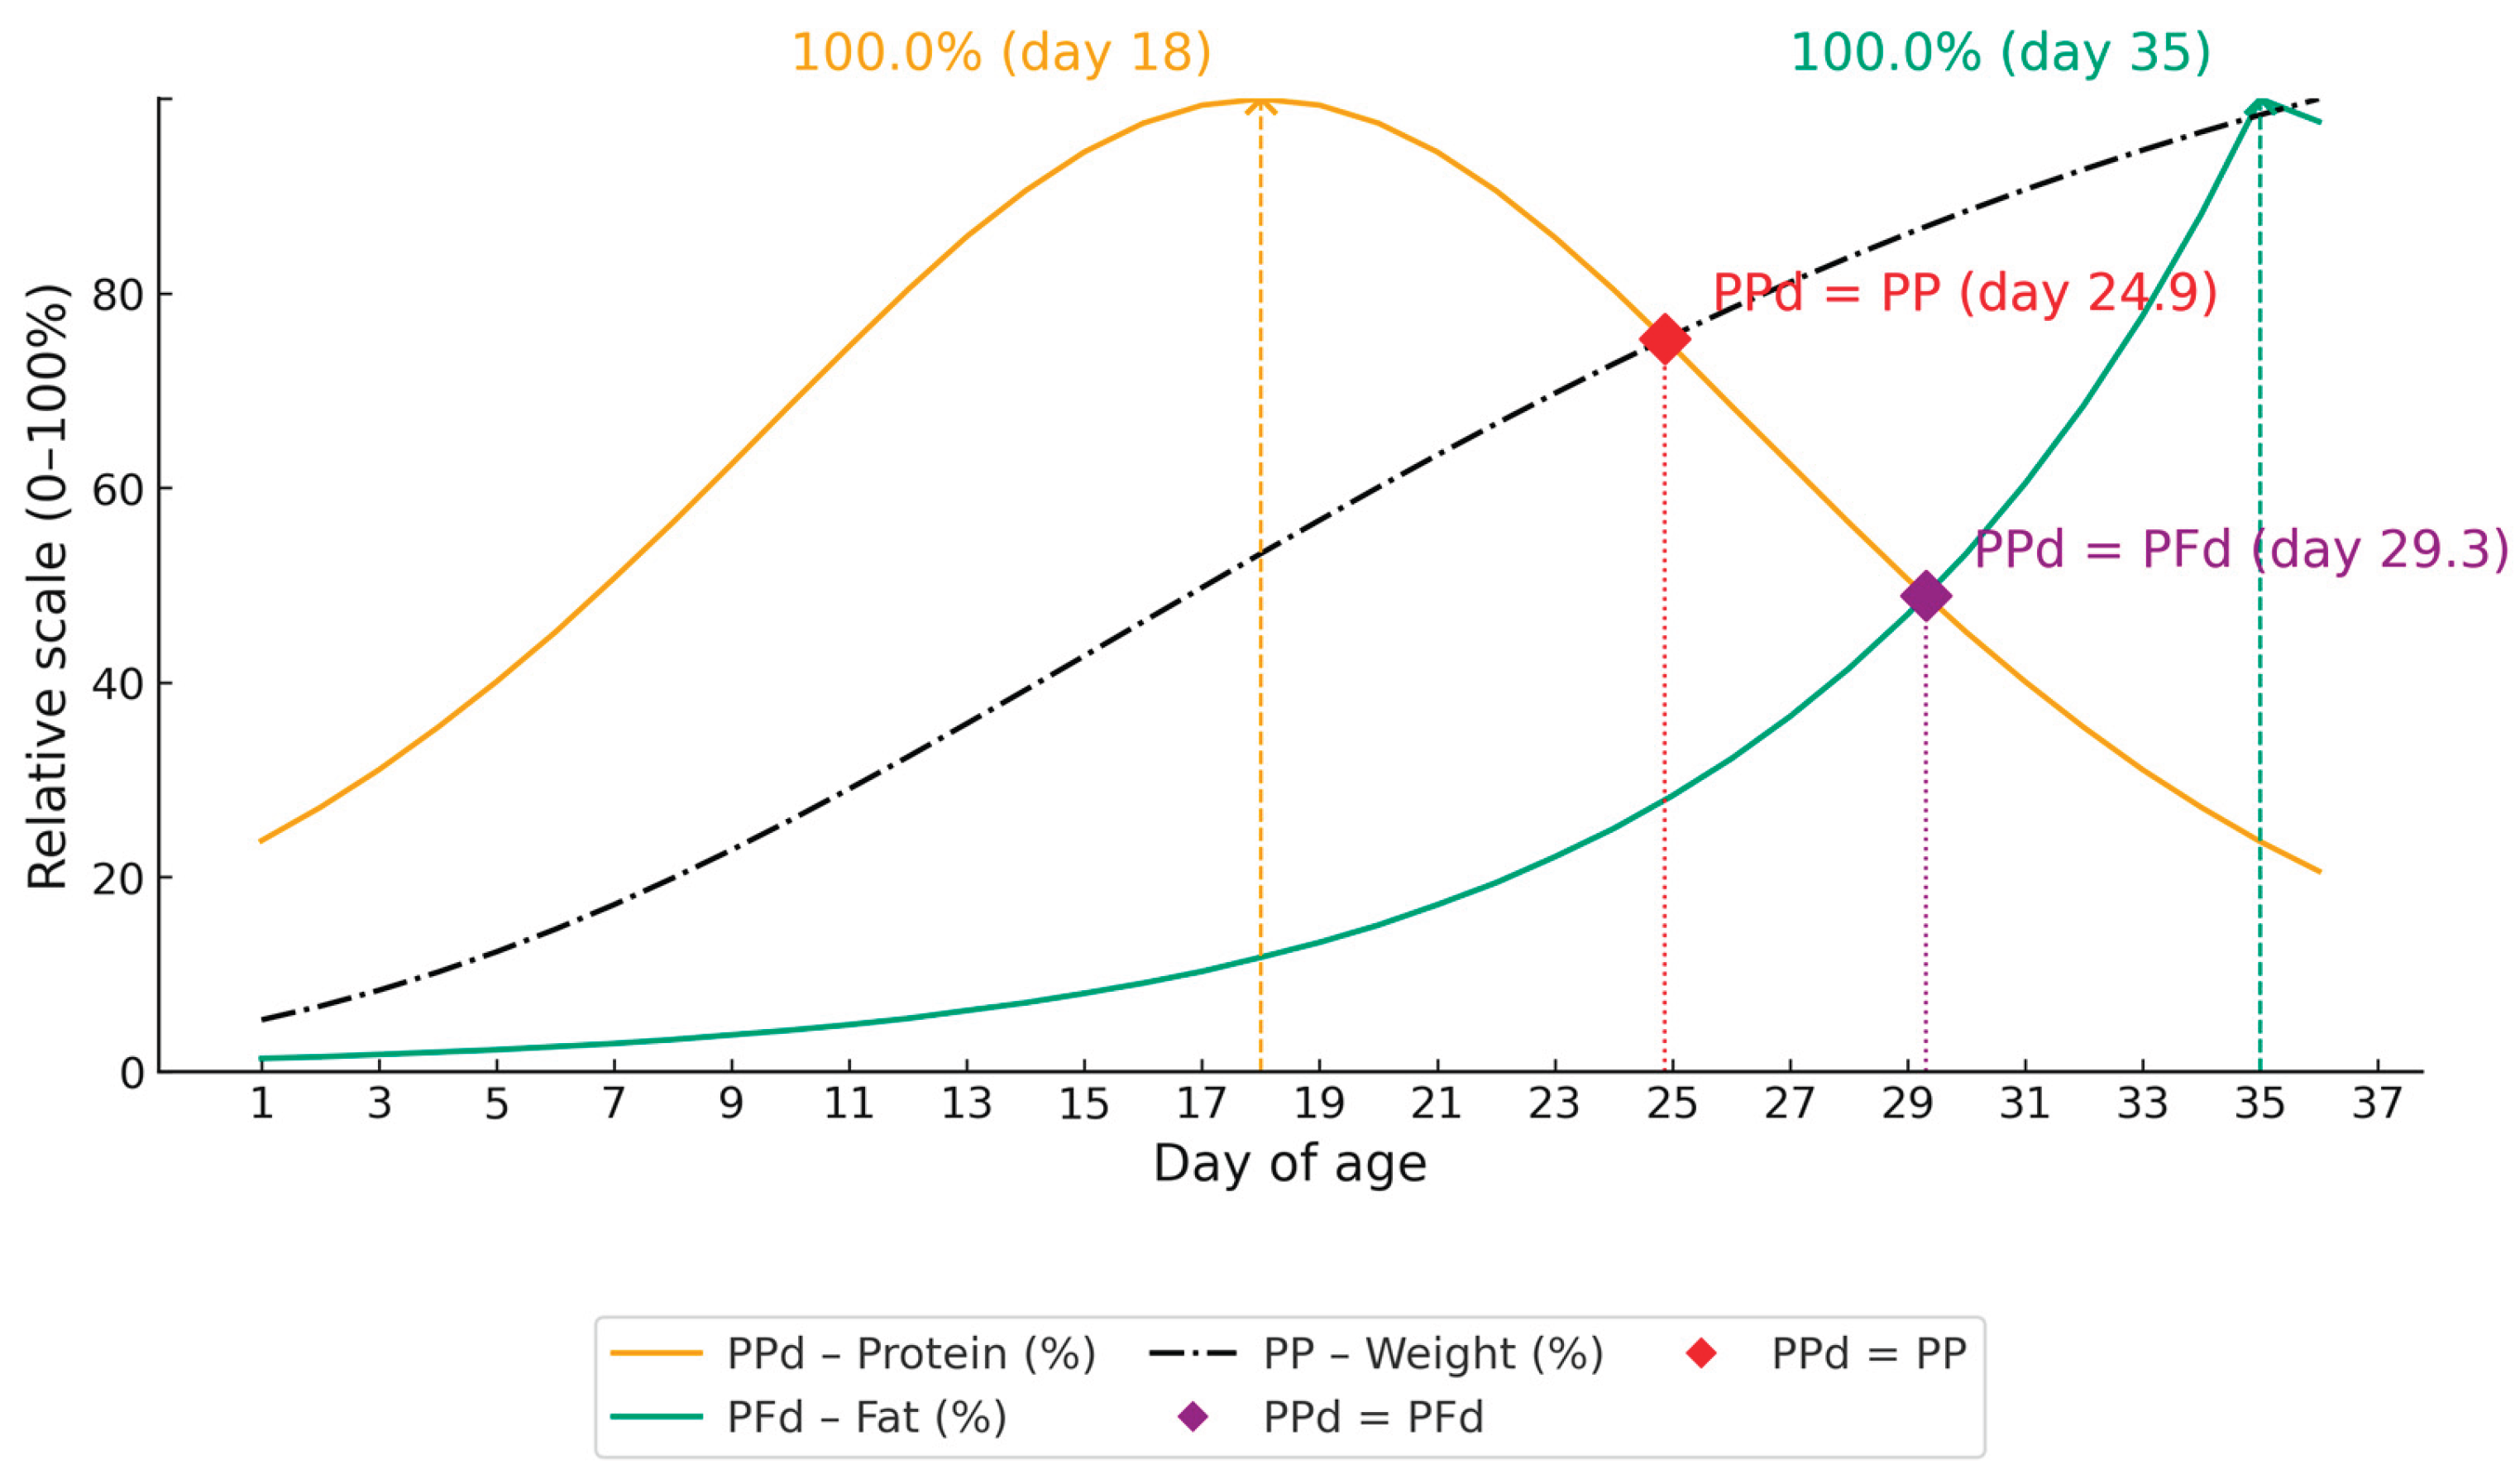
Table 1.
Ingredient composition of the experimental diets.
| Ingredients (g/kg) | 01-14 days | 15-36 days |
| Corn | 578.05 | 598.11 |
| Soybean meal | 368.62 | 360.82 |
| Degummed oil | 12.78 | 7.63 |
| Dicalcium phosphate | 22.07 | 17.49 |
| Calcitic limestone | 10.99 | 9.23 |
| Common salt | 4.83 | 5.06 |
| DL-Methionine 99% | 1.61 | 1.13 |
| L-Lysine HCl 78.4% | 0.63 | 0.05 |
| L-Threonine 98.5% | 0.02 | 0.09 |
| Premix1 | 0.40 | 0.40 |
| Total | 1000.0 | 1000.0 |
| Calculated nutrient composition of the experimental diets | ||
| Nutrients (g/kg) | 01-14 days | 15-36 days |
| Crude protein | 212.8 | 210.9 |
| Metabolizable energy (MJ/kg) | 12.13 | 12.13 |
| Calcium | 10.92 | 9.11 |
| Available phosphorus | 5.13 | 4.28 |
| Sodium | 2.05 | 2.14 |
| Potassium | 8.60 | 8.52 |
| Chloride | 3.71 | 3.74 |
| Electrolyte balance (mEq/kg) | 204.5 | 290.5 |
| Digestible lysine | 10.95 | 10.34 |
| Digestible methionine + cysteine | 7.44 | 6.93 |
| Digestible threonine | 7.33 | 7.34 |
| Digestible valine | 8.98 | 8.89 |
| Digestible isoleucine | 8.35 | 8.26 |
| Digestible tryptophan | 2.45 | 2.42 |
| Digestible arginine | 13.43 | 13.26 |
| Digestible histidine | 5.22 | 5.18 |
| Digestible glycine + serine | 17.34 | 17.16 |
| Digestible phenylalanine + tyrosine | 17.22 | 17.05 |
| Digestible leucine | 16.80 | 16.74 |
1Premix supplied the following per kg of diet: Mn, 18.175 mg; Zn, 17.5 mg; Fe, 11.25 mg; Cu, 2.0 mg; I, 0.1875 mg; Se, 0.075 mg; vitamin A, 0.482 mg (retinyl acetate); vitamin D₃, 0.0075 mg (cholecalciferol); vitamin E, 2.5 mg (dl-α-tocopheryl acetate); vitamin K₃, 0.3 mg; thiamine (vitamin B₁), 0.38 mg; riboflavin (vitamin B₂), 1.0 mg; vitamin B6, 0.52 mg; vitamin B₁₂, 2.0 mg; folic acid, 0.1625 mg; pantothenic acid, 2.6 mg; niacin, 7.0 mg; choline chloride, 71.593 mg; antioxidant, 25.0 mg; halquinol, 7.5 mg; salinomycin, 16.5 mg.
Table 2.
Slaughter schedule (number of quail per slaughter and per replicate).
| Slaughter no. | 1º | 2º | 3º | 4º | 5º | 6º | 7º | 8º | 9º | 10º | 11º | 12º | 13º | |
| Age (day) | 1 | 3 | 6 | 9 | 12 | 15 | 18 | 21 | 24 | 27 | 30 | 33 | 36 | |
| Total quails | 1ER.1 | 15 | 8 | 6 | 5 | 5 | 4 | 2 | 2 | 2 | 2 | 2 | 2 | 2 |
| 1ER.2 | 8 | 6 | 5 | 5 | 4 | 2 | 2 | 2 | 2 | 2 | 2 | 2 | ||
| 1ER.3 | 8 | 6 | 5 | 5 | 4 | 2 | 2 | 2 | 2 | 2 | 2 | 2 | ||
| 1ER.4 | 8 | 6 | 5 | 5 | 4 | 2 | 2 | 2 | 2 | 2 | 2 | 2 | ||
| 1ER.5 | 8 | 6 | 5 | 5 | 4 | 2 | 2 | 2 | 2 | 2 | 2 | 2 | ||
1Rep = experimental replicate.
Table 4.
Nonlinear model parameters for body weight.
| Parameters | von Bertalanffy | Brody | Gompertz | logistic | Richards |
| 1a | 193.1 | 931.6 | 169.7 | 145.3 | 164.6 |
| 2k | 0.0544 | 0.0047 | 0.0778 | 0.146 | 0.0859 |
| 3ti | -5.8152 | 0.6045 | 15.6527 | 18.0295 | -9.0042 |
| 4m | --- | --- | --- | --- | 0.117 |
| 5(R²) | 99.28 | 96.95 | 99.29 | 99.25 | 99.29 |
| 6ASD | 7.41 | 8.09 | 7.32 | 7.53 | 7.38 |
| 7MAD | 4.53 | 5.76 | 4.26 | 4.90 | 4.26 |
| 8AIC | 263.44 | 274.84 | 261.85 | 265.38 | 263.76 |
| 9BIC | 269.96 | 281.36 | 268.38 | 271.90 | 272.45 |
| 10AI | 70.33 | 102.35 | 64.45 | 78.21 | 65.13 |
1Asymptotic parameter; 2Growth rate; 3Curve inflection point; 4Shape parameter; 5Coefficient of determination; 6Asymptotic standard deviation; 7Mean absolute deviation of residuals; 8Akaike information criterion; 9Bayesian information criterion; 10Asymptotic index.
Table 5.
Nonlinear model parameters for protein deposition.
| Parameters | von Bertalanffy | Brody | Gompertz | logistic | Richards |
| 1a | 33.936 | 78.9198 | 30.8109 | 27.3032 | 27.1683 |
| 2k | 0.0643 | 0.0124 | 0.0884 | 0.1586 | 0.164 |
| 3ti | -3.7621 | 1.7467 | 14.8421 | 17.497 | 18.1046 |
| 4m | --- | --- | --- | --- | 1.0782 |
| 5(R²) | 99.5 | 97.1 | 99.56 | 99.62 | 99.62 |
| 6ASD | 1.18 | 1.43 | 1.12 | 1.05 | 1.06 |
| 7MAD | 0.81 | 1.05 | 0.73 | 0.69 | 0.69 |
| 8AIC | 24.92 | 49.46 | 17.41 | 9.00 | 10.97 |
| 9BIC | 31.44 | 55.98 | 23.93 | 15.52 | 19.66 |
| 10AI | 59.57 | 102.52 | 47.34 | 38.81 | 39.89 |
1Asymptotic parameter; 2Growth rate; 3Curve inflection point; 4Shape parameter; 5Coefficient of determination; 6Asymptotic standard deviation; 7Mean absolute deviation of residuals; 8Akaike information criterion; 9Bayesian information criterion; 10Asymptotic index.
Table 6.
Nonlinear model parameters for ash deposition.
| Parameters | von Bertalanffy | Brody | Gompertz | logistic | Richards |
| 1a | 5.445 | 14.709 | 4.992 | 4.341 | 4.553 |
| 2k | 0.064 | 0.011 | 0.089 | 0.160 | 0.123 |
| 3ti | -3.478 | 1.931 | 15.122 | 17.673 | 10.487 |
| 4m | --- | --- | --- | --- | 0.476 |
| 5(R²) | 98.97 | 95.25 | 99.00 | 99.00 | 99.00 |
| 6ASD | 0.272 | 0.297 | 0.267 | 0.266 | 0.267 |
| 7MAD | 0.168 | 0.205 | 0.158 | 0.158 | 0.151 |
| 8AIC | -166.28 | -154.73 | -168.63 | -168.84 | -167.63 |
| 9BIC | -159.76 | -148.20 | -162.12 | -162.32 | -158.93 |
| 10AI | 83.62 | 108.25 | 77.40 | 77.44 | 74.15 |
1Asymptotic parameter; 2Growth rate; 3Curve inflection point; 4Shape parameter; 5Coefficient of determination; 6Asymptotic standard deviation; 7Mean absolute deviation of residuals; 8Akaike information criterion; 9Bayesian information criterion; 10Asymptotic index.
Table 7.
Nonlinear model parameters for fat deposition.
| Parameters | von Bertalanffy | Brody | Gompertz | logistic | Richards |
| 1a | 13912.60 | 931.60 | 1538.30 | 29.270 | 11.701 |
| 2k | 0.003 | 0.005 | 0.018 | 0.134 | 17.919 |
| 3ti | -1.094 | 0.605 | 121.70 | 38.281 | 35.597 |
| 4m | --- | --- | --- | --- | 142.20 |
| 5(R²) | Not estimated | 0.969 | 0.970 | 0.979 | |
| 6ASD | 0.99 | 3.90 | 0.96 | 0.94 | 0.80 |
| 7MAD | 0.62 | 2.92 | 0.53 | 0.53 | 0.46 |
| 8AIC | 1.68 | 179.89 | -2.55 | -4.40 | -24.93 |
| 9BIC | 8.20 | 186.41 | 3.96 | 2.212 | -16.23 |
| 10AI | 46.56 | 200.00 | -56.25 | -56.60 | -63.38 |
1Asymptotic parameter; 2Growth rate; 3Curve inflection point; 4Shape parameter; 5Coefficient of determination; 6Asymptotic standard deviation; 7Mean absolute deviation of residuals; 8Akaike information criterion; 9Bayesian information criterion; 10Asymptotic index.
Table 8.
Selected models for each variable, with the corresponding equations and estimated parameters (A, k, tᵢ, and m when applicable).
Table 8.
Selected models for each variable, with the corresponding equations and estimated parameters (A, k, tᵢ, and m when applicable).
| Variable | Model | Equation |
| Body weight (BW) | Gompertz | BW(t) = 169.7 × |
| Protein deposition (Pd) | logistic | Pd(t) = |
| Ash deposition (Ad) | Gompertz | Ad(t) = 4.99 × |
| Fat deposition (Fd) | Richards | Fd(t) = 11.70 × [1 + 142.2 × ](-1/142.2) |
Table 9.
Estimates of body weight, daily and cumulative depositions, and relative percentages (1–36 days).
Table 9.
Estimates of body weight, daily and cumulative depositions, and relative percentages (1–36 days).
| Day | 1BW | 2DWG | 3PP | 4AP | 5DPd | 6PPd | 7AA | 8DAd | 6PAd | 9AF | 10DFd | 6PFd |
| 01 | 7.36 | 1.65 | 5.33 | 1.86 | 0.257 | 23.75 | 0.15 | 0.042 | 25.93 | 0.14 | 0.017 | 1.37 |
| 02 | 9.31 | 1.95 | 6.74 | 2.15 | 0.294 | 27.17 | 0.21 | 0.052 | 32.10 | 0.16 | 0.019 | 1.53 |
| 03 | 11.57 | 2.26 | 8.38 | 2.49 | 0.336 | 31.05 | 0.27 | 0.064 | 39.51 | 0.19 | 0.022 | 1.77 |
| 04 | 14.14 | 2.58 | 10.24 | 2.87 | 0.383 | 35.40 | 0.34 | 0.076 | 46.91 | 0.21 | 0.025 | 2.01 |
| 05 | 17.03 | 2.89 | 12.33 | 3.31 | 0.434 | 40.11 | 0.43 | 0.088 | 54.32 | 0.24 | 0.028 | 2.26 |
| 06 | 20.23 | 3.20 | 14.65 | 3.80 | 0.489 | 45.19 | 0.53 | 0.100 | 61.73 | 0.27 | 0.032 | 2.58 |
| 07 | 23.72 | 3.49 | 17.18 | 4.34 | 0.549 | 50.74 | 0.64 | 0.111 | 68.52 | 0.31 | 0.036 | 2.90 |
| 08 | 27.49 | 3.76 | 19.91 | 4.96 | 0.611 | 56.47 | 0.77 | 0.122 | 75.31 | 0.35 | 0.041 | 3.30 |
| 09 | 31.50 | 4.01 | 22.81 | 5.63 | 0.676 | 62.48 | 0.90 | 0.132 | 81.48 | 0.40 | 0.047 | 3.79 |
| 10 | 35.73 | 4.23 | 25.87 | 6.37 | 0.742 | 68.58 | 1.04 | 0.140 | 86.42 | 0.45 | 0.053 | 4.27 |
| 11 | 40.15 | 4.42 | 29.08 | 7.18 | 0.807 | 74.58 | 1.19 | 0.148 | 91.36 | 0.51 | 0.060 | 4.83 |
| 12 | 44.72 | 4.57 | 32.38 | 8.05 | 0.870 | 80.41 | 1.34 | 0.154 | 95.06 | 0.58 | 0.068 | 5.48 |
| 13 | 49.42 | 4.69 | 35.79 | 8.98 | 0.929 | 85.86 | 1.50 | 0.158 | 97.53 | 0.66 | 0.078 | 6.29 |
| 14 | 54.20 | 4.78 | 39.25 | 9.96 | 0.980 | 90.57 | 1.66 | 0.161 | 99.38 | 0.74 | 0.088 | 7.09 |
| 15 | 59.03 | 4.83 | 42.75 | 10.98 | 1.023 | 94.55 | 1.82 | 0.162 | 100.0 | 0.84 | 0.100 | 8.06 |
| 16 | 63.89 | 4.86 | 46.27 | 12.04 | 1.055 | 97.50 | 1.98 | 0.162 | 100.0 | 0.96 | 0.113 | 9.11 |
| 17 | 68.73 | 4.85 | 49.77 | 13.11 | 1.075 | 99.35 | 2.14 | 0.161 | 99.38 | 1.09 | 0.128 | 10.31 |
| 18 | 73.54 | 4.81 | 53.26 | 14.19 | 1.082 | 100.0 | 2.30 | 0.159 | 98.15 | 1.23 | 0.146 | 11.76 |
| 19 | 78.29 | 4.75 | 56.69 | 15.27 | 1.075 | 99.35 | 2.46 | 0.156 | 96.30 | 1.40 | 0.165 | 13.30 |
| 20 | 82.96 | 4.67 | 60.08 | 16.32 | 1.055 | 97.50 | 2.61 | 0.152 | 93.83 | 1.58 | 0.187 | 15.07 |
| 21 | 87.53 | 4.57 | 63.39 | 17.35 | 1.023 | 94.55 | 2.76 | 0.147 | 90.74 | 1.80 | 0.213 | 17.16 |
| 22 | 91.97 | 4.45 | 66.60 | 18.33 | 0.980 | 90.57 | 2.90 | 0.142 | 87.65 | 2.04 | 0.241 | 19.42 |
| 23 | 96.29 | 4.32 | 69.73 | 19.26 | 0.928 | 85.77 | 3.04 | 0.137 | 84.57 | 2.31 | 0.274 | 22.08 |
| 24 | 100.46 | 4.17 | 72.75 | 20.13 | 0.870 | 80.41 | 3.17 | 0.131 | 80.86 | 2.62 | 0.310 | 24.98 |
| 25 | 104.48 | 4.02 | 75.66 | 20.93 | 0.807 | 74.58 | 3.29 | 0.124 | 76.54 | 2.97 | 0.352 | 28.36 |
| 26 | 108.34 | 3.86 | 78.46 | 21.67 | 0.741 | 68.48 | 3.41 | 0.118 | 72.84 | 3.37 | 0.399 | 32.15 |
| 27 | 112.04 | 3.70 | 81.14 | 22.35 | 0.676 | 62.48 | 3.52 | 0.112 | 69.14 | 3.82 | 0.453 | 36.50 |
| 28 | 115.58 | 3.54 | 83.70 | 22.96 | 0.611 | 56.47 | 3.63 | 0.106 | 65.43 | 4.34 | 0.514 | 41.42 |
| 29 | 118.95 | 3.37 | 86.14 | 23.51 | 0.548 | 50.65 | 3.73 | 0.099 | 61.11 | 4.92 | 0.583 | 46.98 |
| 30 | 122.16 | 3.21 | 88.46 | 24.00 | 0.489 | 45.19 | 3.82 | 0.093 | 57.41 | 5.58 | 0.661 | 53.26 |
| 31 | 125.20 | 3.04 | 90.67 | 24.43 | 0.434 | 40.11 | 3.91 | 0.088 | 54.32 | 6.33 | 0.750 | 60.44 |
| 32 | 128.08 | 2.88 | 92.75 | 24.81 | 0.383 | 35.40 | 3.99 | 0.082 | 50.62 | 7.18 | 0.850 | 68.49 |
| 33 | 130.81 | 2.73 | 94.73 | 25.15 | 0.336 | 31.05 | 4.07 | 0.076 | 46.91 | 8.15 | 0.964 | 77.68 |
| 34 | 133.38 | 2.57 | 96.59 | 25.44 | 0.294 | 27.17 | 4.14 | 0.071 | 43.83 | 9.24 | 1.094 | 88.15 |
| 35 | 135.81 | 2.43 | 98.35 | 25.70 | 0.256 | 23.66 | 4.20 | 0.066 | 40.74 | 10.48 | 1.241 | 100.0 |
| 36 | 138.09 | 2.28 | 100.00 | 25.92 | 0.220 | 20.61 | 4.27 | 0.062 | 38.27 | 11.69 | 1.210 | 97.66 |
1Body Weight – BW, g/quail; 2Daily Weight Gain – DWG, g/day. 3Percentual weight – PP, %; 4Accumulated Protein – AP, g/day; 5Daily Protein deposition - DPd g/day; 6Percentage of maximum daily deposition for protein (PPd - %), ash (PAd - %) and fat (PFd - %).7Accumulated Ash – AA, g/day; 8Daily Ash deposition – DAd, g/day; 9Accumulated Fat – AF, g/day; 10Daily Fat deposition – g/day;.
Disclaimer/Publisher’s Note: The statements, opinions and data contained in all publications are solely those of the individual author(s) and contributor(s) and not of MDPI and/or the editor(s). MDPI and/or the editor(s) disclaim responsibility for any injury to people or property resulting from any ideas, methods, instructions or products referred to in the content. |
© 2025 by the authors. Licensee MDPI, Basel, Switzerland. This article is an open access article distributed under the terms and conditions of the Creative Commons Attribution (CC BY) license (http://creativecommons.org/licenses/by/4.0/).
Copyright: This open access article is published under a Creative Commons CC BY 4.0 license, which permit the free download, distribution, and reuse, provided that the author and preprint are cited in any reuse.


