Submitted:
06 October 2025
Posted:
07 October 2025
You are already at the latest version
Abstract
Background/Objectives: Thermoregulation is essential for survival, with the hypothalamic preoptic area integrating peripheral signals to maintain core body temperature. While fever enhances immune responses, excessive hyperthermia causes cellular damage. Liraglutide (LIRA), a GLP-1 analog used in the treatment of diabetes, may have uncharacterized thermoregulatory effects. This study investigates the impact of LIRA on temperature regulation and fever in rats, with a focus on sex-dependent mechanisms. Methods: Male and female Wistar rats received lipopolysaccharide (LPS, i.p.) to induce fever, followed by LIRA treatment (0.3 mg/kg, i.p.) one hour later. Body temperature was monitored for up to six hours post-LPS injection. Results: LIRA reduced body temperature in both euthermic and febrile rats of both sexes. LPS increased PGE₂ concentration in both sexes, with males showing a twofold increase compared to females. LIRA treatment reduced PGE₂ levels in LPS-challenged males but not in female rats. LPS elevated interleukin (IL)-6 levels in both sexes, while LIRA treatment decreased IL-6 only in females. In males, LPS reduced hypothalamic serotonin (5-HT) levels, and LIRA further decreased 5-HT in saline-treated animals. In females, LIRA increased 5-HT levels in LPS-challenged animals. Additionally, LIRA exhibited sex-specific effects on hypothalamic JNK phosphorylation, increasing activation in LPS-treated males and reducing it in LPS-treated females. Conclusions: LIRA demonstrates antipyretic properties through distinct, sex-specific mechanisms. In males, temperature reduction correlates with decreased hypothalamic PGE₂, whereas in females, antipyretic effects are associated with reduced IL-6, decreased JNK phosphorylation, and increased 5-HT. These findings reveal sexually dimorphic GLP-1R-mediated thermoregulatory pathways during inflammation. However, the causal relationships between these molecular changes and temperature regulation require further investigation, particularly regarding whether observed biochemical alterations represent primary mechanisms or secondary consequences of temperature modulation. Future studies should investigate the functional significance of the apparent contradiction in serotonergic responses between sexes.
Keywords:
prostaglandin E2
; interleukin-6
; serotonin
; hypothalamus
; lipopolysaccharide
; antipyretic
1. Introduction
Fever represents a centrally regulated elevation in body temperature that constitutes a fundamental component of the acute-phase response to infectious and inflammatory stimuli [1]. Thermoregulation is critical for organism survival, with the preoptic area of the anterior hypothalamus integrating peripheral signals to maintain core body temperature through activation of heat conservation and dissipation mechanisms [2]. While fever enhances immune responses by promoting leukocyte migration, phagocytosis, and antibody production, excessive hyperthermia imposes substantial metabolic demands, increases oxygen consumption, and can result in protein denaturation and cellular damage [3,4].
The hypothalamic control of fever involves complex neuroinflammatory cascades. Lipopolysaccharide (LPS) administration triggers the release of pro-inflammatory cytokines, including IL-6, which stimulates cyclooxygenase-2 (COX-2) expression in cerebral endothelial cells, leading to prostaglandin (PG) E₂ synthesis. PGE₂ subsequently activates EP3 receptors on thermosensitive neurons within the preoptic area, initiating the febrile response. Anti-inflammatory mediators, particularly IL-10, provide regulatory control by inhibiting pro-inflammatory signaling pathways and modulating PG synthesis [2,5].
Sex differences in thermoregulation have been consistently observed in both animals and humans [6,7]. Body temperature patterns fluctuate throughout the ovarian cycle in females, indicating a regulatory role of sex hormones in maintaining thermal homeostasis [8,9]. Evidence shows that randomly cycling female rats exhibit diminished febrile responses compared to males, which stems from the modulatory effects of female gonadal hormones on thermoregulatory and inflammatory pathways [10]. Furthermore, vasopressin antagonism has been found to increase hypothalamic PGE₂ levels in febrile male rats but not in females, highlighting sex-specific mechanisms involved in fever regulation [11].
LIRA, a glucagon-like peptide-1 receptor (GLP-1R) agonist, is currently employed in the treatment of type 2 diabetes mellitus and obesity. The growing use of GLP-1 analogs underscores the need to comprehend their effects beyond mere metabolic regulation, particularly as many patients are now exposed to these medications daily. Recent studies have revealed that LIRA possesses anti-inflammatory and neuroprotective properties in various clinical conditions, including osteoarthritis and hepatic ischemia-reperfusion injury [12,13]. The relationship between GLP-1R signaling and the regulation of thermoregulation and fever remains largely uncharted. However, prior research has indicated that blocking central GLP-1R can intensify fever induced by LPS, suggesting a potential involvement of GLP-1 in temperature regulation [14]. Given the prevalent use of GLP-1 analogs and their possible effects on central nervous system function, understanding their influence on body temperature regulation and fever response holds significant clinical importance.
This study aimed to explore the effects of LIRA on body temperature in male and female rats during LPS-induced febrile response. Additionally, the research aimed to assess its influence on hypothalamic and systemic inflammatory and oxidative markers, as well as the role of neurotransmitters such as serotonin (5-HT) and dopamine (DA). Furthermore, we investigated the sex-specific effects of LIRA on hypothalamic JNK phosphorylation to elucidate the molecular mechanisms underlying GLP-1 receptor-mediated modulation of fever.
2. Results
2.1. LIRA Reduces Body Temperature in Both Euthermic and Febrile Rats
To investigate the effect of LIRA on fever, we first injected LPS intraperitoneally, and after 1 hour, we administered the treatment with LIRA (0.3 mg/kg) by the same route to animals of both sexes. As expected, LPS administration evoked a significant increase in body temperature compared with the saline-treated group, which maintained a relatively stable temperature, with minor fluctuations likely due to animal handling. LIRA administration completely abolished LPS-induced fever (Figure 1A, 1C). Interestingly, the temperature of euthermic animals (SAL/LIRA group) was also reduced by LIRA treatment in both male and female rats (Figure 1A, 1C).
To quantify these effects, thermal index values were calculated from the area under the curve during the gray-shaded period, providing clearer quantification of the time-course results shown in Figure 1A and 1C. It was observed sex-specific differences in LIRA’s effects. In males (Figure 1B), the SAL/LIRA group demonstrated a greater reduction in thermal index compared to the LPS/LIRA group, indicating that LIRA’s hypothermic effect was attenuated in the presence of LPS-induced inflammation. Conversely, in females (Figure 1D), the LPS/LIRA group exhibited a more pronounced reduction in thermal index than the SAL/LIRA group, suggesting that LIRA’s temperature-lowering effects were enhanced during the inflammatory state.
2.2. Effect of Post-Treatment with LIRA on Hypothalamic PGE₂ Production
To investigate the mechanism by which LIRA reduces the body temperature of these animals, we measured the hypothalamic concentration of PGE₂. Intraperitoneal administration of LPS increased PGE₂ concentration in both male and female rats, with the concentration being twice as high in males as in females (Figure 2A, 2B). LIRA treatment reduced PGE₂ concentration in male rats challenged with LPS (Figure 2A). In sharp contrast, there was no change in PGE₂ concentration after LIRA treatment in female rats (Figure 2B).
2.3. Effect of Post-Treatment with LIRA on Circulating IL-6 and IL-10 Levels
The proinflammatory cytokine IL-6 was measured in serum to assess the inflammatory response to LPS and the effect of LIRA administration. LPS triggered an increase in circulating IL-6 levels compared to the control group in both male and female rats (Figure 3A, 3B). LIRA treatment affected only female rats, reducing IL-6 levels (-45%, p<0,05). We also measured the concentration of IL-10, an anti-inflammatory cytokine, in these animal sera (Figure 3C and 3D). LPS caused an increase in the concentration of IL-10 compared to the control group only in male rats. Interestingly, treatment with LIRA promoted an increase in IL-10 levels in saline-treated animals, while it did not change IL-10 levels in LPS-treated animals (Figure 3C). In female rats, neither LPS administration nor LIRA treatment altered the serum concentration of IL-10 (Figure 3D).
2.4. Effect of LIRA on ROS and HbNO Production
We investigated the effects of LIRA on blood markers of oxidative stress, i.e., reactive oxygen species (ROS), and nitrosative stress, such as nitrosylated hemoglobin (HbNO). No significant increases in ROS were observed after this dose of LPS in either male or female rats, and LIRA treatment did not alter ROS formation in either sex (Figure 4A, 4B).
HbNO formation increased significantly after LPS challenge in both male and female rats. However, LIRA treatment did not alter HbNO levels in animals of either sex (Figure 4C,D).
2.5. Changes in 5-HT and DA levels in the hypothalamus by LIRA
To investigate whether the body temperature reduction induced by LIRA occurs through a mechanism involving 5-HT or DA, we quantified the levels of these neurotransmitters in the hypothalamus of male and female rats (Figure 5). In male rats, a reduction in 5-HT levels was observed after administration of LPS (Figure 5A). Regarding the treatment, LIRA caused a significant decrease in 5-HT levels in saline-treated animals, but did not change the reduction promoted by LPS (Figure 5A). In female rats, LPS administration did not induce changes in 5-HT levels compared to the control group. Interestingly, treatment with LIRA increased 5-HT levels in LPS-challenged animals (Figure 5B).
Regarding DA levels, no significant changes were observed after LPS administration or LIRA treatment, either in male or female rats (Figure 5C, 5D).
2.6. Sex-Specific Modulation of Hypothalamic JNK Signaling by LIRA
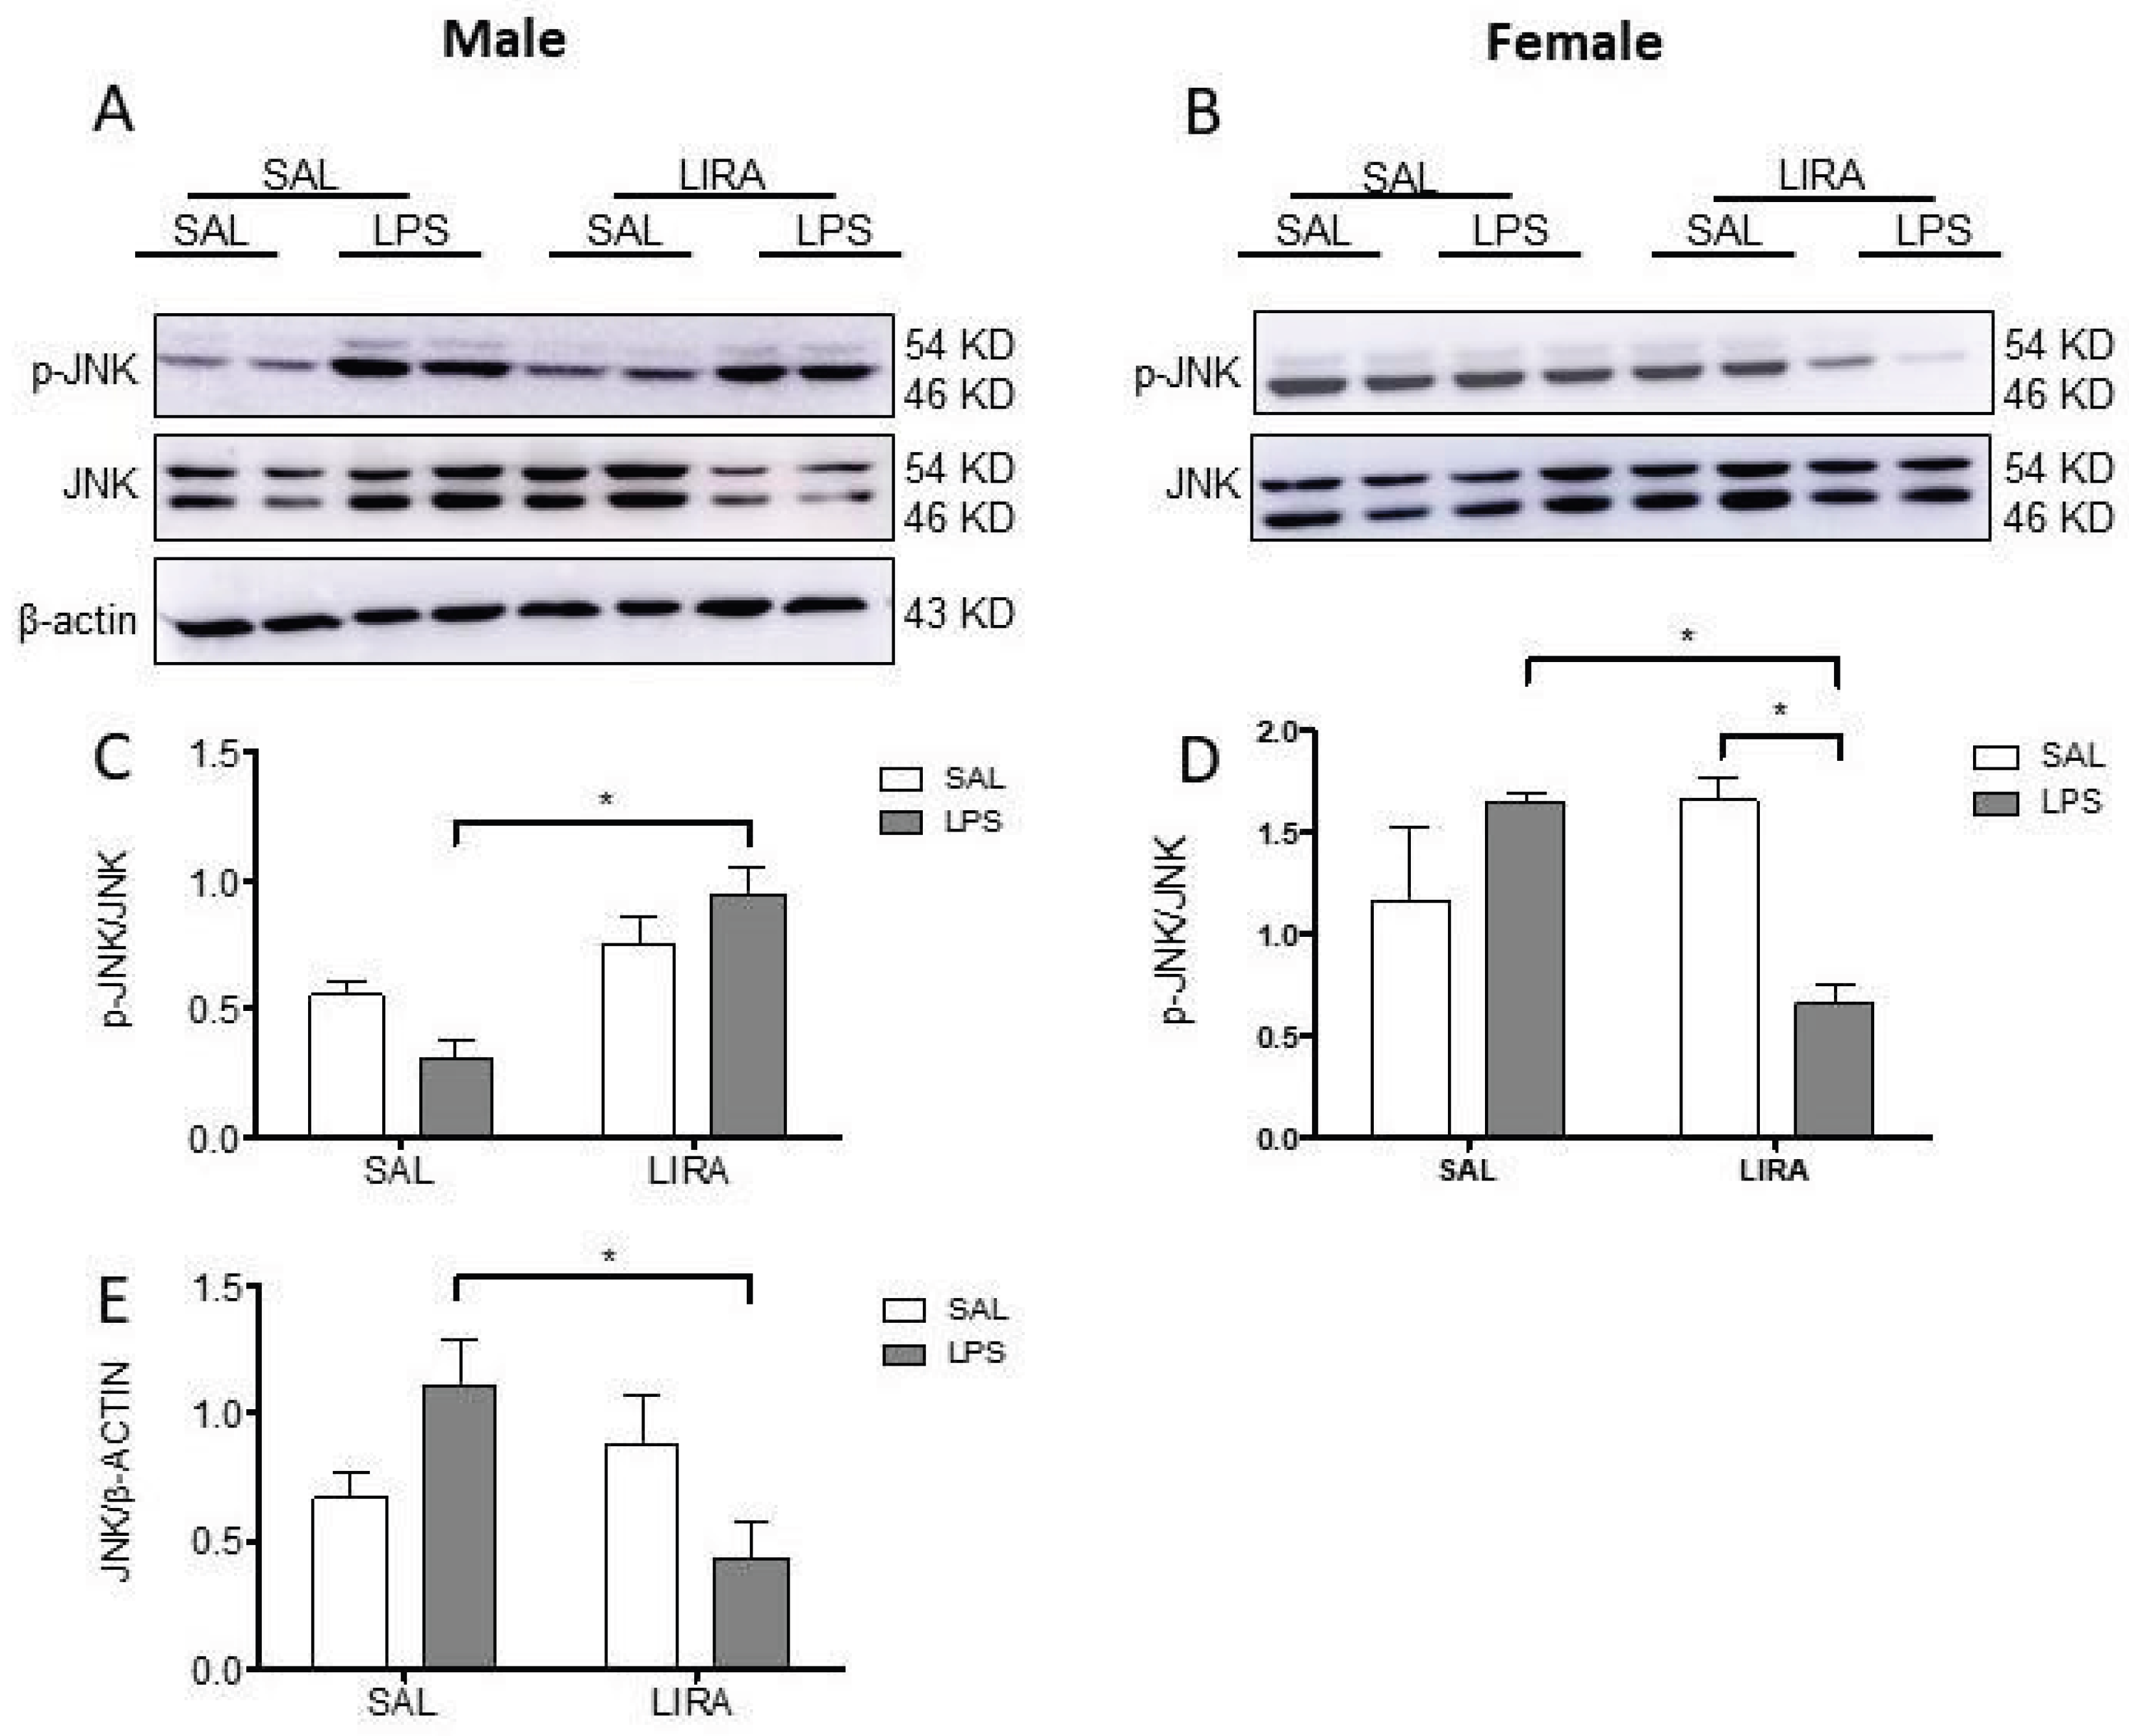
We then examined the molecular pathways involved in the antipyretic effect of LIRA. Given the central role of JNK signaling in inflammatory responses, we investigated the impact of LIRA on hypothalamic JNK phosphorylation in both male and female rats after LPS administration. Western blot analysis revealed sex-dependent differences in JNK activation patterns. In male rats, LPS administration alone did not significantly alter JNK phosphorylation compared to saline controls. However, LIRA treatment in LPS-challenged males resulted in a significant increase in phosphorylated JNK levels (p<0.05), suggesting enhanced kinase activation (Figure 6A, 6C). Total JNK protein expression showed a corresponding decrease in the LPS/LIRA group compared to LPS/SAL (p<0.05), indicating altered protein turnover or synthesis (Figure 6E).
In contrast, female rats exhibited a markedly different response pattern. Although LPS administration alone did not significantly increase JNK phosphorylation compared to saline controls, LIRA treatment in LPS-challenged females dramatically reduced phosphorylated JNK levels compared to the LPS/SAL group (p<0.05) (Figure 6B, 6D). Total JNK protein levels remained stable across all female treatment groups, indicating that the observed changes reflect altered kinase activation rather than modifications in protein expression (Figure 6B).
3. Discussion
In this study, we investigated the effects of LIRA on central thermoregulatory mechanisms and fever responses induced by systemic inflammation triggered by LPS. We demonstrated that LIRA reduces body temperature in both euthermic and febrile animals of both sexes; however, the mechanisms involved in LIRA’s antipyretic effects are sex-specific.
Fever is generated by the action of several autonomic responses, including peripheral vasoconstriction, decreased sweating, reduced heat loss, shivering, and possibly also non-shivering thermogenesis [5]. In this study, we used a dose of 50 µg/kg intraperitoneally to induce fever in male and female animals. This dose caused a fever of similar magnitude in animals of both sexes, which differs from some studies that demonstrate that cycling females exhibit a fever of lesser magnitude than ovariectomized females or males [10,22]. It is known that estrogen reduces the LPS-induced febrile response [10] and that the production of this hormone varies according to the estrous cycle in female rats [23]. Thus, this discrepancy may be explained by the lack of estrous cycle monitoring in females, which may have masked sex-dependent differences in fever magnitude.
Our findings demonstrate that LIRA reduced body temperature in both euthermic and febrile conditions across male and female animals. These results align with previous research by [14], who demonstrated that central antagonism of GLP-1R increased LPS-induced fever in their experimental model. Additionally, a prior study showed that LIRA attenuates peripheral inflammatory responses, specifically reducing carrageenan-induced paw edema and local temperature in rats [16]. Given that LIRA functions as a GLP-1R agonist, the antipyretic effect observed in our study represents the expected pharmacological response, likely mediated through both central thermoregulatory mechanisms and peripheral anti-inflammatory actions, which suggests the role of GLP-1 signaling in controlling both inflammatory responses and thermoregulation.
PGs are considered the final mediators of the febrile response [5]. To elucidate the mechanism by which LIRA reduces fever, we quantified the concentration of PGE₂ in the hypothalamus of these animals. The results showed that LPS induced an increase in PGE₂ concentrations in both male and female rats, with the concentration in males being twice that observed in females. In agreement with our data, [10] demonstrated that PGE₂ production in ovariectomized rats is greater than in cycling female rats after LPS challenge. Interestingly, LIRA treatment reduced the concentration of this mediator only in male animals. These results suggest that the mechanism by which LIRA reduces body temperature in febrile male animals involves a reduction in PGE₂ concentrations in the hypothalamus. In agreement with our data, previous studies have demonstrated that LIRA can reduce PGE₂ production after LPS stimulation. A study evaluated the anti-inflammatory effects of LIRA on LPS-activated macrophages, showing that LIRA dose-dependently reduces PGE₂ production [24]. Another group demonstrated that exendin-4, a GLP-1R agonist with a mechanism of action similar to LIRA, inhibits the expression of the inflammatory mediators iNOS, COX-2, PGE₂, and NO, as well as pro-inflammatory cytokines in an in vitro model of LPS-induced inflammation in macrophages [25]. Indeed, a recent study published in 2022 demonstrated that, in an osteoarthritis model, LIRA treatment significantly reduced PGE₂ secretion in vitro in chondrocytes and macrophages [12].
Regarding female animals, we observed no significant difference in PGE₂ production after LIRA treatment, despite a reduction in body temperature. Indeed, a study demonstrated that female rats may use different strategies to control fever compared to male rats. For example, they observed that a vasopressin antagonist elevates PGE₂ in febrile male rats, but not in females, showing that PGE₂ levels in fever may differ between the sexes, which is in agreement with our results [11].
It is well known that LPS administration induces the release of IL-6, a key pyrogenic cytokine involved in the regulation of fever. Its critical role is demonstrated by the fact that direct administration of IL-6 into the brain elicits fever [26]. In contrast, neutralization of this cytokine or its genetic absence prevents the development of the febrile response [3,27,28]. In the present study, LPS increased serum IL-6 levels in both sexes; however, LIRA significantly reduced this cytokine only in females. In agreement, a study in male mice showed that another GPL-1 analogue, exendin-4, did not alter LPS-induced plasma IL-6 production [29]. By contrast, there is also evidence that LIRA and exendin-4 exert anti-inflammatory effects by reducing IL-6 levels across various experimental models [12,13,25]. This outcome may be related to sex-dependent differences in response to LIRA, as findings from [30] suggest that drug exposure is likely higher in women. This difference in exposure could translate into a more pronounced pharmacological effect, implying that the dose we used (0.3 mg/kg) was sufficient to modulate IL-6 in females but not in males.
IL-10 is an anti-inflammatory cytokine essential for regulating the immune response, acting to suppress the production of pro-inflammatory cytokines. In our study, we identified increased IL-10 production only in male rats after LPS challenge. Interestingly, LIRA treatment exhibited two distinct effects on IL-10 production depending on the inflammatory context. In control animals from the saline group, LIRA increased IL-10 production, whereas in LPS-treated animals, LIRA did not alter IL-10 production. Indeed, one study demonstrated that in rats with acute inflammation treated with LIRA, IL-10 levels increased dramatically in inflamed paw tissue compared to non-inflamed paws [16]. Another study demonstrated that LIRA alleviated hyperalgesia associated with chronic migraine by inhibiting the levels of CGRP, phosphorylated ERK (p-ERK), and c-fos in the trigeminal nucleus caudalis, while simultaneously increasing IL-10 release [31].
In female rats, we observed basal levels of IL-10 at least 3 times higher than those observed in male rats. However, no significant changes in IL-10 levels were observed in females after LPS administration, which may indicate a sexually-dependent response to LIRA. In agreement, one study showed that LIRA promoted increased expression of the anti-inflammatory mediators IL-10 and TGFβ1 in the hippocampi of males, but not in females, of food-restricted mothers [32].
Several studies demonstrate that LIRA attenuates oxidative stress in tissues, such as the liver and heart, as well as in human umbilical vein endothelial cells, possibly through its anti-inflammatory effects [33,34,35]. In this investigation, we hypothesized that the reduction in body temperature caused by LIRA could be associated with a decrease in the production of reactive oxygen species (ROS). As a result, we did not observe a significant increase in ROS in the blood of animals with fever. Treatment with LIRA did not change blood ROS levels. These data are consistent with a previous study, which demonstrated a significant increase in ROS formation in the liver, brown adipose tissue, and hypothalamus, but not blood during the febrile response [20].
Nitric oxide (NO) is a crucial radical involved in various physiological and pathological processes. When there is an increase in NO availability in the blood, nitrosated hemoglobin HbNO is formed, and the reaction of hemoglobin with NO is a protective mechanism for the body during oxidative stress [19]. Therefore, we decided to test the hypothesis that treatment with LIRA would also modulate HbNO concentrations, given that previous studies have shown that NO is involved in the febrile response and acts as an antipyretic molecule during LPS-induced fever [36,37,38]. In our study, animals of both sexes with fever showed an increase in HbNO concentrations in the blood 4 hours after LPS injection, indicating that NO availability in the blood increases during fever. However, LIRA treatment did not alter HbNO concentration during fever, demonstrating that the temperature reduction caused by LIRA is not associated with changes in HbNO. In contrast, Hattori et al. (2010) concluded that LIRA exerts an anti-inflammatory effect on vascular endothelial cells, increasing NO production and suppressing NF-kappaB activation, in part by activating AMPK [39].
Recent evidence suggests that LIRA has the potential to reduce depressive symptoms, and this effect may be partially due to the modulation of central neurotransmitter systems [40]. Given the well-established roles of 5-HT and DA in mood regulation and the alterations in these neurotransmitters observed during systemic inflammation, we investigated the effects of LIRA on hypothalamic 5-HT and DA levels. This investigation is particularly relevant since 5-HT exhibits antipyretic properties, suggesting that LIRA’s fever-reducing effects may be mediated, at least in part, through increased 5-HT concentrations in thermoregulatory centers.
A previous study demonstrated that hypothalamic 5-HT levels are reduced in male rats and increased in female rats during LPS-induced systemic inflammation [22]. Here, we also observe this same pattern, suggesting a sexually dimorphic response to fever, possibly related to hormonal, immunological, or neurochemical differences between the sexes. Moreover, we observed a reduction in hypothalamic 5-HT levels in non-febrile male rats treated with LIRA and an increase in 5-HT in febrile female rats treated with LIRA. In line with our findings, one study showed a decrease in plasma 5-HT levels in male mice following LIRA administration [41].
Regarding DA, a previous study demonstrated a decrease in this neurotransmitter during systemic inflammation in both male and female rats [22]. However, in our study, no changes were observed after the administration of LPS, nor after treatment with LIRA.
Stress-activated protein kinase (JNK) plays a crucial role in inflammatory signaling cascades, being activated by pro-inflammatory stimuli, including LPS [25,42]. LIRA exhibited sex-specific effects on hypothalamic JNK phosphorylation, increasing activation in LPS-treated males while reducing it in LPS-treated females. These sex-specific differences in JNK signaling may partially explain the distinct physiological responses to LIRA observed between males and females during systemic inflammation. The opposing effects of LIRA on JNK activation between sexes suggest fundamentally different molecular mechanisms underlying GLP-1 receptor-mediated neuroimmune modulation in the hypothalamus.
This study demonstrates that LIRA exerts antipyretic effects through sexually dimorphic mechanisms in rats. In male rats, LIRA reduces fever primarily by suppressing hypothalamic PGE₂ concentrations, the classical pyrogenic pathway. In contrast, in female rats, LIRA lowers body temperature independently of PGE₂ modulation. Instead, it attenuates circulating IL-6 levels and enhances hypothalamic 5-HT concentrations during fever. The opposing sex-specific effects on JNK phosphorylation further highlight the distinct molecular mechanisms underlying these responses. Collectively, these findings suggest that GLP-1 analogues may engage distinct neuroimmune pathways depending on biological sex, revealing previously unrecognized sexual dimorphism in GLP-1 receptor-mediated responses during systemic inflammation.
4. Materials and Methods
4.1. Animals
This study was conducted at the Laboratory of Protein Chemistry and Biochemistry of the University of Brasilia (UnB) and was approved by the UnB Ethics Committee for the use of Animals (CEUA) (Protocol No. 23106.128494/2022-27). Male and female Wistar rats (8-9 weeks) were obtained from the Evangelical University of Goiás (Anápolis, Goiás, Brazil). The animals were housed four per cage in a ventilated rack (Alesco Indústria e Comércio Ltda, Monte Mor, São Paulo) in a temperature-controlled room at 22 ± 1°C and submitted to a 12-h light–dark cycle (lights on at 7 a.m.) with water and food ad libitum.
4.2. Drugs
LPS from Escherichia coli (0111: B4, Sigma-Aldrich, USA) was diluted in sterile saline and administered ip at a dose of 50 µg/kg. LIRA (Saxenda®, Novo Nordisk, DK) was diluted in sterile saline and administered ip at a dose of 0.3 mg/kg. The doses of LPS and LIRA were selected based on pilot experiments and previous studies [10,15,16]. Ketamine, xylazine, and acepromazine were purchased from Vetnil (Louveira, SP, Brazil). Oxytetracycline (Terramicina®, Zoetis, São Paulo, Brazil) and meloxicam (Maxicam®, MSD, São Paulo, Brazil) were of commercial grade.
4.3. Temperature Datalogger Implantation and Core Temperature Measurements
Animals were anesthetized with a mixture of xylazine at 10 mg/kg, ketamine hydrochloride at 60 mg/kg, and acepromazine at 1 mg/kg, administered intraperitoneally. Incisions were made in the skin and peritoneal muscle to implant temperature dataloggers (Subcue, Calgary, Canada), followed by suturing of the muscle and skin. Post-surgery, animals received an intramuscular injection of oxytetracycline at 10 mg/kg and a subcutaneous injection of meloxicam at 1 mg/kg. Meloxicam administration was repeated for two additional days. Following these procedures, animals were returned to their cages for a seven-day recovery period before pharmacological experiments began.
4.4. Experimental Design
Experiments were conducted in the rats’ thermoneutral zone (27 ± 1°C) (Gordon, 1990) [17], after animals had acclimated to the environment for at least 12 hours. Body temperatures were monitored at 15-minute intervals throughout the experiments. To investigate LIRA’s effects on fever, rats received an injection of LPS (50 µg/kg, ip) to induce fever, followed by post-treatment with LIRA (0.3 mg/kg) 1 hour later. Animals had their body temperature monitored for 6 hours following LPS administration. For experiments involving the collection of hypothalamic tissue and blood samples for analysis, the same experimental design was followed, with animals being euthanized 4 hours after LPS administration. Then, the animals were euthanized, the hypothalami were immediately dissected, immersed in liquid nitrogen, and stored at −80°C until analysis. Blood samples were also collected for the quantification of reactive oxygen species (ROS) and nitrosylated hemoglobin (HbNO), while serum was obtained for the measurement of IL-6 and IL-10 concentrations. All biological samples were stored at −80°C until they were analyzed.
4.5. Quantification of Hypothalamic PGE₂ by ELISA
Hypothalamic PGE₂ concentrations were measured according to the protocol described by [18]. Immediately after collection, samples received 40 μL of indomethacin (1 mg/mL, pH 7.4). The hypothalami were homogenized in 1 mL of RPMI containing indomethacin in Tris-HCl, then acidified with HCl to a pH of 3.5–4.0. After ice incubation, samples were centrifuged at 20,000 g (4°C, 10 min). Supernatants were applied to Sep-Pak C18 cartridges, and PGE₂ was eluted with 2 mL absolute ethanol. Following 18-hour speed vacuum drying, pellets were resuspended in EIA buffer and analyzed using Cayman Chemical’s Prostaglandin E2 ELISA Kit (detection limit: 7.8 pg/mL).
4.6. Measurement of IL-6 and IL-10 Levels in Serum
For IL-6 and IL-10 quantification, blood samples were collected via cardiac puncture during exsanguination in heparinized tubes and centrifuged for 10 minutes at 4700 g at 4 °C. The supernatant was transferred to new tubes and stored at −80 °C until further analysis. IL-6 and IL-10 production were evaluated by ELISA, carried out according to the manufacturer’s instructions (Catalog Number RAB0311 and RAB0246, respectively, Sigma Aldrich, USA). First, standard curves were performed using reagents provided by the kit, and the serum levels of the cytokines were determined according to this curve.
4.7. Quantification of ROS and HbNO by EPR Spectroscopy
ROS and HbNO were quantified in blood using electron paramagnetic resonance (EPR) spectroscopy following established methodology [19,20]. For ROS quantification, the spin trap CMH (10 mM) was dissolved in freshly prepared Krebs-HEPES buffer (KHB) containing deferoxamine (25 mM) and sodium diethyldithiocarbamate trihydrate (5 mM) as metal chelators. CMH is oxidised, mainly by the superoxide ion, forming the EPR-detectable nitroxide radical CM• that has a half-life of several hours [20]. Blood samples were mixed with equal volumes of 400 μM CMH solution containing sodium heparin (100 IU/ml) and incubated at 37°C for 30 minutes with constant agitation. Calibration standards used 3-carboxy-proxyl (CP•) at 0, 5, 10, 50, and 100 μM concentrations. For HbNO quantification, cardiac blood was collected 4 hours post-LPS via right ventricular puncture using heparinized syringes. After centrifugation (2000 × g, 5 min), samples were immediately frozen in liquid nitrogen. Calibration curves were generated using erythrocytes treated with nitrite (1, 10, 100 μM) and sodium dithionite (20 mg) as reducing agent. All samples were placed in 1 mL syringes, frozen in liquid nitrogen, and stored at -80°C. EPR analysis used a Bruker EMX Plus spectrometer (X-band, 9 GHz) with parameters: 10 mW microwave power, 5 Gauss modulation amplitude, 100 kHz modulation frequency, 12-second scan time, and 4-scan averaging across 240 Gauss sweep width. All reagents were obtained from Noxygen (Elzach, Germany).
4.8. Neurotransmitter Measurement by HPLC
Hypothalamic 5-HT and DA concentrations were measured using HPLC with electrochemical detection. Tissue samples were sonicated in 0.1 M perchloric acid containing 0.02% sodium metabisulfite and 3,4-dihydroxybenzylamine (50 ng/ml) as internal standard. After centrifugation (10,000 × g, 20 min, 4°C), 20 μl of supernatant was analyzed. The mobile phase consisted of citric acid monohydrate (20 g), octane-1-sulfonic acid sodium salt (200 mg), EDTA (40 mg), and deionized water (900 ml), filtered through 0.45 μm membranes, with methanol added to 10% v/v. Chromatographic separation used a Synergi Fusion-RPC-18 column (150 × 4.6 mm, 4 μm) with SecurityGuard pre-column at 25°C. An ESA Coulochem III electrochemical detector with dual-electrode analytical cell (ESA 5011A) was employed, with oxidation potentials of 100 mV and 450 mV. A guard cell (ESA 5020) was set at 350 mV. Concentrations were calculated from standard curves and expressed as ng/g of tissue based on previous studies [21,22].
4.9. Western Blotting for Detection of JNK and Phospho-JNK
To detect total and phosphorylated JNK, hypothalamic protein extraction was performed with RIPA buffer containing protease and phosphatase inhibitors (2 mM Na₃VO₄ and 10 mM Na₄P₂O₇), followed by protein quantification. Total cellular proteins (20 μg/well) were incubated with Laemmli sample buffer containing β-mercaptoethanol and boiled for 5 min, and subjected to 10% SDS/PAGE. Proteins were transferred to polyvinylidene fluoride (PVDF) membranes using a semi-dry system at 24 V for 1 hour and 30 minutes. After transfer, the membranes were blocked with a 5% non-fat milk in TBS-T buffer (10 mM Tris-base, 150 mM NaCl, and 0.1% Tween 20) for 2 h at room temperature. After blocking, the membranes were incubated with primary Phospho-SAPK/JNK (Thr183/Tyr185) rabbit polyclonal antibody (9251) and Total-SAPK/JNK rabbit polyclonal antibody (9252) provided by Cell Signaling Technology (Beverly, MA, USA) for 16 hours at 4ºC. Monoclonal anti-β-actin antibody (A5441) from Sigma-Aldrich (St. Louis, MO, USA) was used as a loading control. Horseradish peroxidase-conjugated goat anti-rabbit IgG secondary antibody from Cell Signaling Technology (Beverly, MA, USA) was used here. The immunoreactive bands were detected using Pierce ECL from Thermo Fisher Scientific (cat. number 32106). ImageJ software was utilized for protein expression analysis. β-actin and the total form of JNK were used for normalization.
4.10. Statistical Analysis
Thermal index analysis was used to evaluate the amplitude of thermal responses, calculated from the area under the curve (AUC). We established 36.5°C as the baseline temperature and calculated the AUC from 2 to 6 h post-LPS. AUC values are expressed as degrees Celsius (y-axis) × hours (x-axis). Thermal index values and the other results (expressed as mean ± SEM) were analyzed using two-way ANOVA followed by Tukey’s multiple comparison test. GraphPad Prism version 10.5 (GraphPad Software, Inc., La Jolla, CA, USA) was used for statistical analyses. Values of p < 0.05 were considered statistically significant.
Author Contributions
Conceptualization, G.L.S.d.S, and F.H.V.-S.; methodology, G.L.S.d.S., E.K.M.d.C., S.C.R.d.A., A.P.L.d.N., B.R.B.G., A.B.R.L., L.J.F.G., C.R., R.A.C., A.R.Z, P.E.N.d.S., F.H.V.-S; formal analysis, G.L.S.d.S., F.H.V.-S. and C.R; investigation, G.L.S.d.S., E.K.M.d.C., S.C.R.d.A., A.P.L.d.N., B.R.B.G., A.B.R.L., L.J.F.G., C.R., A.R.Z., P.E.N.d.S., and F.H.V.-S data curation, F.H.V.-S., C.R., A.R.Z., and P.E.N.d.S; writing original draft preparation, G.L.S.d.S., F.H.V.-S., E.K.M.d.C. e S.C.R.d.A.; writing review and editing, G.L.S.d.S., E.K.M.d.C., S.C.R.d.A., A.P.L.d.N., B.R.B.G., A.B.R.L., L.J.F.G., C.R., A.R.Z., P.E.N.d.S., and F.H.V.-S; supervision, F.H.V.-S., C.R., A.R.Z., e P.E.N.d.S; project administration, F.H.V.-S; funding acquisition, F.H.V.-S. and P.E.N.d.S. All authors have read and agreed to the published version of the manuscript.
Funding
This work was supported by the Fundação de Apoio à Pesquisa do Distrito Federal (FAPDF grants 00193-00001702/2024-30; 0019300000262/2023-12); Conselho Nacional de Desenvolvimento Científico e Tecnológico (CNPq grant 316113/2023-9); Coordenação de Aperfeiçoamento de Pessoal de Nível Superior (CAPES, Finance Code 001). We are thankful to the DPI/BCE/UnB (Edital nº 001/2025 DPI/BCE/UnB) for contributing to these publication fees. G.L.S.d.S. was a recipient of a scholarship from CAPES (88887.511342/2020-00).
Institutional Review Board Statement
This study was carried out according to the Guide for the Care and Use of Laboratory Animals of the National Council for the Control of Animal Experimentation (CONCEA) and approved by UnB Ethics Committee for the Use of Animals (CEUA) (Protocol No. 23106.128494/2022-27) on 8 March 2023.
Data Availability Statement
Will be provided when requested.
Acknowledgments
We acknowledge the use of Claude AI (claude.ai) and ChatGPT 4 (www.chatgpt.com) to support English language revision and improve clarity and coherence in the manuscript.
Conflicts of Interest
The authors declare no conflict of interest.
Abbreviations
The following abbreviations are used in this manuscript:
| 5-HT | Serotonin |
| AMPK | AMP-activated protein kinase |
| AUC | Area Under the Curve |
| CGRP | Calcitonin Gene-Related Peptide |
| CM• | 3-methoxycarbonyl-2,2,5,5-tetramethylpyrrolidine-1-oxyl |
| CMH | 1-hydroxy-3-methoxycarbonyl-2,2,5,5-tetramethylpyrrolidine |
| CP• | 3-carboxy-proxyl nitroxide |
| COX-2 | Cyclooxygenase-2 |
| DA | Dopamine |
| ELISA | Enzyme-Linked Immunosorbent Assay |
| EP3 | Prostaglandin E₂ receptor 3 |
| ERK | Extracellular signal-regulated kinase |
| ESA | Electrochemical detector brand (Coulochem III) |
| GLP-1 | Glucagon-Like Peptide-1 |
| GLP-1R | Glucagon-Like Peptide-1 receptor |
| HbNO | Nitrosylated Hemoglobin |
| HPLC | High-Performance Liquid Chromatography |
| iNOS | Inducible Nitric Oxide Synthase |
| i.p. | Intraperitoneal |
| JNK | c-Jun N-terminal kinase |
| LIRA | Liraglutide |
| LPS | Lipopolysaccharide |
| NF-κB | Nuclear Factor kappa B |
| NO | Nitric Oxide |
| PGE₂ | Prostaglandin E₂ |
| PVDF | Polyvinylidene Fluoride |
| RIPA | Radioimmunoprecipitation Assay buffer |
| RPMI | Roswell Park Memorial Institute medium |
| ROS | Reactive Oxygen Species |
| SAL | Saline |
| SDS/PAGE | Sodium Dodecyl Sulfate Polyacrylamide Gel Electrophoresis |
| SEM | Standard Error of the Mean |
| TBS-T | Tris-Buffered Saline with Tween 20 |
| TGFβ1 | Transforming Growth Factor beta 1 |
References
- Dinarello CA, Cannon JG, Wolff SM. New Concepts on the Pathogenesis of Fever. Clinical Infectious Diseases. 1988, 10, 168–189. [CrossRef]
- Morrison SF, Nakamura K. Central neural pathways for thermoregulation. Frontiers in Bioscience. 2011, 16, 74. [CrossRef]
- Evans SS, Repasky EA, Fisher DT. Fever and the thermal regulation of immunity: the immune system feels the heat. Nature Reviews Immunology. 2015, 15, 335–349. [CrossRef]
- Tansey EA, Johnson CD. Recent advances in thermoregulation. Advances in Physiology Education. 2015, 39, 139–148. [CrossRef]
- Blomqvist A, Engblom D. Neural Mechanisms of Inflammation-Induced Fever. The Neuroscientist. 2018, 24, 381–399. [CrossRef]
- Cai KC, van Mil S, Murray E, Mallet JF, Matar C, Ismail N. Age and sex differences in immune response following LPS treatment in mice. Brain, Behavior, and Immunity. 2016, 58, 327–337. [CrossRef]
- Yanovich R, Ketko I, Charkoudian N. Sex Differences in Human Thermoregulation: Relevance for 2020 and Beyond. Physiology. 2020, 35, 177–184. [CrossRef]
- Coelho LCM, Cruz J v. , Maba IK, Zampronio AR. Fever Induced by Zymosan A and Polyinosinic-Polycytidylic Acid in Female Rats: Influence of Sex Hormones and the Participation of Endothelin-1. Inflammation. 2021, 44, 321–333. [CrossRef]
- Baker FC, Siboza F, Fuller A. Temperature regulation in women: Effects of the menstrual cycle. Temperature. 2020, 7, 226–262. [CrossRef]
- Brito HO, Radulski DR, Wilhelms DB, et al. Female Sex Hormones Influence the Febrile Response Induced by Lipopolysaccharide, Cytokines and Prostaglandins but not by Interleukin-1β in Rats. Journal of Neuroendocrinology. 2016, 28(10). [CrossRef]
- PITTMAN QJ, CHEN X, MOUIHATE A, MARTIN S. Vasopressin-Induced Antipyresis: Sex- and Experience-Dependent Febrile Responses. Annals of the New York Academy of Sciences. 1998, 856, 53–61. [CrossRef]
- Meurot C, Martin C, Sudre L, et al. Liraglutide, a glucagon-like peptide 1 receptor agonist, exerts analgesic, anti-inflammatory and anti-degradative actions in osteoarthritis. Scientific Reports. 2022, 12, 1567. [CrossRef]
- Li SL, Wang ZM, Xu C, et al. Liraglutide Attenuates Hepatic Ischemia–Reperfusion Injury by Modulating Macrophage Polarization. Frontiers in Immunology. 2022, 13. [CrossRef]
- Rinaman L, Comer J. Antagonism of central glucagon-like peptide-1 receptors enhances lipopolysaccharide-induced fever. Autonomic Neuroscience. 2000, 85, 98–101. [CrossRef]
- Brito HO, Reis RC, Bini I, et al. NK1 receptor mediates cerebral cellular and extracellular morphological changes during the LPS-induced febrile response. Brain Research. 2024, 1842, 149107. [CrossRef]
- Mert I, Cetinkaya A, Gurler M, et al. Anti-inflammatory potential of liraglutide, a glucagon-like peptide-1 receptor agonist, in rats with peripheral acute inflammation. Inflammopharmacology. 2022, 30, 1093–1105. [CrossRef]
- Gordon, CJ. Thermal biology of the laboratory rat. Physiology & Behavior. 1990, 47, 963–991. [Google Scholar] [CrossRef]
- Figueiredo MJ, de Melo Soares D, Martins JM, et al. Febrile response induced by cecal ligation and puncture (CLP) in rats: involvement of prostaglandin E2 and cytokines. Medical Microbiology and Immunology. 2012, 201, 219–229. [CrossRef]
- Dikalov S, Fink B. ESR Techniques for the Detection of Nitric Oxide In Vivo and in Tissues. In: ; 2005, 597-610. [CrossRef]
- Gomes BRB, Firmino M, Jorge JS, et al. Increase of reactive oxygen species in different tissues during lipopolysaccharide-induced fever and antipyresis: an electron paramagnetic resonance study. Free Radical Research. 2018, 52, 351–361. [CrossRef]
- Moreira CG, Barbiero JK, Ariza D, et al. Behavioral, Neurochemical and Histological Alterations Promoted by Bilateral Intranigral Rotenone Administration: A New Approach for an Old Neurotoxin. Neurotoxicity Research. 2012, 21, 291–301. [CrossRef]
- Costa RA, Amatnecks JA, de Oliveira Guaita G, Stern CAJ, Branco LGS, Zampronio AR. Sexual dimorphism of hypothalamic serotonin release during systemic inflammation: Role of endothelin-1. Journal of Neuroimmunology. 2024, 394, 578427. [CrossRef]
- Goldman JM, Murr AS, Cooper RL. The rodent estrous cycle: characterization of vaginal cytology and its utility in toxicological studies. Birth Defects Research Part B: Developmental and Reproductive Toxicology. 2007, 80, 84–97. [CrossRef]
- Baris E, Portakal HS, Aslan A, Firtina Karagonlar Z, Tosun M. Liraglutide modulates cyclooxygenase and α7 acetylcholine receptors: in vitro and in silico insights into its anti-inflammatory role in LPS-induced inflammation in RAW 264.7 macrophages. Naunyn-Schmiedeberg’s Archives of Pharmacology. Published online May 31, 2025. [CrossRef]
- Lu C, Xie T, Guo X, et al. Glucagon-like peptide-1 receptor agonist exendin-4 mitigates lipopolysaccharide-induced inflammatory responses in RAW264.7 macrophages. International Immunopharmacology. 2019, 77, 105969. [CrossRef]
- Roth J, de Souza GEP. Fever induction pathways: evidence from responses to systemic or local cytokine formation. Brazilian Journal of Medical and Biological Research. 2001, 34, 301–314. [CrossRef]
- Chai Z, Gatti S, Toniatti C, Poli V, Bartfai T. Interleukin (IL)-6 gene expression in the central nervous system is necessary for fever response to lipopolysaccharide or IL-1 beta: a study on IL-6-deficient mice. The Journal of Experimental Medicine. 1996, 183, 311–316. [CrossRef]
- Kozak W, Kluger MJ, Soszynski D, et al. IL-6 and IL-1β in Fever: Studies Using Cytokine-Deficient (Knockout) Mice. Annals of the New York Academy of Sciences. 1998, 856, 33–47. [CrossRef]
- Wong CK, McLean BA, Baggio LL, et al. Central glucagon-like peptide 1 receptor activation inhibits Toll-like receptor agonist-induced inflammation. Cell Metabolism. 2024, 36, 130–143. [CrossRef]
- Wilding JPH, Overgaard R v. , Jacobsen L v., Jensen CB, Le Roux CW. Exposure–response analyses of liraglutide 3.0 mg for weight management. Diabetes, Obesity, and Metabolism. 2016, 18, 491–499. [CrossRef]
- Jing F, Zou Q, Pu Y. GLP-1R agonist liraglutide attenuates pain hypersensitivity by stimulating IL-10 release in a nitroglycerin-induced chronic migraine mouse model. Neuroscience Letters. 2023, 812, 137397. [CrossRef]
- Diz-Chaves Y, Toba L, Fandiño J, González-Matías LC, Garcia-Segura LM, Mallo F. The GLP-1 analog, liraglutide prevents the increase of proinflammatory mediators in the hippocampus of male rat pups submitted to maternal perinatal food restriction. Journal of Neuroinflammation. 2018, 15, 337. [CrossRef]
- Yu J, Zhao Y, Xu L, et al. Liraglutide Attenuates Hepatic Oxidative Stress, Inflammation, and Apoptosis in Streptozotocin-Induced Diabetic Mice by Modulating the Wnt/β-Catenin Signaling Pathway. Mediators of Inflammation. 2023, 2023, 1–12. [CrossRef]
- Inoue T, Inoguchi T, Sonoda N, et al. GLP-1 analog liraglutide protects against cardiac steatosis, oxidative stress and apoptosis in streptozotocin-induced diabetic rats. Atherosclerosis. 2015, 240, 250–259. [CrossRef]
- Shiraki A, Oyama J Ichi, Komoda H, et al. The glucagon-like peptide 1 analog liraglutide reduces TNF-α-induced oxidative stress and inflammation in endothelial cells. Atherosclerosis. 2012, 221, 375–382. [CrossRef]
- Begg DP, Kent S, McKinley MJ, Mathai ML. Suppression of endotoxin-induced fever in near-term pregnant rats is mediated by brain nitric oxide. American Journal of Physiology-Regulatory, Integrative and Comparative Physiology. 2007, 292, R2174–R2178. [CrossRef]
- Soriano RN, Ravanelli MI, Batalhao ME, Carnio EC, Branco LGS. Propyretic role of the locus coeruleus nitric oxide pathway. Experimental Physiology. 2010, 95, 669–677. [CrossRef]
- Steiner AA, Antunes-Rodrigues J, McCann SM, Branco LGS. Antipyretic role of the NO-cGMP pathway in the anteroventral preoptic region of the rat brain. American Journal of Physiology-Regulatory, Integrative and Comparative Physiology. 2002, 282, R584–R593. [CrossRef]
- Hattori Y, Jojima T, Tomizawa A, et al. RETRACTED ARTICLE: A glucagon-like peptide-1 (GLP-1) analogue, liraglutide, upregulates nitric oxide production and exerts anti-inflammatory action in endothelial cells. Diabetologia. 2010, 53, 2256–2263. [CrossRef]
- Gammoh O, Qnais E, Aljabali AAA, Hatahet T, Alqudah A. Metabolic resilience: liraglutide’s potential in alleviating depressive symptoms. Molecular Biology Reports. 2025, 52, 550. [CrossRef]
- Nonogaki K, Kaji T. The GLP-1 Receptor Agonist Liraglutide Decreases Primary Bile Acids and Serotonin in the Colon Independently of Feeding in Mice. International Journal of Molecular Sciences. 2024, 25, 7784.
- Mizuno S, Kurobe-Takashima Y, Kuriki D, et al. Phosphatidylcholine suppresses inflammatory responses in LPS-stimulated MG6 microglial cells by inhibiting NF-κB/JNK/p38 MAPK signaling. PLOS One. 2025, 20, e0328206. [CrossRef]
Figure 1.
LIRA reduces the febrile response induced by LPS in male and female rats. Rats were treated with LIRA via intraperitoneal injection (i.p.) at a dose of 0.3 mg/kg, or with saline (SAL) at a volume of 0.5 mL, administered 1 hour after an i.p. injection of LPS (50 μg/kg) or sterile saline. (A, C) The data are expressed as mean ± SEM of body temperature (ºC) in 6-7 animals. The gray and black arrows represent the time of LPS and LIRA injections, respectively. (B, D) Thermal index calculated from the area under the curve, from 2 to 6 h (as indicated in panels A, C). ****p < 0.0001, #p < 0.05 LPS/SAL compared with SAL/SAL. Data were analyzed by (A, C) three-way ANOVA matching by factor time and (B, D) two-way ANOVA, both followed by Tukey’s multiple comparison test.
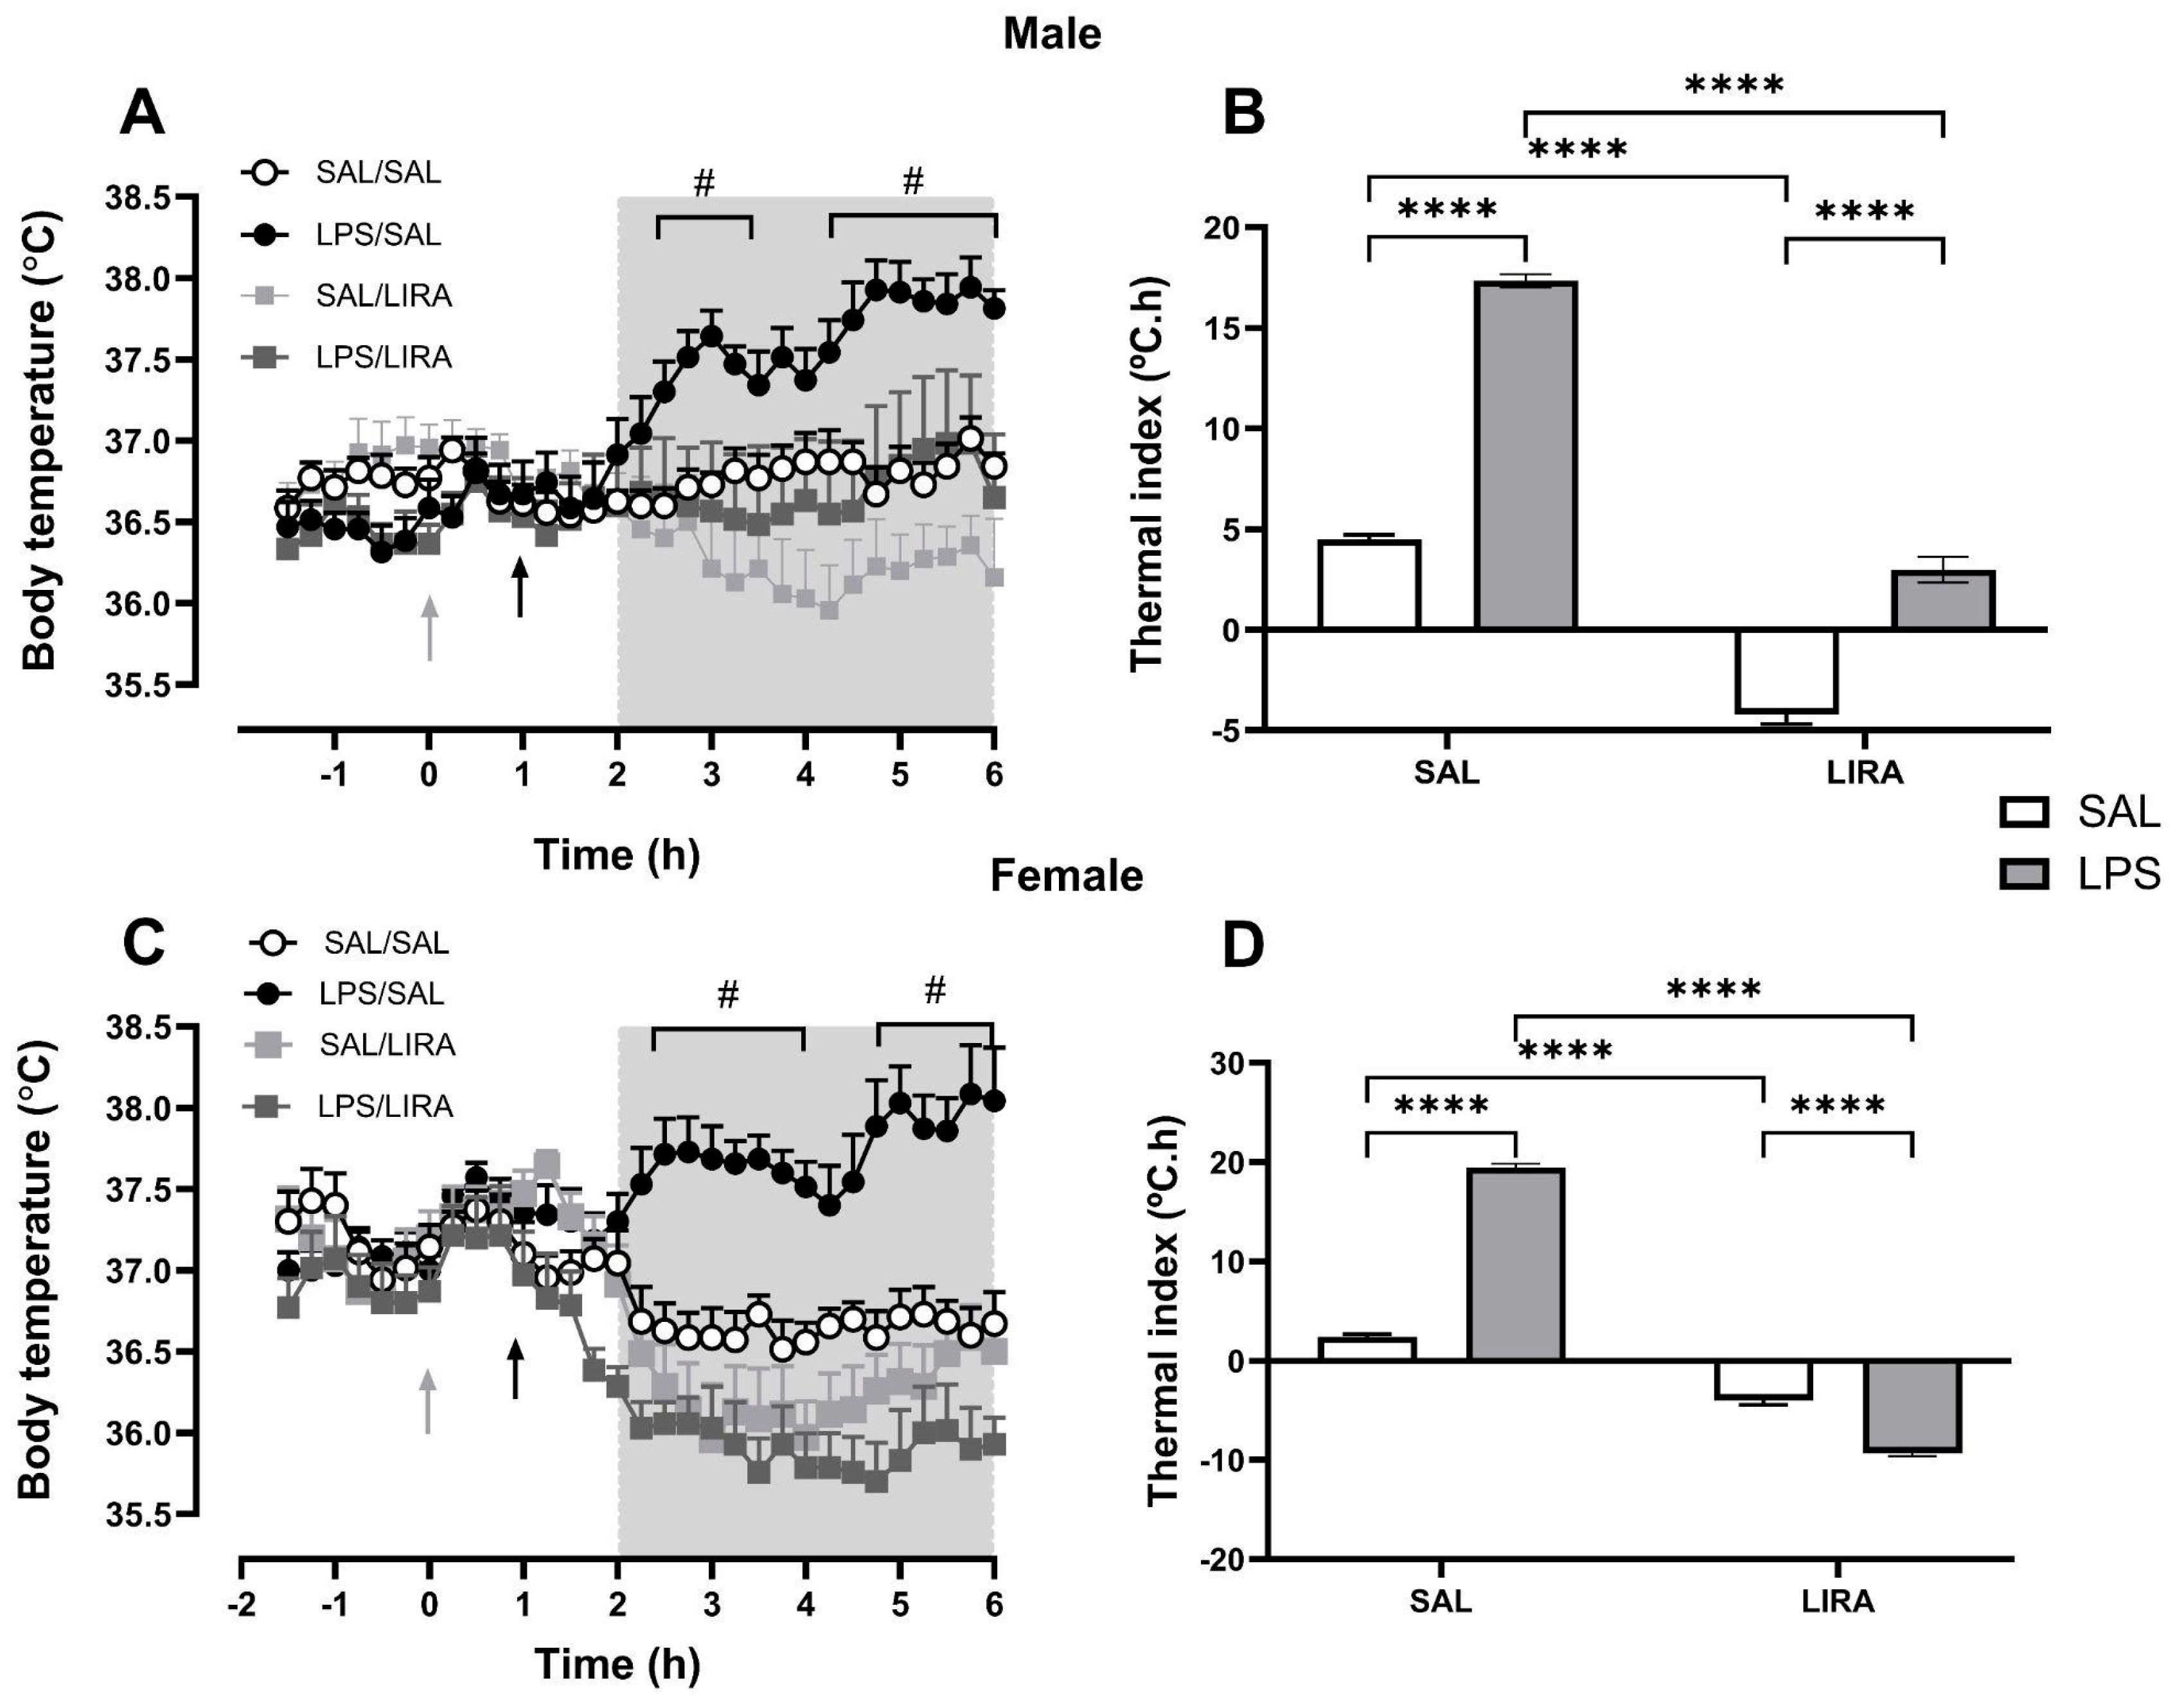
Figure 2.
LIRA attenuates LPS-induced elevation of hypothalamic PGE₂ in male rats. (A) and (B) show the concentration of PGE₂ per gram of hypothalamic tissue collected 4 hours after LPS administration in male and female rats, respectively. Data represent mean ± SEM and were analyzed using two-way ANOVA followed by Tukey’s multiple comparison test. *p < 0.05; **p < 0.01.

Figure 3.
Serum concentrations of IL-6 and IL-10 after LPS administration in rats treated with or without LIRA. Panels (A) and (B) show IL-6 concentrations in male and female rats, respectively. Panels (C) and (D) show IL-10 concentrations in male and female rats, respectively. Animals were divided into control (SAL) and LIRA-treated groups (0.3 mg/kg, i.p.) and evaluated 4 hours after administration of LPS (50 μg/kg, i.p.) or sterile saline (0.9%, 0.5 mL) (n = 5 per group). Data are presented as mean ± SEM. Statistically significant differences were indicated by *p < 0.05, **p < 0.01, ****p < 0.0001, as determined by two-way ANOVA followed by Tukey’s post hoc test.
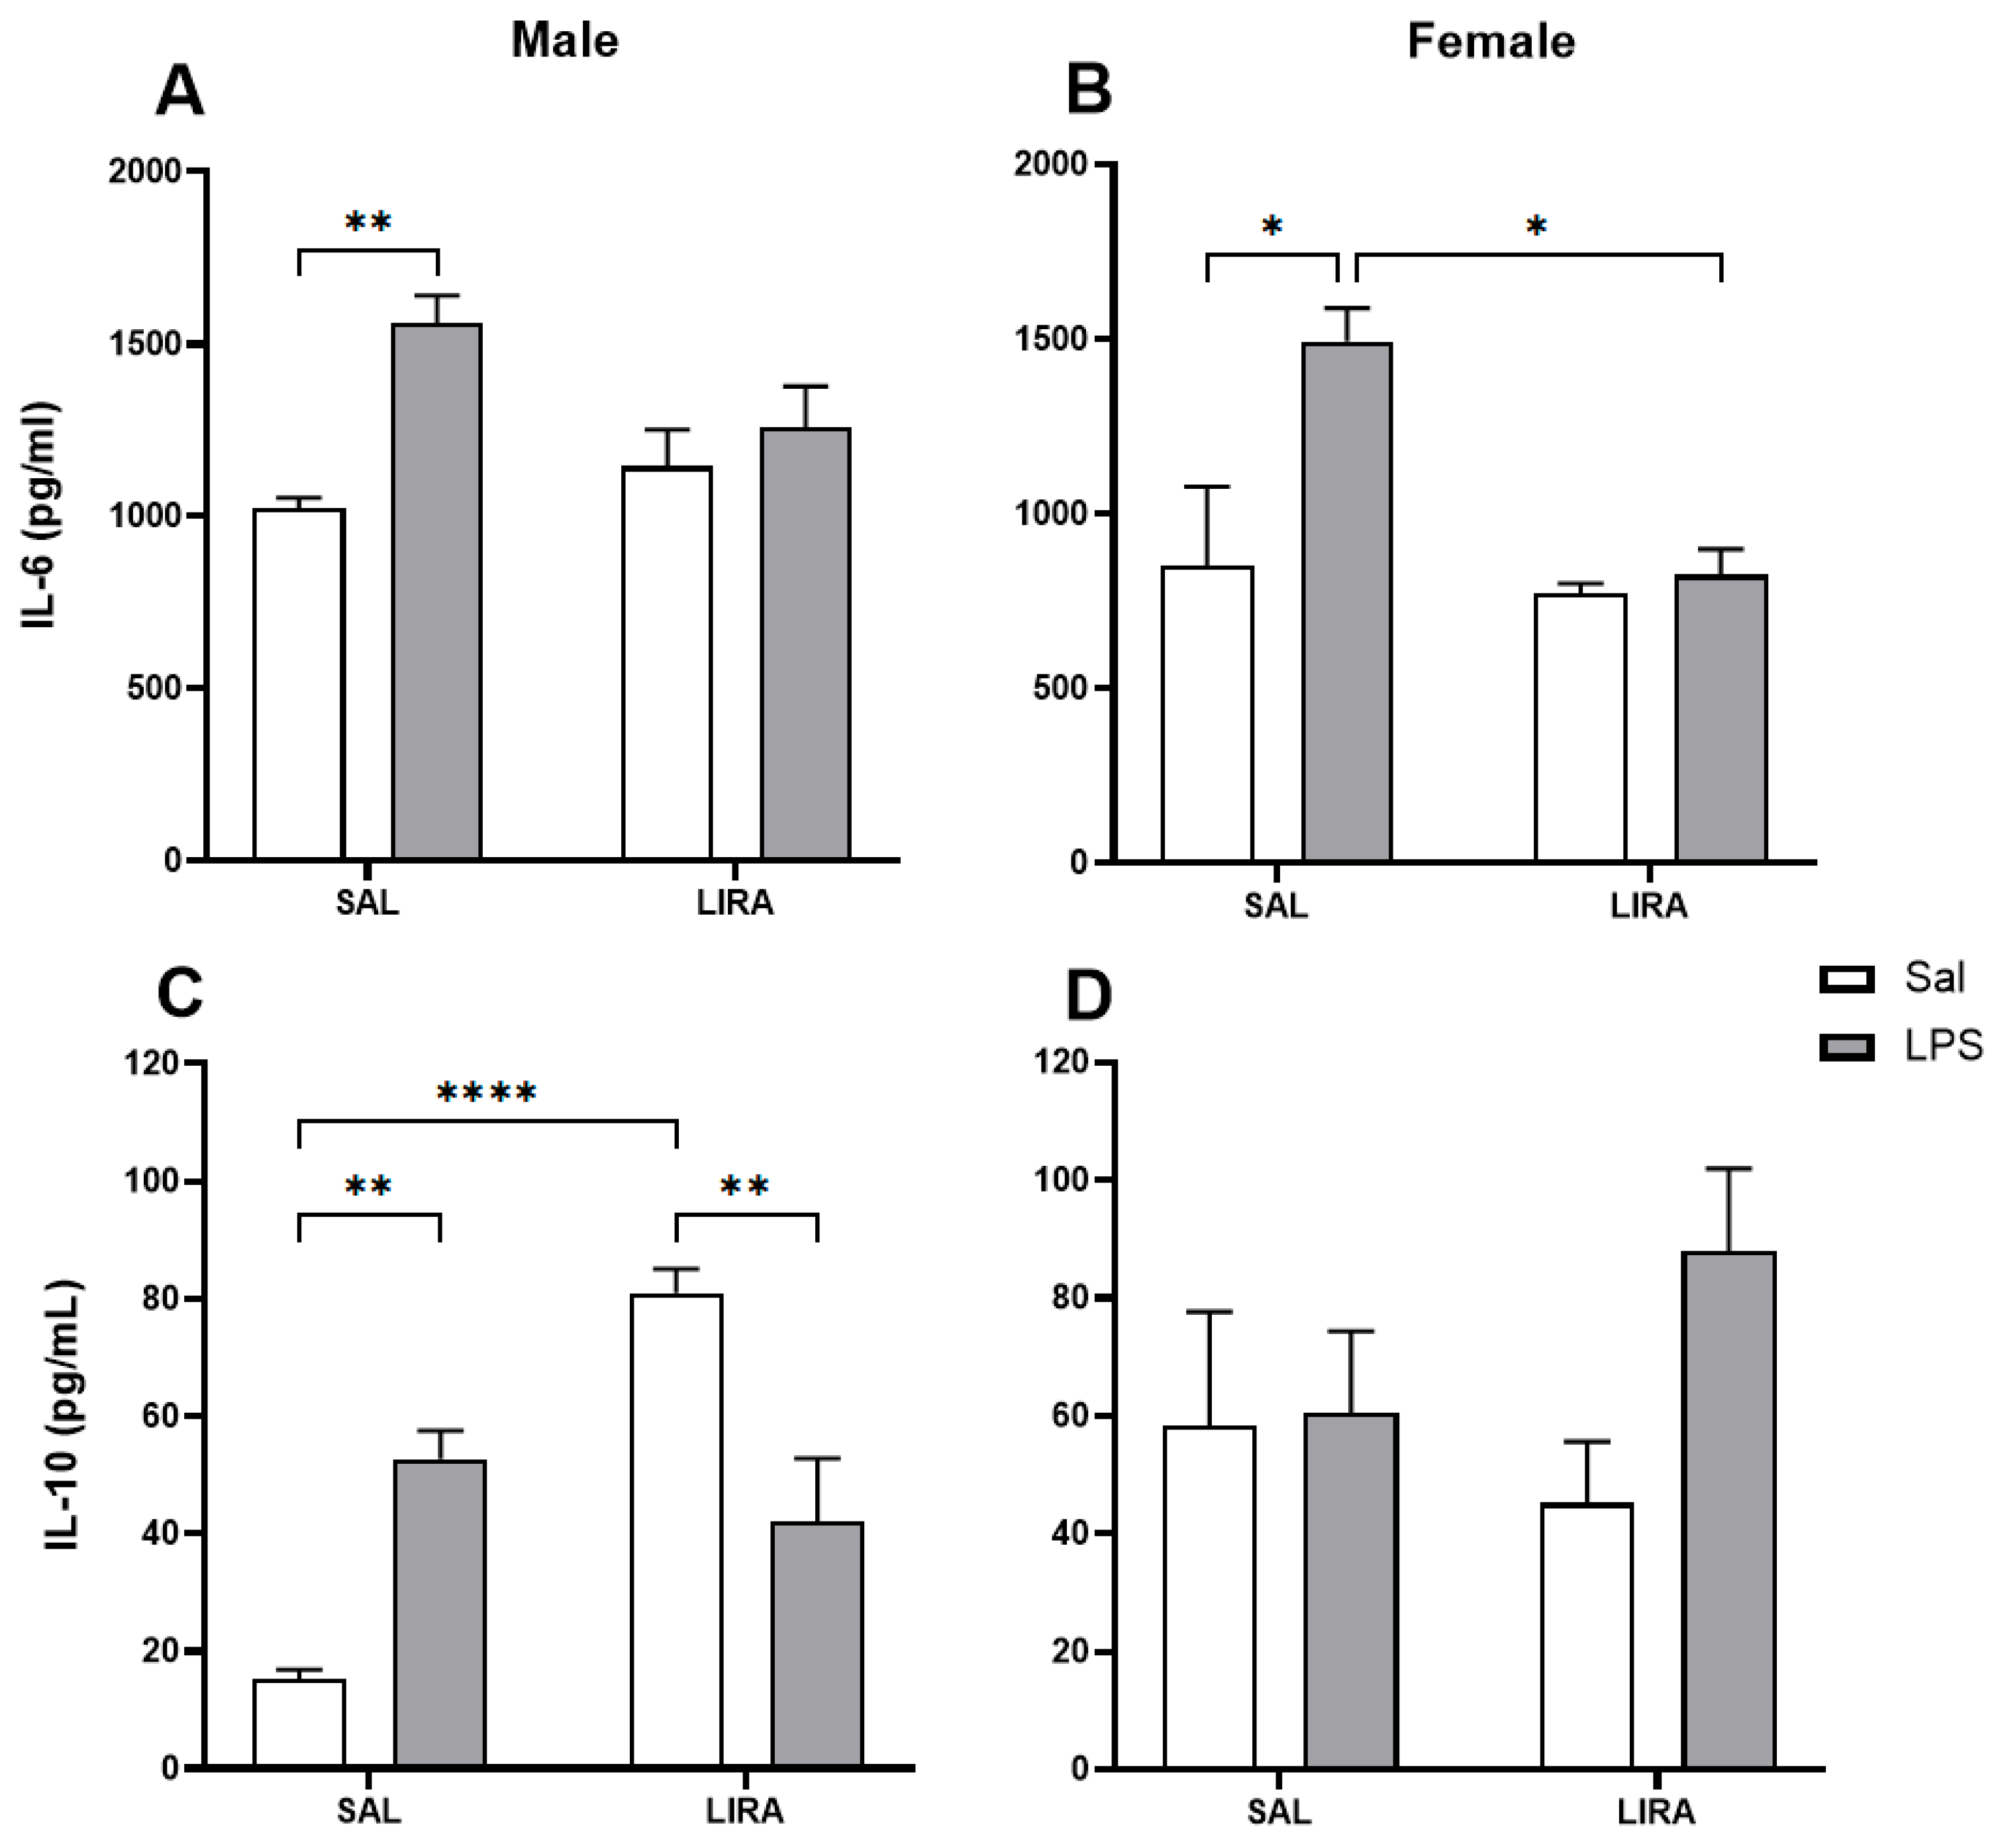
Figure 4.
CM• and peripheral HbNO concentrations after LPS administration in rats treated with or without LIRA. Panels (A) and (B) show CM• concentrations in male and female rats, respectively. Panels (C) and (D) show peripheral HbNO concentrations in males and females, respectively. Animals were divided into control (SAL) and LIRA-treated groups (0.3 mg/kg, i.p.) and evaluated 4 hours after administration of LPS (50 μg/kg, i.p.) or sterile saline (0.9%, 0.5 mL) (n = 6-7 per group). Data are presented as mean ± SEM. Statistically significant differences were indicated by *p < 0.05, **p < 0.01, ***p < 0.001, ****p < 0.0001, as determined by two-way ANOVA followed by Tukey’s post hoc test.
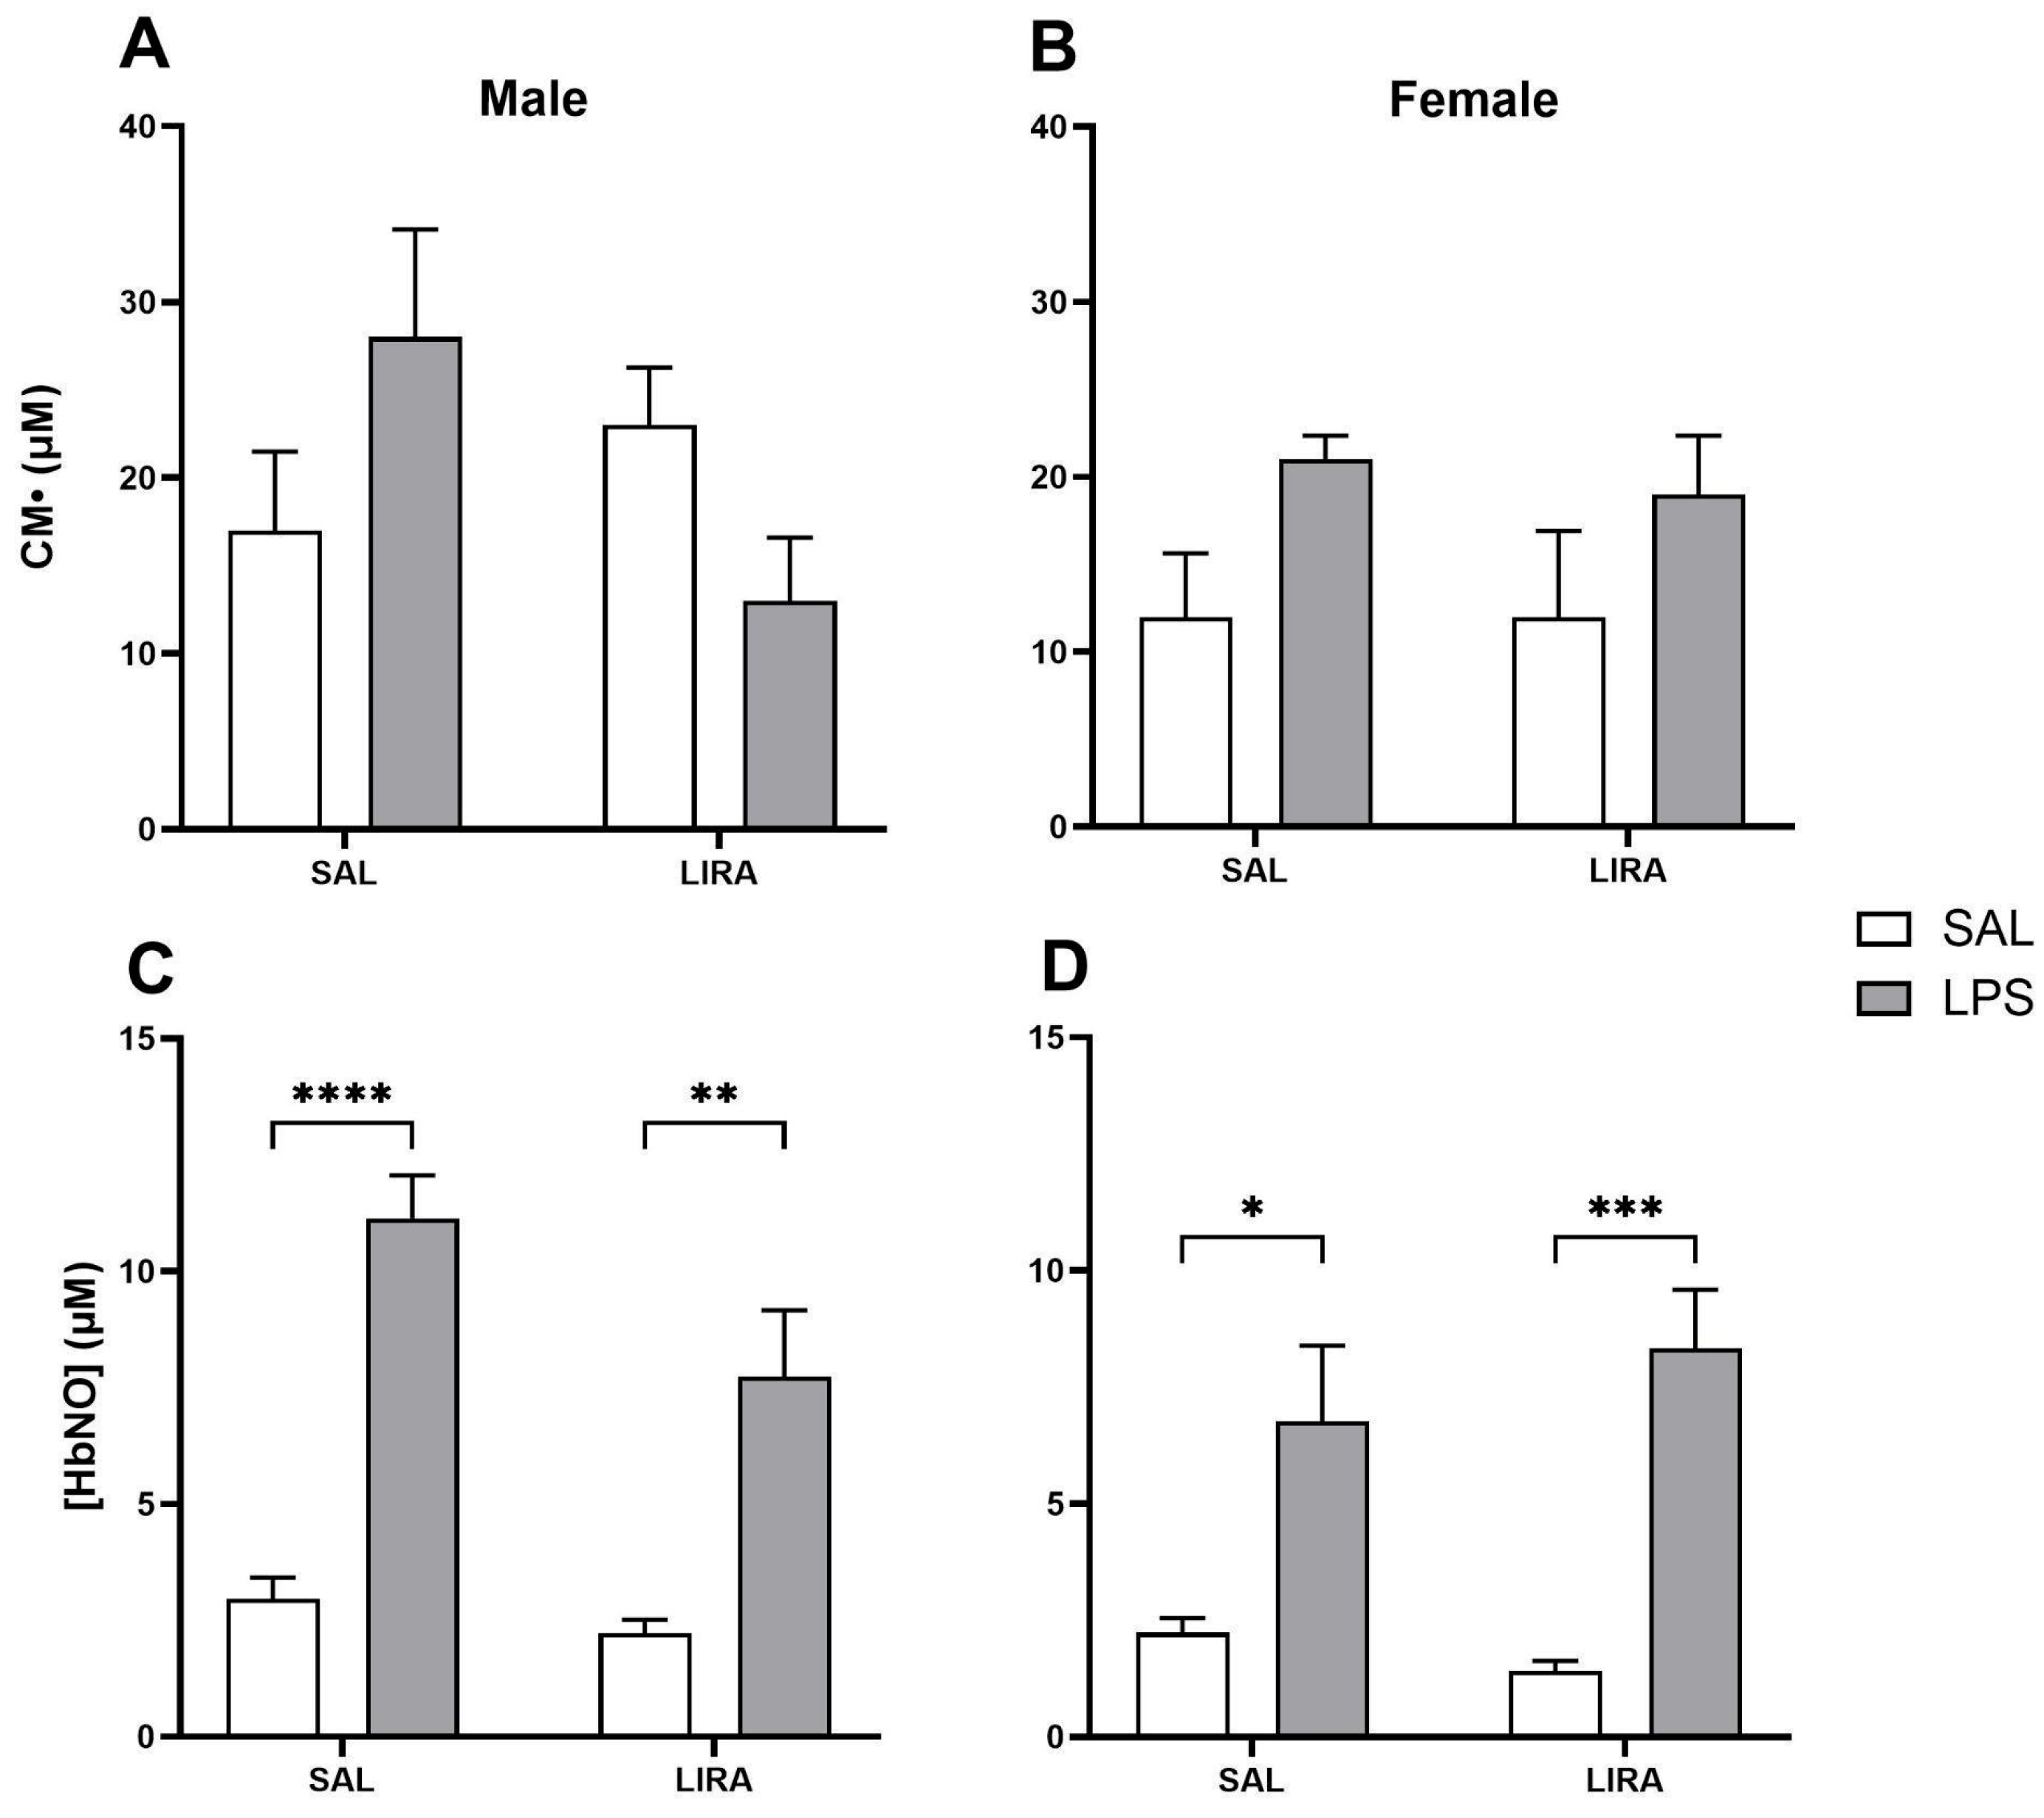
Figure 5.
Levels of 5-HT and DA in the hypothalamus after LPS administration in rats treated with or without LIRA. Panels (A) and (B) show levels of 5-HT in male and female rats, respectively. Panels (C) and (D) show levels of DA in males and females, respectively. Animals were divided into control (SAL) and LIRA-treated groups (0.3 mg/kg, i.p.) and evaluated 4 hours after administration of LPS (50 μg/kg, i.p.) or sterile saline (0.9%, 0.5 mL) (n = 6-7 per group). Data are presented as mean ± SEM. Statistically significant differences were indicated by *p < 0.05, **p < 0.01, as determined by two-way ANOVA followed by Tukey’s post hoc test.
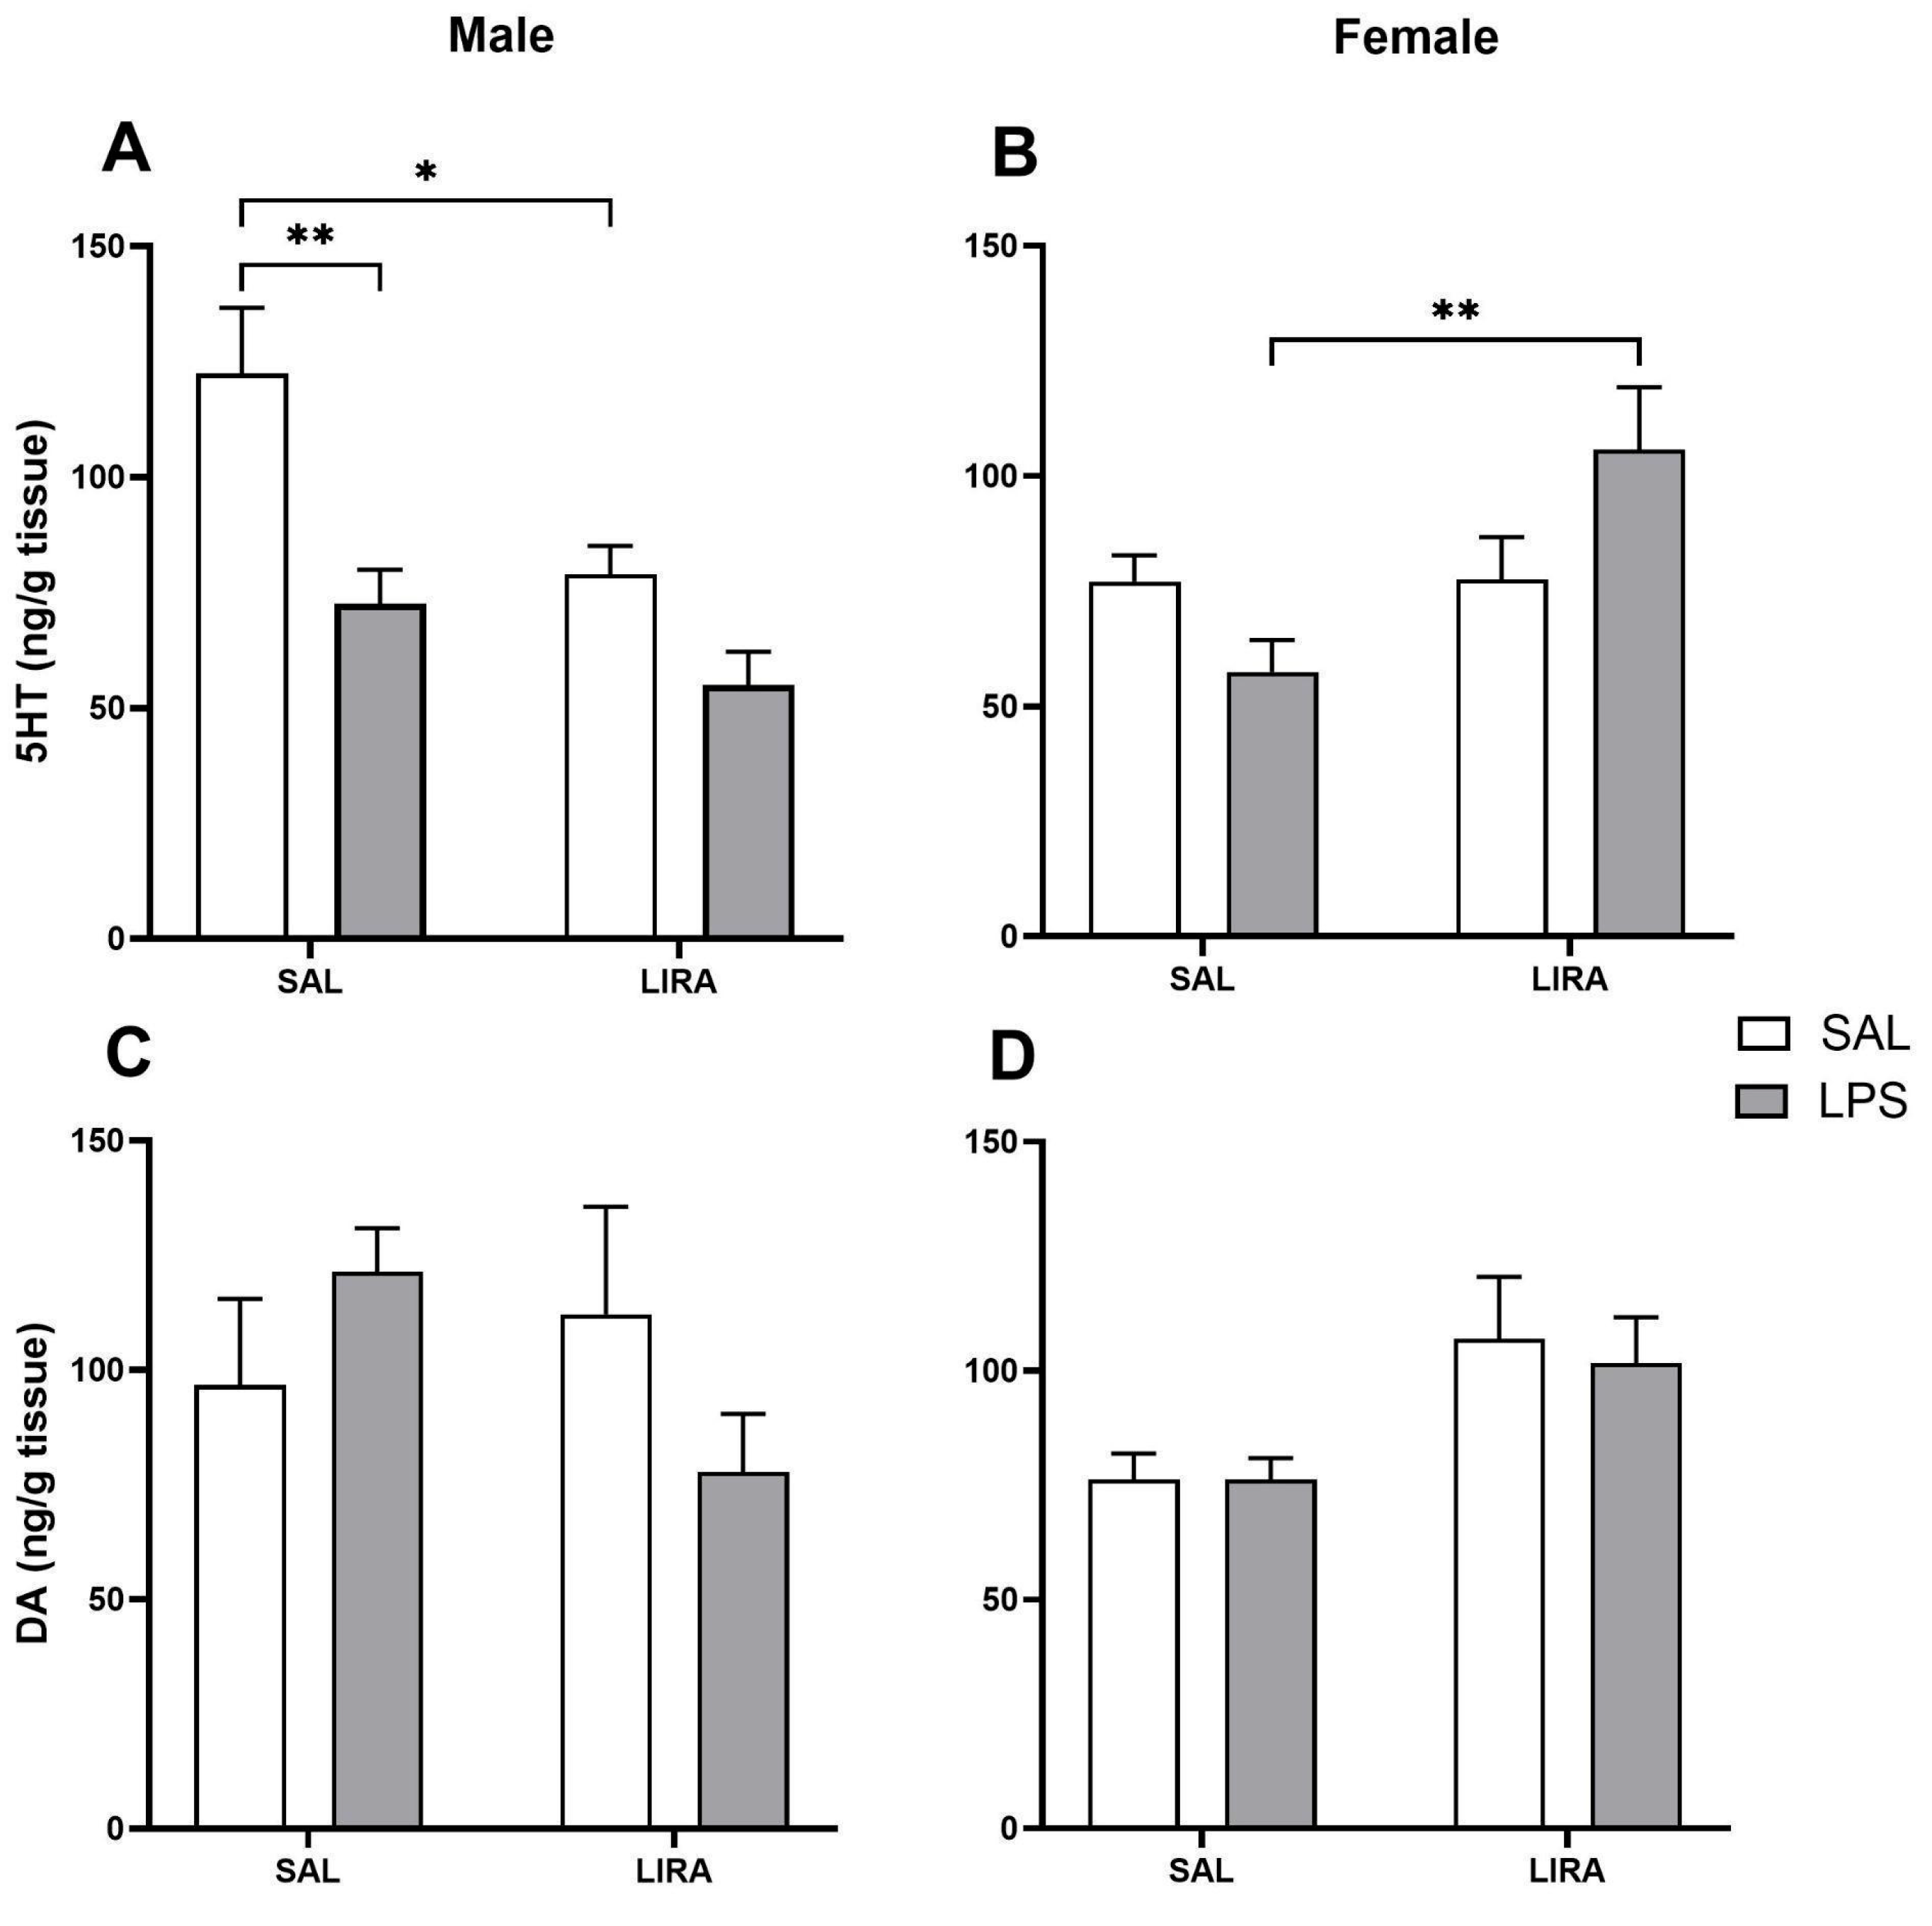
Figure 6.
Sex-specific effects of LIRA on hypothalamic JNK phosphorylation in male and female rats following LPS-induced systemic inflammation. Representative Western blot images showing phosphorylated JNK (p-JNK), total JNK, and β-actin protein expression in hypothalamic tissue from male (A) and female (B) rats. Animals were treated with SAL or LIRA followed by SAL or LPS (50 μg/kg, i.p.). Quantitative analysis shows the ratio of p-JNK to total JNK in males (C) and females (D), as well as total JNK normalized to β-actin in males (E). Data are presented as mean ± SEM (n = 6-8 per group). *p < 0.05 as determined by two-way ANOVA followed by Tukey’s post hoc test. Molecular weights are indicated on the right side of the blots.
Disclaimer/Publisher’s Note: The statements, opinions and data contained in all publications are solely those of the individual author(s) and contributor(s) and not of MDPI and/or the editor(s). MDPI and/or the editor(s) disclaim responsibility for any injury to people or property resulting from any ideas, methods, instructions or products referred to in the content. |
© 2025 by the authors. Licensee MDPI, Basel, Switzerland. This article is an open access article distributed under the terms and conditions of the Creative Commons Attribution (CC BY) license (http://creativecommons.org/licenses/by/4.0/).
Copyright: This open access article is published under a Creative Commons CC BY 4.0 license, which permit the free download, distribution, and reuse, provided that the author and preprint are cited in any reuse.


