Submitted:
06 October 2025
Posted:
07 October 2025
You are already at the latest version
Abstract
Determination of the elemental composition of minerals and their derivatives at mining enterprises is important at all stages of minerals processing. This paper is devoted to the results of development and application of an online X-ray fluorescence (XRF) analysis method for monitoring mineral elements on a conveyor belt of mining enterprises. Evaluation of metrological characteristics achieved in the online analysis of lump, ore, charge feed, cake and slag materials on conveyor belt is presented. Each implementation of the online XRF analysis at mining enterprises was preceded by laboratory studies, development of measurement methods, calibration of a specific XRF analyzer using standard reference samples for a specific concentration range of the monitored elements. Typical areas of application for monitoring the concentration of elements in rocks on conveyor belts of mining enterprises and those solutions that made it possible to achieve the required measurement accuracy of an X-ray fluorescence analyzer in online mode are presented.
Keywords:
XRF analysis of minerals
; elemental analysis
; on-line ore analysis on conveyor belt
1. Introduction
Determination of the elemental composition of minerals and products of their technological processing at mining and refining facilities is important at all stages of material processing (for example, mining and beneficiation). Many analyzing techniques have been developed that allow to accurately determine the chemical composition of prepared samples [1,2,3]. Such an analysis requires setting up special laboratories that have quite a complex and expensive analytical equipment, specially trained and highly qualified personnel. To ensure the operation of such an analytical laboratory, the availability of a large number of chemical reagents is required, which, in addition, have a significant negative impact on the environment. When analyzing materials on such an industrial scale, the main difficulties are related to delivering the representativeness of these materials’ samples and the speed of analysis, the results of which often become known only after a few hours.
Operational analysis of materials on the conveyor of mining enterprises in most cases does not require sample preparation, which excludes the influence of a human factor and unpredictable accidents on the results of the analysis [4]. Such operational analysis can be based on various nuclear physics methods (e.g., radiometric, neutron activation, gamma activation, and X-ray fluorescence (XRF)) [4,5,6,7]. Of course, online analysis methods are usually less sensitive and precise than chemical ones. However, they provide analysis results in real time, which allows to quickly adjust technologies, automate technological processes and eliminate significant human labor costs. Besides, on the conveyor it is often less important to know the absolute value of a particular element’s concentration, than to control its trend and see the course of the concentration change. Each of the nuclear physics methods has its advantages and disadvantages and solves a certain range of applications [4,5,6,7].
X-ray fluorescence analysis (XRF) is one of the most accurate and simplest analytical methods for studying a matter in order to obtain its elemental composition [5,7]. With the help of this method, various elements from aluminum (Al) to uranium (U) can be detected. The XRF method is based on the registration and subsequent analysis of the spectra that arise when the materials under study are irradiated with X-rays. Both X-ray tubes and isotopes of various elements can be used as a radiation source. The industry produces a massive number of XRF equipment for analysis of materials in laboratory conditions [8], the measurement methods on such equipment are well developed.
At the same time, the development of on-line XRF equipment for materials analysis in industrial environments is not so rapid. There are several industrial XRF analyzers on the market for the elemental composition analysis of liquid solutions and pulp [9,10,11,12,13,14], for the analysis of alloys in coatings [15,16], and for the analysis of bulk materials on a conveyor [17,18,19]. The small number of industrial online XRF analyzers on the market is primarily due to non-standard technological problems that need to be solved by each enterprise in its production. Any non-standard task requires its own individual solution.
This paper is devoted to the results of development and application of an on-line XRF method for monitoring elements in minerals at conveyors of mining and processing enterprises. The paper also reviews those mining technological applications where we have successfully implemented the on-line method and presents an analysis of metrological characteristics achieved in these applications.
The introduction should briefly place the study in a broad context and highlight why it is important. It should define the purpose of the work and its significance. The current state of the research field should be carefully reviewed and key publications cited. Please highlight controversial and diverging hypotheses when necessary. Finally, briefly mention the main aim of the work and highlight the principal conclusions. As far as possible, please keep the introduction comprehensible to scientists outside your particular field of research. References should be numbered in order of appearance and indicated by a numeral or numerals in square brackets—e.g., [1] or [2,3] or [4,5,6]. See the end of the document for further details on references.
2. Online XRF Method
In contrast to laboratory applications, the online use of XRF equipment to analyze the concentration of elements in both pulp and bulk materials implies its integration into the technological line of processing production [4]. For this reason, a reliable industrial on-line XRF analyzer, capable of continuous operation in harsh industrial conditions, is the key element necessary for implementation of an on-line XRF method of controlling elements in minerals on a conveyor. In the mining industry, where analyzers work year-round in unsealed hangars almost in the open air and are exposed to dust, humidity, a wide range of operating temperatures from -40oC to +50oC, electromagnetic interference, vibration, etc., the operating conditions are especially harsh.
The scheme of application of the online XRF method of control of bulk materials on a conveyor is presented in Figure 1. The industrial XRF analyzer (1) is mounted on a special suspension (2) (see Section 3) above the conveyor belt (3) with ore (4), usually moving at a speed of 1-2 m/s, in some enterprises – up to 5 m/s. XRF analyzer contains an X-ray tube (5), an X-ray detector (6), a multi-channel analyzer for amplification and shaping of signals from the detector, power supplies (7), computer (8) equipped with software for the analysis of X-ray spectra and the calculation of the concentration of the required elements.
Passing under the analyzer, the ore is irradiated by X-ray radiation from the X-ray tube (9) and emits secondary characteristic radiation (10), which is registered by a semiconductor X-ray detector (6). The type of X-ray tube used, its power and anode material are determined by the conditions of the application to be solved.
The height of installing the XRF analyzer above the conveyor depends on the type and size of ore pieces going along the conveyor, the pattern of ore distribution along the width of the conveyor belt and the change in its height on the conveyor over time. In practice, material sizes vary greatly in different conveyor belt applications, ranging from fractions of mm to 25-30 cm. The maximum size of the ore pieces determines the height at which the XRF analyzer should be mounted above the conveyor with the ore, as well as the geometry of mutual arrangement of the X-ray tube and detector. In order to mount the analyzer at a certain level above the conveyor belt, various suspensions have to be designed and applied, and their design depends on the specific task (see Section 3). Ideally, the surface of the ore should be completely flat so that the bottom surface of the XRF analyzer could be as close as possible to the surface of the material. But in real applications, this is extremely rare.
In real-world applications, there is always an air gap between the ore surface and the surface of the XRF analyzer, which must be minimized. Since virtually all lines (L-series) of the characteristic X-ray emission of elements from aluminum to uranium are in the 1-30 keV energy range, such soft radiation is easily absorbed in the air gap, leading to a decrease in the sensitivity of the method. No less important is the need not only to minimize, but also to ensure the consistency of the width of this air gap. When changing the width of the air gap, the value of radiation absorption in it will change, which will be perceived by the detector as a change in the signal from a controlled element in the ore due to a change in its concentration.
Since the X-ray energy for excitation of fluorescence of elements from aluminum to uranium is relatively small (9-45 keV), the layer of the material from which the fluorescent quanta with an acceptable self-absorption value comes out is about 1.0-1.5 mm. This is considered to be the main disadvantage of XRF material control method (both laboratory and online), as it results in low representativeness (small volume) of the sample tested. However, in the case of the online XRF method, due to a moving conveyor belt, the volume of samples measured is 3-4 orders of magnitude larger, even than that of samples in chemical analysis. Thus, at a1 m/s speed of the conveyor belt, the track of an irradiated ore material being 10 cm wide and the time of one measurement being 200 seconds, the sample volume is about 20x103 cm3. While in chemical analysis, the volume of ore material is approximately 1 cm3.
3. Development and Implementation of the On-Line XRF Method
Industrial XRF Analyzer. XRF analyzers manufactured for use in laboratory conditions [8] are not suitable for use in online monitoring on enterprise conveyors. We continue to develop and implement the online XRF analysis method for mining enterprises based on the industrial CON-X XRF analyzer [17], which has already undergone several upgrades to meet the increasing level of requirements [20]. Since analyzer installation locations in all mining enterprises are practically open hangars all year round, we provided the analyzer with a hermetically sealed housing; the temperature inside the detection system is stabilized, which ensures reliable measurement of results under all external conditions.
However, even then measurement results depend on many factors, such as a distance between a measured sample and the analyzer, the size of ore pieces, the high degree of inhomogeneity of the controlled material, unknown and variable amounts of light elements invisible to the analyzer, the humidity of the measured material, dustiness of the air, etc. All these factors were considered in the calculation algorithm to ensure reliable results of online XRF analysis.
Software. A software package developed for online XRF analysis, provides the analyzer not only with empirical correction (i.e., using a reference sample), but also using the fundamental parameter method. This software package provides the ability to conveniently process the obtained spectrum, including deconvolution, smoothing, subtracting the background, the use of spectral ratio method and the standard-background method [5,7]. This allows to solve a wide range of technological problems in the mining industry.
In addition to calculating the concentrations of elements, the software also calculates an assessment of their statistical accuracy, the detection limit (DL) and sensitivity of the measurements [21]. The detection limit (DL) is the minimum concentration which can be detected with certainty in a given measurement time. It is determined from the expression:
where Sp and Sb are numbers of photons, detected in the spectral line and its background, and C is the concentration of the corresponding element.
The statistical accuracy (σ) shows the achievable repeatability of determination of the element concentration at a fixed sample position. It is determined from the expression:
The sensitivity (ε) is defined as an increase in the number of photons in the spectral line arriving to the detector in one second, if the concentration is increasing by 1% (in terms of measured element). It is computed from the expression.
where, t is the measurement time.
Calibration. In order to deliver the required accuracy in measuring the concentration of the measured elements on a conveyor, and to minimize all unaccounted errors (see above), the online analyzer must be calibrated for the specific task it needs to solve. Analyzer calibration, which correlates the X-ray intensity to actual quantities of the registered elements, is performed by us in laboratory conditions using reference samples [22,23]. For such calibration, we use reference samples provided to us by mining companies themselves. These reference samples are produced by analytical plant laboratories of mining enterprises, and contain the concentrations of monitored elements in the range in which they are present in the ores of these enterprises. Characteristics of standard reference samples for online XRF analyzers’ applications (see section 4) are presented in Table 1.
Figure 2 shows an example of a typical calibration curve for measuring Titanium (application 4.5), created using the provided standard samples. The R2 value for the given graph was 0.9971. For the rest elements of interest all R2 values are given in Table 1 without the graphs. As can be seen from the table, all R2 values are close to the value=1, thus indicating that the calibration graphs are close to perfect straight lines.
Reference materials ensure accurate and consistent measurements, allowing to control metrological characteristics of the XRF analyzer and validate measuring techniques. All XRF analyzers presented in Section 4 have been calibrated relative to reference samples provided by customer enterprises. All these analyzers have methodologies developed for measuring the required elements.
4. On-Line Analyses Results and Discussions
Below are some typical applications for monitoring the concentration of elements in rocks at mining plants and the solutions that enabled achieving the required measurement accuracy online using the CON-X XRF analyzer on conveyor belts of these plants. In all of the above solutions, XRF analyzers used X-ray tubes with a Mo anode, although in other applications X-ray tubes with a different anode material were used (Ag, Rh). The power of X-ray tubes in the presented applications varied (HV=9-45 kV; I=100-800 μA) depending on the task to be solved. Silicon Drift detectors (SDD) with a sensitive surface area of 10 mm2 were used as X-ray detectors.
4.1. The Chromite Lump (Cr2O3 or FeCr2O4) Content Determination
Control of the chromium content in chromium-iron ore was provided to control the quality of the initial products on the conveyor of a mining company. The online XRF analyzer was mounted above a conveyor belt on a standard suspension on four legs with shock absorbers to reduce the vibration of the analyzer (Figure 3).
The distance from the bottom of the analyzer (which is also the detector plane) to the surface of ore pieces was 150 mm. The conveyor belt speed was 1 m/s, and the measurement time in this application was t=60 sec. The typical spectrum of chromium-iron ore flowing through the conveyor recorded online by the XRF analyzer, used to calculate the concentrations of elements in it and the calculation errors, is presented in Figure 4.
The spectrum clearly shows the peaks of chromium and iron, the concentrations of oxides of which in the ore range from 29 to 40% and 25 to 30%, respectively. The detection limits of chromium and iron in the ore were 0.07 and 0.08% abs. The accuracy of XRF analysis is confirmed by the data of chemical analysis of more than 300 ore samples, which were taken from the conveyor synchronously with the operation of the spectrometer. Graphs of changes in the concentration of chromium in ore in various samples are presented in Figure 5. The standard deviation of the results of the two methods was 1.1% abs for Cr2O3 and 0.8% abs for Fe2O3.
4.2. Analysis of Copper-Zinc Sulfide Ore
Continuous monitoring of copper and zinc concentration in copper-zinc sulfide ore lumps is carried out by a company during conveyor transportation. The industrial online analyzer was installed above the conveyor at a height of 80 mm above the ore level on a simple suspension attached to a beam passing over the conveyor (Figure 6.).
The dimensions of ore lumps were 50-150 mm. Conveyor speed was 1 m/s, measurement time in a given application t= 300 sec. A typical of copper-zinc sulfide ore spectrum recorded by the analyzer and used to calculate concentrations and measurement errors is shown in Figure 7.
The spectrum in Figure 7 indicates that the XRF analyzer is capable of online measurement of Fe, Cu and Zn in copper-zinc sulfide ore. The spectra clearly show that the copper Ka peaks are very small, and the copper Ka peak is completely covered by the zinc Ka peak, since the zinc concentration is tens of times higher. The concentration ranges for copper in this ore were from 0.05 to 0.8%, its detection limit was 0.008%. A comparison of the results of measuring copper concentrations in the ore online by the XRF method with chemical analysis is shown in Figure 8.
The standard deviation when compared with the results of chemical analysis for copper were 9.45%. For zinc, the standard deviation (3.6%) is significantly smaller, since the intensity of its peaks is much higher.
4.3. Analysis of Chemical Composition of the Charge Feed
For the production of cast iron from iron ore, agglomerate is used, the raw material for which is an iron-ore mixture (IORM) and limestone. The main task of managing the process of the agglomerate charge preparation is to ensure the required chemical composition. The system for automatic continuous monitoring of the chemical composition of charge components (limestone and IORM) was developed on the basis of the XRF online method [4].
The iron-ore charge feed moves on a conveyor belt at a speed of 1 m/s (Figure 9.) and has the following granulometric composition: the content of 0-1 mm size class material in IORM is 68-83%, 1-3 mm – 12-23%, the remaining part of IORM consists of larger particles with a 3-8 mm size. The IORM level on the conveyor belt is very uneven. To equalize the IORM level and ensure a constant distance between the analyzer detector and the IORM layer on the conveyor (40 mm), a floating suspension with a protective cover was developed. In case of heavy loads of the conveyor belt, the spectrometer is automatically lifted above the conveyor by command from the emergency level sensors. The expressiveness of the method for analyzing IORM directly in the process flow depends on the time of spectrum measurement and is 6 minutes.
The spectrum of X-ray fluorescence of IORM is shown in Figure 10. The spectrum contains lines of iron, calcium, argon (in the composition of air), manganese, peaks of iron escape, total peaks of iron superposition, peaks of coherent and incoherent scattering of characteristic radiation of the tube (molybdenum line).
The range of element concentrations in IORM during the industrial test period was 57.5-60.5; 3,58-4,96; 0.24-2.19% for Fe, CaO, MnO, respectively. The reproducibility of the results of CaO, MnO and Fe determination was 1.8; 12.0 and 0.2% rel., accordingly. For a sample with a CaO content of 2.56 and MnO content of 1.02%, the detection limits were 0.33 and 0.21%, respectively. The resulting detection limit for Fe was 0.16%. The error of the X-ray fluorescence determination of CaO, MnO and Fe in IORM directly in the process flow was: 6.4; 19.0 and 0.9% rel., accordingly.
The results of XRF analysis on the conveyor were controlled by comparing these with the results of chemical analysis of 500 simultaneously taken samples [4]. A mechanized sampler was used for sampling IORM on the conveyor. The volume of the sample taken every 6 minutes was 0.6 -0.8 kg. Experimental studies showed that the discrepancy between the results of iron determination in the samples and in the flow is characterized by a standard deviation of 1.6% rel. The XRF in the flow methodology surpasses the technique of IORM analysis by one-time samples selection in terms of accuracy, expressiveness, productivity, efficiency and the possibility of participation in the Automated Process Control System (APCS).
4.4. Cobalt (Co) Content Determination in Iron-Cake
Concentration control of cobalt iron-cake is necessary for an enterprise to control the quality in the technological process. Such control was carried out directly on a belt filter with a cake moving at a speed of 0.3 m/s (Figure 11). The distance from the lower plane of the analyzer to the surface of the cake was 50 mm, which was provided by the diameter of wheels supporting the analyzer on the surface of the cake. To prevent the wheels from falling into the cake, a dynamic suspension with a balancer has been developed, that kept the analyzer in a fixed position above the cake.
The spectrum of the iron cake for the measurement time t=300 sec is shown in Figure 12. The spectrum clearly shows the lines of all elements present in the cake. The task of determining the cobalt concentration is complicated by the fact that the intense Fe-Kb line overlaps with the weak Co-Ka line. This creates difficulties in determining the Co concentration, but the analyzer performs the task due to the sufficiently high energy resolution of the detector. To measure the cobalt content in the required concentration range of 0.23 - 0.36%, the empirical coefficients method was used. This method uses standard samples of different concentrations, close in composition to the real ore. To determine the cobalt concentration, we used a calculation option in which the cobalt peak area is normalized to the peak area (Fe-Ka), using the fundamental value of the Fe-Ka to Fe-Kb ratio. The best results were obtained when the calibration curve was plotted directly from the ratio of Co/Fe intensities to the incoherent scattering intensity of the radiation.
On Figure 13 chemical and online XRF analyzer measurements results for cobalt content determination are presented. The average result received by the analyzer differs from the average result for the same samples in chemical laboratory: - for Co – 0.023% abs. (2.695% rel.); - for Fe – 0.642% abs. (6.766% rel.); - for Cu – 0.091% abs. (6.058% rel.) Statistical parameters (the detection limit, statistical accuracy and sensitivity) for the elements of interest have been calculated using the acquired spectra. All three statistical parameter values for iron (Fe) and copper (Cu) are presented in the Table 2.
5. Online Analysis of Vanadium Slag
Vanadium content in this slag is to be measured before recycling of vanadium containing residues. Knowledge of the slag composition will help optimize the metal recovery. The online XRF analyzer is installed on the simplest suspension attached to the structure by a conveyor (Figure 14.) Distance between the slag and the analyzer is 50 mm (variable between 30 and 70 mm). Conveyor speed is 0.4 m/sec. Measurement time – 300 sec.
An example of the XRF spectra of the vanadium slag samples is shown on Figure 15. (overview) and Figure 16 (zoom into low-intensity lines). Some of the chemical elements giving rise to the spectral lines are indicated. The Ar line originates in the air between the analyzer and the sample.
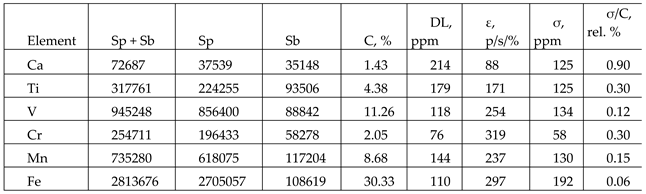
Statistical analysis of this spectrum is given in Table 3. These data show that in five-minute measurements the online analyzer is able to quantify amount of Ca, Ti, V, Cr, Mn, and Fe in the vanadium slag samples. We have calculated the following statistical parameters for these elements: the detection limit, statistical accuracy and sensitivity.
We have calculated the following statistical parameters for these elements [21]: Sp and Sb are numbers of photons detected in the spectral line and its background; C is the concentration of the corresponding element; DL-detection limit; ε - sensitivity of measurements; σ - statistical accuracy.
The standard deviation of the data measured over 180 sec is 0.09% with repeatability of measurements (n=33), which meets the Customer’s requirements. The study indicates that V content can be determined in vanadium slag flow directly above a conveyor belt with an accuracy of not worse than 2% relative (respectively, 0.2% V absolute). The amount of some other elements (Ca, Ti, Cr, Mn, Fe) may also be determined on-line. Relative statistical accuracies of their determination are estimated in Table 3.
4. Conclusions
Despite the many fundamental problems and technological limitations in the online XRF method, which hinder its wider implementation, its use in the technological processes of mining enterprises continues to grow. As the results of this paper show, the online XRF method allows to solve rather non-standard problems of controlling the content of elements in materials (lump, ore, change feed, cake, slag) on conveyors of mining and reprocessing enterprises. This conclusion is supported by the results of applying the online XRF method for impurities analysis of quartz sand on the conveyor belts of sand industry enterprises [24].
6. Discussion
The results of this study demonstrate the feasibility of online element concentration monitoring using X-ray fluorescence (XRF) in geological materials in various states: lump, ore, charge feed, cake, and slag materials.
The analyzer calibration procedures for specific applications are well-established. Measurement results in specific applications are in good agreement with control measurements in industrial chemical laboratories. Further research and development should be aimed at enabling the detection of light elements in geological ores.
Author Contributions
Conceptualization, Writing, Original draft preparation. V. Gostilo; Methodology & Validation; A. Sokolov; Software, Formal analysis & Data curation; U. Miranda Ordonez; Investigation & Visualisation; V. Kuzmovs.
Funding
This research received no external funding.
Conflicts of Interest
The authors declare no conflicts of interest.
Abbreviations
The following abbreviations are used in this manuscript:
| XRF | X-ray fluorescence |
| IORM | Iron-Ore Mixture |
| APCS | Automated Process Control System |
References
- Whiten, B. CALCULATION OF MINERAL COMPOSITION FROM CHEMICAL ASSAYS. Miner. Process. Extr. Met. Rev. 2007, 29, 83–97. [Google Scholar] [CrossRef]
- 2007, *!!! REPLACE !!!*; Vol.29, pp. 2007; Vol.29, pp. 83-97.
- Coomber, D. Radiochemical Methods in Analysis. Springer, 1975.
- Gandhi, S.M. , Sarkar, B.C. Essentials of Mineral Exploration and Evaluation, Elsevier, 2016.
- Volkov, A.I. , Alov, N.V. Automated systems for determining the chemical composition of bulk and lump materials on a conveyor (overview). Problems of Ferrous Metallurgy and Material Science, 2011, No. 2, 75-88 (Rus).
- Beckhoff, B. , Kanngießer, B. Langhoff, N., Wedell, R., Wolff, H. Handbook of Practical X-Ray Fluorescence Analysis. Springer, 2006.
- Molnar, G. Handbook of Prompt Gamma Activation Analysis. Springer, 2004.
- X-Ray Spectrometry: Recent Technological Advances, edited by Tsuji, K., Injuk, J., van Grieken, R. John Wiley & Sons Ltd., 2004. XPRT. XRF Analyzer Suppliers & Manufacturers. Available on-line: https://www.environmental-expert.com/companies/keyword-xrf-analyzer-67312 (Accessed on 30.09. 2025.
- Metso (2023). Courier 5X /6X SL online analyzers. Reliable automated sampling and analysis. [Brochure]. Available on-line: https://www.metso.com/portfolio/courier-5x6x-sl-analyzer/ (Accessed on 30.09. 2025.
- XORE (2016). Maximum profitability with world class analyses. [Brochure]. Available on-line: https://www.xore.se/wp-content/uploads/2016/11/Xore_broschyr_v1_eng_us_lowres.pdf (Accessed on 30.09. 2025.
- Metrohm. Process Analytics. (2024). 2060 XRF Process Analyzer, Reliable x-ray fluorescence analysis for online process control. [Brochure]. Available on-line: https://www.metrohm.com/en_us/products/process-analyzers/2060-xrf-process-analyzer.html (Accessed on 30.09. 2025.
- Malvern Panalytical. (2024). EPSILON XFLOW On-line elemental analysis of liquids, designed for your process. Available on-line: https://www.malvernpanalytical.com/en/products/product-range/epsilon-range/epsilon-xflow (Accessed on 30.09. 2025.
- Bachmann. (2024). FLORIDA - Fluids Online Recognition Identification and Determination Analyzer. Available on-line: https://jcbachmann.com/en/products/florida/ (Accessed on 30.09. 2025.
- Thermofisher Scientific. MSA-330 Multi-Stream Slurry XRF Analyzer. Available on-line: https://www.thermofisher.com/order/catalog/product/19502?SID=srch-srp-19502 (Accessed on 30.09. 2025.
- Olympus. (2024). In-Line XRF Analysis – Vanta iX. Available on-line: https://www.olympus-ims.com/en/xrf-analyzers/process/ (Accessed on 30.09. 2025.
- KINTEK. (2024). In-Line XRF Analyzer. Available on-line: https://kindle-tech.com/products/in-line-xrf-analzyer (Accessed on 30.09. 2025.
- Baltic Scientific Instruments. On-line XRF conveyor analyzer CON-X. Available on-line: http://bsi.lv/en/products/xrf-analyzers/-line-xrf-conveyor-analyzer-con-x/xxxxxx (Accessed on 30.09. 2025.
- InduTech. (2008). OXEA – Online X-ray Elemental Analyzer. [Brochure]. Available on-line: https://indutech.com/downloads/InduTech. OXEA Online Series. Available on-line: https://indutech.com/online-xrf-analyzer-series/ (Accessed on 30.09. 2025.
- Bachmann. (2024). Texas - Total Elemental X-ray Analysis System. Available on-line: https://jcbachmann.com/en/products/texas/ (Accessed on 30.09. 2025.
- Kondratjevs, V.; Landmans, K.; Sokolovs, A.; Gostilo, V. PERFORMANCE IMPROVEMENT OF ON-LINE XRF ANALYSIS OF MINERALS ON A CONVEYOR BELT. J. Min. Sci. 2020, 56, 1061–1066. [Google Scholar] [CrossRef]
- Rousseau, R.M. Detection Limit and Estimate of Uncertainty of Analytical XRF Results. The Rigaku Journal, Vol.18. No 2/2001, pp 33 – 35.
- Barwick, V. (Ed), Eurachem/CITAC Guide: Guide to Quality in Analytical Chemistry: An Aid to Accreditation (3rd ed. 2016). ISBN 978-0-948926-32-7. Available from www.eurachem.org.
- Yakowitz, H.; Myklebust, R. L.; Heinrich, K. F. J. An On-Line Correction Procedure for Quantitative Electron Probe Microanalysis. Institute for Materials Research National Bureau of Standards, Washington, National Bureau of Standards Technical Note. 796, Issued 73. 19 October.
- Sokolov, A. ; Letko,E.; Kuzmovs, V.; Miranda Ordonez, U.; Gostilo, V. On-line XRF Analysis of Industrial Sand Impurities on a Conveyor Belt. Aspects in Mining & Mineral Science (AMMS), 2025, Vol.13, Issue 2, pp. 1576-1586. [CrossRef]
Figure 1.
Drawing of installing an online XRF analyzer on a conveyor belt.
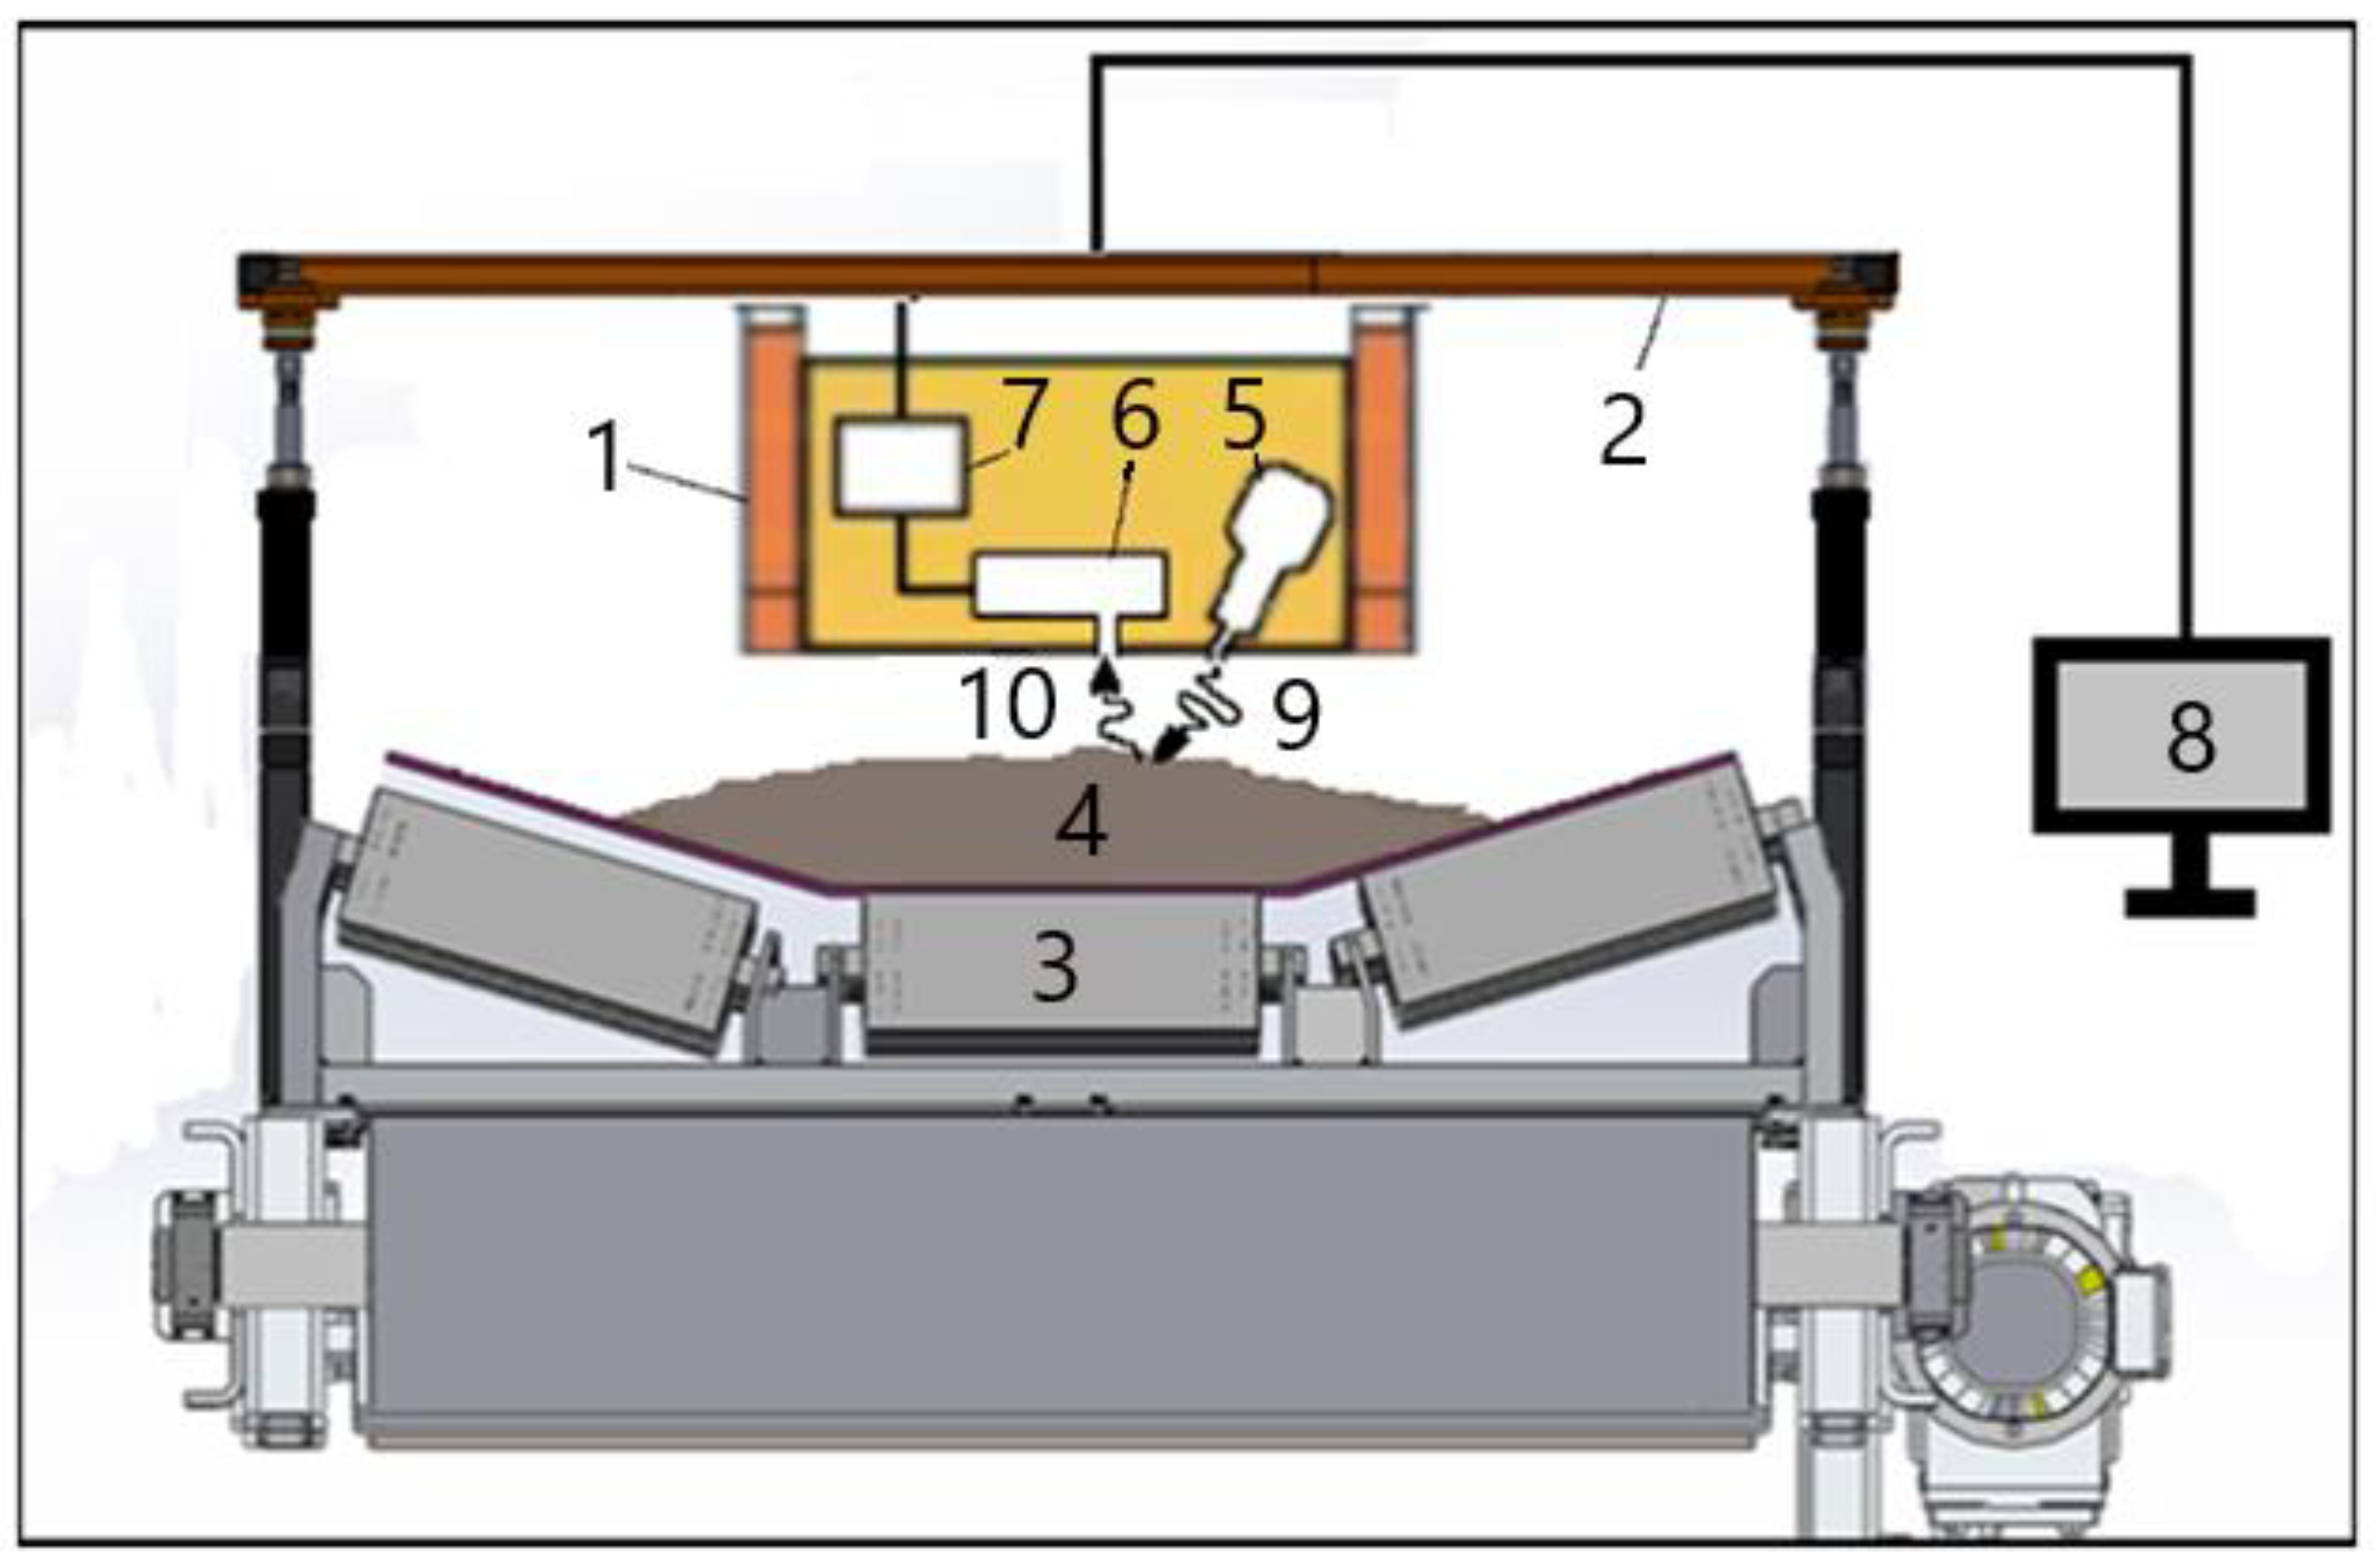
Figure 2.
Example of a typical calibration curve of an XRF analyzer for measuring Ti (application 4.5).
Figure 2.
Example of a typical calibration curve of an XRF analyzer for measuring Ti (application 4.5).
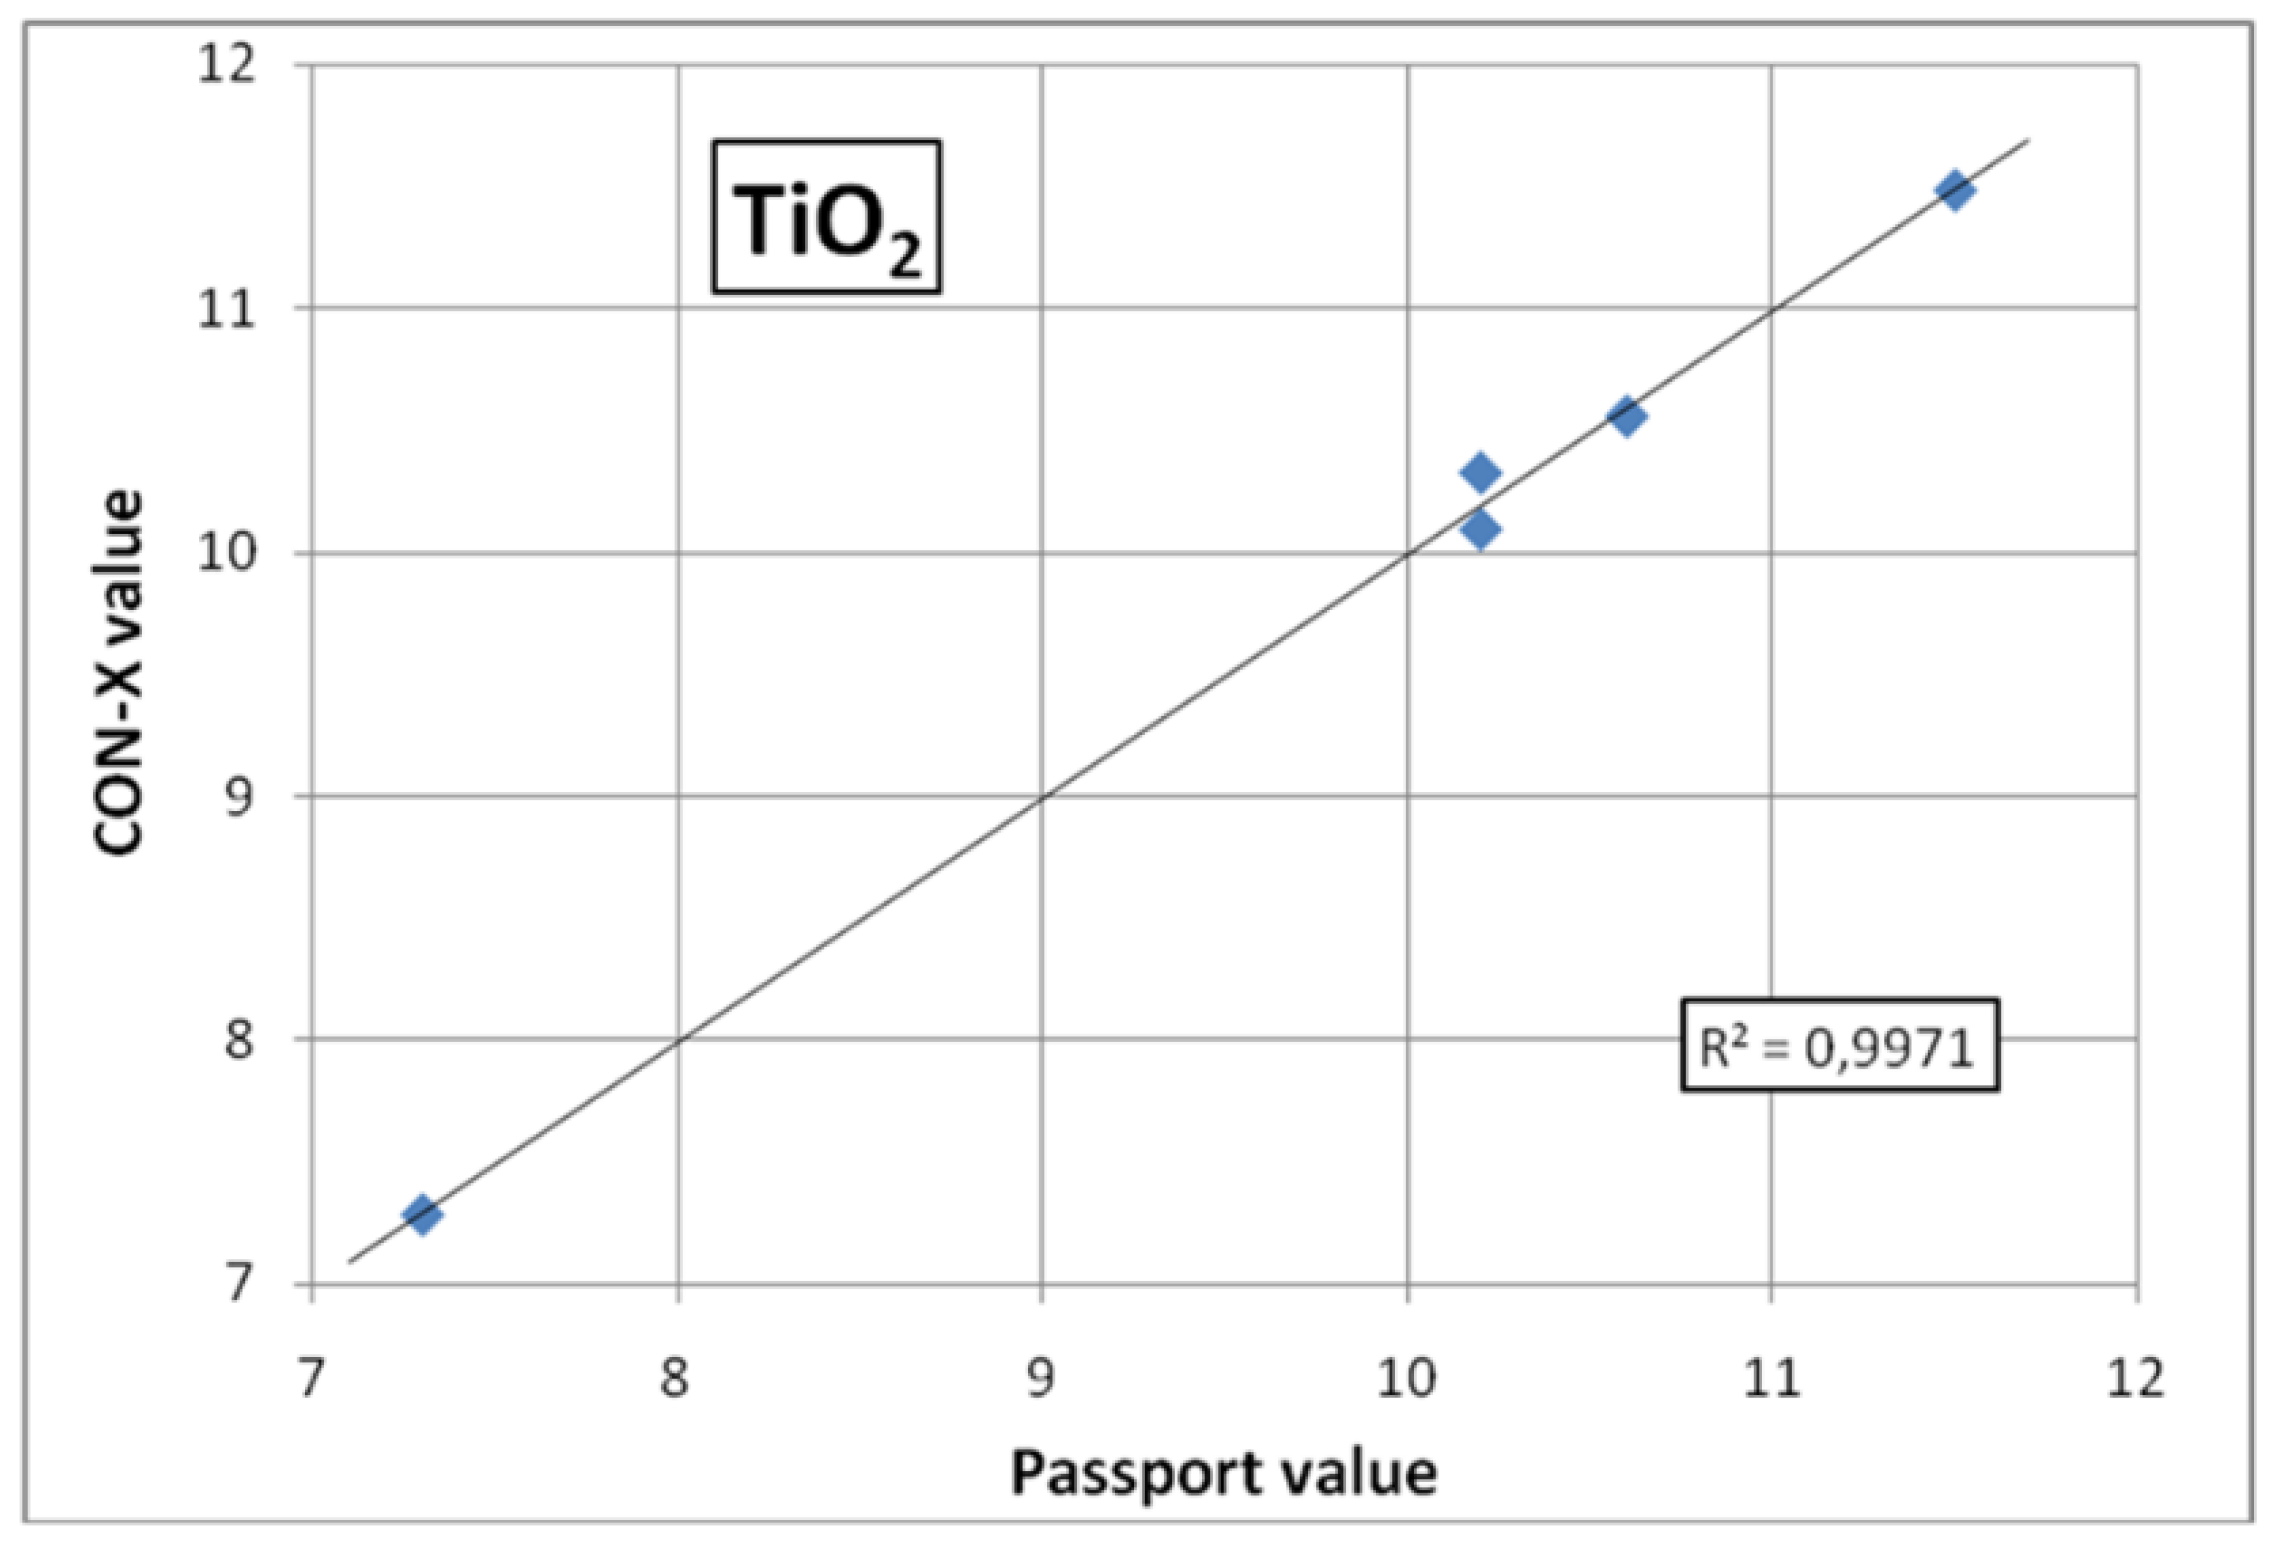
Figure 3.
Online XRF analyzer on a standard suspension on four legs above the conveyor belt.
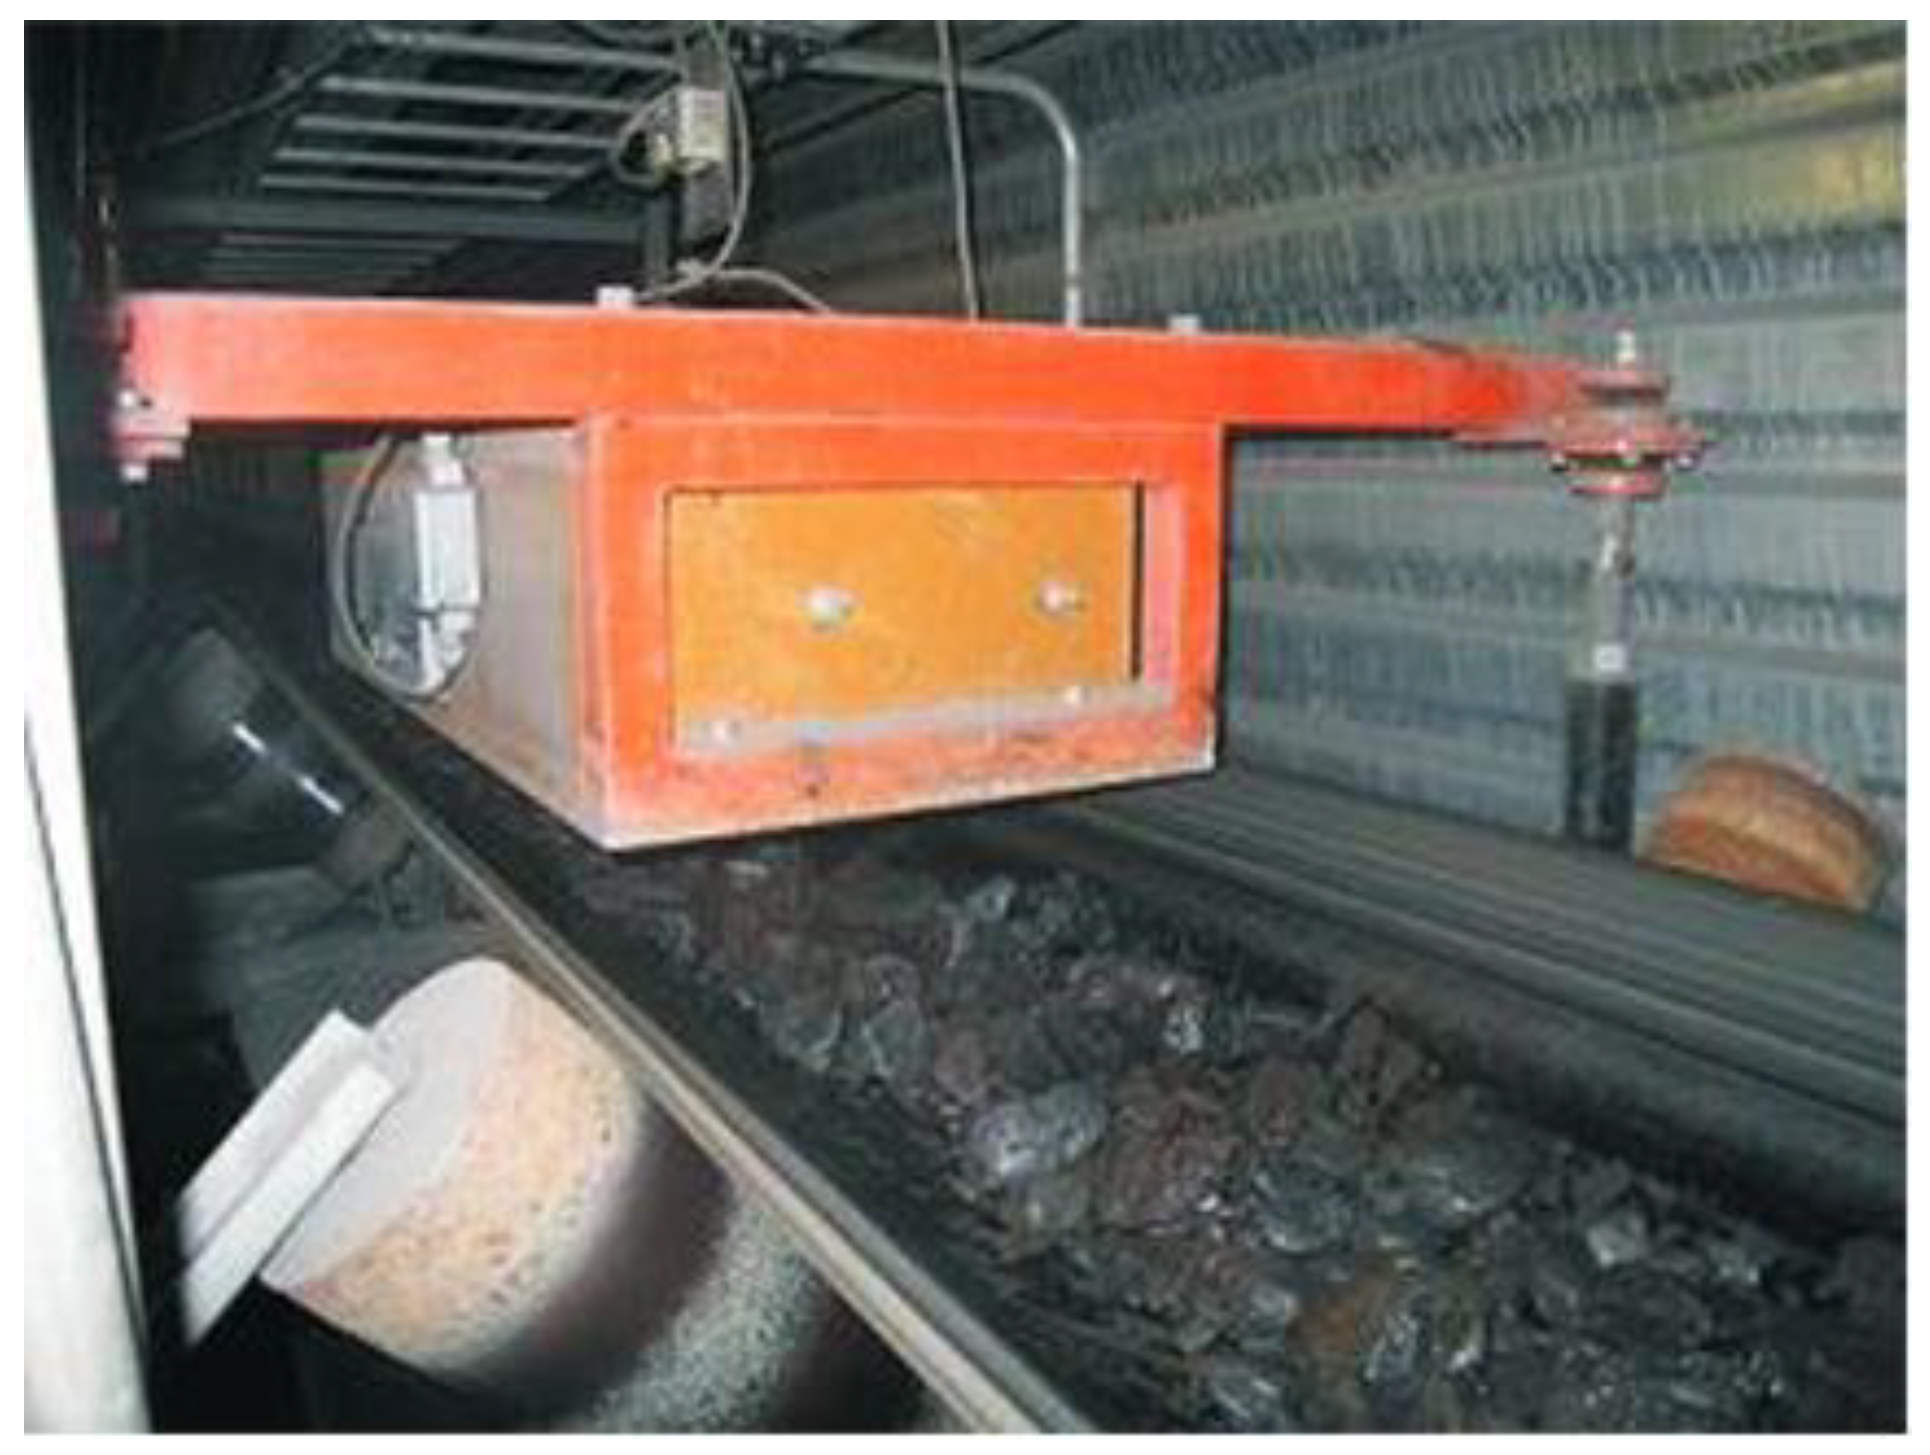
Figure 4.
Spectrum of chromium-iron ore on the conveyor.
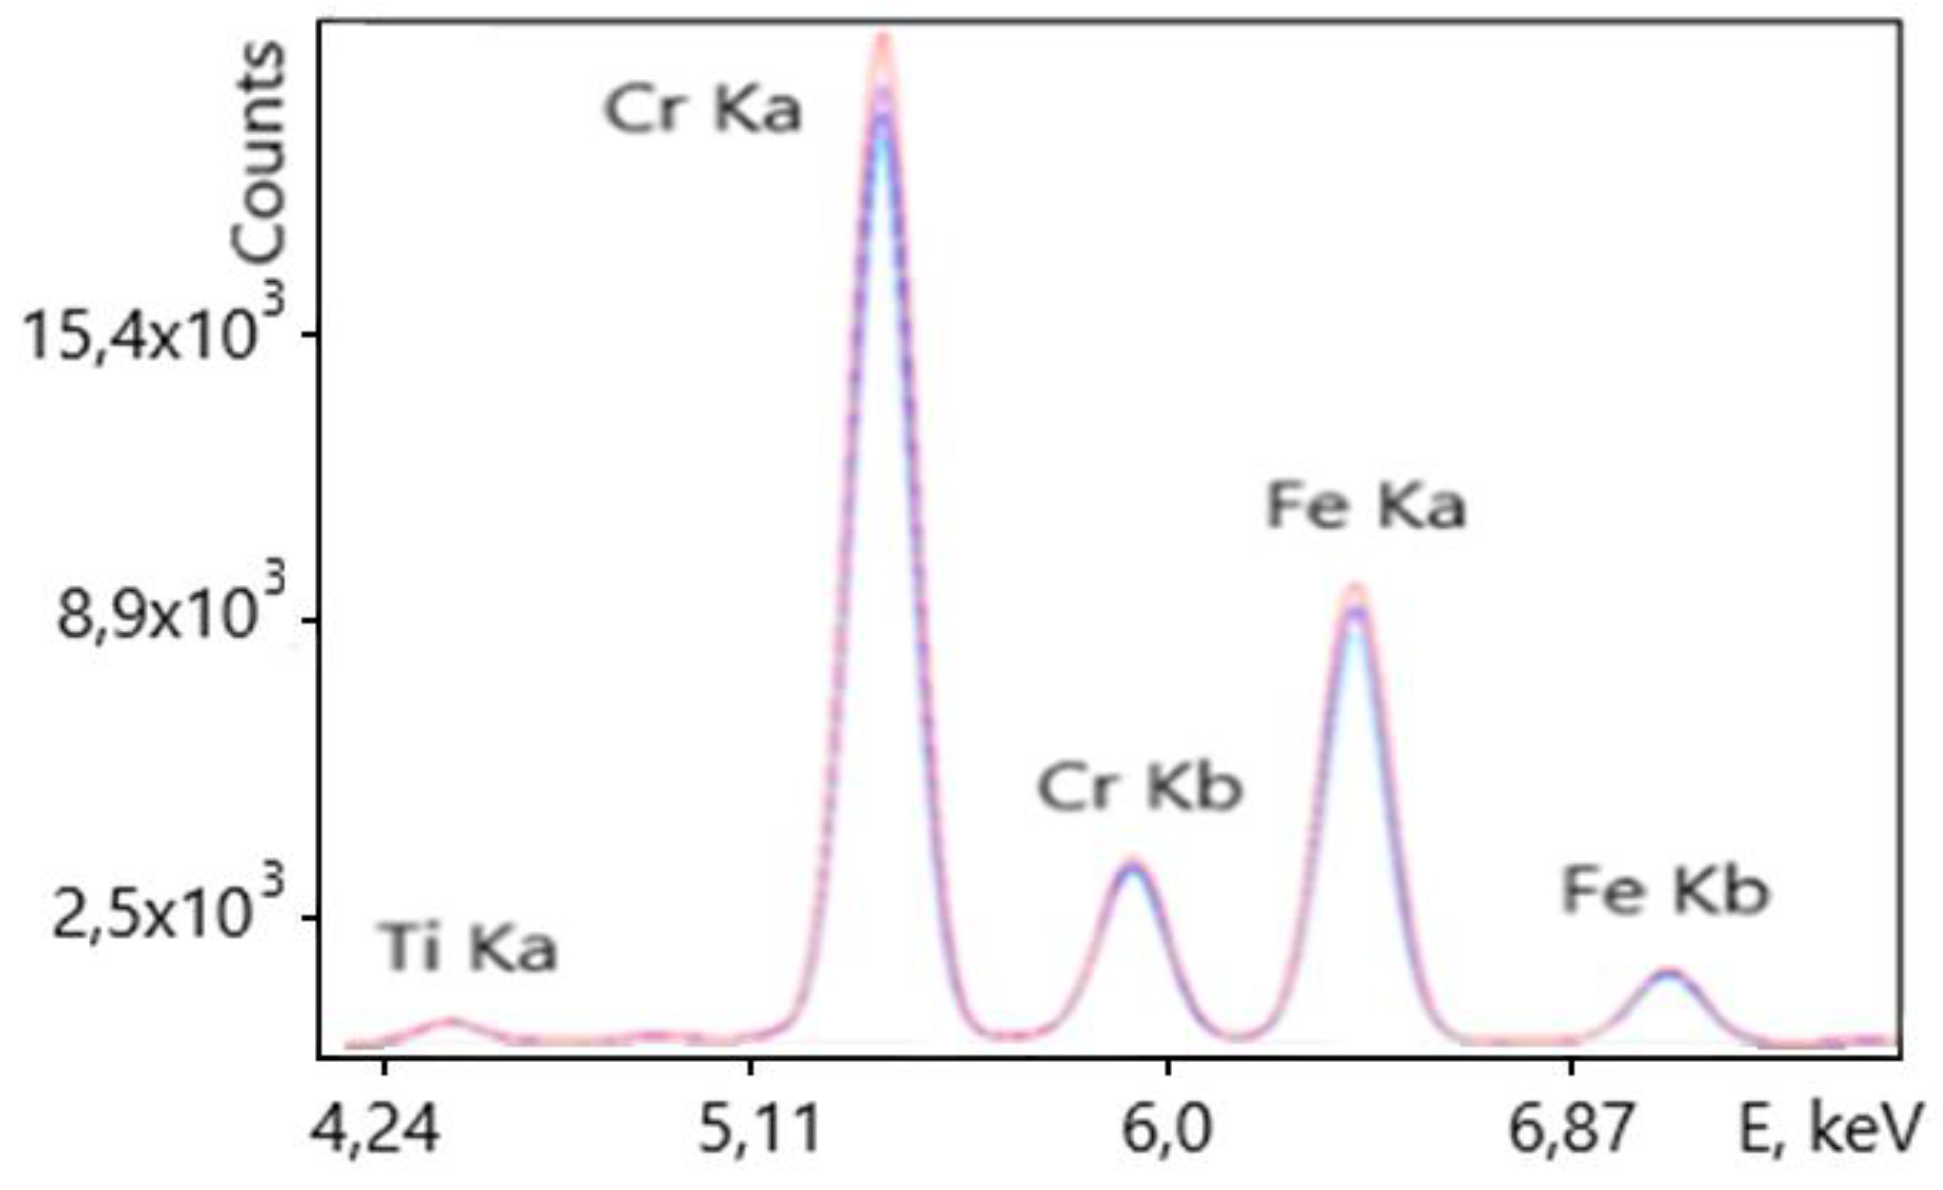
Figure 5.
Comparison of the results of chromium concentration determination by chemical analysis and online measurements.
Figure 5.
Comparison of the results of chromium concentration determination by chemical analysis and online measurements.
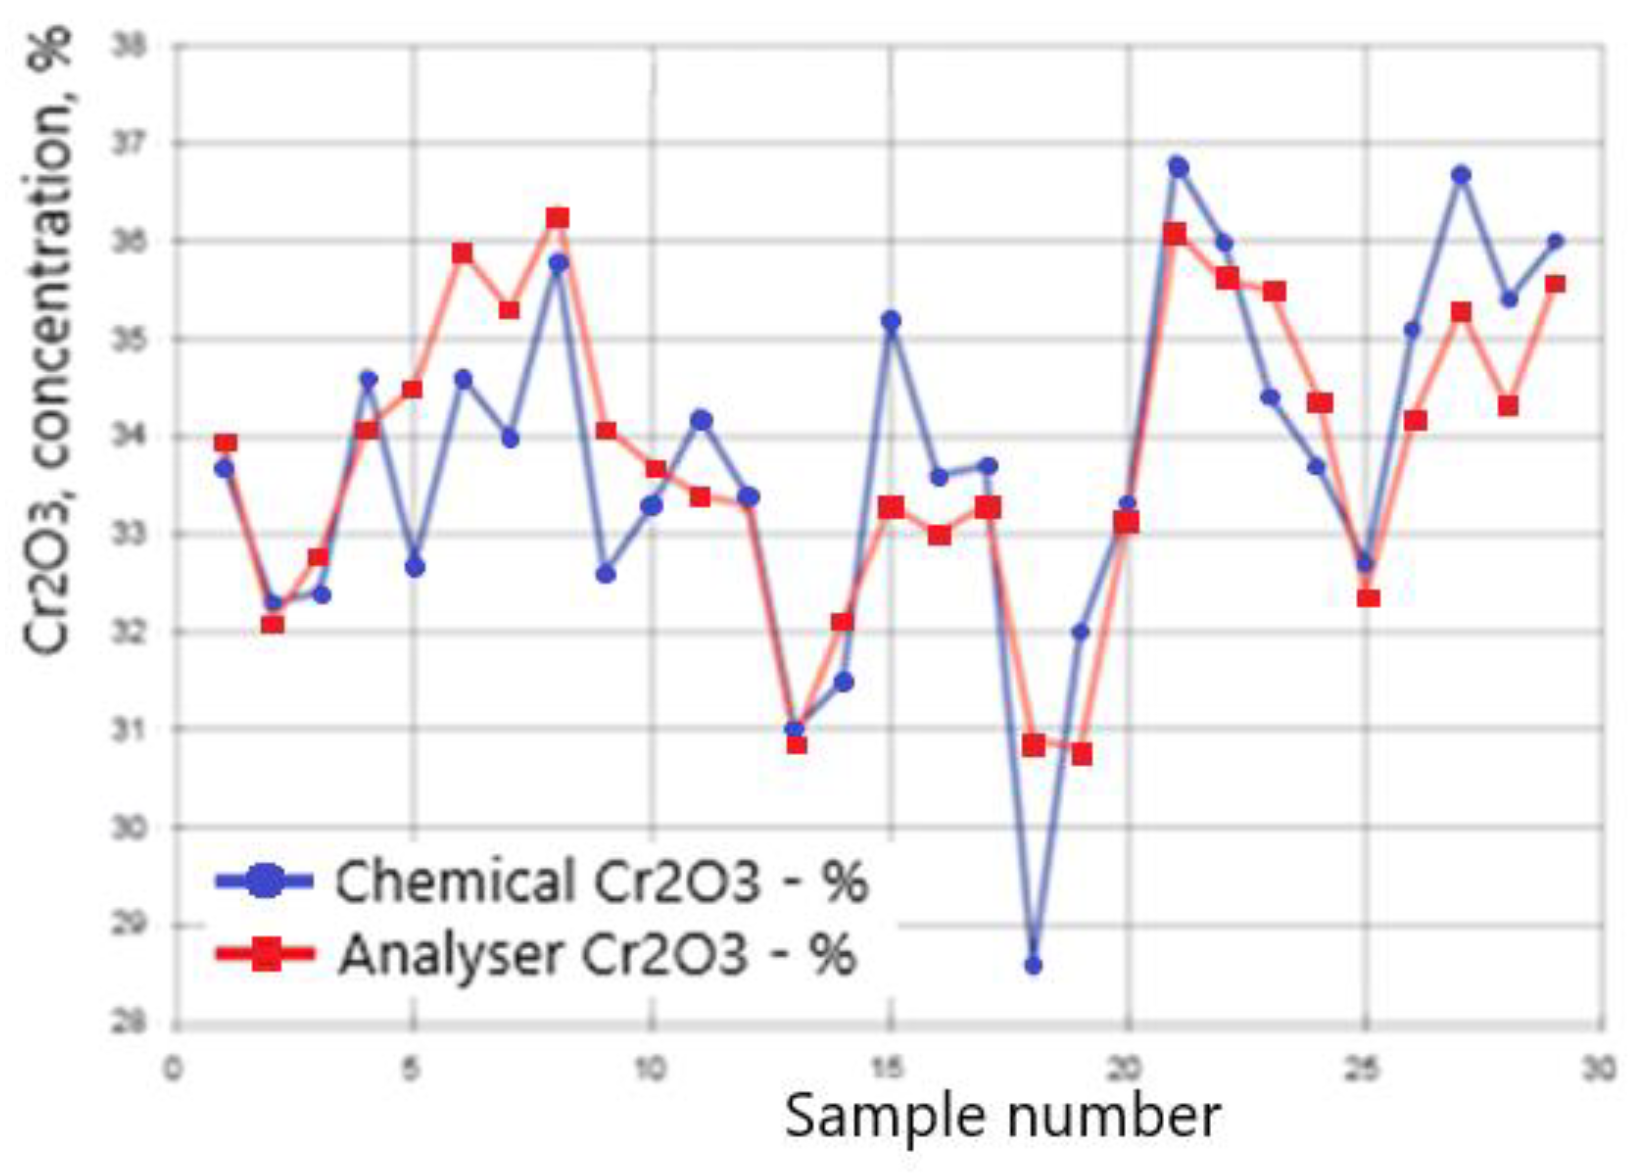
Figure 6.
Online XRF analyzer over the conveyor with lumps of copper-zinc sulfide ore.
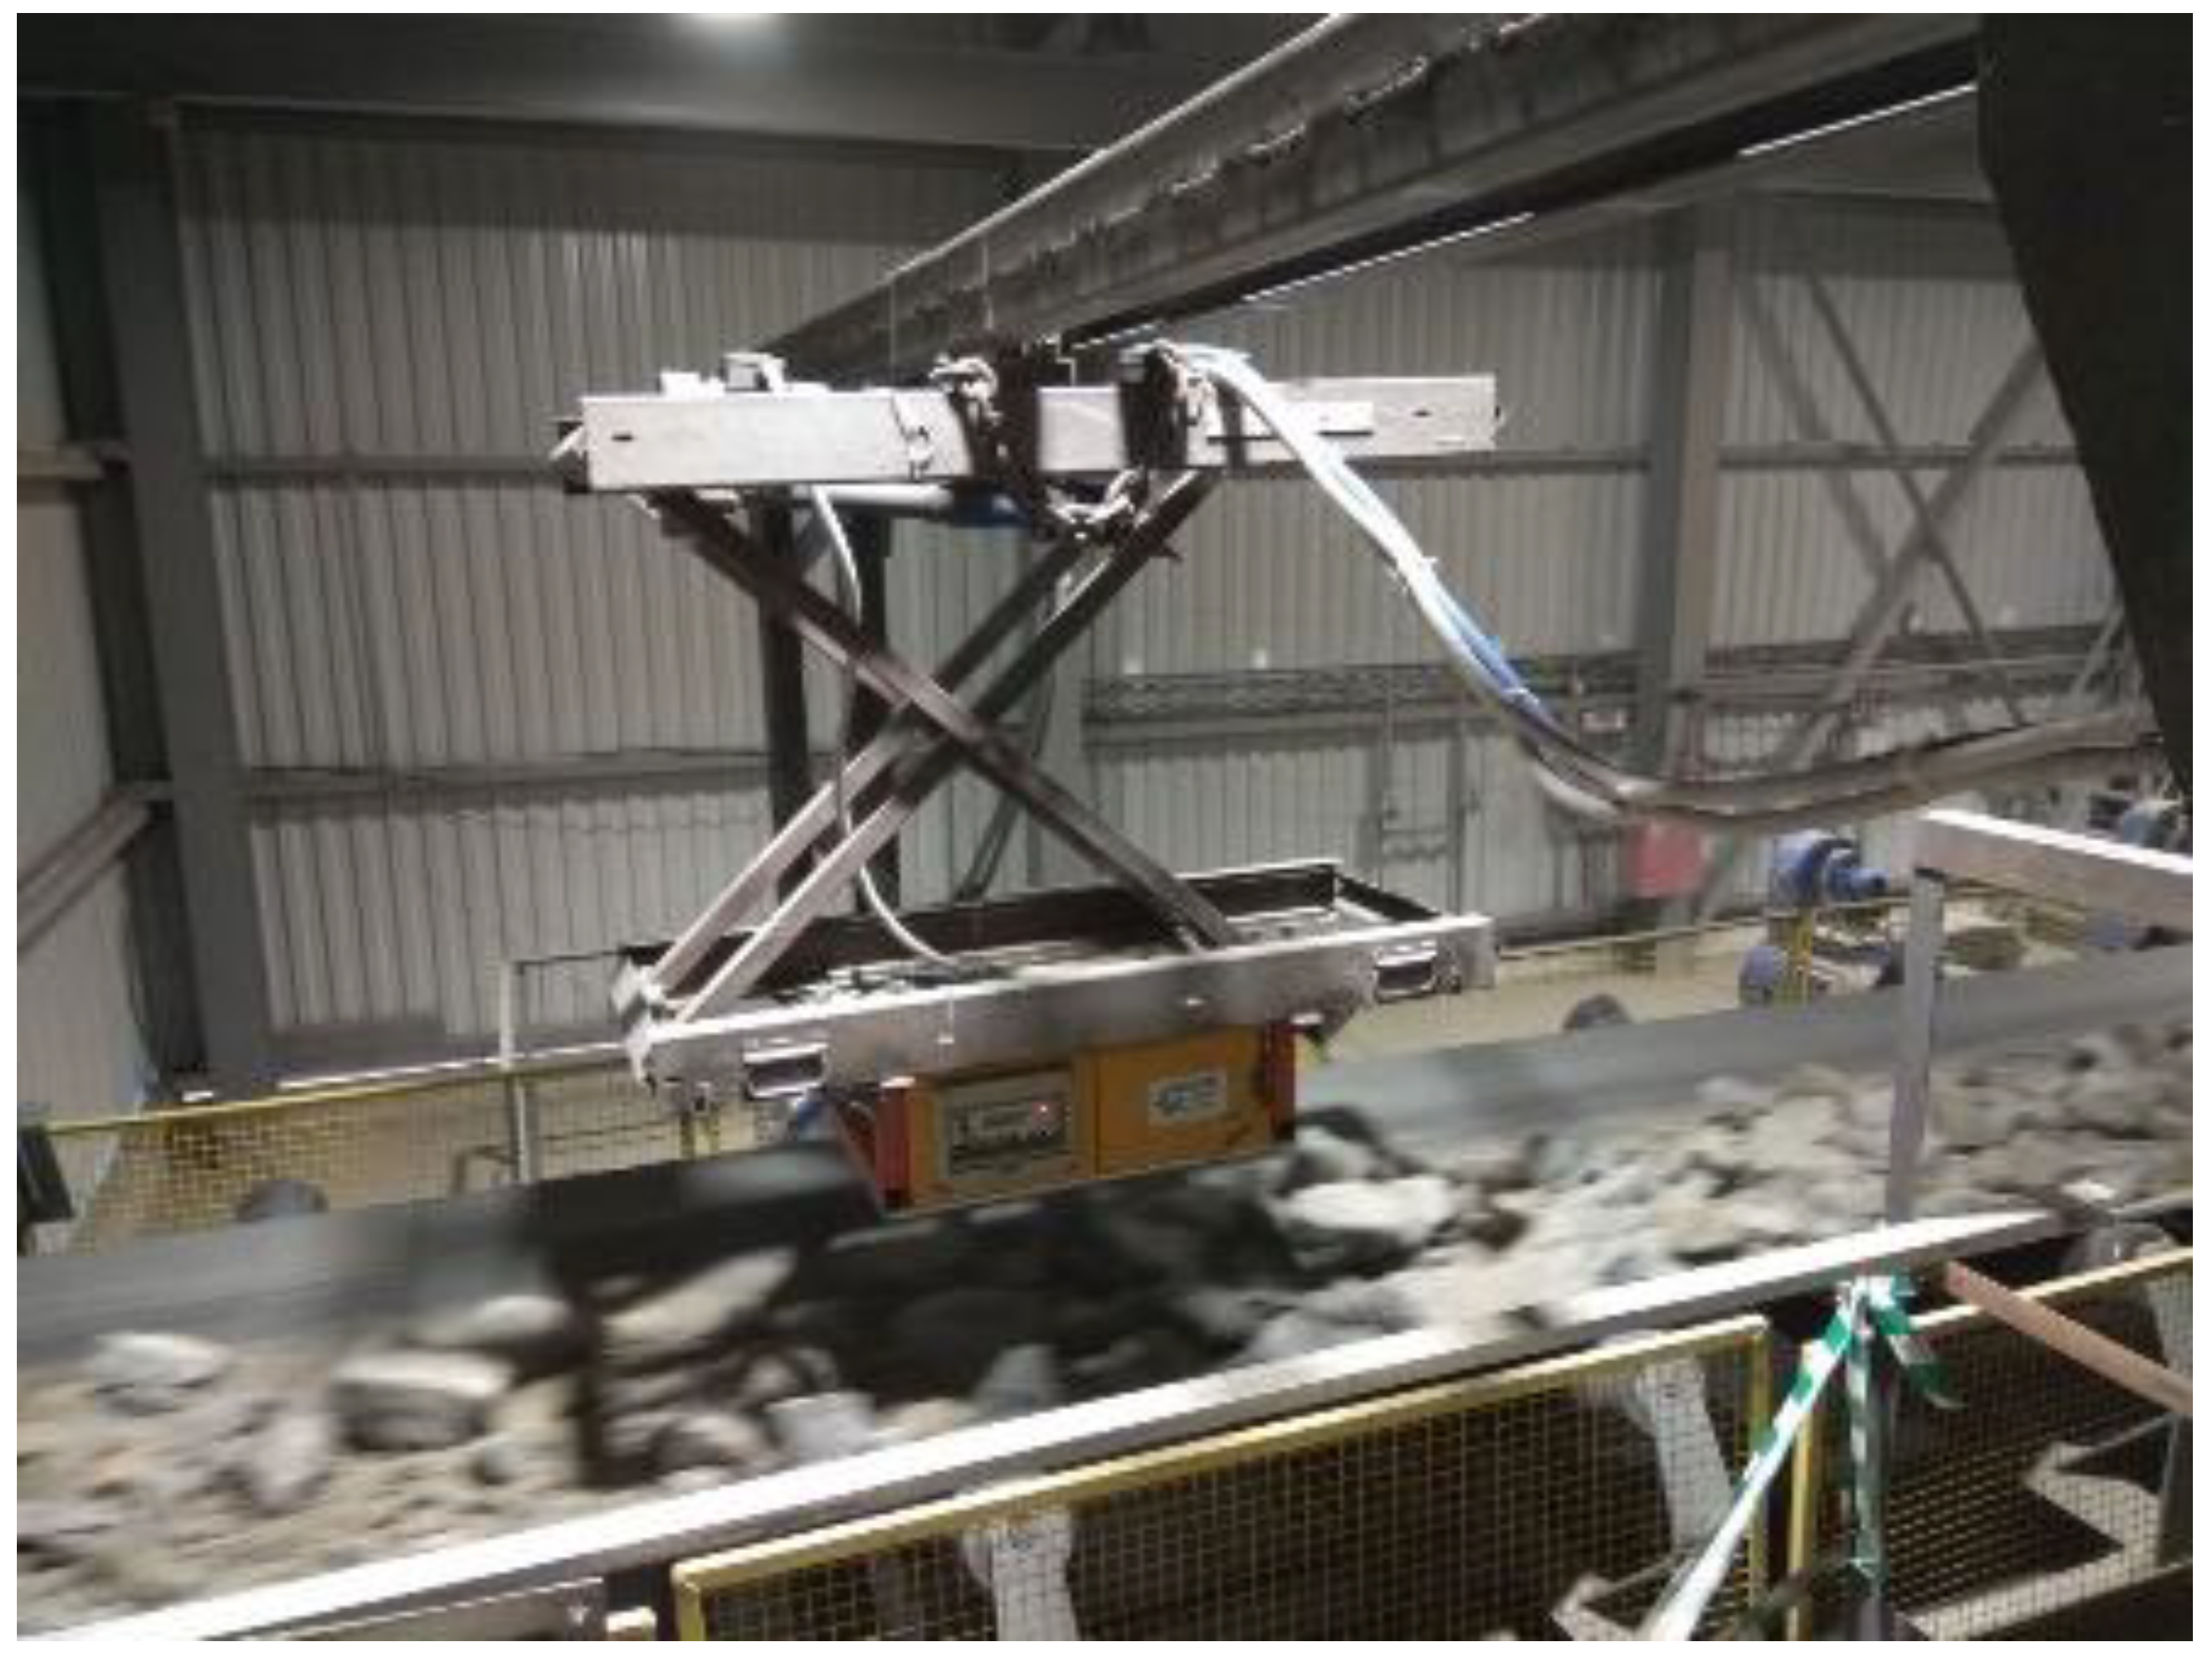
Figure 7.
Spectrum of copper-zinc sulfide ore samples.
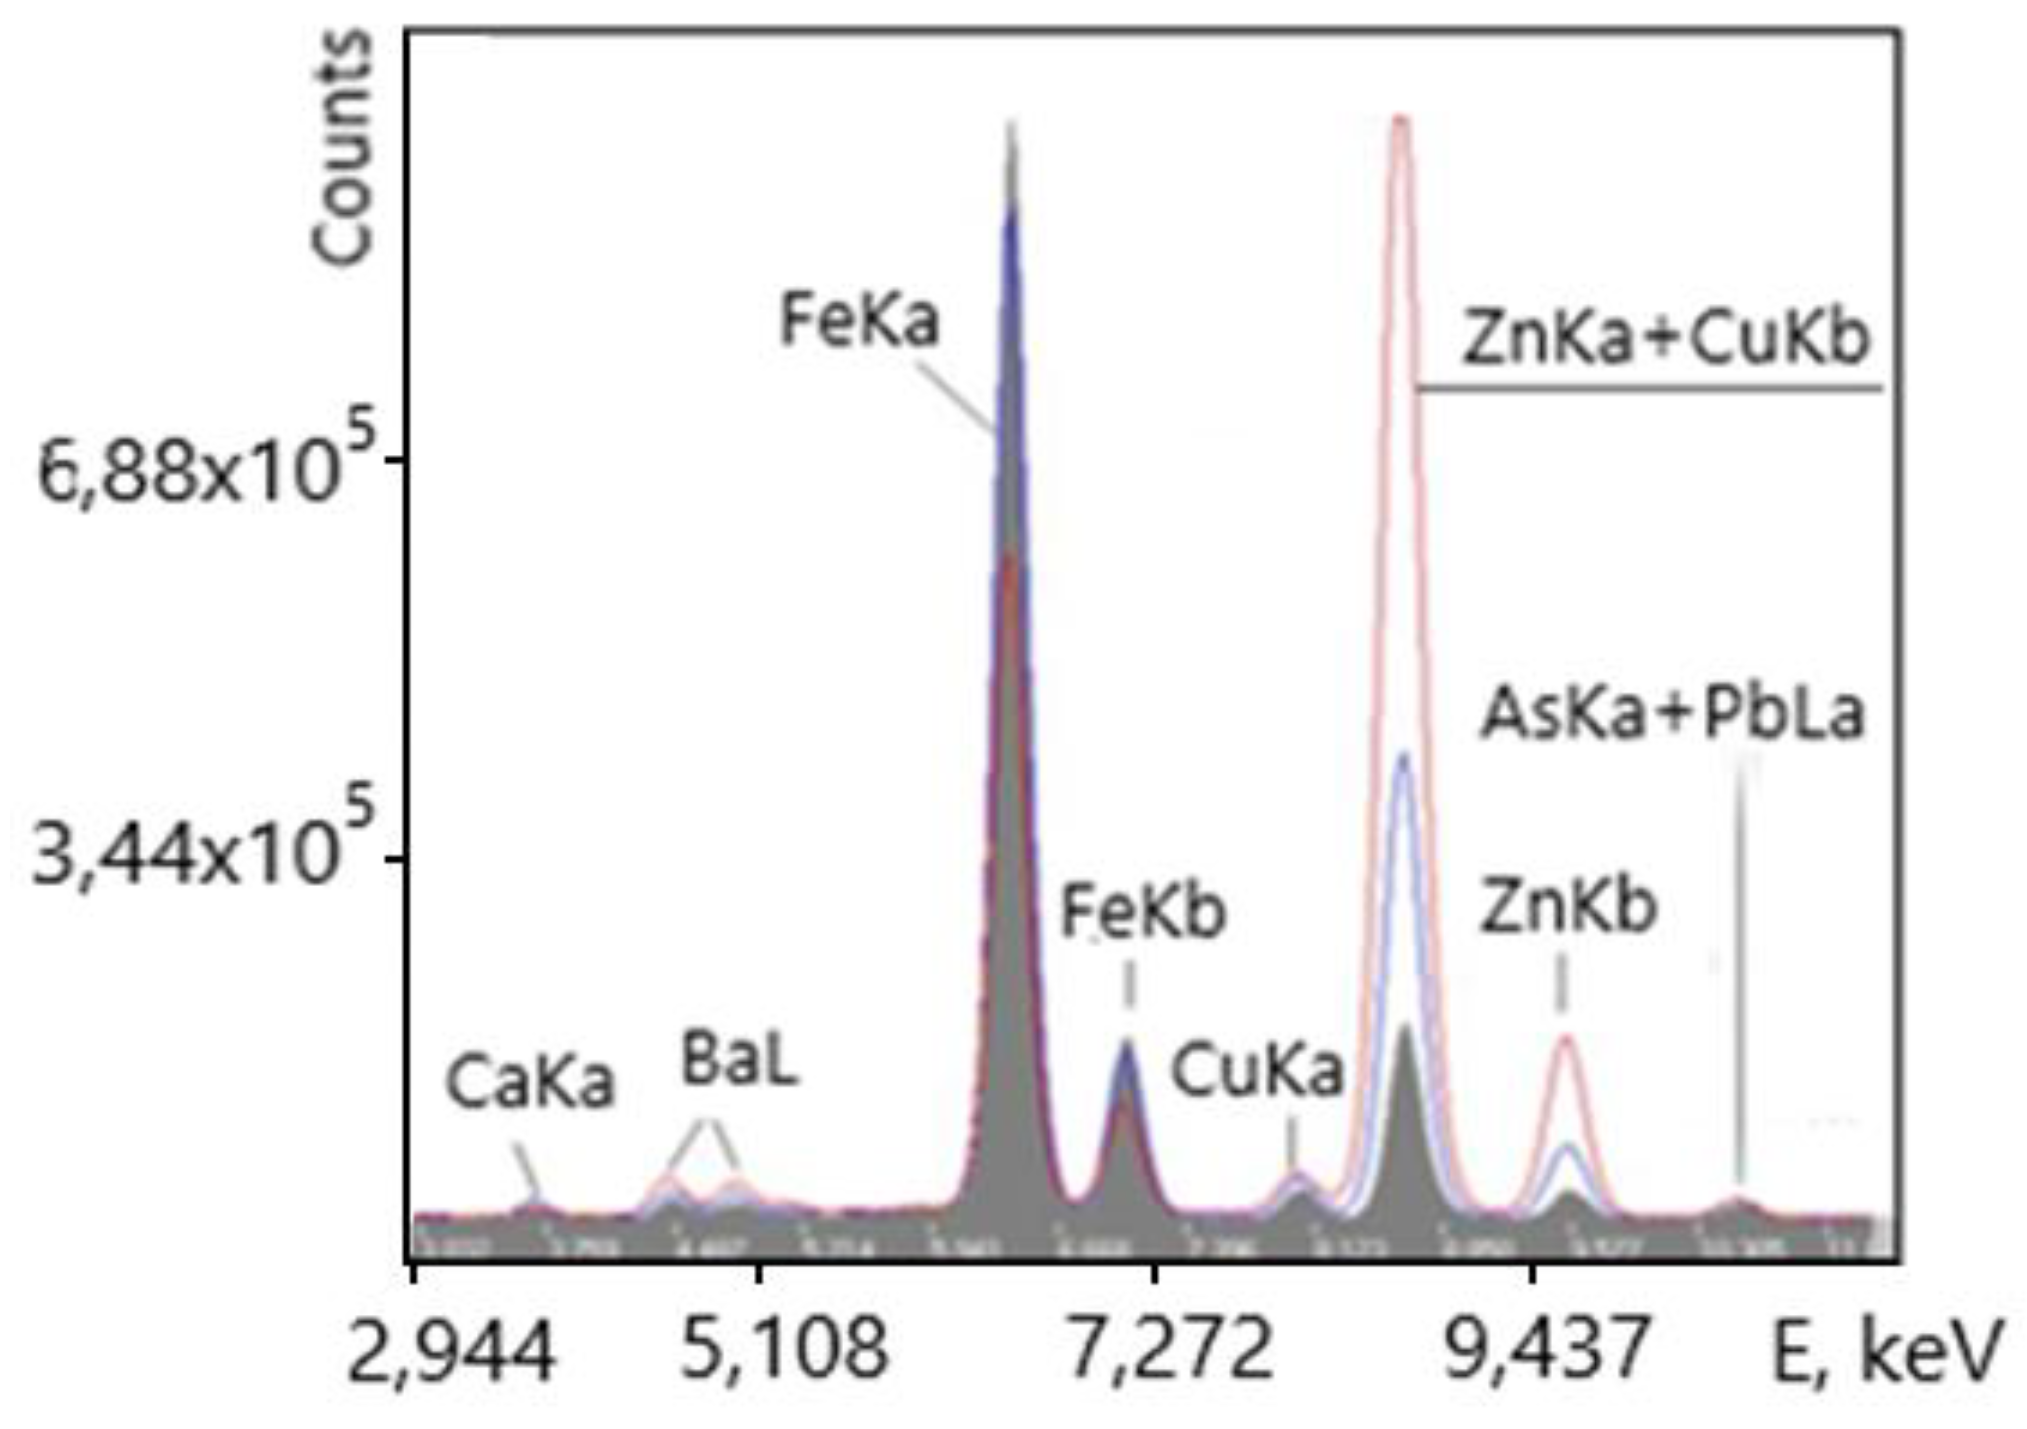
Figure 8.
The copper concentrations results obtained by chemical research and by online XRF measurements.
Figure 8.
The copper concentrations results obtained by chemical research and by online XRF measurements.
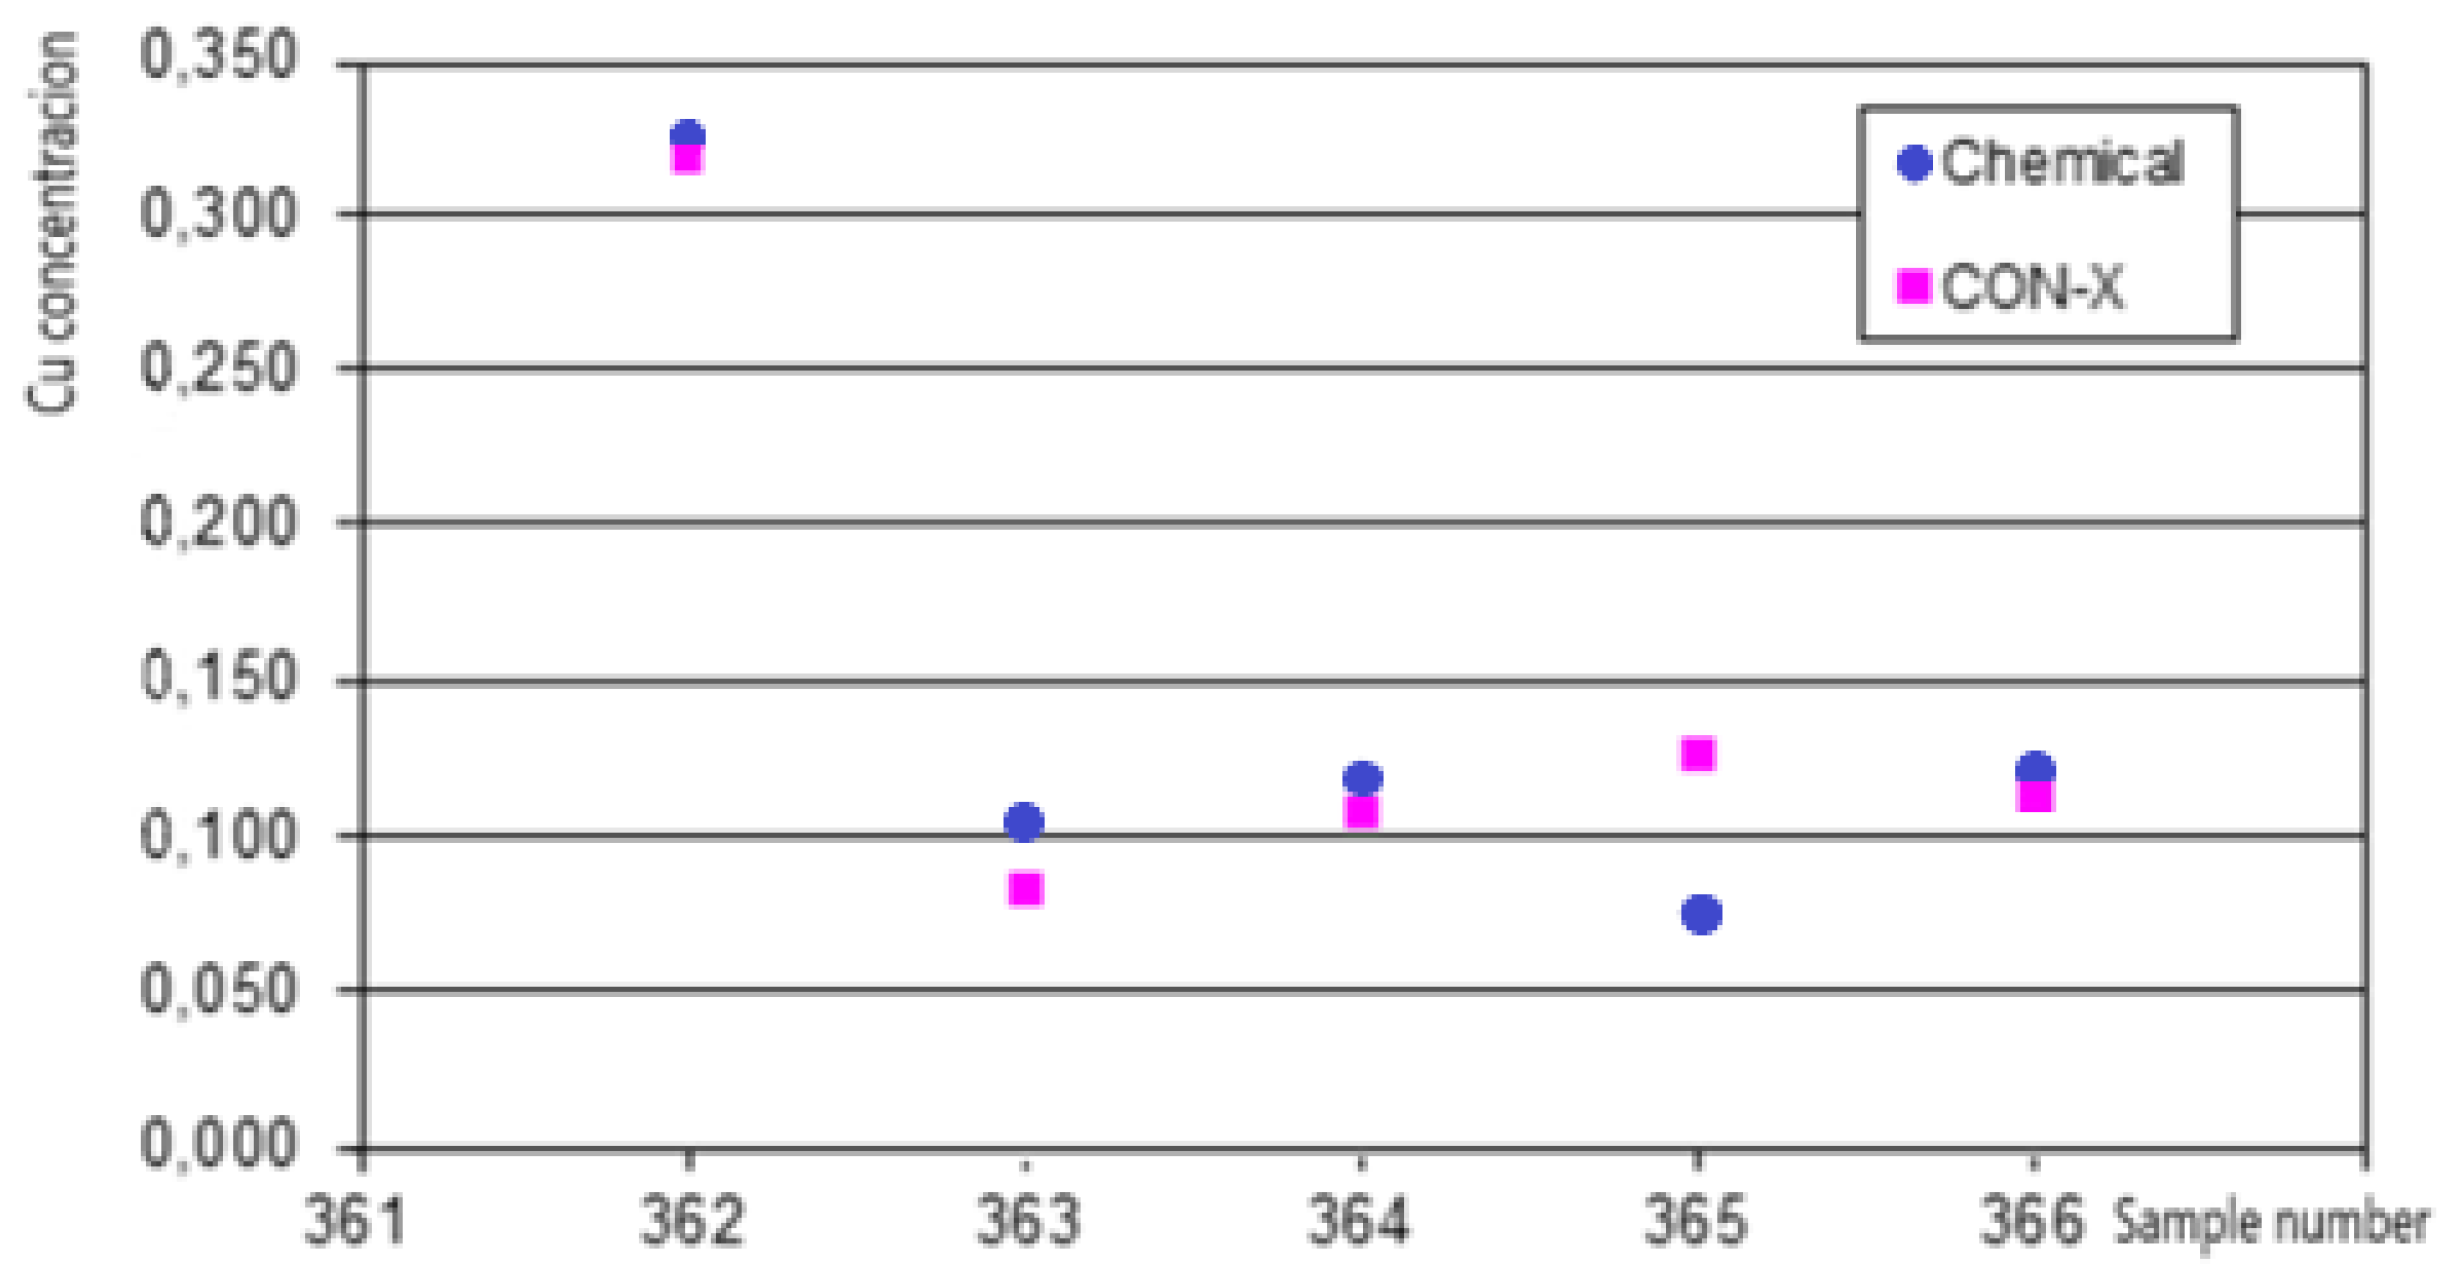
Figure 9.
Online XRF analyzer on an iron-ore mixture conveyor.
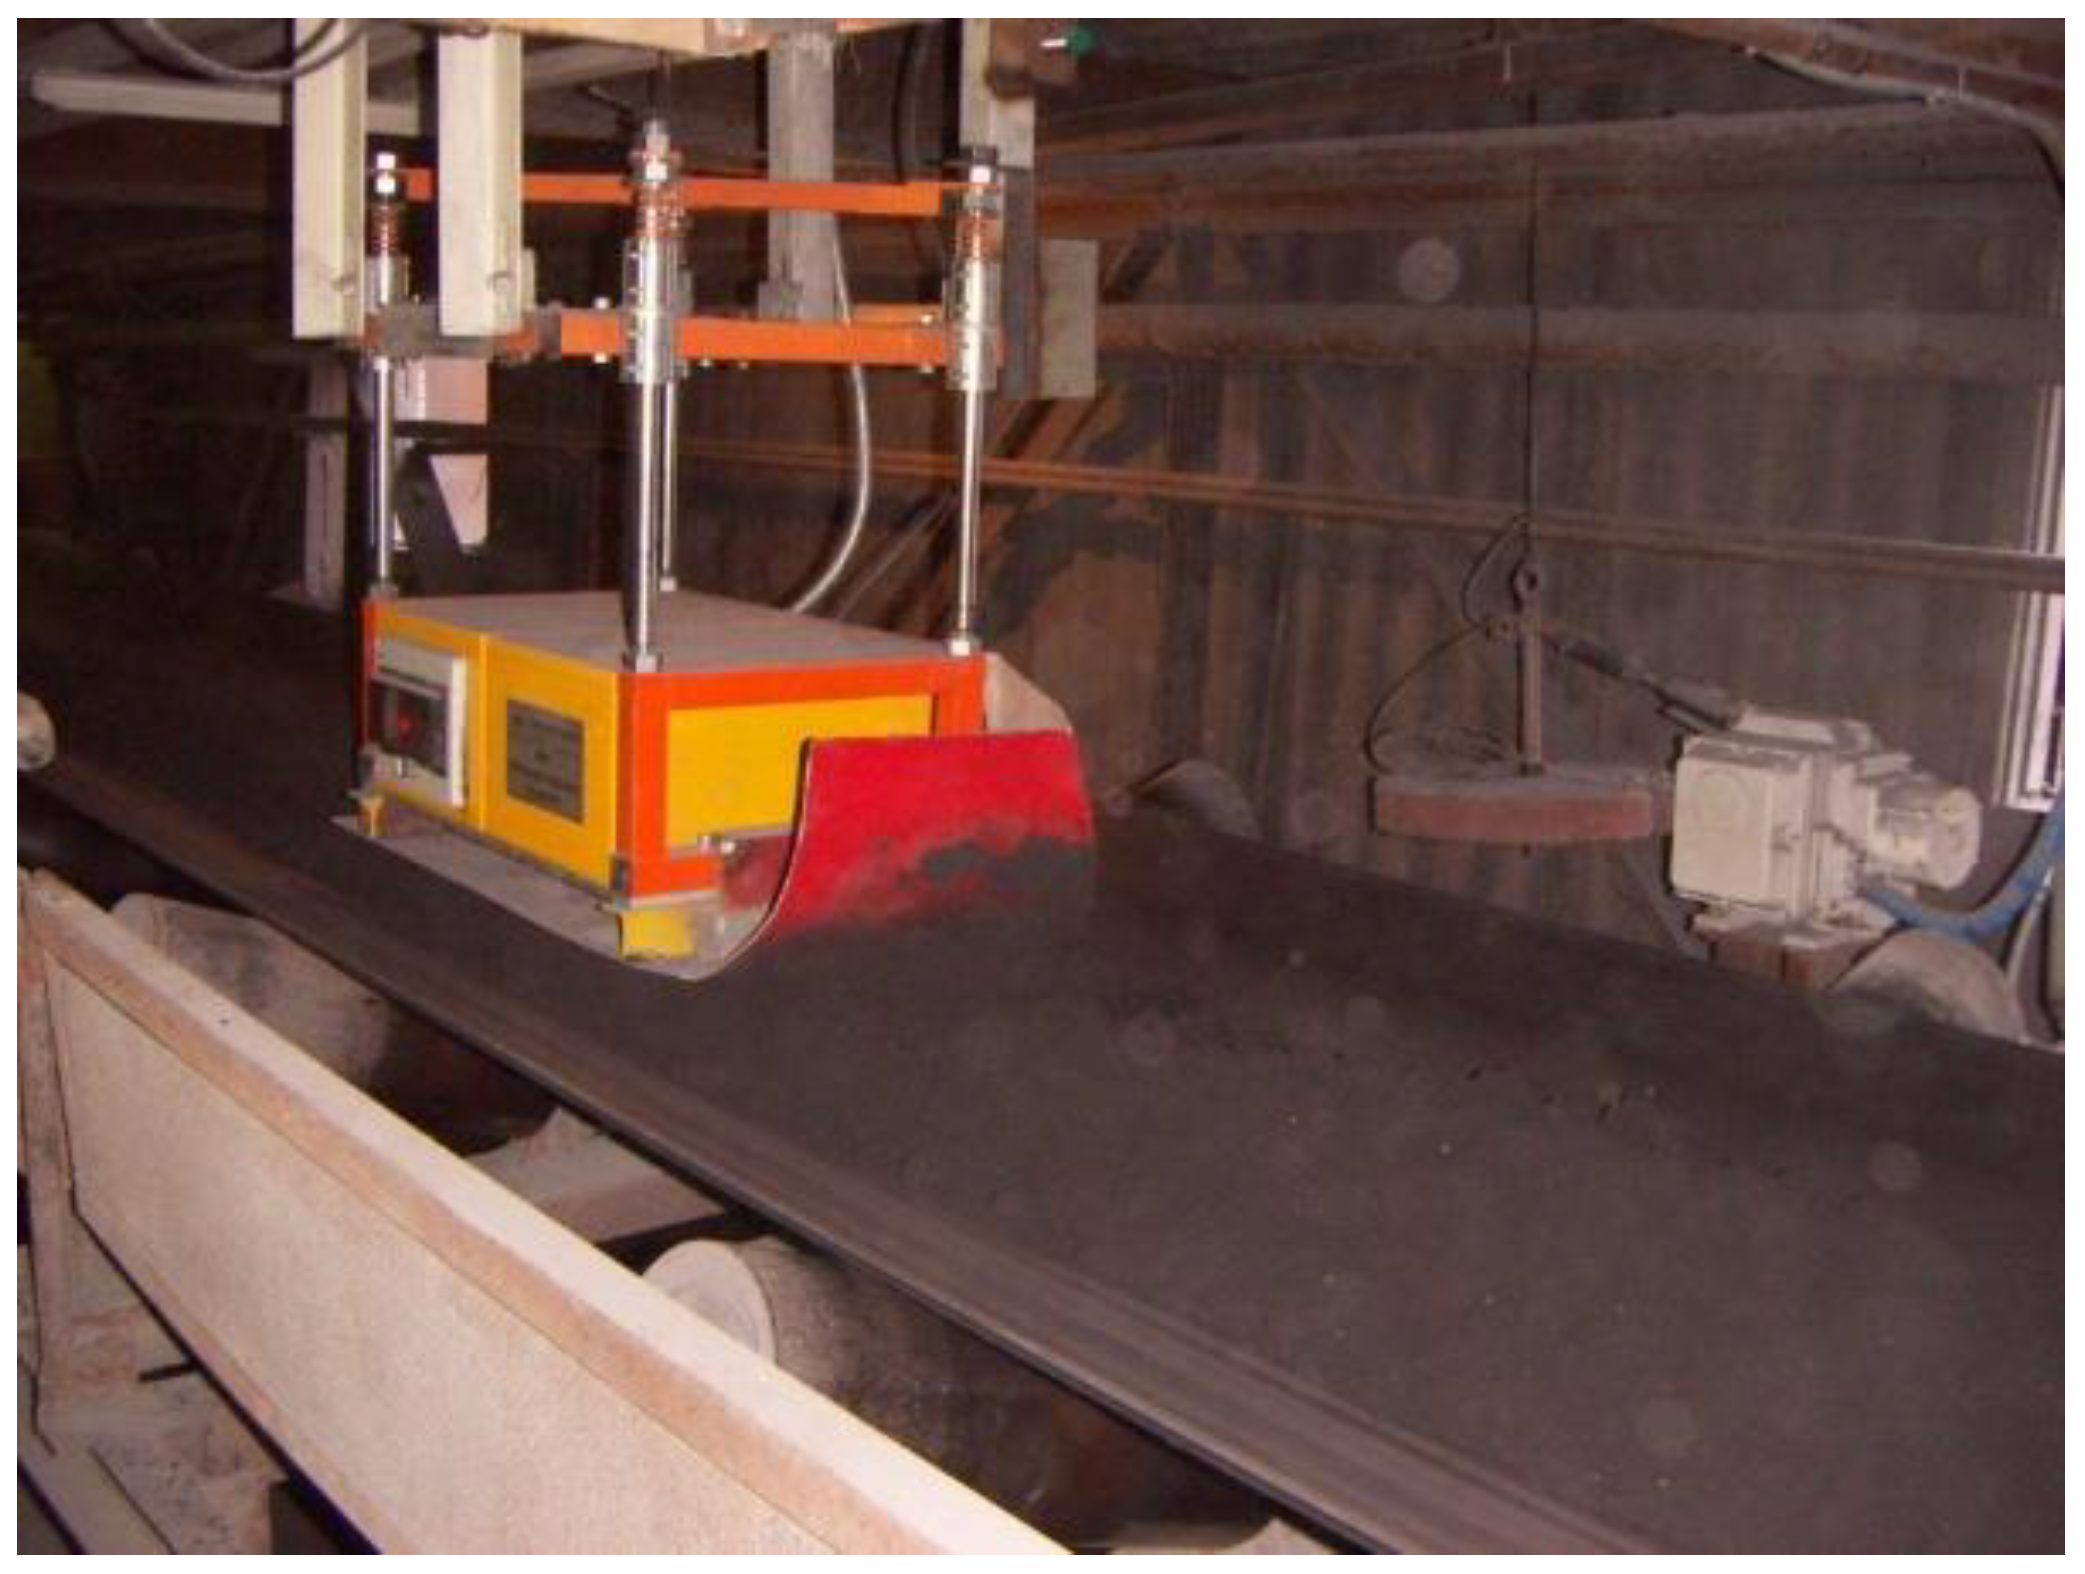
Figure 10.
X-ray fluorescence spectrum of iron-ore mixture.
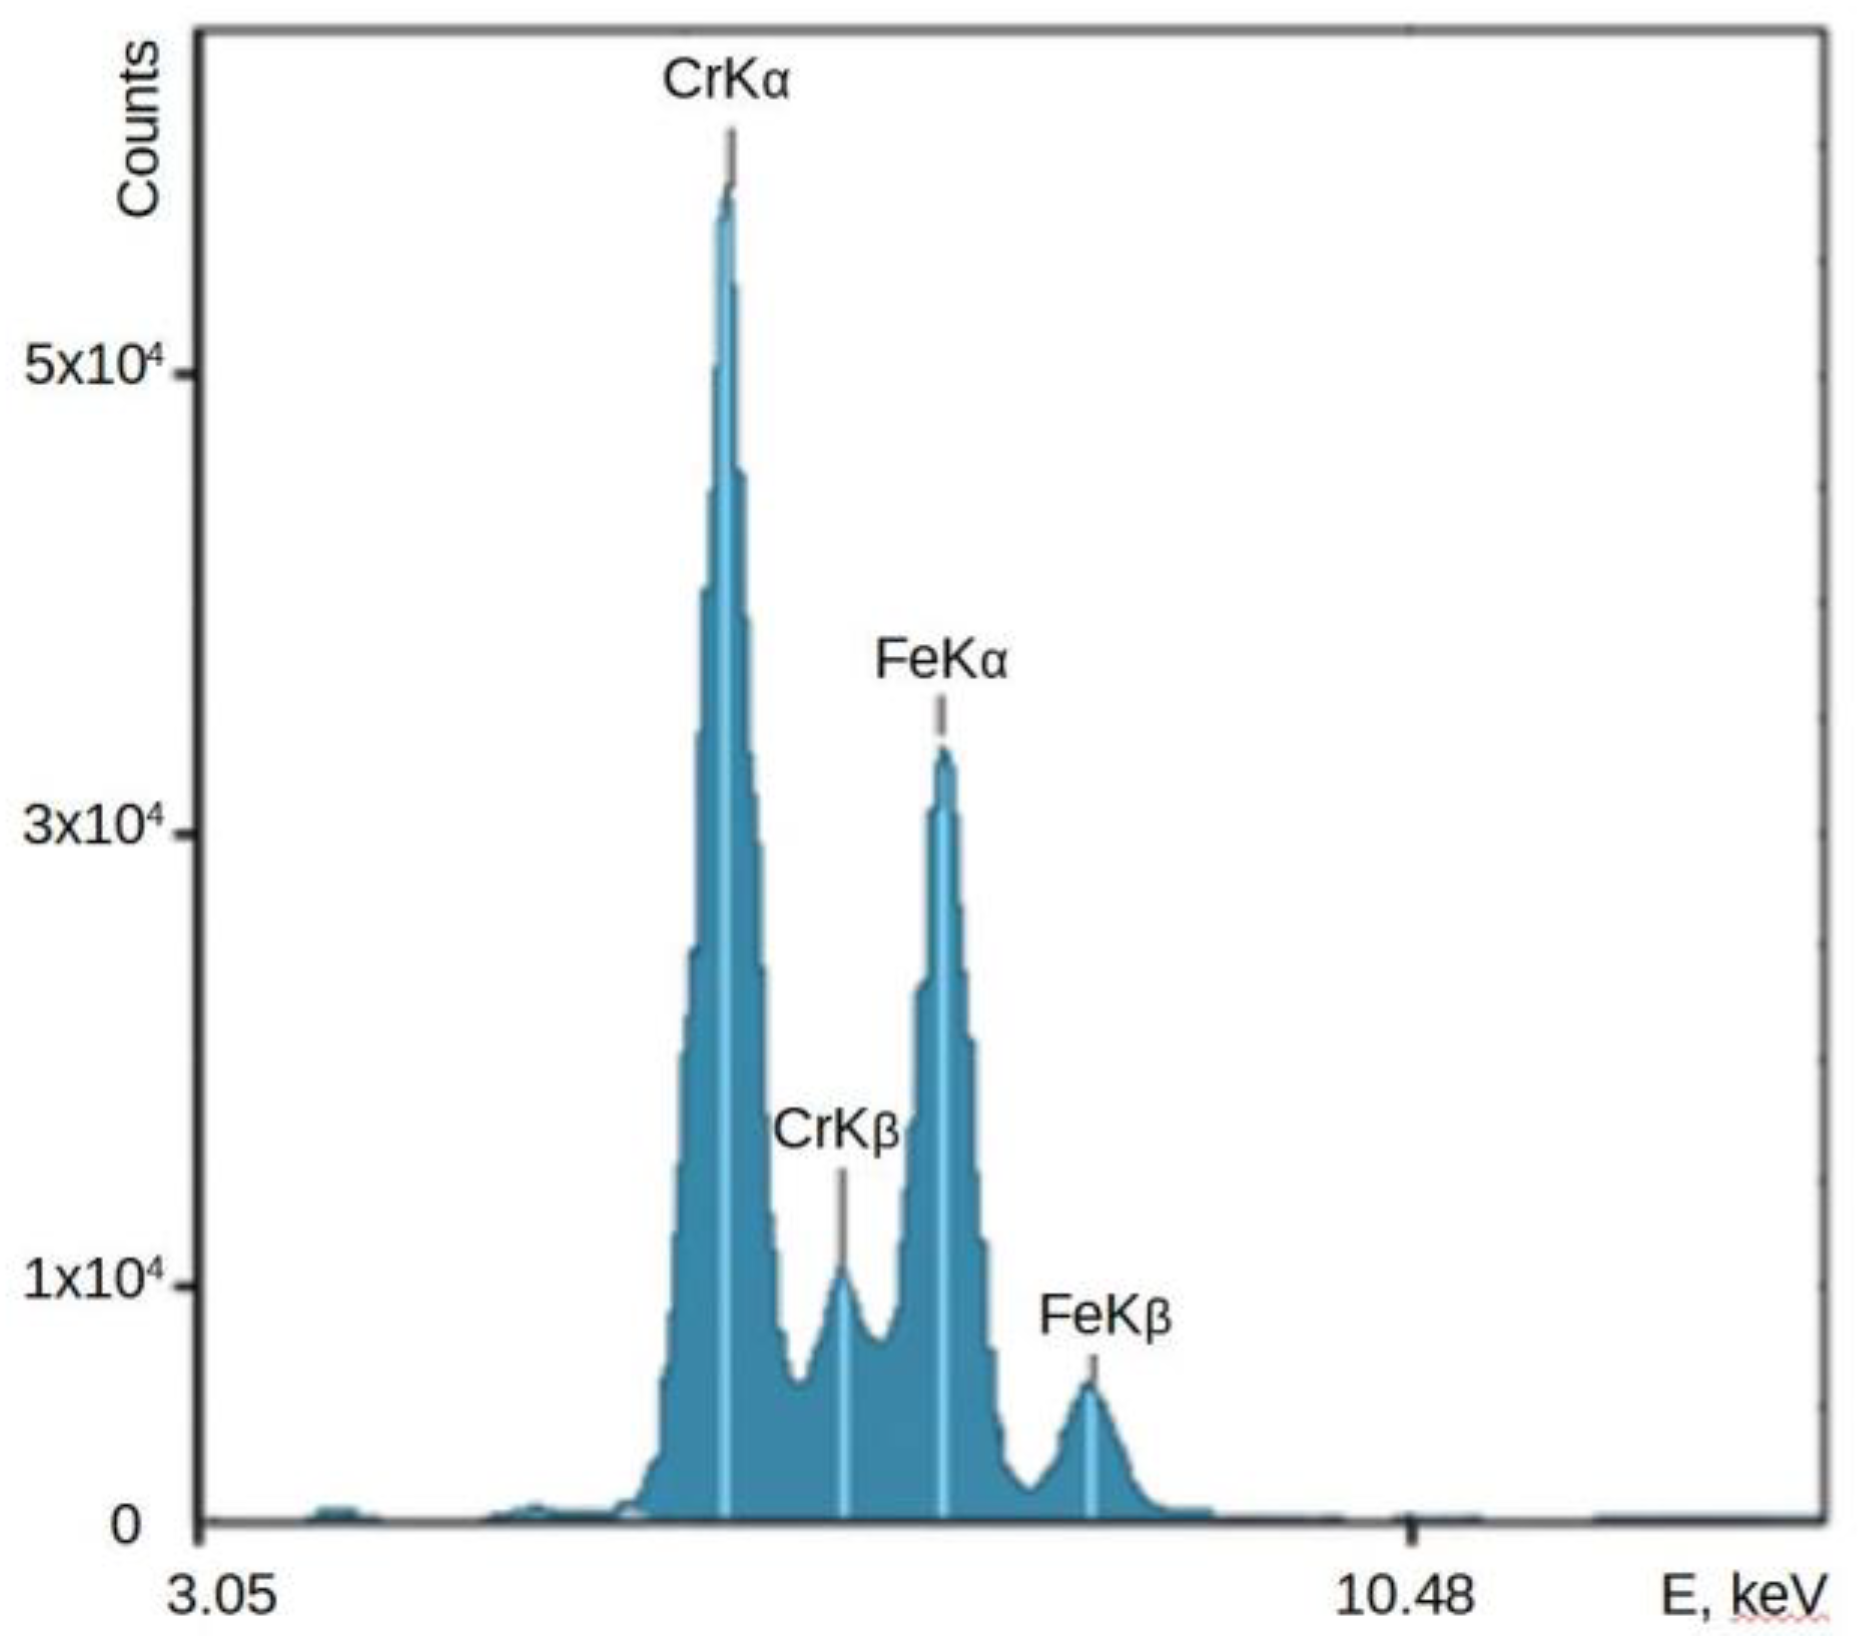
Figure 11.
Online XRF analyzer on the belt filter with iron-cake.
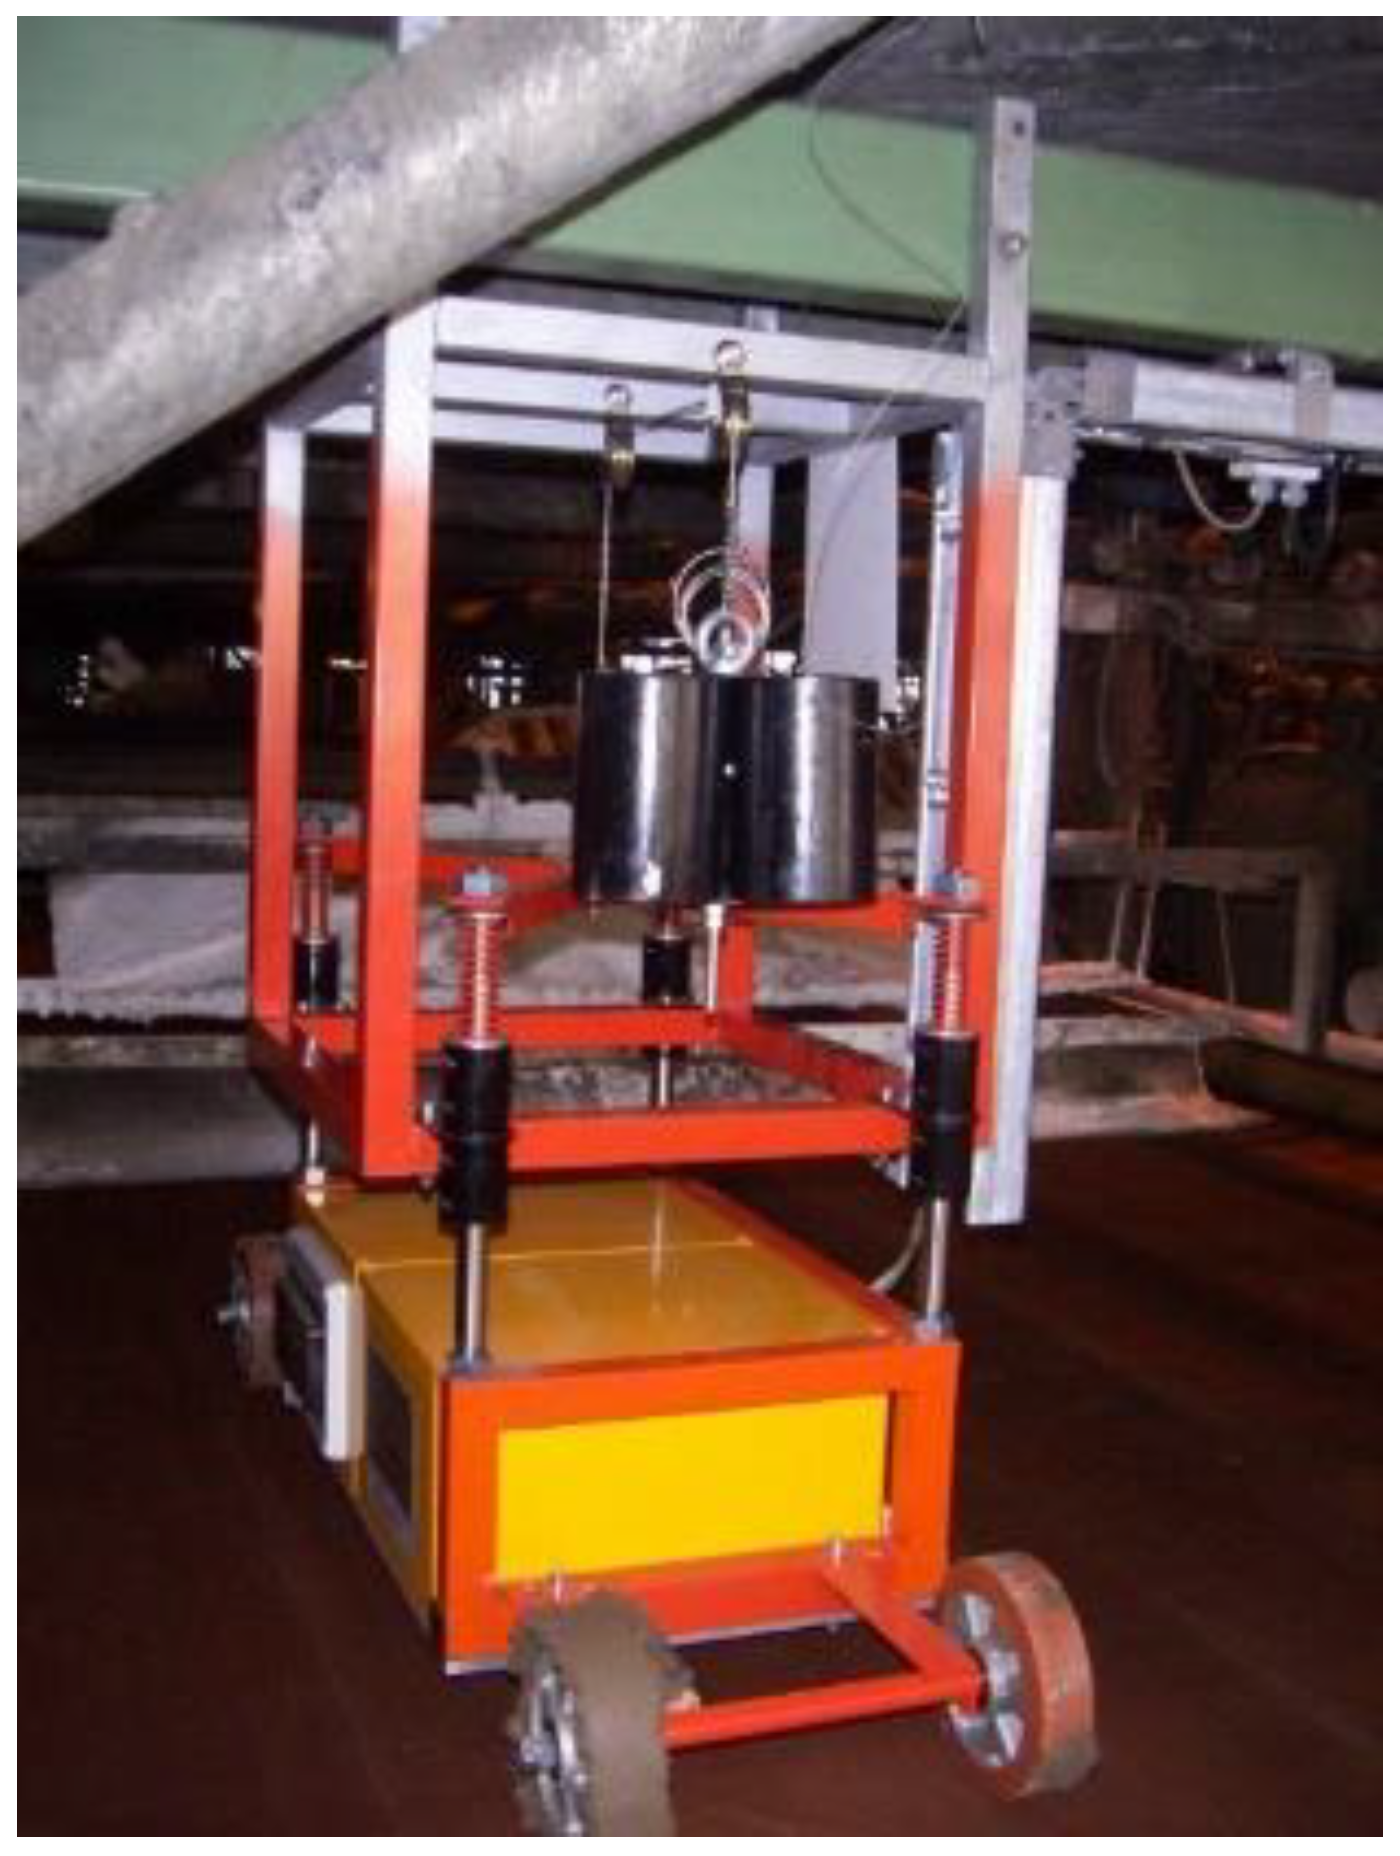
Figure 12.
Spectrum of the iron-cake during the measurement time t=300 sec.
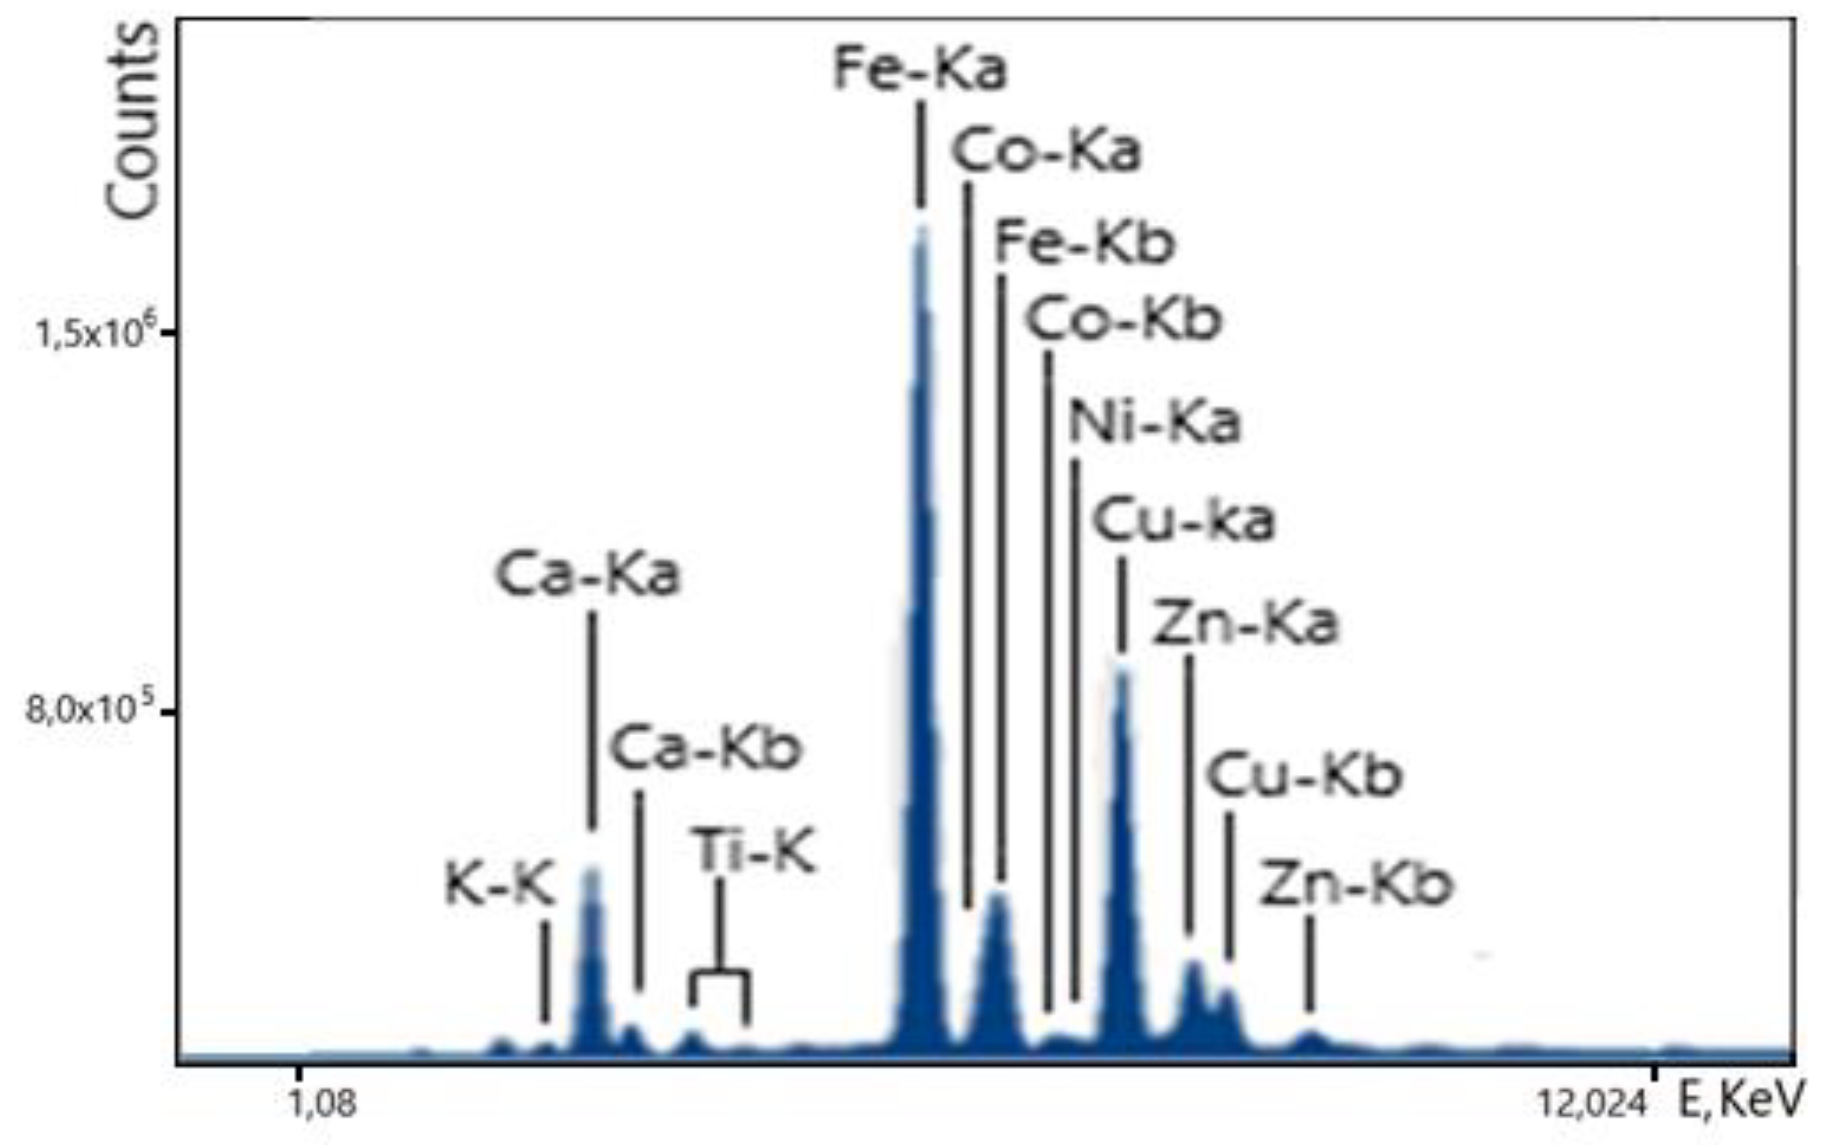
Figure 13.
Chemical and online XRF measurements results for cobalt content determination.
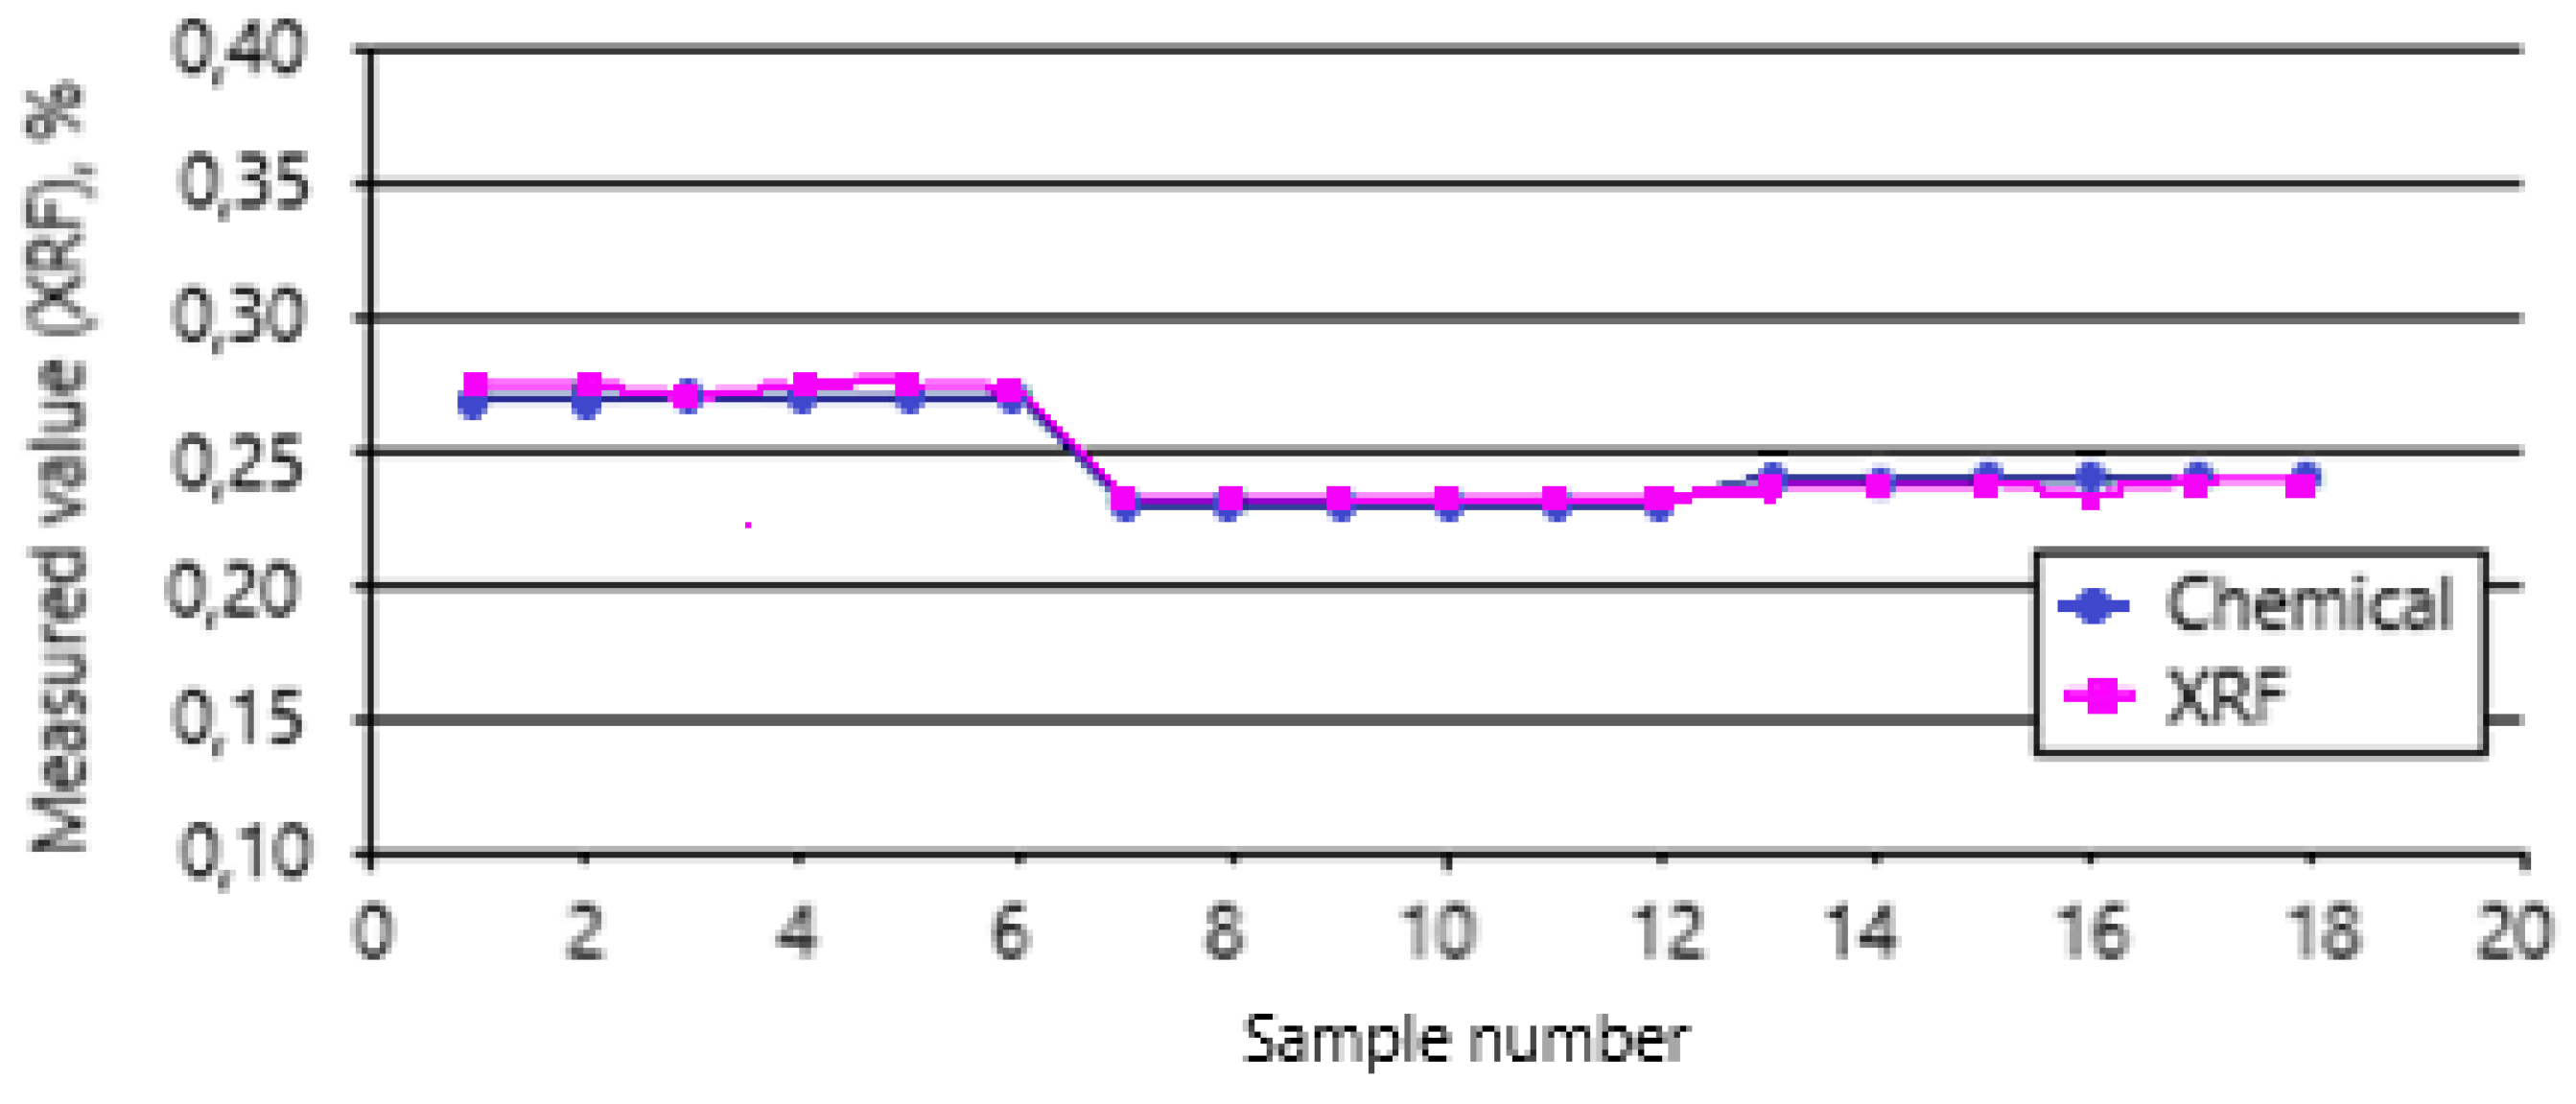
Figure 14.
Online XRF analyzer above the conveyor with Vanadium Slag.
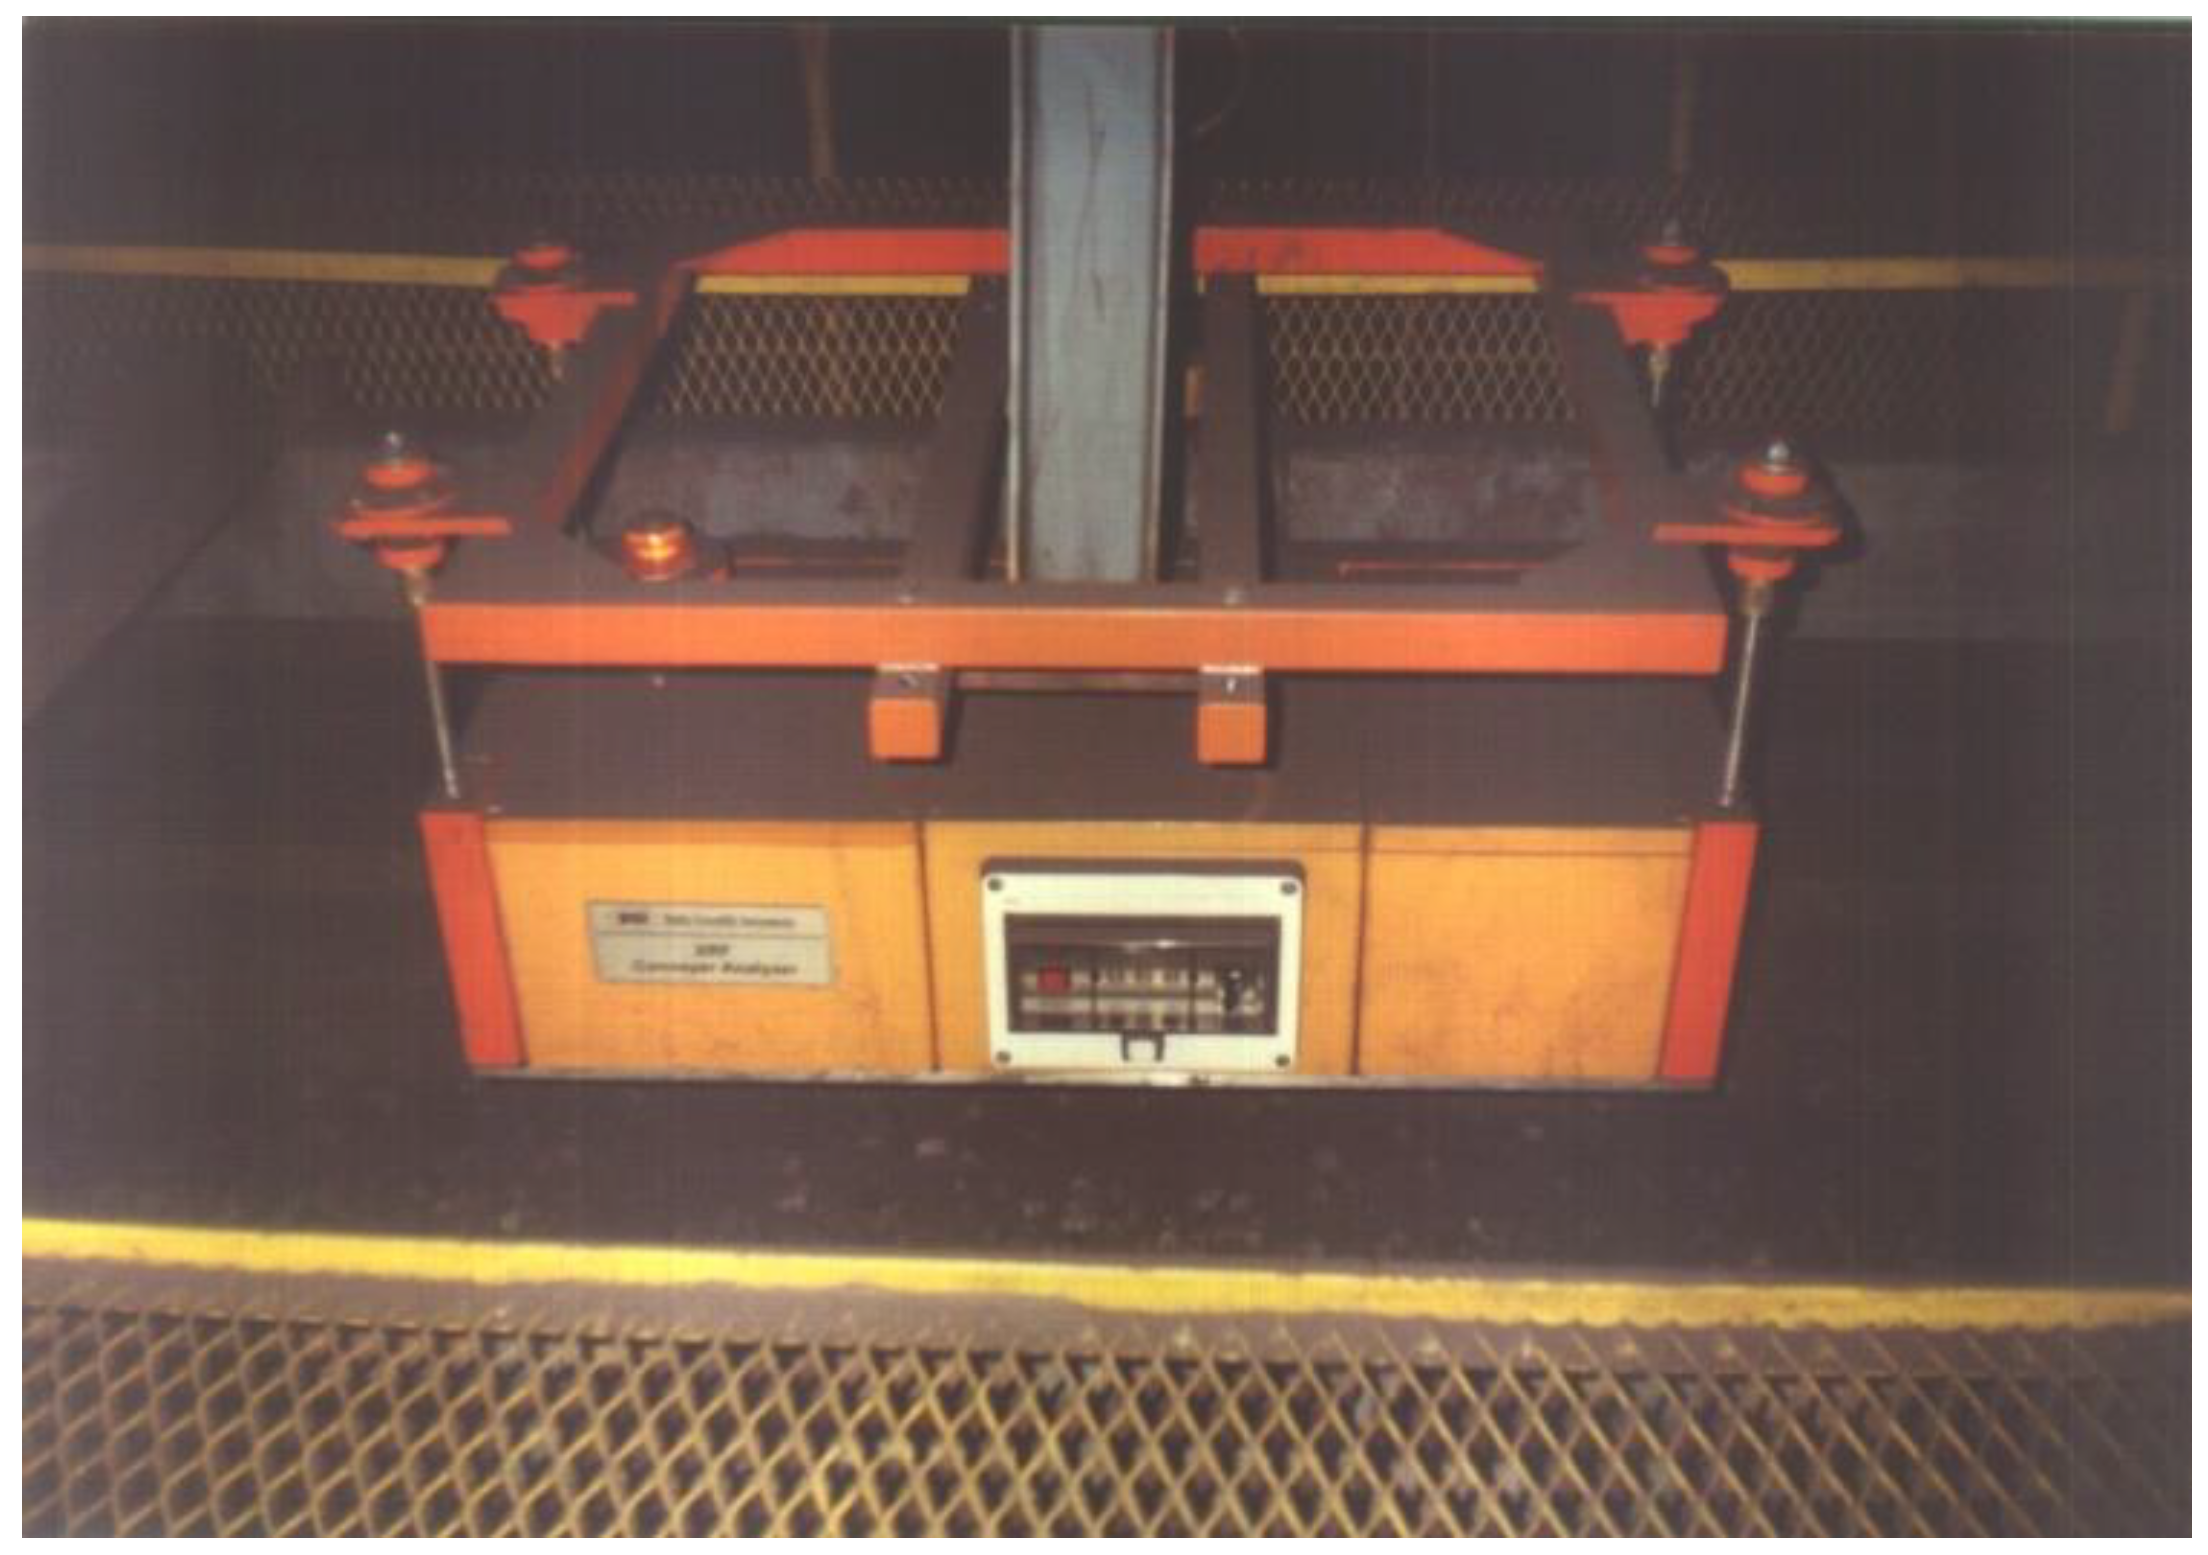
Figure 15.
Spectrum of a vanadium slag sample.
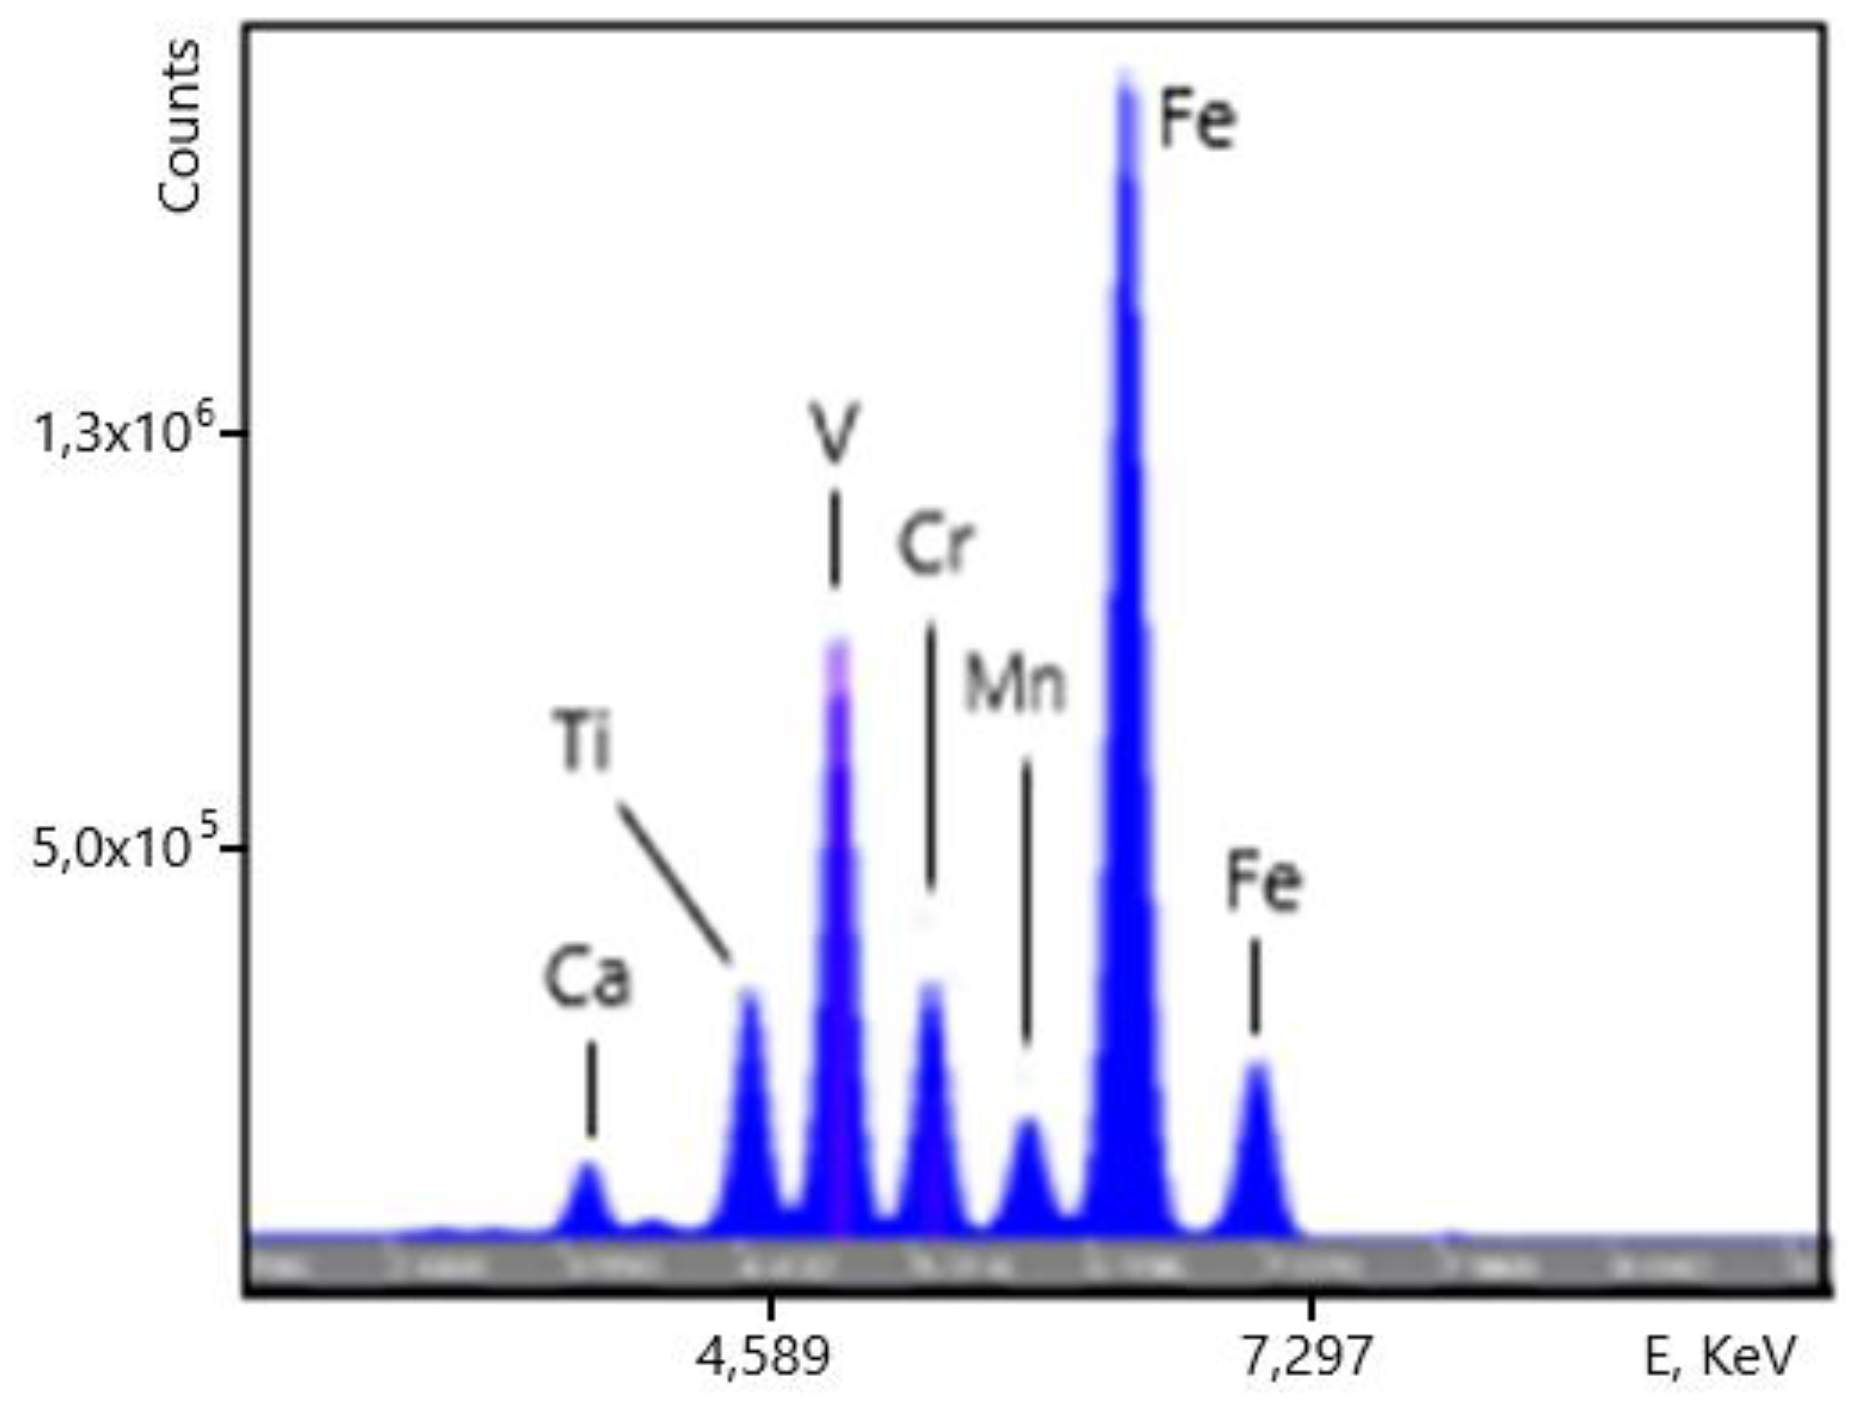
Figure 16.
Zoom into low-intensity features of the vanadium slag XRF spectrum.
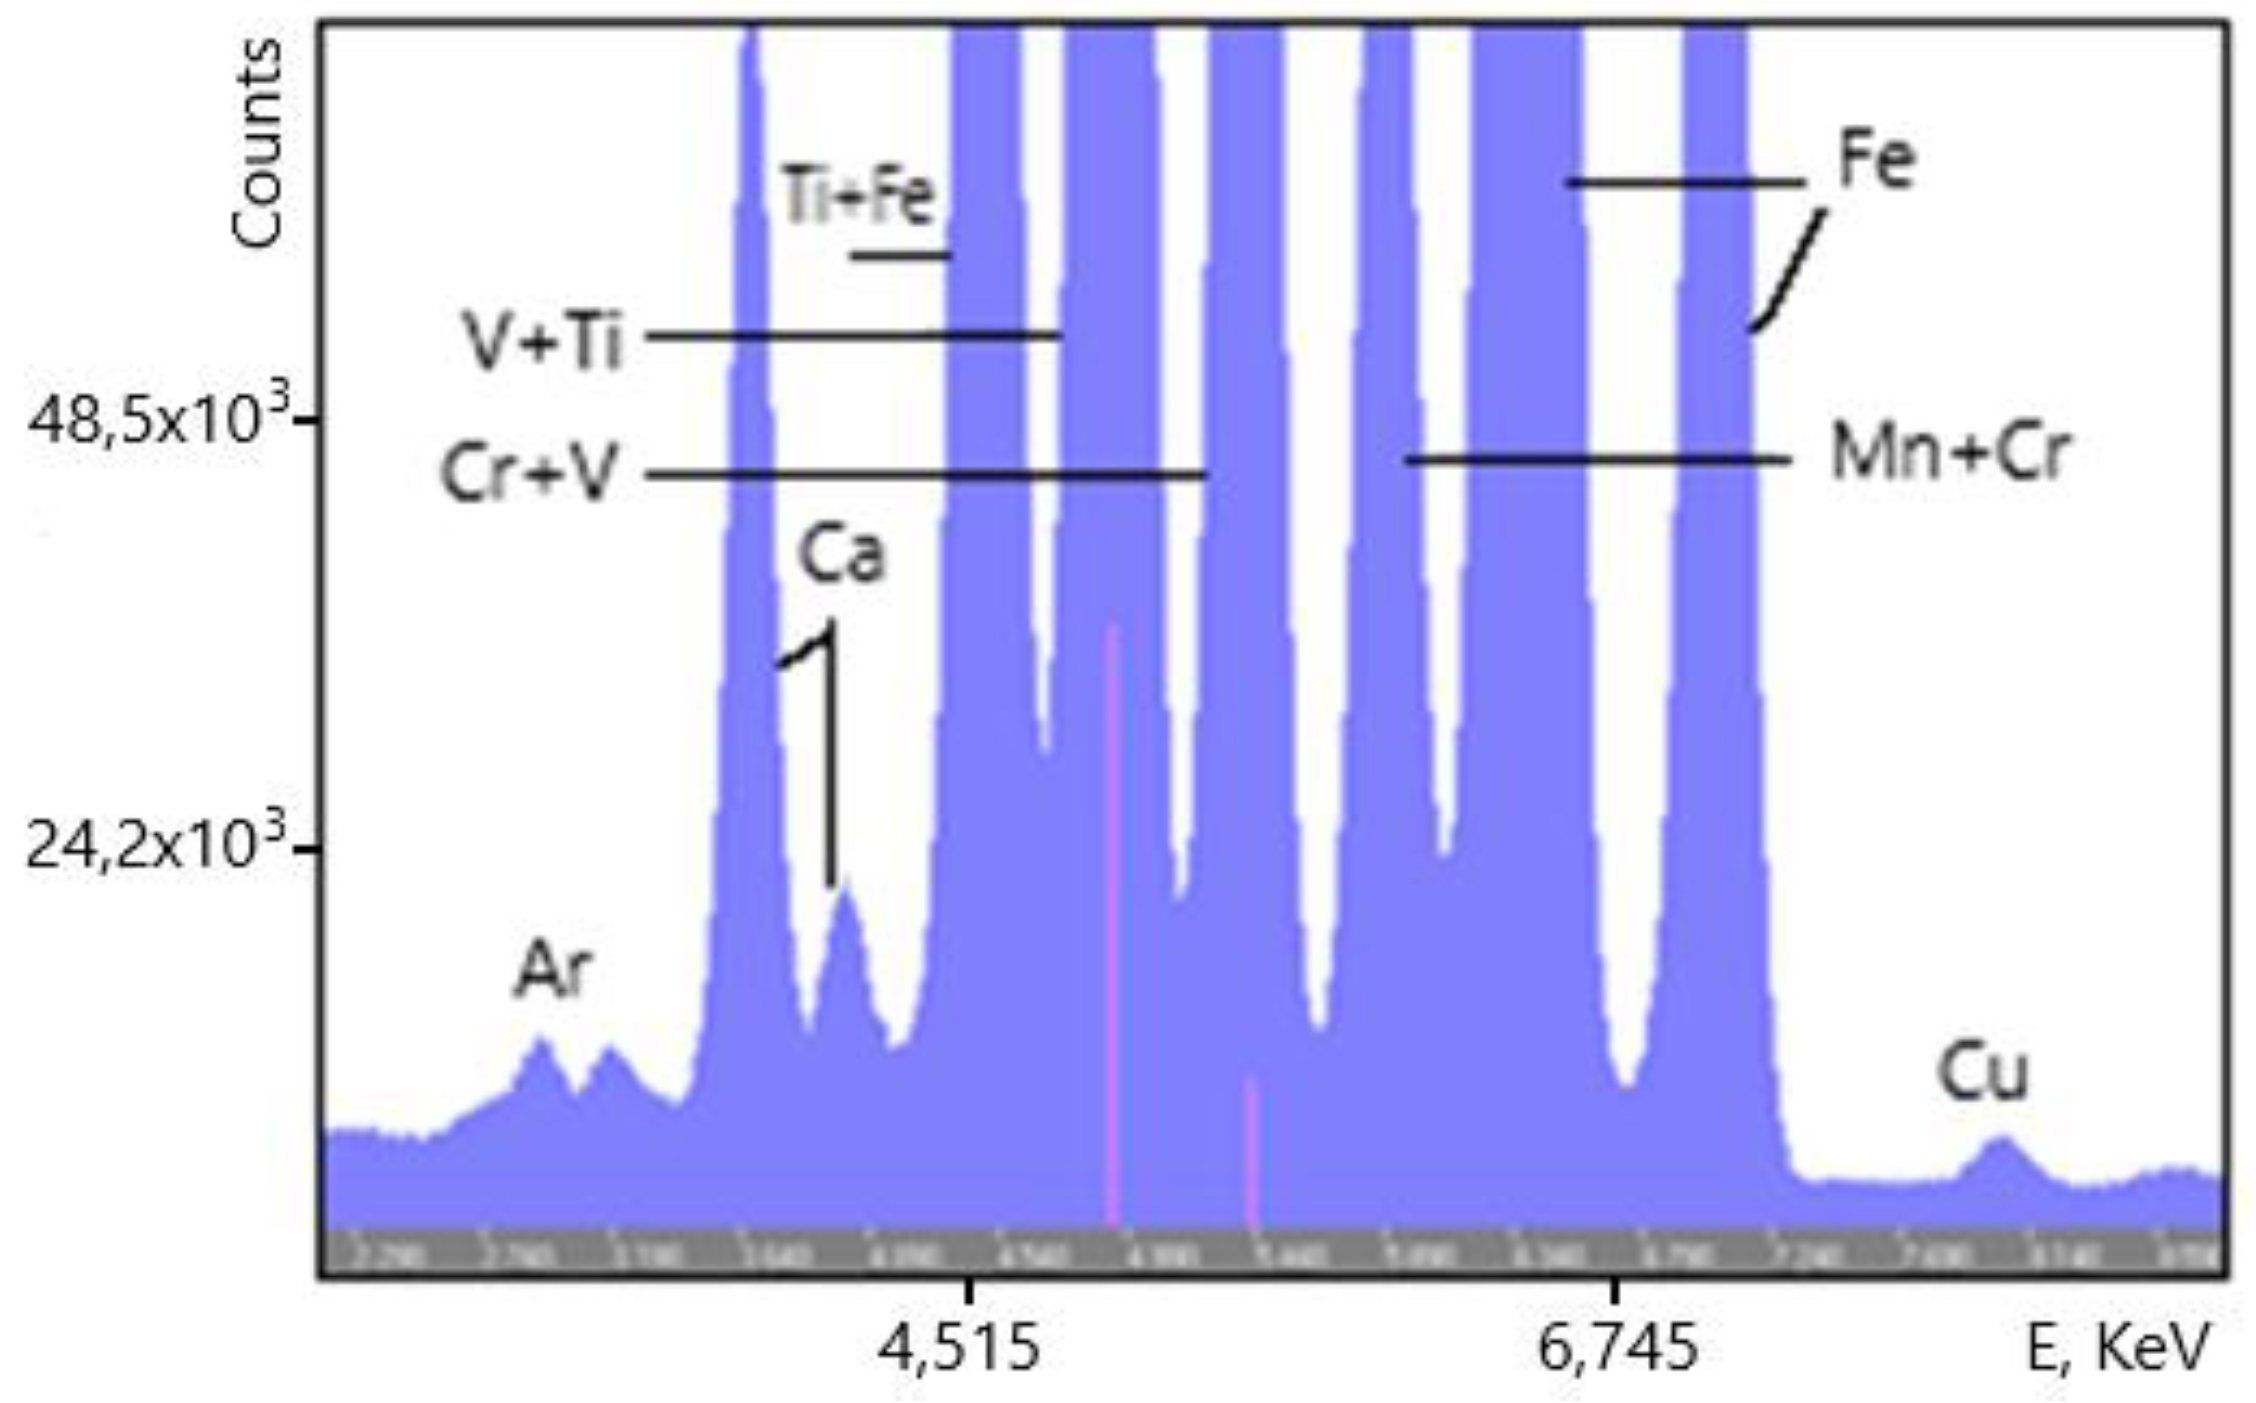

Table 1.
Characteristics of standard reference samples, provided by customers for online XRF analyzers calibration.
Table 1.
Characteristics of standard reference samples, provided by customers for online XRF analyzers calibration.
| Application | Material | Concentration range, % | Number of reference samples | R2 | |
|---|---|---|---|---|---|
| 4.1 | Chromite Lump | Cr2O3 FeCr2O4 |
29-40 25-30 |
300 | 0.981 |
| 4.2 | Copper-zinc sulfide | Cu | 17.7– 35.9 | 12 | 0.999 |
| Zn | 0.37– 9.52 | 0.999 | |||
| S | 31.11-38.82 | 0.982 | |||
| 4.3 | Charge feed | Ca (CaO) Ca(CaO/SiO2) |
3–4 0.5–0.9 |
10 | 0.942 |
| Cr (Cr2O3) | 0.01–0.03 | - | |||
| Fe | 58 – 65 | 0.939 | |||
| 4.4 | Iron cake | Fe | 3.40 – 3.64 | 18 | - |
| Co | 0.23 – 0.36 | 0.991 | |||
| Cu | 1.03 – 1.34 | - | |||
| 4.5 | Vanadium slag | Ca | 1.43 – 4.29 | 7 | 0.919 |
| Ti | 4.38 – 6.89 | 0.997 | |||
| V | 11.26–12.33 | 0.997 | |||
| Cr | 2.05 – 3.42 | 0.719 | |||
| Mn | 2.09 – 8.67 | 0.999 | |||
| Fe | 20.26–30.39 | 0.995 | |||
Table 2.
Statistical parameters for iron and copper.
| Sample name | Fe | Cu | ||||
|---|---|---|---|---|---|---|
| Detection limit, % | Precision, % | Sensitivity, p/s /% | Detection limit, % | Precision, % | Sensitivity, p/s /% | |
| 27.04 | 0.032 | 0.13 | 576.57 | 0.026 | 0.21 | 777.34 |
| 29.4 | 0.030 | 0.13 | 599.08 | 0.027 | 0.24 | 765.07 |
| 01.05 | 0.032 | 0.14 | 567.34 | 0.029 | 0.14 | 755.66 |
Table 3.
Statistical parameters from the vanadium slag XRF spectrum.
Disclaimer/Publisher’s Note: The statements, opinions and data contained in all publications are solely those of the individual author(s) and contributor(s) and not of MDPI and/or the editor(s). MDPI and/or the editor(s) disclaim responsibility for any injury to people or property resulting from any ideas, methods, instructions or products referred to in the content. |
© 2025 by the authors. Licensee MDPI, Basel, Switzerland. This article is an open access article distributed under the terms and conditions of the Creative Commons Attribution (CC BY) license (http://creativecommons.org/licenses/by/4.0/).
Copyright: This open access article is published under a Creative Commons CC BY 4.0 license, which permit the free download, distribution, and reuse, provided that the author and preprint are cited in any reuse.


