
Submitted:
06 October 2025
Posted:
06 October 2025
You are already at the latest version
Abstract
The growth of peer-to-peer accommodation platforms has transformed the tourism and hospitality industry by introducing decentralized, host-driven pricing systems. However, many Airbnb hosts rely on intuition or limited platform recommendations to set nightly rates, often resulting in inconsistent pricing strategies. This study develops and evaluates a machine-learning model for predicting Airbnb prices using publicly available data from Inside Airbnb for Seattle, Washington. The analysis integrates listing, review, and calendar data to identify key determinants of nightly rates. Following extensive data cleaning and feature engineering, three predictive models were tested: Linear Regression, Ridge Regression, and Random Forest Regression. The Random Forest model achieved the best performance, with an R² of 0.726 and a mean absolute error (MAE) of approximately $51 per night. Cross-validation and multi-seed testing confirmed model stability and reproducibility. Feature-importance analysis revealed that property capacity and amenity richness were the strongest predictors of price, while neighborhood tier and host activity contributed moderately. These findings reinforce hedonic pricing theory by demonstrating that tangible property characteristics explain most pricing variation in peer-to-peer rentals. The study contributes a reproducible and interpretable framework for short-term rental analytics, offering practical guidance for hosts, policymakers, and researchers seeking to understand data-driven pricing in the sharing economy.
Keywords:
Airbnb
; machine learning
; pricing prediction
; feature engineering
; random forest
; hedonic pricing
1. Introduction
The expansion of peer-to-peer accommodation platforms such as Airbnb has disrupted traditional hospitality models by enabling individual hosts to manage property listings and pricing directly. This decentralized structure increases flexibility but also creates inefficiencies, as many hosts rely on intuition or platform-suggested averages when setting nightly rates. Consequently, properties with similar features or locations often exhibit substantial price variation, suggesting opportunities for more systematic, data-driven pricing.
Machine-learning (ML) techniques offer a promising avenue for addressing this challenge. Unlike traditional linear methods, ML models can capture complex, non-linear relationships between listing attributes, host behavior, and location characteristics. Applied within the framework of hedonic pricing theory, which views property value as a function of its measurable features, these models provide an empirical basis for understanding how structural, amenity, and neighborhood variables shape rental prices (Wang & Nicolau, 2017).
This study applies a predictive modeling framework to Airbnb listings in Seattle, Washington, to explore which features most influence nightly prices. Seattle’s diverse neighborhoods, strong tourism sector, and extensive public data availability through the Inside Airbnb repository make it an ideal context for this analysis. Multiple datasets—including listings, reviews, and calendar availability—are combined to develop an integrated analytical view of the market.
The research aims to identify key determinants of price, compare model accuracy across linear and ensemble approaches, and evaluate reproducibility through cross-validation and multi-seed testing. By combining methodological transparency with empirical rigor, the study contributes to the growing intersection of machine learning and tourism analytics, offering a replicable approach that can inform host decision-making, academic inquiry, and platform-level strategy.
The central research question is therefore:
How accurately can machine-learning models predict nightly Airbnb prices in Seattle, and which listing-level features are most influential in determining those prices?
2. Literature Review
2.1. Overview
Research on Airbnb pricing has expanded rapidly alongside the growth of the sharing economy.Scholars have examined both the economic mechanisms behind short-term rental (STR) markets and the application of computational methods for predicting listing prices.This section reviews the main determinants of Airbnb pricing, recent advances in predictive modeling, and the methodological gaps that motivate the present study.
2.2. Determinants of Airbnb Pricing
Airbnb pricing reflects a mix of structural, locational, and reputational factors.Early hedonic studies, such as Oskam and Boswijk (2016), showed that property size, amenities, and proximity to key areas explain most price variation. Extending this view, Wang and Nicolau (2017) analyzed 33 cities and found that capacity and amenity richness consistently outweighed purely geographic effects once listing heterogeneity was considered. Behavioral influences also matter: Teubner, Hawlitschek, and Dann (2017) demonstrated that host ratings and trust signals command measurable price premiums. Although Gunter and Önder (2018) examined demand rather than prices, their spatial model indicated that neighborhood density and market clustering indirectly shape achievable rates. Together, these studies confirm that Airbnb prices are primarily determined by property features, location context, and host reputation—factors that inform the machine-learning approaches discussed next.
2.3. Machine-Learning Approaches to Price Prediction
As Airbnb datasets became richer and more widely accessible, researchers increasingly adopted machine-learning (ML) methods to capture the complex and non-linear relationships among property, locational, and behavioral factors influencing price.Traditional econometric techniques such as ordinary least squares regression offered interpretability but often struggled to represent interaction effects and diminishing returns.ML algorithms—especially tree-based ensembles—allow these relationships to emerge directly from data.
Alharbi (2023) developed a sustainable pricing framework for Airbnb listings in Barcelona that integrated sentiment features from guest reviews with gradient-boosting and regularized linear models. The study reported strong predictive accuracy and highlighted that review sentiment, host responsiveness, and property capacity were among the strongest predictors.Building on earlier hedonic research, Wang and Nicolau (2017) analyzed 33 global cities and confirmed that capacity and amenity variables dominate over location once adequate heterogeneity is modeled.In a related stream, Gunter and Önder (2018) investigated Airbnb demand in Vienna using spatial econometric models, showing that neighborhood density and cross-listing effects influence occupancy and indirectly affect attainable prices.Complementing these quantitative approaches, Teubner, Hawlitschek, and Dann (2017) demonstrated that reputation signals such as ratings, Superhost status, and verification significantly shape willingness to pay in the sharing economy.Finally, Camatti et al. (2024) compared artificial-intelligence and traditional models for Airbnb price prediction, concluding that advanced algorithms yield comparable or superior performance when supported by high-quality structured features.
Across these studies, the consensus is that ensemble and gradient-boosting methods outperform purely linear baselines, yet relatively few works report rigorous reproducibility checks such as multi-seed or cross-validation testing.The present study responds to this methodological gap by constructing a reproducible ML pipeline and systematically evaluating performance consistency across multiple random partitions of the data.
2.4. Methodological Limitations in Prior Studies
Despite strong progress, several methodological gaps persist. First, most studies rely on a single random train–test split, leaving uncertainty about model stability across different partitions of the data. Varma and Simon (2006) showed that such single-split evaluations can produce overly optimistic estimates of accuracy. Second, few papers include robustness checks (e.g., multi-seed averaging or bootstrapped confidence intervals) to confirm model consistency. Third, feature engineering in prior research is often limited to structural and locational variables, with minimal integration of host activity or calendar-based availability metrics. Finally, many models are treated as “black boxes,” offering little interpretability despite high predictive accuracy—a barrier to practical adoption by hosts or policymakers.
2.5. Comparative Summary of Key Studies
Table 1 summarizes major contributions to the Airbnb pricing literature, highlighting cities studied, models used, and reported performance metrics.
2.6. Identified Research Gaps
Across the literature, three gaps remain evident:
- Limited robustness testing — Few studies employ multi-seed evaluation to confirm model stability across random splits.
- Narrow feature scope — Calendar availability, host activity, and behavioral variables are rarely included, despite their potential explanatory power.
- Lack of transparency — Many high-performing models are not easily interpretable, limiting their usefulness for non-technical stakeholders.
This study addresses these gaps by implementing a reproducible, feature-rich, and explainable modeling pipeline using data from Seattle’s Airbnb market.The following chapter details the methodological framework developed to meet these objectives.
3. Methodology
3.1. Research Approach
This study adopted a quantitative predictive-modeling approach to estimate Airbnb nightly prices and identify the listing characteristics that most influence them. Machine-learning (ML) algorithms were selected because they can model complex, non-linear interactions among structural, locational, and behavioral features that traditional regression may overlook. The research followed the CRISP-DM framework—data understanding, preparation, modeling, evaluation, and interpretation—to ensure a systematic and reproducible process. All analyses were conducted in Python 3.12 using pandas, NumPy, and scikit-learn (Pedregosa et al., 2011).
3.2. Data Source and Integration
Data were drawn from the publicly available Inside Airbnb repository (https://insideairbnb.com/), using the Seattle 2025 snapshot. Four datasets were integrated:
- Listings.csv – Property-level metadata, amenities, host information, and nightly prices.
- Reviews.csv – Guest reviews and timestamps, used to generate host-activity features.
- Calendar files – Daily availability and booking rules for each listing.
- Neighbourhoods.xlsx – Names and coordinates of Seattle neighborhoods.
Files were merged with listing ID and host ID, yielding 6,227 unique listings after cleaning.Integration ensured a unified analytical dataset combining structural, temporal, and locational dimensions.
3.3. Data Cleaning and Preparation
Several preprocessing steps were required to prepare the data for modeling.Missing values in bedrooms, bathrooms, and accommodates were imputed with the median within comparable property groups. Price fields containing currency symbols were converted to numeric form, and unrealistic entries were adjusted: prices below the 1st or above the 99th percentile were capped at those thresholds to minimize the effect of extreme outliers. This capping retained all records while preventing luxury listings from disproportionately influencing results.
Because nightly prices were highly right-skewed, a logarithmic transformation was applied:
This transformation produced a more balanced distribution and stabilized variance for regression modeling. All numeric variables were standardized, and categorical variables were encoded using one-hot representations within the modeling pipeline.
3.4. Feature Engineering
Extensive feature engineering was performed to create meaningful predictors reflecting property capacity, amenities, host behavior, neighborhood context, and calendar activity.Key groups included:
- Structural / Capacity Features: accommodates, bedrooms, and bathrooms_num, plus a composite size_index combining these indicators.
- Amenities: Binary flags for common amenities (workspace, gym, hot tub, pool, air conditioning) and a total amenity_count.
- Neighborhood Tier: Each neighborhood’s median price was used to classify it as High, Mid, or Low tier, then one-hot encoded.
- Host and Review Metrics: review_count, reviews_90d, and a multi_listing_host flag identifying hosts managing multiple properties.
- Calendar Variables: Aggregated metrics derived from locally parsed calendar files, including 30-, 90-, and 180-day availability rates, median minimum nights, and booking-rule statistics.
Zero-byte calendar files were processed locally in Python IDLE to extract availability information, then compiled into a single CSV file for analysis in Google Colab. The final modeling dataset contained 43 engineered predictors.
3.5. Exploratory Data Analysis
Exploratory analysis assessed data quality and relationships among features.The correlation matrix (Figure 1) revealed strong collinearity among capacity-related variables (accommodates, bedrooms, bathrooms_num) and moderate positive relationships between amenity_count and price. These insights justified the inclusion of a regularized linear model (Ridge Regression) alongside non-linear alternatives. Outlier inspection and distribution plots confirmed that the log transformation produced approximately normal residuals for most continuous variables.
A visual inspection of histograms confirmed that the log_price variable approximated a normal distribution after transformation, satisfying assumptions for the linear models and improving interpretability of error metrics.
3.6. Model Specification
Three supervised-learning algorithms were evaluated:
1. Linear Regression – Baseline ordinary least squares (OLS) model.
2. Ridge Regression – Linear model with L2 regularization to mitigate multicollinearity.
3. Random Forest Regressor – Ensemble model averaging multiple decision trees to capture non-linear feature interactions (Breiman, 2001).
Each model was implemented in a scikit-learn pipeline consisting of:
∙ Median imputation for numeric variables and constant imputation for categorical variables.
∙ Standard scaling and one-hot encoding.
∙ Model fitting and prediction.
The Random Forest was configured with 600 trees and a minimum of two samples per leaf.Hyperparameters were tuned via internal cross-validation to balance bias and variance.
3.7. Training, Validation, and Robustness
Data were partitioned into training (80 %) and testing (20 %) sets using a fixed random seed (42) for reproducibility. Model performance was measured using three metrics:
Cross-Validation
Five-fold cross-validation was applied to the training set to estimate generalization accuracy.Average and standard-deviation values of R² and MAE across folds were recorded.
Multi-Seed Evaluation
To assess robustness, the full training–testing cycle was repeated across five random seeds (0–4). Results were summarized using the median and interquartile range (IQR) of R² and MAE values and visualized through box plots (Figure 2). This procedure ensured that findings were not dependent on a single random partition.
The nearly uniform performance across repetitions confirms that results were not dependent on random initialization or partitioning effects—a critical validation for applied machine-learning research.
Model-Selection Criteria
The preferred model was selected based on:
(a) highest mean R² and lowest MAE;
(b) smallest variability across seeds; and
(c) interpretability of feature effects.
3.8. Implementation and Reproducibility
All computations were executed on Google Colab (12 GB RAM, Tesla T4 GPU).The codebase employed consistent library versions and fixed random states for deterministic replication. Outputs—including model metrics, feature-importance rankings, and validation plots—were exported in CSV and PNG formats for documentation.Version control and reproducibility were maintained through a structured Google Drive directory and embedded pipeline scripts.
4. Results
4.1. Overview
This chapter presents the outcomes of the predictive modeling process described in Chapter 3. Three supervised learning algorithms—Linear Regression, Ridge Regression, and Random Forest Regression—were trained on the Seattle Inside Airbnb dataset to predict nightly listing prices. Model performance was assessed using the coefficient of determination (R²), mean absolute error (MAE), and root mean square error (RMSE). Cross-validation and multi-seed testing were conducted to evaluate consistency and generalization.
4.2. Model Performance Summary
Table 2 summarizes the comparative performance of the three models across the primary evaluation metrics.
As shown in Table 2, the Random Forest model achieved the highest predictive accuracy with an R² of 0.726 and the lowest mean absolute error of approximately $51 per night.This indicates that, on average, the model’s predicted prices deviated from actual prices by roughly $50, representing a strong level of precision for heterogeneous market data. A $51 average deviation represents approximately 12% of the mean nightly price, suggesting high practical accuracy. The near-identical results of the Linear and Ridge models reflect limited improvement from regularization, suggesting that non-linear relationships play a central role in Airbnb price variation.
4.3. Cross-Validation Results
Five-fold cross-validation confirmed the generalizability of the models. The Random Forest achieved a mean cross-validated R² of 0.728 (SD = 0.003), while the Linear and Ridge models averaged approximately 0.64. The small standard deviation across folds indicates that the Random Forest consistently captured underlying price relationships rather than fitting to a specific data subset. These results support the robustness of ensemble methods for heterogeneous and non-linear datasets.
4.4. Multi-Seed Robustness Analysis
To verify reproducibility, the entire modeling process was repeated with five random seeds (0–4). The resulting R² and MAE values were summarized using median and interquartile range (IQR). The Random Forest displayed the narrowest dispersion (IQR = 0.008 R²; IQR = $1.7 MAE), demonstrating high stability across data splits.
4.5. Feature Importance Analysis
The Random Forest model also produced interpretable feature-importance scores, revealing which predictors most influenced nightly prices. The top ten features, shown in Figure 3, include both structural and amenity-related attributes.
Key predictors included accommodates, bedrooms, and amenity_count, underscoring the central role of property capacity and available amenities.Features such as workspace, gym, and bathrooms_num contributed additional explanatory power, reflecting guest preferences for functional and comfort-enhancing facilities.Review-based and availability features (e.g., review_count, avail_rate_30d) had smaller but measurable influence, suggesting that while host activity and short-term occupancy matter, they are secondary to property characteristics.
These findings align with previous research (Wang & Nicolau, 2017; Camatti et al., 2024) emphasizing tangible property features as dominant determinants of Airbnb pricing.
4.6. Model Interpretation and Error Patterns
Model interpretation in this study focused on quantitative performance metrics rather than residual diagnostics. Evaluation metrics—R², MAE, and RMSE—were examined across five random seeds to assess generalization and consistency. he Random Forest maintained the highest accuracy with minimal variation across runs, demonstrating a stable fit to the data without evidence of overfitting. The linear models showed lower but consistent performance, suggesting that the main price-driving relationships are inherently non-linear. These results collectively indicate that ensemble methods provide a balanced compromise between predictive power and interpretability for Airbnb price modeling.
4.7. Comparative Performance in Context
When compared with prior research, the model’s predictive performance (R² = 0.726) falls within the upper range of published results. Studies employing ensemble or gradient-boosting methods on similar Airbnb datasets reported comparable accuracy levels (Alharbi, 2023; Camatti et al., 2024). The strong results achieved here, despite relying solely on structured listing and calendar data, demonstrate that robust feature engineering and reproducible validation can rival more complex models that incorporate textual or image inputs. Furthermore, the dominance of capacity and amenity features in this study aligns closely with the findings of Wang and Nicolau (2017), while the spatial and density effects noted by Gunter and Önder (2018) offer additional context for understanding how neighborhood characteristics shape overall demand. Together, these comparisons reinforce the broader literature’s view that property attributes and reputational trust signals are the most consistent drivers of Airbnb pricing performance.
4.8. Summary of Findings
The Random Forest model demonstrated the strongest predictive capability, explaining approximately 73% of the variation in nightly prices with an average error of around $51. Cross-validation and multi-seed testing confirmed consistent performance across data partitions, validating the model’s generalizability. Feature analysis revealed that property capacity and amenity richness dominate price formation, while neighborhood and host factors exert secondary effects. These results provide a sound empirical foundation for the discussion presented in the following chapter.
5. Discussion and Implications
5.1. Overview
This chapter interprets the study’s findings considering prior research and theoretical frameworks. The discussion focuses on three dimensions: (a) how the results align with established Airbnb pricing determinants, (b) what the findings imply for short-term rental (STR) management and platform analytics, and (c) how the research contributes to the broader field of data-driven pricing and hedonic modeling.
5.2. Interpretation of Findings
The Random Forest model’s strong performance (R² = 0.726, MAE ≈ $51) confirms that ensemble learning effectively captures the complex interactions among Airbnb listing features.This outcome is consistent with prior machine-learning research such as Camatti et al. (2024), which demonstrated that artificial-intelligence approaches often outperform or match traditional regression baselines in short-term-rental pricing tasks. The present results also mirror the hedonic patterns reported by Wang and Nicolau (2017), where tangible structural and amenity characteristics explained most of the price variance. Although Gunter and Önder (2018) focused on demand rather than price, their evidence that neighborhood density and listing concentration affect occupancy indirectly supports the idea that location intensity influences value. Likewise, Teubner et al. (2017) found that reputation mechanisms—ratings and Superhost status—carry measurable price premiums, consistent with the smaller yet significant effects observed for host-related features in this model. Overall, these findings reinforce that property capacity, amenity richness, and trust indicators collectively remain the strongest determinants of Airbnb pricing outcomes.
5.3. Methodological Contributions
Beyond predictive accuracy, this research contributes methodologically by emphasizing reproducibility and transparency in applied ML workflows. Few Airbnb pricing studies have implemented both cross-validation and multi-seed testing to assess robustness, an issue highlighted in bias-estimation work by Varma and Simon (2006). By reporting median and interquartile metrics across five seeds, this study provides a more reliable estimate of model stability. All preprocessing, encoding, and modeling steps were embedded within unified scikit-learn pipelines (Pedregosa et al., 2011), ensuring that identical transformations occurred across training and testing data. These design choices address reproducibility—a growing priority in data-science and tourism-analytics research.
5.4. Theoretical Implications
The findings reinforce hedonic pricing theory within a modern, data-driven context. Traditional hedonic models assume linear relationships between attributes and price, yet real-world STR markets display complex, non-linear interactions among capacity, location, and amenities. The superior performance of the Random Forest model demonstrates that ensemble learning can serve as a non-linear extension of hedonic principles, capturing diminishing returns and threshold effects that linear models overlook. For instance, adding a second bedroom may increase price significantly, but additional bedrooms yield smaller marginal gains—a pattern efficiently learned by tree-based models.
This empirical validation of non-linear hedonic effects contributes theoretically to the intersection of economics and machine learning, illustrating how algorithmic methods can enrich classical frameworks without replacing them.
5.5. Practical Implications
For hosts and property managers, the results highlight the tangible value of strategic investment in property improvements. Enhancing capacity and offering high-demand amenities—such as a workspace, air conditioning, or gym access—can lead to measurable increases in nightly rates. By leveraging predictive tools similar to the Random Forest model, hosts can benchmark their listings against local market patterns and optimize pricing dynamically.
For platforms and policymakers, the study demonstrates how open data and interpretable machine-learning models can improve market transparency. Platforms could integrate feature-based pricing estimators into host dashboards to encourage more consistent pricing practices, while policymakers could use similar models to analyze affordability, neighborhood saturation, and the economic impacts of STR activity.
5.6. Broader Analytical Significance
The modeling framework presented here also has broader implications for other domains of predictive analytics. Its emphasis on multi-source feature integration, reproducible pipeline design, and performance stability can inform pricing and forecasting applications beyond tourism, including e-commerce, transportation, and real estate analytics.Moreover, the inclusion of interpretable feature importance metrics supports responsible AI practices by ensuring that predictions remain explainable to stakeholders.
5.7. Summary
In summary, this study demonstrates that ensemble machine-learning models, when combined with systematic feature engineering and robust validation, can effectively explain and predict Airbnb pricing variation. The results extend prior literature by confirming that tangible property characteristics remain the dominant determinants of value, while also highlighting the methodological importance of reproducibility in applied analytics. These insights hold significance for both academic researchers and industry practitioners seeking to align data-driven pricing strategies with transparency and interpretability principles.
6. Limitations and Future Research
Although this study produced strong and reproducible results, several limitations should be acknowledged to contextualize its findings and guide future work.
6.1. Data Limitations
The Inside Airbnb dataset, while extensive, had incomplete daily calendar data. Many listings’ calendar files lacked detailed day-by-day pricing or occupancy information, allowing only aggregate measures such as availability rates and minimum-night rules to be calculated. As a result, temporal effects such as seasonality, weekday variation, or event-driven price fluctuations could not be modeled directly. In addition, spatial analysis relied on neighborhood tiers derived from median prices rather than precise geographic coordinates, limiting the granularity of locational insights.Finally, the absence of textual and visual listing data excluded potentially informative factors such as host descriptions, image quality, and review sentiment.
6.2. Methodological Limitations
Only three algorithms—Linear Regression, Ridge Regression, and Random Forest—were evaluated. Although the Random Forest demonstrated strong performance, other advanced methods such as Gradient Boosting Machines (e.g., XGBoost, LightGBM) or deep learning models could be tested for potential gains in predictive accuracy. Residual analysis and formal statistical tests for bias or heteroscedasticity were not conducted, as the emphasis was on predictive robustness. Additionally, computational limits in Google Colab required local preprocessing of calendar files, constraining experimentation with larger hyperparameter grids.
6.3. Future Research Directions
Future studies could extend this framework by incorporating temporal and spatial dynamics, such as event calendars or geospatial proximity measures, to capture finer-grained price variability.Integrating textual and visual features through natural language processing and computer vision could further enhance model interpretability and performance. Applying explainable AI (XAI) tools like SHAP or LIME would strengthen transparency by quantifying how specific features influence predictions. Cross-city analyses could also test the generalizability of the model across different housing markets and regulatory contexts. Finally, deploying this model as an interactive dashboard or pricing tool could translate academic insights into practical decision support for Airbnb hosts and local policymakers.
7. Conclusions
This study developed and validated a reproducible machine-learning framework for predicting Airbnb listing prices using publicly available data from Seattle, Washington.By integrating structured features across property, amenity, and host dimensions, the Random Forest model explained approximately 73 percent of price variation with an average prediction error near $51. These findings reinforce hedonic pricing theory by confirming that property capacity and amenity richness remain the strongest determinants of value in short-term rental markets.Methodologically, the research contributes a transparent pipeline emphasizing multi-seed validation, cross-validation, and open-data reproducibility—practices that strengthen the reliability of applied analytics. The framework and results provide both academic and practical insights: academically, they extend hedonic models into non-linear domains; practically, they offer a blueprint for hosts and policymakers seeking data-driven guidance for pricing and regulation.Future research can expand upon this foundation by incorporating textual, spatial, and temporal data to capture more nuanced market dynamics.
References
- Alharbi, Z. H. (2023). A Sustainable Price Prediction Model for Airbnb Listings Using Machine Learning and Sentiment Analysis. Sustainability, 15(17), 13159. [CrossRef]
- Breiman, L. (2001). Random forests. Machine Learning, 45(1), 5–32. [CrossRef]
- Camatti, N., di Tollo, G., Filograsso, G. et al. Predicting Airbnb pricing: a comparative analysis of artificial intelligence and traditional approaches. Comput Manag Sci 21, 30 (2024). [CrossRef]
- Gunter, U. and Önder, İ. (2018). determinants of airbnb demand in vienna and their implications for the traditional accommodation industry. Tourism Economics, 24(3), 270-293. [CrossRef]
- Jeroen Oskam, Albert Boswijk; Airbnb: the future of networked hospitality businesses. Journal of Tourism Futures 14 March 2016; 2 (1): 22–42. [CrossRef]
- Pedregosa, F., Varoquaux, G., Gramfort, A., et al. (2011). Scikit-learn: Machine learning in Python. Journal of Machine Learning Research, 12, 2825–2830. https://www.jmlr.org/papers/v12/pedregosa11a.html.
- Teubner, T. , Hawlitschek, F., & Dann, D. (2017). Price determinants on airbnb: how reputation pays off in the sharing economy. Journal of Self-Governance and Management Economics, 5(4), 53. [CrossRef]
- Varma, S. and Simon, R. (2006). Bias in error estimation when using cross-validation for model selection. BMC Bioinformatics, 7(1). [CrossRef]
- Wang, D. and Nicolau, J. (2017). Price determinants of sharing economy based accommodation rental: a study of listings from 33 cities on airbnb.com. International Journal of Hospitality Management, 62, 120-131. [CrossRef]
- Zervas, G., Proserpio, D., & Byers, J. W. (2017). The rise of the sharing economy: Estimating the impact of Airbnb on the hotel industry. Journal of Marketing Research, 54(5), 687–705. [CrossRef]
Figure 1.
Correlation Matrix Showing Relationships Among Numeric Listing Features.
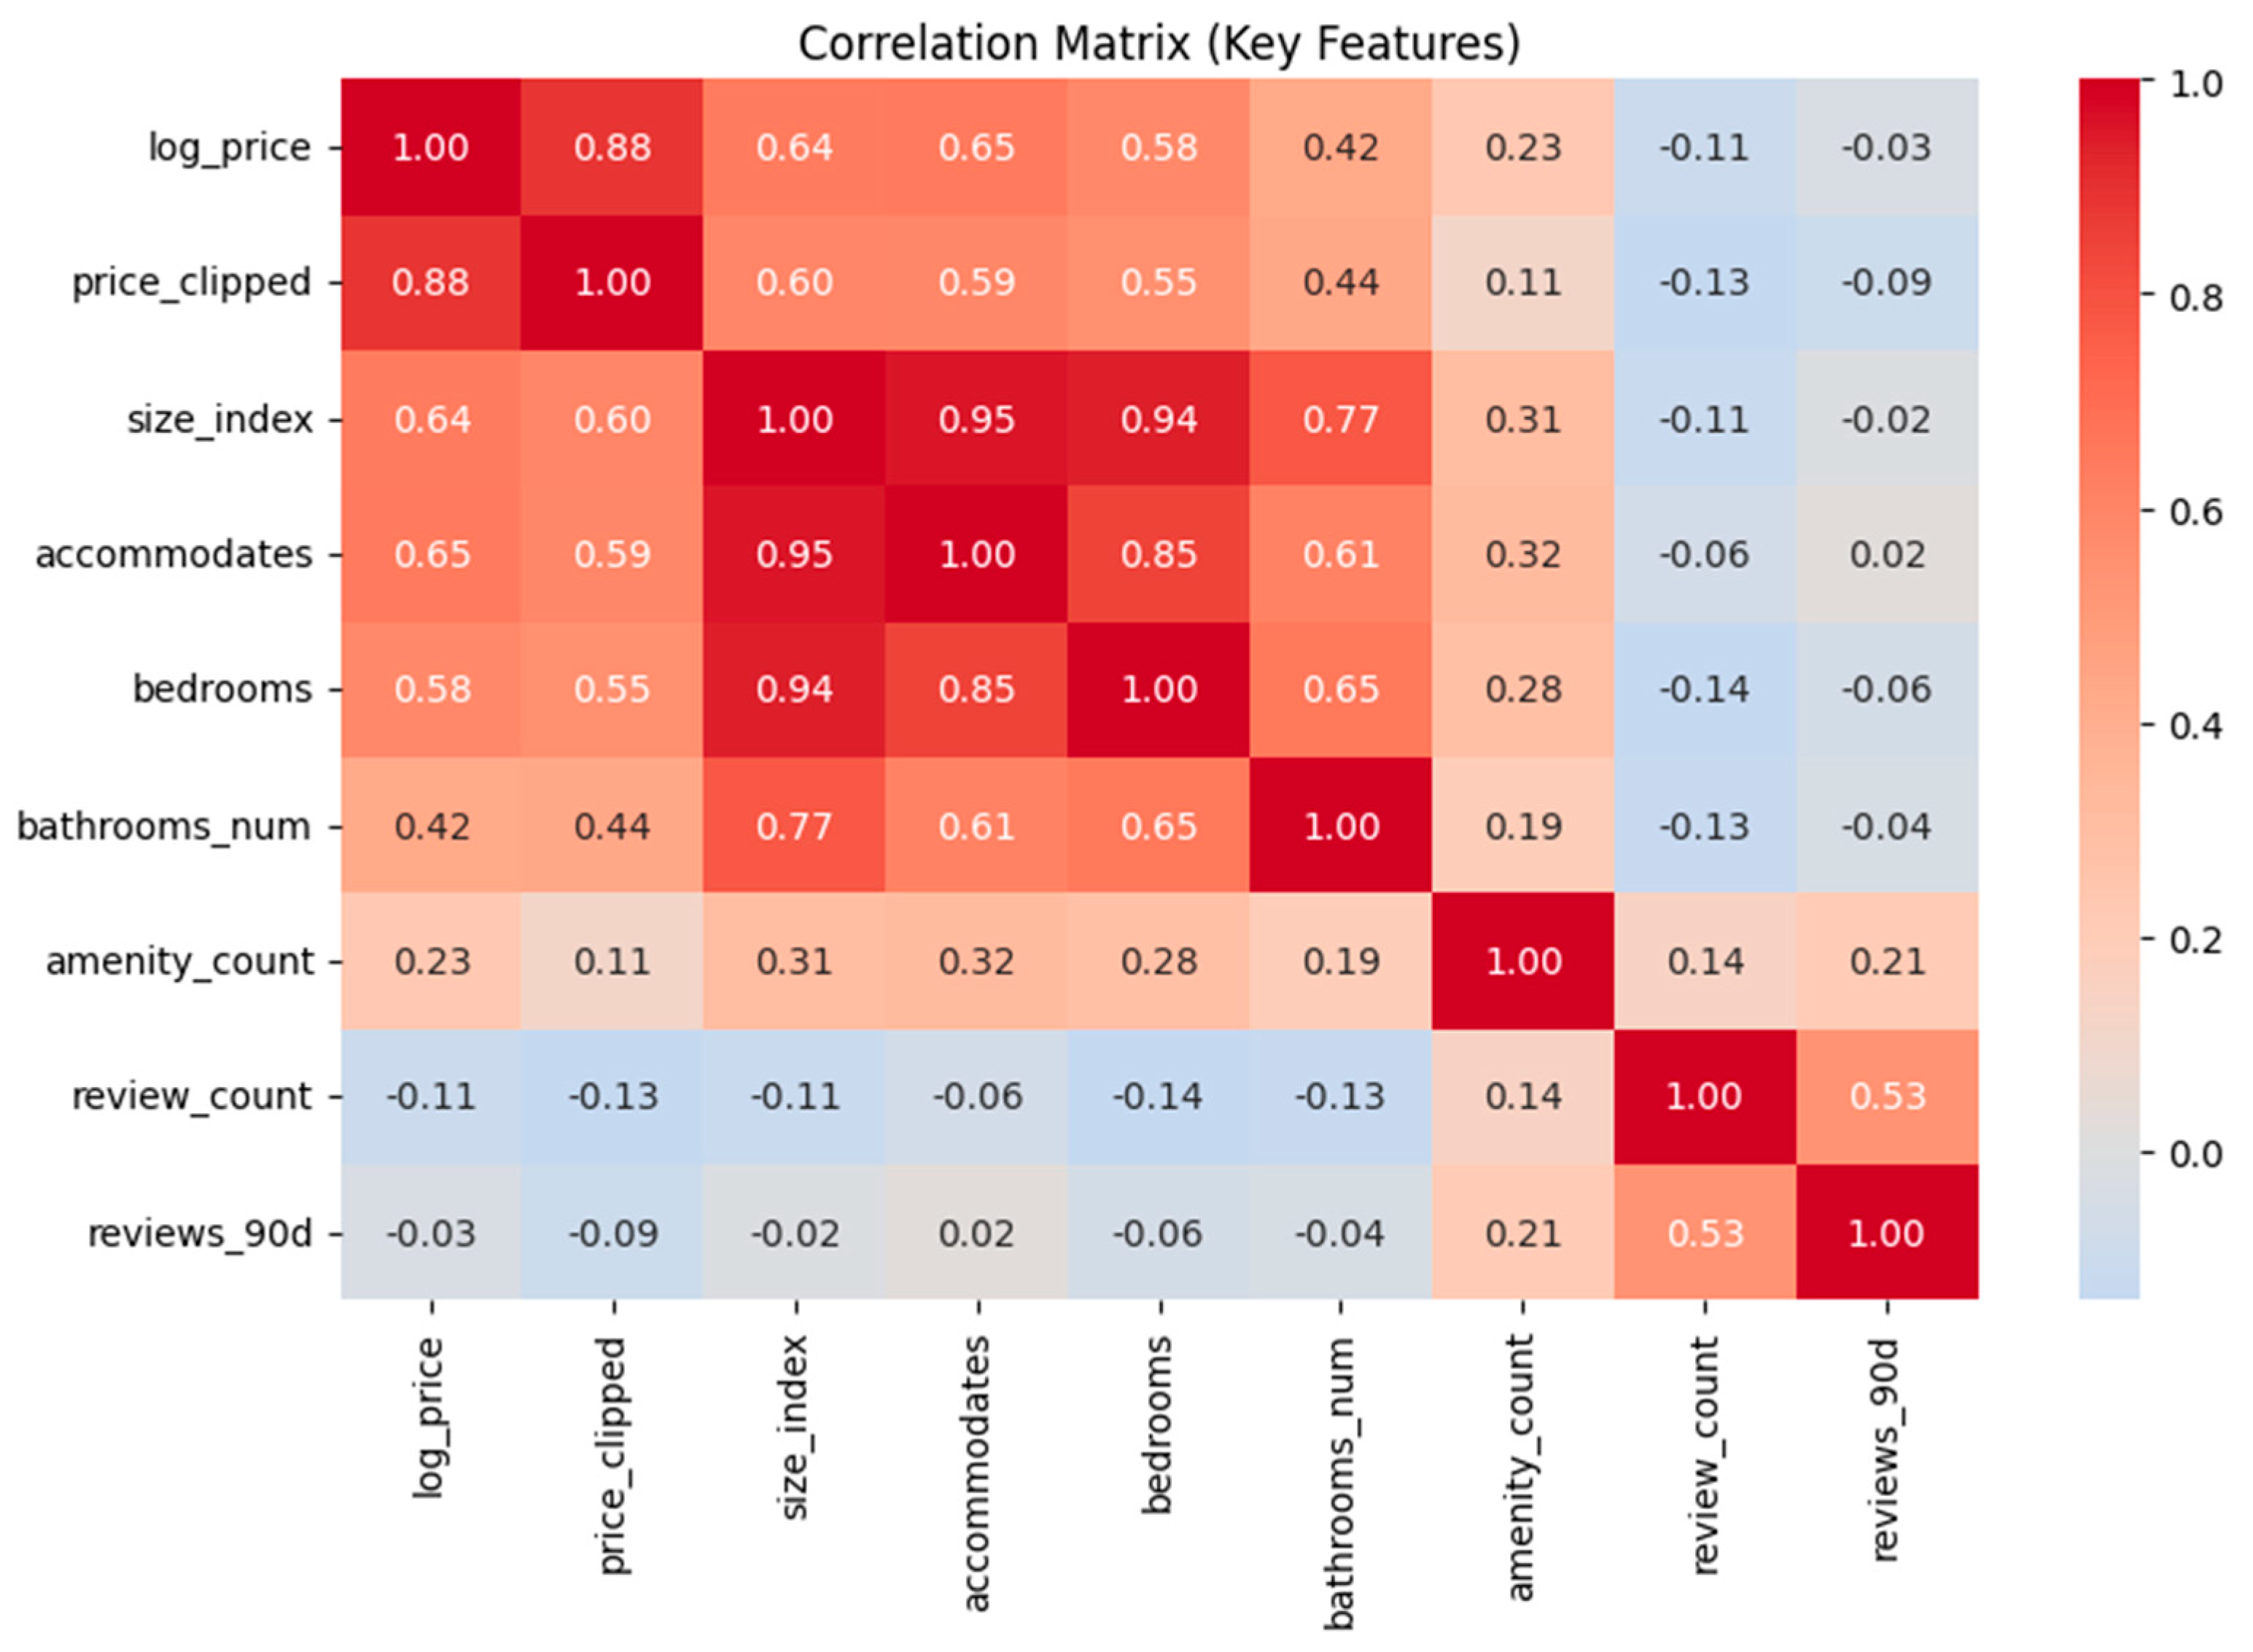
Figure 2.
Box Plots Illustrating Model Stability Across Five Random Seeds (R² and MAE Distributions).
Figure 2.
Box Plots Illustrating Model Stability Across Five Random Seeds (R² and MAE Distributions).
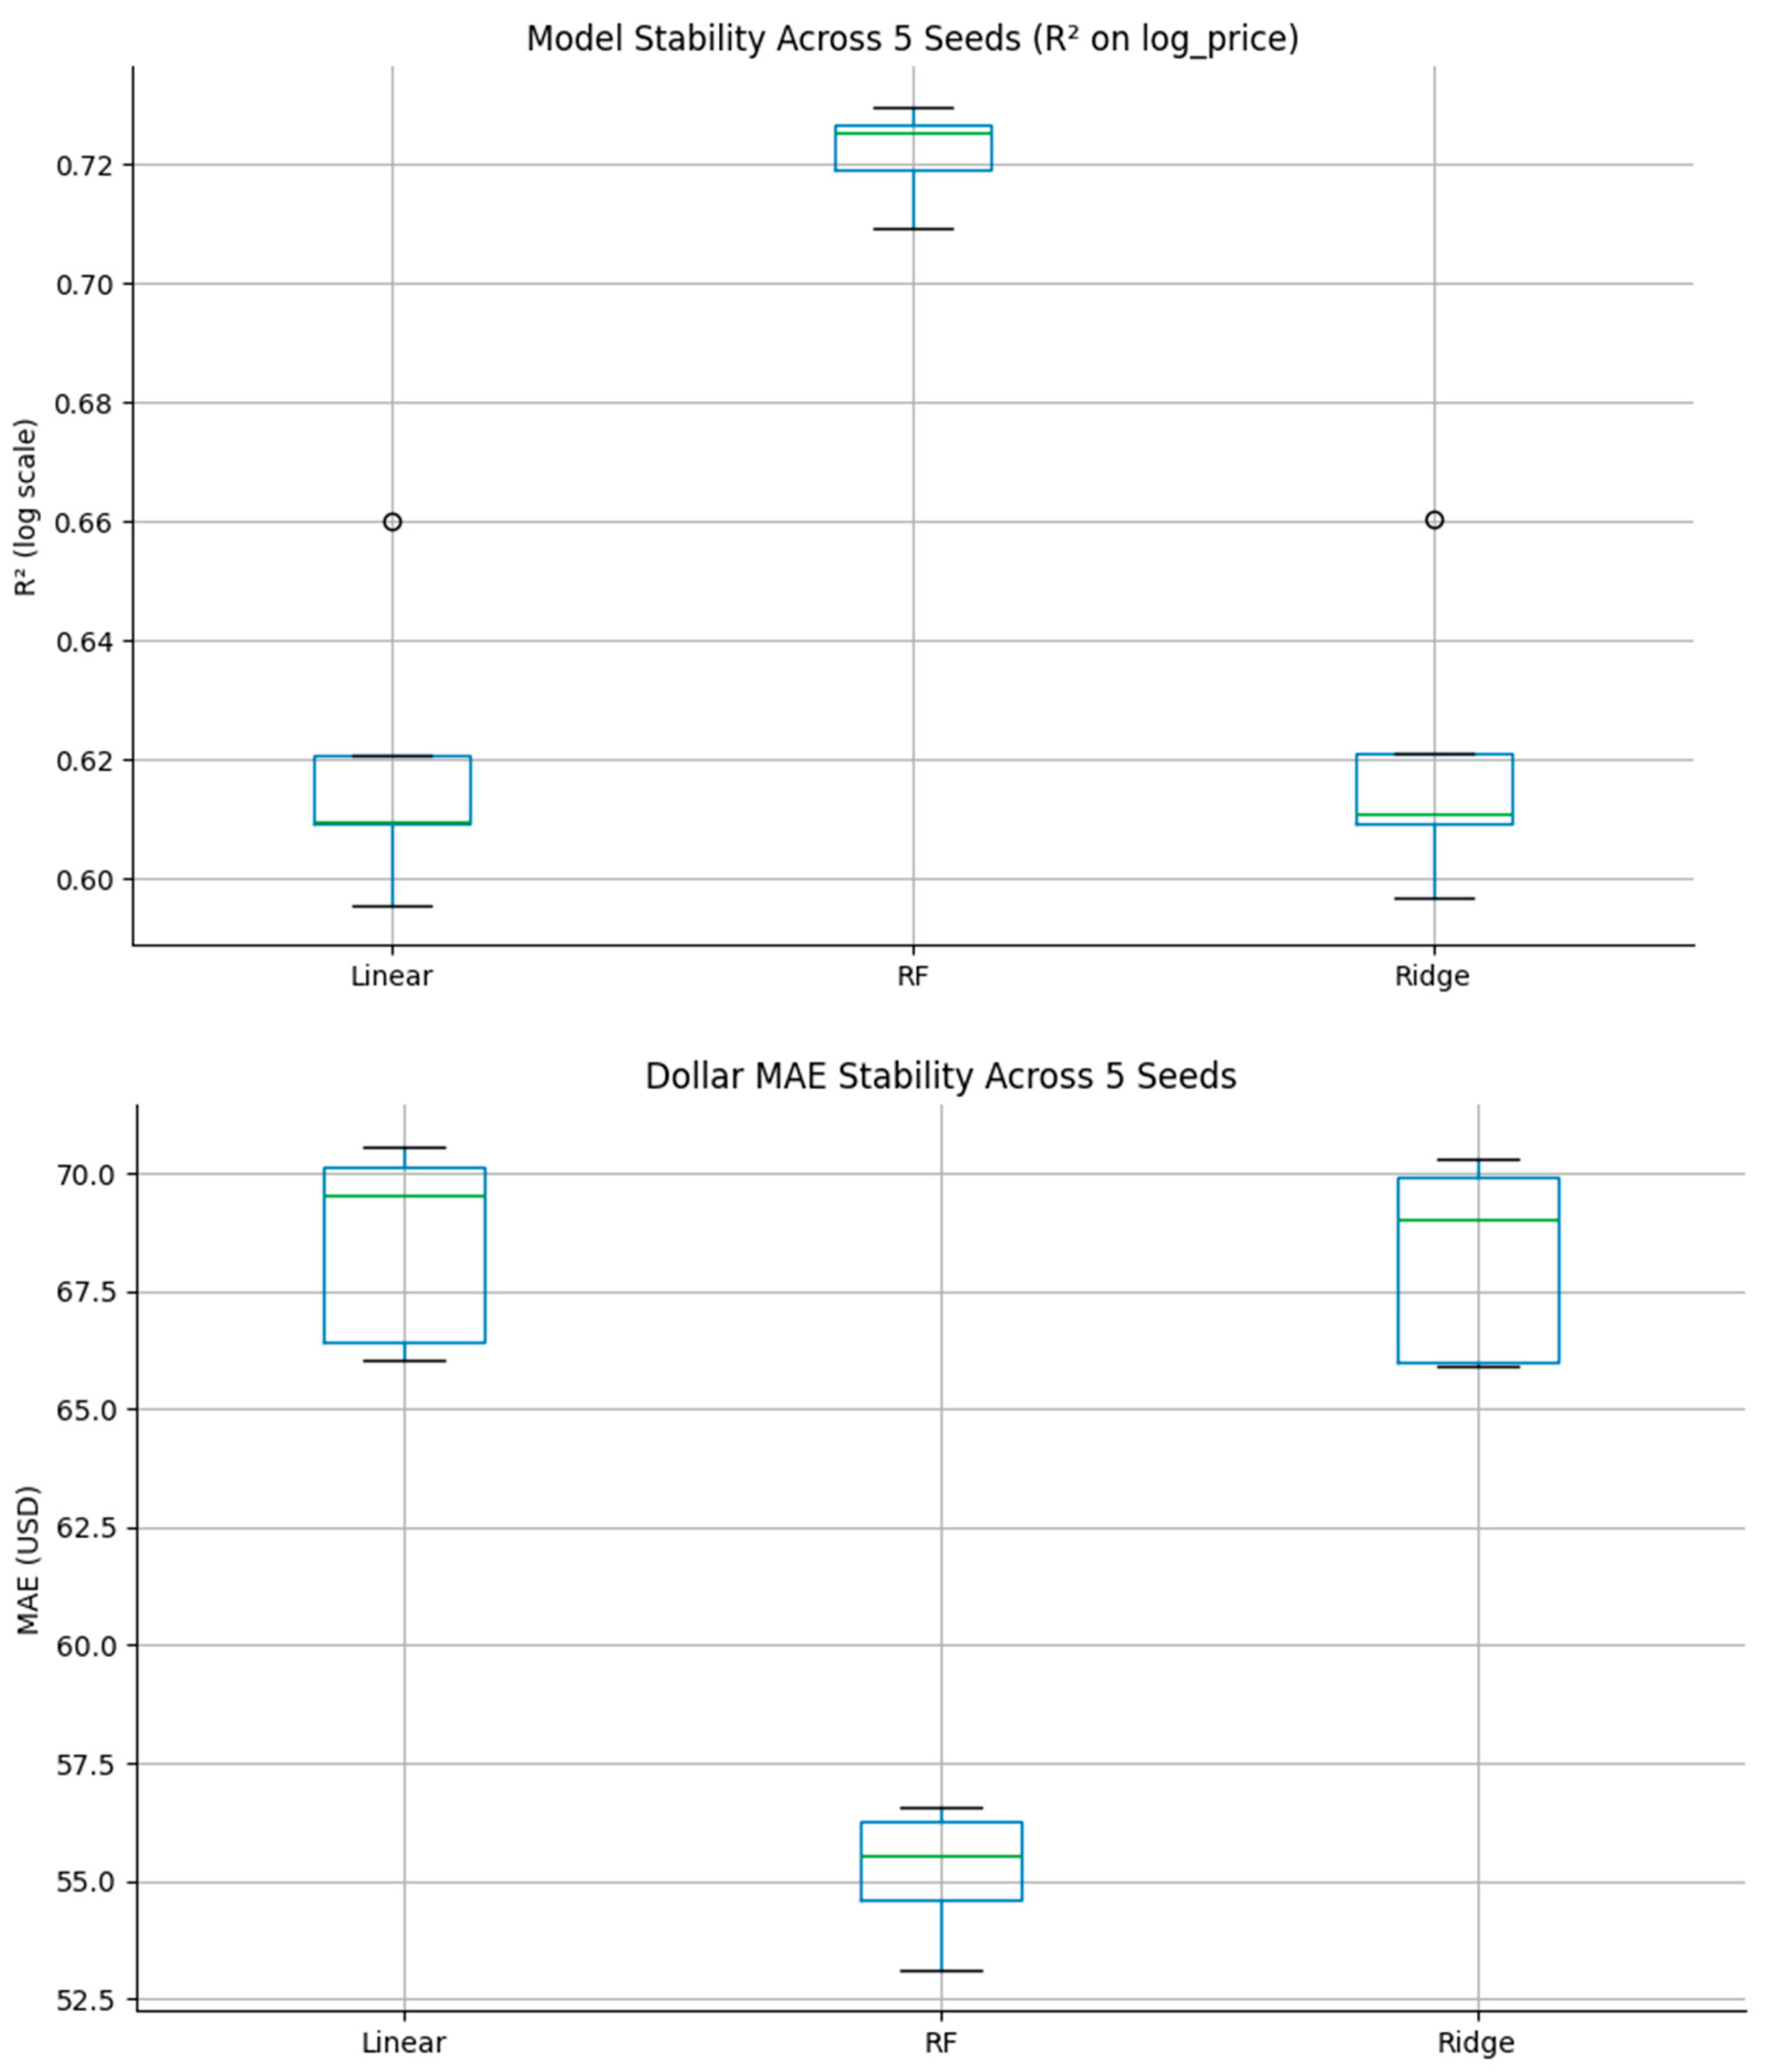
Figure 3.
Top Ten Predictors of Airbnb Listing Price According to the Random Forest Model.
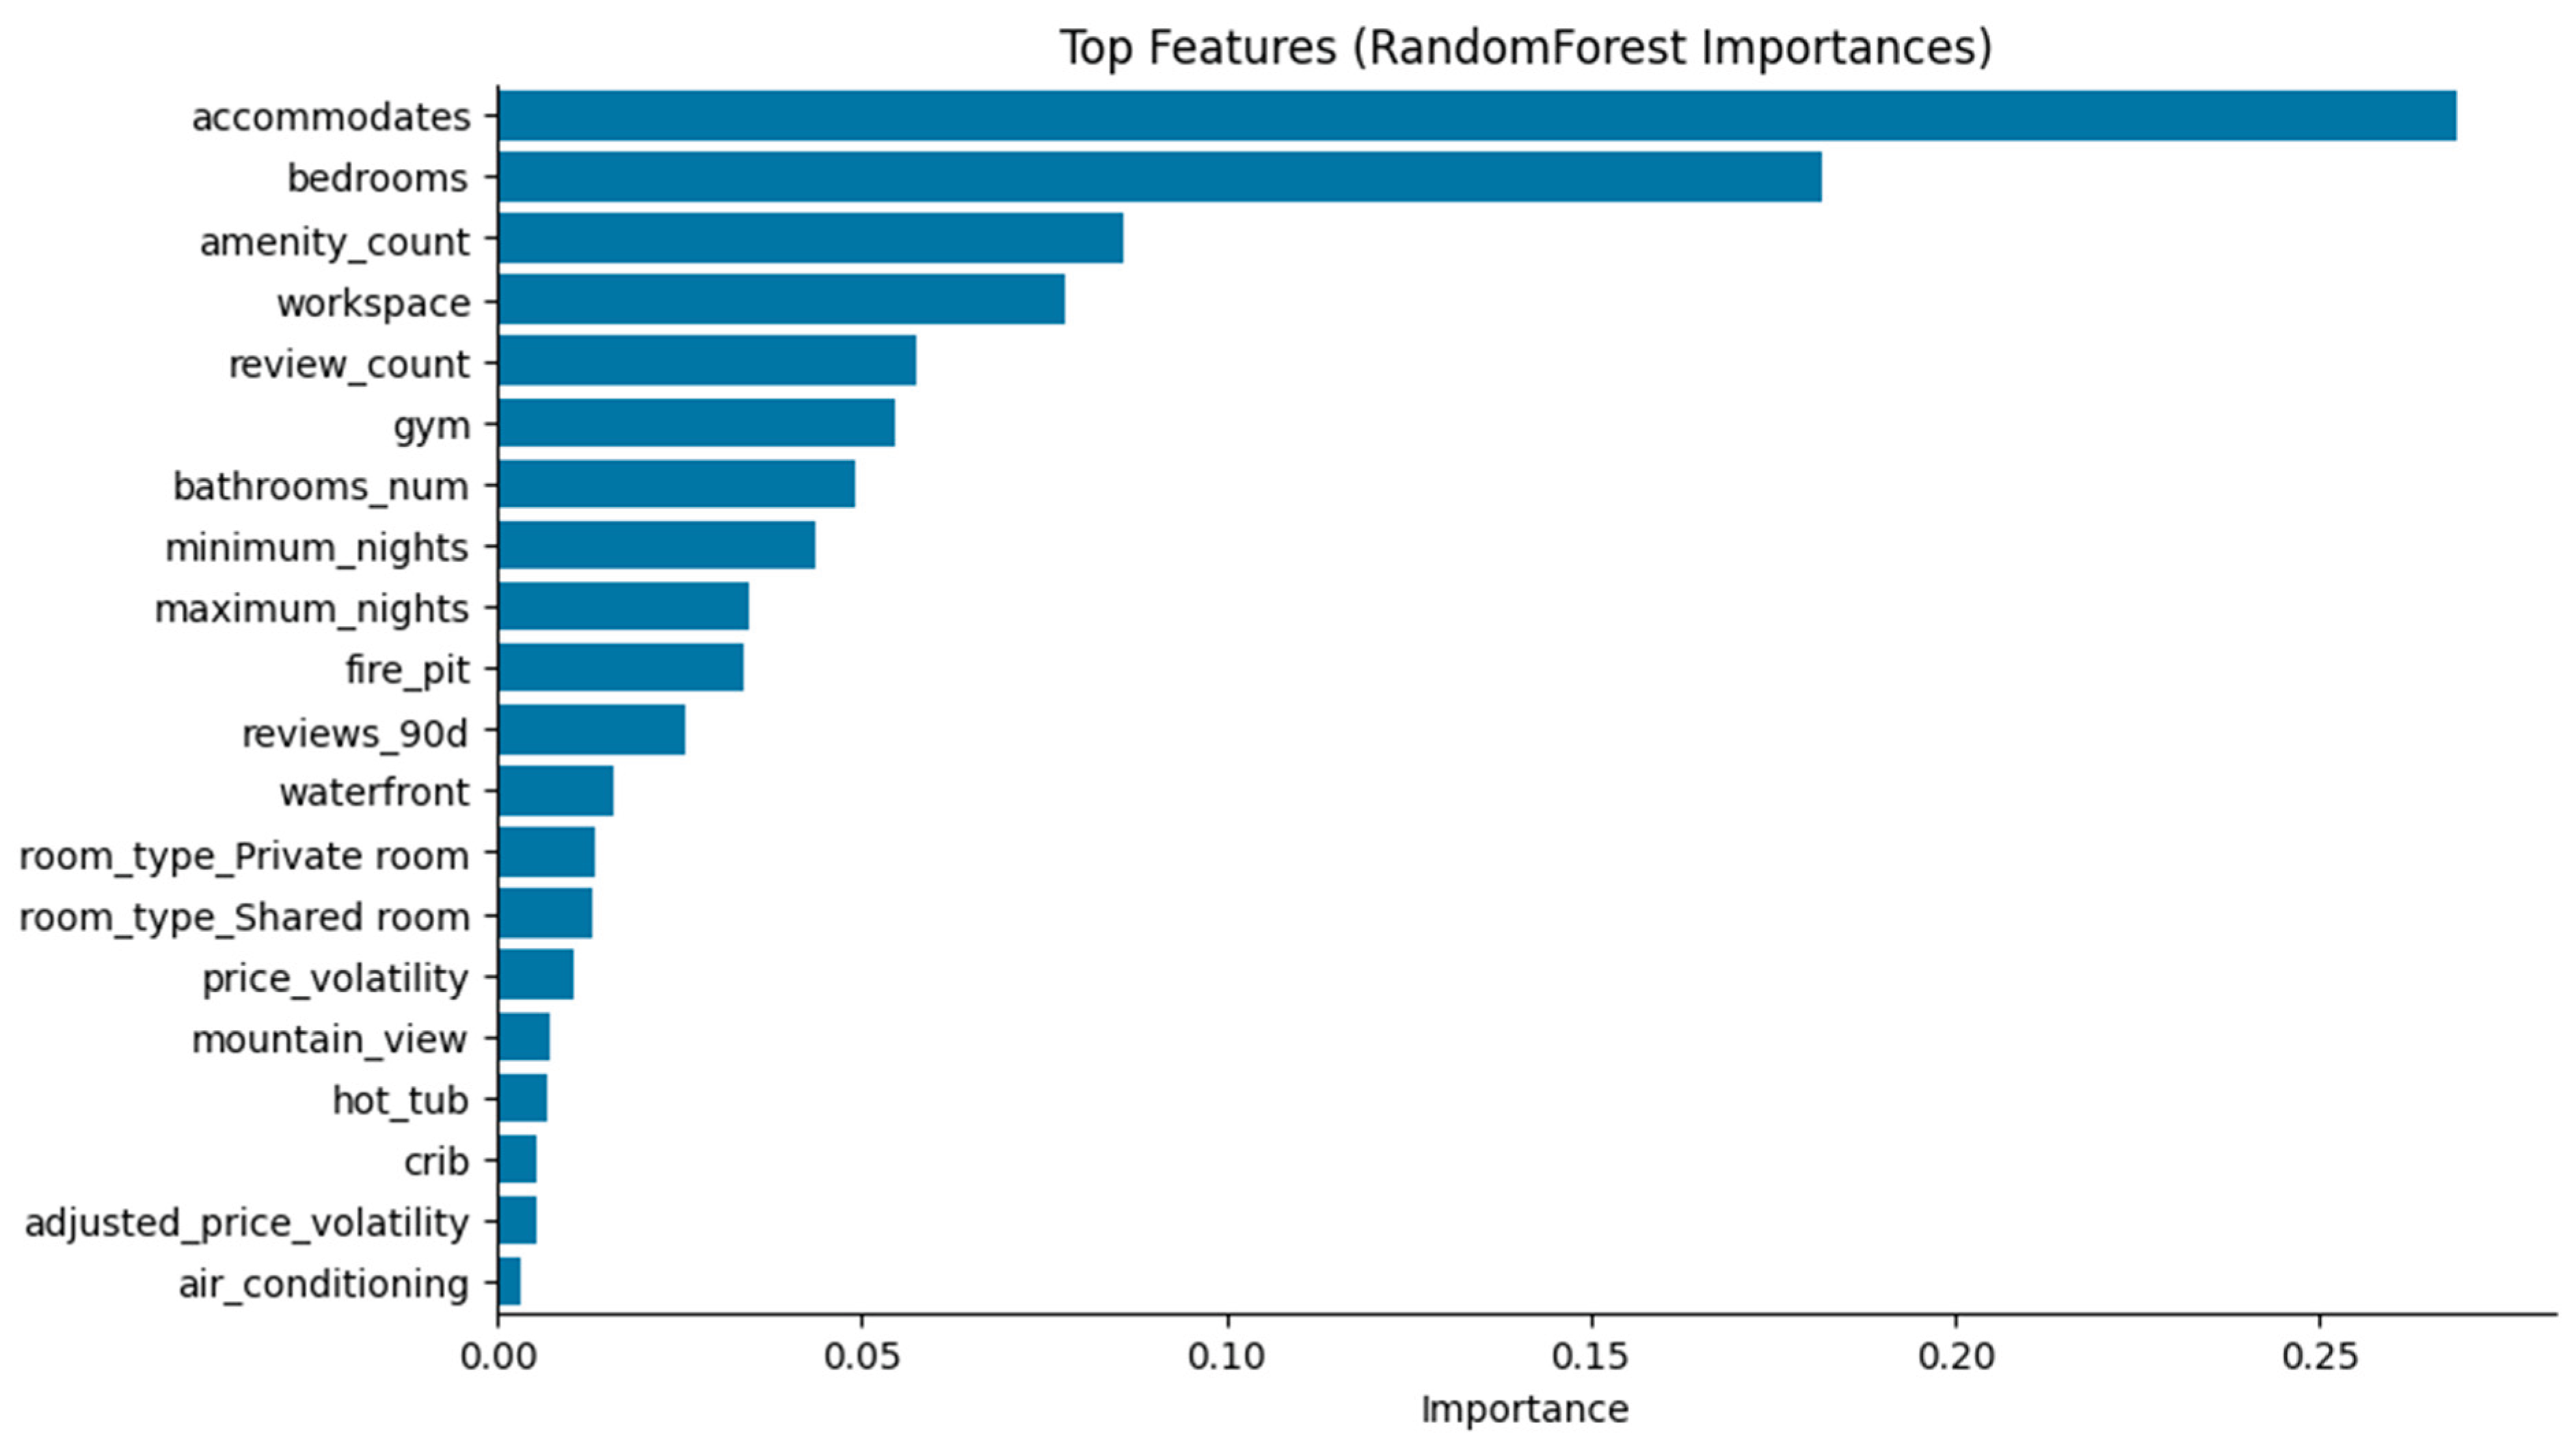

Table 1.
Comparison of Key Airbnb Price-Prediction Studies.
| Study | City / Dataset | Model(s) | Distinctive Features |
| Oskam & Boswijk (2016) | Amsterdam | OLS | Structural + locational |
| Gunter & Önder (2018) | Vienna | Spatial econometric | Neighborhood density, demand effects |
| Teubner et al. (2017) | Multi-city (Germany) | Hedonic / Regression | Reputation and trust factors |
| Wang & Nicolau (2017) | 33 cities | Linear regression | Amenity + capacity dominant |
| Alharbi (2023) | Barcelona | GBM + sentiment | Textual sentiment features |
| Camatti et al. (2024) | Netherlands | AI vs traditional | Explainability focus |
| Present Study (2025) | Seattle | Linear, Ridge, RF | Multi-seed validation |
Table 2.
Model performance comparison (test set results).
| Model | log MAE | log RMSE | R² | MAE ($) | RMSE ($) |
| Linear Regression | 0.283 | 0.370 | 0.637 | $63 | $152 |
| Ridge Regression | 0.283 | 0.370 | 0.637 | $62 | $147 |
| Random Forest Regressor | 0.235 | 0.321 | 0.726 | $51 | $91 |
Disclaimer/Publisher’s Note: The statements, opinions and data contained in all publications are solely those of the individual author(s) and contributor(s) and not of MDPI and/or the editor(s). MDPI and/or the editor(s) disclaim responsibility for any injury to people or property resulting from any ideas, methods, instructions or products referred to in the content. |
© 2025 by the authors. Licensee MDPI, Basel, Switzerland. This article is an open access article distributed under the terms and conditions of the Creative Commons Attribution (CC BY) license (http://creativecommons.org/licenses/by/4.0/).
Copyright: This open access article is published under a Creative Commons CC BY 4.0 license, which permit the free download, distribution, and reuse, provided that the author and preprint are cited in any reuse.


