
Submitted:
06 October 2025
Posted:
06 October 2025
You are already at the latest version
Abstract
Background/Objectives: Appropriate biomarkers are necessary for early diagnosis and multidisciplinary treatment of pancreatic ductal adenocarcinoma (PDAC). In recent years, the effectiveness of circulating tumor cells (CTCs) as biomarkers for various cancers has been reported; however, their detection rate in PDAC remains low, and sufficient evidence are not yet established. CTC detection methods with high reliability and performance are essential for clarifying the importance of CTCs in patients with PDAC. Methods: A total of 5 mL peripheral blood samples were collected from 38 patients newly diagnosed with PDAC and 17 healthy controls. Negative enriched cells were immunoflu-orescently stained with EpCAM-phycoerythrin and cell surface vimentin-fluorescein isothiocyanate(CSV). Images were automatically captured using an all-in-one fluorescence microscope. Cellular regions were detected from the captured images and the average lu-minance of the cellular regions was calculated. A total of 9086 and 1071 cell images were obtained from patients with PDAC and healthy controls, respectively. Results: In the Ep-CAM assay, a threshold that included 95% of healthy individuals was optimal for distin-guishing patients with PDAC from healthy controls, with a sensitivity, specificity, and AUC of 0.74, 0.76, and 0.84, respectively. At this threshold, the CTC-positivity rate in pa-tients with PDAC was 76.3%. Conversely, the CSV assay failed to demonstrate a valid threshold to distinguish patients with PDAC from healthy controls. No significant differ-ences were found between CTC and clinicopathological features among patients with PDAC. Conclusions: This method using high resolution image scanning has the potential to identify CTCs with greater objectivity by quantifying cell luminance values.
Keywords:
high resolution image scanning
; circulating tumor cells
; negative enrichment
; pancreatic ductal adenocarcinoma
; liquid biopsy
1. Introduction
Pancreatic ductal adenocarcinoma (PDAC) is the fourth leading cause of cancer-related death, with a dismal prognosis and an approximate 5-year survival rate of 9%. Due to the absence of early symptoms and effective screening, PDAC is often diagnosed at an advanced stage [1]. However, in the last decade, novel chemotherapeutic regimens, such as FOLFIRINOX and gemcitabine along with nab-paclitaxel (GnP), have incrementally improved the prognosis of patients with PDAC. In addition, multimodal treatment combining induction chemotherapy, surgery, and subsequent Chemoradiotherapy has begun to show promising results [2]. Appropriate biomarkers are essential for both early diagnosis and guiding multimodality treatment in PDAC. Frequently used biomarkers of PDAC include carcinoembryonic antigen, carbohydrate antigen 19-9 (CA19-9), pancreatic cancer-associated antigen Duke-PAN-2, and S-pancreas-1 antigen. Among these, CA19-9 is particularly valuable but has limitations in early diagnosis and in cases of obstructive jaundice, highlighting the need for more sensitive biomarkers [3]. Recently, circulating tumor cells (CTCs) have attracted attention as biomarkers for various cancers; CTCs are a rare subset of disseminated tumor cells in the bloodstream of patients with solid tumors, shed from primary tumors and considered pivotal for distant metastasis, with important oncological implications. As a form of liquid biopsy, CTCs have shown utility in various areas, including diagnosis, disease progression assessment, and therapeutic efficacy evaluation [4]. However, evidence from CTC studies in patients with PDAC remains lacking. Using CellSearch (Menarini Biosystems, IT), the only FDA-approved and currently gold standard method for CTC detection, the detection rate of CTCs in patients with PDAC is low, ranging from 7–48%, which is the lowest among solid tumors [5,6]. To clarify the importance of CTCs in patients with PDAC, establishing a reliable and high-performance method for CTC detection is essential. The workflow of CTC research is divided into two stages, namely enrichment and identification. Selecting an appropriate method based on the tumor characteristics and the study objectives proves important. CTC enrichment methods using immunomagnetic separation are broadly classified into positive and negative enrichment methods. Positive enrichment provides high purity but lower recovery rates, while negative enrichment offers higher recovery rates but with reduced purity. The inverse relationship between purity and recovery is a critical factor in selecting an appropriate enrichment method. For cancers such as PDAC, negative enrichment may be effective for enhancing CTCs recovery. However, even with improved recovery rates, identifying CTCs from low-purity populations proves difficult, which remains a major challenge for downstream analysis. After enrichment, only a small fraction of the hundreds to thousands of cells are likely CTCs, making accurate identification challenging even for an experienced pathologist, which can be time consuming, and the accuracy of identification cannot be guaranteed [7]. Negative enrichment requires efficient and objective CTC identification for downstream analysis. High-resolution image scanning offers excellent objectivity and is promising for this purpose, with the potential advancements from recent progress in artificial intelligence [8,9,10]. These technologies hold promise for improving CTC separation efficiency, reducing costs, and enhancing detection sensitivity and accuracy. However, currently, no studies have applied high-resolution image scanning for CTC analysis in patients with PDAC, and standardized criteria and methodology for CTC identification remain unclear, necessitating further fundamental research. In this study, we propose a method to identify CTCs in patients with PDAC by quantifying antigenic marker expression in negatively enriched cells using high-resolution image scanning.
2. Materials and Methods
2.1. Patient Recruitment and Sample Collections
This study was approved by the Ethical Review Board of Toyama University Hospital (R2021061) and conducted in accordance with the Declaration of Helsinki. Written informed consent was obtained from all the participants. Peripheral blood samples were collected from 38 patients newly diagnosed with PDAC and 17 healthy controls. Patient samples were collected between January 2023 and December 2023. The eligibility criteria for patients were i) pathologically confirmed by endoscopic ultrasound-fine needle aspiration, ii) no PDAC treatment prior to enrollment, and iii) no history of synchronous double cancers. The healthy controls had no history of malignant disease. All patients with PDAC were staged using abdominal enhanced computed tomography, enhanced magnetic resonance imaging, and staging laparoscopy. The tumor-node-metastasis staging system for pancreatic tumors in the 8th edition of the Union for International Cancer Control (UICC) was applied [11].
2.2. Sample Collection and CTC Enrichment
Blood samples were collected in 5 mL ethylenediaminetetraacetic acid tubes. Samples were processed within 4 h of collection. Peripheral blood was subjected to CD45 depletion using the RossetteSep™ kit (StemCell Technologies, Vancouver, Canada) according to the manufacturer’s instructions. After RBC lysis using BD Pharm Lyse ™ lysing solution (Becton, Dickinson and Company, New Jersey, USA) and fixation with 4% paraformaldehyde, enriched cells were stained using manual immunofluorescence with EpCAM-phycoerythrin (clone REA764; MACS Miltenyi Biotec, Cologne, Germany) and cell surface vimentin-fluorescein isothiocyanate(CSV) (clone 84-1; ABNOVA, Taipei, Taiwan). Nuclei were stained with 4′, 1, 6′- diamidino-2-phenylindole (DAPI) (Thermo Fisher, Massachusetts, USA). The stained cells were transferred to microscope slides and prepared for imaging (Figure 1a).
2.3. High-Resolution Image Scanning and Image Processing
Images were automatically captured using an all-in-one fluorescence microscope (BZ-X800, KEYENCE, Osaka, Japan) through a Plan Apochromat 20x objective (NA0.75, BZ-PA20, KEYENCE, Osaka, Japan) with a Z-step size of 5 μm. Red fluorescence was detected with a TRITC filter (ex: 545/25 nm, em: 605/70 nm, dichroic: 565 nm; OP-87764, KEYENCE, Osaka, Japan) at 1/20 s exposure time. Green fluorescence was detected with a GFP filter (ex: 470/40 nm, em: 525/50 nm, dichroic: 495 nm, OP-87763; KEYENCE, Osaka, Japan) at 1/15 s exposure time. Blue fluorescence was detected using a DAPI-V filter (ex: 395/25 nm, em: 460/50 nm, dichroic: 425 nm, OP-88359; KEYENCE, Osaka, Japan) with an exposure time of 1/250 s. The image-stacking function of the BZ-X Analyzer software (BZ-H4A, KEYENCE, Osaka, Japan) was used to stitch the captured images (Figure 1b). The captured images were subsequently processed using an algorithm developed in cooperation with the Department of Mechanical and Intellectual Systems Engineering, Faculty of Engineering, University of Toyama [8]. This process consists of two steps: (1) detection of cellular regions and (2) calculation of the average luminance of the cellular regions (Figure 1c).
2.3.1. Detection of Cellular Regions
DAPI-expressing regions in the captured image were converted to grayscale, and the foreground regions were extracted using binarization. After removing the noise by a closing process that performs three expansions and three contractions, the cell regions were extracted using the watershed transformation. Excluding non-cellular images (debris and optical noise) from the detected cellular regions is necessary. A proprietary machine-learning algorithm trained on an annotation library containing approximately 10,000 cell and non-cellular images assisted in the sorting of cell and non-cellular (e.g., debris, optical noise) regions. The selected images were submitted to trained reviewers, and only cell images were used for luminance analysis.
2.3.2. Calculation of the Average Luminance of Cellular Regions
To minimize the effects of differences in staining conditions and nonspecific luminescence in each image, the background average luminance uniformity was performed for each cell image. The EpCAM and CSV images of the extracted cell regions were grayscale and binarized, respectively. The foreground regions were extracted, the luminance of each image was measured, and the luminance average was calculated.
2.4. Threshold Settings
A dataset of 10 randomly selected healthy controls was used to set the thresholds. EpCAM and CSV luminance were measured for the detected cells, and the thresholds were set to include 99%, 95%, and 90% of all the cells for both EpCAM and CSV.
2.5. Statistical Analysis
Correlations between CTC counts and clinicopathological data were analyzed using Fisher exact tests or chi-square, and Mann–Whitney U test. Receiver Operating Characteristics (ROC) analysis was performed to evaluate areas under the curve (AUC), sensitivity (SN), specificity (SP), positive predictive values, and negative predictive values. The optimal cut-off value was determined according to the maximum value of the Youden J index. All statistical analyses were performed using JMP Pro ver.17 (SAS Institute, Cary, NC, USA). A two-sided p value < 0.05 was considered significant.
3. Results
3.1. Acquisition of Cell Images and Measurement of Luminance
We obtained 9086 and 1071 cell images from 38 patients with PDAC and healthy controls, respectively. Of these, luminance was measured for both EpCAM and CSV (Supplementary Figure 1). In the EpCAM assay, the mean luminance was 16.1 (4.2–227.3) for the patient with PDAC and 16.3 (2.7-197.1) lumens for the healthy control groups, with no significant difference (p = 0.689). In the CSV assay, the average was 29.4 (6.6–237.0) and 34.4 (8.4–221.0) lumens in the patient with PDAC and healthy control groups, respectively, with a significant difference (p <0.0001).
3.2. Setting Thresholds and Counting CTC Candidate Cells at Each Threshold
The luminance threshold was determined using 336 images from 10 randomly selected healthy controls. For EpCAM, the luminance threshold to include 99% of the cells in the healthy controls was 84.3 lumens, 34.5 lumens for 95% of the cells, and 28.0 lumens for 90% of the cells. For CSV, the luminance thresholds to include 99%, 95%, and 90% of the cells were 165.4, 109.4, and 91.0 lumens, respectively. Hereafter, the respective luminance thresholds are referred to as EpCAM (99) and CSV (95). Cells exceeding each threshold were counted from 38 patients with PDAC and seven healthy controls in the test set (Supplementary Table 1 and Figure 2). For the EpCAM assay, the detection rates in patients with PDAC were 50.0%, 86.8%, and 92.1% for the EpCAM (99), EpCAM (95), and EpCAM (90) thresholds, respectively, and the median number of cells detected was 0.5 (0–10), 3 (0–19), and 4.5 (0–79). In contrast, the corresponding detection rates in healthy controls were 28.6%, 42.9%, and 57.1%, respectively, with a median number of cells detected of 0 (0–2), 0 (0–3), and 1 (0–10). A significant difference was observed in the number of cells detected between patients with PDAC and healthy controls using the thresholds of EpCAM (95) (p = 0.0056) and EpCAM (90) (p = 0.037) (Figure 3abc). In the CSV assay, the detection rates in patients with PDAC were 42.1%, 63.2%, and 73.7% for thresholds of CSV (99), CSV (95), and CSV (90), respectively, and the median number of cells detected was 0 (0–6), 1 (0–12), and 1 (0–12). In contrast, the detection rates in healthy controls were 28.6%, 57.1%, and 71.4%, and the median number of cells detected was 0 (0–1), 1 (0–4), and 1 (0–4), respectively (Figure 3d, e, and f). No significant differences were observed in the number of cells detected between patients with PDAC and healthy controls at any threshold.
3.3. Setting Optimal Thresholds and Distributions of CTCs in Patients with PDAC
At each threshold, ROC curves and AUC analyses were performed to assess the diagnostic ability to distinguish patients with PDAC from healthy controls. Moreover, we compared the AUC for each threshold value using the Delong test (Figure 4 and Table 1). EpCAM (95) was the most suitable threshold to distinguish patients with PDAC from healthy controls, with a SN of 0.74 and SP of 0.76, using a cutoff value of 2 cells/5 mL, according to the Youden index. The comparison of the AUCs showed that the performance of EpCAM (95) was significantly superior to that of EpCAM (99), CSV (99), CSV (95), and CSV (90) (AUC EpCAM (95) = 0.84, Delong test p-value vs. EpCAM (99) = 0.0002, Delong test p-value vs. CSV(99) = 0.0002, Delong test p-value vs. CSV(95) = 0.0201, Delong test p-value vs. CSV (90) = 0.0021, respectively). We defined CTCs as cells with luminance higher than that of the threshold EpCAM (95) and investigated the association between CTCs and clinicopathological data in patients with PDAC. The number of CTCs showed no significant differences between early (stage I–II) and advanced (stage III–IV) patients, regardless of CY-positivity or tumor size (Figure 5). The positivity rate was 76 .3% (29/38) using a cut-off value of 2 cells/5 mL. The positive rates of CTC did not correlate with age, sex, tumor location, TNM stage, CY, or tumor size (Table 2).
4. Discussion
In this study, we analyzed CTCs in patients with PDAC using a combination of negative enrichment and high-resolution image scanning. High-resolution image scanning offers an objective approach to assessing CTCs by quantifying cell luminance values. This method has the potential to detect not only CTCs with high EpCAM expression, as captured by conventional techniques, but also those with low EpCAM expression. Using high-resolution image scanning, we attempted to estimate the luminance range in which CTCs were present by quantifying the luminance values of the cells and comparing them to those of healthy controls. EpCAM is expressed in most epithelial malignancies and 94% of pancreatic cancer tissues. However, variation exists in EpCAM expression, with only approximately 50% of all pancreatic cancers showing high EpCAM expression [12]. Variation in EpCAM expression is expected not only in pancreatic cancer tissues but also in CTCs. In fact, a large variation in EpCAM expression has been reported in CTCs of patients with prostate cancer, with differences observed both between patients and within individual patients [13]. CellSearch may limit CTC detection rate in patients with PDAC due to its inability to detect CTCs lacking EpCAM expression as well as those with low EpCAM expression [14]. The detection rate of CTCs in patients with PDAC using CellSearch is low, ranging from 7–48% [5]. Consequently, research on CTC in this population has lagged behind that in other cancer types, such as breast, prostate, and colorectal cancers. Consequently, the challenge in CTC research is to detect CTCs across a broad range of variations, including those with low EpCAM expression, and to identify new surface antigens as alternatives to EpCAM. A quantitative evaluation of surface antigens would be beneficial for detecting CTCs with varying expression levels; however, few studies have quantitatively measured these surface antigens [13,15], and reports on high-resolution image scanning are lacking. This imaging technique allows for the quantitative evaluation of surface antigen marker expression levels by mapping and averaging cell luminance. Background adjustments were implemented to correct for differences associated with the staining technique, followed by the calculation of luminance values. After quantifying the luminance values of the cell surface antigens, estimating the luminance range indicative of CTC presence is necessary. Three thresholds for each antibody were established using the dataset from healthy control patients, and the luminance range in which CTCs were present was estimated by comparing the test sets of patients with PDAC and healthy controls. Using EpCAM (99) as the luminance threshold, the detection rate was approximately 50%, which is nearly identical to that of conventional methods, such as CellSearch, which can only detect CTCs with high EpCAM expression. The luminance thresholds for EpCAM (95) and EpCAM (90) were estimated as the lower limit of the presence of EpCAM-positive CTCs, revealing that EpCAM-positive CTCs vary from high to low expression, even in patients with PDAC. We also investigated CSV as an alternative CTC marker for EpCAM. CSV as an EMT marker has been reported to be useful in identifying mesenchymal CTCs in PDAC [16]. Some studies report that CSV outperforms EpCAM in detection rates for PDAC [17], while others indicate that CSV is less effective than EpCAM and that no CTCs exhibit only mesenchymal surface antigen [18,19,20]. A common challenge in CTC studies is the difficulty in comparing results due to variations in detection and identification methods and differences in patient backgrounds, such as tumor stage. Therefore, it remains controversial whether CSVs are more effective than EpCAM, or merely serve as complementary markers. In our study, we were unable to establish a reliable CSV threshold to differentiate patients with PDAC from healthy controls. This could be attributed to a low CSV positivity rate in patients with PDAC, a narrow luminance range for CSV positivity, or a high false-positive rate in healthy controls. Increasing the number of cellular images from patients with PDAC and healthy controls might help improve detection accuracy. Nevertheless, the clinical significance of both epithelial and mesenchymal CTCs is intriguing and warrants further investigation. In this study, the detection rate in patients with PDAC was 76.8% (cutoff: ≥2 CTCs), and the number of CTCs proved useful in differentiating patients with PDAC from healthy controls (AUC=0.84; SN=0.74; SP=0.76, using a cutoff of 2 cells/5 mL). Previous studies examining the diagnostic performance of CTCs reported AUCs ranging from 0.83 to 0.85, similar to this study [21,22,23]. An important factor that improves the prognosis of PDAC is early diagnosis of CTCs, which were detected in 12 out of 16 patients (75%) with resectable early-stage PDAC using a cutoff value of 2 cells/5 mL, suggesting that CTCs may serve as a valuable biomarker for early PDAC detection. As current PDAC diagnosis relies on imaging and advanced endoscopic methods, establishing accessible liquid biopsy could potentially improve patient outcomes. To our knowledge, no studies have reported the usefulness of CTC in the early detection of PDAC; future large-scale studies are needed to validate their potential. We did not find any association between the clinicopathological background and CTCs. Notably, staging laparoscopy and washing cytology were performed in all patients with PDAC without overt distant metastases, revealing no association between CY-positivity and CTC or other distant metastases [24]. The association between the clinicopathological background and CTCs in patients with PDAC remains unclear. Court et al. reported an association between the number of CTCs and PDAC Stage [25], while Bissolati et al. and Okubo et al. reported higher CTC positivity in cases with distant metastases [26,27]. However, many other studies have failed to show an association between clinicopathological background and CTC. In general, CTC positivity, similar to other malignancies, may be associated with an unfavorable prognosis in patients with PDAC C5 [28]. Variations in CTC detection methods and rates across studies complicate comparative assessments. Future studies will benefit from a standardized, efficient detection method capable of differentiating CTCs by subset, such as epithelial and mesenchymal. Immunological staining offers a straightforward and suitable approach for evaluating CTC counts compared to mRNA or DNA mutation analysis and is most appropriate when evaluating the number of CTCs. While more reliable than other methods, this approach is time-consuming, and yields inconsistent evaluations even among experts [7]. To enhance objectivity and efficiency, we employed high-resolution image scanning with conventional machine learning for CTC analysis. Although the method offers greater objectivity in CTC identification, it relies on manual input and is not yet a fully comprehensive analytical method. Deep learning (DL), which has advanced considerably in recent years, aligns well with image analysis and promises to enable comprehensive automated CTC analysis in the future. Studies applying DL to CTC models using cell lines have demonstrated its accuracy and efficiency in CTC analysis [8,10]. Although the possibility of using DL to identify CTCs in the future is not debatable, a substantial gap remains between analyses based on cell lines and those involving actual patient blood. There is a crucial difference between cell lines, where sufficient quantities and accurate annotations are guaranteed, and CTCs, which typically involve low cell counts and limited information. In addition, inter-observer variability in CTC annotation can complicate the immediate implementation of DL into CTC analysis. Overcoming these challenges will usher CTC research into a new era.
This study has certain limitations, including its single-center design and limited sample size. In addition, the molecular biology of CTCs was not analyzed in this study. Further clinical data and molecular biological analysis are needed to validate our results.
5. Conclusions
This study demonstrated that a novel CTC detection method, combining high-resolution image scanning with negative enrichment, enables objective quantification of antigen expression and improves the CTC detection rate in patients with PDAC. These findings suggest that this method has potential as a reliable biomarker for the diagnosis of PDAC. Further large-scale, multicenter studies are warranted to validate its clinical utility and to explore its application in patient stratification and treatment monitoring.
6. Patents
The authors declare that there are no patents resulting from the work reported in this manuscript.
Supplementary Materials
The following supporting information can be downloaded at the website of this paper posted on Preprints.org, Figure S1: Luminance was measured for both EpCAM and CSV; Table S1: Number of candidate CTCs at each threshold in patients with PDAC and controls.
Author Contributions
Conceptualization, Takahiro Manabe, Tomoyuki Okumura and Kenji Terabayashi; Data curation, Takahiro Manabe, Takahisa Akashi, Akane Yamada, Yusuke Kishi, Kisuke Tanaka, Tatsuhiro Araki, Naoya Takeda, Kosuke Mori, Nana Kimura, Yoshihisa Numata, Tomohiro Minagawa, Takeshi Miwa, Toru Watanabe, Katsuhisa Hirano, Shinichi Sekine, Isaya Hashimoto, Kazuto Shibuya, Isaku Yoshioka and Koshi Matsui; Formal analysis, Kenji Terabayashi and Teo Rui; Funding acquisition, Tomoyuki Okumura; Investigation, Takahiro Manabe, Teo Rui, Akane Yamada, Yusuke Kishi and Kisuke Tanaka; Methodology, Takahiro Manabe and Kenji Terabayashi; Project administration, Tomoyuki Okumura; Resources, Tatsuhiro Araki, Naoya Takeda, Kosuke Mori, Nana Kimura, Yoshihisa Numata, Tomohiro Minagawa, Takeshi Miwa, Toru Watanabe, Katsuhisa Hirano, Shinichi Sekine, Isaya Hashimoto, Kazuto Shibuya, Isaku Yoshioka and Koshi Matsui; Supervision, Tomoyuki Okumura, Kenji Terabayashi, Tohru Sasaki and Tsutomu Fujii; Writing—original draft, Takahiro Manabe; Writing—review & editing, Tomoyuki Okumura, Takahisa Akashi, Tohru Sasaki and Tsutomu Fujii. All authors have read and agreed to the published version of the manuscript.
Funding
This research was funded by JSPS KAKENHI, grant numbers 21K08729 and 24K11844.
Institutional Review Board Statement
The study was conducted in accordance with the Declaration of Helsinki, and approved by the Ethics Review Board of TOYAMA UNIVERSITY HOSPITAL (R2021061, approved on 14 July 2021).
Informed Consent Statement
Informed consent was obtained from all subjects involved in the study. The patients have provided written informed consent for publication of the data in this manuscript.
Data Availability Statement
The datasets used and/or analyzed during the current study are not publicly available due to individual participants’ privacy but are available from the corresponding author on reasonable request.
Acknowledgments
We are grateful to Mr. Kenji Terabayashi of Department of Mechanical and Intellectual Systems Engineering, Faculty of Engineering, University of Toyama, for their assistance with the experiment.
Conflicts of Interest
The authors declare no conflicts of interest.
Abbreviations
The following abbreviations are used in this manuscript:
| PDAC | Pancreatic ductal adenocarcinoma |
| CTC | Circulating tumor cells |
| CSV | Cell surface vimentin |
| UICC | Union for International Cancer Control |
| DAPI | 4′, 1, 6′- diamidino-2-phenylindole |
| ROC | Receiver Operating Characteristics |
| AUC | Areas under the curve |
| SN | Sensitivity |
| SP | Specificity |
| DL | Deep learning |
References
- Siegel, R.L.; Miller, K.D.; Jemal, A. Cancer statistics, 2019. CA Cancer J Clin 2019, 69, 7–34. [Google Scholar] [CrossRef] [PubMed]
- Igarashi, T.; Yamada, S.; Hoshino, Y.; Murotani, K.; Baba, H.; Takami, H.; Yoshioka, I.; Shibuya, K.; Kodera, Y.; Fujii, T. Prognostic factors in conversion surgery following nab-paclitaxel with gemcitabine and subsequent chemoradiotherapy for unresectable locally advanced pancreatic cancer: Results of a dual-center study. Ann Gastroenterol Surg 2023, 7, 157–166. [Google Scholar] [CrossRef]
- Kanda, M.; Fujii, T.; Takami, H.; Suenaga, M.; Inokawa, Y.; Yamada, S.; Nakayama, G.; Sugimoto, H.; Koike, M.; Nomoto, S.; et al. Combination of the serum carbohydrate antigen 19–9 and carcinoembryonic antigen is a simple and accurate predictor of mortality in pancreatic cancer patients. Surg Today 2014, 44, 1692–1701. [Google Scholar] [CrossRef]
- Cabel, L.; Proudhon, C.; Gortais, H.; Loirat, D.; Coussy, F.; Pierga, J.Y.; Bidard, F.C. Circulating tumor cells: Clinical validity and utility. Int J Clin Oncol 2017, 22, 421–430. [Google Scholar] [CrossRef] [PubMed]
- Yeo, D.; Bastian, A.; Strauss, H.; Saxena, P.; Grimison, P.; Rasko, J.E.J. Exploring the clinical utility of pancreatic cancer circulating tumor cells. Int J Mol Sci 2022, 23, 1671. [Google Scholar] [CrossRef] [PubMed]
- Allard, W.J.; Matera, J.; Miller, M.C.; Repollet, M.; Connelly, M.C.; Rao, C.; Tibbe, A.G.J.; Uhr, J.W.; Terstappen, L.W.M.M. Tumor cells circulate in the peripheral blood of all major carcinomas but not in healthy subjects or patients with nonmalignant diseases. Clin Cancer Res 2004, 10, 6897–6904. [Google Scholar] [CrossRef]
- Svensson, C.M.; Hübler, R.; Figge, M.T. Automated classification of circulating tumor cells and the impact of Interobsever variability on classifier training and performance. J Immunol Res 2015, 2015, 573165. [Google Scholar] [CrossRef]
- Akashi, T.; Okumura, T.; Terabayashi, K.; Yoshino, Y.; Tanaka, H.; Yamazaki, T.; Numata, Y.; Fukuda, T.; Manabe, T.; Baba, H.; et al. The use of an artificial intelligence algorithm for circulating tumor cell detection in patients with esophageal cancer. Oncol Lett 2023, 26, 320. [Google Scholar] [CrossRef] [PubMed] [PubMed Central]
- Zeune, L.L.; Boink, Y.E.; van Dalum, G.; Nanou, A.; de Wit, S.; Andree, K.C.; Swennenhuis, J.F.; van Gils, S.A.; Terstappen, L.W.M.M.; Brune, C. Deep learning of circulating tumour cells. Nat Mach Intell 2020, 2, 124–133. [Google Scholar] [CrossRef]
- Shen, C.; Rawal, S.; Brown, R.; Zhou, H.; Agarwal, A.; Watson, M.A.; Cote, R.J.; Yang, C. Automatic detection of circulating tumor cells and cancer associated fibroblasts using deep learning. Sci Rep 2023, 13, 5708. [Google Scholar] [CrossRef]
- Brierley, J.; Gospodarowicz, M.K.; Wittekind, C. TNM classification of malignant tumor; John Wiley & Sons, Inc.: Chichester, West Sussex, United Kingdom.
- Akita, H.; Nagano, H.; Takeda, Y.; Eguchi, H.; Wada, H.; Kobayashi, S.; Marubashi, S.; Tanemura, M.; Takahashi, H.; Ohigashi, H.; et al. Ep-CAM is a significant prognostic factor in pancreatic cancer patients by suppressing cell activity. Oncogene 2011, 30, 3468–3476. [Google Scholar] [CrossRef]
- Mentink, A.; Isebia, K.T.; Kraan, J.; Terstappen, L.W.M.M.; Stevens, M. Measuring antigen expression of cancer cell lines and circulating tumour cells. Sci Rep 2023, 13, 6051. [Google Scholar] [CrossRef]
- Nicolazzo, C.; Gradilone, A.; Loreni, F.; Raimondi, C.; Gazzaniga, P. EpCAM: low circulating tumor cells: Gold in the waste. Dis Markers 2019, 2019, 1718920. [Google Scholar] [CrossRef]
- Rao, C.G.; Chianese, D.; Doyle, G.V.; Miller, M.C.; Russell, T.; Sanders, R.A.; Terstappen, L.W.M.M. Expression of epithelial cell adhesion molecule in carcinoma cells present in blood and primary and metastatic tumors. Int J Oncol 2005, 27, 49–57. [Google Scholar] [CrossRef]
- Satelli, A.; Mitra, A.; Brownlee, Z.; Xia, X.; Bellister, S.; Overman, M.J.; Kopetz, S.; Ellis, L.M.; Meng, Q.H.; Li, S. Epithelial-mesenchymal transitioned circulating tumor cells capture for detecting tumor progression. Clin Cancer Res 2015, 21, 899–906. [Google Scholar] [CrossRef] [PubMed]
- Wei, T.; Zhang, X.; Zhang, Q.; Yang, J.; Chen, Q.; Wang, J.; Li, X.; Chen, J.; Ma, T.; Li, G.; et al. Vimentin-positive circulating tumor cells as a biomarker for diagnosis and treatment monitoring in patients with pancreatic cancer. Cancer Lett 2019, 452, 237–243. [Google Scholar] [CrossRef]
- Gemenetzis, G.; Groot, V.P.; Yu, J.; Ding, D.; Teinor, J.A.; Javed, A.A.; Wood, L.D.; Burkhart, R.A.; Cameron, J.L.; Makary, M.A.; et al. Circulating tumor cells dynamics in pancreatic adenocarcinoma correlate with disease status: Results of the prospective CLUSTER study. Ann Surg 2018, 268, 408–420. [Google Scholar] [CrossRef]
- Poruk, K.E.; Valero, V.; III; Saunders, T. ; Blackford, A.L.; Griffin, J.F.; Poling, J.; Hruban, R.H.; Anders, R.A.; Herman, J.; Zheng, L.; et al.: Circulating tumor cell phenotype predicts recurrence and survival in pancreatic adenocarcinoma. Ann Surg 2016, 264, 1073–1081. [Google Scholar] [CrossRef] [PubMed]
- Poruk, K.E.; Valero, V.; Saunders, T.; Blackford, A.L.; Griffin, J.F.; Poling, J.; Hruban, R.H.; Anders, R.A.; Herman, J.; Zheng, L.; et al. : Circulating tumor cell phenotype predicts recurrence and survival in pancreatic adenocarcinoma. Ann Surg 2016, 264, 1073–1081. [Google Scholar] [CrossRef]
- Cheng, H.; He, W.; Yang, J.; Ye, Q.; Cheng, L.; Pan, Y.; Mao, L.; Chu, X.; Lu, C.; Li, G.; et al. Ligand-targeted polymerase chain reaction for the detection of folate receptor-positive circulating tumour cells as a potential diagnostic biomarker for pancreatic cancer. Cell Prolif 2020, 53, e12880. [Google Scholar] [CrossRef] [PubMed]
- Chen, J.; Wang, H.; Zhou, L.; Liu, Z.; Tan, X. A combination of circulating tumor cells and CA199 improves the diagnosis of pancreatic cancer. J Clin Lab Anal 2022, 36, e24341. [Google Scholar] [CrossRef]
- Ankeny, J.S.; Court, C.M.; Hou, S.; Li, Q.; Song, M.; Wu, D.; Chen, J.F.; Lee, T.; Lin, M.; Sho, S.; et al. Circulating tumour cells as a biomarker for diagnosis and staging in pancreatic cancer. Br J Cancer 2016, 114, 1367–1375. [Google Scholar] [CrossRef] [PubMed]
- Fukasawa, M.; Watanabe, T.; Tanaka, H.; Itoh, A.; Kimura, N.; Shibuya, K.; Yoshioka, I.; Murotani, K.; Hirabayashi, K.; Fujii, T. Efficacy of staging laparoscopy for resectable pancreatic cancer on imaging and the therapeutic effect of systemic chemotherapy for positive peritoneal cytology. J Hepato-Bil Pancreat Sci 2023, 30, 1261–1272. [Google Scholar] [CrossRef] [PubMed]
- Court, C.M.; Ankeny, J.S.; Sho, S.; Winograd, P.; Hou, S.; Song, M.; Wainberg, Z.A.; Girgis, M.D.; Graeber, T.G.; Agopian, V.G.; et al. Circulating tumor cells predict occult metastatic disease and prognosis in pancreatic cancer. Ann Surg Oncol 2018, 25, 1000–1008. [Google Scholar] [CrossRef]
- Bissolati, M.; Sandri, M.T.; Burtulo, G.; Zorzino, L.; Balzano, G.; Braga, M. Portal vein-circulating tumor cells predict liver metastases in patients with resectable pancreatic cancer. Tumour Biol 2015, 36, 991–996. [Google Scholar] [CrossRef] [PubMed]
- Okubo, K.; Uenosono, Y.; Arigami, T.; Mataki, Y.; Matsushita, D.; Yanagita, S.; Kurahara, H.; Sakoda, M.; Kijima, Y.; Maemura, K.; et al. Clinical impact of circulating tumor cells and therapy response in pancreatic cancer. Eur J Surg Oncol 2017, 43, 1050–1055. [Google Scholar] [CrossRef]
- Martini, V.; Timme-Bronsert, S.; Fichtner-Feigl, S.; Hoeppner, J.; Kulemann, B. Circulating tumor cells in pancreatic cancer: Current perspectives. Cancers (Basel) 2019, 11, 1659. [Google Scholar] [CrossRef]
Figure 1.
Schematic of overall design. a) Flowchart of experimental procedures. b) Image capture and pre-processing. Images were automatically captured with an all-in-one fluorescence microscope (BZ-X800) using a Plan Apochromat 20x objective with a Z step size of 5 μm. c) Cut-out images of CTC candidate cells (scale bar: 20 μm).
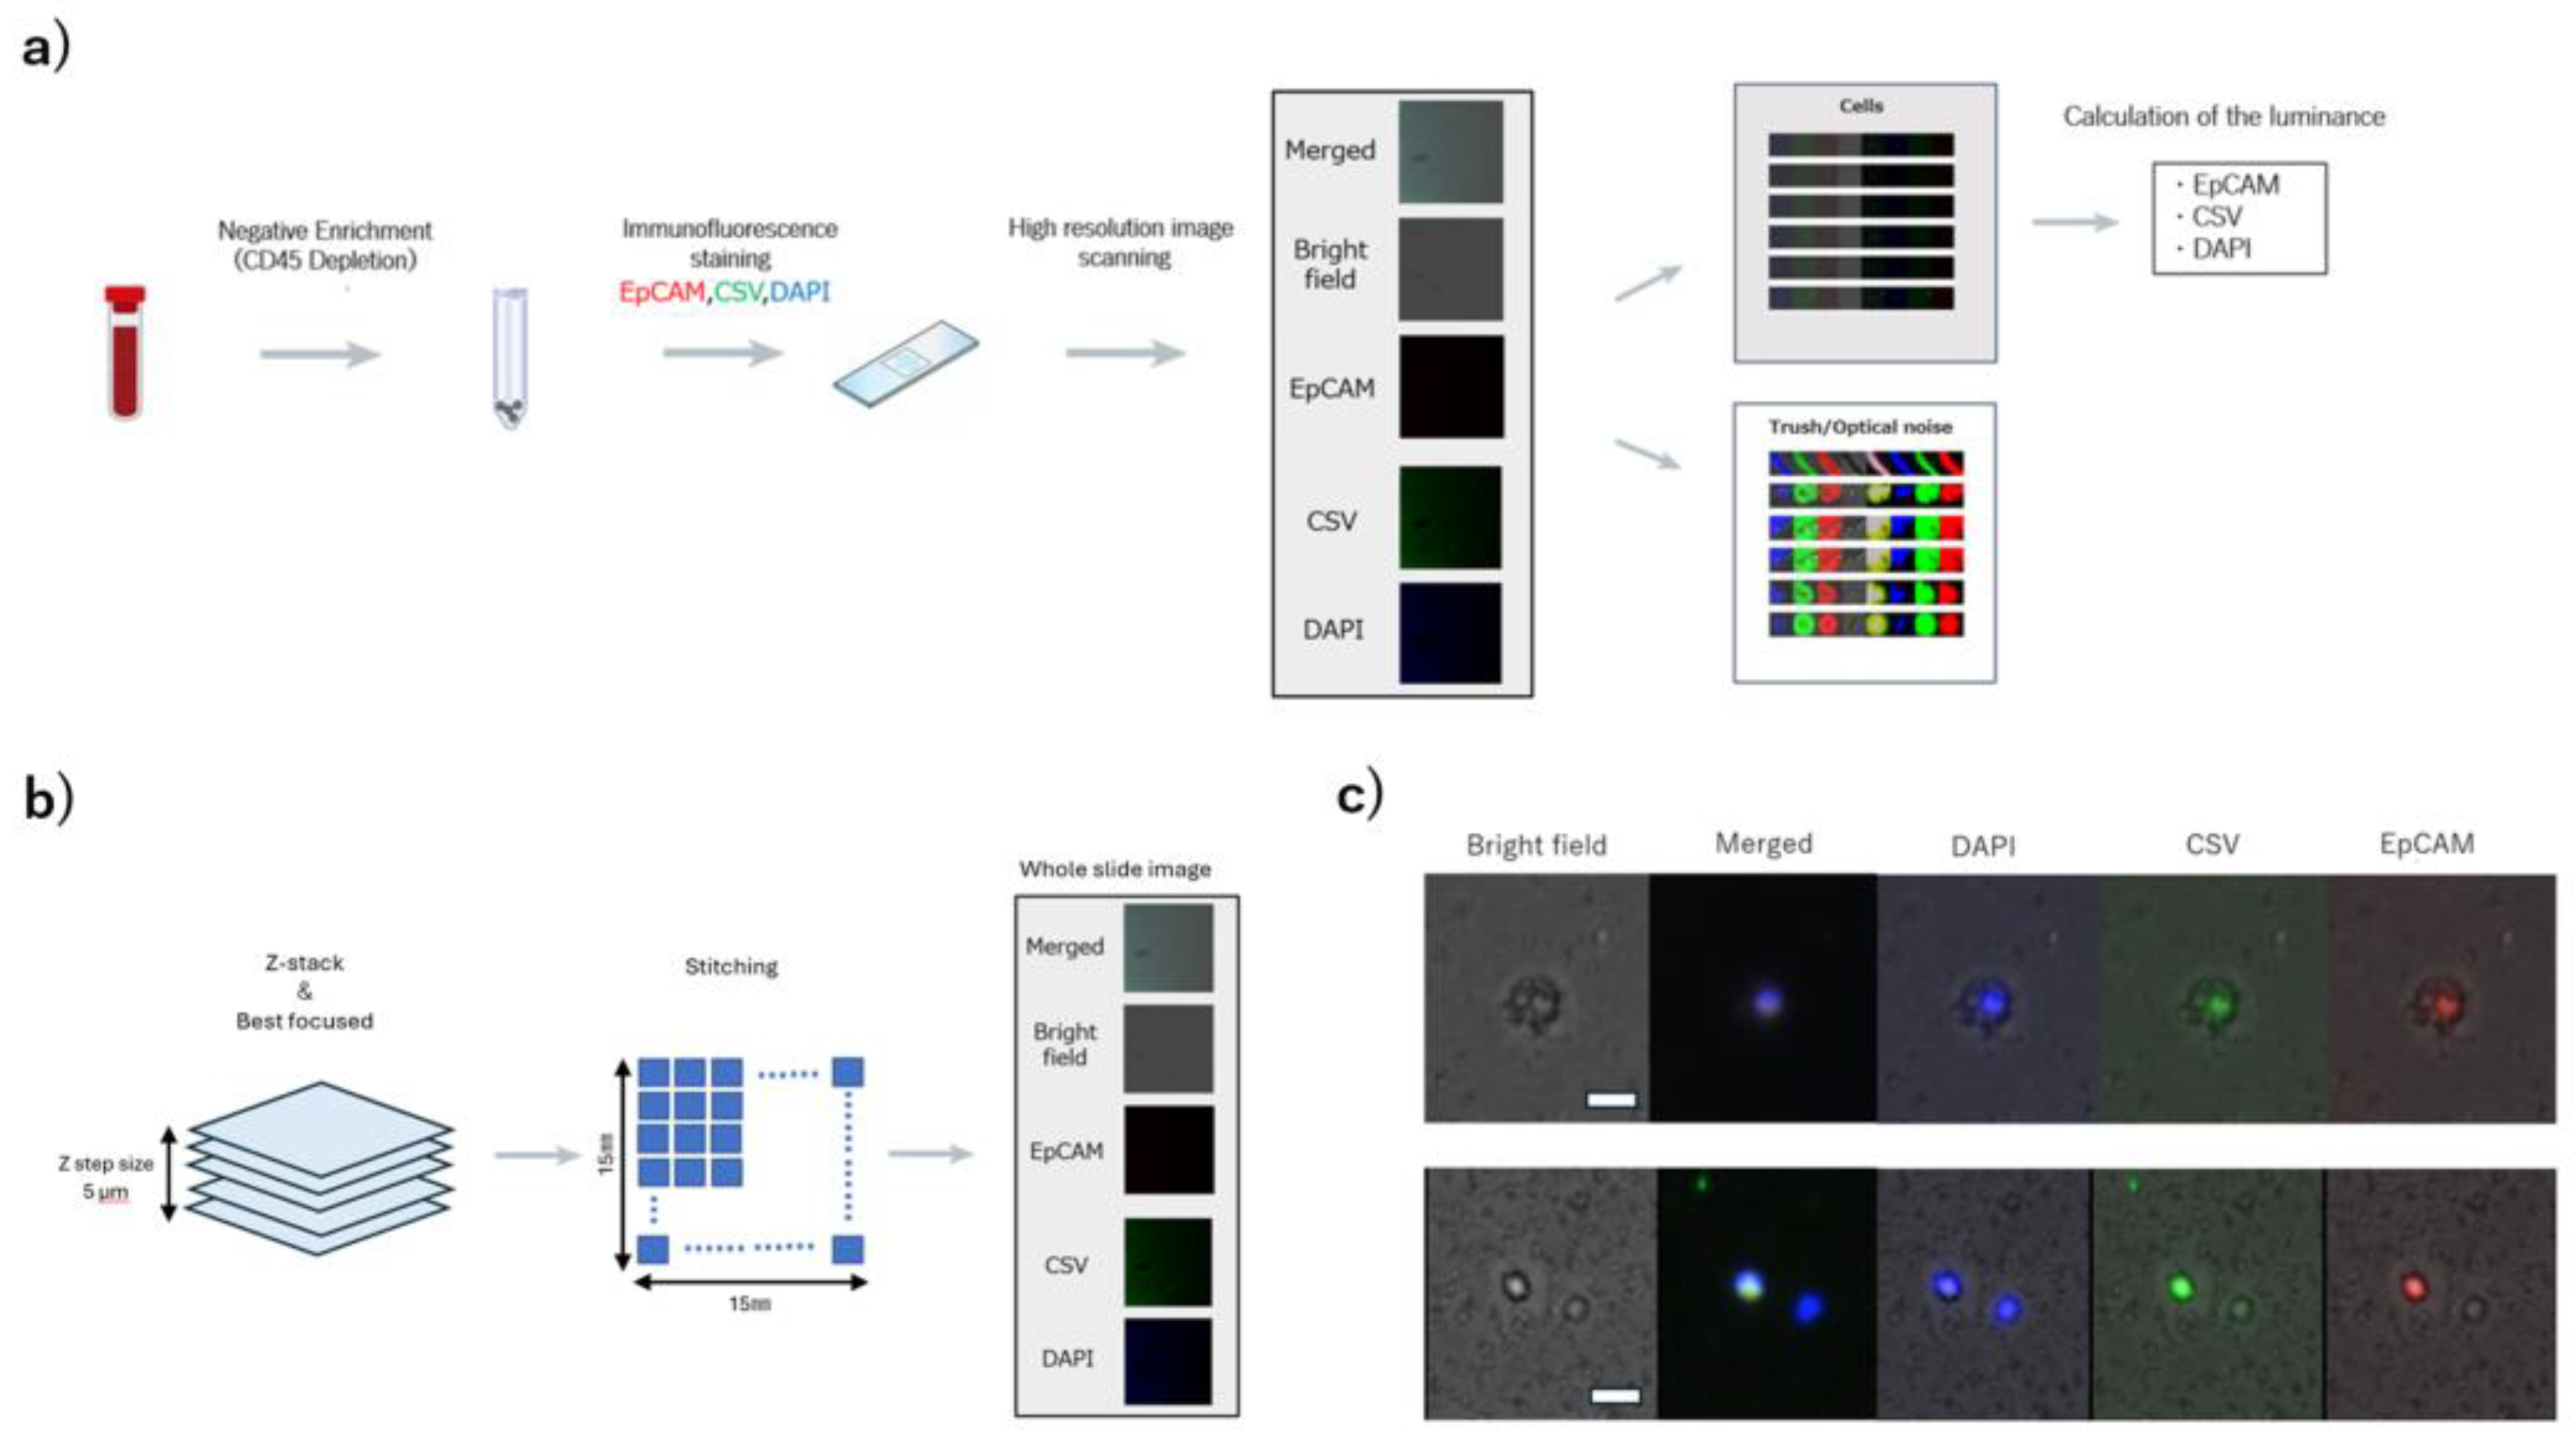
Figure 2.
Distribution of luminance values in the test set. a) Luminance values in EpCAM Assey(1~38: patients with PDAC, A~G: Healthy controls). b) Luminance values in CSV Assey(1~38: patients with PDAC, A~G: Healthy controls).
Figure 2.
Distribution of luminance values in the test set. a) Luminance values in EpCAM Assey(1~38: patients with PDAC, A~G: Healthy controls). b) Luminance values in CSV Assey(1~38: patients with PDAC, A~G: Healthy controls).
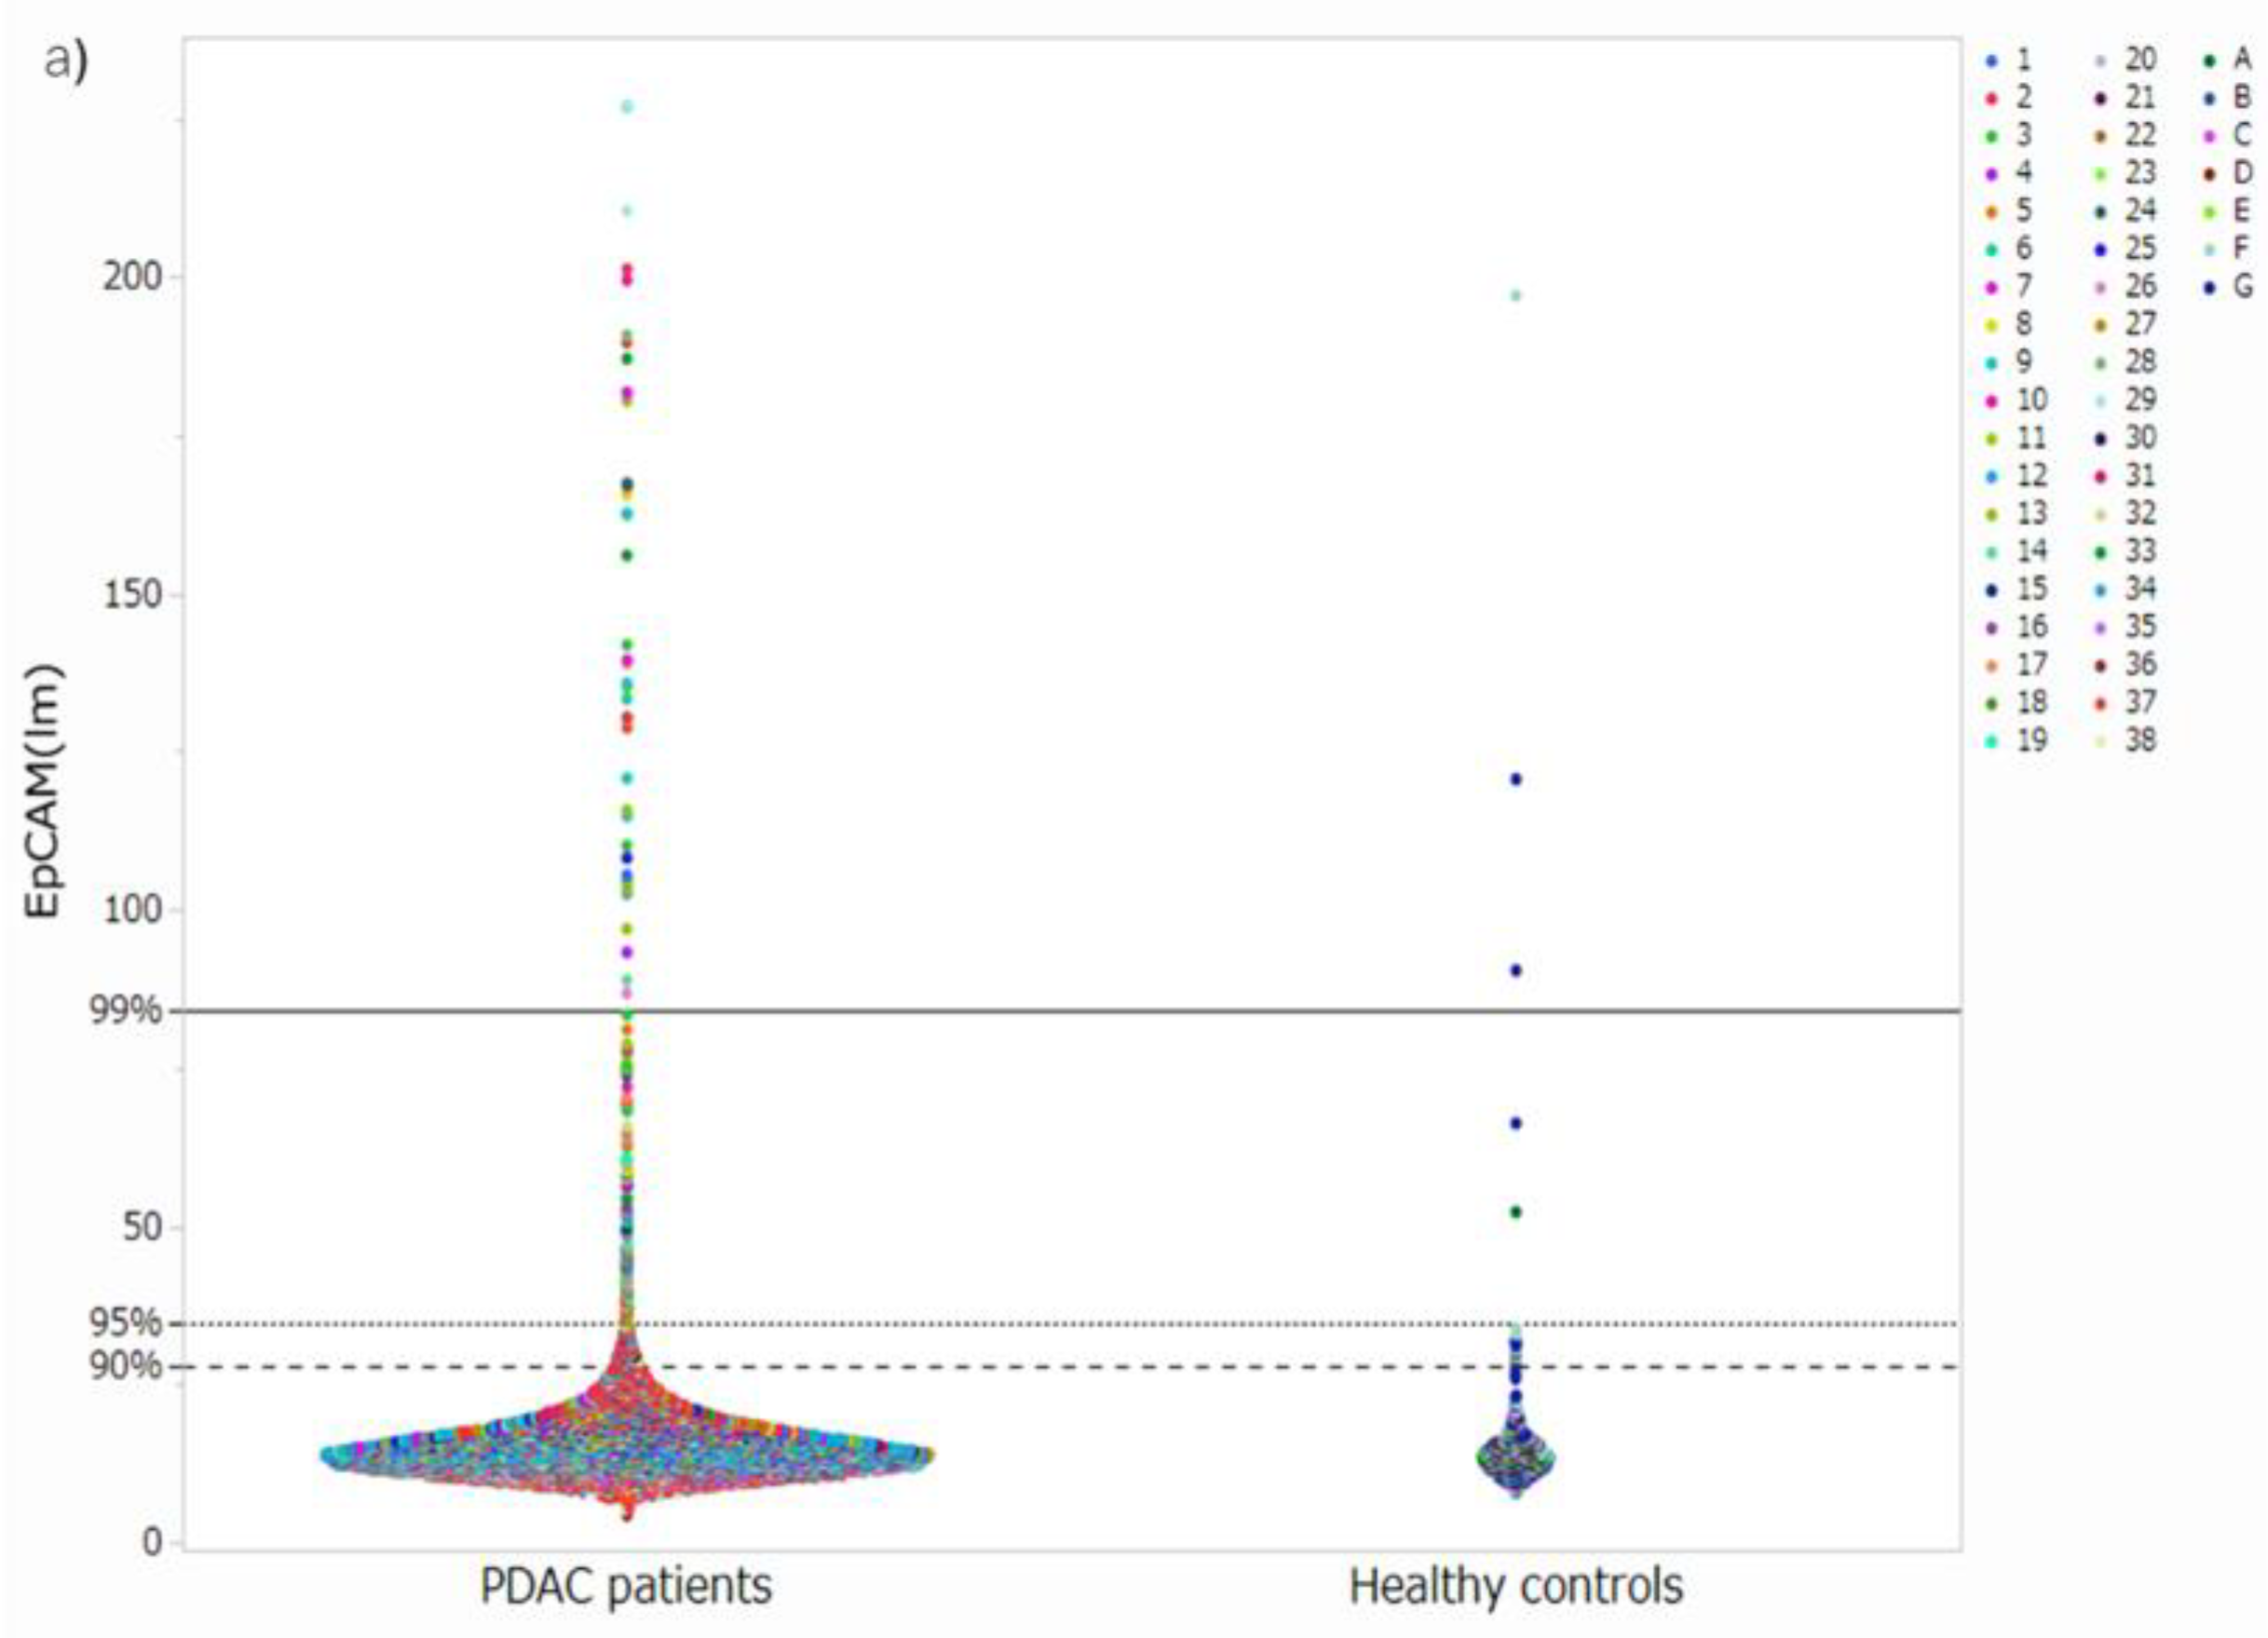
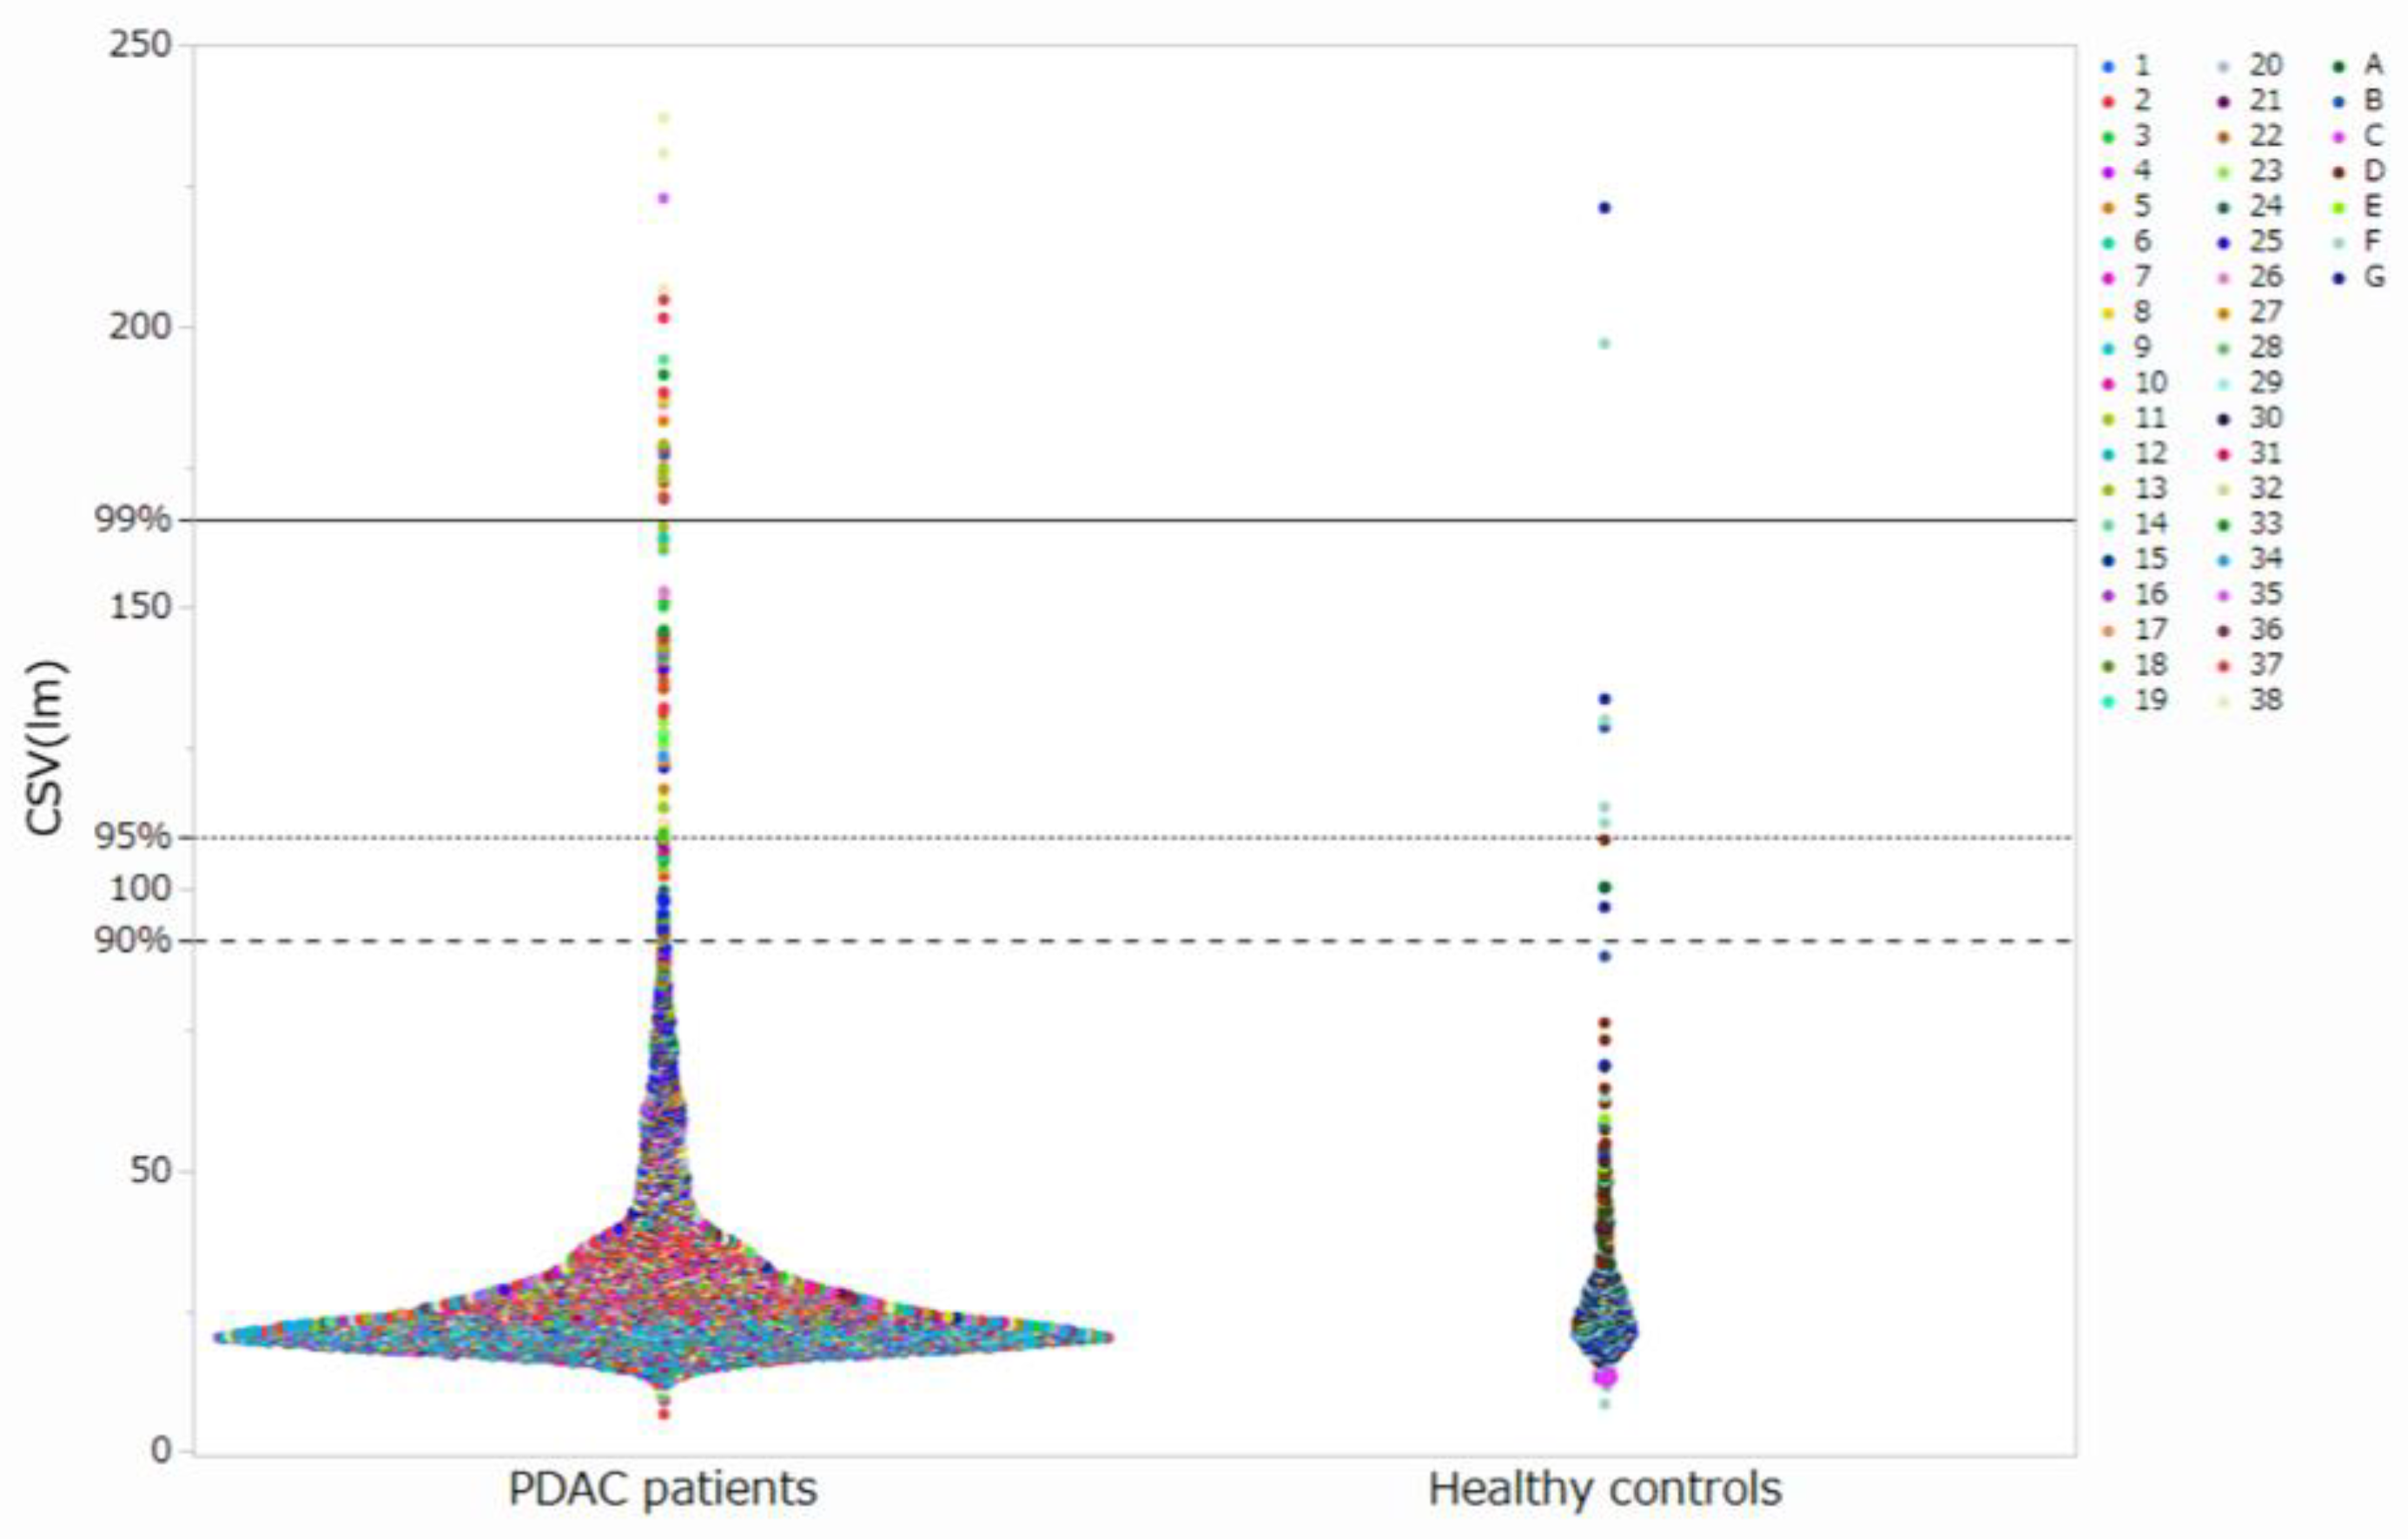
Figure 3.
Number of candidate CTCs a) Number of candidate CTCs in EpCAM (99). b) Number of candidate CTCs in EpCAM (95). c) Number of candidate CTCs in EpCAM (90). d) Number of candidate CTCs in CSV (99). e) Number of candidate CTCs in CSV (95). f) Number of candidate CTCs in CSV (90).
Figure 3.
Number of candidate CTCs a) Number of candidate CTCs in EpCAM (99). b) Number of candidate CTCs in EpCAM (95). c) Number of candidate CTCs in EpCAM (90). d) Number of candidate CTCs in CSV (99). e) Number of candidate CTCs in CSV (95). f) Number of candidate CTCs in CSV (90).
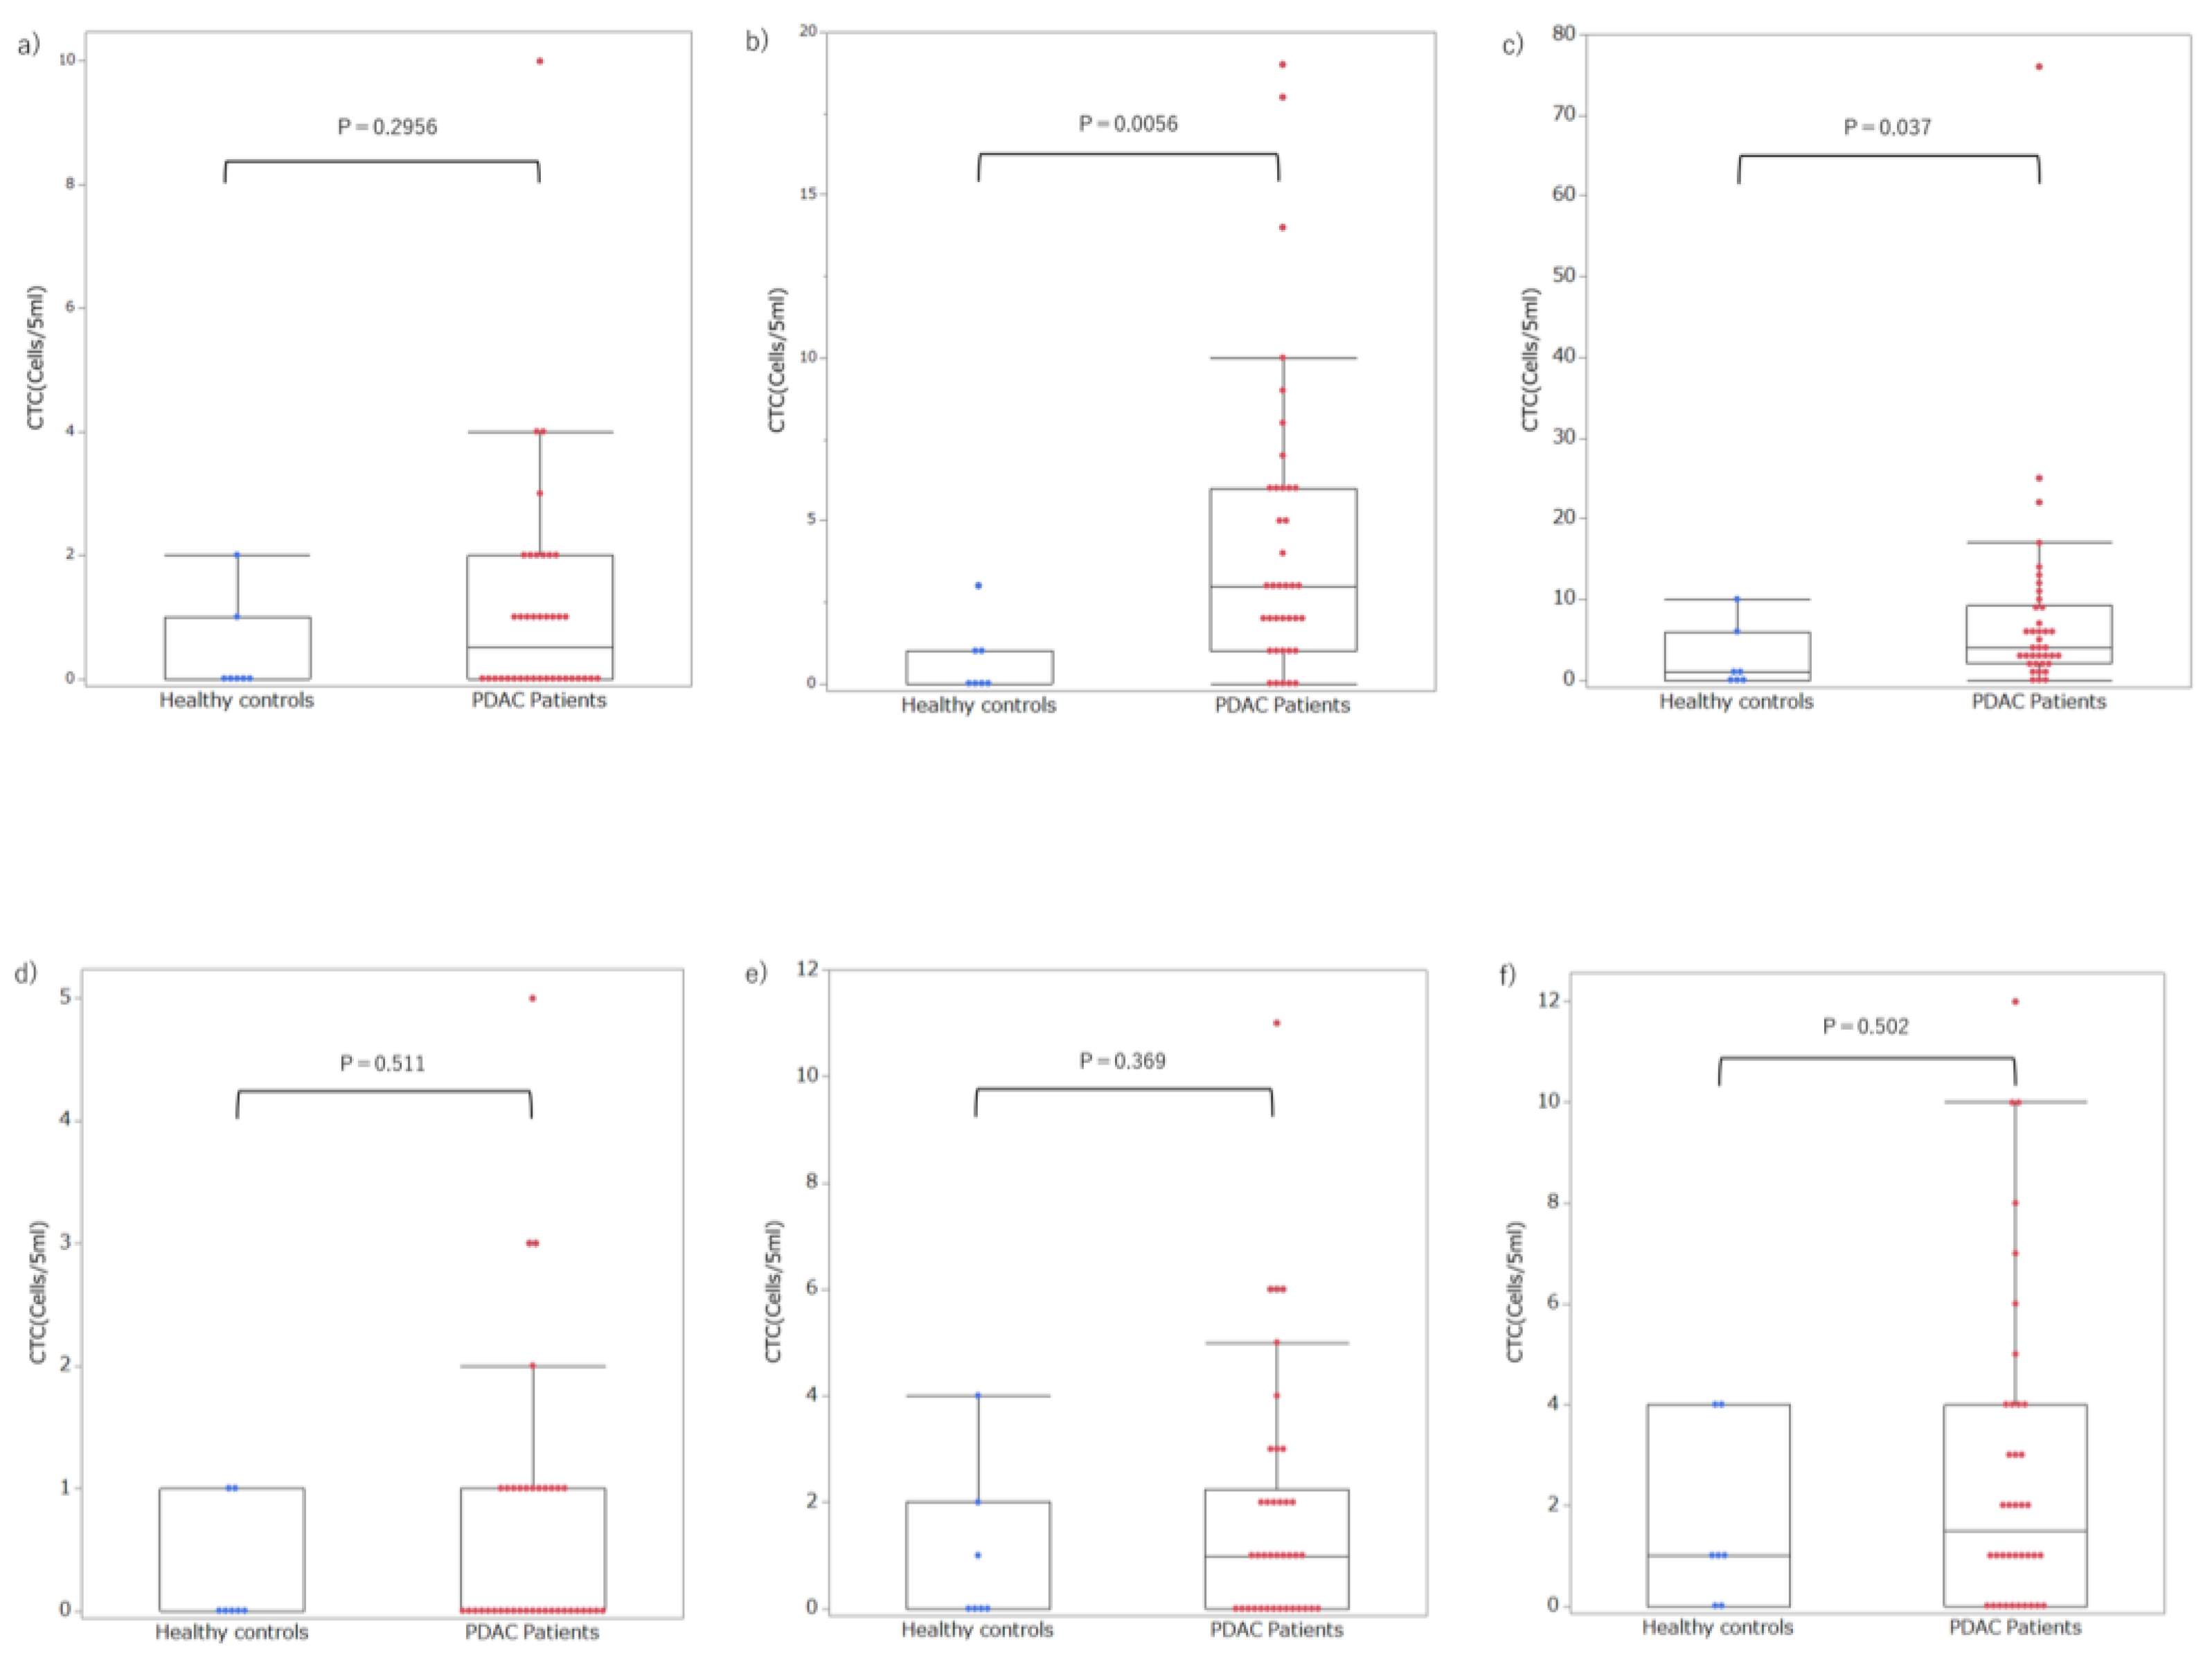
Figure 4.
Comparison of AUC for each threshold.
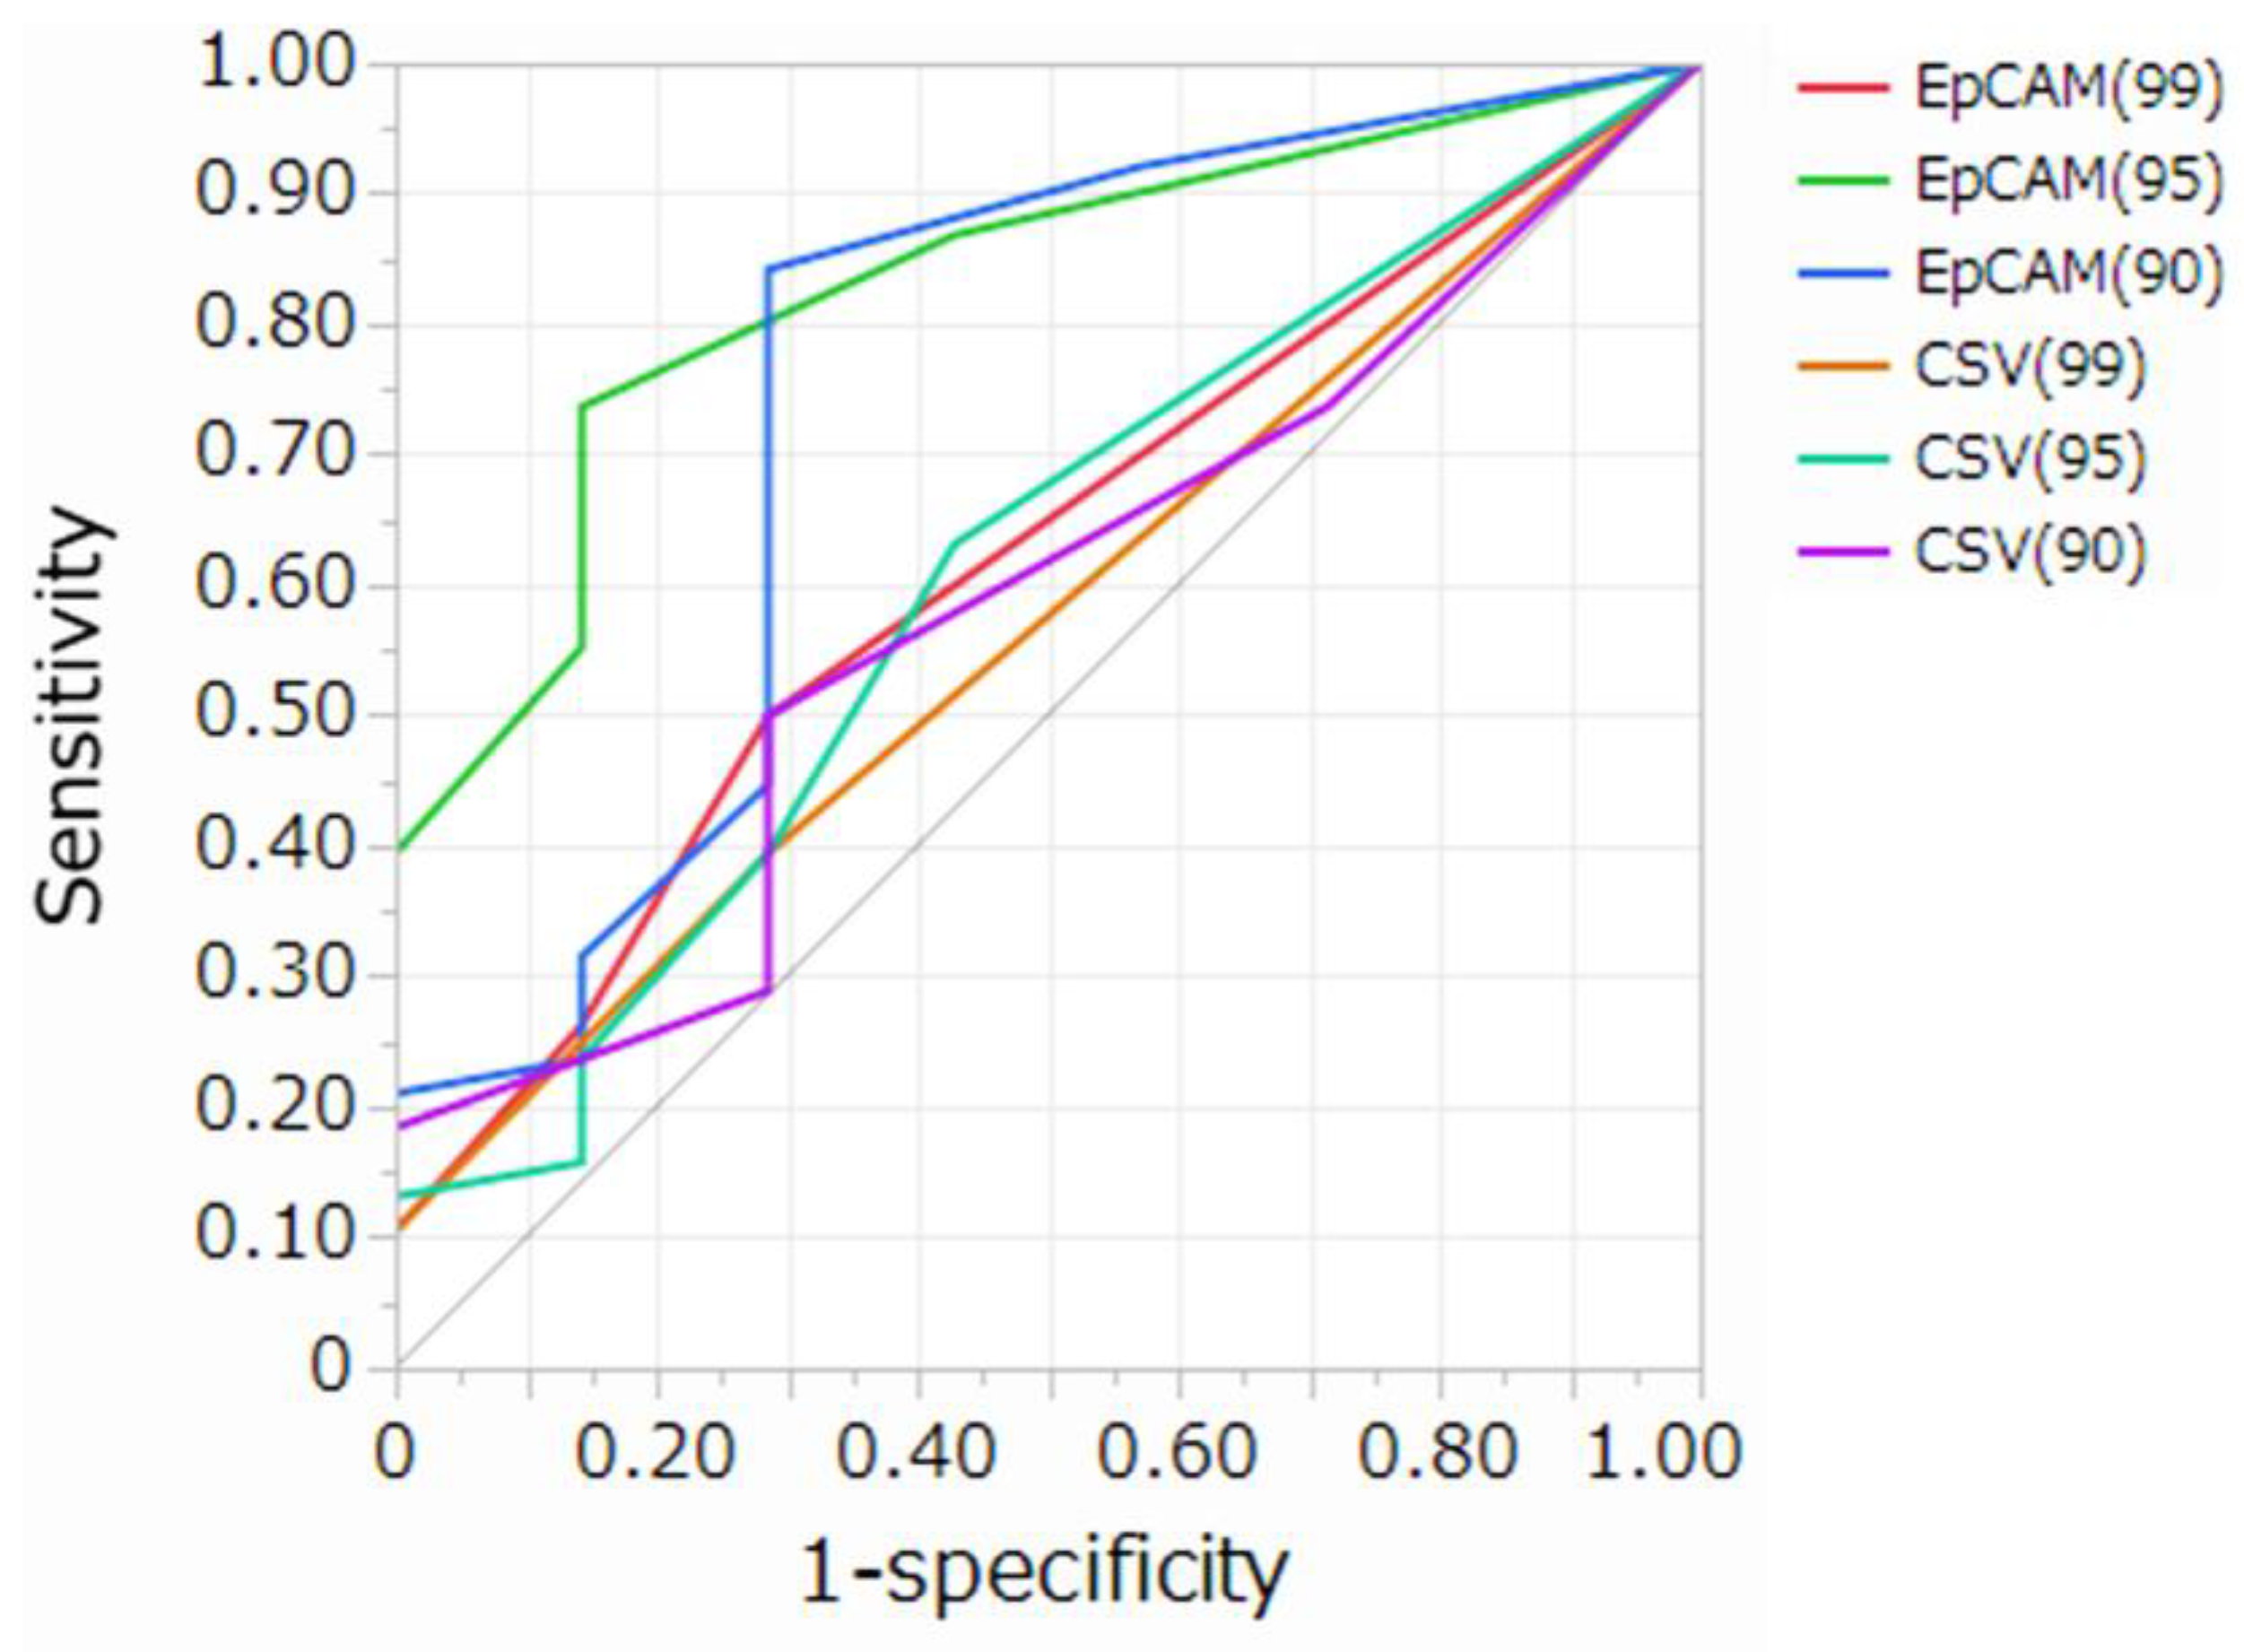
Figure 5.
Association between the number of CTCs and clinicopathological data in patients withPDAC . a) Early stage (stages I–II) and advanced stage (stages III–IV). b) CY positivity. c) Tumor size.
Figure 5.
Association between the number of CTCs and clinicopathological data in patients withPDAC . a) Early stage (stages I–II) and advanced stage (stages III–IV). b) CY positivity. c) Tumor size.
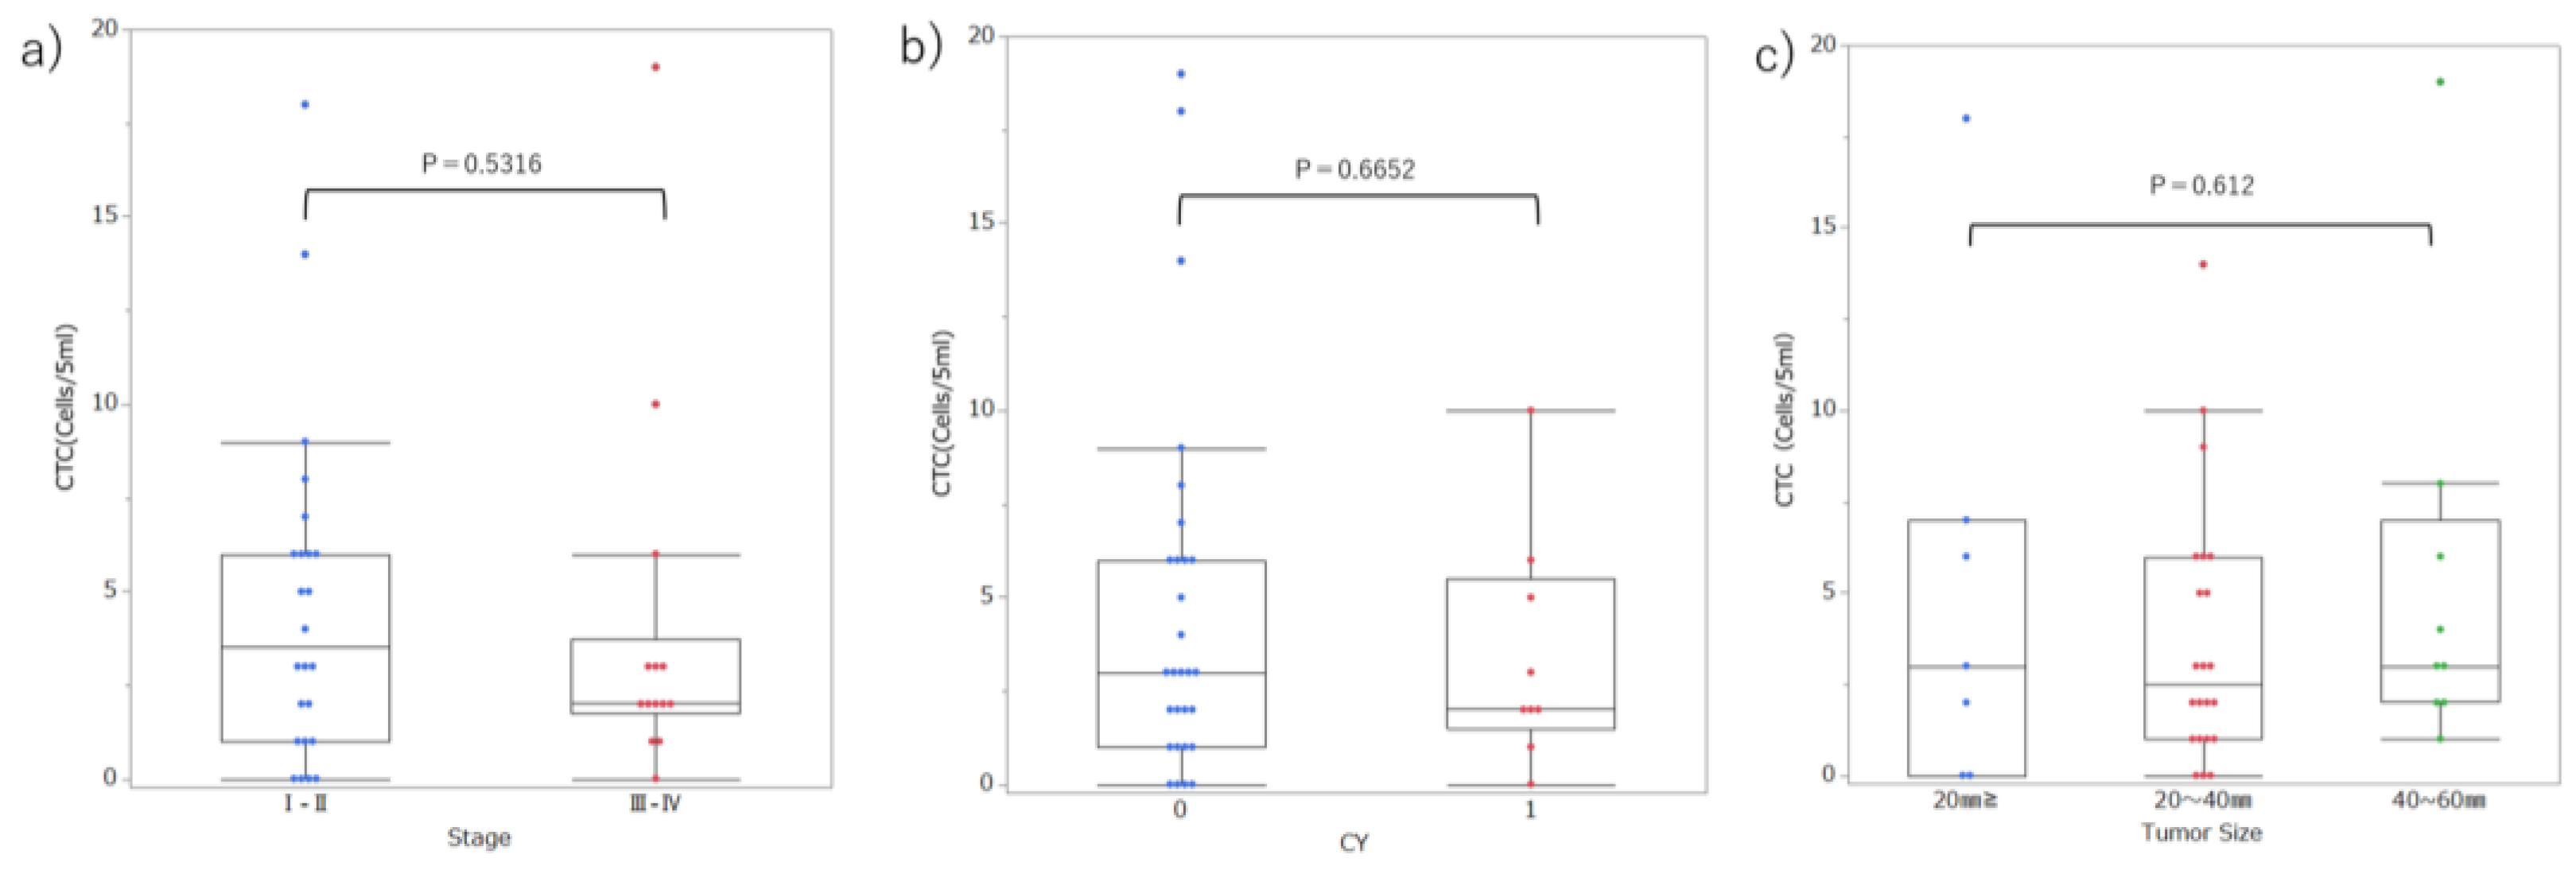

Table 1.
Comparison of AUC for each threshold.
|
Cut-off value (Cells/5mL) |
AUC (95%CI) | Sensitivity | Specificity | Delong test p-value | ||||||
| EpCAM (99) |
EpCAM (95) |
EpCAM (90) |
CSV (99) | CSV (95) | CSV (90) | |||||
| EpCAM (99) | 1 | 0.617(0.414-0.785) | 0.50 | 0.72 | 1.0000 | 0.0002 | 0.0063 | 0.3932 | 0.8864 | 0.6209 |
| EpCAM (95) | 2 | 0.830(0.634-0.932) | 0.74 | 0.76 | 0.0002 | 1.0000 | 0.2704 | 0.0002 | 0.0201 | 0.0021 |
| EpCAM (90) | 2 | 0.750(0.456-0.914) | 0.84 | 0.72 | 0.0063 | 0.2704 | 1.0000 | 0.0025 | 0.0551 | 0.0087 |
| CSV (99) | 1 | 0.570(0.386-0.736) | 0.39 | 0.72 | 0.3932 | 0.0002 | 0.0025 | 1.0000 | 0.5453 | 0.8480 |
| CSV (95) | 1 | 0.605(0.372-0.799) | 0.63 | 0.57 | 0.8864 | 0.0201 | 0.0551 | 0.5453 | 1.0000 | 0.6510 |
| CSV (90) | 2 | 0.581(0.362-0.772) | 0.50 | 0.72 | 0.6209 | 0.0021 | 0.0087 | 0.6510 | 0.8480 | 1.0000 |
EpCAM, epithelial cell adhesion molecule; CSV, cell surface vimentin; AUC, area under the curve; CI, confidence interval.
Table 2.
Positivity of CTCs and clinicopathological features in patients with PDAC.
| CTC≥2 | 2 > CTC | p-value | ||
| Age | 67.1 (58–75) | 72.9 (62–84) | 0.079 | |
| Sex | Male | 19 | 7 | 0.733 |
| Female | 9 | 3 | ||
| Location | Head/Neck | 11 | 7 | 0.092 |
| Body/Tail | 18 | 3 | ||
| UICC Stage | I–II | 17 | 7 | 0.598 |
| III–IV | 11 | 3 | ||
| Tumor size | TS1-2 | 20 | 9 | 0.290 |
| TS3-4 | 8 | 1 | ||
| CY | 0 | 21 | 8 | 0.747 |
| 1 | 7 | 2 |
CTC, circulating tumor cell; PDAC, pancreatic ductal adenocarcinoma; CY, peritoneal cytology; UICC, Union for International Cancer Control.
Disclaimer/Publisher’s Note: The statements, opinions and data contained in all publications are solely those of the individual author(s) and contributor(s) and not of MDPI and/or the editor(s). MDPI and/or the editor(s) disclaim responsibility for any injury to people or property resulting from any ideas, methods, instructions or products referred to in the content. |
© 2025 by the authors. Licensee MDPI, Basel, Switzerland. This article is an open access article distributed under the terms and conditions of the Creative Commons Attribution (CC BY) license (http://creativecommons.org/licenses/by/4.0/).
Copyright: This open access article is published under a Creative Commons CC BY 4.0 license, which permit the free download, distribution, and reuse, provided that the author and preprint are cited in any reuse.


