
Submitted:
04 October 2025
Posted:
06 October 2025
You are already at the latest version
Abstract
In this study, we proposed a novel automated speech quality estimation model capable of evaluating perceptual dysphonia severity and breathiness in audio samples, ensuring alignment with expert-rated assessments. The proposed model integrates Whisper ASR embeddings with Mel spectrograms augmented by second-order delta features combined with a sequential-attention fusion network feature mapping path. This hybrid approach enhances the model’s sensitivity to phonetic, high level feature representation and spectral variations, enabling more accurate predictions of perceptual speech quality. A sequential-attention fusion network feature mapping module captures long-range de-pendencies through the multi-head attention network, while LSTM layers refine the learned representations by modeling temporal dynamics. Comparative analysis against state-of-the-art methods for dysphonia assessment demonstrates our model’s superior generalization across test samples. Our findings underscore the effectiveness of ASR-derived embeddings alongside the deep feature mapping structure in speech quality assessment, offering a promising pathway for advancing automated evaluation systems.
Keywords:
Transformers
; Whisper ASR model
; Deep learning
; Speech quality estimation
; Perceptual speech quality
; Disordered voice
1. Introduction
In clinical practice, evaluating the vocal system (mostly for voice disorders and for accurately assessing dysphonia) primarily relies on auditory-perceptual judgment, a widely used subjective assessment method [1,2]. Auditory-perceptual evaluation plays a vital role in identifying vocal pathologies and monitoring speech disorders, particularly after invasive treatments such as subthalamic nucleus deep brain stimulation for Parkinson’s disease (PD) [3,4]. This method enables clinicians to assess voice quality and track changes over time, offering valuable insights into treatment efficacy. Clinicians assess voice characteristics based on their auditory perception, typically employing standardized rating scales. Examples of standardized scales include the Consensus Auditory-Perceptual Evaluation of Voice (CAPE-V) [5] that allows clinicians to rate the voice/speech attributes such as breathiness, roughness, strain, pitch, and overall severity, and the GRBAS scale [6] that facilitates judgments of grade, roughness, breathiness, asthenia, and strain. Unlike GRBAS, which uses an ordinal scale, CAPE-V employs a visual analog scale, allowing for more precise detection of subtle voice quality differences. It also ensures higher intra and inter-rater reliability, making it more consistent across different clinicians and over time. CAPE-V follows a structured and standardized protocol, reducing variability in assessments and improving comparability across studies. Moreover, it provides a more comprehensive evaluation of voice quality by incorporating a broader range of perceptual parameters beyond the Grade score in GRBAS. These advantages make CAPE-V based evaluated model particularly useful for clinical assessments and for validating disordered speech processing models in real world applications.
Despite its significance, auditory-perceptual judgment presents several limitations. First, it requires raters with substantial clinical expertise to ensure accurate assessments. Second, achieving reliability often demands evaluations from multiple experts, adding to the complexity of the process. Third, the procedure is time-intensive, leading to delays in obtaining results, which can hinder timely clinical decision-making. These challenges underscore the need for more objective with standardized metrics, and efficient evaluation methods [7,8]. Furthermore, a recent study [9] investigated the consistency with which experienced voice clinicians applied the CAPE-V protocol for evaluating voice quality. In this study, twenty clinicians assessed audio recordings from twelve individuals with diverse vocal characteristics, using the CAPE-V scales under conditions that reflected typical clinical practice. The results revealed notable variability in clinicians’ ratings, particularly across the dimensions of breathiness, roughness, and strain. This inconsistency highlights a critical challenge in clinical voice assessment-namely, the lack of standardization in applying CAPE-V which may compromise the accuracy and reliability of dysphonia severity evaluations. As such, this approach is inherently susceptible to inter-rater variability and subjective bias, highlighting the need for more standardized and objective evaluation techniques [1,2].
In clinical voice assessments, objective evaluation methods have traditionally emphasized the analysis of sustained vowel phonations. This preference stems from the fact that sustained vowels offer a stable and consistent vocal sample, reducing the impact of rapid articulatory movements and prosodic variations typically found in continuous speech. As a result, they provide a controlled environment for measuring key acoustic parameters related to voice quality [10,11]. In [12], Lin et al. have proposed a lightweight, automatic audio parameter extraction method using age, sex, and five audio features (jitter, absolute jitter, shimmer, HNR, and zero crossing) to improve voice quality assessment based on sustained vowels. However, relying exclusively on sustained vowels presents certain limitations. These phonations may not fully reflect the dynamic characteristics of natural speech, potentially missing critical features of voice disorders that become evident during connected speech. To overcome this, recent advancements have incorporated analyses of continuous speech. For example, the Acoustic Voice Quality Index (AVQI) integrates measurements from both types of speech samples, offering a more comprehensive assessment of dysphonia severity [13].
Non-intrusive objective methods provide distinct advantages over intrusive approaches, especially in scenarios like voice calls HAs, and clinical settings, where access to a clean reference signal is often limited. These techniques enable real-time speech quality (SQ) assessment without requiring a pristine reference, making them highly practical for real-world applications [14,15]. In recent years, Deep Neural Networks (DNNs) have revolutionized SQ and speech intelligibility (SI) assessment in other fields such as telecommunications and assistive hearing devices, offering non-intrusive, end-to-end evaluations that eliminate the need for reference signals [16,17,18,19]. For example, in Quality-Net [20], a DNN-based model designed for nonintrusive speech quality assessment. The model is trained using a Recurrent Neural Network (RNN) with bidirectional long short-term memory (BLSTM) layers to predict perceptual speech quality scores, such as the Perceptual Evaluation of Speech Quality (PESQ), directly from degraded speech. By capturing temporal dependencies in speech signals, Quality-Net refines its predictions by minimizing the MSE between its predicted and actual quality scores, enhancing its assessment accuracy. Similarly, several advanced approaches have emerged, further improving non-intrusive speech quality assessment. These include STOI-Net [19], which focuses on SI prediction, MOSA-Net [17], a model designed for MOS prediction, CCATMos [21], which integrates contextual and temporal modeling, and TorchAudio-Squim [22], an open-source framework offering pretrained models for speech quality evaluation.
In some research work self-supervised learning (SSL) has emerged as an approach to overcoming data scarcity in speech processing tasks. By enabling models to learn robust representations from unlabeled data, SSL has been instrumental in developing non-intrusive speech assessment systems [23,24,25,26,27]. Building on this foundation, researchers have explored the potential of Speech Foundation Models (SFMs) for SI and SQ prediction [28]. For instance, Cuervo and Marxer [28] conducted a systematic evaluation of ten SFMs in the context of the Clarity Prediction Challenge 2 (CPC2). Their study revealed that certain SFMs could effectively predict the percentage of correctly perceived words by hearing-impaired listeners from speech-in-noise recordings, achieving state-of-the-art performance with minimal adaptation. Similarly, Mogridge et al. [29] investigated noise-robust SFMs for non-intrusive SI prediction. They proposed extracting temporal-hierarchical features from SFMs trained on large and diverse datasets, such as Whisper, to enhance SI model prediction accuracy. Their results demonstrated that leveraging these rich representations significantly improved non-intrusive SI prediction performance.
The advances in DNN-based have impacted the disordered voice quality research as well. However, a substantial majority of research studies focused on automatic disorder detection and classification. In a recent scoping review, Liu et al. [30] revealed that 88% of published research between 2000 – 2023 aimed at detecting the presence of voice pathology. For example, in [31], researchers proposed a deep learning framework for the automatic detection of dysphonia based on acoustic features derived from sustained vowel phonations. The study utilized recordings from 238 dysphonic and 223 healthy Mandarin speakers, from which mel-spectrograms and MFCCs were extracted from 1.5-second audio segments. These features were then used to train CNNs for binary classification of dysphonic versus healthy voices.
Liu et al.’s scoping review also showed that only 5% of the studies investigated the assessment of voice quality attributes, and all these studies focused on the GRBAS scale. For example, in [6], the authors developed a DNN model to predict the overall severity of dysphonia using the GRBAS scale-encompassing Grade, Roughness, Breathiness, Asthenia, and Strain. Their model achieved performance that was comparable to, and in some cases exceeded, that of expert human raters [32]. Furthermore, Dang et al. [33] recently introduced a deep learning-based approach for clinical voice quality assessment, incorporating ASR and SSL representations trained on largescale normal speech datasets. Their work highlights the growing impact of SSL and SFMs in advancing objective and non-intrusive speech assessment methodologies.
Very few studies have applied DNN-based speech quality prediction models for estimating the CAPE-V ratings associated with a speech sample. As an example, Benjamin et al. [34] have developed a machine-learning model using support vector machines and acoustic-prosodic features extracted via OpenSMILE to predict CAPE-V overall severity from voice recordings. The model achieved a high correlation (r = 0.847) with expert ratings, with improved performance when combining features from vowels, sentences, and whole audio samples. As discussed before, Lin et al. [12] assimilated the jitter, shimmer, HNR, zero crossings, along with age and sex variables using a random forest (RF) machine learning model to predict CAPE-V ratings, but for sustained vowels only. Lin et al. [12] also compared the performance of their ML model with SSL and SFM models such as Whisper and WavLM and reported that these models were equivalent. The performance of these models in predicting CAPE-V ratings for running speech sentences is unknown.
In summary, very few machine-learning models have been developed for the comprehensive assessment of dysphonia severity and breathiness (for speech quality measurements, often used in clinical disordered voice assessments) that integrate the sentence samples while being accurate to expert-rated samples [34]. In this paper, we have proposed a model using Whisper ASR transformer encoder, Mel spectrogram with second order Deltas and Sequential-Attention Fusion Network (SAFN) feature mapping path, details of which are given in the following section.
2. Proposed Model
The proposed model, illustrated in Figure 1, is designed to estimate speech quality by utilizing features extracted from an ASR model along with Mel-spectrogram representations. The model takes two primary inputs: ASR-derived embeddings, obtained from the encoder hidden states of a pretrained ASR model, and Mel-spectrogram features with second order deltas. The ASR representations are derived from the Whisper model (whisper-small) [9], which was pretrained to capture rich linguistic information. To enhance feature diversity and improve robustness across various auditory conditions, we integrated Whisper-derived embeddings with delta-enhanced Mel-spectrograms. This combination ensures that both linguistic and spectral features are effectively captured. The extracted features are then processed by downstream modules, which map them to the output labels. In our implementation, the Whisper padding operation was removed before utilizing the ASR features to ensure consistency in feature alignment. The ASR model itself comprises 12 transformer encoder layers, denoted as W, which contribute to the learned feature representations.
To incorporate representations from multiple depths, an adapter architecture is employed to process the outputs from the deeper six layers of the Whisper model. This design enables the model to capture and utilize hierarchical features learned at varying levels of abstraction, enhancing its ability to extract meaningful information across different layers of the neural network. The adapter architecture consists of a fully connected (FC) layer, a GELU activation function [35], a normalization layer and dropout layer with 10% probability as shown in Figure 2. Residual connections in transformer encoders are known for preserving and propagating features across layers, but adapter networks offer the advantage of fine-tuning and reweighting multi-depth representations, making them valuable for tasks like quality prediction. Adapters, which are lightweight task-specific layers, adapt pre-trained features for downstream tasks, effectively integrating hierarchical information that residual connections alone may not fully capture. The outputs from the six adapters are assigned learnable weights that sum to 1, and these outputs are then combined using a weighted summation. To ensure the sum of the weights equals 1, the outputs from the adapters are processed through a softmax layer. Additionally, the feature set includes the Mel-spectrogram, along with its first and second-order delta coefficients, which are crucial for capturing frequency-level characteristics necessary for auditory perceptual assessment. Whisper operates on 40-dimensional Mel-spectrograms rather than time-domain data. For our downstream module, we concatenate all features from Whisper, and Mel-spectrogram (with its deltas) along the feature dimension to create a comprehensive input representation. In our proposed structure, our designed SAFN model which predicted in Figure 3, has constructed from three-layer unidirectional LSTM layers for sequence processing with 360 units input size and 128 hidden sizes, followed by a dropout layer with the probability of 30%. The LSTM output is further refined using a FC (128 → 128 dimensions), followed by GELU activation and dropout (30% probability) for additional feature transformation.
To 128. dimensional embeddings and 16 attention heads. The first MHA layer processes the LSTM-enhanced features by computing self-attention over the input sequences, producing an output, which is then added to the original input through a residual connection and normalized via normalization layer. The second MHA layer follows the same residual formulation, refining the representation further through another normalization operation. These residual connections facilitate stable gradient flow and improve network convergence by preserving essential information from earlier layers. After attention processing, the features are passed through a two-layer feedforward network, where the first layer expands the dimensionality from 128 to 256, followed by a GELU activation, and then projected back to 128 dimensions. Another residual connection ensures that the feedforward transformation is integrated smoothly into the existing feature space. For speech quality estimation, the model employs a linear projection layer (128 → 1 dimension) to predict frame-level quality scores, which are then passed through a sigmoid activation function to normalize outputs. A global average pooling (GAP) layer is applied to aggregate frame-level scores into a single utterance-level quality prediction. The use of residual connections, layer normalization, and dropout mechanisms ensures robust feature learning and prevents overfitting, making the model effective in capturing both short-term and long-term dependencies in speech. By leveraging ASR embeddings and spectral representations, the proposed structure efficiently models the underlying quality characteristics of speech and provides a reliable framework for objective speech assessment tasks.
3. Methodology
3.1. Dataset
We conducted our experiments on Perceptual Voice Qualities Database (PVQD) dataset [36]. PVQD owns 296 speech samples consisting of sustained vowels /a/, /i/, and running speech in English, with each sample representing an individual case (A small number of samples do not contain the sustained vowel /a/ or /i/). Audio signals were captured at a sampling rate of 44.1 kHz. Experienced raters evaluated the voice quality of the recorded samples using the CAPE-V and GRBAS scales. Additionally, demographic information, including the speaker’s age and gender, was provided to support the analysis. In our experiments, running speech are extracted into speech segments that last 2 to 5 seconds. In general we extracted 1645 segments from the PVQD dataset for our purpose. We divided the running segmented dataset into test, validation, and training sets. Consequently, the data is trained in a regression fashion.
3.2. Input Data
In our experiments, all audio recordings were resampled to a consistent sample rate of 16,000 Hz to standardize the input data. For the proposed non-intrusive metric, we extracted Mel-spectrogram features from the recordings, utilizing 400 FFT filters for the Short-Time Fourier Transform (STFT). The hop length between consecutive STFT windows was set to 320 samples. To generate the spectrogram, we used a Hann window with a length of 400 samples. Additionally, 40 Mel filter-banks were applied to capture the frequency characteristics of the signal. Figure 4 illustrates the Mel-spectrograms of two representative test samples from the dataset, highlighting the frequency content and temporal dynamics of the signals. This approach allows for an efficient and detailed representation of the audio that is critical for auditory perceptual assessments.
3.3. Training Setup
It is worth noting that the dataset was divided into three parts: training (999 samples), validation (306 samples), and testing (340 samples). Our experiments were conducted using two distinct target labels including CAPE-V breathiness and CAPE-V severity for evaluating the model’s performance within the distinct experiments. In our experiments, we utilize the mean absolute error (MAE) loss for regression tasks. Our model is performed using the AdamW optimizer, which is a variant of the Adam optimizer with decoupled weight decay regularization. AdamW is particularly well-suited for mitigate the issue of weight decay being coupled with the adaptive learning rate updates. In our training process, the optimizer is configured with a learning rate of 5e-6, which is relatively small to ensure stable and gradual convergence, preventing sudden fluctuations in the loss function and helping the model generalize well to unseen data. Additionally, a weight decay of 1e-4 is applied to encourage L1 regularization, preventing the model from overfitting by discouraging excessively large weight values. If there was no improvement on the validation set for four consecutive epochs, the learning rate was reduced by half. The batch size was set to 1, and during fine-tuning, the weights of the pre-trained modules remained adjustable and were not frozen. We trained the model through 200 epochs, and the experiments were performed on a system with 32 GB-RAM, a GPU-based graphic card with 10240 CUDA cores (GeForce RTX 3080TI-A12G).
3.4. Results
First, we visualized the distribution of subjective and objective scores, emphasizing the differences in model predictions by comparing their mean values and standard deviations across the entire test dataset. Figure 5 presents a comparative analysis of CAPE-V severity, CAPE-V breathiness, and Cepstral Peak Prominence (CPP) [37] in dB, with the left y-axis representing the normalized scores (0 to 1) for severity and breathiness, and the right y-axis displaying CPP values in dB. Different color-coded bars indicate various evaluation methods including subjective ratings (blue), the proposed model (orange), the Dang et al. model (yellow), the ablated Dange et al. model (purple), and CPP values (green, measured in dB using the right y-axis).
For CAPE-V severity, the subjective ratings (blue) have a mean normalized score of approximately 0.32, with an error range extending up to approximately 0.60. The proposed model (orange) and Dang model (yellow) yield similar mean values of around 0.28–0.30, with slightly lower error ranges. The Ablation study (purple) follows a similar trend, maintaining a mean value of approximately 0.28. The CPP values (green) for CAPE- V severity show a mean of approximately 0.52 with an error bar extending up to 0.65, indicating notable variability. Similarly, for CAPE-V breathiness, the subjective ratings have a mean normalized score of approximately 0.27, with error bars reaching up to 0.50. The proposed model and Dang model exhibit comparable scores, both around 0.25–0.26, with minimal deviation. The Ablation study also remains in a similar range, approximately 0.24. CPP values for breathiness have a mean of approximately 0.50, with error bars extending up to 0.65, reinforcing the trend observed in the severity measure.
From these results, a key observation is that the proposed model demonstrates several advantages over CPP. First, it aligns more closely with subjective CAPE-V severity and breathiness scores, making it a better predictor of perceptual voice quality. The proposed model exhibits lower variability, as indicated by smaller error bars, ensuring more stable and consistent predictions. Furthermore, since the proposed model is trained on perceptual data, it can handle a broader range of voice qualities, whereas CPP primarily reflects harmonic structure and periodicity. Overall, the key advantage of the proposed model over CPP is its ability to accurately reflect human perception, making it more clinically relevant and practical for real-world voice evaluation.
Scatter plots between the subjective and objective data are shown in Figure 6 for further assessment of their relationship. In Figure 6, the y-axis represents the objective score averaged across all sentences produced by a talker in the test dataset, and the x-axis represents the averaged CAPE-V expert rating for that talker. Furthermore, the linear regression fits to the scattered data are indicated as dashed lines in all sub-panels of Figure 6, along with the regression equations and coefficients of determination (R²). The R² metric is widely used in various speech-based analyses to evaluate the accuracy and reliability of predictive models [5,38] indicates the proportion of variance in the dependent variable (normalized objective scores) that is explained by the independent variable (subjective scores). The R² value ranges from 0 to 1, where R² =1 signifies a perfect fit and R² =0 means the model does not explain any variability in the data.
In Figure 6(a), each model’s predicted breathiness scores are plotted against subjective ratings. The proposed model (blue) exhibits the strongest linear relationship with subjective scores, with an R² value of 0.8804, meaning that it explains 88.04% of the variance in the objective scores based on subjective scores. The full Dang et al. model (orange) follows closely with an R² of 0.8726, indicating lower explanation of the variance than the proposed model. The ablated version of the Dang et al. model (green) has an R² of 0.8712, suggesting that it too explains a lower amount of variance than the proposed model. Figure 6(c) displays the scatter data between subjective breathiness scores and CPP in decibels (dB). The scatter plot demonstrates a negative correlation) between CPP and subjective breathiness scores, as higher CPP (dB) values indicate lower severity scores. With an R² value of 0.7327, the CPP only explains 73.27% of the data variance.
Similar patterns can be observed for the CAPE-V severity data. Figure 6(b) presents the scatter plot between subjective CAPE-V severity scores and normalized objective scores derived from three different models including the proposed model, the Dang et al. model, and its ablated version. Once again, the proposed model (blue) had the highest R² value, and therefore explains the data variance the most. Figure 6(d) illustrates the relationship between subjective CAPE-V severity scores and CPP. The scatter plot shows a negative correlation between these variables, with the coefficient of determination at R²=0.7178. The findings from Figure 6 confirm the efficacy of objective measures based on SFM models in predicting breathiness and overall severity as perceived in subjective assessments by expert clinicians.
Table 1 displays the Pearson correlation coefficient and RMSE results between the predicted and actual CAPE-V breathiness/severity values across different models. These values are reported at the individual sentence level, as well as the talker level – where the sentence level scores are averaged for each talker. It is evident from this table, that the proposed model achieves the highest correlation coefficient for the CAPE-V severity and breathiness attributes at both the sentence and talker levels while maintaining the lowest RMSE values, indicating strong predictive performance with minimal error. The correlation coefficients and the RMSE values associated with the full and ablated Dang et al. [33] models are close behind. It is further evident that the ML models perform significantly better than the low-level traditional acoustic parameters such as the CPP and HNR. For comparative purposes, Table 1 also lists the correlation coefficient and RMSE values reported by Benjamin et al. [34] for the CAPE-V severity prediction. It must be noted here that Benjamin et al. [34] reported the predictive metrics for the entire database of 295, rather than the test data subset used for evaluatng the rest of the models.
The statistical significance of the differences in correlation coefficients associated with the proposed model, and the full and ablated versions of Dang et al. [33] models was assessed using the z test statistic. At the sentence level, there was no statistically significant difference between the proposed model and the Dang et al. [33] full model for the overall severity attribute (z = 0.382, p = 0.351) and breathiness. The comparsion between the proposed model and the ablated Dang et al. model did result in a significant difference (z = 2.56, p < 0.01). For the breathiness attribute at the sentence level, the proposed model resulted in significantly better correlations than both versions of Dang et al. model (z = 1.67, p = 0.047 and z = 2.395, p < 0.01 respectively). When collapsed across the sentences, i.e. at the talker level, the correlation coefficients between the subjective scores and the predictions from the proposed and Dang et al. models were statistically similar. Due to the smaller size of the test dataset when collapsed across sentences (n=59), future research with data from a larger cohort of talkers is needed to further assess the performance differences between competitive SFM models.
3.5. Generalization to an Unseen Dataset
Given the lack of any other publicly available CAPE-V databases, we have tested our model on an unseen, small, and private dataset that we collected by Ensar et al., [39]. In this database, the CAPE-V ratings of overall severity were collected for sentence recordings from 30 talkers (24 disordered and 6 normal talkers). Unlike the PDVQ dataset, which contained expert CAPE-V evaluations, these samples were rated by thirty inexperienced listeners. Ensar et al. [39] reported high inter- and intra-rater reliabilities for the CAPE-V overall severity scores, and hence their average scores for the 30 speech samples were used to compare against the corresponding model predictions.
Results showed 93.38% correlation between mean subjective Cape-V severity scores and predicted severity score using the proposed model. The generalization performance of the proposed model on an unseen dataset is illustrated in Figure 7. The scatter plot shows the relationship between the subjective severity scores, obtained from human listeners, and the predicted severity scores generated by the model. A strong positive linear association is observed, with data points closely distributed around the fitted regression line. The regression equation y=0.7131x+0.2146 and the coefficient of determination =0.8721 demonstrate that the model accounts for approximately 87% of the variance in subjective ratings, indicating a high degree of predictive accuracy. As a comparison, the Dang et al. [33] full model resulted in a linear regression fit that explained 85% of the variance. This result highlights the robustness and reliability of the proposed approach in capturing perceptual severity patterns beyond the training data, reinforcing its potential for real-world applicability in objective disordered speech quality assessment.
4. Discussion
The results of our proposed model demonstrate the efficacy of integrating Whisper ASR embeddings with Mel spectrograms augmented by second-order delta features along with the proposed SAFN for speech quality estimation within the disordered speech signals. This approach leverages the robustness of Whisper’s deep-learned speech representations, which encapsulate phonetic and linguistic information, enhancing the model’s ability to discern subtle quality variations in speech signals. Additionally, the inclusion of second-order delta features captures dynamic spectral changes, improving the sensitivity of the system to transient distortions and artifacts.
Our SAFN feature mapping module effectively learns long-range dependencies, preserving global and long dependencies of the speech structure while reducing redundant information. The subsequent LSTM layers further refine the learned representations by modeling temporal dependencies, ensuring a more accurate prediction of speech quality. This hybrid architecture allows our model to balance the strengths of self-attention mechanisms with the sequential modeling capabilities of recurrent networks.
Comparative analysis with existing state-of-the-art methods reinforces the advantages of our approach. As demonstrated in figures 5 and 6, the proposed model consistently outperforms baseline methods, achieving the highest Pearson correlation coefficients and lowest RMSE values for CAPE-V breathiness and severity estimation. Notably, our model achieved an R² of 0.8804 for breathiness and 0.8264 for severity, outperforming the Dang model and the Ablation study. The lower number of trainable parameters (242.4M vs. 336.1M in the Dang model) highlights the computational efficiency of our approach without compromising accuracy. Furthermore, the model’s strong agreement with perceptual ratings, as evidenced by its alignment with subjective assessments, underscores its clinical relevance.
Our findings also highlight the limitations of traditional acoustic measures such as CPP, which, despite showing a strong correlation with perceptual ratings, exhibited higher variability and lower predictive performance compared to our proposed model. As illustrated in Table 1, the CPP-based approach yielded a correlation of -85.59% for breathiness and -84.72% for severity, with relatively higher RMSE values, reinforcing the superiority of deep-learning-based representations for dysphonia assessment.
Beyond its predictive accuracy, the proposed model demonstrates superior generalization on unseen samples, maintaining robustness against both stationary and non-stationary distortions. The ability of Whisper ASR embeddings to retain meaningful phonetic structures contributes to improved correlation with perceptual quality scores, particularly in cases where traditional spectral-based methods struggle. These findings highlight the potential of ASR-derived embeddings along with the second order of Mel spectrograms and SAFN in speech quality estimation, paving the way for more intelligent and adaptable automated assessment systems.
5. Conclusions and Future Work
This paper presents an effective disordered speech quality estimation framework that leverages Whisper ASR embeddings and Mel spectrograms with second-order delta features in addition with a deep sequential-attention fusion network architecture. By incorporating a sequential-attention fusion network architecture feature mapping module and LSTM layers, our model efficiently captures both global and temporal dependencies in speech signals. The proposed approach outperformed the existing methods, particularly in handling diverse conditions and retaining phonetic structures relevant to perceptual quality. In the case of computation complexity, the proposed structure is significantly lower than the state-of-the-art structure while outperformed that method in both Cape-V breathiness and severity on the same unseen data. Overall, our results showed 92.43% Pearson correlation using Cape-V breathiness and 88.09% correlation using the Cape-V severity on test set. As future research, we should explore strategies such as domain adaptation, alternative embedding techniques, and model compression methods to enhance deploy ability. Additionally, validating the system on real-world noisy datasets, including conversational and multi-speaker environments, would further solidify its practical applicability.
Author Contributions
Conceptualization-Vahid Ashkanichenarlogh, Vijay Parsa; Investigation-Vahid Ashkanichenarlogh; Methodology-Vahid Ashkanichenarlogh; Project administration-Vahid Ashkanichenarlogh; Software-Vahid Ashkanichenarlogh; Validation-Vahid Ashkanichenarlogh, Vijay Parsa; Visualization-Vahid Ashkanichenarlogh, Arman Hassanpour; Formal analysis-Vahid Ashkanichenarlogh, Arman Hassanpour, Vijay Parsa; Supervision-Vijay Parsa; Writing - original draft-Vahid Ashkanichenarlogh, Vijay Parsa; Writing - review & editing-Vahid Ashkanichenarlogh, Vijay Parsa.
Funding
This research was funded by the Discovery Grant from Natural Sciences and Engineering Research Council (NSERC), Canada, to Dr. Vijay Parsa.
Informed Consent Statement
Not applicable.
Data Availability Statement
The source code with the segmented running speech based dataset and some example predictions are available at GitHub through the provided link: https://github.com/vahidashkani/vahidashkani-Impaired-Patients-Voice-Quality-Assessment-Model.
Acknowledgments
We gratefully thank Dr. Philip Doyle for sharing the additional CAPE-V database that was used in assessing the generalization performance of ML models.
Conflicts of Interest
The authors confirm that there are no conflicts of interest related to the research, writing, authorship and/or publication of this article.
Abbreviations
The following abbreviations are used in this manuscript:
| ASR | Automatic Speech Recognition |
| DNN | Deep Neural Network |
| LSTM | Long Short-Term Memory |
| MFCC | Mel-Frequency Cepstral Coefficients |
| Whisper ASR | Whisper Automatic Speech Recognition |
| SQ | Speech Quality |
| SI | Speech Intelligibility |
| SFMs | Speech Foundation Models |
| CPP | Cepstral Peak Prominence |
| AVQI | Acoustic Voice Quality Index |
| CAPE-V | Consensus Auditory-Perceptual Evaluation of Voice |
| GRBAS | Grade, Roughness, Breathiness, Asthenia, and Strain |
| PD | Parkinson’s Disease |
| CPC2 | Clarity Prediction Challenge 2 |
| SSL | Self-Supervised Learning |
| SFMs | Speech Foundation Models |
| SAFN | Sequential-Attention Fusion Network |
| FC | Fully Connected |
| GAP | Global Average Pooling |
| PVQD | Perceptual Voice Qualities Database |
| RMSE | Root Mean Square Error |
References
- Barsties, B.; De Bodt, M. Assessment of voice quality: Current state-of-the-art. Auris Nasus Larynx 2015, 42, 183–188. [Google Scholar] [CrossRef] [PubMed]
- Kreiman, J.; Gerratt, B.R. Perceptual Assessment of Voice Quality: Past, Present, and Future. Perspect. Voice Voice Disord. 2010, 20, 62–67. [Google Scholar] [CrossRef]
- Tsuboi, T.; Watanabe, H.; Tanaka, Y.; Ohdake, R.; Yoneyama, N.; Hara, K.; Nakamura, R.; Watanabe, H.; Senda, J.; Atsuta, N.; et al. Distinct phenotypes of speech and voice disorders in Parkinson's disease after subthalamic nucleus deep brain stimulation. J. Neurol. Neurosurg. Psychiatry 2014, 86, 856–864. [Google Scholar] [CrossRef] [PubMed]
- Tsuboi, T.; Watanabe, H.; Tanaka, Y.; Ohdake, R.; Hattori, M.; Kawabata, K.; Hara, K.; Ito, M.; Fujimoto, Y.; Nakatsubo, D.; et al. Early detection of speech and voice disorders in Parkinson’s disease patients treated with subthalamic nucleus deep brain stimulation: a 1-year follow-up study. J. Neural Transm. 2017, 124, 1547–1556. [Google Scholar] [CrossRef] [PubMed]
- Kim, S.; et al. 05 July 2022; arXiv:arXiv:2110.05376. [CrossRef]
- Hidaka, S.; Lee, Y.; Nakanishi, M.; Wakamiya, K.; Nakagawa, T.; Kaburagi, T. Automatic GRBAS Scoring of Pathological Voices using Deep Learning and a Small Set of Labeled Voice Data. J. Voice 2022, 39, 846.e1–846.e23. [Google Scholar] [CrossRef] [PubMed]
- Kent, R.D. Hearing and Believing. Am. J. Speech-Language Pathol. 1996, 5, 7–23. [Google Scholar] [CrossRef]
- Mehta, D.D.; E Hillman, R. Voice assessment: updates on perceptual, acoustic, aerodynamic, and endoscopic imaging methods. Curr. Opin. Otolaryngol. Head Neck Surg. 2008, 16, 211–215. [Google Scholar] [CrossRef] [PubMed]
- Nagle, K.F. Clinical Use of the CAPE-V Scales: Agreement, Reliability and Notes on Voice Quality. J. Voice 2022, 39, 685–698. [Google Scholar] [CrossRef] [PubMed]
- Maryn, Y.; Roy, N.; De Bodt, M.; Van Cauwenberge, P.; Corthals, P. Acoustic measurement of overall voice quality: A meta-analysis. J. Acoust. Soc. Am. 2009, 126, 2619–2634. [Google Scholar] [CrossRef] [PubMed]
- Gómez-García, J.; Moro-Velázquez, L.; Mendes-Laureano, J.; Castellanos-Dominguez, G.; Godino-Llorente, J. Emulating the perceptual capabilities of a human evaluator to map the GRB scale for the assessment of voice disorders. Eng. Appl. Artif. Intell. 2019, 82, 236–251. [Google Scholar] [CrossRef]
- Lin, Y.-H.; Tseng, W.-H.; et al. Lightly Weighted Automatic Audio Parameter Extraction for the Quality Assessment of Consensus Auditory-Perceptual Evaluation of Voice, in 2024 IEEE International Conference on Consumer Electronics (ICCE), Jan. 2024, pp. 1–6. [CrossRef]
- Maryn, Y.; Weenink, D. Objective Dysphonia Measures in the Program Praat: Smoothed Cepstral Peak Prominence and Acoustic Voice Quality Index. J. Voice 2015, 29, 35–43. [Google Scholar] [CrossRef] [PubMed]
- Falk, T.H.; Parsa, V.; Santos, J.F.; Arehart, K.; Hazrati, O.; Huber, R.; Kates, J.M.; Scollie, S. Objective Quality and Intelligibility Prediction for Users of Assistive Listening Devices: Advantages and limitations of existing tools. IEEE Signal Process. Mag. 2015, 32, 114–124. [Google Scholar] [CrossRef] [PubMed]
- Andersen, A.H.; de Haan, J.M.; Tan, Z.-H.; Jensen, J. Nonintrusive Speech Intelligibility Prediction Using Convolutional Neural Networks. IEEE/ACM Trans. Audio, Speech, Lang. Process. 2018, 26, 1925–1939. [Google Scholar] [CrossRef]
- Leng, Y.; Tan, X.; et al. MBNET: MOS Prediction for Synthesized Speech with Mean-Bias Network, in ICASSP 2021 - 2021 IEEE International Conference on Acoustics, Speech and Signal Processing (ICASSP), 21, pp. 391–395. 20 June. [CrossRef]
- Zezario, R.E.; Fu, S.-W.; Chen, F.; Fuh, C.-S.; Wang, H.-M.; Tsao, Y. Deep Learning-Based Non-Intrusive Multi-Objective Speech Assessment Model With Cross-Domain Features. IEEE/ACM Trans. Audio, Speech, Lang. Process. 2022, 31, 54–70. [Google Scholar] [CrossRef]
- Dong, X.; and Williamson, D. S. An Attention Enhanced Multi-Task Model for Objective Speech Assessment in Real-World Environments, in ICASSP 2020 - 2020 IEEE International Conference on Acoustics, Speech and Signal Processing (ICASSP), 20, pp. 911–915. 20 May. [CrossRef]
- Zezario, R. E.; Fu, S.-W.; Fuh, C.-S.; et al. STOI-Net: A Deep Learning based Non-Intrusive Speech Intelligibility Assessment Model, in 2020 Asia-Pacific Signal and Information Processing Association Annual Summit and Conference (APSIPA ASC), Dec. 2020, pp. 482–486. Accessed: , 2025. [Online]. Available: https://ieeexplore.ieee. 18 May 9306. [Google Scholar]
- Fu, S.-W.; Tsao, Y.; et al. Quality-Net: An End-to-End Non-intrusive Speech Quality Assessment Model based on BLSTM, Aug. arXiv, arXiv:arXiv:1808.05344. [CrossRef]
- Liu, Y.; Yang, L.-C.; Pawlicki, A.; and Stamenovic, M. CCATMos: Convolutional Context-aware Transformer Network for Non-intrusive Speech Quality Assessment, in Interspeech 2022, Sept. 2022, pp. 3318–3322. [CrossRef]
- Kumar, A.; et al. , Torchaudio-Squim: Reference-Less Speech Quality and Intelligibility Measures in Torchaudio, in ICASSP 2023 - 2023 IEEE International Conference on Acoustics, Speech and Signal Processing (ICASSP), 23, pp. 1–5. 20 June. [CrossRef]
- Gao, Y.; Shi, H.; Chu, C.; and Kawahara, T. Enhancing Two-Stage Finetuning for Speech Emotion Recognition Using Adapters, in ICASSP 2024 - 2024 IEEE International Conference on Acoustics, Speech and Signal Processing (ICASSP), Apr. 2024, pp. 11316–11320. [CrossRef]
- Gao, Y.; Chu, C.; and Kawahara, T. Two-stage Finetuning of Wav2vec 2.0 for Speech Emotion Recognition with ASR and Gender Pretraining, in INTERSPEECH 2023, ISCA, Aug. 2023, pp. 3637–3641. [CrossRef]
- Tian, J.; et al. , Semi-supervised Multimodal Emotion Recognition with Consensus Decision-making and Label Correction, in Proceedings of the 1st International Workshop on Multimodal and Responsible Affective Computing, in MRAC ’23. New York, NY, Oct. 2023, USA: Association for Computing Machinery; pp. 67–73. [CrossRef]
- Dang, S.; Matsumoto, T.; Takeuchi, Y.; and Kudo, H. Using Semi-supervised Learning for Monaural Time-domain Speech Separation with a Self-supervised Learning-based SI-SNR Estimator, in INTERSPEECH 2023, ISCA, Aug. 2023, pp. 3759–3763. [CrossRef]
- Sun, H.; Zhao, S.; et al. Fine-Grained Disentangled Representation Learning For Multimodal Emotion Recognition, in ICASSP 2024 - 2024 IEEE International Conference on Acoustics, Speech and Signal Processing (ICASSP), Apr. 2024, pp. 11051–11055. [CrossRef]
- Cuervo, S.; and Marxer, R. Speech Foundation Models on Intelligibility Prediction for Hearing-Impaired Listeners, in ICASSP 2024 - 2024 IEEE International Conference on Acoustics, Speech and Signal Processing (ICASSP), Apr. 2024, pp. 1421–1425. [CrossRef]
- Mogridge, R.; et al. , Non-Intrusive Speech Intelligibility Prediction for Hearing-Impaired Users Using Intermediate ASR Features and Human Memory Models, in ICASSP 2024 - 2024 IEEE International Conference on Acoustics, Speech and Signal Processing (ICASSP), Apr. 2024, pp. 306–310. [CrossRef]
- Liu, G.S.; Jovanovic, N.; Sung, C.K.; Doyle, P.C. A Scoping Review of Artificial Intelligence Detection of Voice Pathology: Challenges and Opportunities. Otolaryngol. Neck Surg. 2024, 171, 658–666. [Google Scholar] [CrossRef] [PubMed]
- Chen, Z.; Zhu, P.; Qiu, W.; Guo, J.; Li, Y. Deep learning in automatic detection of dysphonia: Comparing acoustic features and developing a generalizable framework. Int. J. Lang. Commun. Disord. 2022, 58, 279–294. [Google Scholar] [CrossRef] [PubMed]
- García, M. A.; and Rosset, A. L. Deep Neural Network for Automatic Assessment of Dysphonia, Feb. 2022; 25, arXiv:arXiv:2202.12957. [Google Scholar] [CrossRef]
- Dang, S.; et al. , Developing vocal system impaired patient-aimed voice quality assessment approach using ASR representation-included multiple features, Aug. 2024; 22, arXiv:arXiv:2408.12279. [Google Scholar] [CrossRef]
- van der Woerd, B.; Chen, Z.; Flemotomos, N.; Oljaca, M.; Sund, L.T.; Narayanan, S.; Johns, M.M. A Machine-Learning Algorithm for the Automated Perceptual Evaluation of Dysphonia Severity. J. Voice 2023. [Google Scholar] [CrossRef] [PubMed]
- Lee, M. Mathematical Analysis and Performance Evaluation of the GELU Activation Function in Deep Learning. J. Math. 2023, 2023, 1–13. [Google Scholar] [CrossRef]
- Walden, P.R. Perceptual Voice Qualities Database (PVQD): Database Characteristics. J. Voice 2022, 36, 875.e15–875.e23. [Google Scholar] [CrossRef] [PubMed]
- Murton, O. M.; Haenssler, A. E.; Maffei, M. F.; et al. Validation of a Task-Independent Cepstral Peak Prominence Measure with Voice Activity Detection, in INTERSPEECH 2023, ISCA, Aug. 2023, pp. 4993–4997. [CrossRef]
- Dindamrongkul, R.; Liabsuetrakul, T.; Pitathawatchai, P. Prediction of pure tone thresholds using the speech reception threshold and age in elderly individuals with hearing loss. BMC Res. Notes 2024, 17, 1–10. [Google Scholar] [CrossRef] [PubMed]
- Ensar, B.; Searl, J.; Doyle, P. Stability of Auditory-Perceptual Judgments of Vocal Quality by Inexperienced Listeners, presented at the American Speech and Hearing Convention, Seattle, WA, United States, Dec. 2024. [Google Scholar]
Figure 1.
Overview of the proposed structure for quality measurement.
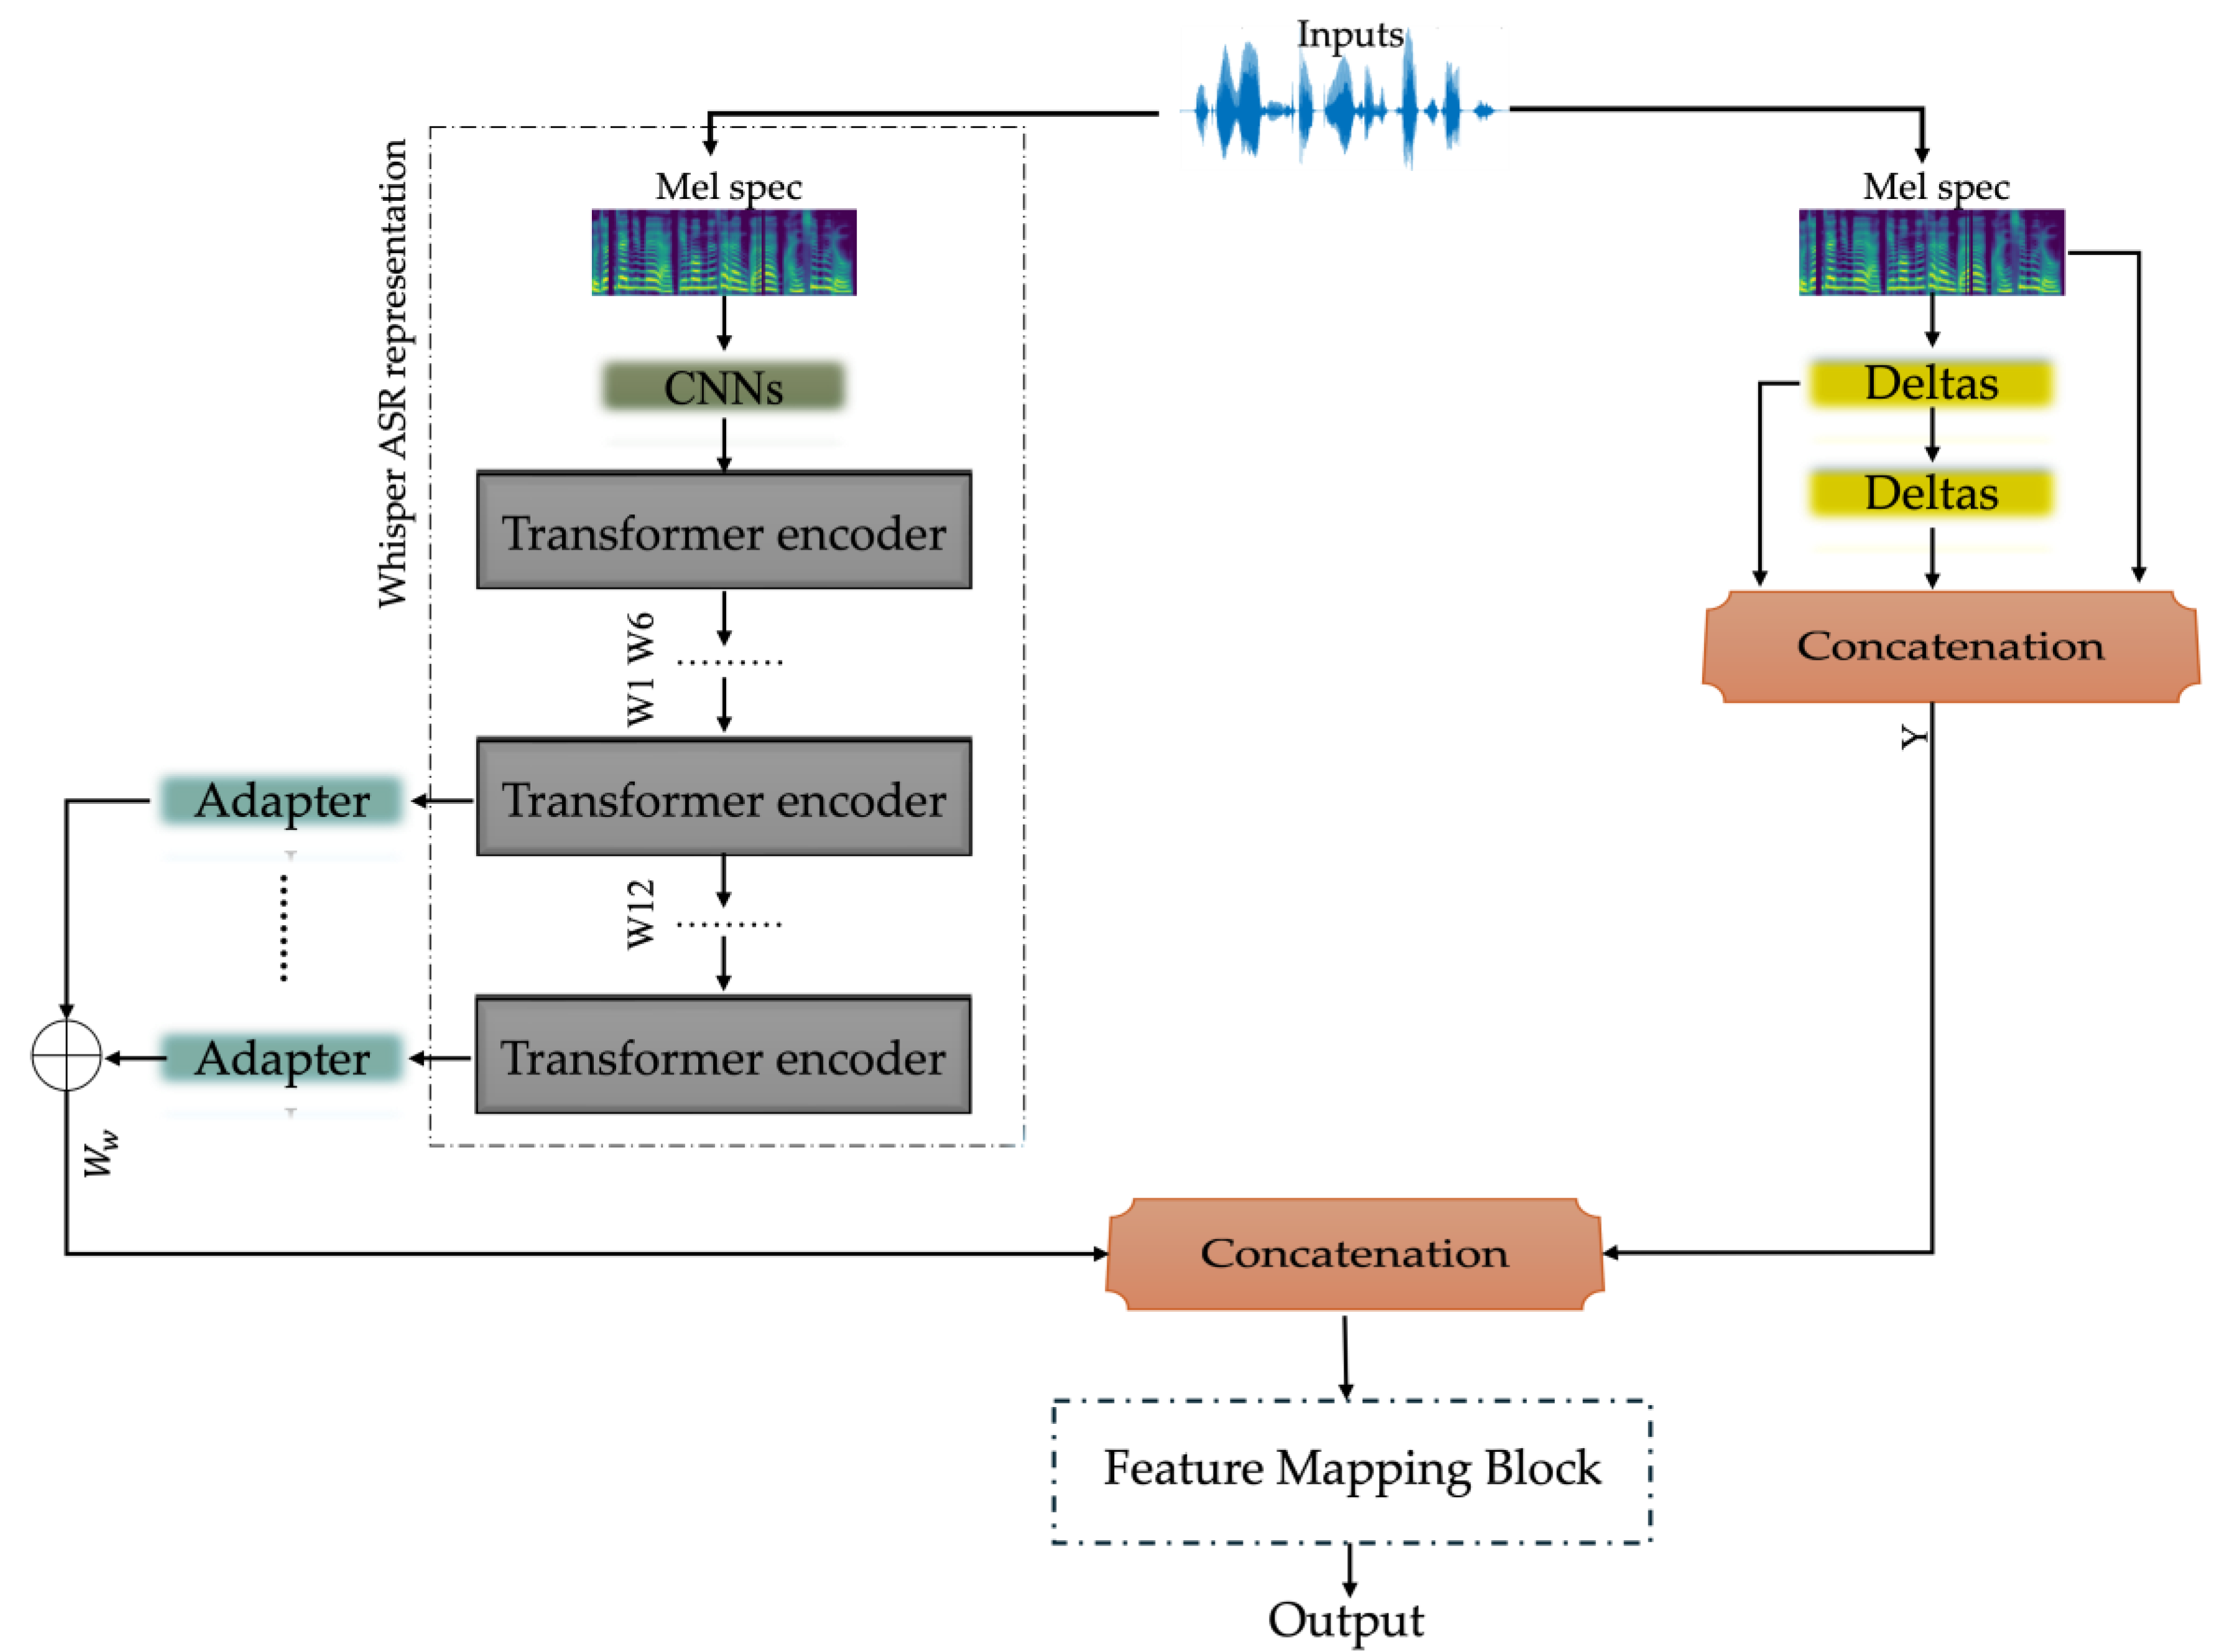
Figure 2.
Overview of the proposed adapters structure.
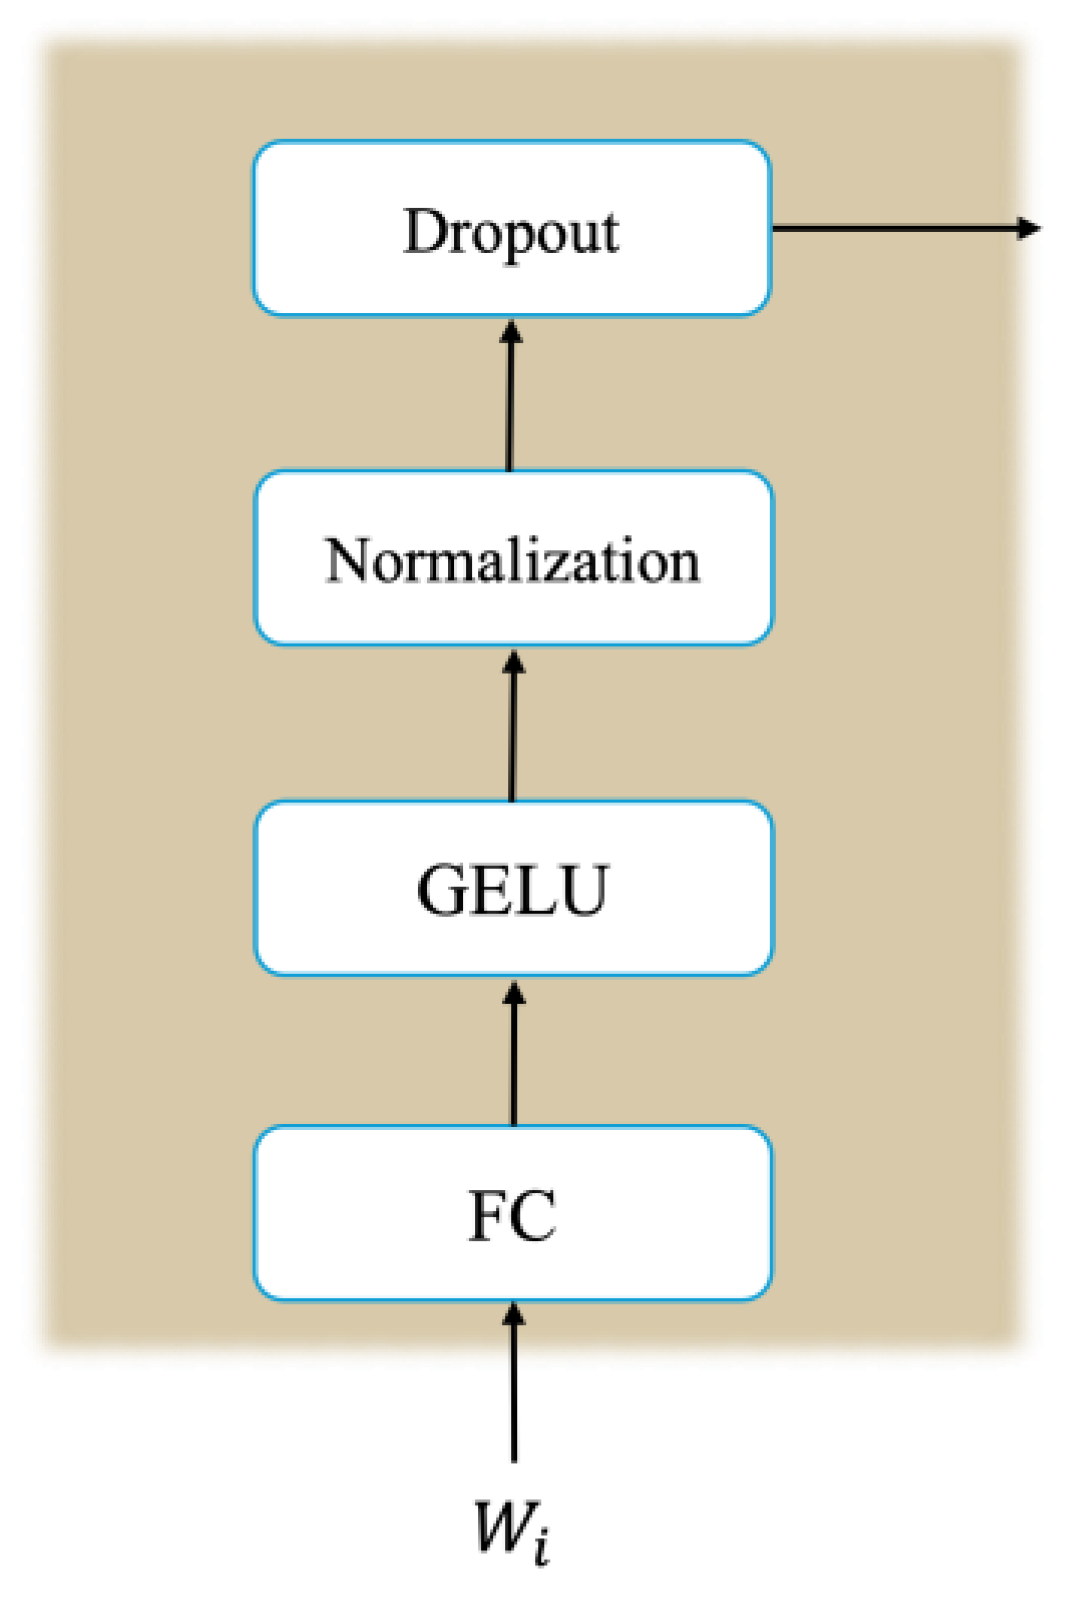
Figure 3.
Proposed feature mapping block.
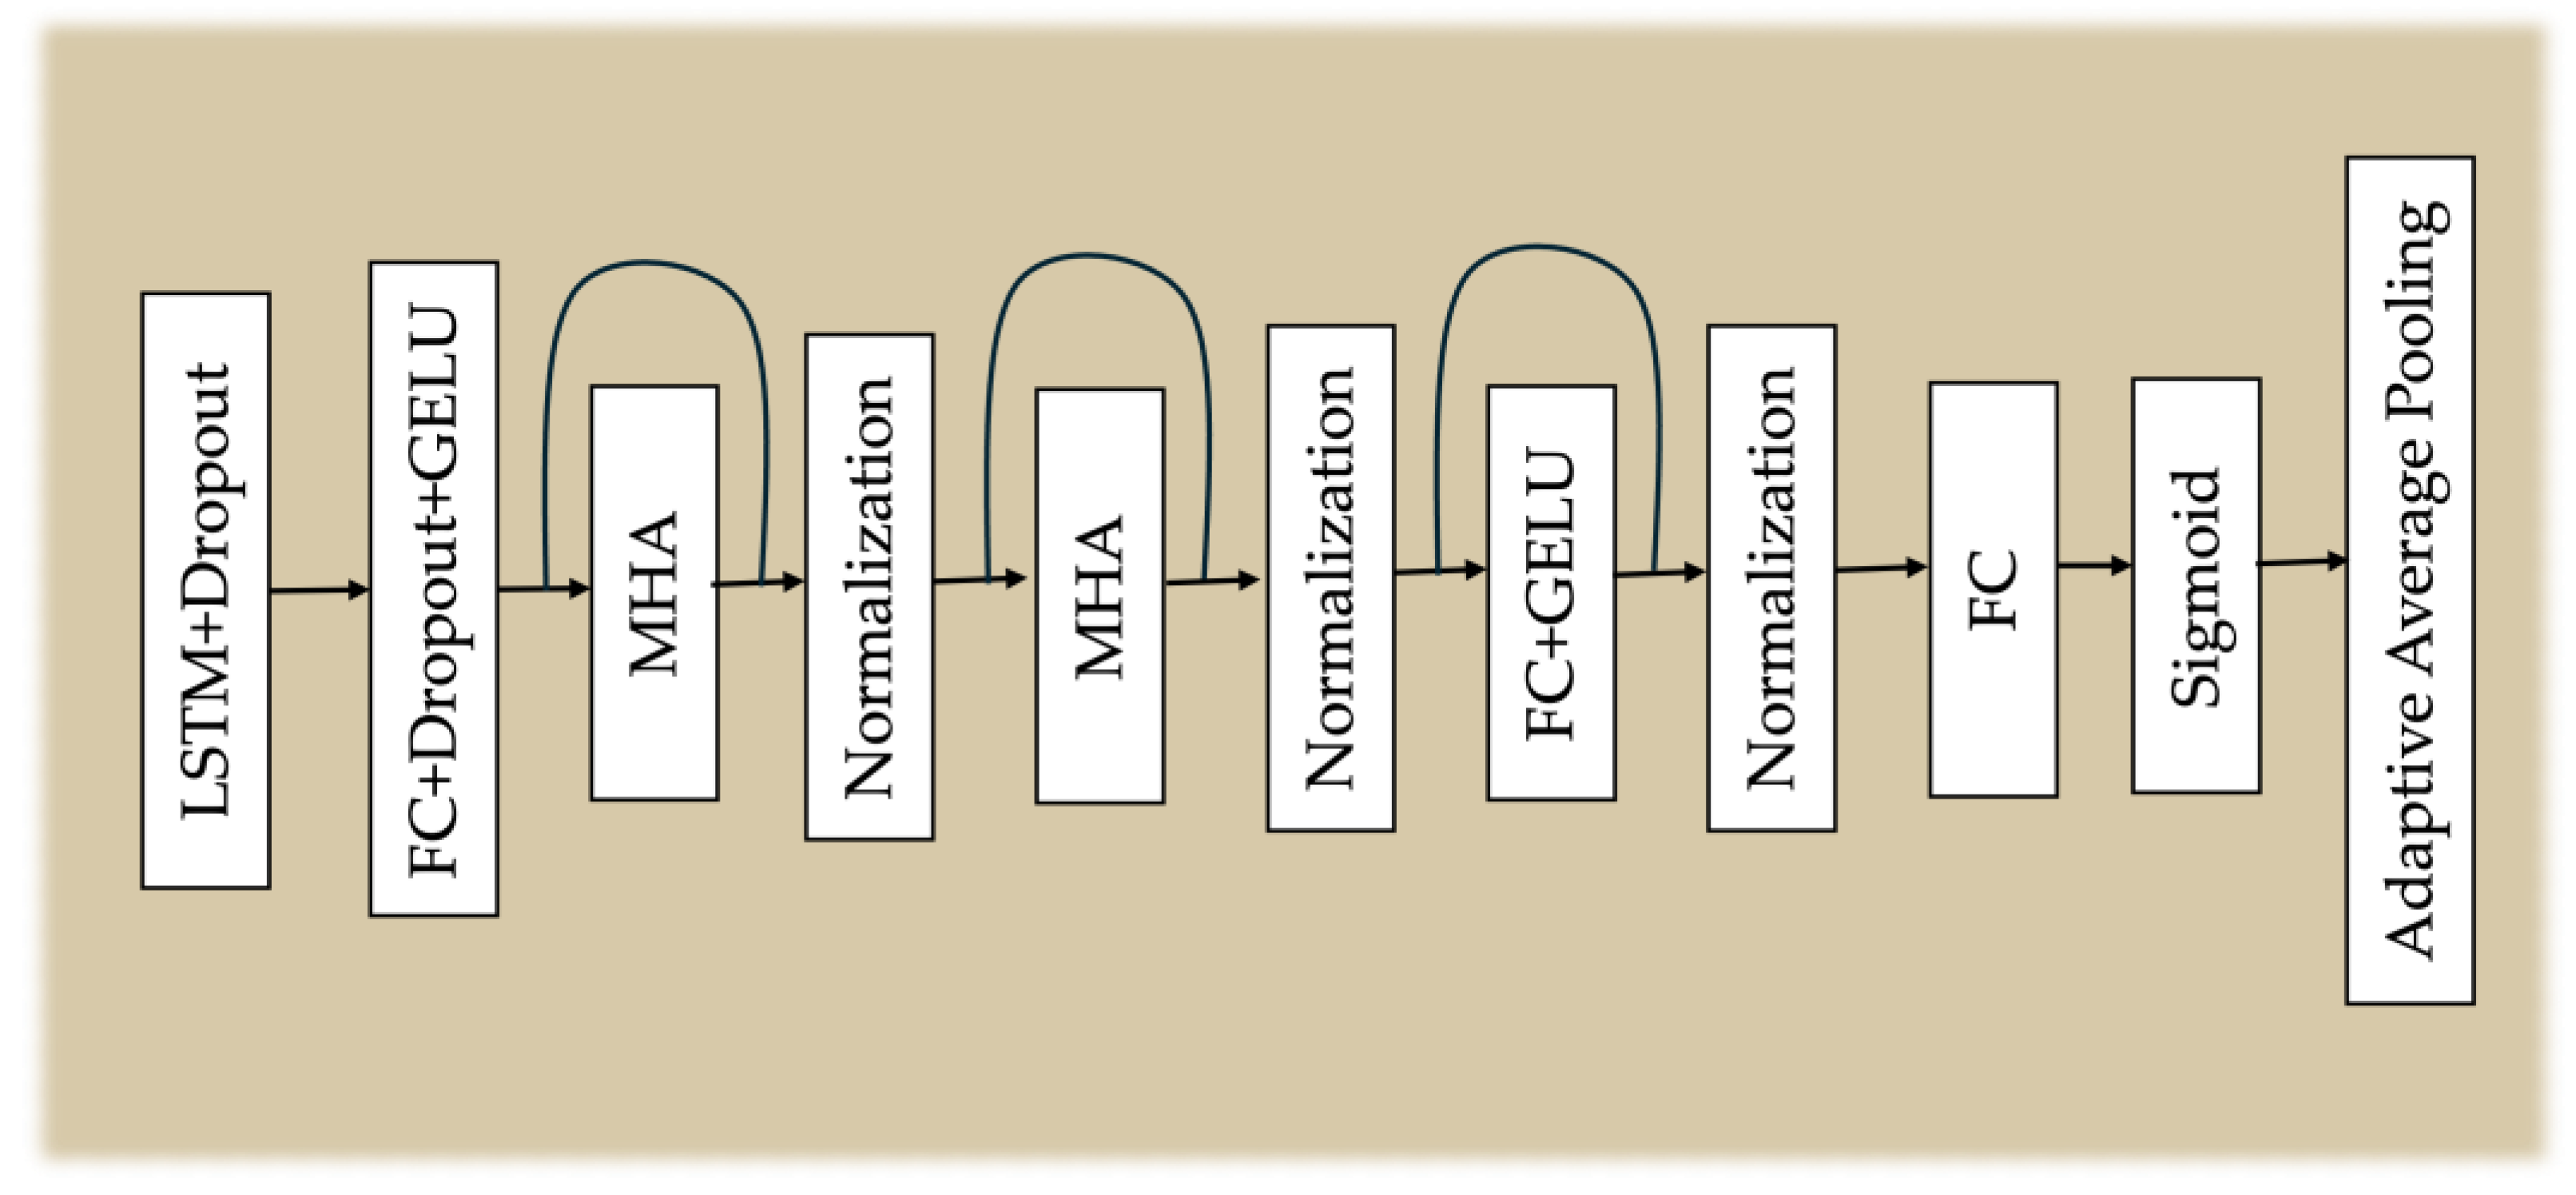
Figure 4.
Left: Waveforms of two test samples. Right: Corresponding Mel-spectrograms.
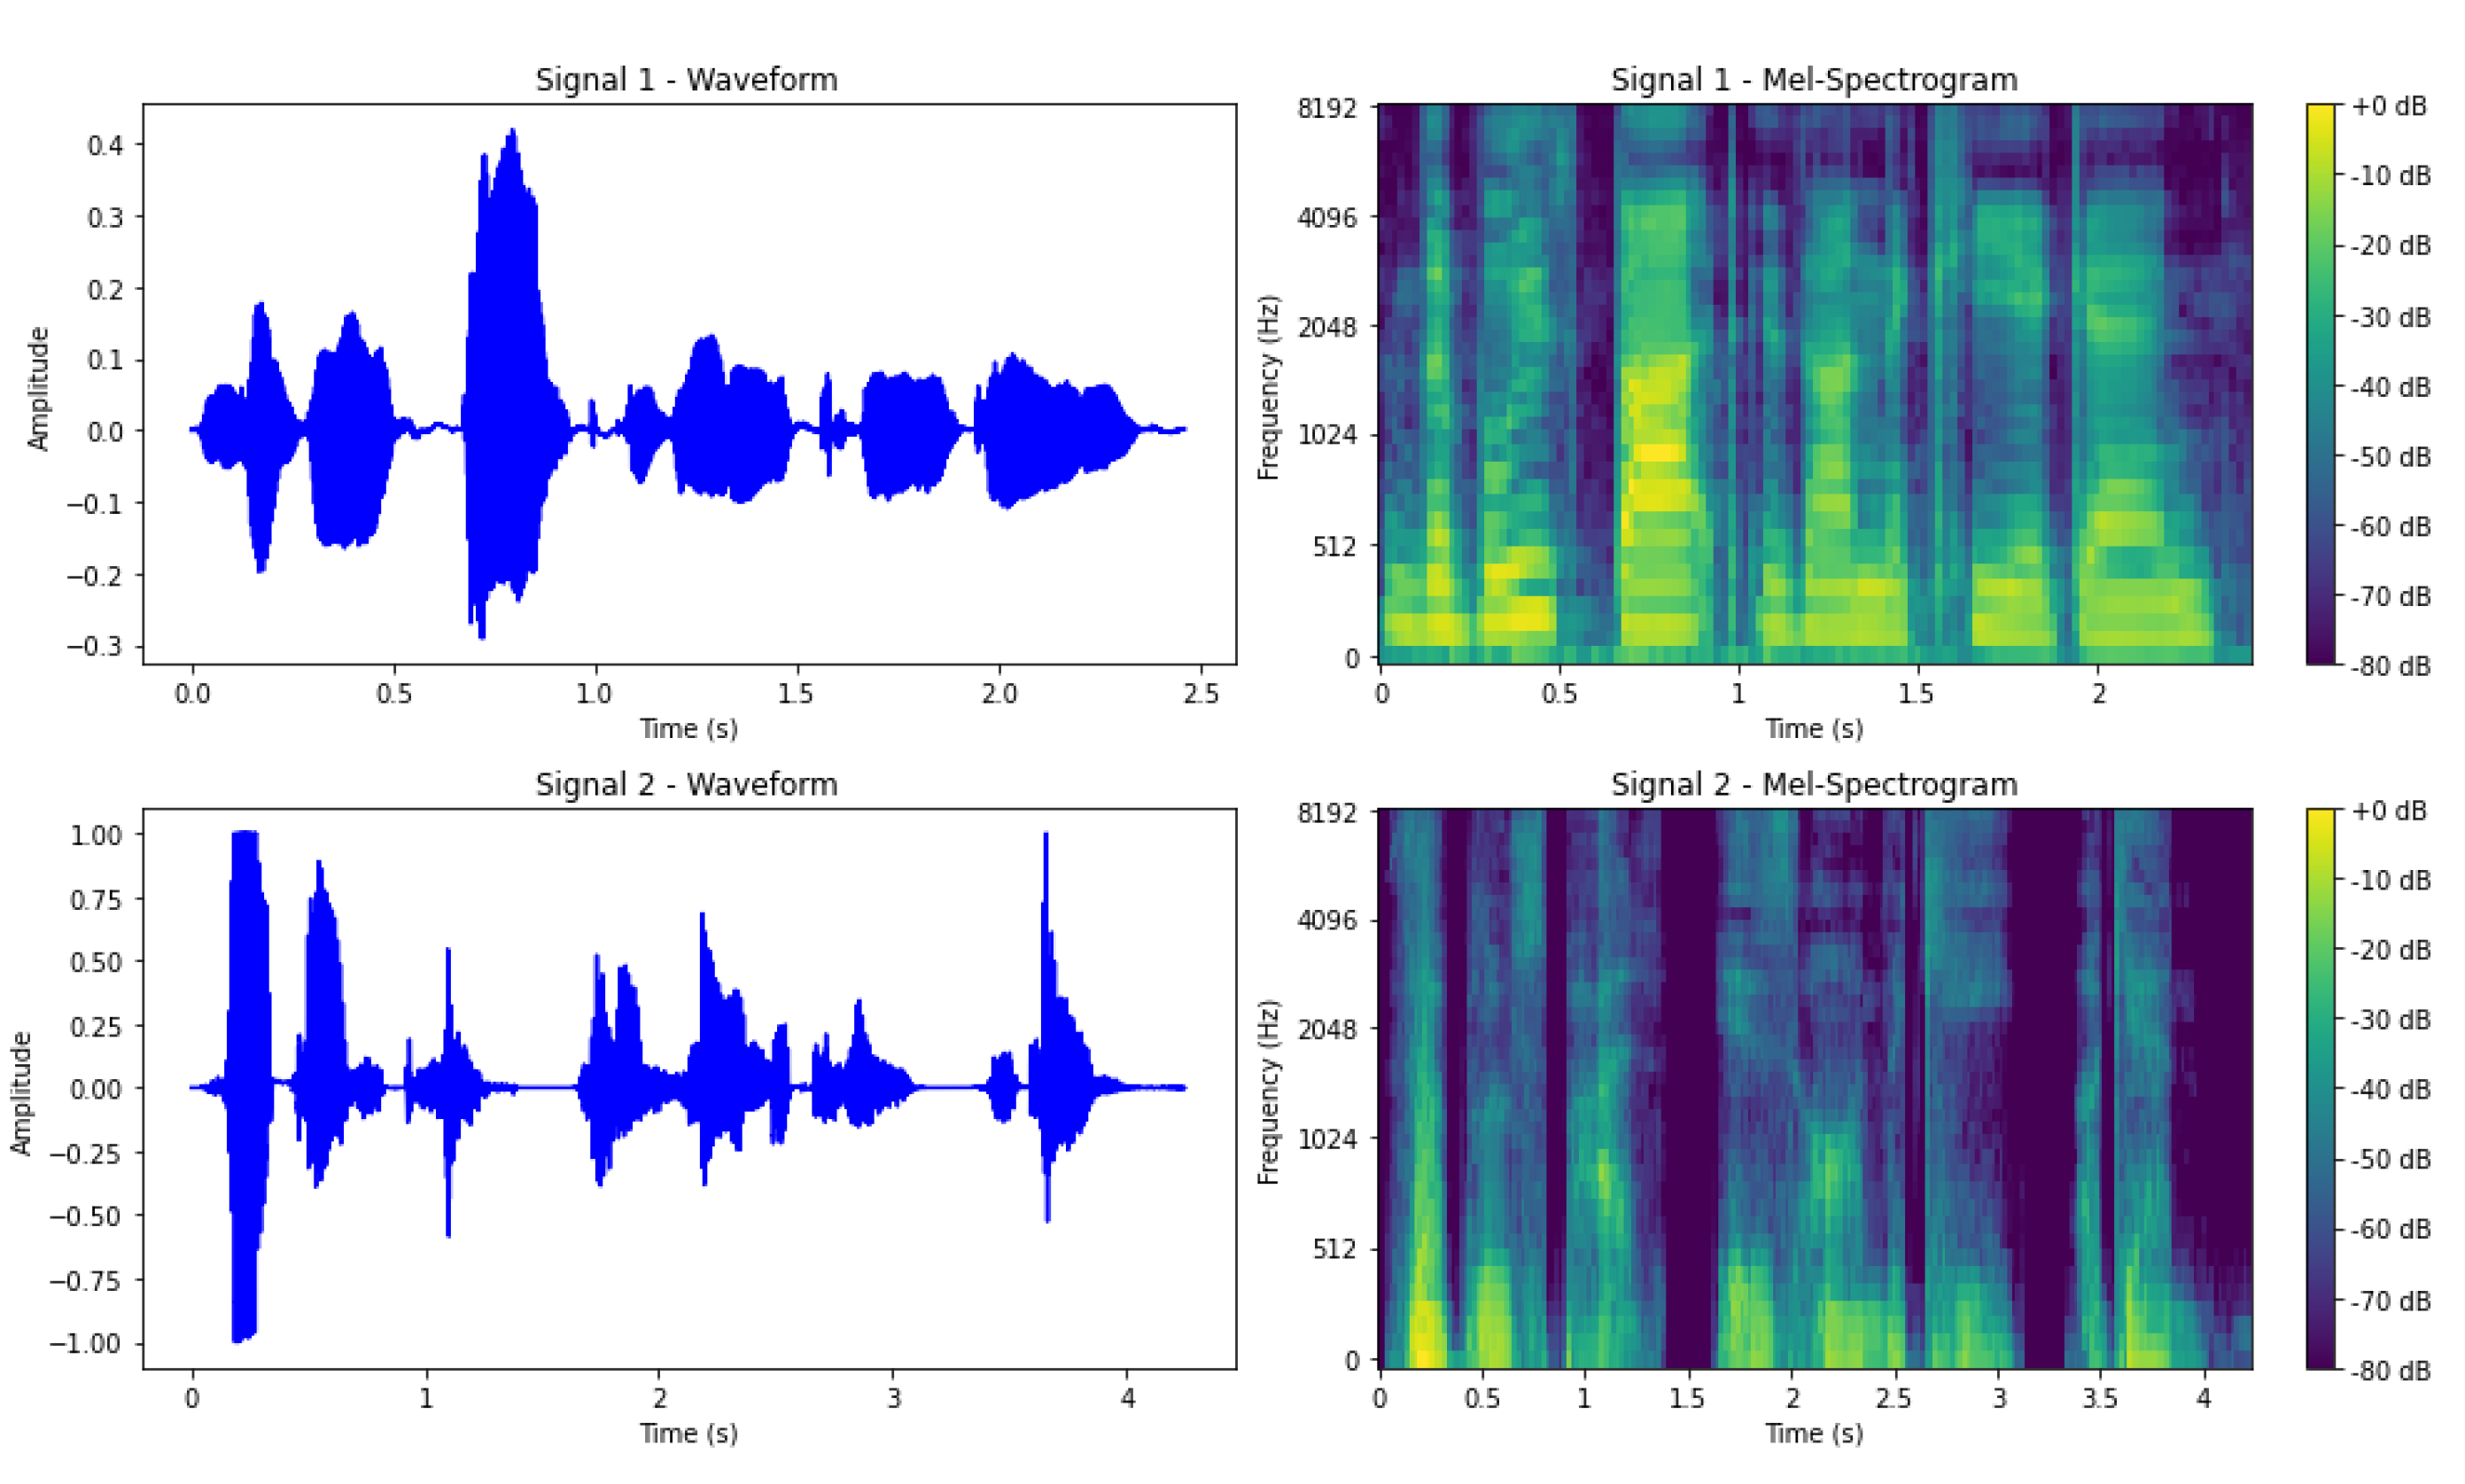
Figure 5.
Bar plot comparing subjective Cape-V Severity and Breathiness scores with predictions from different methods.
Figure 5.
Bar plot comparing subjective Cape-V Severity and Breathiness scores with predictions from different methods.
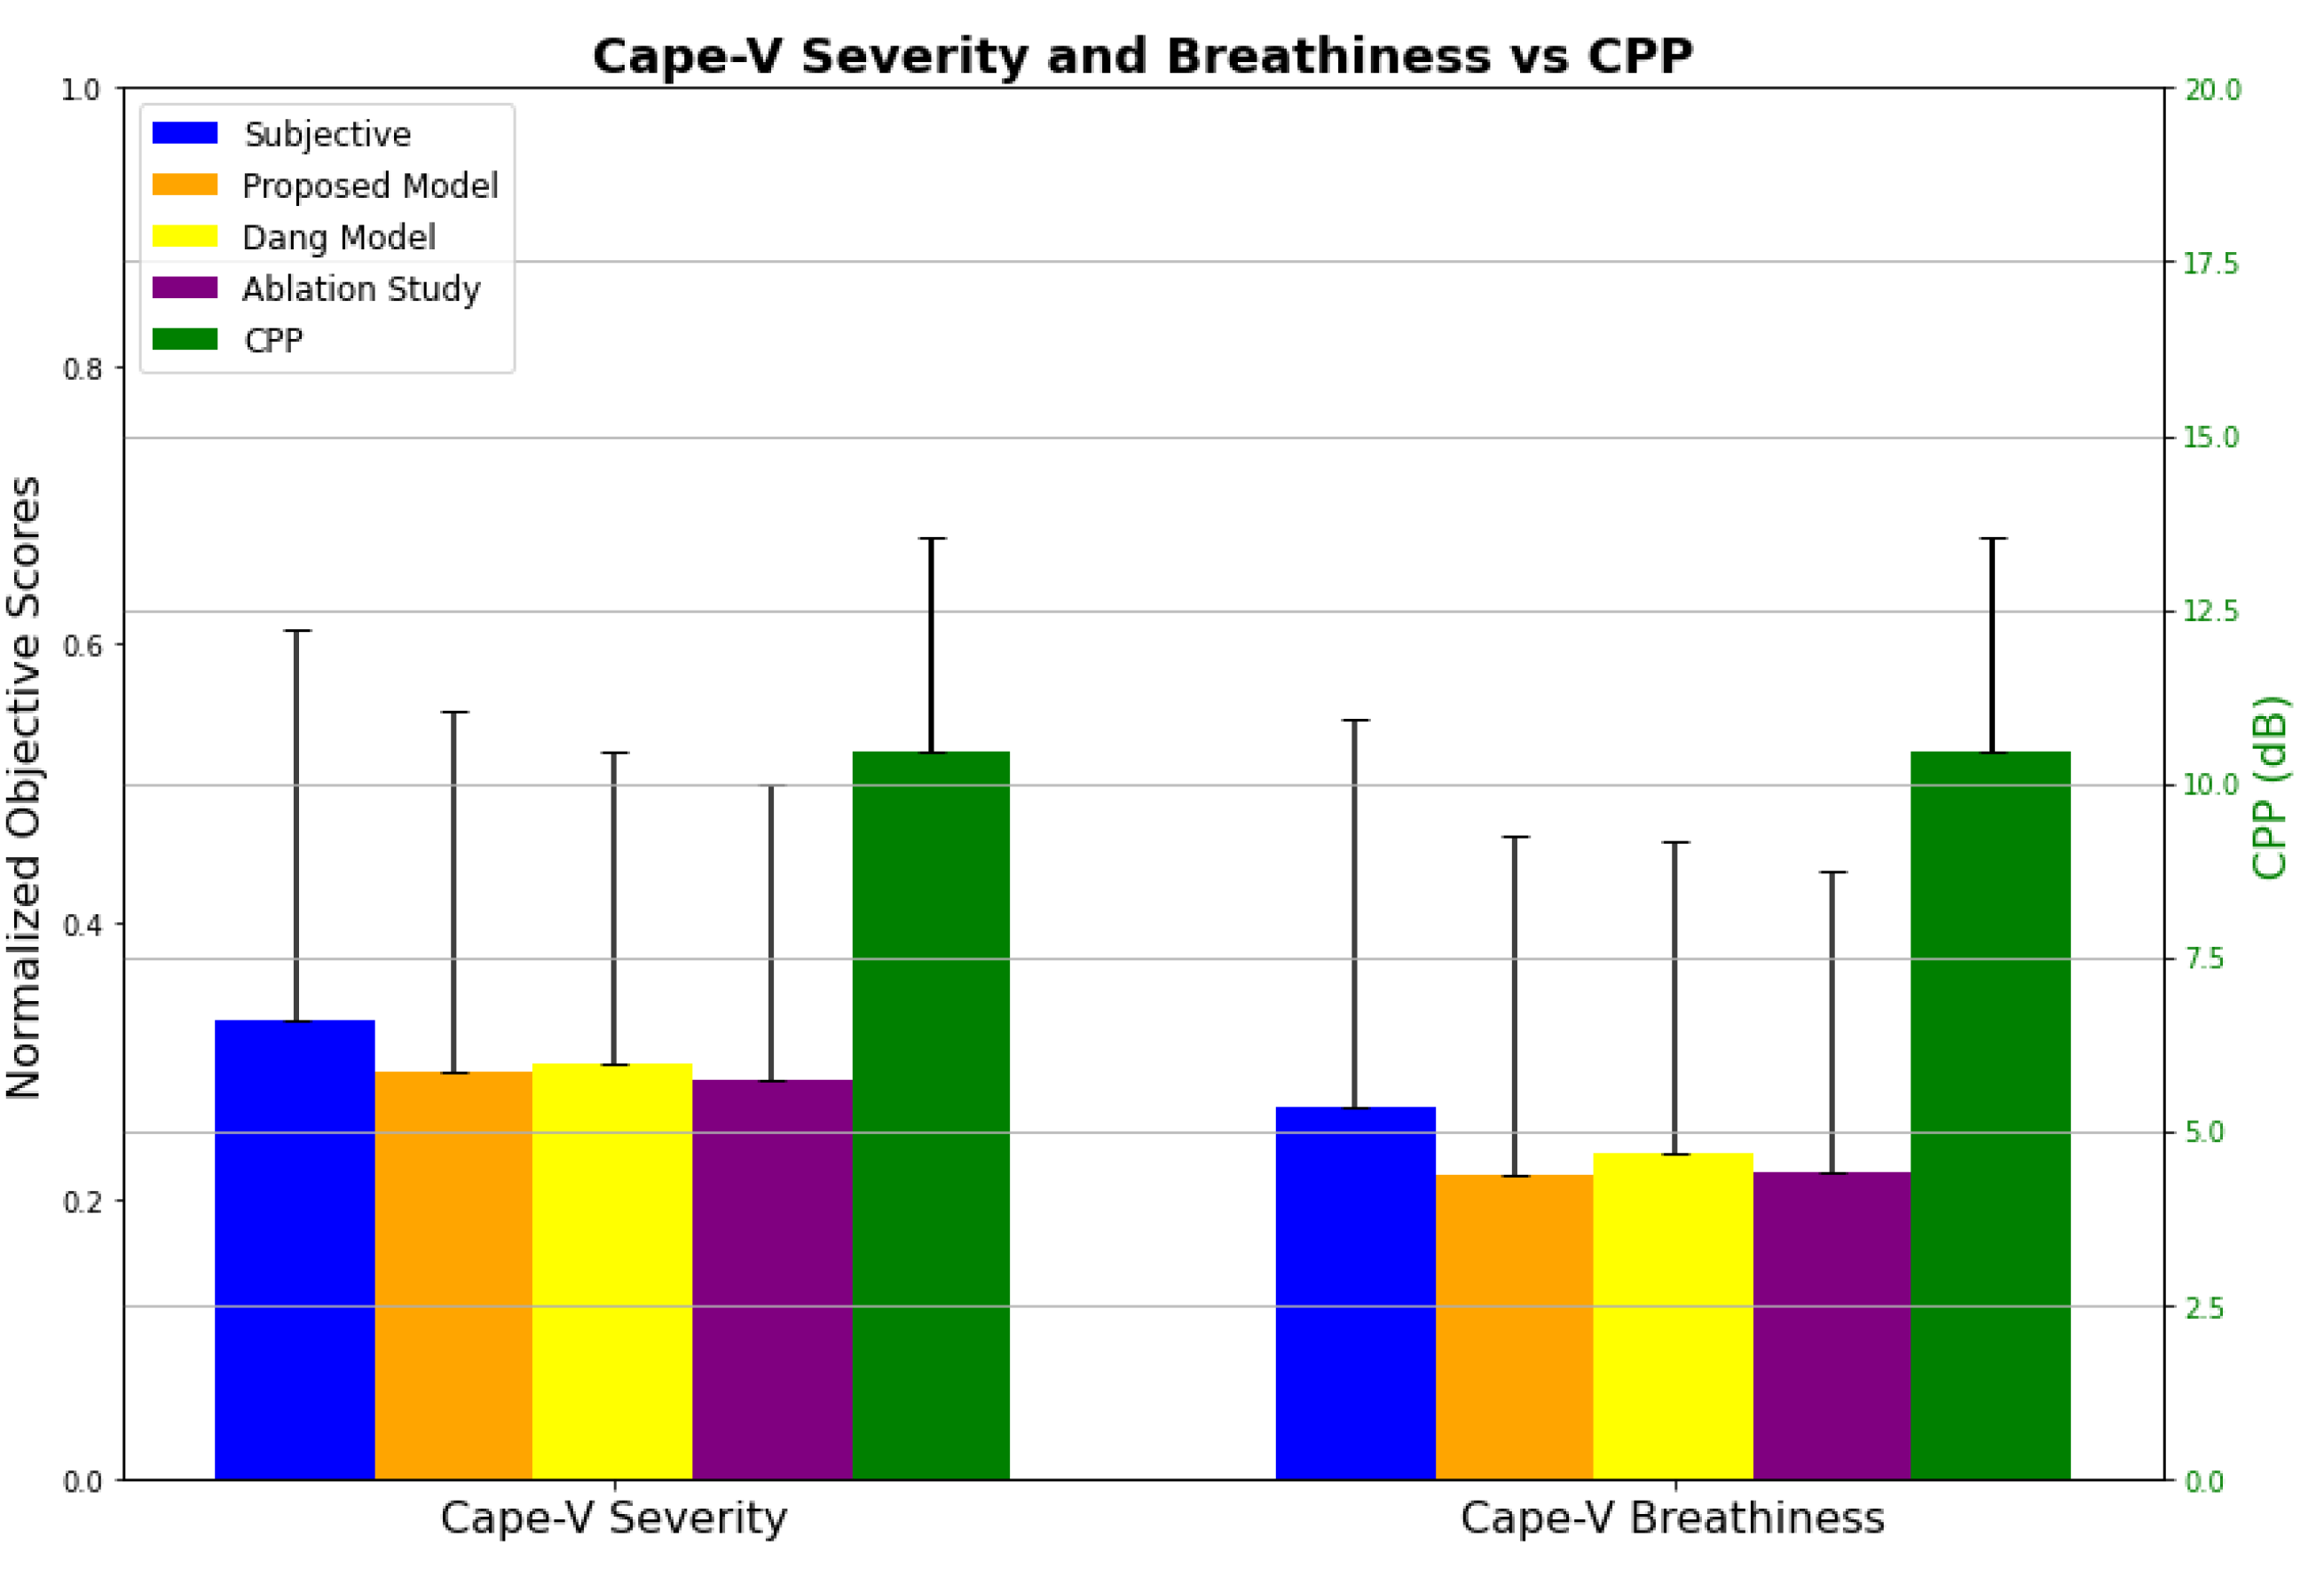
Figure 6.
Scatter plot displaying the subjective based Cape-V breathiness and severity scores against the different methods. (a) Cape-V breathiness between subjective scores and objective predicted scores, (b) Cape-V severity between subjective scores and objective predicted scores, (c) Cape-V breathiness between subjective scores and CPP, (d) Cape-V severity between subjective scores and CPP.
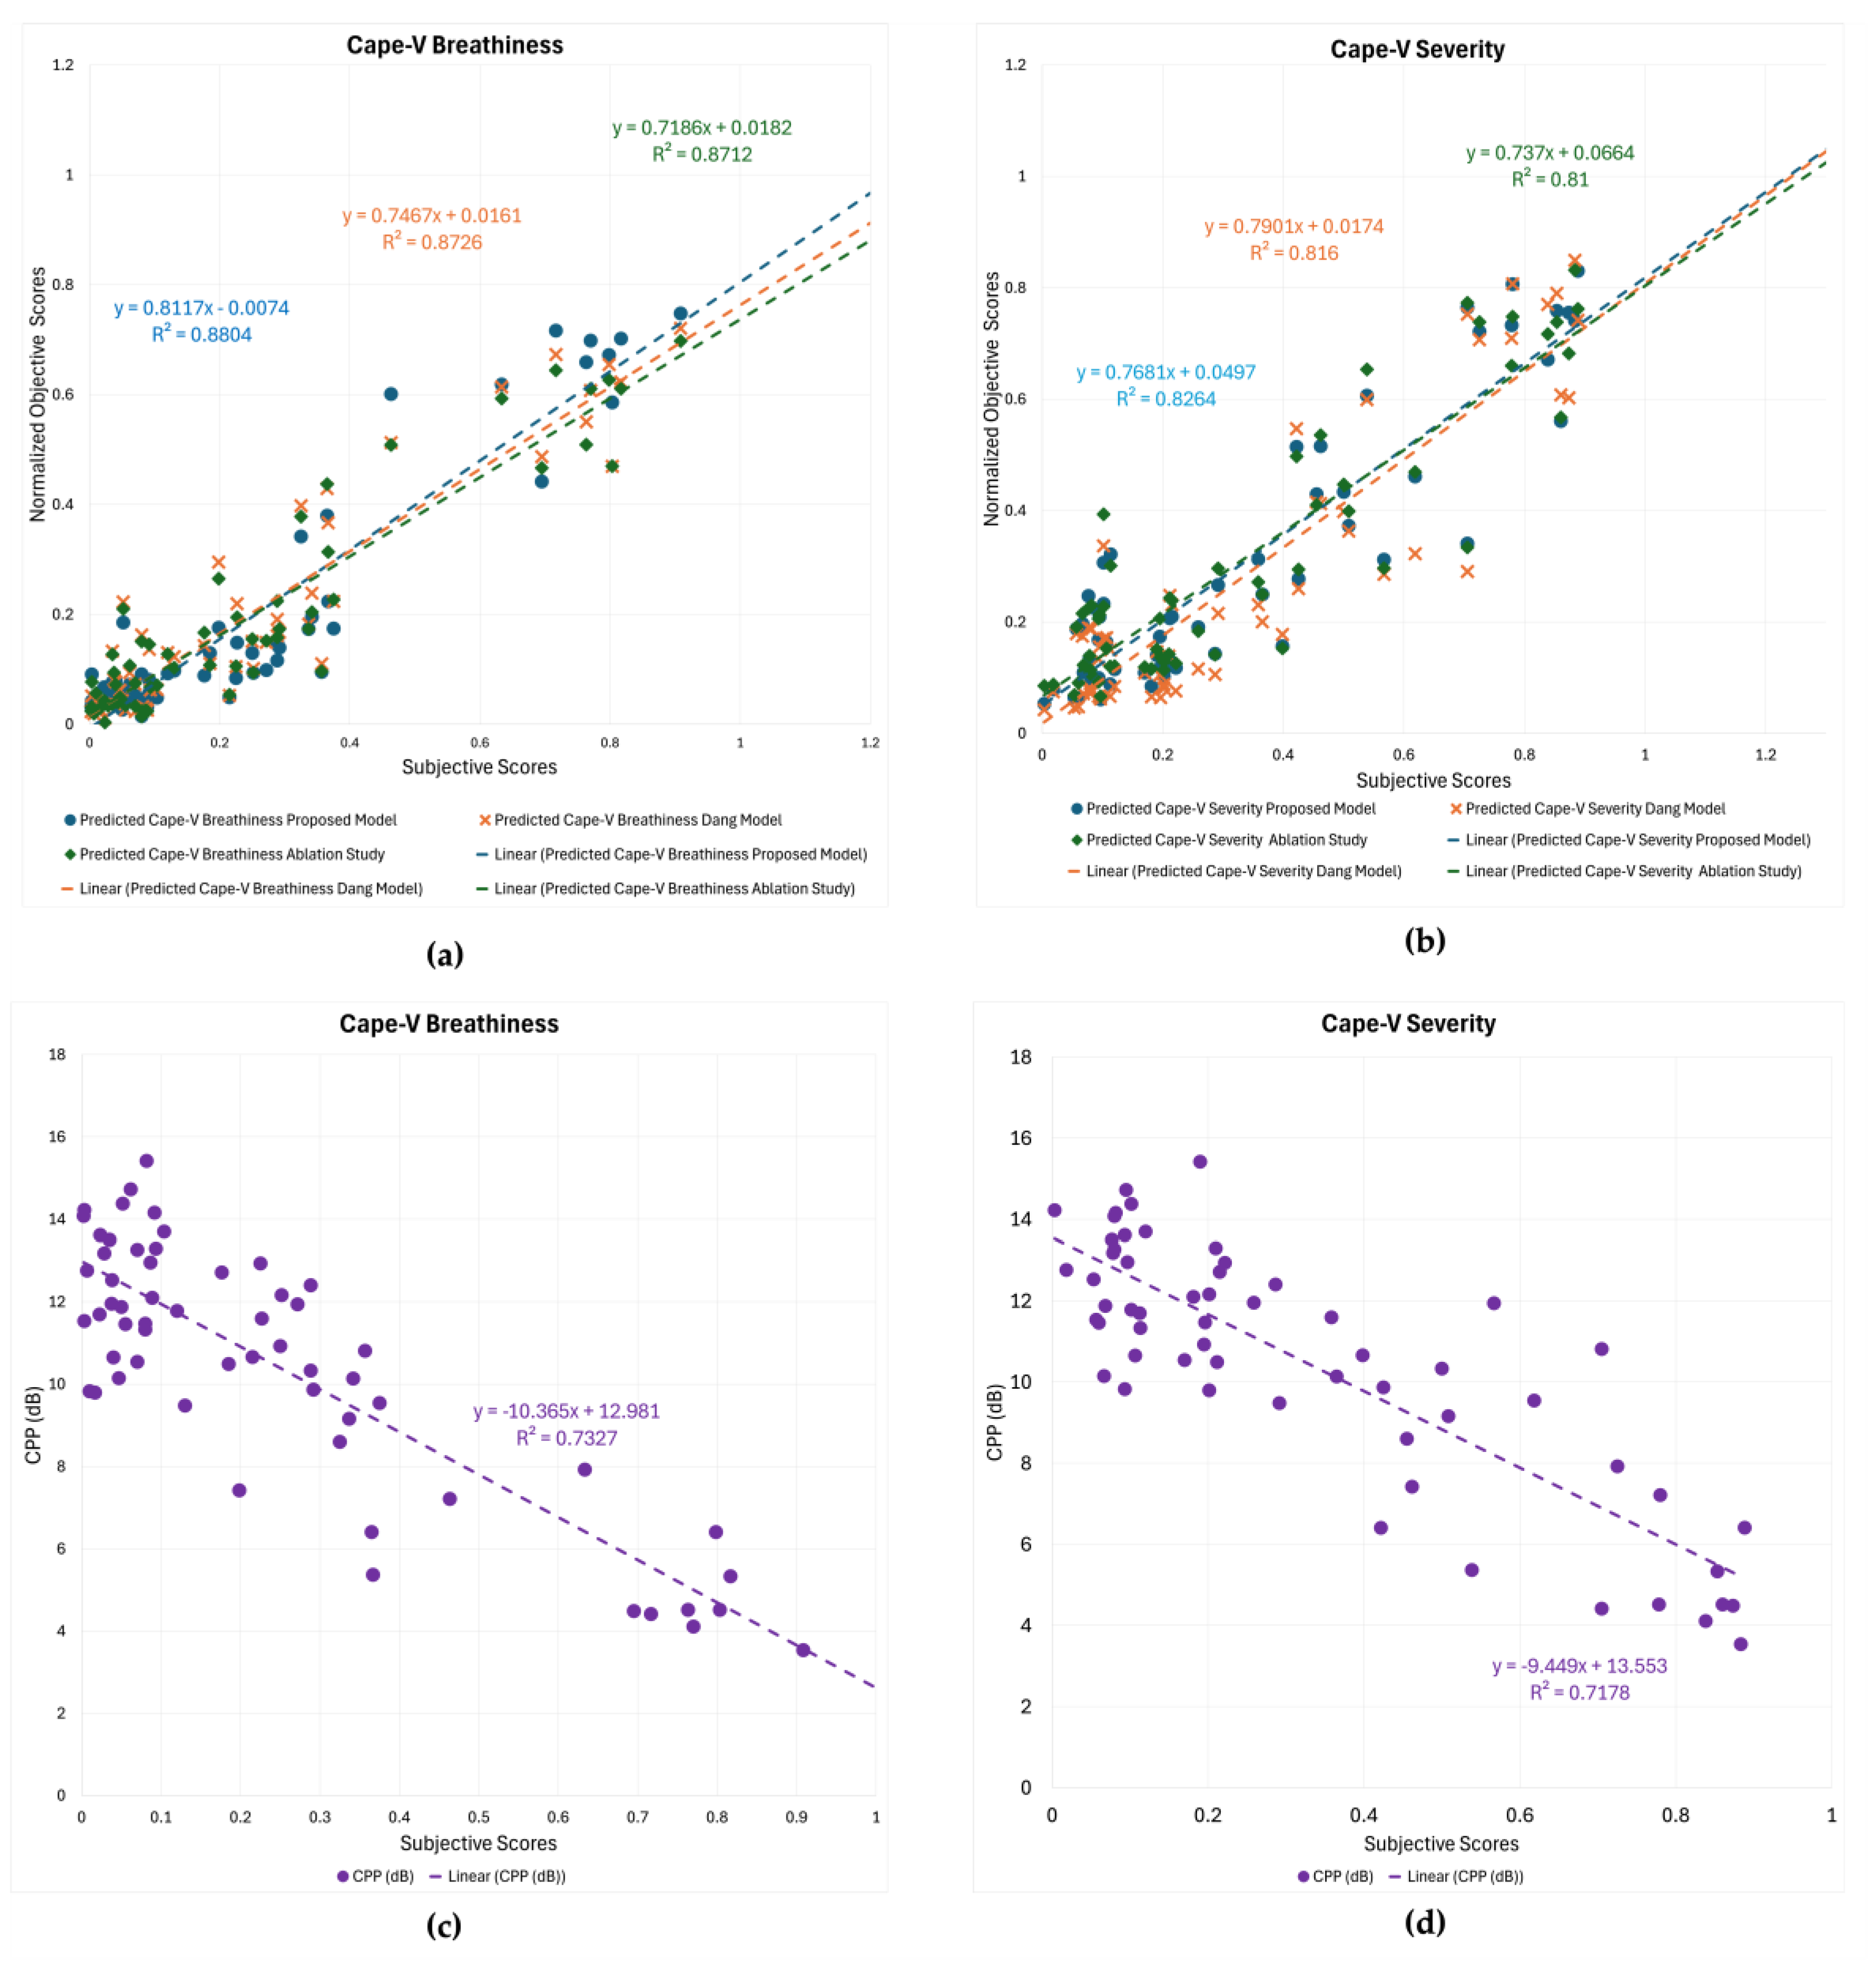
Figure 7.
Correlation between mean subjective Cape-V severity scores and predicted severity score using the proposed model on unseen dataset.
Figure 7.
Correlation between mean subjective Cape-V severity scores and predicted severity score using the proposed model on unseen dataset.
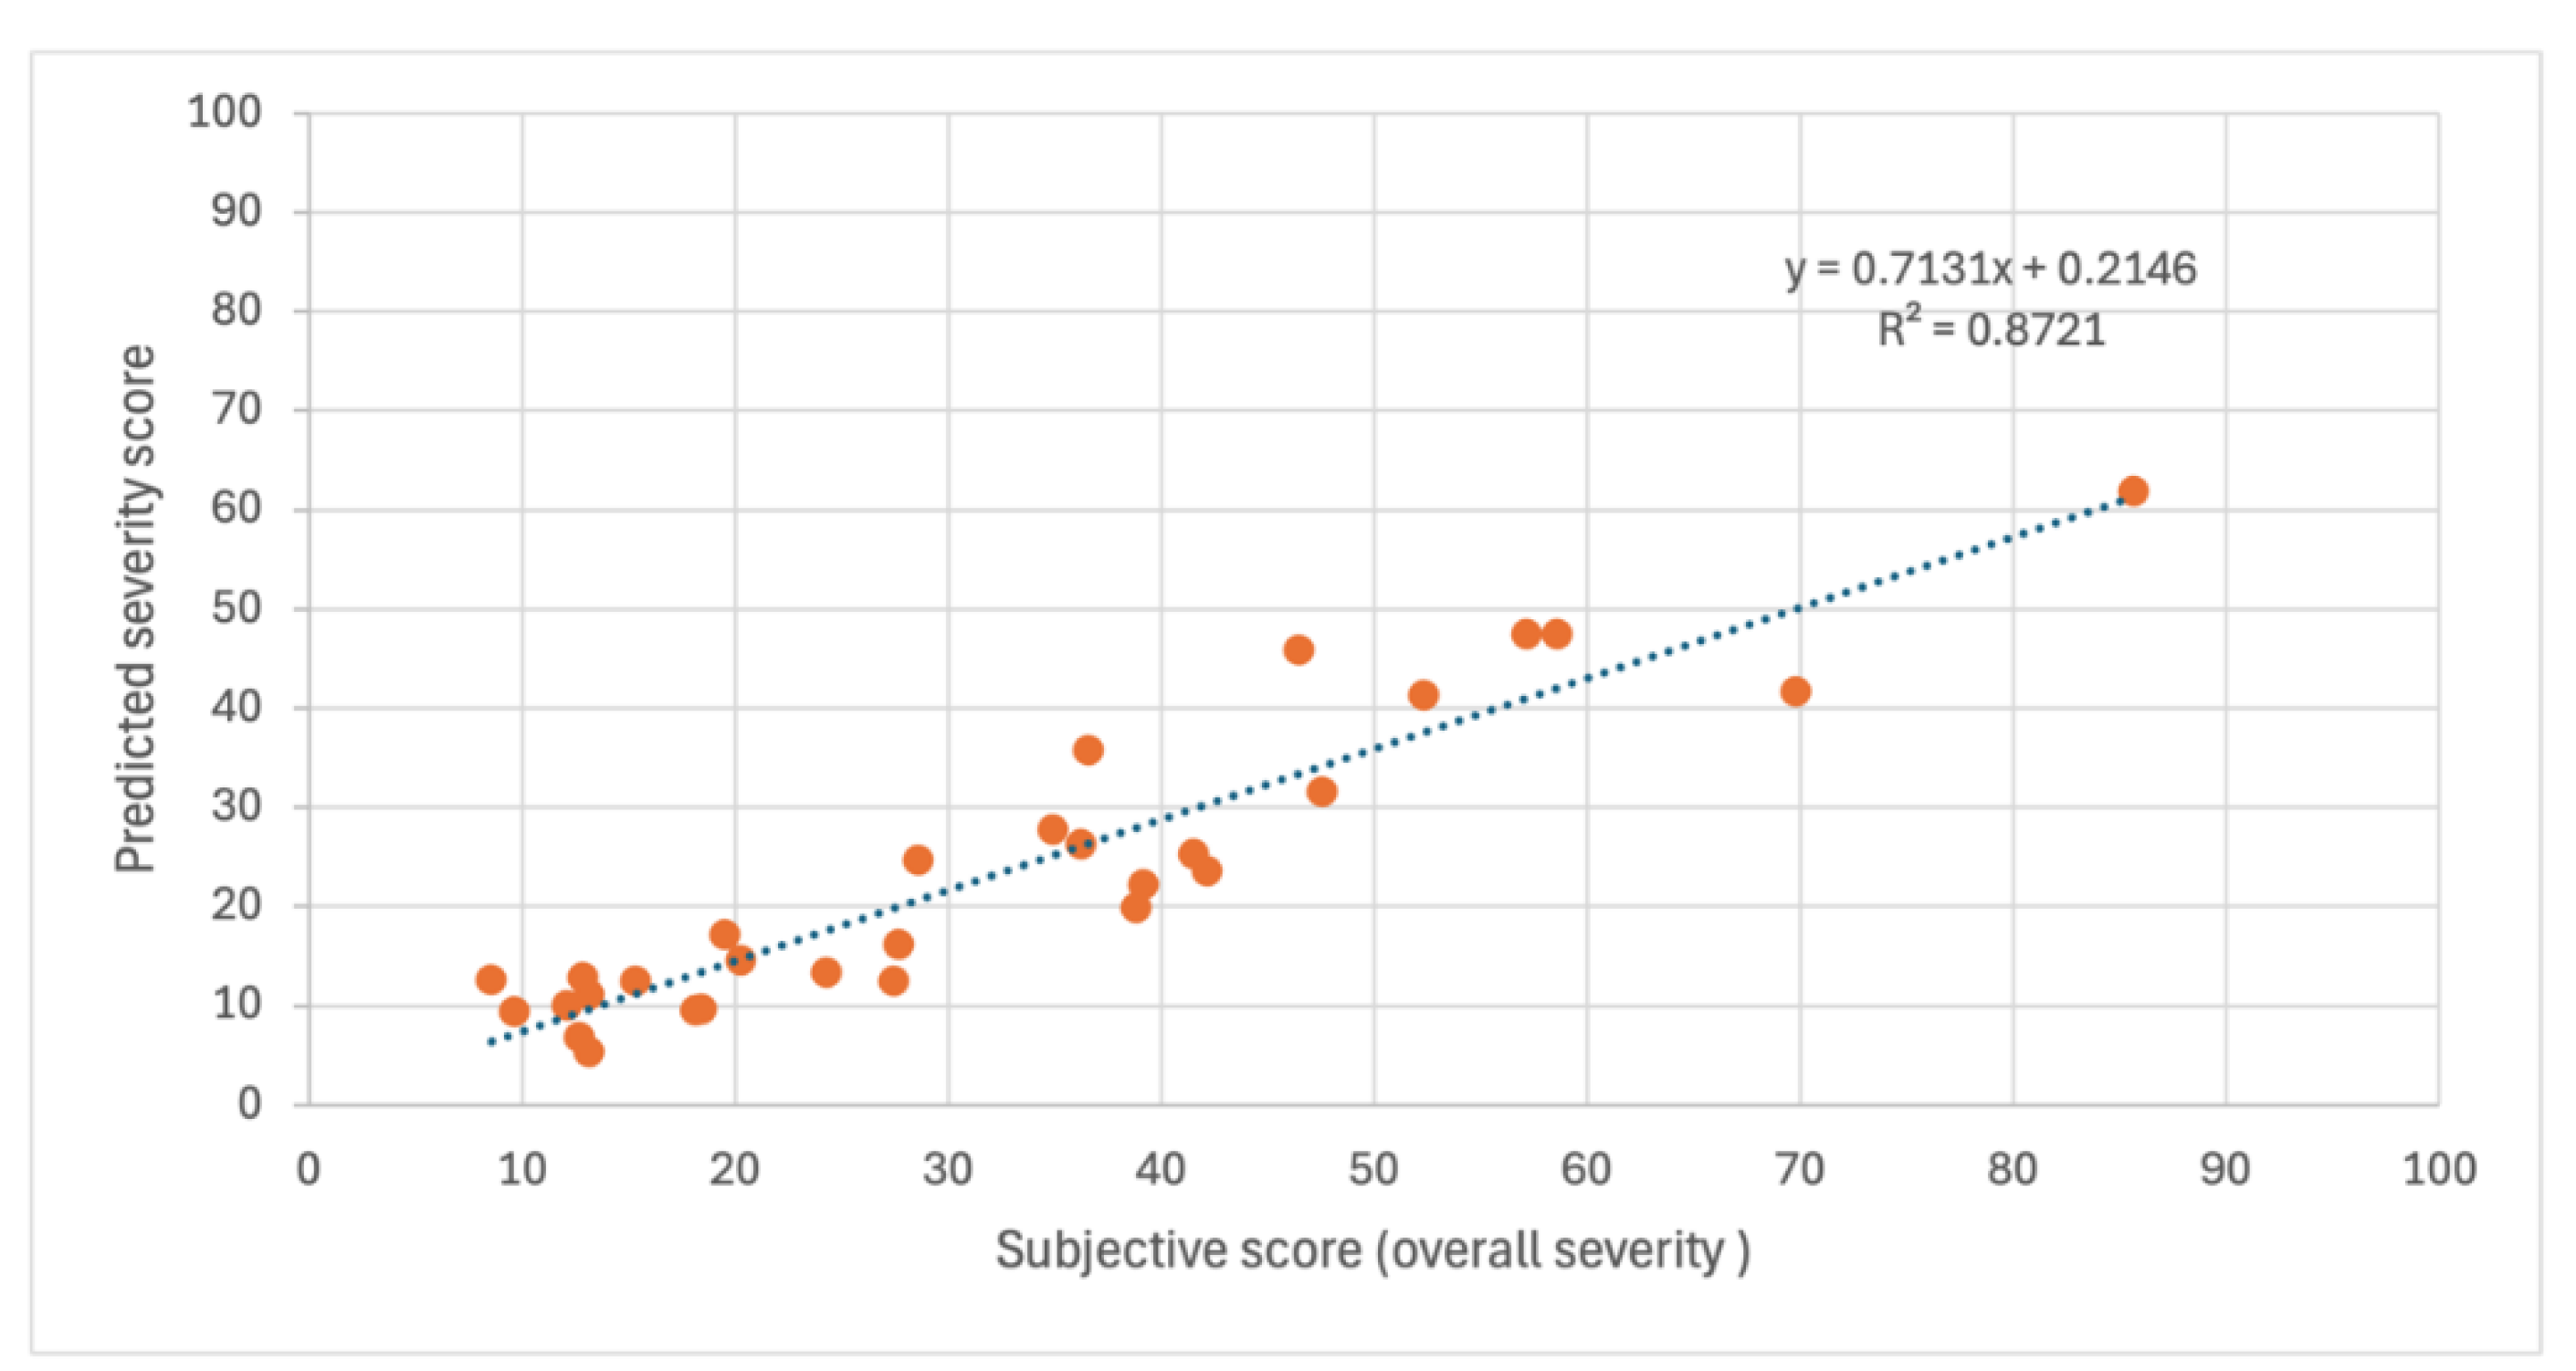

Table 1.
Pearson correlation coefficients and RMSE values resulting from the comparison between the subjective and objective scores. * Benjamin et al. [34] results are from the entire dataset of 295 talkers, whereas the remaining model scores were calculated for the test dataset of 59 talkers.
Table 1.
Pearson correlation coefficients and RMSE values resulting from the comparison between the subjective and objective scores. * Benjamin et al. [34] results are from the entire dataset of 295 talkers, whereas the remaining model scores were calculated for the test dataset of 59 talkers.
| Method | CAPE-V severity | CAPE-V breathiness | Trainable Parameters | ||
|---|---|---|---|---|---|
| Correlation | RMSE | Correlation | RMSE | ||
| Sentence Level: | |||||
| Proposed | 0.8810 | 0.1335 | 0.9244 | 0.1118 | 242,423,655 |
| Dang et al. [33] | 0.8784 | 0.1423 | 0.9155 | 0.1159 | 336,119,692 |
| Dang et al. [33], Ablated | 0.8685 | 0.1386 | 0.9104 | 0.1216 | 241,177,500 |
| CPP (dB) | -0.7468 | 0.1835 | -0.7577 | 0.1665 | - |
| HNR (dB) | -0.4916 | 0.2402 | -0.4898 | 0.2225 | - |
| Talker Level: | |||||
| Proposed | 0.9092 | 0.1189 | 0.9394 | 0.1029 | |
| Dang et al. [33] | 0.9034 | 0.1286 | 0.9352 | 0.1060 | |
| Dang et al. [33], Ablated | 0.9000 | 0.1237 | 0.9342 | 0.1111 | |
| Benjamin et al. [34] * | 0.8460 | 0.1423 | - | - | |
| CPP (dB) | -0.8489 | 0.1458 | -0.8576 | 0.1307 | |
| HNR (dB) | -0.5330 | 0.2333 | -0.5296 | 0.2156 | |
Disclaimer/Publisher’s Note: The statements, opinions and data contained in all publications are solely those of the individual author(s) and contributor(s) and not of MDPI and/or the editor(s). MDPI and/or the editor(s) disclaim responsibility for any injury to people or property resulting from any ideas, methods, instructions or products referred to in the content. |
© 2025 by the authors. Licensee MDPI, Basel, Switzerland. This article is an open access article distributed under the terms and conditions of the Creative Commons Attribution (CC BY) license (http://creativecommons.org/licenses/by/4.0/).
Copyright: This open access article is published under a Creative Commons CC BY 4.0 license, which permit the free download, distribution, and reuse, provided that the author and preprint are cited in any reuse.


