
Submitted:
22 May 2025
Posted:
22 May 2025
You are already at the latest version
Abstract
Parkinson's disease (PD) through speech analysis is a promising area of research, as speech impairments are often one of the early signs of the disease. This study explores the potential of automatic speech recognition (ASR) models, namely Wav2Vec 2.0 and HuBERT, for detecting PD through fine-tuning these pre-trained models on speech data and employing transfer learning techniques. These models, pretrained on large unlabeled datasets, can be capable of learning rich speech representations that capture acoustic markers of PD. The study also proposes the integration of a supervised contrastive learning (SupCon) approach to enhance the models' ability to distinguish PD-specific features. Additionally, the proposed ASR-based features were compared against two common acoustic feature sets: mel-frequency cepstral coefficients (MFCCs) and the extended Geneva minimalistic acoustic parameter set (eGeMAPS) as baseline. We also employ gradient-based methods, Grad-CAM, to visualize important speech regions contributing to the models' predictions. The experiments, conducted using the NeuroVoz dataset, demonstrated that features extracted from the pre-trained ASR models exhibited superior performance compared to the baseline features. The results also reveal that integrating SupCon consistently outperforms traditional cross-entropy based models. Wav2Vec2.0 and HuBERT with SupCon achieved the highest F1-scores of 90.0% and 88.99% respectively. Additionally, their AUC scores in the ROC analysis surpassed the cross-entropy models which had comparatively lower AUCs ranging from 0.84 to 0.89. These results highlight the potential of ASR-based models as scalable, non-invasive tools for diagnosing and monitoring PD, offering a promising avenue for early detection and management of this debilitating condition.
Keywords:
Parkinson’s disease (PD)
; Deep Learning
; Transfer learning
; Supervised Contrastive Learning
; Wav2Vec 2.0
; HuBERT
1. Introduction
Parkinson's disease (PD), a progressive neurodegenerative disorder, affects millions of people worldwide, causing significant motor, cognitive, and speech impairments [1,2]. With the global prevalence of PD projected to increase twofold by 2040, accurate and timely diagnosis, as well as monitoring of disease progression, have become crucial for optimizing treatment outcomes and improving quality of life for patients [3,4]. Traditional methods of assessing Parkinson's severity, such as the Unified PD Rating Scale (UPDRS), rely on subjective evaluations by clinicians, which can be time-consuming, costly, and prone to inter-rater variability [5,6].
Speech analysis has emerged as a promising biomarker for PD (PD) diagnosis and monitoring in recent years. Individuals with PD often exhibit distinct speech patterns, including tremors, rigidity, and hesitation, which can be indicative of the disease's progression [3]. These vocal changes are frequent among the earliest observable symptoms of the disease, making them particularly valuable for early detection and ongoing assessment [7].
Recent advancements in signal processing, machine learning (ML), and deep learning (DL) have shown significant interest in the automated detection and classification of Parkinson's disease severity through speech analysis [8]. Typically, these detection approaches employ a two-stage pipeline: feature extraction followed by classification. The development of these systems relies on supervised learning techniques, utilizing speech samples collected from both healthy individuals and those diagnosed with PD. The binary classification (Parkinson's vs. non-Parkinson's) is based on clinical diagnoses provided by neurologists and movement disorder specialists. Researchers have explored various models and feature extraction techniques to identify and highlight the distinctive characteristics of PD-affected speech [2,9,10,11].
Building on these advancements, recent studies have increasingly focused on two main approaches: feature selection for shallow classifiers and deep learning architectures. The first approach involves hand-crafting acoustic features that capture speech abnormalities associated with PD and using conventional machine learning algorithms, including support vector machine (SVM) classifiers, random forest models, and k-nearest neighbor (kNN) techniques [11,12,13,14,15]. The models were trained using diverse speech characteristics including acoustic features (jitter, shimmer, and harmonic-to-noise ratios) alongside complexity measurements to identify changes in voice production that occur in Parkinson's Disease patients [9,10,11,16,17]. While this approach has shown promising results, the second approach, which leverages deep learning to automatically learn features directly from speech data, has demonstrated superior performance. Various neural network architectures, including Convolutional Neural Networks (CNNs), Recurrent Neural Networks (RNNs), and transformer-based models, have achieved state-of-the-art results on PD detection from speech [16,18,19,20,21,22,23]. These architectures can process different types of input representations - from raw audio waveforms that preserve the complete temporal information, to spectrograms that capture the time-frequency characteristics of speech, or even a combination of both. Overall, deep learning models excel at automatically learning relevant speech patterns, eliminating the need for manual feature engineering by experts. By leveraging transfer learning, these models can build upon knowledge gained from related speech tasks to improve their accuracy in detecting Parkinson's Disease [16,24].
However, in various fields, acquiring labeled data poses significant challenges. Consequently, there has been substantial progress in pre-training deep learning models with unlabeled data. Recently, a promising approach utilizing automatic speech recognition (ASR) models combined with self-supervised learning has emerged and gained widespread attention. This approach is helpful in research areas where datasets are often limited in size [25]. The process involves training models on large speech datasets in an unsupervised manner, allowing them to learn speech representations from tasks-audio that can be applied to specific downstream task. Pre-trained models like Wav2Vec 2.0 [26] and HuBERT [27] have demonstrated effectiveness in various speech technology applications, including voice pathology detection [25,28,29,30]. Studies have demonstrated that ASR models, originally designed for speech-to-text tasks, have the potential to be repurposed for other disease related detection by analyzing speech patterns and identifying acoustic biomarkers associated with the disease. These models have shown promise in tasks relevant to PD, such as detecting subtle speech changes and classifying severity levels of dysarthria, a common speech impairment in PD patients [25]. This study found that HuBERT features outperformed traditional acoustic features in detecting and classifying dysarthric speech, with absolute accuracy improvements of up to 2.86% and 10.46% in detection and severity level classification of tasks, respectively [25]. A recent study demonstrated that Wav2Vec features can effectively classify PD patients, with a minimum AUROC of 0.77 and a maximum AUROC of 0.98 in cross-database experiments [31]. In another study, Wav2Vec 2.0 was employed to classify raw speech recordings for PD detection using a dataset collected via a midrange Android smartphone, achieving a notable accuracy of up to 97.92% in distinguishing PD from non-PD individuals. However, the authors highlighted difficulties in making precise multi-class predictions across different stages of the disease [32]. Despite the promising results of recent studies, the application of ASR models in PD diagnosis and monitoring remains a relatively underexplored area of research.
In this study, we first explore the potential of popular ASR models, specifically Wav2Vec 2.0 and HuBERT, for the detection of PD from speech. We propose that these models, having learned rich speech representations from large datasets, are capable of effectively capturing the distinctive acoustic characteristics associated with PD, leading to accurate detection. We also aim to find out the explainability of these models by employing gradient-based feature importance methods like Grad-CAM [33], visualizing the speech signal regions that contribute most significantly to the model's decision.
Furthermore, we propose the integration of a supervised contrastive learning [34] approach in conjunction with a classification head within the training objectives, a strategy that has not yet been explored in this context of ASR models. The supervised contrastive approach is expected to help in grouping similar speech representations more closely, while distancing those that are dissimilar, which can improve the model’s ability to discern PD-specific features. In addition to leveraging advanced ASR models, we established baseline comparisons using two classical machine learning approaches: an extreme gradient boosting (XGBoost) [35] model and a multilayer perceptron (MLP). These models were trained on traditional acoustic features: mel-frequency cepstral coefficients (MFCCs) and the extended Geneva minimalistic acoustic parameter set (eGeMAPS) [36].
After a thorough assessment, which included fine-tuning and careful examination of the effects of supervised contrastive learning, it is indicated that this method has the capability to enhance overall performance.
2. Materials and Methods
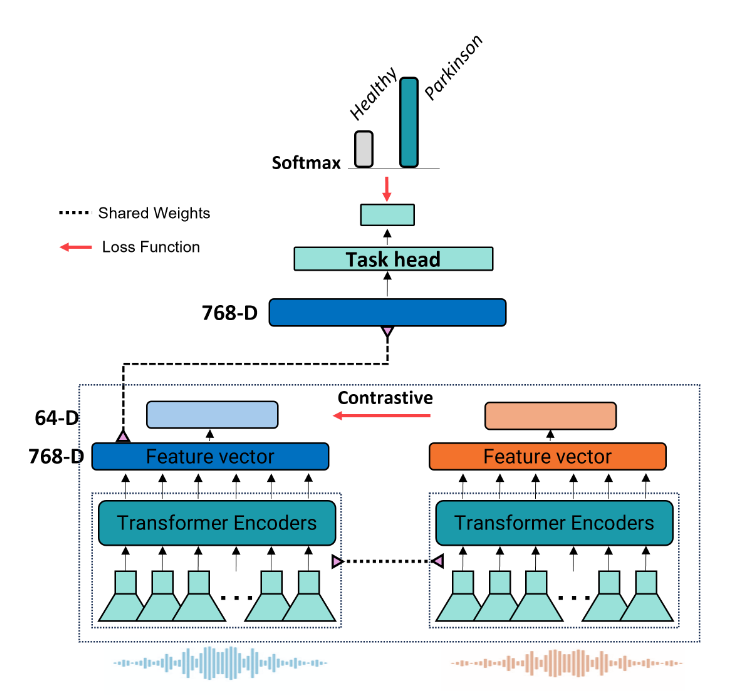
This speech classification system, depicted in Figure 1, analyzes 5-second audio clips to identify individuals with PD. The process begins with a Transformer Encoder that converts raw audio into a meaningful feature vector. This vector is then processed through two parallel pathways: one task head that classifies the audio as "Healthy" or "Parkinson," and a projection network aimed at enhancing model robustness via supervised contrastive learning.
For the base model, only the classifier is utilized. To investigate the effects of supervised contrastive learning, both the classifier and the projection network are employed, with gradient flow from the classification head blocked. The architecture employs a unified training approach where the classifier, encoder, and projection networks are trained simultaneously. By blocking the backward flow of gradients from the classifier to the encoder, this design eliminates the traditional requirement for separate training phases.
2.1. Dataset
This study used the recently updated NeuroVoz voice and speech database, as originally described in [37,38], which includes recordings from 112 adult native speakers of Castilian Spanish. The participants are divided into two groups: 58 healthy controls (HC) and 54 individuals diagnosed with PD. The recordings were collected by the Bioengineering and Optoelectronics Group at the Universidad Politécnica de Madrid, in collaboration with the Otorhinolaryngology and Neurology Departments of Gregorio Marañón Hospital in Madrid, Spain. The database features a variety of speech tasks, such as sustained vowel phonation, diadochokinetic (DDK) tests, recitation of predetermined sentences, and spontaneous speech describing an image. Further details about the database can be found in reference [37,38].
In this study, we used a subset of the complete dataset, consisting of 16 repeated utterances totaling 1,695 audio samples. Of these, 828 were from individuals with PD, and 867 were from HC. This selection was made because we aimed to utilize an ASR model that had been pretrained on comparable large-scale dataset. The histogram in Figure S1 compares audio recording durations between two study groups: healthy controls (HC) and individuals diagnosed with PD. Further details about the speech tasks are provided in supplementary Tables S1 and S2. To our knowledge, while one study examined small subsets of this dataset using DDK and vowels [16], no comprehensive analysis of the complete subset has been conducted to date.
2.2. Data Preprocessing
To prepare the audio data for analysis by deep learning models, several preprocessing steps were implemented. The first step standardized all recordings to a 16000 kHz sampling rate. Next, silent segments at the beginning and end of each recording were eliminated. The dataset contained varied recording durations, as illustrated in Figure S1. To facilitate uniform batch processing during model training, each recording was adjusted to a standard 5-second length. This was achieved by adding padding to shorter segments and cutting off excess audio from longer recordings. Moreover, in order to enhance model generalization given the limited training data size, we expanded the dataset using audio augmentation techniques. Specifically, we applied low-pass filtering through the torch audio augmentation library [39] s part of the preprocessing pipeline. This augmentation was restricted to the training set only, while validation and test sets remained unmodified to maintain their real-world characteristics.
Moreover, in order to reduce overfitting given the initially small training dataset, the limited data set was expanded through the application of simple low-pass filter audio augmentation using the torch audio augmentation library prior to executing put into model. This data expansion aims to improve generalizability. Data augmentation was not used for the validation and test sets so that these sets would resemble real-world data.
2.3. Deep Learning Models
Our research evaluates the effectiveness of two leading self-supervised speech models - Wav2Vec 2.0 [26] and HuBERT [27]- in processing speech patterns for specialized applications. Both models were pretrained on the extensive LibriSpeech corpus, a well-regarded dataset in the speech processing community.
Wav2Vec 2.0 and HuBERT are self-supervised models for learning speech representations directly from raw audio, leveraging multi-layer CNN encoders and 12-layer transformer-based context networks (Figure 2). Wav2Vec 2.0 processes raw audio into 768-dimensional contextual embeddings through convolutional layers with a stride of 20 ms and a receptive field of 25 ms, followed by masked transformer-based context modeling and a contrastive learning objective to distinguish true quantized representations from distractors, as described by Baevski et al. [26]. In contrast, HuBERT employs a k-means clustering step to generate discrete target units from MFCC features, learning to predict embeddings for masked segments using cross-entropy loss, with clustering refined iteratively using deeper model layers [27]. Both models output 768-dimensional feature vectors from their final transformer layers, which we use for analysis. For PD detection, these feature vectors are passed through a simple one-layer fully connected classifier (Figure 2c), which reduces them to 64 dimensions via a linear transformation, applies ReLU activation, dropout for regularization, and a final linear transformation to produce predictions. The same classification architecture, including a 32-dimensional hidden layer in the projection network, is used across all models.
2.4. Supervised Contrastive Learning (SupCon)
Contrastive learning is a powerful self-supervised learning technique that has gained significant attention in recent years, particularly in the fields of computer vision and natural language processing [34,40,41]. The core idea behind contrastive learning is to learn representations by comparing similar and dissimilar samples in a dataset. This approach enables models to capture meaningful features and relationships within the data without relying on explicit labels. The method is frequently used in self-supervised learning, where the task is to learn meaningful features from unlabeled data [34]. In supervised settings, where labels are available, a given sample may have multiple positive samples (i.e., multiple samples that belong to the same class). The standard contrastive loss does not account for this and can only handle one positive per anchor sample, making it unsuitable for supervised learning tasks where there are several samples from the same class [34,42].
Contrastive loss for supervised learning can be generalized to incorporate multiple positive samples. This is done by summing over all positives for a given anchor sample, denoted as . As shown in Eq. 1, for instance, the contrastive loss for each sample is computed by considering all positive samples , where represents the set of positive samples for the anchor . The supervised contrastive loss then evaluates the distance between the anchor and all positive samples relative to a set of negatives (samples that belong to different classes). The function inside the log term measures the similarity between the anchor and a positive sample , normalized by the sum of exponentials of similarities between the anchor and all other samples , where is the set of all samples except the anchor. This is scaled by a temperature parameter to control the sharpness of the distribution. All our experiments used a temperature of τ = 0.07. Lower temperature benefits training more than higher ones, but extremely low temperatures are harder to train due to numerical instability [34,43,44]. This formulation enables the incorporation of multiple positive samples, making it particularly well-suited for supervised learning environments [42]. The contrastive loss is defined as follows:
where:
represents the normalized projections of the input samples into an embedding space, where N is the number of samples and is the dimensionality of the embedding.
i ∈ I refers to each sample in the batch,
P(i) is the set of positive samples for the anchor i,
A(i) is the set of all other samples excluding the anchor,
is a temperature parameter to scale the similarities, typically set at .
denotes the cosine similarity between the projections and .
In datasets with numerous easy-to-contrast pairs, contrastive loss gradients can become minimal, hindering informative updates [42,45]. To mitigate this, we employ hard pair scaling with a factor of 1.5, identifying the most challenging negative examples through cosine similarity analysis. Noting that, while supervised contrastive loss aims to distinguish pairs across classes, we complement this with a softmax-based cross-entropy loss [34], blocking its gradient to prevent encoder updates during training.
2.5. Baseline Features and Model Used for Comparison
A baseline approach was established using traditional acoustic feature extraction. Two primary feature sets were selected: MFCCs and eGeMAPS, known for their ability to distinguish pathological from healthy speech [20,25,46,47]. MFCCs were computed using Hamming-windowed frames of 25 ms with a 5 ms shift, producing a 39-dimensional vector per utterance, including cepstral coefficients and their derivatives, via the Librosa library [48]. eGeMAPS (extended Geneva minimalistic acoustic parameter set) [36], designed to capture key vocal characteristics, comprised 88 features, including prosodic, excitation, vocal tract, and spectral descriptors, extracted using the openSMILE toolkit [25,49].
The extracted features were classified using an XGBoost model [35] (details in supplementary materials) and a multilayer perceptron (MLP) with a predefined architecture. These classifiers predicted speech categories and served as a baseline for comparison with proposed ASR-based deep learning methods.
2.6. Experimental Setup and Training Parameters
We utilized several Python libraries in our implementation, including PyTorch [39] for developing deep learning models, Pandas [50] and NumPy [51] for data manipulation and analysis, and Matplotlib [52] along with Scikit-learn [53] for visualization and certain analytical tasks.
As detailed in Table 1, key training hyperparameters used during model optimization included learning rate, batch size, and number of epochs. The models were trained using an Adaptive Moment Estimation optimizer with Weight Decay (AdamW), an optimization algorithm with cross-entropy loss to measure prediction error [54]. A learning rate of 2e-5 was set initially and adjusted over time per a scheduler. We implemented the experiments using a system comprising an Intel Core i7 13700K CPU @ 5.2 GHz, with 128GB of RAM and GPU NVIDIA RTX 4090 24GB.
2.7. Evaluation Metrics
This study employed five primary evaluation criteria: accuracy, F1-score, specificity, sensitivity, and precision. The equations for these metrics are presented in Eqs. 2-6.
where TP, TN, FP, and FN represent the counts of true positives, true negatives, false positives, and false negatives, respectively. Sensitivity and specificity are important statistical metrics that indicate the proportion of correctly identified positive and negative cases.
2.8. The Grad-CAM Technique for Visual Explanations
Grad-CAM (Gradient-weighted Class Activation Mapping) [33] can be adapted for ASR transformer models to visualize prediction relevance in audio data. By overlaying Grad-CAM heatmaps on audio waveforms, researchers can identify which time segments contain critical features for model inference [55]. The technique involves computing gradients of the target output with respect to attention weights in the final transformer layer, allowing visualization of the most contributory audio signal parts for tasks like Parkinson's disease classification.
3. Results and Discussion
This section presents a comprehensive analysis of the results and assesses the performance of the models examined in this study.
3.1. Classification Performance
To assess the models' performance in a fair and comprehensive manner, we divided the dataset into two parts: 80% for training and 20% for testing, ensuring no speaker overlap between them. The test set served as the final evaluation benchmark. Using the training set, a stratified speaker-independent 5-fold cross-validation approach was implemented for all experiments. The data was divided into 5 folds, ensuring no overlap of patients between folds to prevent data leakage. The model was trained on 4 folds (80% of training data) and assessed on the remaining fold (20%), with this process repeated 5 times so each fold served as the evaluation set once. Early stopping was employed during training to prevent overfitting by saving the best-performing model based on validation performance. Finally, we evaluated the best model's generalization capability on the previously held-out test set. This method provided a rigorous assessment of model performance on unseen data. The performance of each model on the test set, including precision, recall, F1 score, and accuracy, is detailed in Table 2. The graph representation of the corresponding performance (F1 score) for each model is shown in Figure 3.
Across all models, training with Supervised Contrastive consistently yields better F1 scores, Precision, and Sensitivity compared to Cross Entropy alone. Specifically, Wav2Vec2.0 with Supervised Contrastive achieves the highest F1 score of 90.0%, along with improved performance on other metrics, indicating that supervised contrastive training benefits the model's ability to accurately identify and classify relevant patterns.
The bar graph visually represents the F1 scores of these models, showcasing Wav2Vec2.0-base and HuBERT with Supervised Contrastive as the top-performing configurations, with HuBERT's performance closely matching that of Wav2Vec2.0. The baseline models (XGBoost and MLP) trained on acoustic features achieved F1-scores between 73.33% and 74.52%, and AUC scores between 0.80 and 0.81. These results were significantly lower than those of our ASR-based models, demonstrating the superior performance of fine-tuned ASR models in PD detection. Among the models, MLP (MFCCs features) and XGBoost (MFCCs features) exhibit the lowest F1 scores. Of these, XGBoost and MLP training with egeMAPS features performs slightly better, but both are outperformed by the other models.
The error bars demonstrate the variability across runs, with the highest-performing models exhibiting lower variability. These results emphasize the effectiveness of Supervised Contrastive training across both ASR models, while fine-tuning for Spanish (Wav2Vec2.0-FT[es]) shows a competitive yet slightly lower performance, suggesting some limitations in the transferability or adaptation of the model across languages.
The proposed models also were assessed via cumulative confusion matrices and receiver operating characteristic (ROC) curves across a 5-fold cross-validation. The cumulative confusion matrices provide a comprehensive view of model performance by summarizing results across all folds. The ROC curves illustrate the tradeoff between the true positive rate and the false positive rate, offering insights into the diagnostic power of the models. The area under the ROC curve (AUC) serves as an indicator of model performance, with higher AUC values reflecting superior classification ability. The cumulative confusion matrices in Figure 4 evaluate the diagnostic performance of three models trained with cross entropy and SupCon across five cross-validation folds.
In the context of diagnosing PD, recall (sensitivity) is particularly critical because Parkinson's is a progressive neurodegenerative disorder where early detection is essential for managing symptoms and potentially slowing disease progression. High recall ensures that the model captures as many true Parkinson cases as possible, minimizing false negatives that could delay essential treatment. Among the models, Wav2Vec 2.0 demonstrates the most balanced performance, achieving high sensitivity (92.6%) while maintaining competitive accuracy across both classes. HuBERT follows closely, but shows slightly lower sensitivity for Parkinson cases (91.3%), whereas the Wav2Vec 2.0-FT[es] model, although effective, has a lower recall for Healthy cases (73.8%) and performs best in identifying Parkinson cases (87.7%). This analysis shows that while all three models are good at differentiating between Healthy and Parkinson classes, Wav2Vec 2.0’s superior recall makes it particularly suitable for early diagnosis of PD, where maximizing sensitivity is essential to improving patient outcomes through timely treatment. Additionally, the cumulative confusion matrices for the baseline models are provided in Supplementary Figure S3.
Figure 5 presents the ROC curves comparing the performance of different model variants and training approaches. Overall, the baseline models (XGBoost and MLP) demonstrated lower performance (AUC < 0.81) compared to the ASR-based models. The SupCon methods demonstrated superior performance, with HuBERT SupCon and Wav2Vec SupCon achieving the highest AUC scores of 0.93 and 0.92, respectively. These results significantly outperformed the cross-entropy based approaches, which showed comparatively lower performance with AUC values ranging from 0.84 to 0.89. Specifically, Wav2Vec2-FT[es] CE showed the lowest performance with an AUC of 0.84, while Wav2Vec2 CE and HuBERT CE performed moderately better with AUC scores of 0.89 and 0.88, respectively. The steeper curves and higher true positive rates at lower false positive rates for the SupCon models indicate their enhanced ability to discriminate between classes compared to their CE-based counterparts.
To more effectively assess the model's performance across different utterances in the dataset, we analyzed the accuracy for each individual sentence type. Figure S4 presents a comparative analysis of the detection accuracy across various speech samples. The analysis includes both Wav2Vec 2.0 and HuBERT models, along with their variants, using Cross Entropy and Supervised Contrastive loss functions. The dataset comprises multiple sentence types, identified by specific IDs such as ABLANDADA, PIDIO, BURRO, and others, each representing distinct speech samples from the dataset.
Results showed that Wav2Vec 2.0 shows superior performance, especially when paired with Supervised Contrastive Loss, achieving accuracies between 0.87-0.94, compared to 0.83-0.89 with Cross Entropy Loss. The largest gain is observed for the " ABLANDADA " sentence, where accuracy reaches 0.94, showcasing this combination of model and loss function as particularly effective. HuBERT model performs slightly lower but still effectively, with accuracies of 0.84-0.91 using Supervised Contrastive Loss and 0.83-0.89 with Cross Entropy. Overall, Supervised Contrastive Loss consistently outperforms Cross Entropy across both models, with Wav2Vec 2.0 emerging as the most effective model for PD detection from this speech dataset.
3.2. Grad Cam Feature Visualization
Figure 6 shows Grad-CAM feature map visualizations for 10 sample audio clips taken from our dataset (ABLANDADA sentence). To ensure a meaningful comparison between Grad-CAM and t-SNE visualizations, we exclusively used models from the final fold. Grad-CAM analysis reveals which regions of the input contribute most significantly to the model's predictions. For this visualization, we focused on the output projections from the final self-attention layer. This layer encapsulates the highest-level features processed by the model. It directly influences the model's output by projecting the attention mechanism's output back into the embedding space, making it a good candidate for identifying the input regions that contribute most significantly to the final decision.
Both models highlight regions within the waveforms, but with differing intensity and spread, which suggests that they may be emphasizing slightly different acoustic features for classification. Regarding Healthy class, The wav2vec model's Grad-CAM heatmaps generally exhibit more consistent and expansive high-activation zones across the waveform compared to HuBERT, potentially indicating a broader approach in feature extraction. Conversely, HuBERT shows narrower, more localized regions of attention, suggesting it might be focusing on more specific, fine-grained features of the audio signal. When analyzing Parkinson's speech samples, both models demonstrate a consistent focus on the central regions of the audio waveforms. In most cases their focus is quite similar to each other. A notable observation is that the HuBERT model appears to strongly activate voiced segments in Parkinson's speech while paying attention to small unvoiced sections in healthy speech samples. This variation in activation regions could reflect differences in how each model captures the temporal structure of speech relevant to distinguishing healthy from Parkinsonian speech patterns.
Overall, the application of Grad-CAM can provide clinicians with user-friendly visualizations, highlighting the audio regions that influence a model's detection of PD. This capability allows clinicians to align the model’s decisions with their medical knowledge, thereby increasing confidence in the model's reliability, and identifying areas for improvement if the heatmap shows activation in irrelevant audio sections.
3.3. Ablation Study
In this section, we present the results of several ablation experiments to evaluate the impact of different components in our proposed integrated SupCon training. We specifically examine how factors such as projection size, temperature settings, freezing the encoder, utilizing features from various layers, and the impact of not scaling hard negatives influence performance.
Table 3 shows the ablation results of Wav2Vec 2.0 and HuBERT with SupCon across different projection head sizes. For Wav2Vec 2.0, the best accuracy (89.43%) and F1 score (90.00%) are achieved with a projection head size of 32. However, larger head sizes result in a slight decline in performance, with accuracy dropping to 87.43% for a head size of 256. Similarly, for HuBERT, the highest performance is observed with a projection head size of 32, achieving an accuracy of 88.06% and F1 score of 88.99%. Increasing the projection head size also leads to a marginal decrease in performance for HuBERT, with accuracy falling to 87.60% for a head size of 256.
Table 4 presents the performance metrics of three models: Wav2Vec 2.0 + CE, HuBERT+ CE, and Wav2Vec 2.0-FT[es] + CE, with and without fine-tuning. Fine-tuning consistently improved the performance across all models. Notably, HuBERT+ CE with fine-tuning achieved the highest accuracy (85.49%) and sensitivity (91.31%), indicating robust recognition capabilities. In contrast, Wav2Vec 2.0-FT[es] + CE, despite showing significant improvements post fine-tuning, had the lowest scores without fine-tuning, suggesting its dependency on additional training for optimal performance. The results underscore the importance of fine-tuning in enhancing model effectiveness, particularly for achieving higher specificity and sensitivity.
Wav2Vec 2.0 and HuBERT, both coupled with SupCon, were evaluated for classification performance at different temperatures (0.03, 0.07, and 0.10) as detailed in Table 5. Wav2Vec 2.0 achieved its highest accuracy (89.43% ± 2.31%) and F1-score (90.00% ± 2.35%) at a temperature of 0.07. HuBERT with SupCon showed comparable performance at 0.03 and 0.07 but a significant drop at 0.10, despite higher sensitivity. The optimal temperature appears model-specific, with 0.07 favoring Wav2Vec and HuBERT.
We also conducted an ablation study on feature extractor layers (Table S4) and the impact of scaling hard negatives with different projection sizes in SupCon (Table S5). For Cross Entropy criteria, both Wav2Vec 2.0 and HuBERT showed improved performance with deeper layers, peaking at Layer 12. Wav2Vec 2.0 achieved 85.89% accuracy (±4.27) and 86.86% F1-score (±3.42), while HuBERT reached 85.49% accuracy (±2.41) and 86.27% F1-score (±2.26). Sensitivity peaked at Layer 12 for both models, though specificity showed higher variability. For SupCon criteria, scaling hard negatives consistently improved metrics, with Wav2Vec 2.0 outperforming HuBERT, particularly in accuracy, F1-score, and precision. A projection size of 32 outperformed 64 for both models, with metrics showing stable variations (2-4%). Detailed results are provided in Tables S4 and S5 in the supplementary materials.
4. Conclusions
In summary, this study highlights the potential of leveraging advanced ASR models for the detection and monitoring of PD through speech analysis Utilizing the NeuroVoz voice and speech database. In these experiments, classification systems were developed using two popular pre-trained ASR models, wav2vec 2.0 and HuBERT, for feature extraction, alongside traditional baseline features and the base models (XGBoost and MLP). The ASR-based models were trained using two approaches: straightforward cross-entropy and supervised contrastive learning, aimed at accurately predicting the output labels. Results showed that features from pre-trained models outperformed the baseline features, suggesting that unsupervised training on diverse healthy speech data provides a strong foundation for pathological voice detection.
Our approach yielded promising results, with Wav2Vec 2.0 achieving a F1-score of up to 90.00% in distinguishing PD from healthy individuals. Furthermore, the application of SupCon enhanced the model's performance, improving the ability to discern subtle speech changes linked to PD. In this context, the contrastive learning strategy improved Wav2Vec 2.0's performance from 0.89 and 86.86% to 0.92 and 90.00% for the metrics the AUROC and F1-Score. The integration of gradient-based feature importance methods, such as Grad-CAM, allowed us to visualize and understand the specific regions of the speech signal that contributed most to the model's decisions, adding a layer of interpretability.
In conclusion, these results underscore the efficacy of ASR models along with contrastive learning in non-invasive PD diagnosis and monitoring, paving the way for their potential application in clinical settings. Despite the challenges posed by the limited availability of medical datasets, future work will focus on extending this method to cross-linguistic PD prediction, thereby contributing to the development of more robust and universally applicable diagnostic tools.
Supplementary Materials
The following supporting information can be downloaded at the website of this paper posted on Preprints.org. Table S1. Transcriptions in the IPA and translations of selected sentences; Table S2. Overview of speech assessment tasks focusing on Velopharyngeal Closure , articulation, prosody, intonation, and other vocal functions ; Section: eXtreme Gradient Boosting (XGBoost); Figure S1. Histogram showing the distribution of audio lengths for the tasks across the groups: HC and PD.; Figure S2. Grad-CAM architecture employed for visual explanation.; Figure S3. The cumulative confusion matrices show the performance of each model across fivefolds of cross-validation on the dataset of sentences.; Figure S4. Accuracy comparison across various sentences; Table S3.Overview of acoustic features and their associated functionals in eGeMAPS, totaling 88 features; Table S4.Classification performance of Wav2Vec 2.0 and HuBERT with Cross Entropy using different layer as feature extractor, showing accuracy, precision, recall, F1, AUC, and specificity with standard deviations.; Table S5. Classification performance of Wav2Vec 2.0 and HuBERT with SupCon at with and without scaling hard negatives, and across two different projection sizes (32 and 64), showing accuracy, precision, recall, F1, AUC, and specificity with standard deviations.
Author Contributions
Conceptualization, H.S.M., B.-i.L. and M.Y.; methodology, H.S.M. and M.Y., N.M.; software, H.S.M.; investigation, B.-i.L. and M.Y.; data curation, H.S.M.; writing—original draft preparation, H.S.M. and M.Y.; writing—review and editing, H.S.M., B.-i.L. and M.Y., N.M.; visualization, H.S.M.; supervision, M.Y. and B.-i.L.; project administration, M.Y. and B.-i.L.; funding acquisition, B.-i.L. and M.Y. All authors have read and agreed to the published version of the manuscript
Funding
This work was supported by the Pukyong National University Research Fund in 2023.
Institutional Review Board Statement
This study was exempt from ethical review as it exclusively utilized publicly accessible datasets (refer to Data Availability Statement for details).
Informed Consent Statement
Patient consent was waived due to the use of publicly accessible datasets (refer to Data Availability Statement for details)
Data and Source Code Availability Statement
The dataset used in this study is publicly available upon submitting request. For access to the NeuroVoz dataset please visit : https://zenodo.org/records/10777657. The pretrained models utilized in this study include `facebook/wav2vec2-base-10k-voxpopuli-ft-en`, `facebook/hubert-base-ls960`, and `facebook/wav2vec2-base`, all of which are available in the Hugging Face model repository. The source code is also available on request.
Conflicts of Interest
The authors declare that they have no conflicts of interest.
Abbreviations
The following abbreviations are used in this manuscript:
| AUC | Area Under the Receiver Operating Characteristic Curve |
| ASR | Automatic Speech Recognition |
| CE | Cross Entropy |
| CNN | Convolutional Neural Network |
| DL | Deep Learning |
| DDK | Diadochokinetic |
| eGeMAPS | extended Geneva Minimalistic Acoustic Parameter Set |
| FN | False Negative |
| FP | False Positive |
| FT | Fine-Tuned |
| F1 | F1 Score (harmonic mean of precision and recall) |
| Grad-CAM | Gradient-weighted Class Activation Mapping |
| HC | Healthy Control |
| kNN | k-Nearest Neighbors |
| MLP | Multilayer Perceptron |
| MFCCs | Mel-Frequency Cepstral Coefficients |
| ML | Machine Learning |
| PD | Parkinson's Disease |
| RNN | Recurrent Neural Network |
| ROC | Receiver Operating Characteristic |
| SVM | Support Vector Machine |
| SN | Sensitivity (Recall) |
| SP | Specificity |
| SupCon | Supervised Contrastive Learning |
| TN | True Negative |
| TP | True Positive |
| UPDRS | Unified Parkinson’s Disease Rating Scale |
| Wav2Vec 2.0 | A self-supervised speech model developed by Facebook AI |
| τ | Temperature parameter (used in contrastive loss function) |
References
- Moustafa, A.A.; Chakravarthy, S.; Phillips, J.R.; Gupta, A.; Keri, S.; Polner, B.; Frank, M.J.; Jahanshahi, M. Motor Symptoms in Parkinson’s Disease: A Unified Framework. Neurosci. Biobehav. Rev. 2016, 68, 727–740. [Google Scholar] [CrossRef]
- Mei, J.; Desrosiers, C.; Frasnelli, J. Machine Learning for the Diagnosis of Parkinson’s Disease: A Review of Literature. Front. Aging Neurosci. 2021, 13, 633752. [Google Scholar] [CrossRef]
- Dorsey, E.R.; Sherer, T.; Okun, M.S.; Bloem, B.R. The Emerging Evidence of the Parkinson Pandemic. J. Park. Dis. 2018, 8, S3–S8. [Google Scholar] [CrossRef] [PubMed]
- GBD 2016 Neurology Collaborators Global, Regional, and National Burden of Neurological Disorders, 1990-2016: A Systematic Analysis for the Global Burden of Disease Study 2016. Lancet Neurol. 2019, 18, 459–480. [CrossRef] [PubMed]
- Bridges, B.; Taylor, J.; Weber, J.T. Evaluation of the Parkinson’s Remote Interactive Monitoring System in a Clinical Setting: Usability Study. JMIR Hum. Factors 2024, 11, e54145. [Google Scholar] [CrossRef]
- Hssayeni, M.D.; Jimenez-Shahed, J.; Burack, M.A.; Ghoraani, B. Symptom-Based, Dual-Channel LSTM Network for The Estimation of Unified Parkinson’s Disease Rating Scale III. In Proceedings of the 2019 IEEE EMBS International Conference on Biomedical & Health Informatics (BHI); May 2019; pp. 1–4.
- Postuma, R.B. Voice Changes in Prodromal Parkinson’s Disease: Is a New Biomarker within Earshot? Sleep Med. 2016, 19, 148–149. [Google Scholar] [CrossRef]
- Rahman, S.; Hasan, M.; Sarkar, A.K.; Khan, F. Classification of Parkinson’s Disease Using Speech Signal with Machine Learning and Deep Learning Approaches. Eur. J. Electr. Eng. Comput. Sci. 2023, 7, 20–27. [Google Scholar] [CrossRef]
- Moro-Velazquez, L.; Gomez-Garcia, J.A.; Arias-Londoño, J.D.; Dehak, N.; Godino-Llorente, J.I. Advances in Parkinson’s Disease Detection and Assessment Using Voice and Speech: A Review of the Articulatory and Phonatory Aspects. Biomed. Signal Process. Control 2021, 66, 102418. [Google Scholar] [CrossRef]
- Ngo, Q.C.; Motin, M.A.; Pah, N.D.; Drotár, P.; Kempster, P.; Kumar, D. Computerized Analysis of Speech and Voice for Parkinson’s Disease: A Systematic Review. Comput. Methods Programs Biomed. 2022, 226, 107133. [Google Scholar] [CrossRef]
- Kodali, M.; Kadiri, S.R.; Alku, P. Automatic Classification of the Severity Level of Parkinson’s Disease: A Comparison of Speaking Tasks, Features, and Classifiers. Comput. Speech Lang. 2024, 83, 101548. [Google Scholar] [CrossRef]
- Govindu, A.; Palwe, S. Early Detection of Parkinson’s Disease Using Machine Learning. Procedia Comput. Sci. 2023, 218, 249–261. [Google Scholar] [CrossRef]
- Wang, Q.; Fu, Y.; Shao, B.; Chang, L.; Ren, K.; Chen, Z.; Ling, Y. Early Detection of Parkinson’s Disease from Multiple Signal Speech: Based on Mandarin Language Dataset. Front. Aging Neurosci. 2022, 14, 1036588. [Google Scholar] [CrossRef] [PubMed]
- Motin, M.A.; Pah, N.D.; Raghav, S.; Kumar, D.K. Parkinson’s Disease Detection Using Smartphone Recorded Phonemes in Real World Conditions. IEEE Access 2022, 10, 97600–97609. [Google Scholar] [CrossRef]
- Mamun, M.; Mahmud, M.I.; Hossain, M.I.; Islam, A.M.; Ahammed, M.S.; Uddin, M.M. Vocal Feature Guided Detection of Parkinson’s Disease Using Machine Learning Algorithms. In Proceedings of the 2022 IEEE 13th Annual Ubiquitous Computing, Electronics & Mobile Communication Conference (UEMCON); IEEE: New York, NY, NY, USA, October 26 2022; pp. 0566–0572. [Google Scholar]
- Ibarra, E.J.; Arias-Londoño, J.D.; Zañartu, M.; Godino-Llorente, J.I. Towards a Corpus (and Language)-Independent Screening of Parkinson’s Disease from Voice and Speech through Domain Adaptation. Bioengineering 2023, 10, 1316. [Google Scholar] [CrossRef]
- Jeong, S.-M.; Song, Y.-D.; Seok, C.-L.; Lee, J.-Y.; Lee, E.C.; Kim, H.-J. Machine Learning-Based Classification of Parkinson’s Disease Using Acoustic Features: Insights from Multilingual Speech Tasks. Comput. Biol. Med. 2024, 182, 109078. [Google Scholar] [CrossRef]
- Hireš, M.; Gazda, M.; Drotár, P.; Pah, N.D.; Motin, M.A.; Kumar, D.K. Convolutional Neural Network Ensemble for Parkinson’s Disease Detection from Voice Recordings. Comput. Biol. Med. 2022, 141, 105021. [Google Scholar] [CrossRef]
- Quan, C.; Ren, K.; Luo, Z.; Chen, Z.; Ling, Y. End-to-End Deep Learning Approach for Parkinson’s Disease Detection from Speech Signals. Biocybern. Biomed. Eng. 2022, 42, 556–574. [Google Scholar] [CrossRef]
- Hireš, M.; Drotár, P.; Pah, N.D.; Ngo, Q.C.; Kumar, D.K. On the Inter-Dataset Generalization of Machine Learning Approaches to Parkinson’s Disease Detection from Voice. Int. J. Med. Inf. 2023, 179, 105237. [Google Scholar] [CrossRef]
- Aversano, L.; Bernardi, M.L.; Cimitile, M.; Iammarino, M.; Montano, D.; Verdone, C. A Machine Learning Approach for Early Detection of Parkinson’s Disease Using Acoustic Traces. In Proceedings of the 2022 IEEE International Conference on Evolving and Adaptive Intelligent Systems (EAIS); IEEE: Larnaca, Cyprus, May 25 2022; pp. 1–8.
- Malekroodi, H.S.; Madusanka, N.; Lee, B.; Yi, M. Leveraging Deep Learning for Fine-Grained Categorization of Parkinson’s Disease Progression Levels through Analysis of Vocal Acoustic Patterns. Bioengineering 2024, 11, 295. [Google Scholar] [CrossRef]
- Rezaee, K.; Savarkar, S.; Yu, X.; Zhang, J. A Hybrid Deep Transfer Learning-Based Approach for Parkinson’s Disease Classification in Surface Electromyography Signals. Biomed. Signal Process. Control 2022, 71, 103161. [Google Scholar] [CrossRef]
- van Gelderen, L.; Tejedor-García, C. Innovative Speech-Based Deep Learning Approaches for Parkinson’s Disease Classification: A Systematic Review 2024.
- Javanmardi, F.; Kadiri, S.R.; Alku, P. Pre-Trained Models for Detection and Severity Level Classification of Dysarthria from Speech. Speech Commun. 2024, 158, 103047. [Google Scholar] [CrossRef]
- Baevski, A.; Zhou, Y.; Mohamed, A.; Auli, M. Wav2vec 2.0: A Framework for Self-Supervised Learning of Speech Representations. Adv. Neural Inf. Process. Syst. 2020, 33, 12449–12460. [Google Scholar]
- Hsu, W.-N.; Bolte, B.; Tsai, Y.-H.H.; Lakhotia, K.; Salakhutdinov, R.; Mohamed, A. HuBERT: Self-Supervised Speech Representation Learning by Masked Prediction of Hidden Units. IEEEACM Trans. Audio Speech Lang. Process. 2021, 29, 3451–3460. [Google Scholar] [CrossRef]
- Kunešová, M.; Zajíc, Z. Multitask Detection of Speaker Changes, Overlapping Speech and Voice Activity Using Wav2vec 2.0. In Proceedings of the ICASSP 2023 - 2023 IEEE International Conference on Acoustics, Speech and Signal Processing (ICASSP); June 4 2023; pp.1–5.
- Zhao, W.; Yang, Z. An Emotion Speech Synthesis Method Based on VITS. Appl. Sci. 2023, 13, 2225. [Google Scholar] [CrossRef]
- Fan, Z.; Li, M.; Zhou, S.; Xu, B. Exploring Wav2vec 2. 0 on Speaker Verification and Language Identification 2021.
- Klempíř, O.; Příhoda, D.; Krupička, R. Evaluating the Performance of Wav2vec Embedding for Parkinson’s Disease Detection. Meas. Sci. Rev. 2023, 23, 260–267. [Google Scholar] [CrossRef]
- Chronowski, M.; Kłaczyński, M.; Dec-Ćwiek, M.; Porębska, K. Parkinson’s Disease Diagnostics Using Ai and Natural Language Knowledge Transfer. Diagnostyka 2023, 25, 1–6. [Google Scholar] [CrossRef]
- Selvaraju, R.R.; Cogswell, M.; Das, A.; Vedantam, R.; Parikh, D.; Batra, D. Grad-CAM: Visual Explanations from Deep Networks via Gradient-Based Localization. Int. J. Comput. Vis. 2020, 128, 336–359. [Google Scholar] [CrossRef]
- Khosla, P.; Teterwak, P.; Wang, C.; Sarna, A.; Tian, Y.; Isola, P.; Maschinot, A.; Liu, C.; Krishnan, D. Supervised Contrastive Learning 2021.
- Chen, T.; Guestrin, C. XGBoost: A Scalable Tree Boosting System. In Proceedings of the Proceedings of the 22nd ACM SIGKDD International Conference on Knowledge Discovery and Data Mining; Association for Computing Machinery: New York, NY, USA, August 13, 2016; pp. 785–794. [Google Scholar]
- Eyben, F.; Scherer, K.R.; Schuller, B.W.; Sundberg, J.; Andre, E.; Busso, C.; Devillers, L.Y.; Epps, J.; Laukka, P.; Narayanan, S.S.; et al. The Geneva Minimalistic Acoustic Parameter Set (GeMAPS) for Voice Research and Affective Computing. IEEE Trans. Affect. Comput. 2016, 7, 190–202. [Google Scholar] [CrossRef]
- Mendes-Laureano, J.; Gómez-García, J.A.; Guerrero-López, A.; Luque-Buzo, E.; Arias-Londoño, J.D.; Grandas-Pérez, F.J.; Godino-Llorente, J.I. NeuroVoz: A Castillian Spanish Corpus of Parkinsonian Speech 2024.
- Mendes-Laureano, J.; Gómez-García, J.A.; Guerrero-López, A.; Luque-Buzo, E.; Arias-Londoño, J.D.; Grandas-Pérez, F.J.; Godino Llorente, J.I. NeuroVoz: a Castillian Spanish corpus of parkinsonian speech 2024.
- Paszke, A.; Gross, S.; Massa, F.; Lerer, A.; Bradbury, J.; Chanan, G.; Killeen, T.; Lin, Z.; Gimelshein, N.; Antiga, L.; et al. PyTorch: An Imperative Style, High-Performance Deep Learning Library. In Proceedings of the Advances in Neural Information Processing Systems 32; Wallach, H., Larochelle, H., Beygelzimer, A., d’Alché-Buc, F., Fox, E., Garnett, R., Eds.; Curran Associates, Inc., 2019; pp. 8024–8035.
- Chen, T.; Kornblith, S.; Norouzi, M.; Hinton, G. A Simple Framework for Contrastive Learning of Visual Representations 2020.
- Gidaris, S.; Bursuc, A.; Simeoni, O.; Vobecky, A.; Komodakis, N.; Cord, M.; Pérez, P. MOCA: Self-Supervised Representation Learning by Predicting Masked Online Codebook Assignments 2024.
- Wang, Y.; Liang, Q.; Xiao, C.; Li, Y.; Moubayed, N.A.; Lin, C. Audio Contrastive Based Fine-Tuning 2023.
- Corrêa Dias, A.; Dias, F.; Moreira, H.; Moreira, V.; Comba, J.L. Team INF-UFRGS at SemEval-2023 Task 7: Supervised Contrastive Learning for Pair-Level Sentence Classification and Evidence Retrieval. In Proceedings of the Proceedings of the 17th International Workshop on Semantic Evaluation (SemEval-2023); Ojha, A.Kr., Doğruöz, A.S., Da San Martino, G., Tayyar Madabushi, H., Kumar, R., Sartori, E., Eds.; Association for Computational Linguistics: Toronto, Canada, July, 2023; pp. 700–706. [Google Scholar]
- Li, S.; Hu, X.; Lin, L.; Wen, L. Pair-Level Supervised Contrastive Learning for Natural Language Inference 2022.
- Wang, X.; Han, X.; Huang, W.; Dong, D.; Scott, M.R. Multi-Similarity Loss with General Pair Weighting for Deep Metric Learning 2020.
- Narendra, N.P.; Alku, P. Dysarthric Speech Classification from Coded Telephone Speech Using Glottal Features. Speech Commun. 2019, 110, 47–55. [Google Scholar] [CrossRef]
- Gurugubelli, K.; Vuppala, A.K. Perceptually Enhanced Single Frequency Filtering for Dysarthric Speech Detection and Intelligibility Assessment. ICASSP 2019 - 2019 IEEE Int. Conf. Acoust. Speech Signal Process. ICASSP 2019, 6410–6414. [CrossRef]
- McFee, B.; Raffel, C.; Liang, D.; Ellis, D.P.W.; McVicar, M.; Battenberg, E.; Nieto, O. Librosa: Audio and Music Signal Analysis in Python. scipy 2015. [Google Scholar] [CrossRef]
- Eyben, F.; Weninger, F.; Gross, F.; Schuller, B. Recent Developments in openSMILE, the Munich Open-Source Multimedia Feature Extractor. In Proceedings of the Proceedings of the 21st ACM international conference on Multimedia; Association for Computing Machinery: New York, NY, USA, October 21 2013; pp. 835–838.
- McKinney, W. Data Structures for Statistical Computing in Python. In Proceedings of the Proceedings of the 9th Python in Science Conference; Walt, S. van der, Millman, J., Eds.; 2010; pp. 56–61.
- Harris, C.R.; Millman, K.J.; Walt, S.J. van der; Gommers, R.; Virtanen, P.; Cournapeau, D.; Wieser, E.; Taylor, J.; Berg, S.; Smith, N.J.; et al. Array Programming with NumPy. Nature 2020, 585, 357–362. [Google Scholar] [CrossRef] [PubMed]
- Hunter, J.D. Matplotlib: A 2D Graphics Environment. Comput. Sci. Eng. 2007, 9, 90–95. [Google Scholar] [CrossRef]
- Pedregosa, F.; Varoquaux, G.; Gramfort, A.; Michel, V.; Thirion, B.; Grisel, O.; Blondel, M.; Prettenhofer, P.; Weiss, R.; Dubourg, V.; et al. Scikit-Learn: Machine Learning in Python. J. Mach. Learn. Res. 2011, 12, 2825–2830. [Google Scholar]
- Loshchilov, I.; Hutter, F. Decoupled Weight Decay Regularization 2019.
- Mellak, Y.; Achim, A.; Ward, A.; Descombes, X. 1 A Machine Learning Framework for the 2 Quantification of Experimental Uveitis in Murine 3 OCT.
Figure 1.
Diagram outlining the process of our classification model.
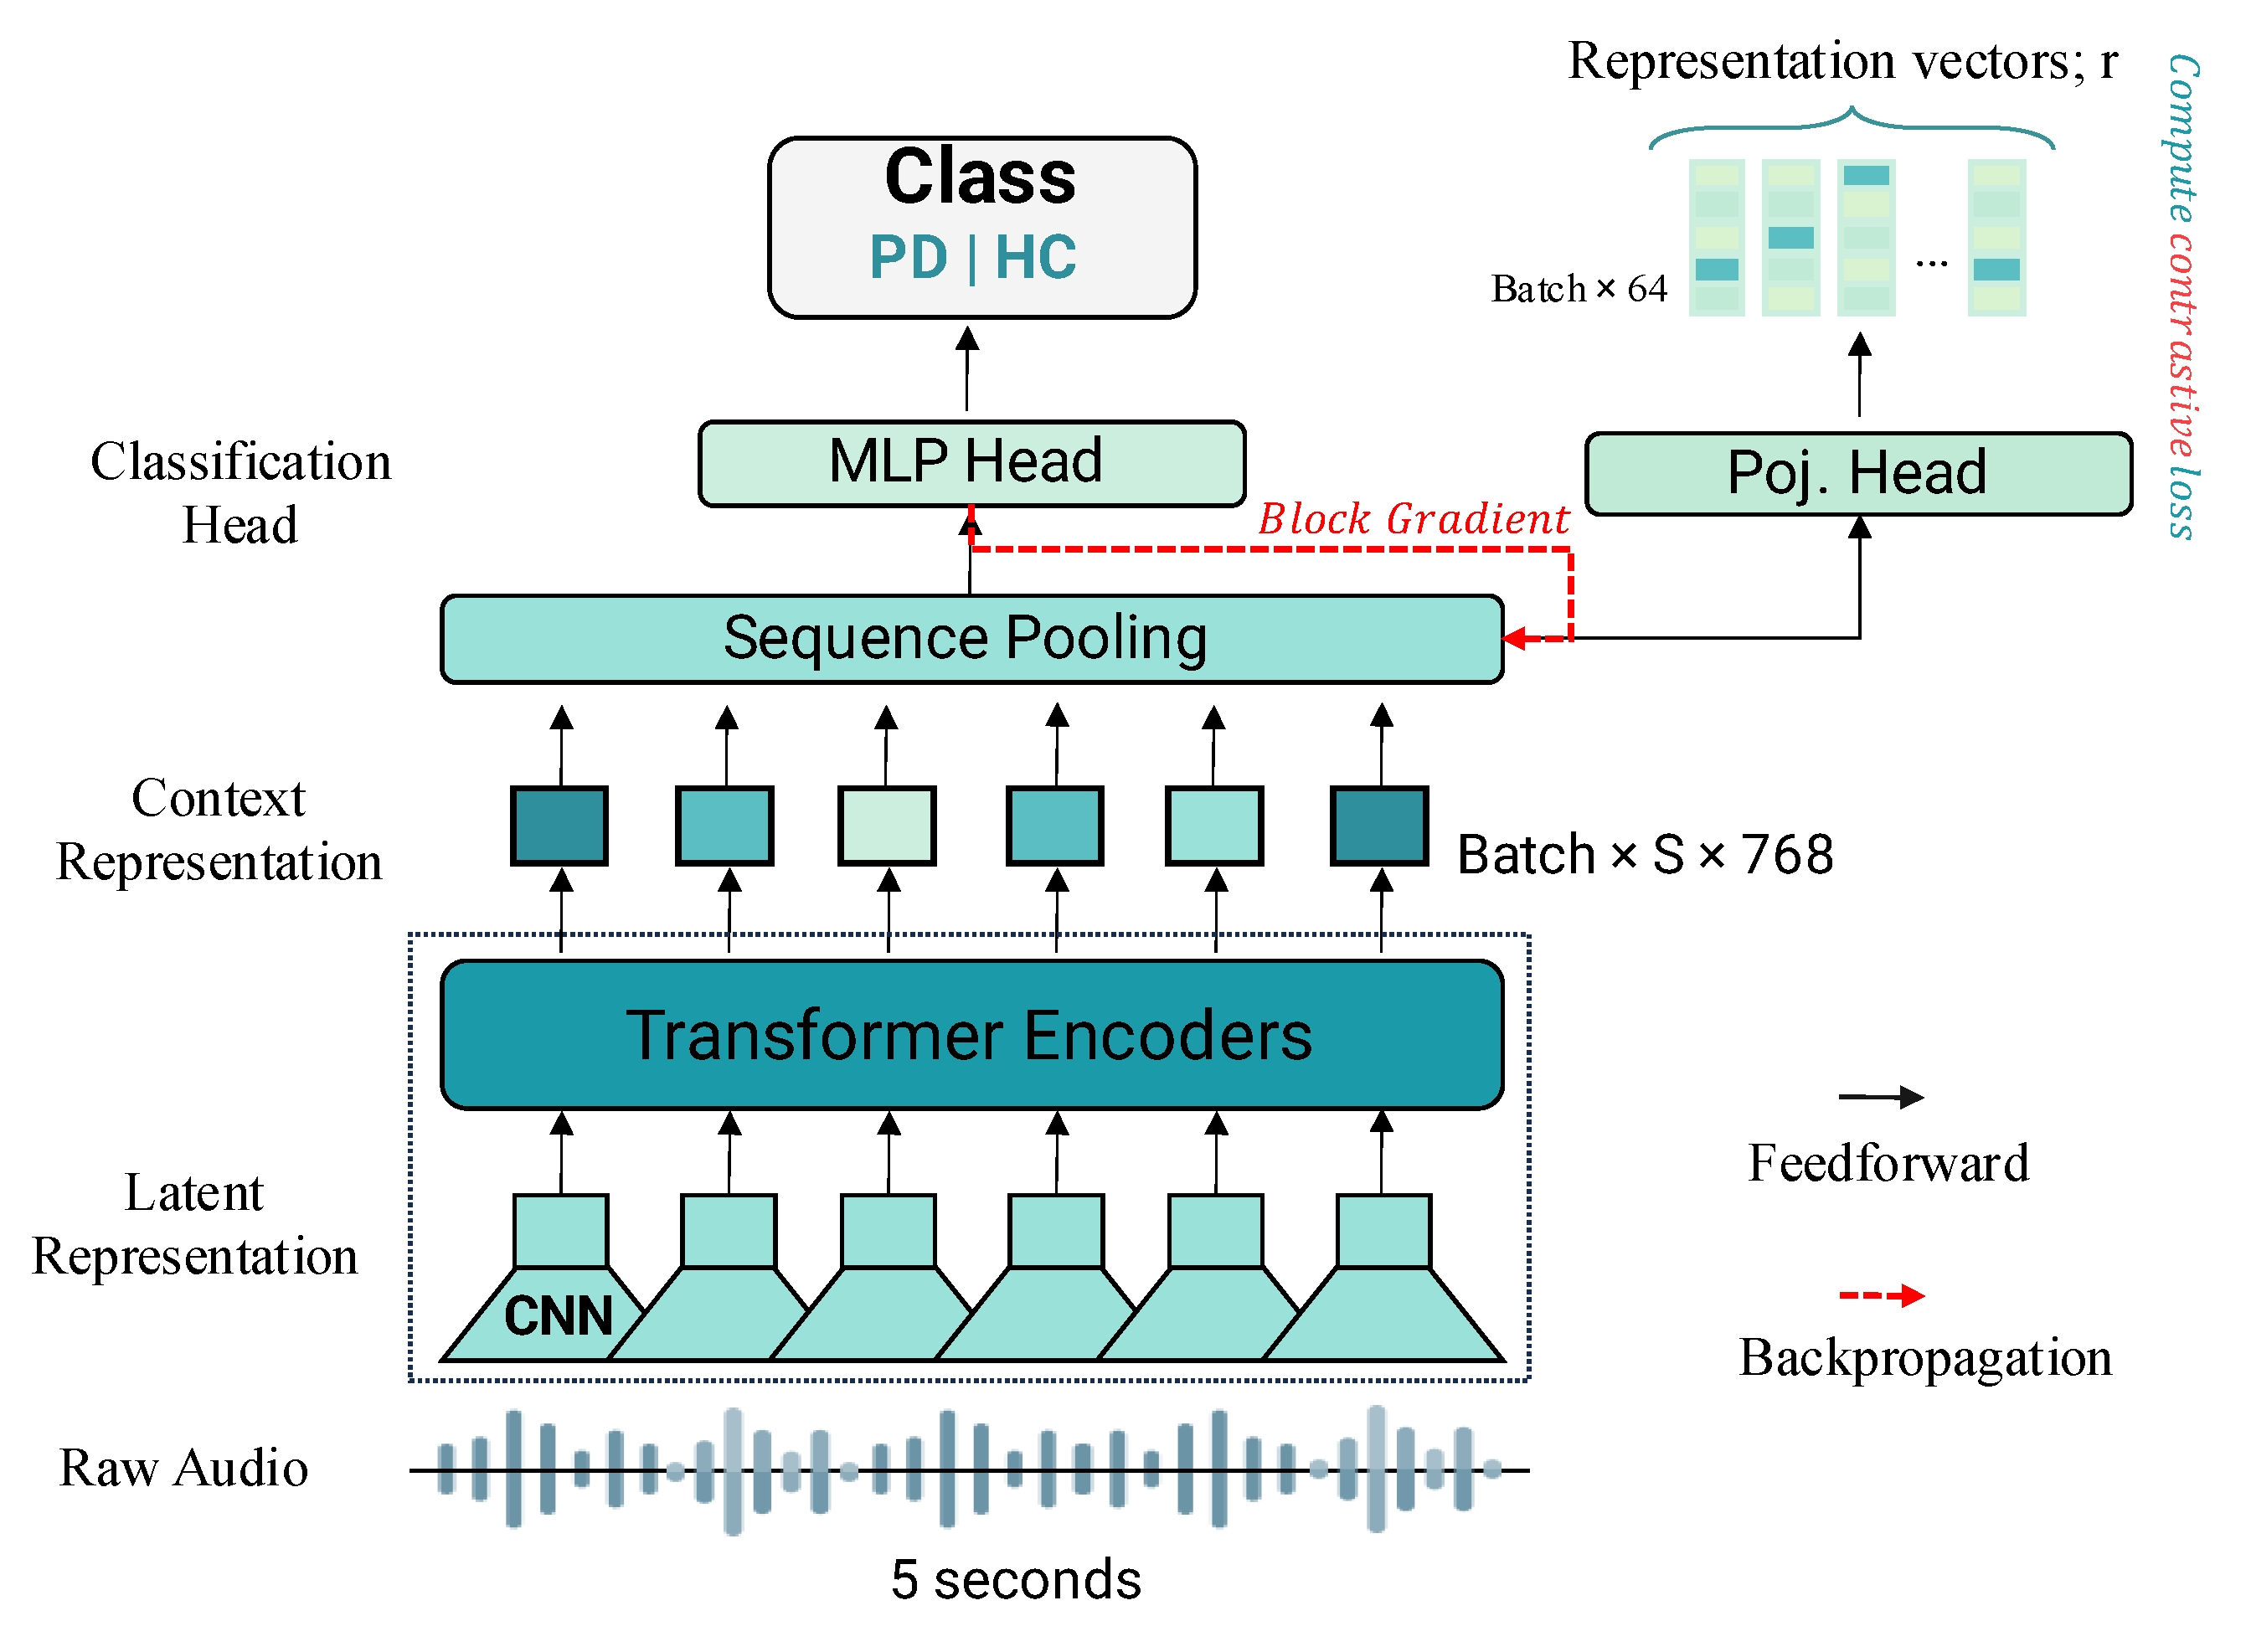
Figure 2.
Overview of the models’ architecture used in this study. (a) Wav2Vec 2.0, (b) HuBERT, (c) Classifier.
Figure 2.
Overview of the models’ architecture used in this study. (a) Wav2Vec 2.0, (b) HuBERT, (c) Classifier.
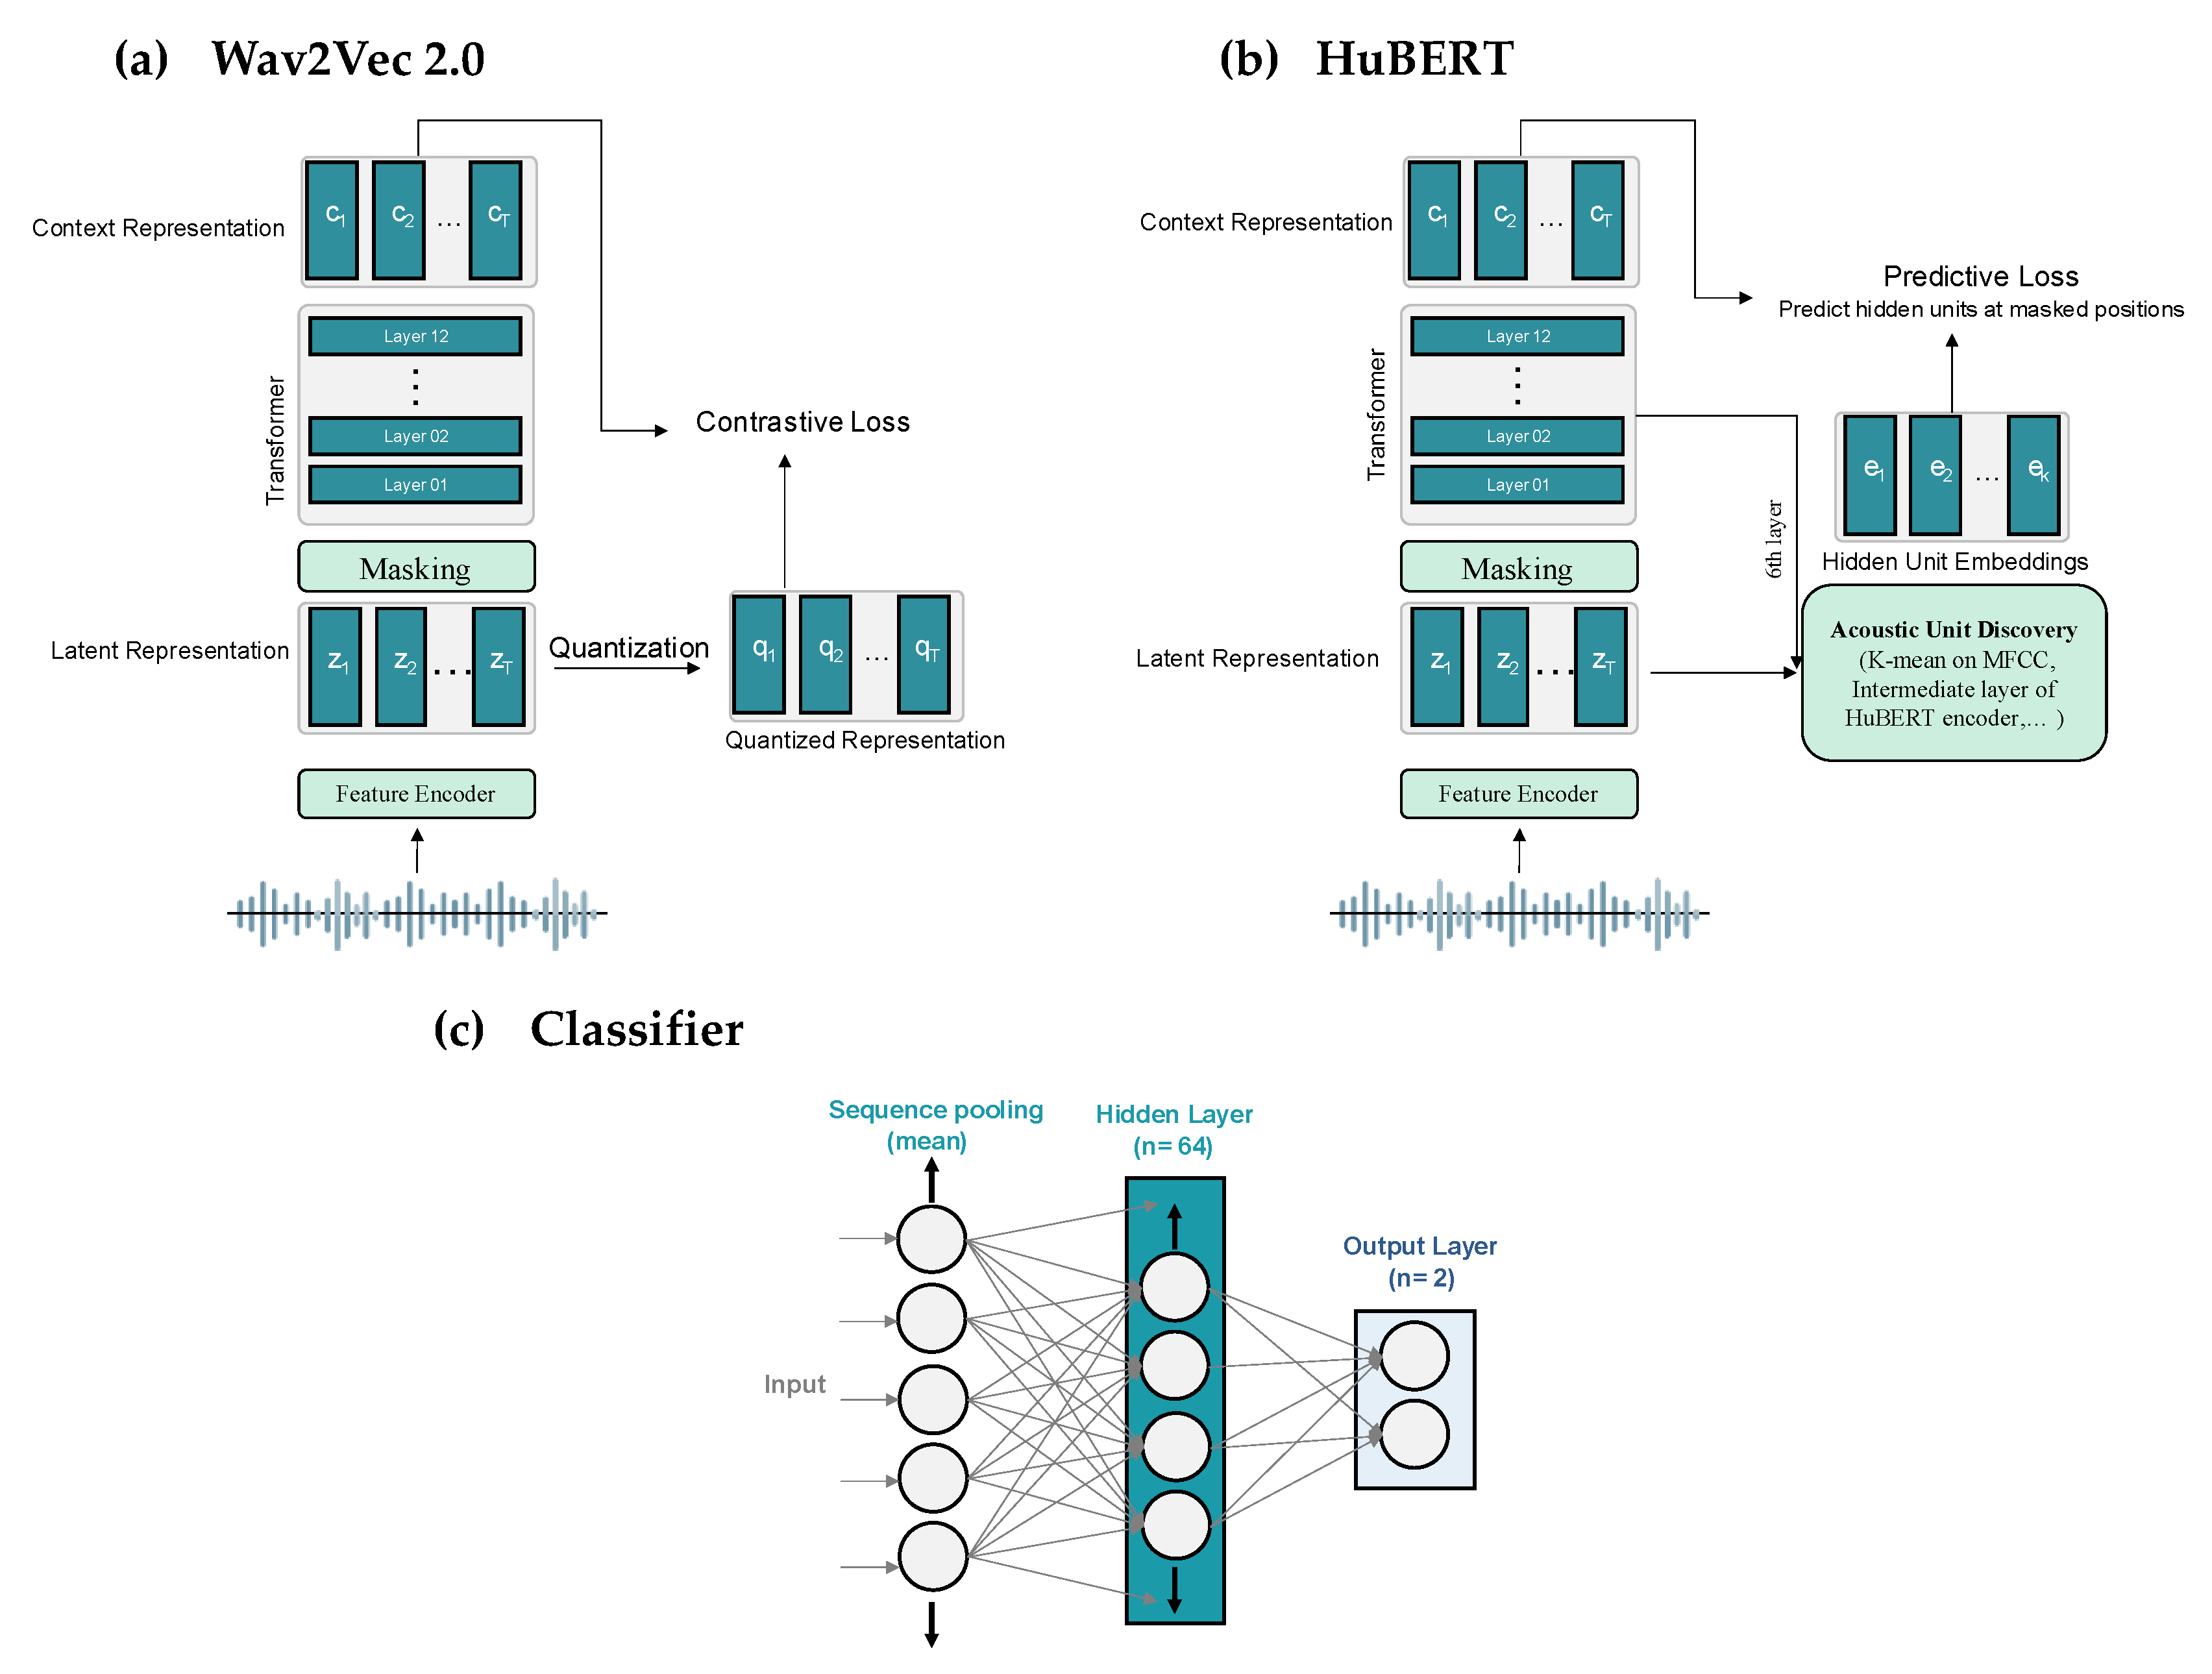
Figure 3.
F1 scores (%) comparison across different models, showing superior performance of supervised contrastive learning (SupCon) approaches over cross-entropy (CE) based models. Wav2Vec2 SupCon and HuBERT SupCon achieve the highest F1 scores of approximately 90%, with error bars indicating model performance variability. In order to enable a clear comparison, the accuracy scale starts at 60%.
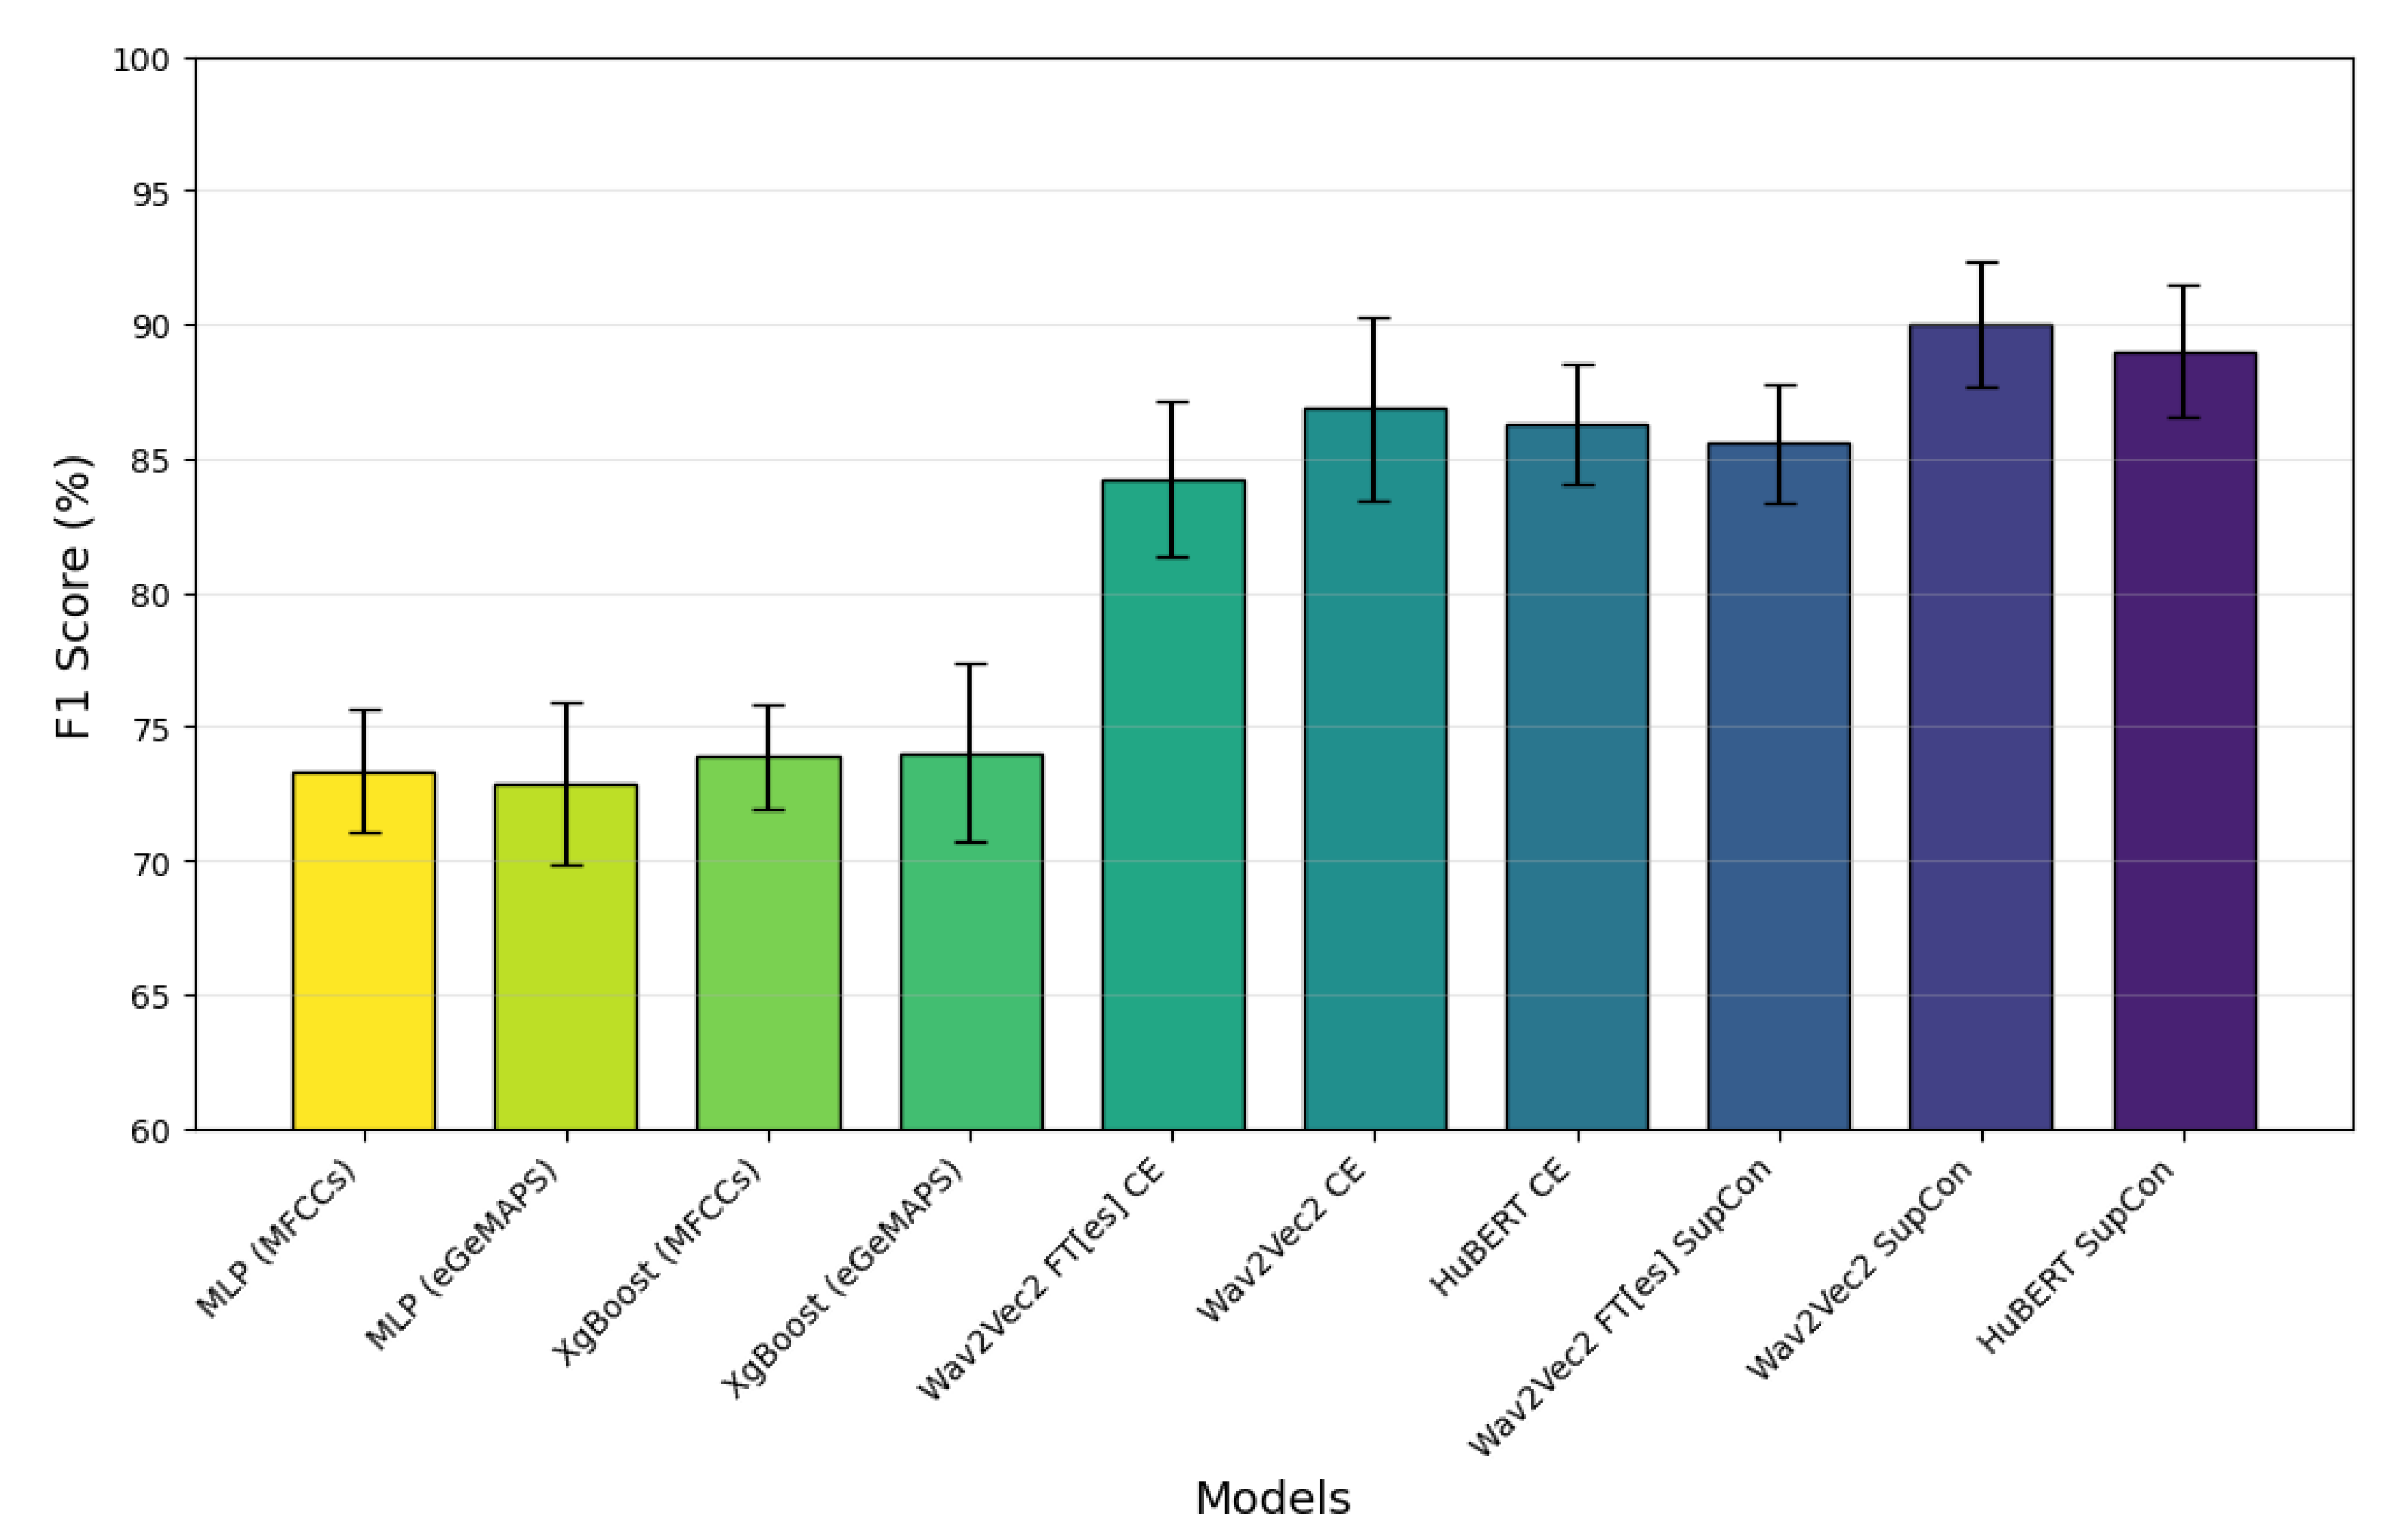
Figure 4.
Cumulative confusion matrices depicting each model's performance across five cross-validation folds on the sentence dataset.
Figure 4.
Cumulative confusion matrices depicting each model's performance across five cross-validation folds on the sentence dataset.
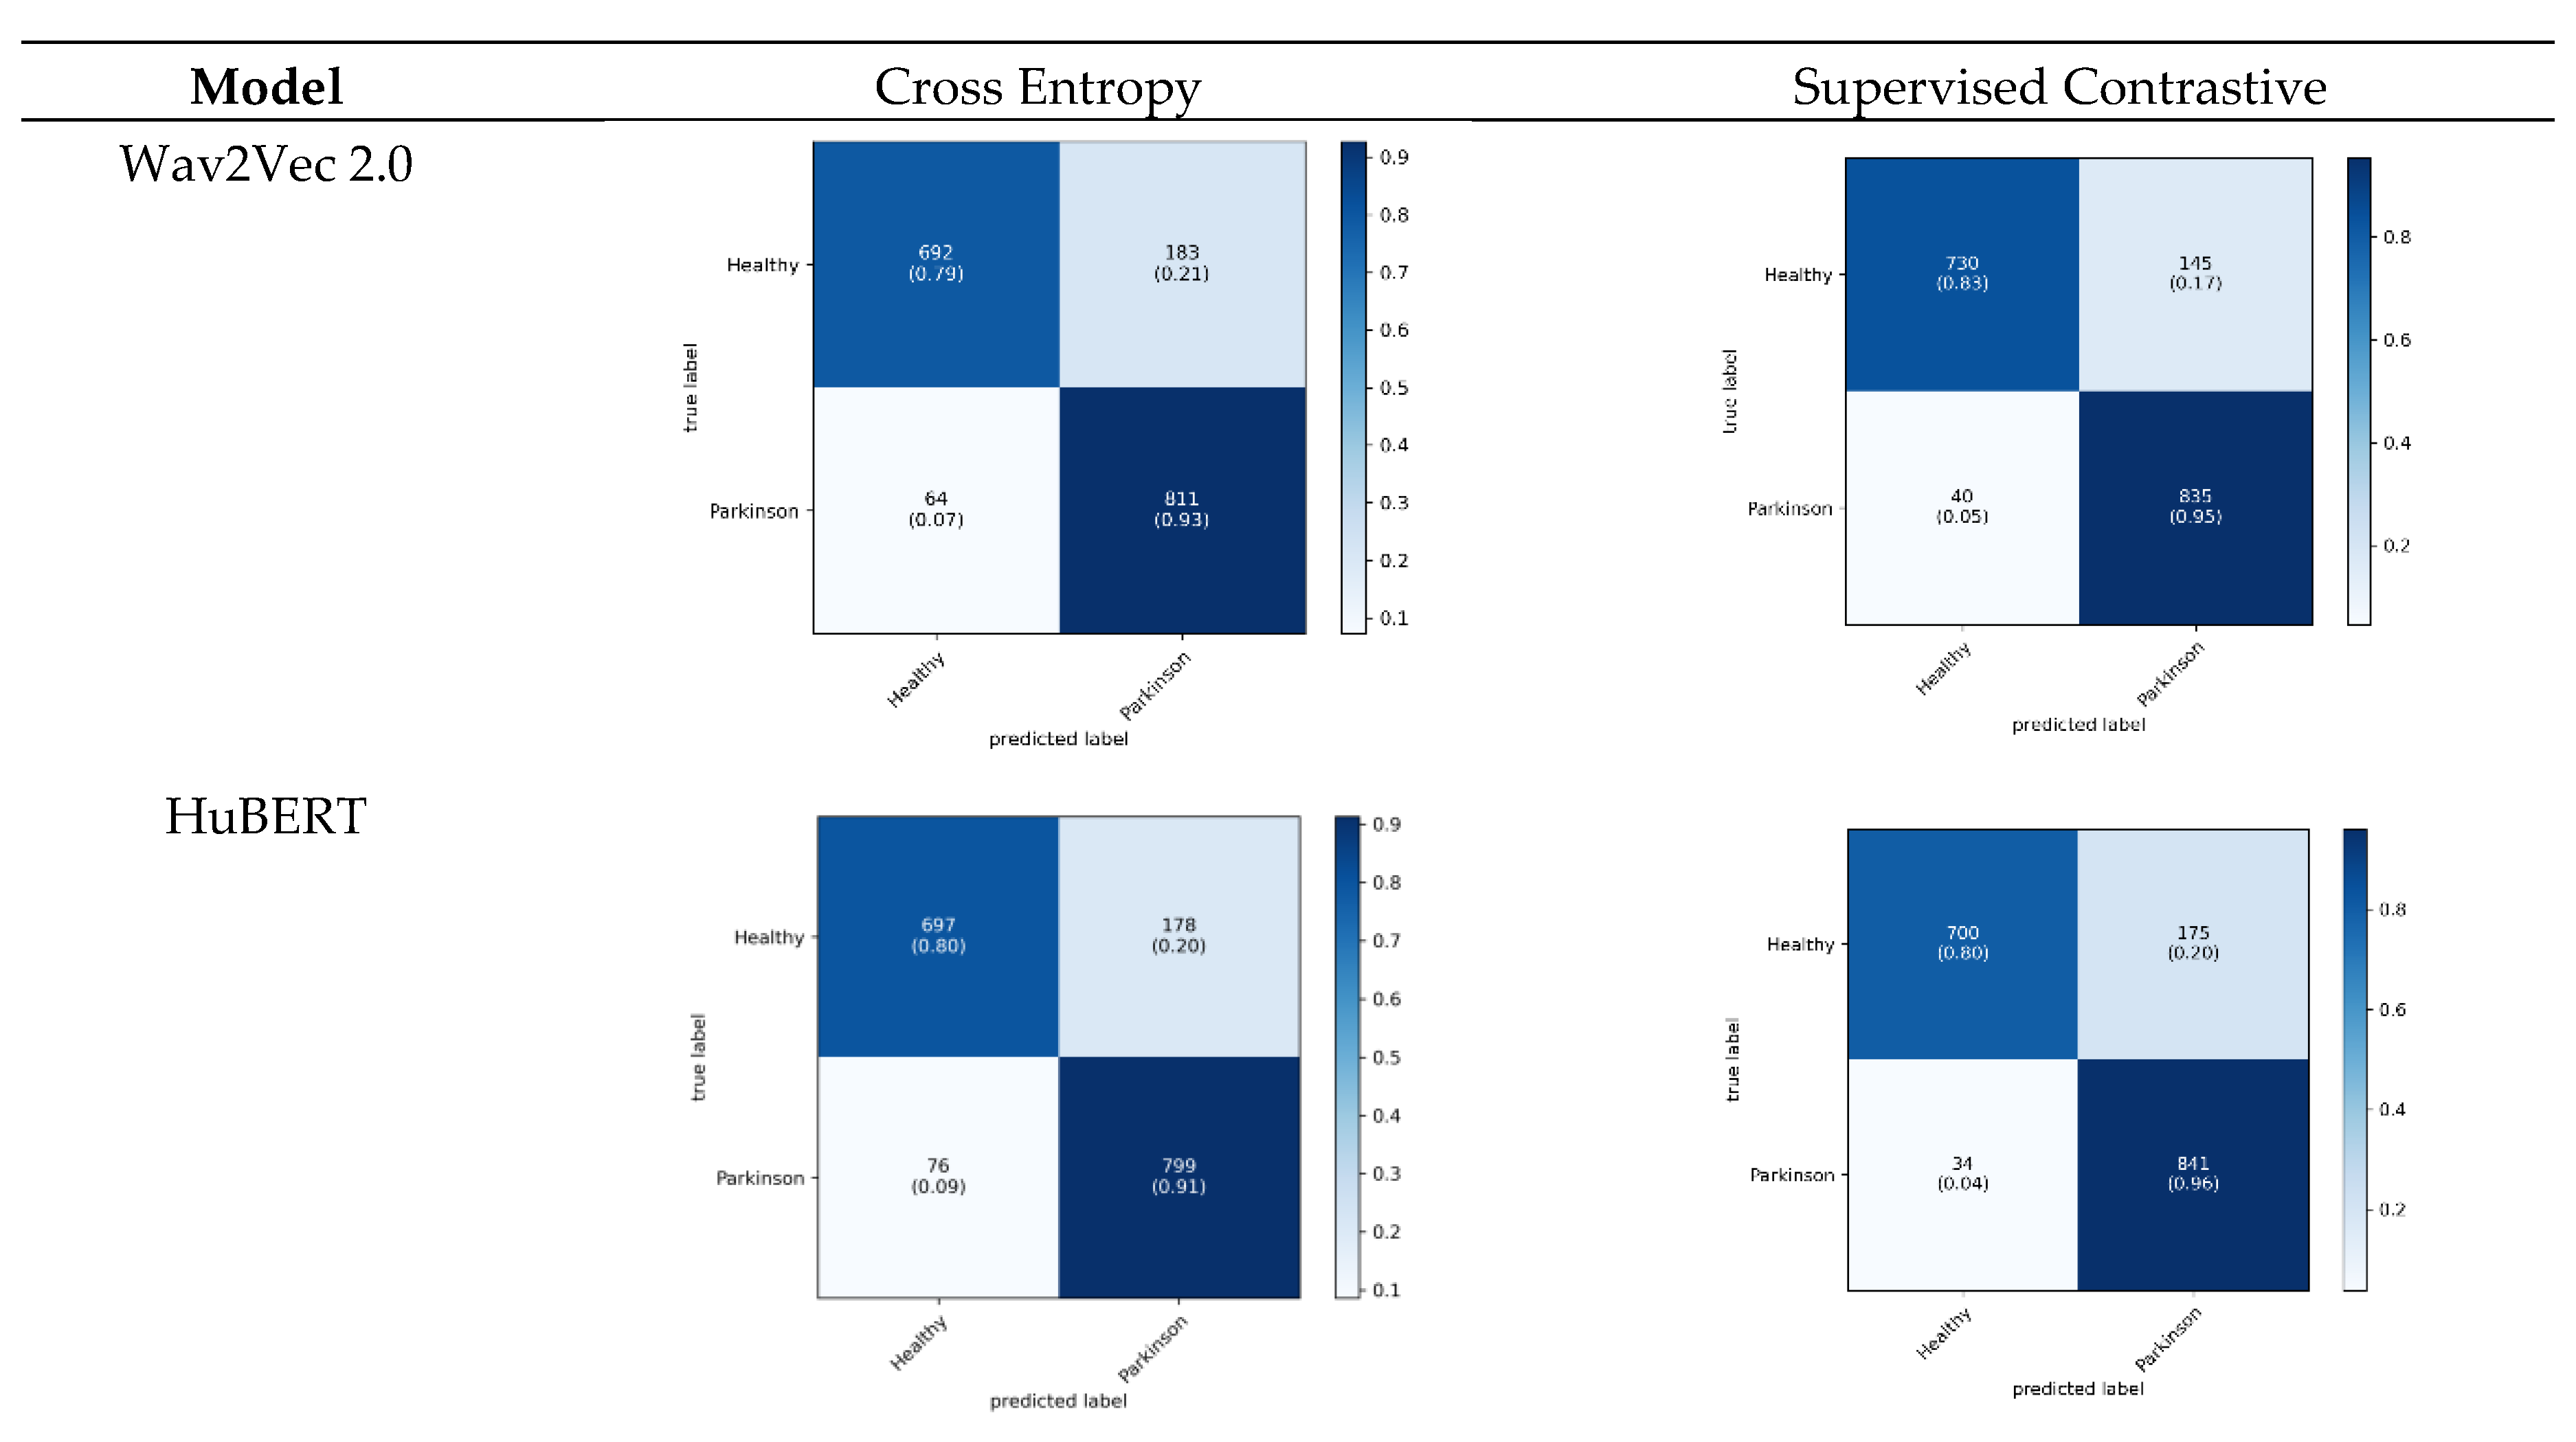
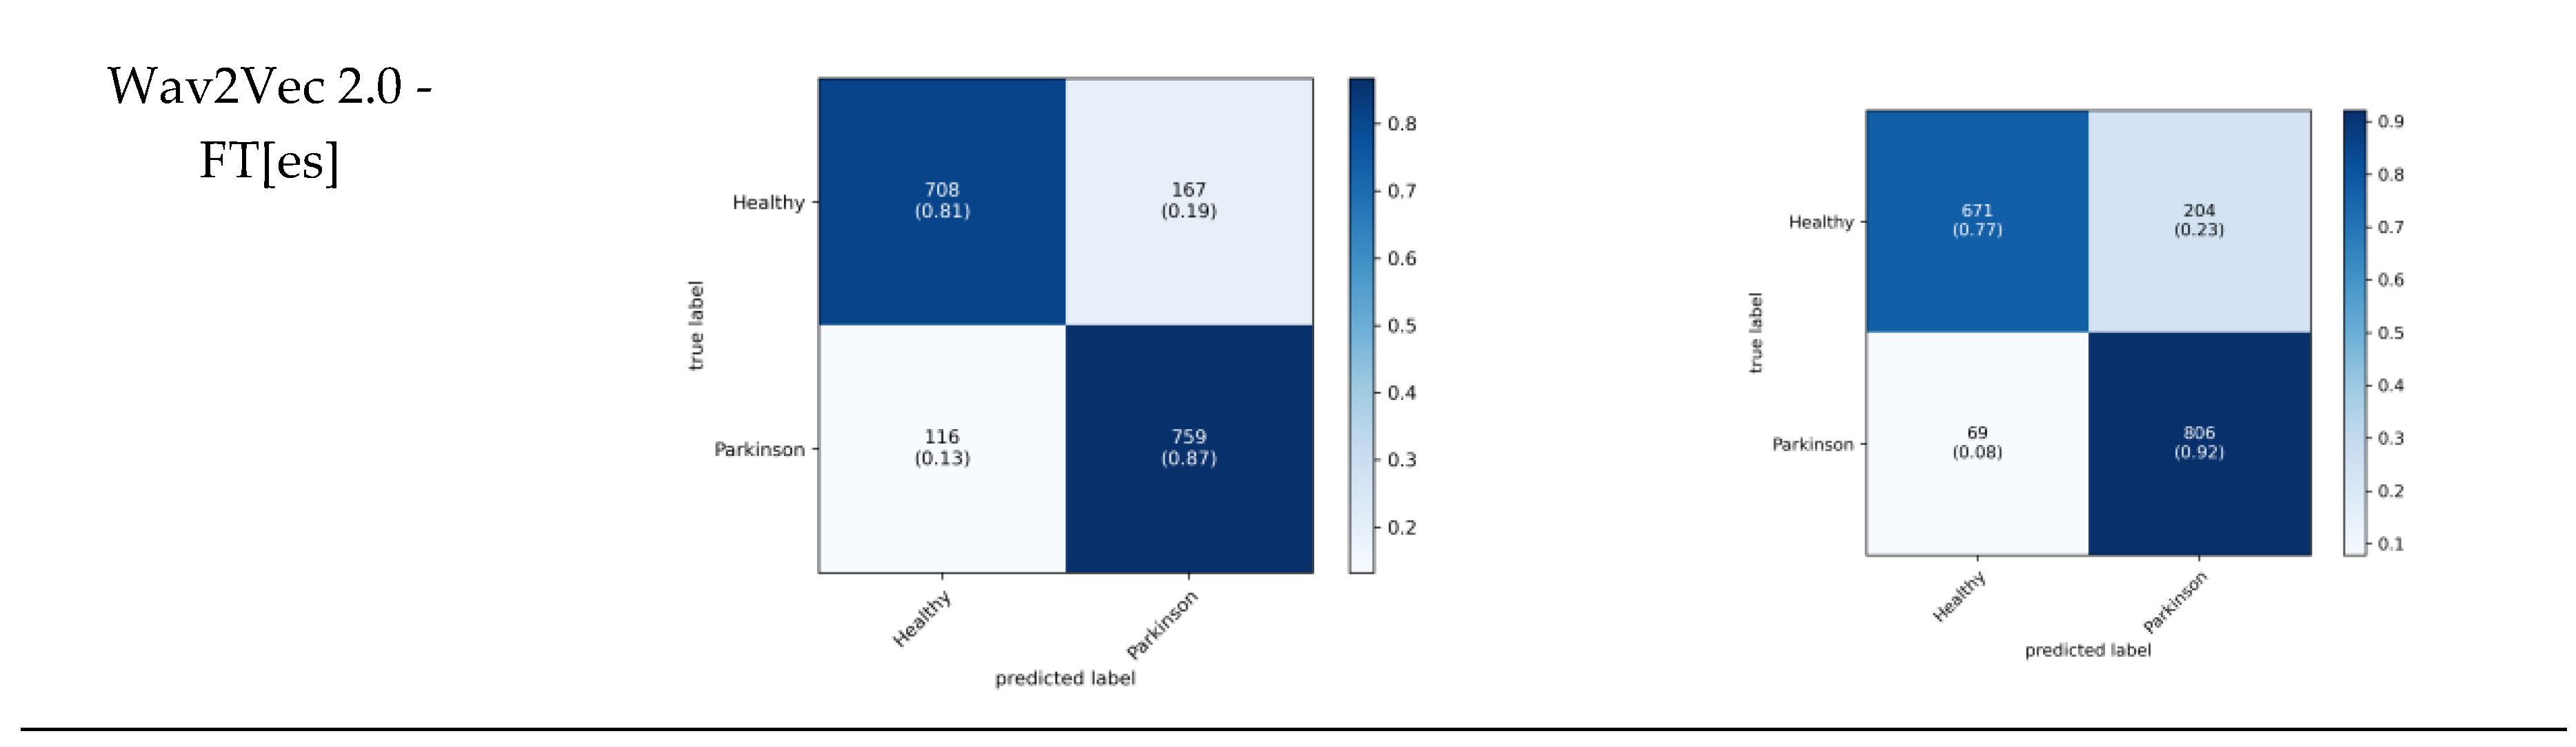
Figure 5.
ROC curves comparing traditional model along with Wav2Vec2 and HuBERT model variants, with SupCon approaches achieving the highest performance (AUC=0.92-0.93) compared to cross-entropy (CE) based models (AUC=0.84-0.89).
Figure 5.
ROC curves comparing traditional model along with Wav2Vec2 and HuBERT model variants, with SupCon approaches achieving the highest performance (AUC=0.92-0.93) compared to cross-entropy (CE) based models (AUC=0.84-0.89).
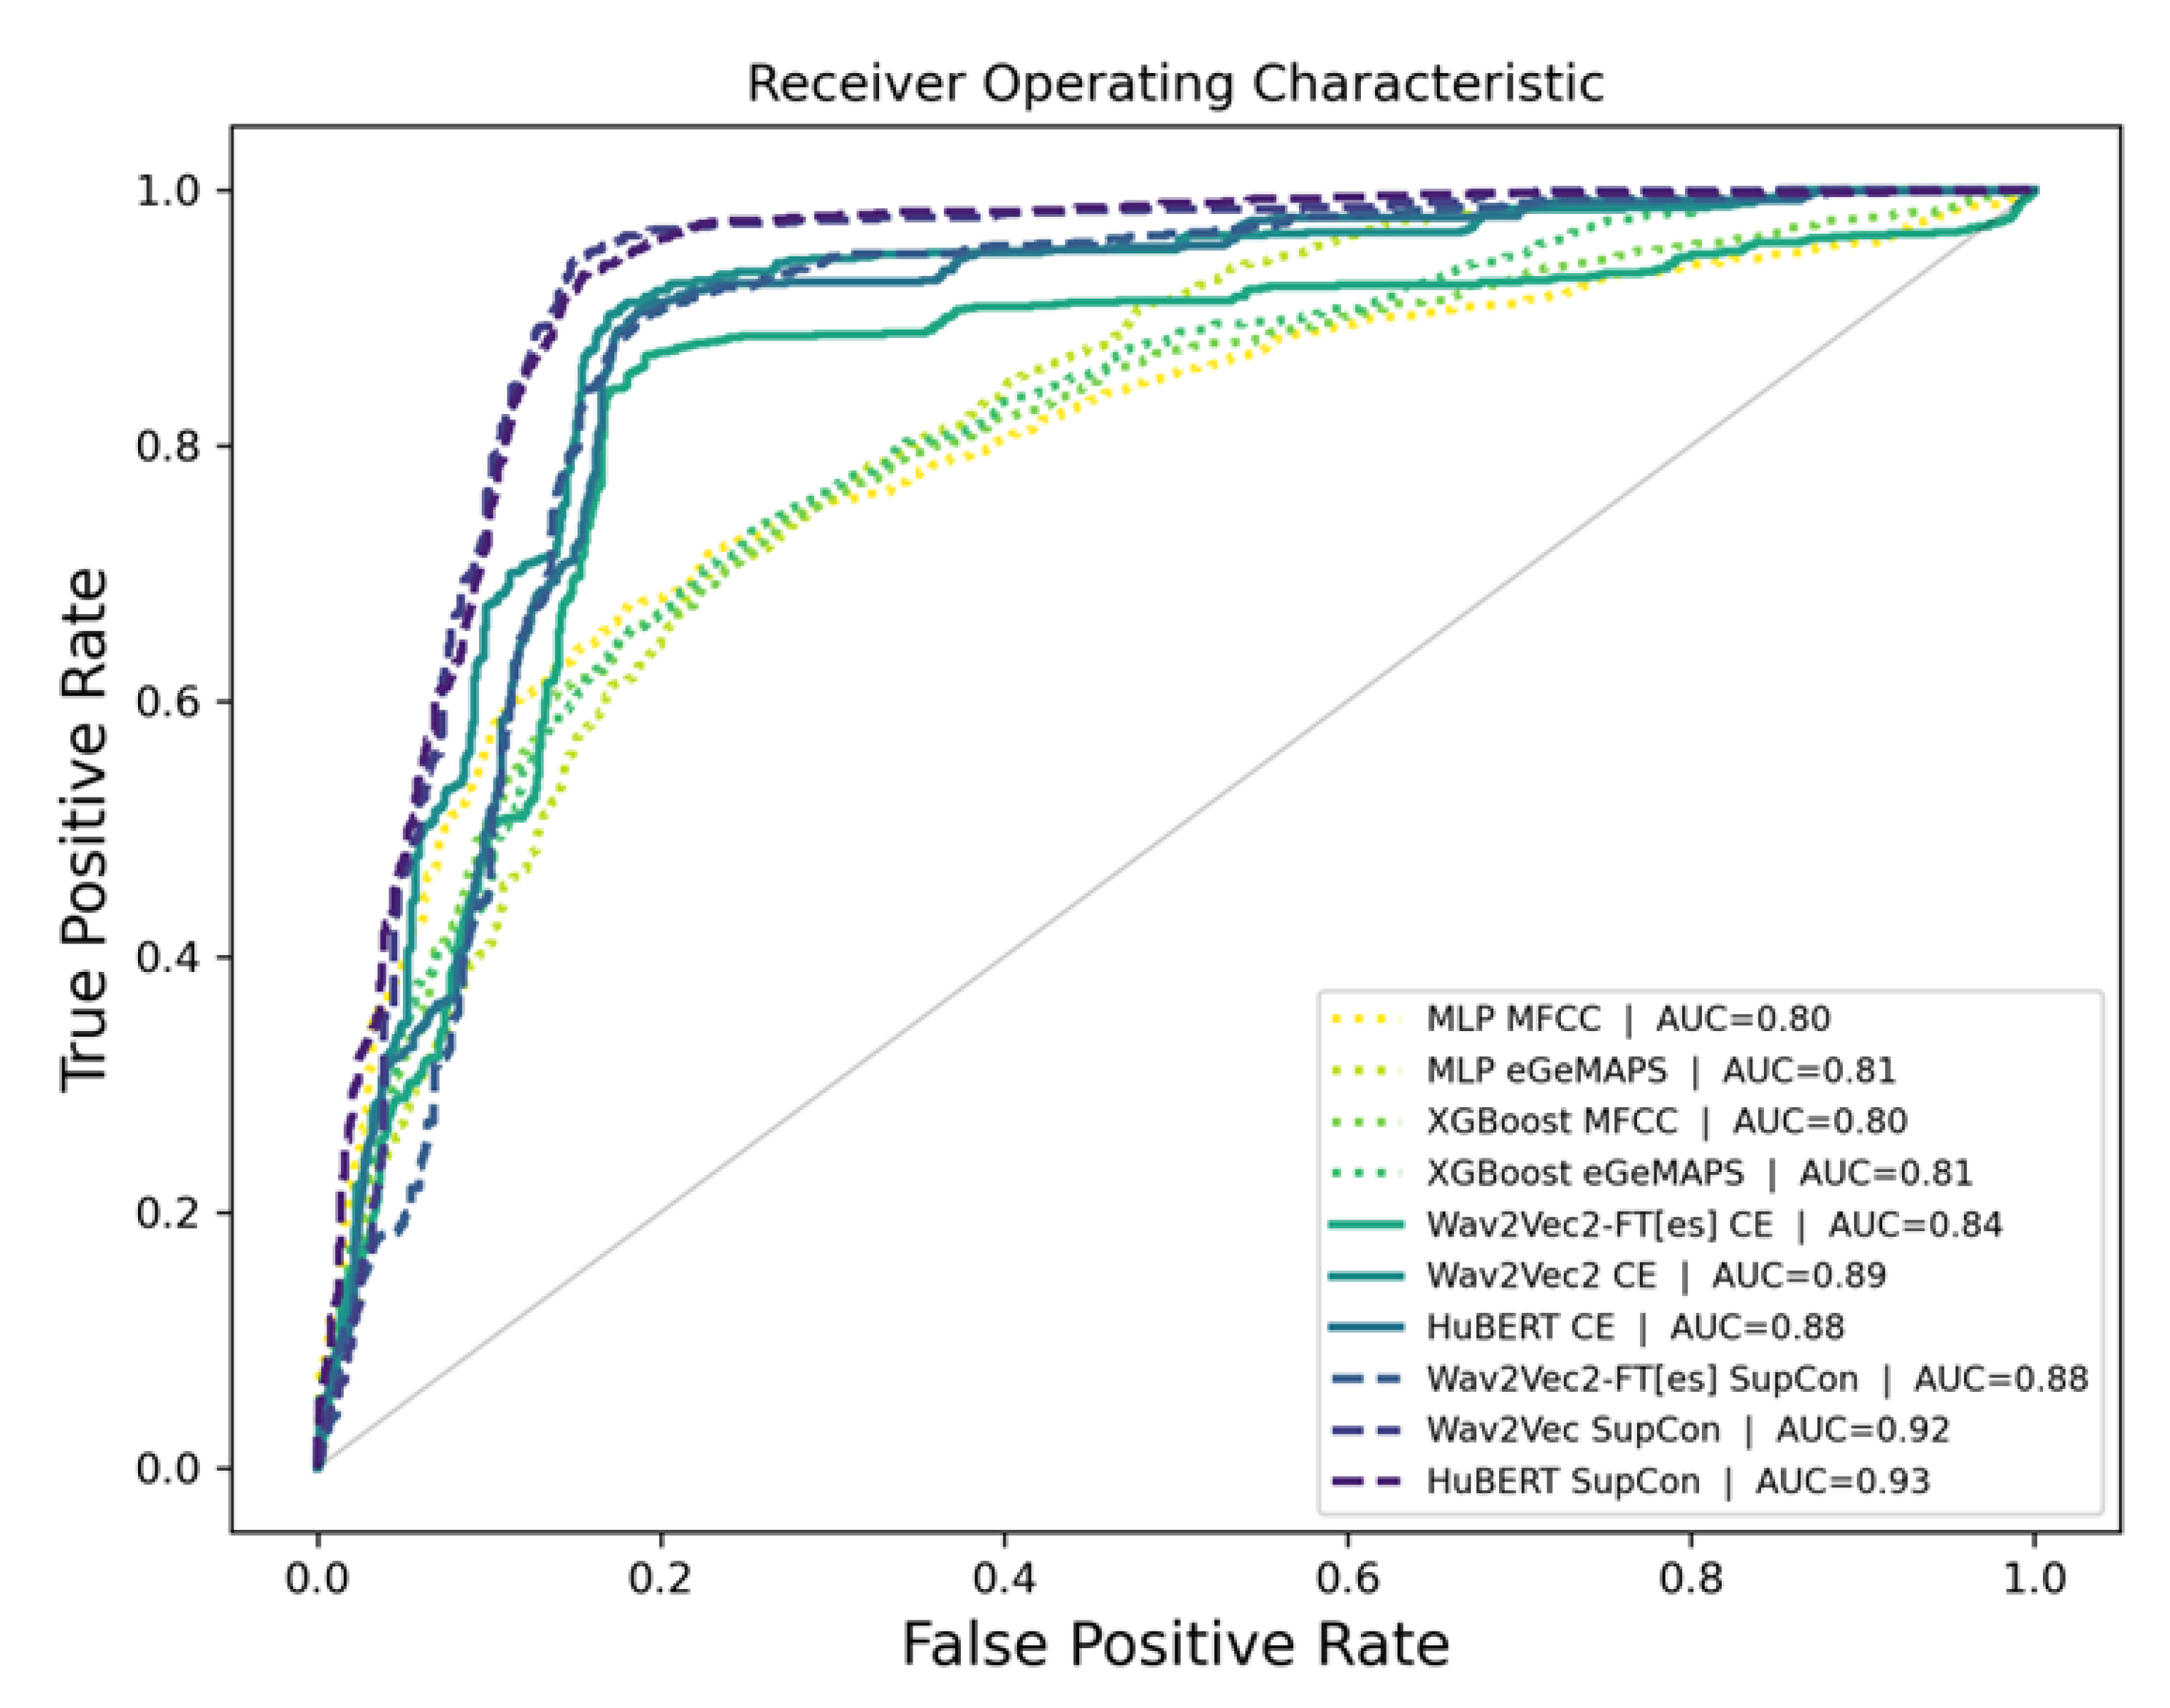
Figure 6.
Grad-CAM visualization feature of models for different classes.
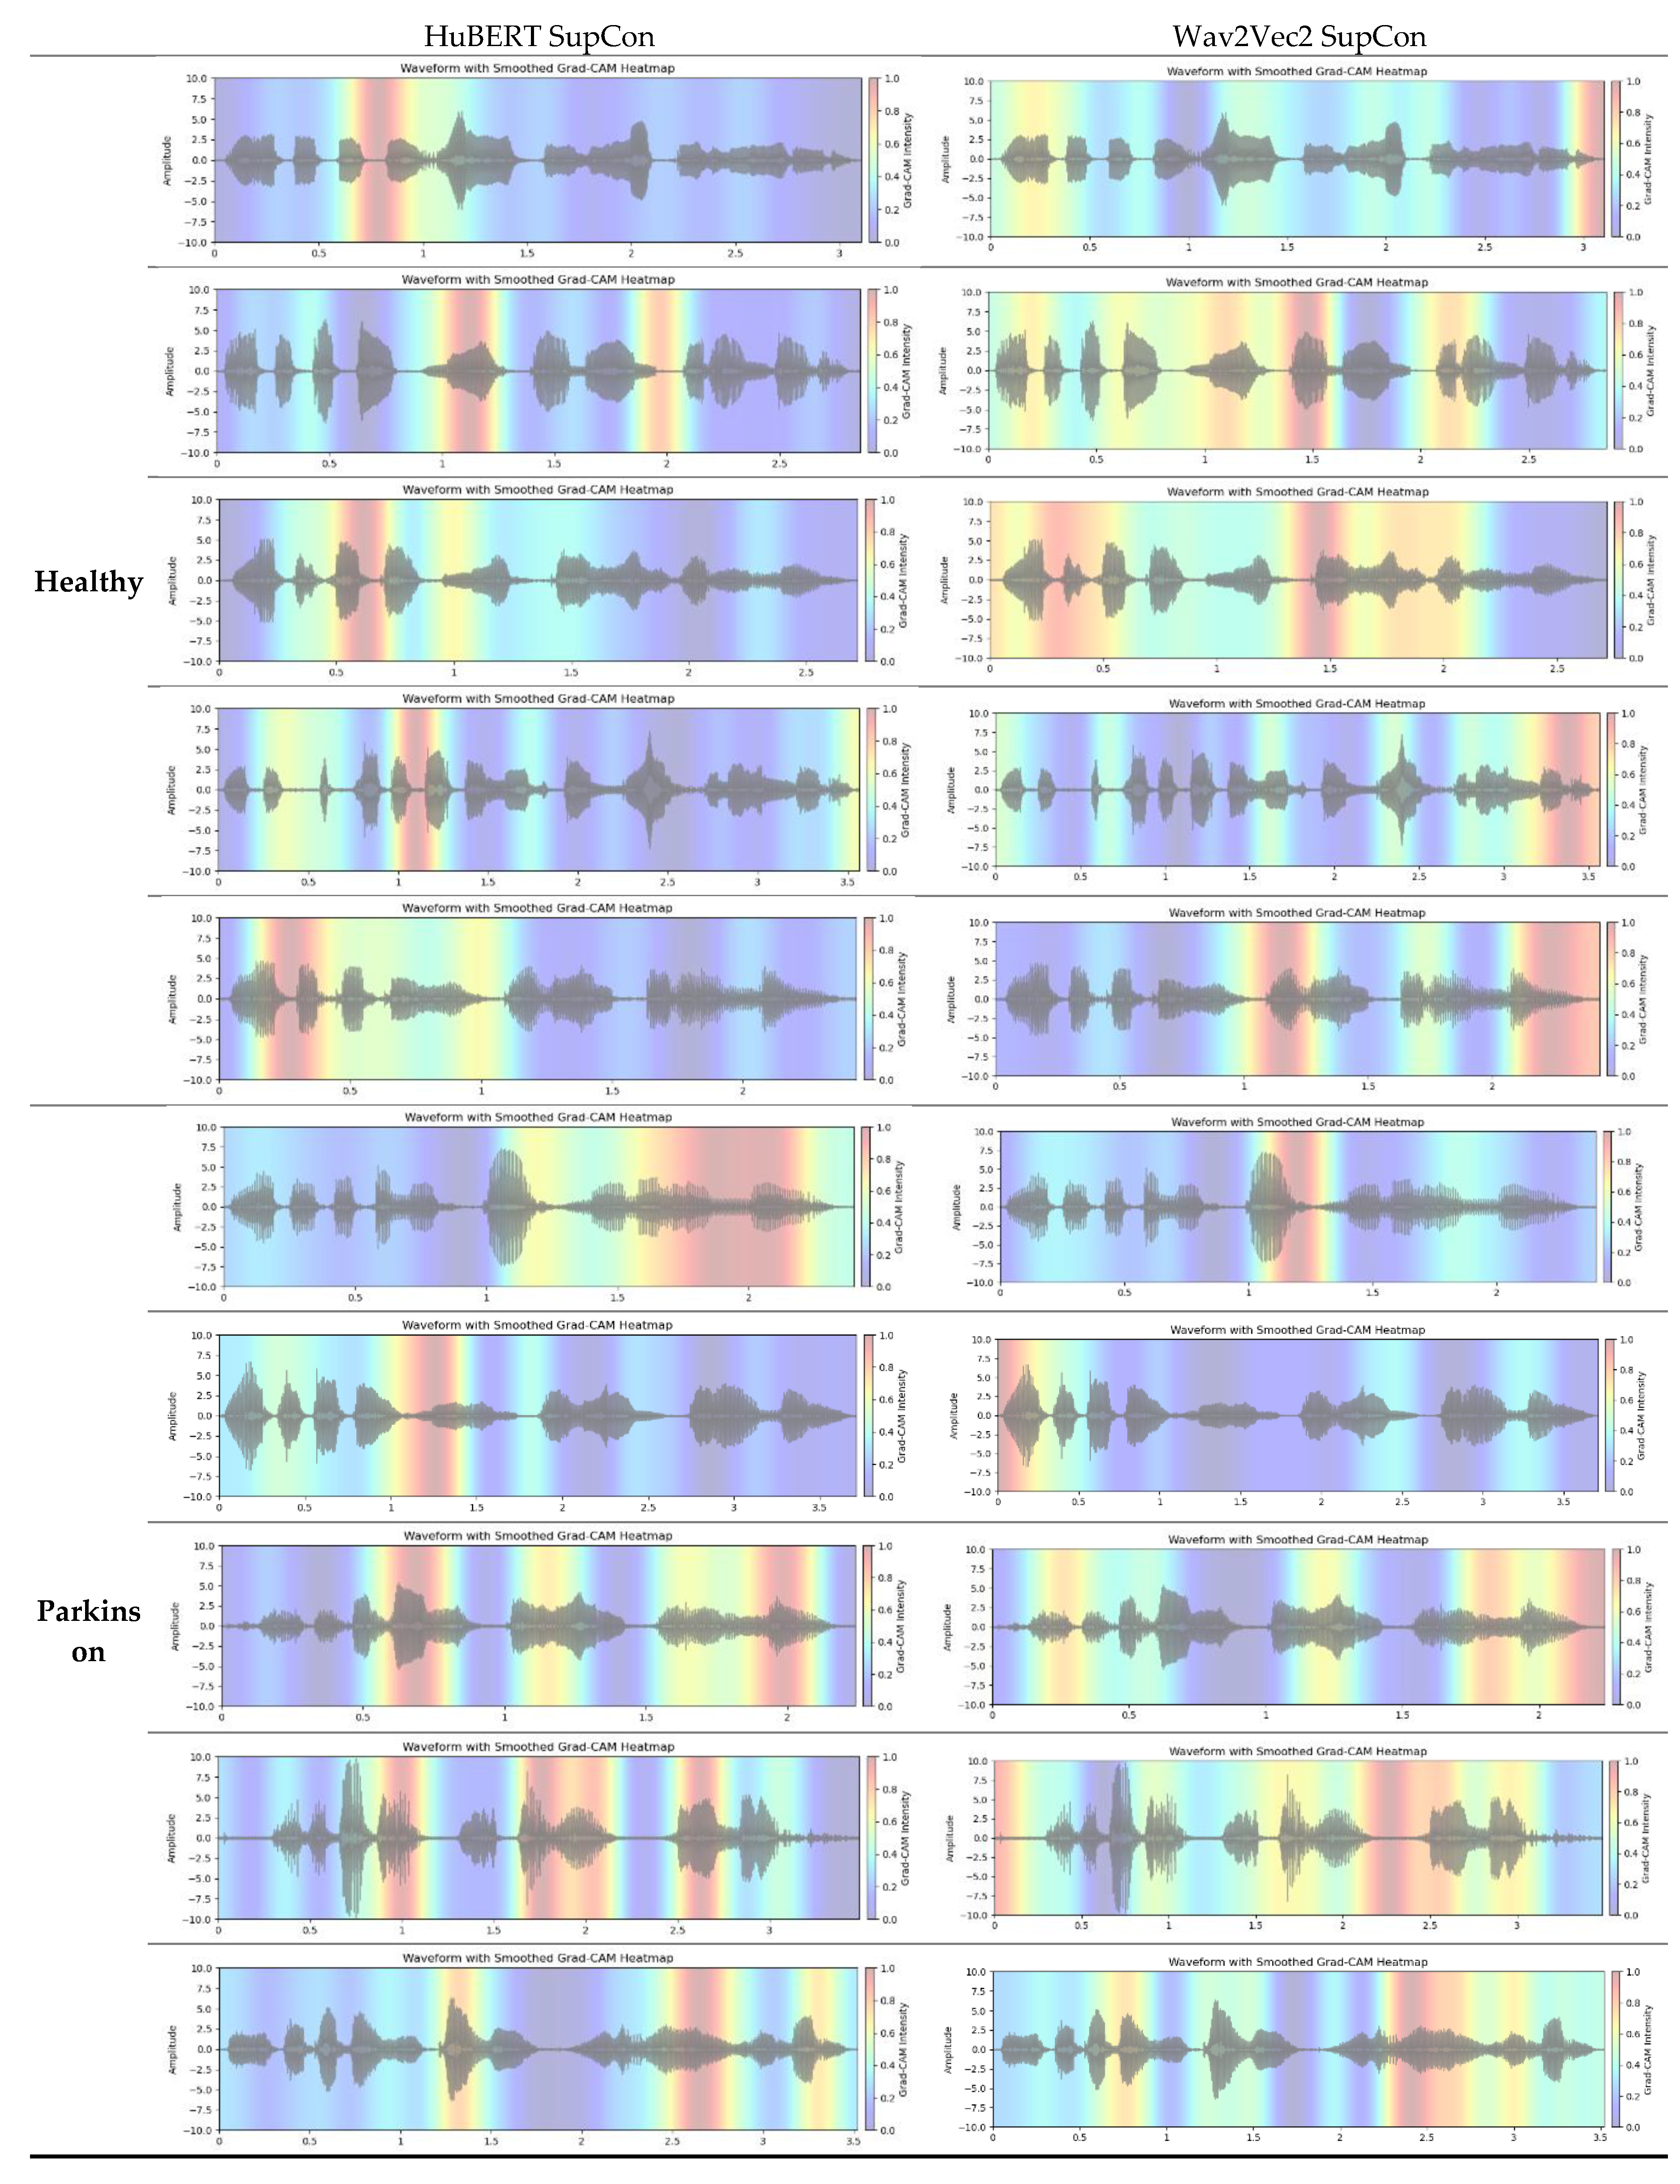

Table 1.
Parameter settings for training models.
| Parameter | Values |
| Epochs | 100 |
| Batch-size | 32 |
| Initial Learning Rate | 2e-5 |
| Optimizer | AdamW (β1=0.9, β2=0.999, Weight decay= 0.01) |
| Loss | Cross entropy loss and Supervised Contrastive loss |
| Dropout | 0.2 |
Table 2.
Classification performance on the test set (Mean ± sample standard deviation) for each model is summarized in the table, comparing precision, recall, F1-score, and accuracy across the different models.
Table 2.
Classification performance on the test set (Mean ± sample standard deviation) for each model is summarized in the table, comparing precision, recall, F1-score, and accuracy across the different models.
| Metric | AC[%] | F1[%] | P[%] | SN[%] | SP[%] |
| Model | |||||
| MLP | |||||
| +MFCCs Features | 72.51 (±2.28) |
73.33 (±2.85) |
71.14 (±1.82) |
75.77 (±4.99) |
69.26 (±2.84) |
| +eGeMAPS Features | 72.86 (±3.05) |
74.51 (±3.03) |
70.19 (±2.47) |
79.43 (±3.98) |
66.29 (±2.77) |
| XgBoost | |||||
| +MFCCs Features | 72.74 (±2.02) |
73.86 (±1.02) |
70.98 (±2.10) |
77.03 (±2.60) |
68.46 (±2.95) |
| +eGeMAPS Features | 73.60 (±3.19) |
74.02 (±3.36) |
72.83 (±2.96) |
75.31 (±4.49) |
71.89 (±3.60) |
| Wav2Vec2.0 | |||||
| +Cross Entropy | 85.89 (±4.27) |
86.86 (±3.42) |
82.02 (±5.89) |
92.69 (±4.30) |
79.09 (±9.09) |
| + Supervised Contrastive | 89.43 (±2.31) |
90.00 (±2.35) |
85.31 (±2.77) |
95.43 (±4.83) |
83.43 (±4.00) |
| HuBERT | |||||
| +Cross Entropy | 85.49 (±2.41) |
86.27 (±2.26) |
82.10 (±24) |
91.31 (±5.86) |
79.66 (±6.88) |
| + Supervised Contrastive | 88.06 (±2.97) |
88.99 (±2.48) |
83.02 (±24) |
96.11 (±3.11) |
80.00 (±6.60) |
| Wav2Vec2.0-FT [Spanish] | |||||
| +Cross Entropy | 83.83 (±2.45) |
84.21 (±2.90) |
82.24 (±3.63) |
86.74 (±7.33) |
80.91 (±6.14) |
| + Supervised Contrastive | 84.40 (±2.84) |
85.56 (±2.18) |
80.17 (±4.83) |
92.11 (±4.61) |
76.69 (±8.18) |
Table 3.
Classification performance of Wav2Vec 2.0 and HuBERT with SupCon across different projection head sizes, showing accuracy, precision, recall, F1 score, and AUC.
Table 3.
Classification performance of Wav2Vec 2.0 and HuBERT with SupCon across different projection head sizes, showing accuracy, precision, recall, F1 score, and AUC.
| Metric | Projection head size | AC[%] | F1[%] | P[%] | SN[%] | SP[%] |
| Model | ||||||
| Wav2Vec 2.0 + SupCon | ||||||
| 32 |
89.43 (±2.31) |
90.00 (±2.35) |
85.31 (±2.77) |
95.43 (±4.83) |
83.43 (±4.00) |
|
| 64 | 89.09 (±1.75) |
89.63 (±1.53) |
85.65 (±3.47) |
94.17 (±3.29) |
84.00 (±4.83) |
|
| 128 | 87.60 (±1.33) |
88.17 (±1.42) |
84.25 (±1.67) |
92.57 (±3.45) |
82.63 (±2.41) |
|
| 256 | 87.43 (±2.99) |
88.29 (±2.49) |
83.01 (±3.93) |
94.40 (±2.15) |
80.46 (±5.79) |
|
| HuBERT+ SupCon | ||||||
| 32 |
88.06 (±2.97) |
88.99 (±2.48) |
83.02 (±4.52) |
96.11 (±3.11) |
80.00 (±6.60) |
|
| 64 | 87.83 (±1.55) |
88.72 (±1.38) |
82.77 (±2.27) |
95.66 (±2.51) |
80.00 (±3.38) |
|
| 128 | 87.49 (±2.57) |
88.45 (±2.03) |
82.67 (±4.73) |
95.43 (±3.90) |
79.54 (±7.24) |
|
| 256 | 87.60 (±0.87) |
88.42 (±0.65) |
83.07 (±2.40) |
94.63 (±2.67) |
80.57 (±3.77) |
Table 4.
Performance metrics for three speech recognition models (Wav2Vec 2.0, HuBERT, Wav2Vec 2.0-FT[es]) with and without fine-tuning.
Table 4.
Performance metrics for three speech recognition models (Wav2Vec 2.0, HuBERT, Wav2Vec 2.0-FT[es]) with and without fine-tuning.
| Metric | Fine tune Model |
AC[%] | F1[%] | P[%] | SN[%] | SP[%] |
| Model | ||||||
| Wav2Vec 2.0 + CE | ||||||
| ✔ | 85.89 (±4.27) |
86.86 (±3.42) |
82.02 (±5.89) |
92.69 (±4.30) |
79.09 (±1.97) |
|
| × | 70.29 (±1.82) |
65.36 (±5.35) |
78.39 (±4.72) |
57.14 (±10.55) |
83.43 (±7.45) |
|
| HuBERT+ CE | ||||||
| ✔ | 85.49 (±2.41) |
86.27 (±2.26) |
82.10 (±24) |
91.31 (±5.86) |
79.66 (±6.88) |
|
| × | 82.69 (±1.21) |
84.30 (±0.96) |
77.17 (±1.68) |
92.91 (±1.32) |
72.46 (±2.69) |
|
| Wav2Vec 2.0-FT[es] + CE | ||||||
| ✔ | 83.83 (±2.45) |
84.21 (±2.90) |
82.24 (±3.63) |
86.74 (±7.33) |
80.91 (±6.14) |
|
| × | 65.54 (±2.05) |
84.21 (±62.95) |
67.97 (±1.73) |
58.74 (±4.94) |
72.34 (±3.34) |
*CE: Cross Entropy.
Table 5.
Classification performance of Wav2Vec 2.0 and HuBERT with SupCon at different temperatures, showing accuracy, precision, recall, F1, AUC, and specificity with standard deviations.
Table 5.
Classification performance of Wav2Vec 2.0 and HuBERT with SupCon at different temperatures, showing accuracy, precision, recall, F1, AUC, and specificity with standard deviations.
| Metric | Temperature | AC[%] | F1[%] | P[%] | SN[%] | SP[%] |
| Model | ||||||
| Wav2Vec 2.0 + SupCon | ||||||
| 0.03 | 87.43 (±1.34) |
87.86 (±1.24) |
85.11 (±5.09) |
90.97 (±3.49) |
79.66 (±7.34) |
|
| 0.07 | 89.43 (±2.31) |
90.00 (±2.35) |
85.31 (±2.77) |
95.43 (±4.83) |
83.43 (±4.00) |
|
| 0.10 | 87.89 (±2.82) |
88.32 (±2.67) |
85.39 (±3.73) |
91.66 (±4.6) |
84.11 (±5.12) |
|
| HuBERT+ SupCon | ||||||
| 0.03 | 87.54 (±3.58) |
88.52 (±3.03) |
82.70 (±5.09) |
95.43 (±2.91) |
79.66 (±7.34) |
|
| 0.07 | 88.06 (±2.97) |
88.99 (±2.48) |
83.02 (±4.52) |
96.11 (±3.11) |
80.00 (±6.60) |
|
| 0.10 | 86.69 (±0.87) |
87.97 (±1.57) |
80.55 (±3.45) |
97.03 (±1.48) |
76.34 (±5.40) |
Disclaimer/Publisher’s Note: The statements, opinions and data contained in all publications are solely those of the individual author(s) and contributor(s) and not of MDPI and/or the editor(s). MDPI and/or the editor(s) disclaim responsibility for any injury to people or property resulting from any ideas, methods, instructions or products referred to in the content. |
© 2025 by the authors. Licensee MDPI, Basel, Switzerland. This article is an open access article distributed under the terms and conditions of the Creative Commons Attribution (CC BY) license (http://creativecommons.org/licenses/by/4.0/).
Copyright: This open access article is published under a Creative Commons CC BY 4.0 license, which permit the free download, distribution, and reuse, provided that the author and preprint are cited in any reuse.


