
Submitted:
09 April 2025
Posted:
09 April 2025
You are already at the latest version
Abstract
Background: Parkinson’s disease (PD) is the second most common neurodegenerative disorder after Alzheimer’s disease affecting countless individuals worldwide. PD is characterized by the onset of a marked motor symptomatology in association with several nonmotor manifestations. The clinical phase of the disease is usually preceded by a long prodromal phase, devoid of overt motor symptomatology but often showing some conditions such as sleep disturbance, constipation, anosmia, and phonatory changes. To date, speech analysis appears to be a promising digital biomarker to anticipate even 10 years the onset of clinical PD, as well serving as a useful prognostic tool for patient follow-up. That is why, the voice can be nominated as the non-invasive method to detect PD from healthy subjects (HS).
Keywords:
Parkinson Disease
; Machine Learning
; Vocal Features
; Mel-frequency cepstral coefficient
; Accuracy Score
; ROC-AUC Score
1. Introduction
It goes without saying that Parkinson’s disease (PD) is the second most prevalent Neurodegenerative disorder after Alzheimer’s disease[1]. The incidence of Parkinson’s has risen yearly, and this trend is estimated to increase the number of PD patients to 17 million cases by 2040[2]. This issue can give rise to increasing socioeconomic burdens worldwide[3]. People with Parkinson’s disease (PWP) are characterized by motor symptoms, including tremor, bradykinesia, rigidity and non-motor symptoms such as REM sleep behavior disorder (RBD), voice impairment, depression, and anxiety[4,5] .The cause of those symptoms is neuronal damage caused by the accumulation of alpha-synuclein protein in a brain region called substantia nigra[6]. Unfortunately, among all motor and non-motor symptoms, some of them can be manifested prior to neurons loss at prodromal phase, including speech, REM sleep behavior disorder (RBD), hyposmia [7,8,9]. In the context of the early diagnosis of Parkinson's disease (PD), speech biomarkers offer a non-invasive and low-cost alternative to other diagnostic methods that are both expensive[10], and cumbersome, such as REM sleep behavior disorder (RBD), hyposmia (reduced sense of smell), and neuroimaging. RBD, which manifests as abnormal behaviors during REM sleep, is considered by many to be an early indication of synucleinopathies, including PD [11]. Studies have shown that individuals with isolated RBD have a high risk of rapidly developing PD in the future. However, not all patients with RBD will progress to PD, and the time frame for such progression can vary [12]. Hyposmia is also a common early symptom of PD, often experienced by patients years before physiological symptoms such as motor impairments begin [13]. Neuroimaging techniques, such as dopamine transporter DaTscan and MRI, represent significant advancements in detecting brain changes associated with Parkinson’s disease. However, the cost of these tests is high, and they are not universally available. Moreover, they may sometimes reveal coexistent findings with other neurodegenerative diseases, which can reduce diagnostic accuracy [14]. Fundamentally, speech biomarkers provide a practical and inexpensive method for the early detection of Parkinson’s disease.
Hypokinetic dysarthria, a distinctive speech disorder associated with PD, is characterized by a range of vocal difficulties, including diminished vocal power, a monotonous pitch range, and impaired articulation [15]. These impairments decrease interaction with people, leading to social isolation and psychological distress, such as depression[16]. In recent years, scientists have found out that more than 90 percent of PD patients suffer from vocal impairments[17], while the voice can reveal PD up to 10 years before the manifestation of motor symptoms. This indicates that the voice can be as one of the best digital biomarkers to predict Parkinson disease at early- stage of PD [18].
Apart from using voice as a digital biomarker to detect Parkinson's disease at an early stage, speech can also be influenced by other motor symptoms. For instance, patients with the postural instability/gait difficulty (PIGD) motor subtype show more pronounced speech impairments compared to those with the tremor-dominant subtype. Individuals with PIGD experience severe disruptions in both speech timing and gait, suggesting potential shared underlying mechanisms that affect both speech and gait[19].
Utilizing disease severity scales, such as Hoehn and Yahr staging and MDS-UPDRS scores, provides a deeper understanding of how disease progression impacts speech. For example, MDS-UPDRS scores generally increase by over 30% with each stage progression on the Hoehn and Yahr scale, and with each 5-year increase in disease duration over the first 15 years. These changes reflect the worsening of both motor and non-motor symptoms and offer valuable insights into disease progression (Differences in MDS-UPDRS Scores Based on Hoehn and Yahr Stage and Disease Duration) [20]. Nonetheless, longitudinal approach can be carried out based on UPDRS, while a cross-sectional approach can use voice recordings at one specific point in time.
In this era, thanks to the remarkable technological revolution, artificial intelligence (AI) and machine learning (ML) can be adopted to analyze voice signals as digital biomarkers to provide non-invasive tools that increase the possibility of monitoring and analyzing signals to predict PD without adopting interventional procedures [21]. Machine learning models are integeated in smartphone applications to differentiate Parkinson's disease patients from controls without the need for invasive measurements. These applications can also be used by neurologists to monitor patients, highlighting the significant role of AI and machine learning in telemedicine [22].
Moreover, ML models will result in high accuracy with minimum human error[23]. Whenever the subject of ML is raised, feature extraction has a vital role in feeding ML algorithms as training data. The more features correlated with PD, the more accurate the detection becomes. Throughout the features, both long-term and short-term features can be employed [24]. Moreover, according to reliable research, pitch period entropy (PPE) and recurrence period density entropy (RPDE) could be considered suitable inputs for machine learning models [25]. Long-term features include fundamental frequency (F0) (pitch), formant frequencies, jitter, and smoothed cepstral peak prominence (CPPS) [26,27] , while short-term features consist of Mel-frequency cepstral coefficients (MFCCs). Due to their high inter-feature correlation, classification accuracy has been reduced when utilizing long term features in comparison to short term feature [28] . Among these features, MFCCs, specifically MFCC2, plays a significant role in interpretation and classification [29]. Classification approach increases opportunity to predict disease by utilizing vocal features [30]. These models include random forest (RF), logistic regression (LR), naïve bayes (NB), decision tree (DT), K-nearest neighbors (KNN), support vector machines (SVM), artificial neural network (ANN), which are the most commonly ML models employed in medical research[23]. Nowadays, overfitting can occur when scientists try to model development, so after building models, unseen data cannot be detected by them, that is why cross-validation is one of the resampling approaches to build models which leading to reduced overfitting and increasing robustness of model [31]. Finally, All models can leverage vocal features to accurately classify individuals with Parkinson’s Disease (PD) from healthy subjects (HS) [32] . Once all algorithms have been implemented, several metrics have been obtained such as accuracy, recall score, and precision [33], ROC-AUC score [34], F1-score [35], and mean squared error (MSE) to report performance of models, demonstrating which models perform better at predicting Parkinson’s disease (PD) from healthy subjects (HS) [36]. In this research, we aim to further investigate the complex and intricate relationship that exists between voice biomarkers and Parkinson’s disease, and utilizing advanced feature extraction (long-term, short-term features and non-standard features) techniques and machine learning algorithms (RF, LR, NB, DT, KNN, ANN) based on cross-sectional study. By using vocal features, we aim to develop machine learning models to detect PD from HS based on metrics (accuracy, recall, precision, F1-score, MSE, ROC-AUC). These models could be proposed to design reliable models to detect Parkinson's disease at an early stage with minimal invasiveness and cost, paving the way for mobile-based platforms in the future. The following sections of this paper outline the methodology, dataset characteristics, and analytical framework employed to achieve the aforementioned objectives.
2. Materials and Methods
The methodology was designed as a cross-sectional study and implemented in five steps, as outlined in Figure 1. First, voices were downloaded from Figshare [37,38]. Next, the features that showed a correlation with Parkinson’s disease (PD) were identified. Thirdly, the dataset was constructed using these selected features. Following this, the dataset was put into various machine learning algorithms.
Finally, performanc metrics were analyzed to determine the best models for our research. All experiments were conducted using python in the Google Collab environment.
2.1. Dataset Preparation
Although the raw voice recordings used in this work were downloaded from a publicly available repository, we applied custom features extraction including Jitter, shimmer, MFCC, CPPS using, Praat software, librosa on python. A total of 41 healthy voices (16 males, 25 females) and 40 voices from PD patients (21 males, 19 females) were studied. All the PD patients which were enrolled had a mean age of 66.6 ± 9.0 years, whereas in the healthy controls, the mean age was 47.9 ± 14.5 years. The Hoehn & Yahr was 2.1±0.4 for Parkinson patients. The voices were prepared for feature extraction [38]. All participants pronounced the sustained vowel /a/. To select the appropriate vocal test, different approaches were considered, such as running speech. However, sustained vowel tests were preferred as they can better induce speech difficulties. Even though running speech is more realistic than sustained vowel tests, it is more difficult to analyze[25,39]
2.2. Acoustic Signal Features
Although features can be extracted using software such as Praat[40] , and the Parselmouth library in Python, this study used Praat (the original software) to extract long-term features (predictors), including jitter, shimmer, and smoothed cepstral peak prominence (CPPS). Notably, The Mel-frequency cepstral coefficient (MFCC), Pitch Period Entropy (PPE), and recurrence period density entropy (RPDE) were extracted using the librosa in python.
2.2.1. Long Term Features:
Long-term features consist of various types of parameters: Fundamental frequency (F0), or pitch, which represents the rate at which the vocal folds vibrate. Jitter, which measures variations in F0 across vocal cycles; Shimmer, indicating fluctuations in amplitude between cycles[24,41], and Cepstral Peak Prominence (CPPS), which
represents the difference between the maximum amplitude and noise[7,27] . Formants, which are the spectral peaks of the speech spectrum, correspond to the resonant frequencies of the vocal tract [42]. All these features can be used to train our model as input data to assist decision making and predict outcome (Automatic Parkinson’s disease detection based on the combination of long-term acoustic features and Mel frequency cepstral coefficients (MFCC)). These acoustic signal features should be used for automatic detection of Parkinson’s disease. These features can characterize signal properties over extended periods, including amplitude variations (shimmer), and frequency fluctuations (jitter).
2.2.2. Pitch Period Entropy (PPE):
The PPE measures irregularities in speech pitch, this is relevant for analyzing speech impairments and Parkinson’s disease (PD) since controlling voice may be impaired. This parameter evaluates the difference between natural variations (such as vibrato and microtremor) and pathological speech associated with PD. In fact, this factor shows how the human ear can perceive pitch change. If the entropy is computed
(a measure of randomness or uncertainty) of pitch variations, PPE can provide reliable measurement to detect PD. This feature can be useful when our study encounters uncontrollable confounding effects including noisy acoustic environments and normal ,and also improve classification of healthy from Parkinson patients[25]
The Recurrence Period Density Entropy (RPDE):
The Recurrence Period Density Entropy (RPDE) can be used to evaluate regularity or periodicity of a voice signal. For example, in healthy individuals, the vocal folds produce voice consistently and follow a regular pattern. On the other hand, voice disorders such as Parkinson’s disrupt this regular pattern, leading to unstable vibrations or irregularities, resulting in a less steady voice. RPDE analyzes the recurrence of similar patterns within the signal over time. RPDE is normalized between 0 and 1. Values closer to 0 indicate higher regularity, while values closer to 1 represent greater irregularities in the voice signal. This parameter can identify general voice disorders and maintain the steady vibration of the vocal folds[25,43].
Short term feature (Mel frequency cepstral coefficients):
Mel-frequency cepstral coefficients (MFCC) were first introduced for automatic speech recognition systems in 1980[44]. Over time, this feature was applied to detect voice disorders and is now widely used as a reliable feature for detecting PD [45] .This short-term feature has non-correlation among some other features, particularly long-term features, making it a reliable factor in improving classification accuracy. Negative MFCC values indicate a higher concentration of energy in the higher frequency bands of the Mel filter. Parkinson’s disease often manifests in voice changes, including hoarseness and breathiness, which are characterized by increased high-frequency energy and, consequently, more negative MFCC values [28]. Table 1 showed a list of features used as input data in the dataset
Preprocessing plays a crucial role in machine learning, as proper execution of this stage ensures that models perform more reliably. First, the dataset was read using the Pandas’ library in Python. Then, the data in the table was converted into a matrix array. All numerical values were standardized and split into 80% training data and 20% test data. Additionally, K-fold cross-validation was applied to enhance the validation of models on both the training datasets.
2.3. Classification Algorithms
In recent times, various types of models have been employed for detecting Parkinson’s Disease (PD) from healthy subjects (HS). This research utilized seven common algorithms. To implement these algorithms, several parameters were considered. Grid search was then used to select the optimal hyperparameters for each model.
Random Forest (RF):
Random forest is a popular ensemble learning method used in machine learning and data science. It works by creating multiple decision trees on different subsets of the training data. These individual trees are then combined to make a final prediction, often through majority voting or averaging. This approach helps to reduce overfitting and improve the overall accuracy and reliability of the model compared to a single decision tree [46].
Logistic Regression (LR):
The LR is one of the popular statistical-based models employed to solve classification issues in ML by probabilities that should be regarded on biological research particularly when ML algorithms is implemented where the target variable is categorical. As mentioned before, this dataset contains one column Labeled as the target for detecting PD. Logistic Regression assumes a linear relationship between the independent and dependent variables, which can limit its applicability in complex, nonlinear relationships. This model calculates probabilities based on sigmoid function between the range of [0,1] in Eq below: [23]
2.2.3. Naive Bayes (NB):
Naive Bayes (NB) is one of the simplest algorithms adopted by Machine learning models. This model is applied as supervised learning based on conditional probability. It is much faster than other supervised learning models because of calculating probability solely and having high accuracy with categorical features. However, Naive Bayes has a drawback: if it encounters unseen data in the training input, it may be unable to make predictions, leading to a probability of 0 [47]
2.2.4. Decision Tree
A Decision tree is applied as commonly ML models in classification. Each step shows a feature of the data, while branch is related to value of that feature. By considering both of factors, the model can classify the data points into specific category. This model is interpreted by human easily because of its tree structure.it also useful to handle missing data. However, overfitting, sensitivity to noise and bias toward the majority class are the most disadvantage of the models [30].
2.2.5. K-Nearest Neighbor (KNN Classifier):
Euclidean distance function is used to compute data and classify new data point based on similar measures on KNN model or lazy learning. On this model, the classification of a data point is determined by the majority vote of its nearest neighbors. The K-NN algorithm stores all available data points and classifies new data points based on their similarity to existing ones. This means that new data can be easily categorized by comparing them with the most similar existing data points. The most challenging to use models that selecting the optimal number of neighbors [36].
2.2.6. Support Vector Machine (SVM):
The SVM uses a hyperplane to optimally separate two classes, maximizing the margin between them. In this case, the classes are normal individuals and Parkinson’s disease (PD) patients. This hyperplane serves as a decision boundary, which is identified by the SVM algorithm. The decision boundary divides the data space into two distinct regions, such as normal and PD. The geometric margin refers to the distance from the decision boundary to the nearest data point. When the data is linearly separable and the resolution limits are clearly separated by the hyperplane, the geometric margin is positive. The objective is to find a hyperplane that maximizes this margin. When the training data are linearly separable, a single linear decision boundary exists, separating the normal data above the hyperplane from the PD data below it [48,49].
2.2.7. Artificial Neural Network (ANN):
Artificial Neural Network (ANNs) is a model inspired by the structure of neurons in human’s brain. The ANN includes layers of interconnected nodes that process and learn patterns through training. ANN can be utilized in ML such as classification. The model has some advantage such as Widely applicable, highly flexible. On the other hand, Risk of overfitting, requires large datasets are the most challenging that must be considered on using this model [50].
2.2.8. Cross Validation
Cross validation is one of the most popular approaches for evaluating and validating the performance of machine learning (ML) models by splitting dataset into subsets. We used K-fold cross-validation, where the data was divided into K equally sized folds. The models were trained on K-1 folds and tested on the remaining fold. This process was repeated K times, and each fold was utilized once as the validation set. All metrics were computed based on their meaning and could be compared with results obtained without using the cross-validation technique [50].
2.2.9. Evaluation Criteria
3. Results
The entire experiment was conducted in the Colab environment, operating on Windows, with the hardware listed in Table 3. The experiments were implemented in Python as well.
In this study, 30 features were selected based on their relevance, as reported and summarized in Table 1. All features were used in the dataset to train the ML models as input.
The dataset, which included vocal features, was standardized because ML does not perform well when numerical values have different scales, which is why all data was standardized according to formula [23]:
where
x is the original data point,
µ is the mean of the data,
σ is the standard deviation of the data
Next, the dataset was split into 80% train and 20% test subset to develop the models. The training data was useful for learning our model, which was not suitable for generalizing the model performance. In this research, we report all metrics based on test models. To ensure reliability, we implemented 5-fold cross-validation to evaluate model performance. To select the best models, we used important factors mentioned earlier, including accuracy, recall or sensitivity, precision, F1score, ROC-AUC score, and MSE. In this study we compared all metrics to select the best models for distinguishing PD from Healthy individuals utilizing cross-validation. According to Table 4, the Random Forest model had the lowest average MSE (5-fold CV) with the minimum standard deviation. The average MSE was 0.50±0.01 for ANN, making it the worst performing model by far. Although MSE is a valid metric for comparing models, other key metrics were considered more informative:
As shown in Table 5, the random forest model could be selected as the best model for predicting PD from healthy subjects in this work. The accuracy and ROC-AUC were 82% and 89%, respectively. Although recall plays a crucial role in distinguishing PD from HS, it was 75% for RF. The Naive Bayes (NB) model achieved the highest recall score (82%) among all models, indicating that the NB could also be considered one of the best models for predicting PD. The ROC-AUC of the NB was 81%, which played a key role in selecting models for Parkinson’s prediction. However, despite its recall scores, the overall accuracy of this model was not optimal.
The grouped bar chart (Figure 2) illustrates the results presented in Table 5. Notably, RF demonstrated the best results in terms of ROC-AUC, accuracy, F1-score and precision score, while ANN had the worst performance across all metrics. Recall plays a significant role in detecting PD. Although NB had the highest recall rate, SVM, LR, DT achieved similar scores. The ANN had the lowest recall rate compared to the other models."
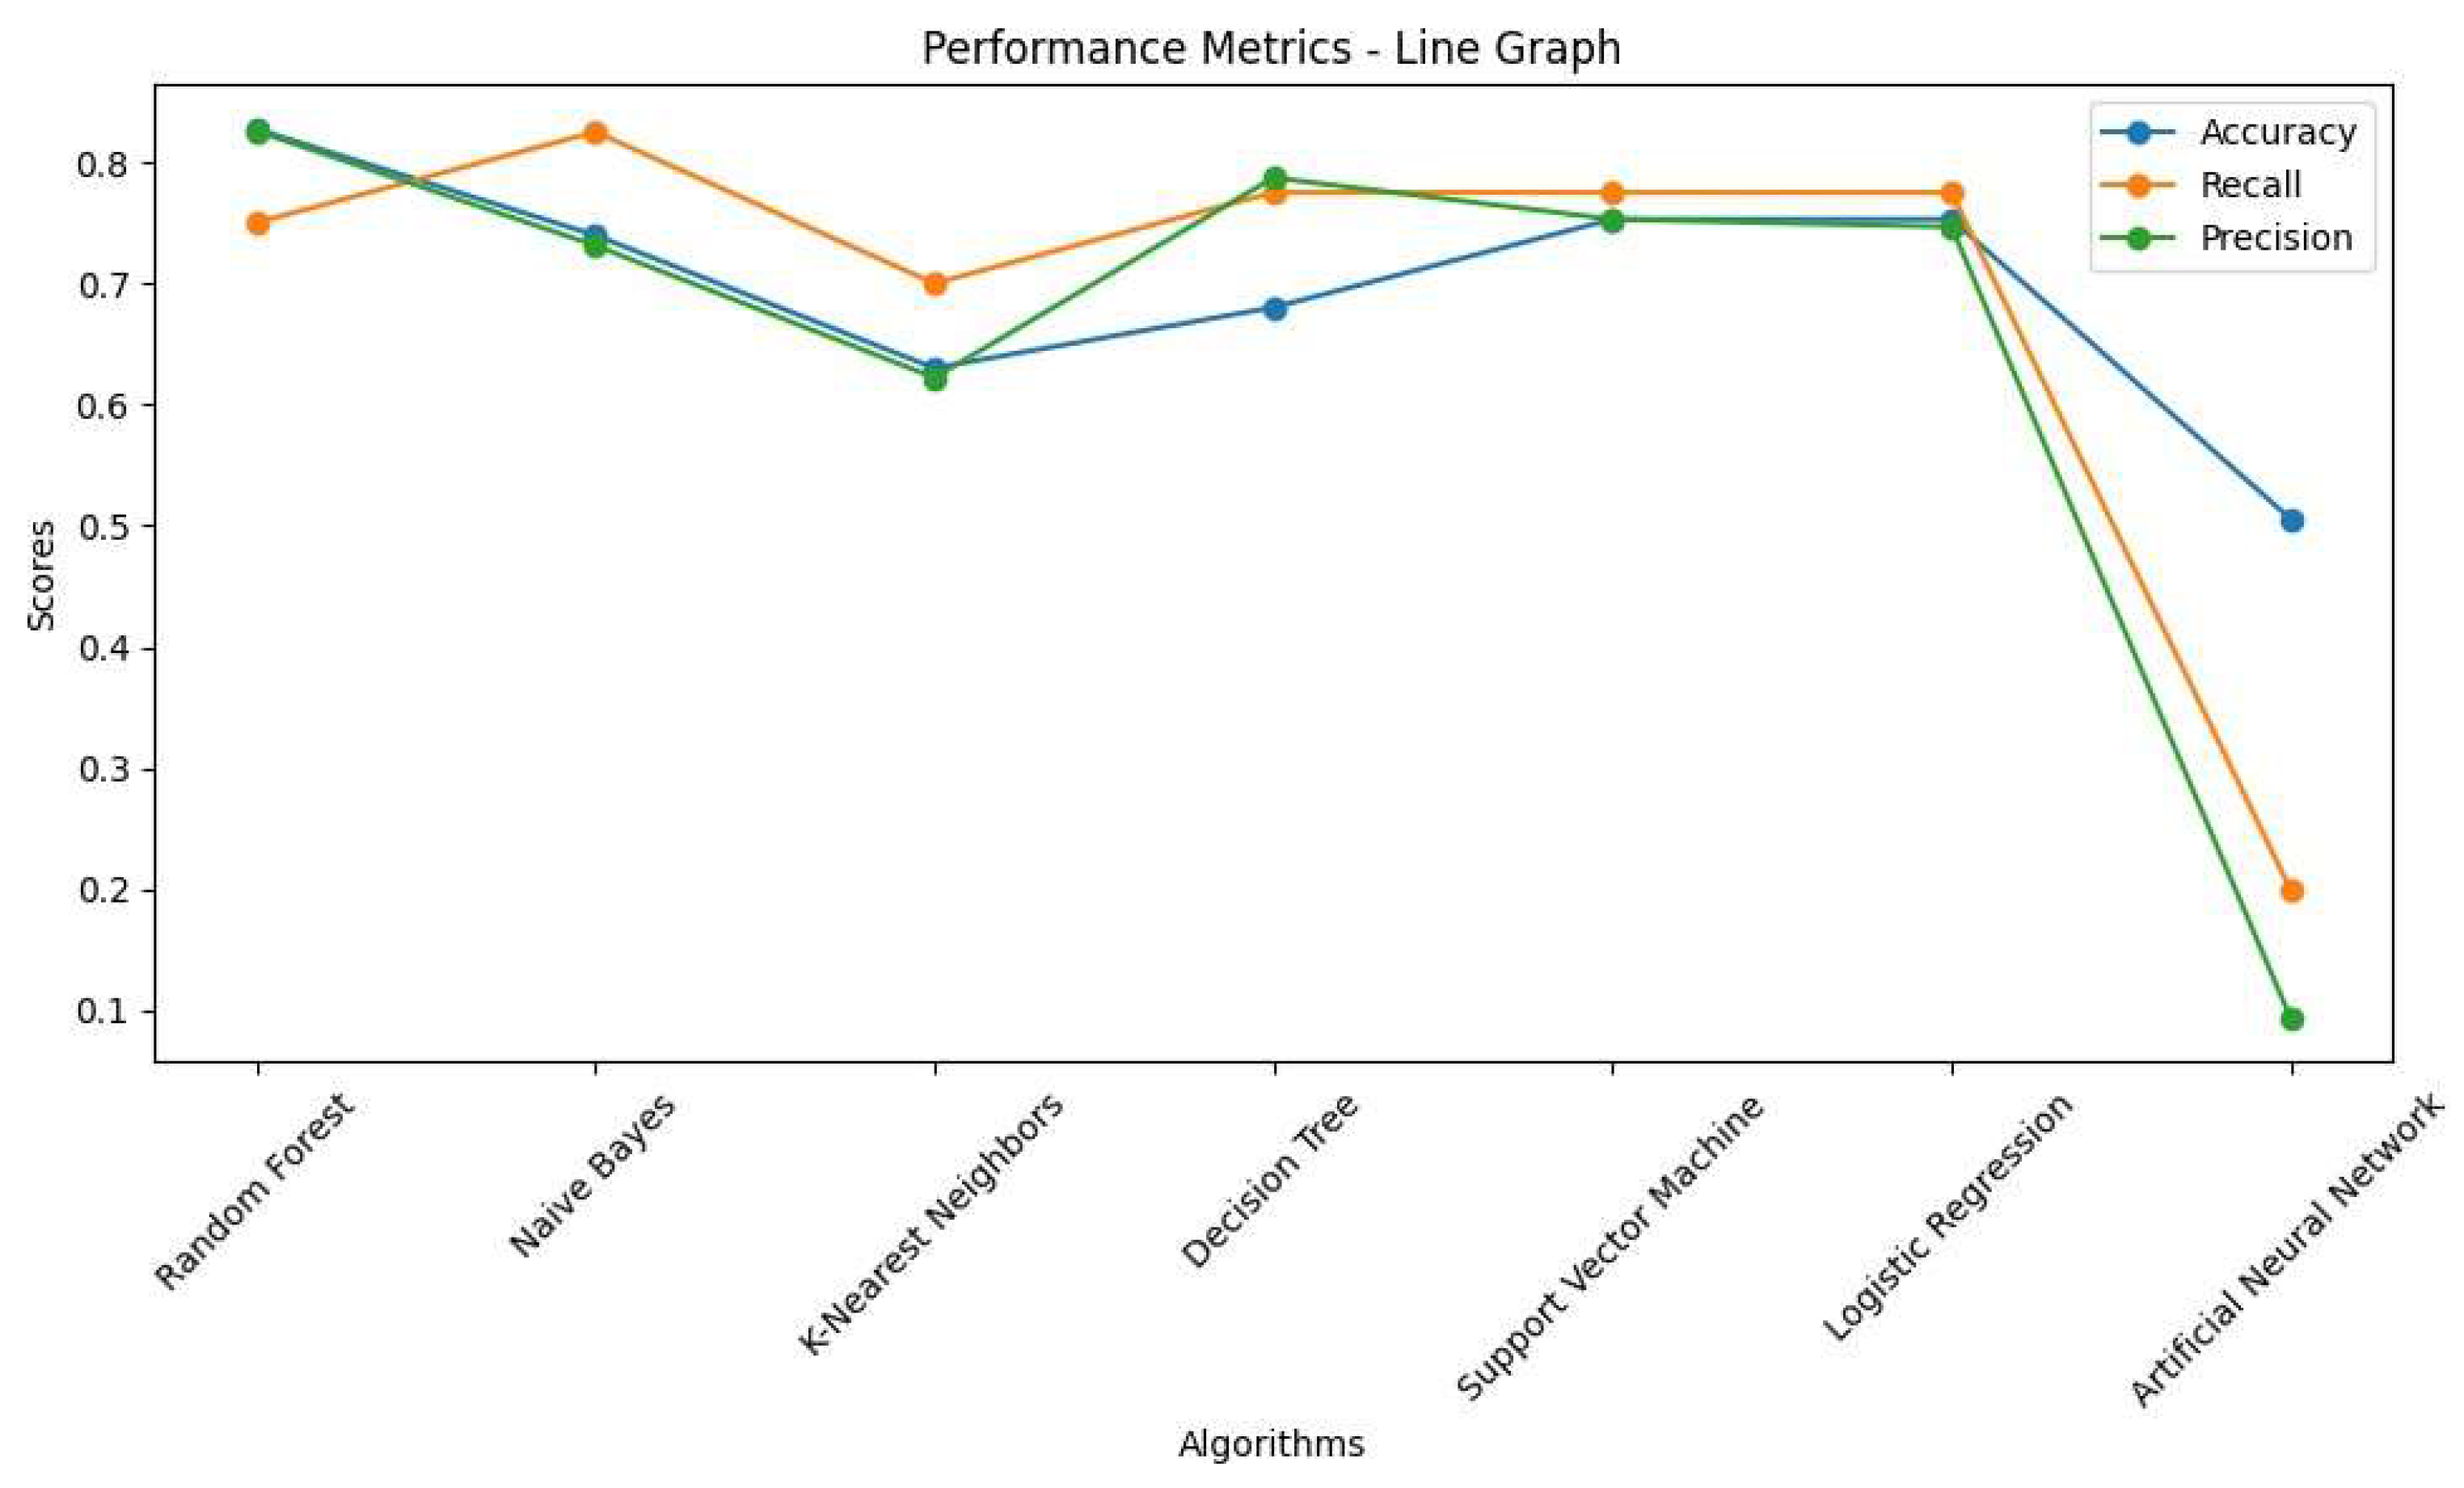
The line graphs also show the performance of the algorithms using three common metrics. According to these line graphs, RF and LR were selected as the best models with 82% and 76% accuracy, respectively. Additionally, the recall scores were identical (83%), and the ROC-AUC scores were 82% and 78%, respectively. Interestingly, as mentioned earlier, ANN had the lowest accuracy but the highest recall. Recall plays a significant role in detecting PD from HS, but among all models, RF and LR had the highest accuracy and recall. This is why both metrics were considered to select the optimal models.
Figure 3.
Performance Metrics (Accuracy, Recall, Precision Scores).
In addition to Random Forest, Naïve Bayes, Logistic Regression, Decision Tree, K-Nearest Neighbors (KNN), and Support Vector Machine (SVM) were also evaluated, as shown in Table 5. Naïve Bayes had the highest recall score, indicating a relationship between recall and PD detection from HS. However, this model suffered from lower accuracy and other important metrics. In this research, the RF, SVM, LR demonstrated best performance across multiple metrics. These models obtained the highest rate in accuracy and precision, and F1-scores. These models showed a better balance between sensitivity and specificity. Specifically, the ROC-AUC scores for RF, SVM and LR were 89%, 82% and 81%, respectively, while NB and DT scored 81% and 80%, respectively (Figure 4). KNN and ANN had the lowest performance across all metrics.
Table 6 provides valuable information to compare pervious studied and our outcomes. Our study adopted long-term, Short-term and non-standard features to build machine learning models. We could achieve 89.65% ,82.65% of ROC-AUC using random forest and SVM, respectively. Naïve Bayes (NB) was also approved with the highest rate of recall (82.50%) for Parkinson detection.
4. Discussion
Our study investigated the potential of machine learning models in distinguishing Parkinson's disease patients from healthy individuals using vocal features. By analysing long-term, short-term, and non-standard acoustic parameters, we aimed to develop a robust classification framework. Our findings indicate that random forest achieved the highest classification performance, followed by support vector machine, logistic regression, and naïve bayes, suggesting that voice impairments in Parkinson's disease can serve as reliable digital biomarkers.
In our work, align with prior research demonstrating the efficacy of machine learning in Parkinson's disease detection through voice analysis. Iyer et al. employed Parselmouth, a Python interface for Praat, to extract long-term features, while we selected for Praat directly to minimize discrepancies. Unlike Iyer’s study, which focused on specific feature subsets, we incorporated additional non-standard measurements, such as Pitch Period Entropy and Recurrence Period Density Entropy, achieving a broader representation of vocal impairments in Parkinson's disease [38].
Through our analysis, the RF model was selected as the best option for avoiding overfitting among the tested algorithms. The RF model, based on decision trees, is well designed to model nonlinear relationships and can handle the noisy data commonly found in acoustic signals indicative of PD, in contrast to the other models in this study [52]. Within this investigation, grid search was used to select our hyperparameters. Although the selected hyperparameters did not significantly improve performance metrics for the ANN and KNN models, the results were different for the RF and SVM models [53].
Although RF and SVM were analyzed in our study, we also compared our findings with those from previous research. For instance, Iyer et al. explored Random Forest, Logistic Regression, and Convolutional Neural Networks. While our Logistic Regression and Random Forest models did not achieve the same level of performance as Iyer’s, our overall model performance was significantly higher in most cases. This contrast highlights the effectiveness of our selected feature set and machine learning approach in distinguishing Parkinson’s disease from healthy individuals [38].
In the present study, we employed 5-fold cross-validation to enhance robustness while reducing computational time. Our research demonstrated superior performance when comparing commonly used models, which are crucial for distinguishing PD from HS. In contrast, Wroge et al. did not comprehensively explore different machine learning models and utilized 10-fold cross-validation, which can increase computational time without yielding significant improvements [54].
In our approach, we combined non-standard features with long-term features and MFCC1-12 to evaluate the performance of various models (as shown in Figure 3). Our findings revealed that RF was the best model for predicting PD from HS. Notably, among all MFCC , MFCC2 emerged as the most relevant for interpreting Parkinson’s disease, as demonstrated by Tracey et al [27]. Although we aimed to integrate all features to develop robust models, previous studies have typically analyzed features based on either non-standard or long-term features, often excluding short-term features despite their significance or disregarding non-standard measurements altogether [26].
Our findings demonstrate that Random Forest is particularly well-suited for handling complex, nonlinear relationships in acoustic data. Its decision tree-based structure enables effective modelling of voice impairments, which may exhibit intricate patterns that simpler classifiers struggle to capture. Additionally, Support Vector Machine and Naïve Bayes exhibited strong recall scores, highlighting their potential in prioritizing sensitivity in Parkinson's disease screening.
Our models could assist neurologists in distinguishing PD from HS, potentially leading to earlier intervention. Early detection would allow for the timely prescription of medications, such as L-dopa, which can help improve speech impairments associated with PD, even if they do not fully restore normal speech. Detecting Parkinson’s at the prodromal stage could significantly enhance patient outcomes by enabling earlier management of symptoms [55] In our investigation, the study was based on a cross-sectional study to analysis voice impairment based on ML models. Although, Longitudinal study can be investigated as useful approach to study any correlation between Parkinson progression and speech change. In Longitudinal study, Unified Parkinson’s Disease Rating Scale (UPDRS) can provide valuable information regarding the disease progression of motor symptoms. However, voice impairment follows a different pattern from motor symptoms especially when the severity of the disease is considered over time. This indicates that separate scales should be developed to assess voice-related disease severity. According to Wright ant et al, Parkinson’s voice features were analyzed and monitored across different severity categories using one-way analysis of variance and support vector regression. Significant changes and trends were found. The study confirmed that voice could be used to detect PD at early and late stages and provide warnings about disease progression [56]. Thus, our study focuses on predicting Parkinson’s disease, and we adopted a different approach. Although they used common features, they aimed to find correlations between PD progression over time.
In our study, RF was the best model, while ANN was the worst. However, some study carried out that AdaBoost classifier had the highest accuracy rate, while KNN was the least accurate [57].
5. Limitation
Our dataset, however, comprises 81 participants (40 Parkinson's disease (PD) patients and 41 healthy individuals), with important limitations when considering the generalization of the findings. While our dataset provides valuable information that can be used to build models to distinguish PD patients from healthy individuals, there are inherent challenges in recruiting participants for the clinical studies that this dataset supports. Recruiting both PD patients and healthy individuals for voice sampling studies can be difficult, and participants may face barriers such as mobility issues or health-related conditions, making it increasingly challenging to obtain consent. Moreover, healthy individuals may not be inclined to participate in research, which can lead to potential bias in the participant selection process. These recruitment issues may limit the diversity and representativeness of the sample, and efforts to expand the dataset by including a variety of demographic groups are important to improve both the robustness and applicability of the findings. Apart from these challenges, the lack of participants also makes it difficult to generalize our model in medical research because of lack of data.
6. Conclusion
This work established that voice characteristics are effective in differentiating Parkinson's disease (PD) patients from healthy individuals using machine learning models in
cross-sectional study. Since neurologists typically diagnose PD only after the onset of motor symptoms, leveraging non-motor symptoms such as speech offers a promising, non-invasive approach for early detection. In this approach, machine learning plays a crucial role by analysing various voice features, including long-term, short-term, and non-standard parameters, which have been shown to provide strong discrimination between PD patients and healthy subjects (HS). By applying various machine learning algorithms, including random forest (RF), logistic regression (LR), naïve bayes, k-nearest neighbors (KNN), support vector machine (SVM), and artificial neural networks (ANN), our findings indicate that RF and SVM achieved the highest performance in classifying PD patients.
Further research should focus on improving classification accuracy by integrating multi-modal approaches and advanced machine learning techniques. Additionally, real-world applicability requires the validation of these models on larger and clinically diverse populations. For example, smartphones can assist neurologists in monitoring patients and even detecting Parkinson’s disease in healthy subjects. The increasing adoption of voice-based screening technologies for early PD diagnosis holds significant potential in enabling neurologists to detect PD before motor symptoms appear, facilitating earlier medical intervention and improved clinical outcomes.
Patents: This section is not mandatory, but may be added if there are patents resulting from the work reported in this manuscript.
Author Contributions
“Conceptualization. and M.M.; methodology, M.R., M.M.,and SA.; software, M.R.,A.C.,C.C.,A.B.; validation,A.D.,D.M., andM.G.; formal analysis, M.R.,G.M. and S.A.; investigation, M.R.,M.M.,S.A.; resources, A.B.,M.D.; data curation, F.M.,A.L.,M.L.; writing—original draft preparation, M.R., A.A., A.C., M.D.; writing—review and editing, M.R, M.M.; visualization, M.R, A.C.; supervision, M.M.; project administration, A.D.; funding acquisition, M.M. All authors have read and agreed to the published version of the manuscript.
Funding
This research was supported by:(i) the Italian Ministry of Research and GPI S.p.A., through the innovative PhD position awarded to M.R.;(ii) the Apulia Region, through the post-doctoral. position funded by the POC PUGLIA FESR ESF 2014/2020 program for the project titled “PaRTiRe Parkinson’s Research Through the Voice” under the “Riparti Project”, granted to M.G.
Institutional Review Board Statement
Not applicable.
Informed Consent Statement
Not applicable.
Data Availability Statement
The data applied to this study to assess systems performance were obtained from the figshare Repository:Parkinsons dataset, which is publicly available at: https://figshare.com/articles/dataset/Voice_Samples_for_Patients_with_Parkinson_s_Disease_and_Healthy_Controls/23849127 (accessed on 04 August 2023).
Acknowledgments
In this section you can acknowledge any support given which is not covered by the author contribution or funding sections. This may include administrative and technical support, or donations in kind (e.g., materials used for experiments).
Conflicts of Interest
The authors declare no conflict of interest.
Abbreviations
The following abbreviations are used in this manuscript:
| PD | Parkinson disease |
| HS | Directory of open access journals |
| CPPS | smoothed cepstral peak prominence |
| PPE | Pitch Period Entropy |
| RPDE | recurrence period density entropy |
| MFCCs | Mel-frequency cepstral coefficients |
| RF | Random Forest |
| KNN | k-nearest neighbors |
| ML | Machine Learning |
| NB | Naïve Bayes |
| SVM | Support vector machines |
| LR | Logistic Regression |
| ANN | Artificial Neural Networks m |
| ROC | Receiver-operating characteristic curve |
| AUC | Area under the curve |
| RBD | REM sleep behavior disorder |
| REM | Rapid Eye Movement |
| Eq | equation |
| TP | True Positive |
| FP | False Positive |
| TN | True Negative |
| FN | False Negative |
| MSE | Mean Squared Error |
| CV | Cross Validation |
| UPDRS | Unified Parkinson’s Disease Rating Scale |
| PIGD | Postural Instability and Gait Disorders |
References
- Yang, K., Wu, Z., Long, J., Li, W., Wang, X., Hu, N., Zhao, X., Sun, T.: White matter changes in Parkinson’s disease. NPJ Parkinsons Dis. 9, 1–10 (2023). [CrossRef]
- Dorsey, E.R., Sherer, T., Okun, M.S., Bloemd, B.R.: The emerging evidence of the Parkinson pandemic. J Parkinsons Dis. 8, S3–S8 (2018). [CrossRef]
- Chaudhuri, K.R., Azulay, J.P., Odin, P., Lindvall, S., Domingos, J., Alobaidi, A., Kandukuri, P.L., Chaudhari, V.S., Parra, J.C., Yamazaki, T., Oddsdottir, J., Wright, J., Martinez-Martin, P.: Economic Burden of Parkinson’s Disease: A Multinational, Real-World, Cost-of-Illness Study. Drugs Real World Outcomes. 11, 1–11 (2024). [CrossRef]
- Mallamaci, R., Musarò, D., Greco, M., Caponio, A., Castellani, S., Munir, A., Guerra, L., Damato, M., Fracchiolla, G., Coppola, C., Cardone, R.A., Rashidi, M., Tardugno, R., Sergio, S., Trapani, A., Maffia, M.: Dopamine- and Grape-Seed-Extract-Loaded Solid Lipid Nanoparticles: Interaction Studies between Particles and Differentiated SH-SY5Y Neuronal Cell Model of Parkinson’s Disease. Molecules. 29, (2024). [CrossRef]
- Poewe, W., Seppi, K., Tanner, C.M., Halliday, G.M., Brundin, P., Volkmann, J., Schrag, A.E., Lang, A.E.: Parkinson disease. Nat Rev Dis Primers. 3, 1–21 (2017). [CrossRef]
- Magrinelli, F., Picelli, A., Tocco, P., Federico, A., Roncari, L., Smania, N., Zanette, G., Tamburin, S.: Pathophysiology of Motor Dysfunction in Parkinson’s Disease as the Rationale for Drug Treatment and Rehabilitation. Parkinsons Dis. 2016, (2016). [CrossRef]
- Mantri, S., Morley, J.F.: Prodromal and early Parkinson’s disease diagnosis. Pract Neurol. 35, 28–31 (2018).
- Brabenec, L., Mekyska, J., Galaz, Z., Rektorova, I.: Speech disorders in Parkinson’s disease: early diagnostics and effects of medication and brain stimulation. J Neural Transm. 124, 303–334 (2017). [CrossRef]
- Ansari, K.A., Johnson, A.: OLFACTORY FUNCTION IN PATIENTS WITH PARKINSON’S DISEASE. Pergamon Press (1975).
- Ramig, L.O., Fox, C., Sapir, S.: Speech treatment for Parkinson’s disease, (2008).
- Goetz, C.G., Poewe, W., Rascol, O., Sampaio, C., Stebbins, G.T., Counsell, C., Giladi, N., Holloway, R.G., Moore, C.G., Wenning, G.K., Yahr, M.D., Seidl, L.: Movement Disorder Society Task Force report on the Hoehn and Yahr staging scale: Status and recommendations. Movement Disorders. 19, 1020–1028 (2004). [CrossRef]
- Weil, R.S., Morris, H.R.: REM sleep behaviour disorder: An early window for prevention in neurodegeneration?, (2019).
- Doty, R.L.: Olfactory dysfunction in neurodegenerative diseases: is there a common pathological substrate?, (2017).
- AnnalesD997Jokinen.
- O’Sullivan, S.B., Schmitz, T.J.: Physical FIFTH EDITION.
- Ahn, S., Springer, K., Gibson, J.S.: Social withdrawal in Parkinson’s disease: A scoping review. Geriatr Nurs (Minneap). 48, 251–261 (2022). [CrossRef]
- Ma, A., Lau, K.K., Thyagarajan, D.: Voice changes in Parkinson’s disease: What are they telling us? Journal of Clinical Neuroscience. 72, 1–7 (2020). [CrossRef]
- Harel, B., Cannizzaro, M., Snyder, P.J.: Variability in fundamental frequency during speech in prodromal and incipient Parkinson’s disease: A longitudinal case study. Brain Cogn. 56, 24–29 (2004). [CrossRef]
- Rusz, J., Krupička, R., Vítečková, S., Tykalová, T., Novotný, M., Novák, J., Dušek, P., Růžička, E.: Speech and gait abnormalities in motor subtypes of de-novo Parkinson’s disease. CNS Neurosci Ther. 29, 2101–2110 (2023). [CrossRef]
- Skorvanek, M., Martinez-Martin, P., Kovacs, N., Rodriguez-Violante, M., Corvol, J.C., Taba, P., Seppi, K., Levin, O., Schrag, A., Foltynie, T., Alvarez-Sanchez, M., Arakaki, T., Aschermann, Z., Aviles-Olmos, I., Benchetrit, E., Benoit, C., Bergareche-Yarza, A., Cervantes-Arriaga, A., Chade, A., Cormier, F., Datieva, V., Gallagher, D.A., Garretto, N., Gdovinova, Z., Gershanik, O., Grofik, M., Han, V., Huang, J., Kadastik-Eerme, L., Kurtis, M.M., Mangone, G., Martinez-Castrillo, J.C., Mendoza-Rodriguez, A., Minar, M., Moore, H.P., Muldmaa, M., Mueller, C., Pinter, B., Poewe, W., Rallmann, K., Reiter, E., Rodriguez-Blazquez, C., Singer, C., Tilley, B.C., Valkovic, P., Goetz, C.G., Stebbins, G.T.: Differences in MDS-UPDRS Scores Based on Hoehn and Yahr Stage and Disease Duration. Mov Disord Clin Pract. 4, 536–544 (2017). [CrossRef]
- Naranjo, L., Pérez, C.J., Martín, J., Campos-Roca, Y.: A two-stage variable selection and classification approach for Parkinson’s disease detection by using voice recording replications. Comput Methods Programs Biomed. 142, 147–156 (2017). [CrossRef]
- Di Cesare, M.G., Perpetuini, D., Cardone, D., Merla, A.: Assessment of Voice Disorders Using Machine Learning and Vocal Analysis of Voice Samples Recorded through Smartphones. BioMedInformatics. 4, 549–565 (2024). [CrossRef]
- Géron, A.: Hands-On Machine Learning with. O’Reilly Media.
- Zewoudie, A.W., Luque, J., Hernando, J.: The use of long-term features for GMM- and i-vector-based speaker diarization systems. EURASIP J Audio Speech Music Process. 2018, (2018). [CrossRef]
- Little, M., McSharry, P., Hunter, E., Spielman, J., Ramig, L.: Suitability of dysphonia measurements for telemonitoring of Parkinson’s disease. Nature Precedings. 1 (2008).
- Jeancolas, L., Benali, H., Benkelfat, B.-E., Mangone, G., Corvol, J.-C., Vidailhet, M., Lehericy, S., Petrovska-Delacrétaz, D.: Automatic detection of early stages of Parkinson’s disease through acoustic voice analysis with mel-frequency cepstral coefficients. In: 2017 International Conference on Advanced Technologies for Signal and Image Processing (ATSIP). pp. 1–6 (2017).
- Convey, R.B., Laukkanen, A.M., Ylinen, S., Penttilä, N.: Analysis of Voice in Parkinson’s Disease Utilizing the Acoustic Voice Quality Index. Journal of Voice. 1–10 (2024). [CrossRef]
- Hawi, S., Alhozami, J., AlQahtani, R., AlSafran, D., Alqarni, M., Sahmarany, L. El: Automatic Parkinson’s disease detection based on the combination of long-term acoustic features and Mel frequency cepstral coefficients (MFCC). Biomed Signal Process Control. 78, 104013 (2022). [CrossRef]
- Tracey, B., Volfson, D., Glass, J., Haulcy, R., Kostrzebski, M., Adams, J., Kangarloo, T., Brodtmann, A., Dorsey, E.R., Vogel, A.: Towards interpretable speech biomarkers: exploring MFCCs. Sci Rep. 13, (2023). [CrossRef]
- Kotsiantis, S.B., Zaharakis, I.D., Pintelas, P.E.: Machine learning: A review of classification and combining techniques. Artif Intell Rev. 26, 159–190 (2006). [CrossRef]
- Berrar, D.: Cross-validation. Encyclopedia of Bioinformatics and Computational Biology: ABC of Bioinformatics. 1–3, 542–545 (2018). [CrossRef]
- Dao, S.V.T., Yu, Z., Tran, L. V., Phan, P.N.K., Huynh, T.T.M., Le, T.M.: An Analysis of Vocal Features for Parkinson’s Disease Classification Using Evolutionary Algorithms. Diagnostics. 12, (2022). [CrossRef]
- Powers, D.M.W.: Evaluation: from precision, recall and F-measure to ROC, informedness, markedness and correlation. (2020). [CrossRef]
- Fawcett, T.: An introduction to ROC analysis. Pattern Recognit Lett. 27, 861–874 (2006). [CrossRef]
- Christen, P., Hand, D.J., Kirielle, N.: A review of the F-measure: its history, properties, criticism, and alternatives. ACM Comput Surv. 56, 1–24 (2023).
- James, M., Hastie, P., Taylor, B.: First Printing : July 5 , 2023. (2023).
- Prior, F., Virmani, T., Iyer, A., Larson-Prior, L., Kemp, A., Rahmatallah, Y., Pillai, L., Glover, A.: Voice Samples for Patients with Parkinson’s Disease and Healthy Controls. https://figshare.com/articles/dataset/Voice_Samples_for_Patients_with_Parkinson_s_Disease_and_Healthy_Controls/23849127, (2023).
- Iyer, A., Kemp, A., Rahmatallah, Y., Pillai, L., Glover, A., Prior, F., Larson-Prior, L., Virmani, T.: A machine learning method to process voice samples for identification of Parkinson’s disease. Sci Rep. 13, (2023). [CrossRef]
- Dejonckere, P.H., Bradley, P., Clemente, P., Cornut, G., Friedrich, G., Heyning, P. Van De: A basic protocol for functional assessment of voice pathology , especially for investigating the efficacy of ( phonosurgical ) treatments and evaluating new assessment techniques Guideline elaborated by the Committee on Phoniatrics. (2001). [CrossRef]
- Boersma, P., van Heuven, V.: Speak and unSpeak with Praat. Glot International. 5, 341–347 (2001).
- Gorriz, J.M., Segovia, F., Ramirez, J., Ortiz, A., Suckling, J.: Is K-fold cross validation the best model selection method for Machine Learning? (2024).
- Oganian, Y., Bhaya-Grossman, I., Johnson, K., Chang, E.F.: Vowel and formant representation in the human auditory speech cortex. Neuron. 111, 2105—-2118.e4 (2023). [CrossRef]
- Little, M.A., McSharry, P.E., Roberts, S.J., Costello, D.A.E., Moroz, I.M.: Exploiting nonlinear recurrence and fractal scaling properties for voice disorder detection. Biomed Eng Online. 6, (2007). [CrossRef]
- Davis, S., Mermelstein, P.: Comparison of parametric representations for monosyllabic word recognition in continuously spoken sentences. IEEE Trans Acoust. 28, 357–366 (1980).
- Tsanas, A., Little, M.A., McSharry, P.E., Spielman, J., Ramig, L.O.: Novel speech signal processing algorithms for high-accuracy classification of Parkinson’s disease. IEEE Trans Biomed Eng. 59, 1264–1271 (2012).
- Jin, Z., Shang, J., Zhu, Q., Ling, C., Xie, W., Qiang, B.: RFRSF: Employee Turnover Prediction Based on Random Forests and Survival Analysis. Lecture Notes in Computer Science (including subseries Lecture Notes in Artificial Intelligence and Lecture Notes in Bioinformatics). 12343 LNCS, 503–515 (2020). [CrossRef]
- Peretz, O., Koren, M., Koren, O.: Naive Bayes classifier – An ensemble procedure for recall and precision enrichment. Eng Appl Artif Intell. 136, (2024). [CrossRef]
- Alalayah, K.M., Senan, E.M., Atlam, H.F., Ahmed, I.A., Shatnawi, H.S.A.: Automatic and Early Detection of Parkinson’s Disease by Analyzing Acoustic Signals Using Classification Algorithms Based on Recursive Feature Elimination Method. Diagnostics. 13, (2023). [CrossRef]
- Evgeniou, T., Pontil, M.: Support vector machines: Theory and applications. In: Advanced course on artificial intelligence. pp. 249–257. Springer (1999).
- Grossi, E., Buscema, M.: Introduction to artificial neural networks. Eur J Gastroenterol Hepatol. 19, 1046–1054 (2007). [CrossRef]
- Vakili, M., Ghamsari, M., Rezaei, M.: Performance Analysis and Comparison of Machine and Deep Learning Algorithms for IoT Data Classification. (2020).
- Breiman, L.: Random Forests. (2001).
- Das, R.: A comparison of multiple classification methods for diagnosis of Parkinson disease. Expert Syst Appl. 37, 1568–1572 (2010). [CrossRef]
- Wroge, T.J., Yasin¨ Yasin¨ozkanca, Y., Demiroglu, C., Si, D., Atkins, D.C., Ghomi, R.H.: Parkinson’s Disease Diagnosis Using Machine Learning and Voice; Parkinson’s Disease Diagnosis Using Machine Learning and Voice. (2018).
- Suppa, A., Costantini, G., Asci, F., Di Leo, P., Al-Wardat, M.S., Di Lazzaro, G., Scalise, S., Pisani, A., Saggio, G.: Voice in Parkinson’s Disease: A Machine Learning Study. Front Neurol. 13, (2022). [CrossRef]
- Wright, H., Postema, M., Aharonson, V.: Towards a voice-based severity scale for Parkinson’s disease monitoring. 10, (2024).
- Hossain, M.A., Amenta, F.: Machine Learning-Based Classification of Parkinson’s Disease Patients Using Speech Biomarkers. J Parkinsons Dis. 14, 95–109 (2024). [CrossRef]
Figure 1.
Typical Pipeline for Voice-Based Analysis.
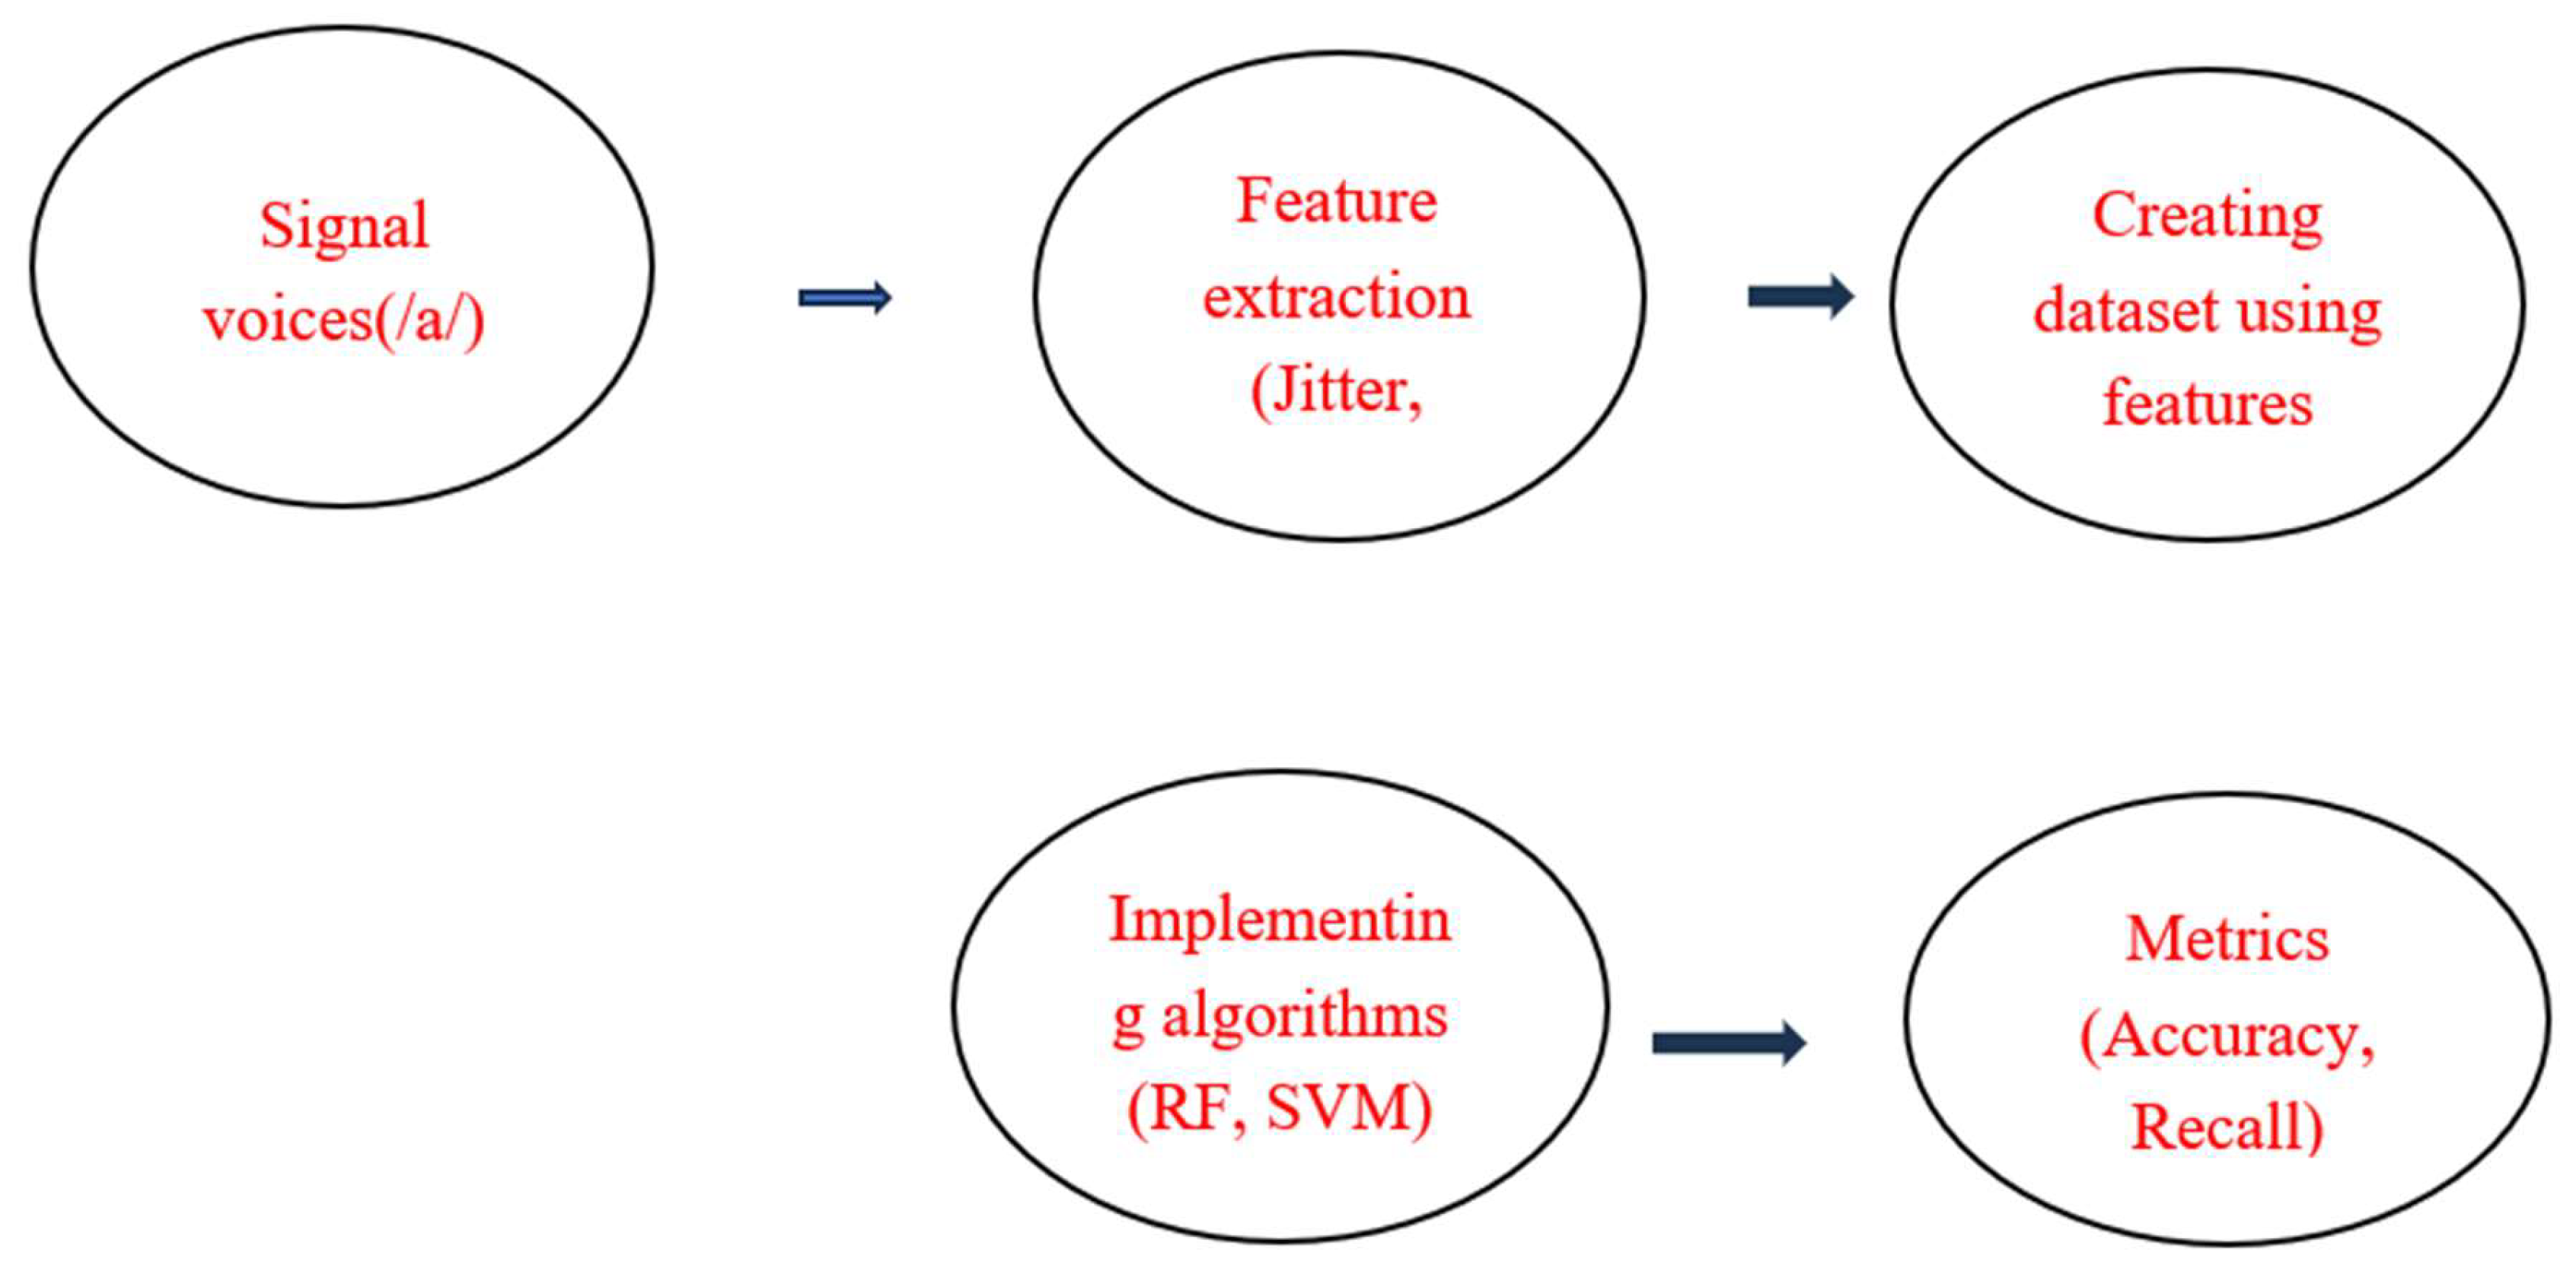
Figure 2.
Performance of Different Algorithms Based on Metrics.
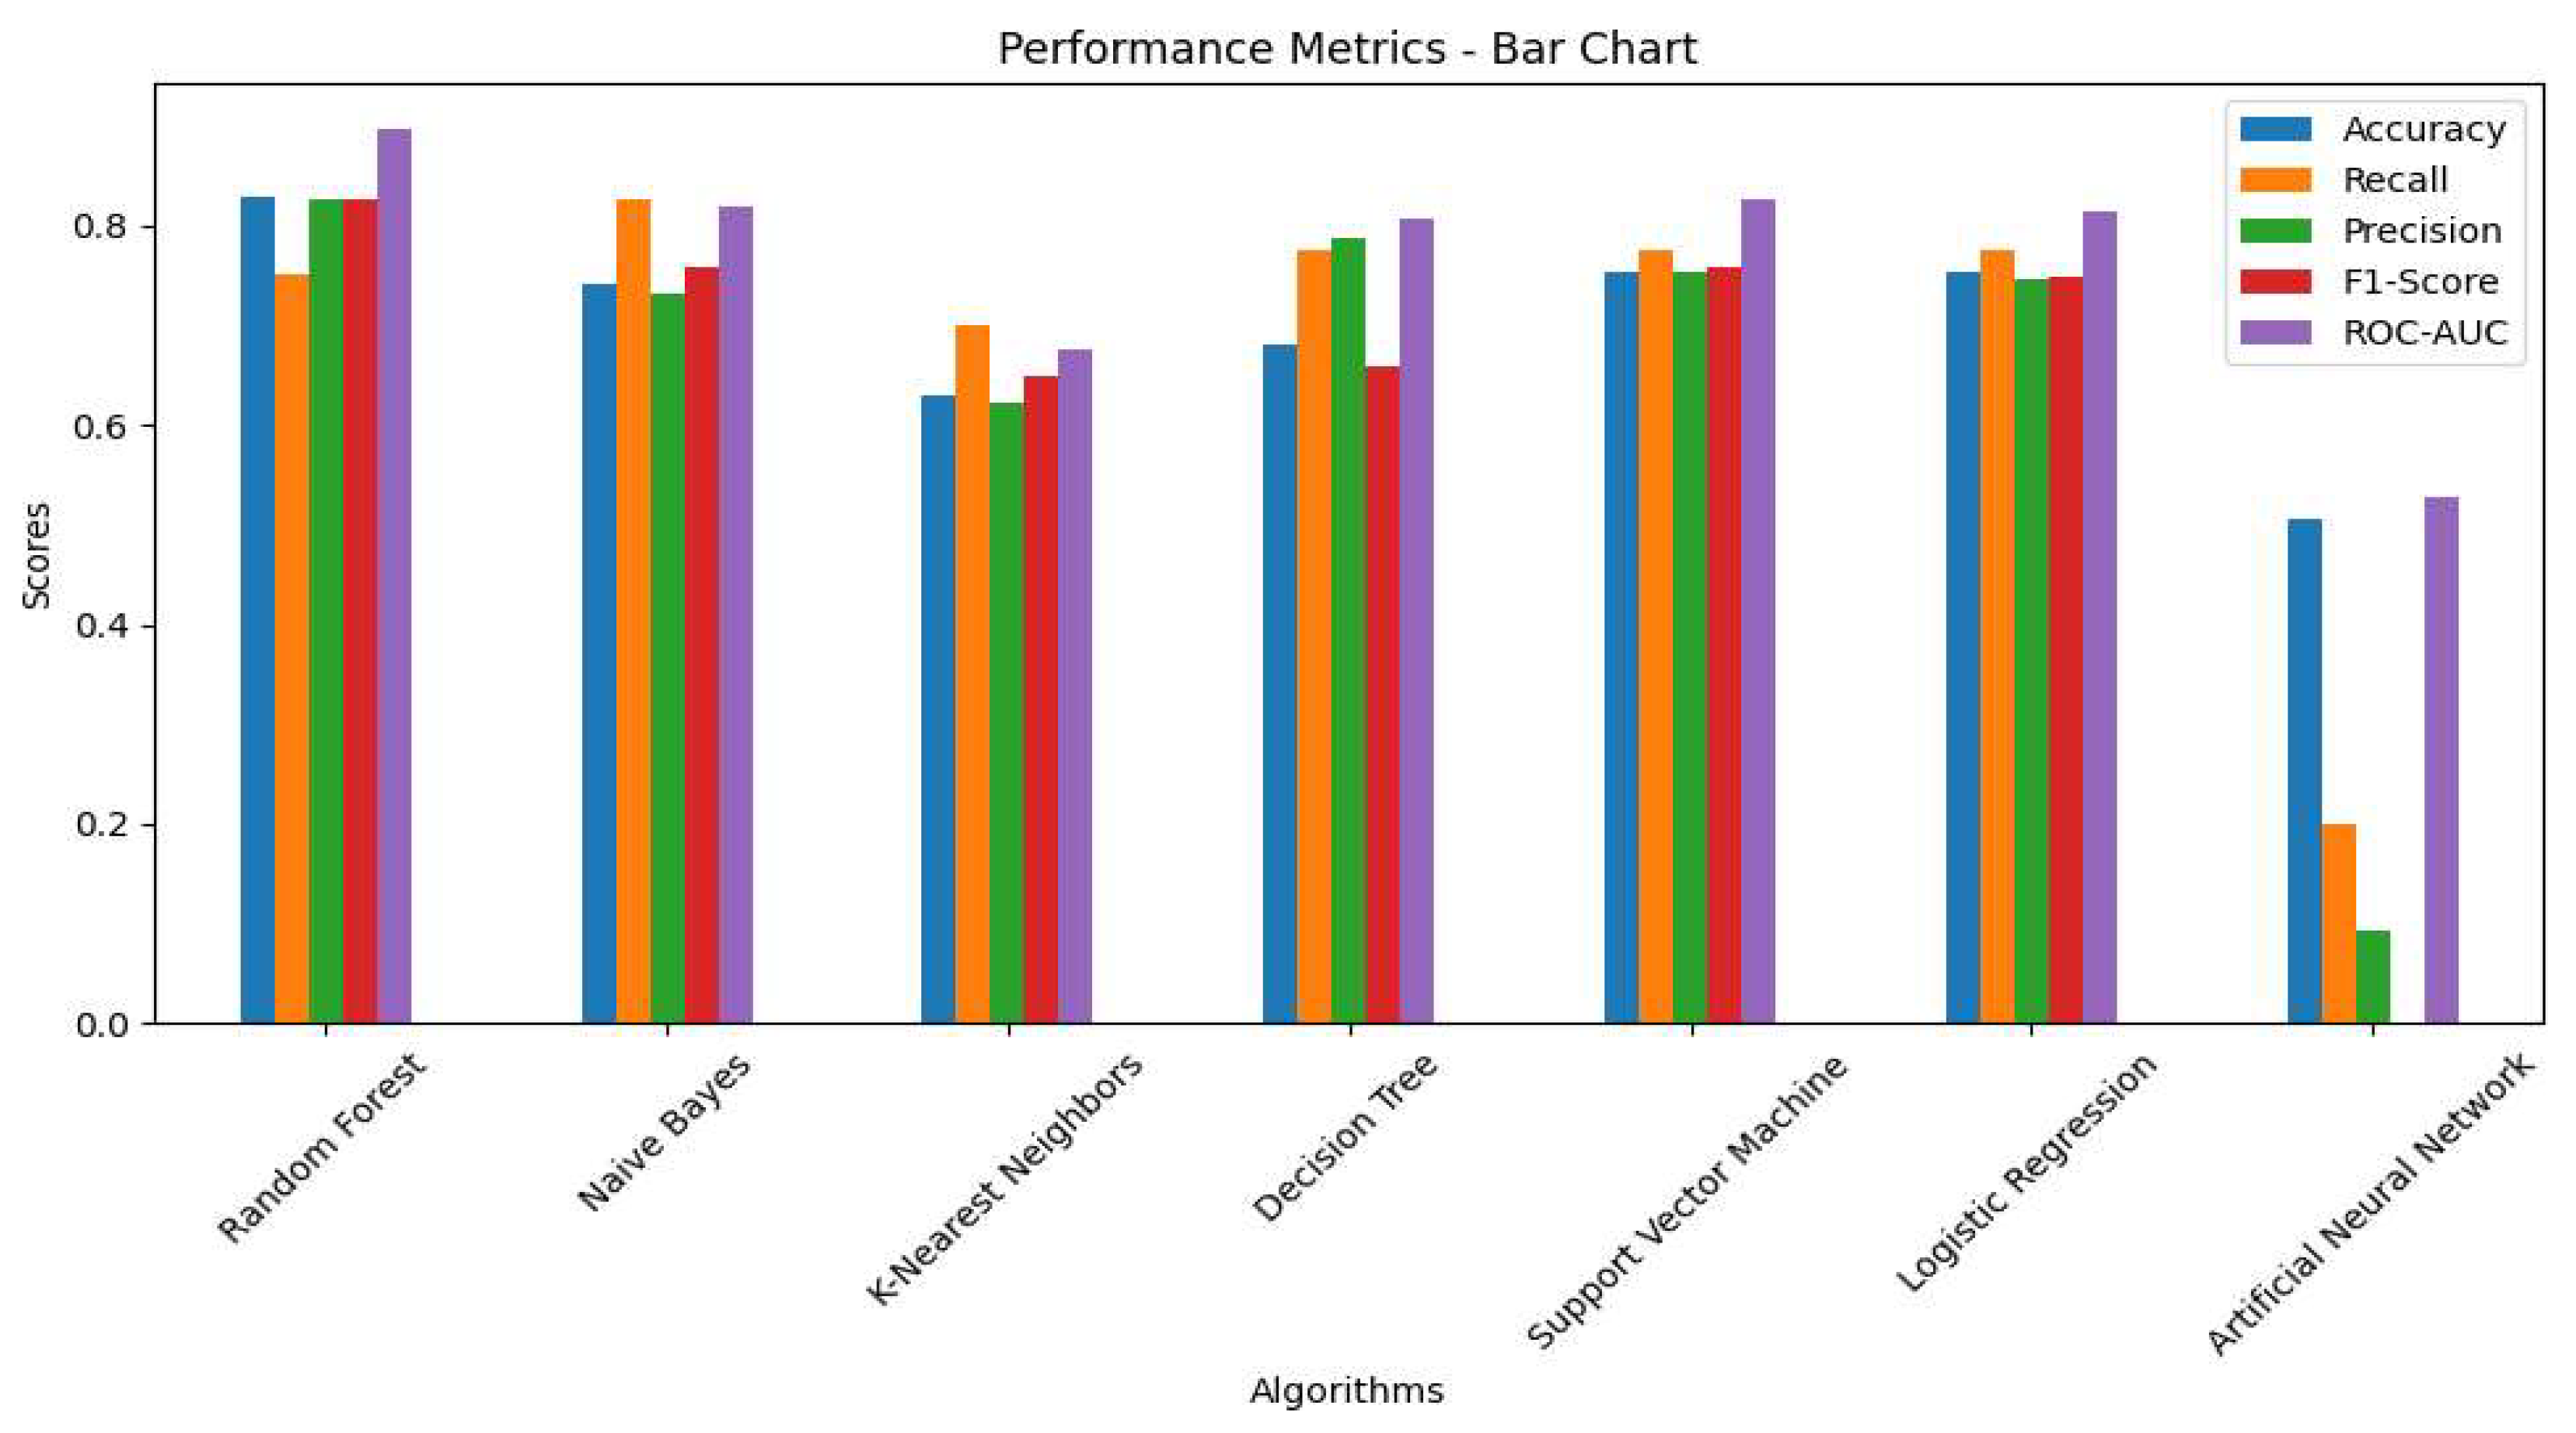
Figure 4.
Receiver Operating Characteristic (ROC) Curves for Machine Learning Algorithms.
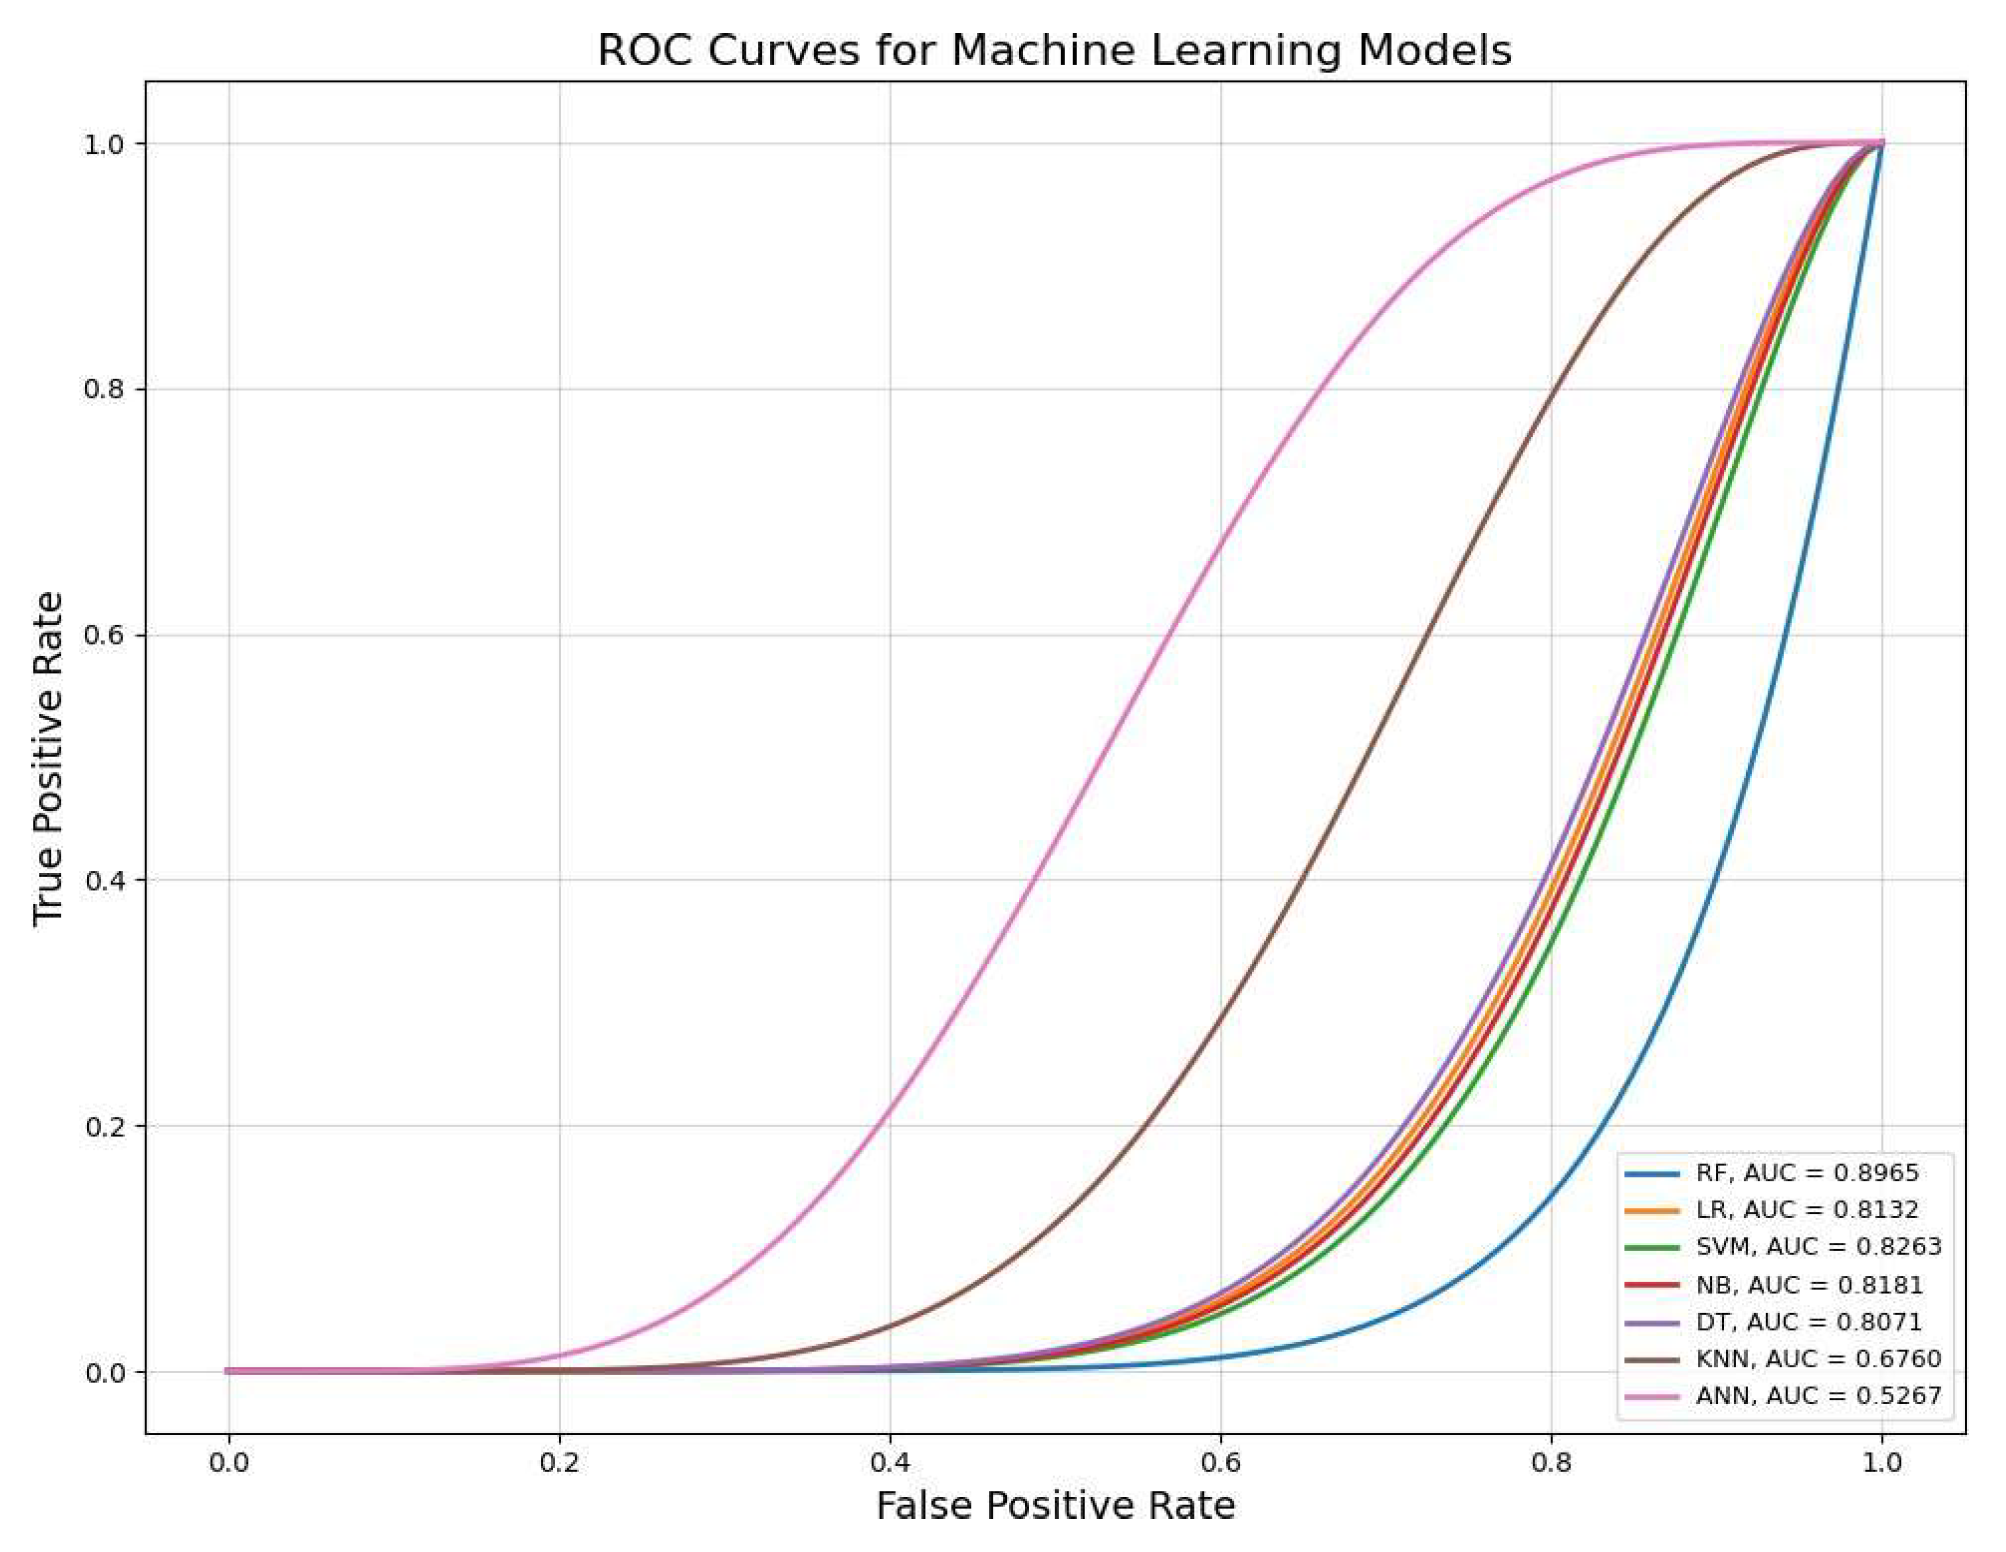

Table 1.
List of Features.
| Features |
Number of Features | Description |
| Jitter | 2 | Measures variability in vocal fold vibration frequency |
| Shimmer | 5 | Measures amplitude fluctuations in vocal cycles |
| NHR | 1 | Noise-to-harmonics ratio |
| HNR | 1 | Harmonics-to-noise ratio |
| Pitch | 1 | Fundamental frequency of vocal fold vibration |
| Intensity | 1 | Overall loudness of the voice |
| Formant | 4 | Resonant frequencies of the vocal tract |
| CPPS | 1 | Measures prominence of spectral peaks |
| PPE | 1 | Measures irregularity in speech pitch to distinguish between natural variations and pathological speech |
| RPDE | 1 | Measures regularity of voice signal |
| MFCC | 12 | Represents spectral envelope of the signal, useful for voice quality analysis |
Table 2.
Metrics, Formulas, and Descriptions.
| Metrics |
Formula |
Description |
|---|---|---|
| Accuracy |
|
Proportion of correctly classified instances |
| Recall |
Proportion of actual positives correctly identified | |
| Precision |
Proportion of predicted positives that are actually positive | |
| F1-Score |
Harmonic means precision and recall | |
| ROC-AUC |
- | Area under the receiver operating characteristic curve. |
| MSE |
Mean squared error between predicted and actual values |
Table 3.
System Implementation Environment.
| Resource | Details |
|---|---|
| CPU | i5 Gen6 |
| RAM | 12.67 GB |
| GPU | 4 GB Tesla T4, 15360 MiB |
| Software | Python3. 10.12 and 3.12.8 |
Table 4.
Effect of (5-fold) Cross Validation (CV) on MSE.
| Models | MSE-Average (5-fold CV) ± SD |
| Random Forest (RF) | 0.17 ± 0.07 |
| Logistic Regression (LR) | 0.27 ± 0.09 |
| Naive Bayes (NB) | 0.26 ± 0.15 |
| Decision Tree (DT) | 0.24 ± 0.11 |
| K-Nearest Neighbors (KNN) | 0.36 ± 0.10 |
| Support Vector Machine (SVM) | 0.24 ± 0.06 |
| Artificial Neural Network (ANN) | 0.50 ± 0.01 |
Table 5.
Cross Validation Results.
| Algorithm | Accuracy | Recall | Precision | F1-Score | ROC-AUC |
|---|---|---|---|---|---|
| Random Forest (RF) | 0.8272 ±0.10 | 0.7500±0.15 | 0.8257±0.14 | 0.8251±0.1 | 0.8965±0.07 |
| Logistic Regression (LR) | 0.7529±0.06 | 0.7750±0.09 | 0.7467±0.12 | 0.7487±0.07 | 0.8132±0.09 |
| Support Vector Machine (SVM) | 0.7529±0.06 | 0.7750±0.04 | 0.7529±0.09 | 0.7487±0.04 | 0.8263±0.09 |
| Naive Bayes (NB) | 0.7397±0.15 | 0.8250±0.18 | 0.7312 ±0.16 | 0.7578±0.14 | 0.8181±0.13 |
| Decision Tree (DT) | 0.6801±0.16 | 0.7750±0.09 | 0.7871±0.16 | 0.6589±0.09 | 0.8071±0.11 |
| K-Nearest Neighbors (KNN) | 0.6301±0.1 | 0.7000±0.15 | 0.6222±0.11 | 0.6493±0.09 | 0.6760±0.06 |
| Artificial Neural Network (ANN) | 0.5058±0.01 | 0.2000±0.40 | 0.0941±0.18 | 0.0000±0 | 0.5267±0.08 |
Table 6.
Comparison of previous ML-based voice analysis studies for Parkinson’s disease and our study.
Table 6.
Comparison of previous ML-based voice analysis studies for Parkinson’s disease and our study.
| Study | Featured used | Machine Learning Models | Best performance |
|---|---|---|---|
| Our research |
Long-term features, short-term features, PPE, RPDE | RF, SVM, NB |
89.65%(ROC-AUC), 82.63%(ROC-AUC) 82.50%(Recall) |
| Fred Prior (30) |
long term and short-term features | RF, LR, CNN |
78%(AUC), 78%(AUC), 97%(AUC) |
| Max little (17) |
Long-term features, non-standard measurement | SVM |
90.4%(accuracy) |
| Wroge (44) |
GeMaps features, AVEC features |
Gradient Boosted Decision Tree ANN |
82% (accuracy),65%(recall) 86%(accuracy),82%(recall) |
Disclaimer/Publisher’s Note: The statements, opinions and data contained in all publications are solely those of the individual author(s) and contributor(s) and not of MDPI and/or the editor(s). MDPI and/or the editor(s) disclaim responsibility for any injury to people or property resulting from any ideas, methods, instructions or products referred to in the content. |
© 2025 by the authors. Licensee MDPI, Basel, Switzerland. This article is an open access article distributed under the terms and conditions of the Creative Commons Attribution (CC BY) license (http://creativecommons.org/licenses/by/4.0/).
Copyright: This open access article is published under a Creative Commons CC BY 4.0 license, which permit the free download, distribution, and reuse, provided that the author and preprint are cited in any reuse.


