
Submitted:
04 October 2025
Posted:
06 October 2025
You are already at the latest version
Abstract
Alzheimer's disease (AD) is characterized by the accumulation and aggregation of tau and amyloid-β (Aβ). The pathophysiology and progression of AD are facilitated by the neurotoxic effects of these aggregated proteins resulting in neurodegeneration and memory loss. In this context, the interaction between tau and Aβ42 is considered but the mechanism behind their pathology associated interplay is not clear. Here, we addressed this question by studies of aggregation of full-length, unmodified tau and Aβ42 at physiologically low concentrations using atomic force microscopy (AFM). AFM imaging and data analyses demonstrate an increase in tau aggregation in the presence of Aβ42, characterized by increased sizes and number of aggregates. Importantly, tau aggregation occurs without the need for phosphorylation or any other post-translational changes. The analysis of the data demonstrates that tau and Aβ42 form co-aggregates, with no visible accumulation of Aβ42 aggregates alone. Given that the catalysis of tau aggregation by Aβ42 is observed at physiological low nanomolar concentrations of Aβ42, the finding suggests that such aggregation catalysis of tau by Aβ42 can be a molecular mechanism underlying pathological tau aggregation process associated with onset and development of Alzheimer’s disease.
Keywords:
tau
; amyloid beta
; Alzheimer’s disease
; aggregation
; AFM imaging
1. Introduction
Alzheimer’s disease (AD) is the most common form of dementia, affecting nearly two-thirds of individuals over 65 years of age[1]. Its two major pathological hallmarks are the accumulation of amyloid-beta (Aβ) aggregates and the formation of tau-containing neurofibrillary tangles, particularly in the entorhinal cortex, limbic regions, and associated cortices[2,3,4]. Notably, these changes begin up to two decades before clinical onset of AD [5], underscoring the importance of understanding the molecular mechanisms that drive tau &Aβ pathology. In their monomeric forms, both tau & Aβ serve essential neuronal functions: Aβ contributes to synaptic activity and plasticity, while tau stabilizes microtubules and maintains cytoskeletal integrity[2,3,4,5]. However, conformational transitions trigger the misfolding of Aβ and tau, which lead to toxic aggregation [4,6]. While tau-containing neurofibrillary tangles have historically defined AD pathology, tau oligomers are increasingly recognized as critical drivers for tau propagation and synaptic disruption. Similarly, oligomeric Aβ species are increasingly linked to neuronal toxicity, suggesting that toxic oligomers for both proteins, rather than their mature aggregates, are central to disease progression [7,8,9,10]. Increasing evidence points to a synergistic relationship between Aβ and tau in AD [11,12]. For instance, Aβ deposition correlates with the spread of tau aggregates [13,14,15], possibly by promoting tau oligomerization, a process linked to synaptic dysfunction, calcium dyshomeostasis, and microtubule destabilization, although the causal mechanisms remain uncertain [16,17,18]. In addition, Aβ activates kinases such as CDK-5 and GSK-3β, which are associated with tau hyperphosphorylation and may thereby contribute to tau-mediated neurotoxicity [8]. Collectively, these findings suggest that Aβ and tau aggregation may be mechanistically linked in AD development [16,19,20], however, the precise molecular basis of their interaction remains unclear.
In this work, we examined the interplay between native full-length tau and Aβ42 at physiologically relevant nanomolar concentrations. Using atomic force microscopy (AFM), we directly visualized the aggregation of Aβ42 and tau, enabling the characterization of the aggregation process. Our findings indicate that Aβ42 at nanomolar levels can accelerate the aggregation of unmodified tau, and that the two proteins are capable of coaggregation.
2. Results
2.1. Experimental Setup
To mimic the aggregation process of Aβ42 at physiologically relevant environment concentrations, specifically in the low nanomolar range [21], we employed the on-surface aggregation approach[22,23], in which AFM is used to directly visualize aggregates assembled as a function of time on a mica substrate. We placed pieces of cleaved mica in protein solutions and incubated the mica for 2 minutes, 3 hours, and 5 hours. After which the mica was rinsed, dried, and imaged with AFM to visualize aggregate formation. Figure S1 provides a schematic of this approach.
2.2. AFM imaging of Tau Aggregation
AFM images of mica specimens incubated in a solution of tau protein at 10 nM are shown in Figure 1. Initially (2 min, Figure 1a), only a few particles of round shape were seen. A few zoomed-in images, indicated with arrows labelled i, ii, and iii, are shown below in Figure 1a. As incubation time increased to 3 hours (Figure 1b), the number of tau aggregates on the surface increased. Similarly, zoomed images of a few particles (i, ii, and iii) are shown below Figure 1b. These are visually larger particles compared with those in Figure 1a.
The aggregation is more pronounced after 5 hours of incubation (Figure 1c), as illustrated by a few zoomed-in images in Figure 1c (i, ii, and iii). Together, these data indicate that over the 5-hour incubation period, tau progressively self-assembles into larger aggregates, demonstrating that even unmodified tau can undergo aggregation at low nanomolar concentrations.
The direct quantification of particle size distribution was achieved by measuring the heights of particles appearing on the mica substrates over time. Ten line traces were drawn across the images (Figure S2a), and the variability in particle heights along each line is shown in Figure S2b, with each line represented by a different color. These measurements from different images were used to generate the histograms in Figure 1d, where the light blue and dark blue bars correspond to the 2-minute and 5-hour incubation times, respectively. The shift toward larger particle heights at 5 hours reflects the progressive aggregation of tau over time. Three independent experiments were conducted, Figure S3 demonstrates the overlap plot of the height traces for 2 minutes and 5 hours, providing a clearer visual representation of data reproducibility. Table 1 shows the median height measurements for each replicate (median ± MAD), where MAD is the median absolute difference, as well as the mean and mean absolute difference (MAD) of the three experiments for 2 minutes and 5 hours. The change from 2 minutes to 5 hours is statistically significant (p < 0.01).
A control experiments using tau proteins (10 nM) in the bulk were conducted to evaluate the impact of the surface on aggregation kinetics (Figure S4). The number of aggregates in the bulk solution (Figure S4a) was less compared to the images corresponding to the aggregation on mica (Figure S4b), and this difference is illustrated by the data in Table S1, in which the number of aggregates depending on time is counted.
2.3. AFM Imaging of Aβ42 Aggregation
Similar experiments were done for 10 nM Aβ42 aggregation, and the results are presented in Figure 2.
A few bright particles (indicated by arrows) corresponding to Aß42 aggregates, and this number grows over time (Figure 2b, c). Note, Aβ42 is 10 times smaller than the tau protein. The histograms corresponding to the particle size distribution for AFM images taken at 2 minutes and 5 hours are shown in Figure 2d to illustrate the growth of particle sizes over time. Three independent experiments were performed, and Figure S5 demonstrates the overlap plot of the height traces for 2 minutes and 5 hours, providing a clearer visual representation of data reproducibility. Table 2 shows the median height measurements for each replicate (median ± MAD) of the three experiments for 2 minutes and 5 hours. The change from 2 minutes to 5 hours is statistically significant (p < 0.01).
2.4. AFM Imaging of Tau-Aβ42 Coaggregation
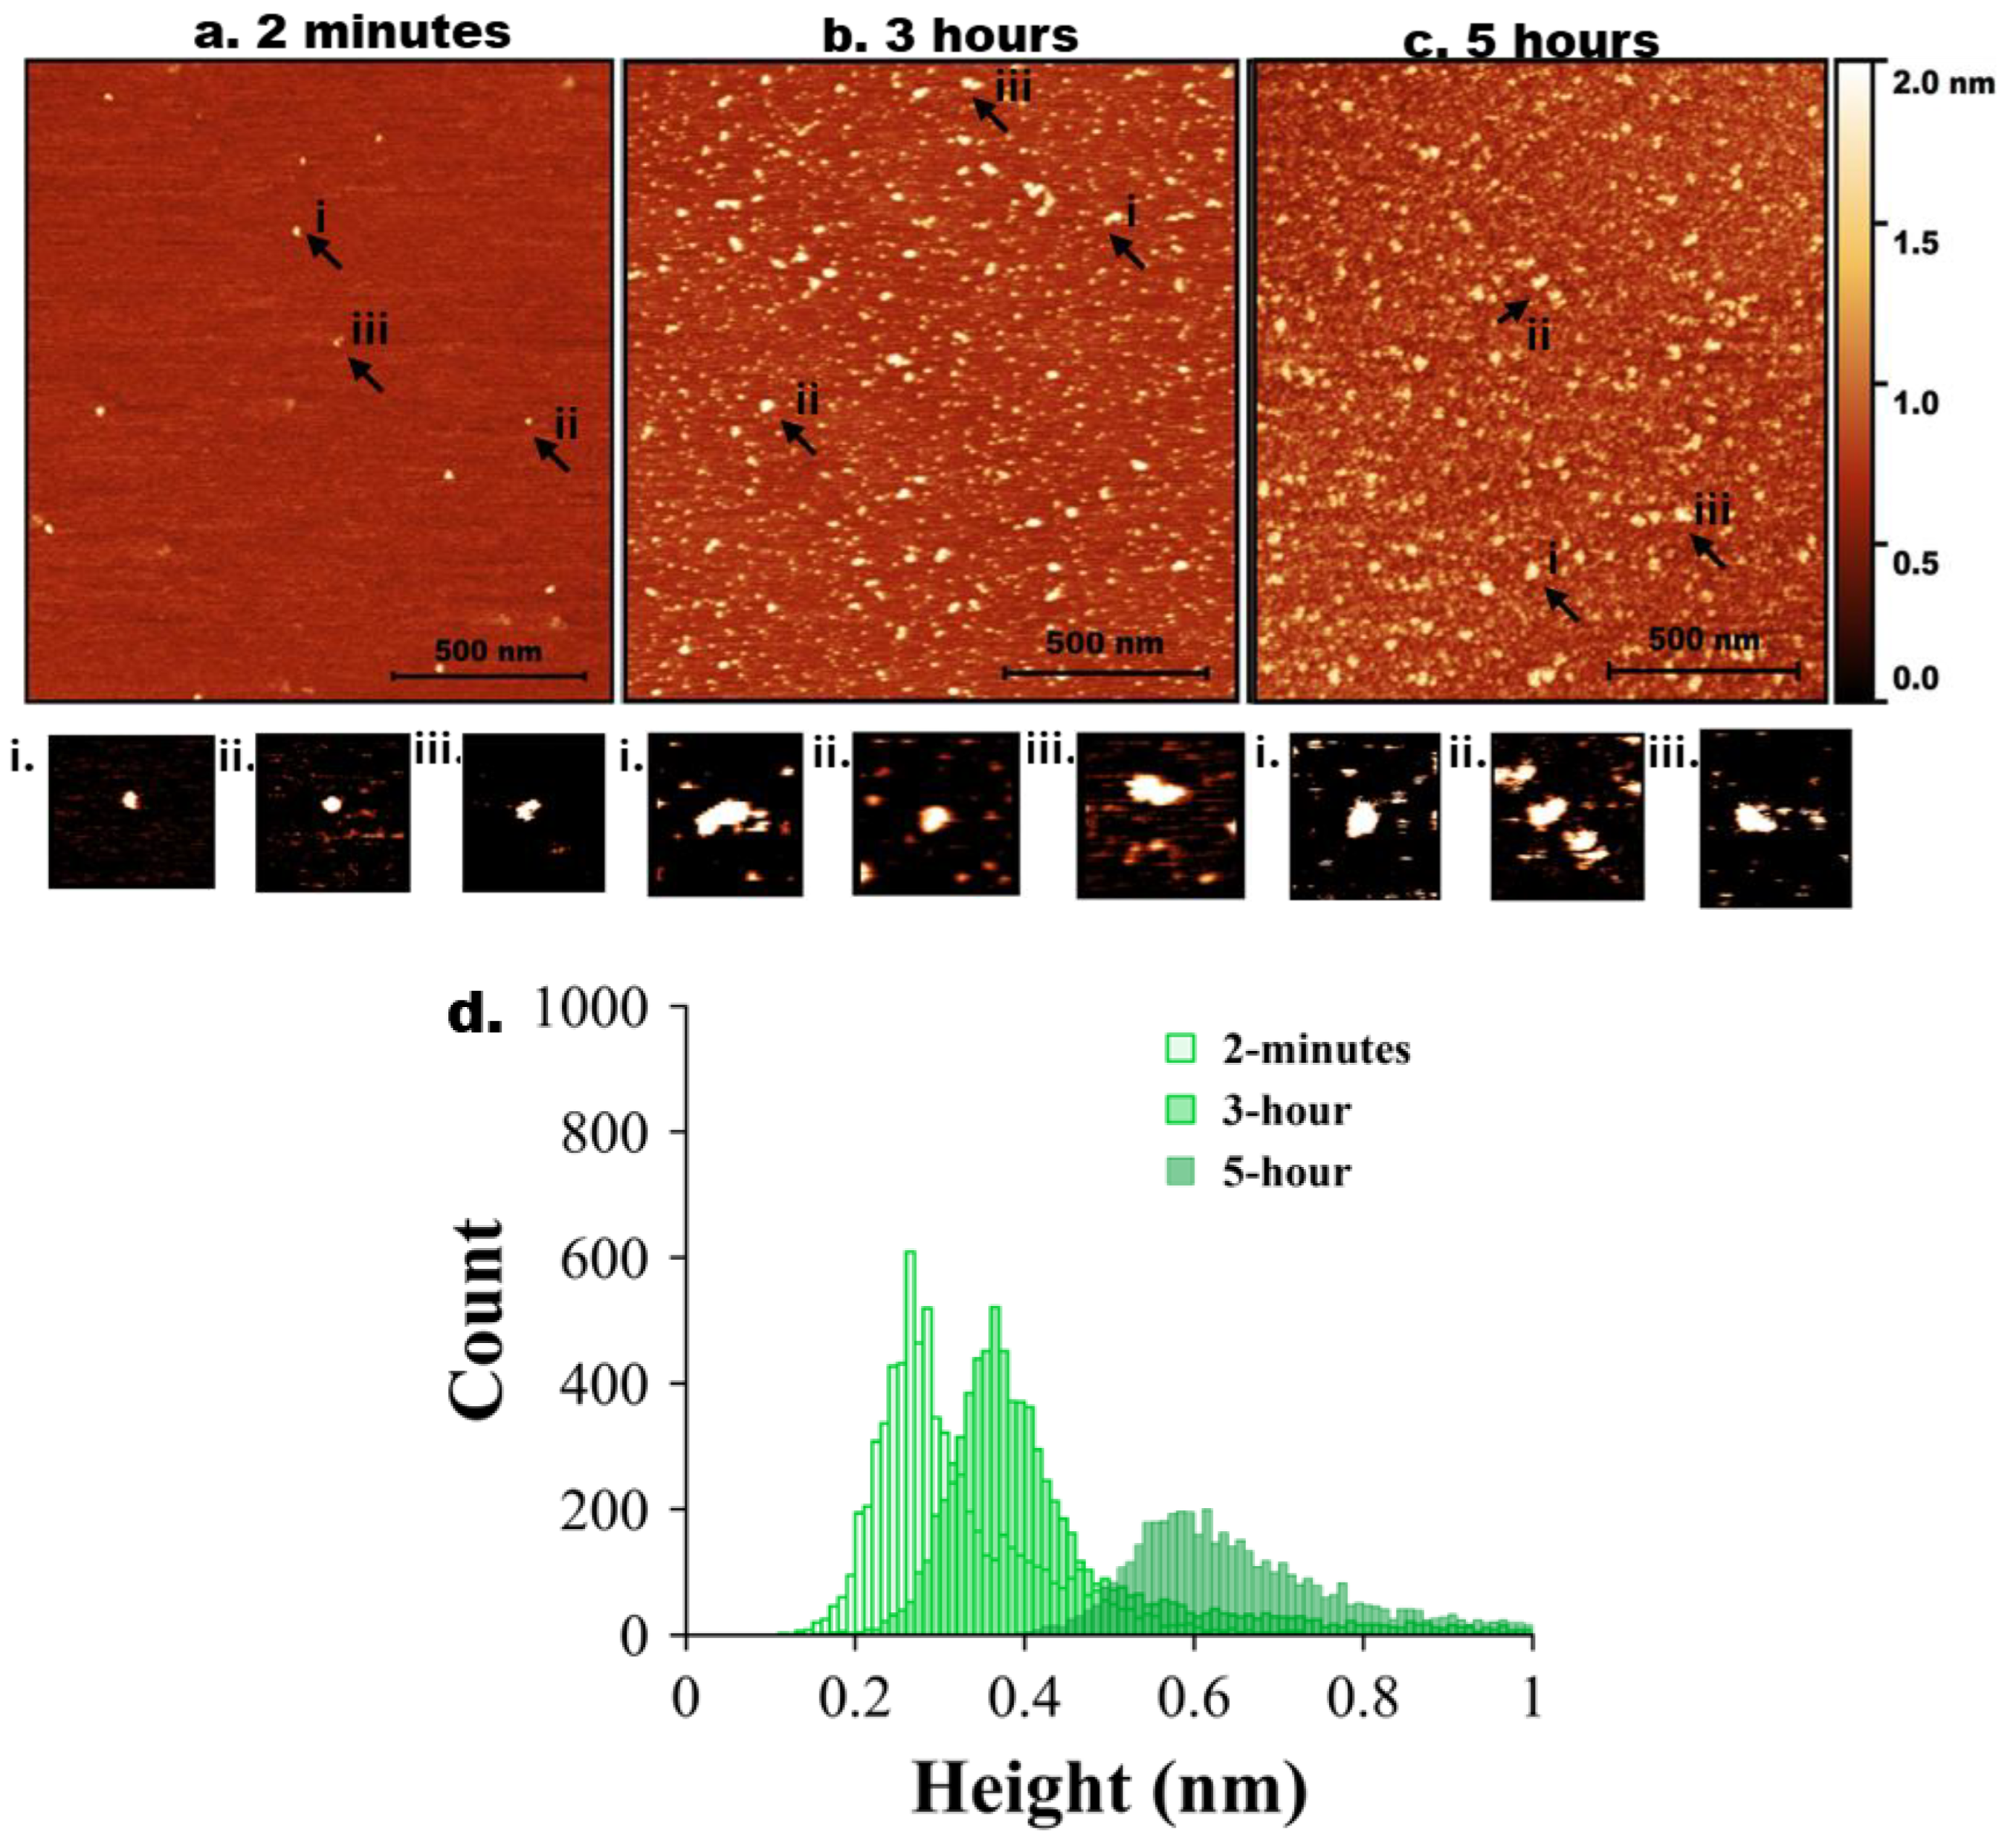
Next, tau and Aβ42 proteins at 10 nM were mixed, and the experiment was repeated as described above for the individual proteins. AFM images are shown in Figure 3. Initially (2 min, Figure 2a), only a few particles of round shape were seen. A few zoomed-in images, indicated with arrows labelled i, ii, and iii, are shown below in Figure 3a. As incubation time increased to 3 hours (Figure 3b), the number of tau-Aβ42 aggregates on the surface increased. Similarly, zoomed images of a few particles (i, ii, and iii) are shown below Figure 3b. These are visually larger particles compared with those in Figue 1b. The aggregation is more pronounced after 5 hours of incubation (Figure 3c), as graphically illustrated by a few zoomed-in images in Figure 3c. Overall, these data demonstrate that the coaggregation of tau-Aβ42 is more pronounced than the aggregation of either tau or Aβ42 individually.
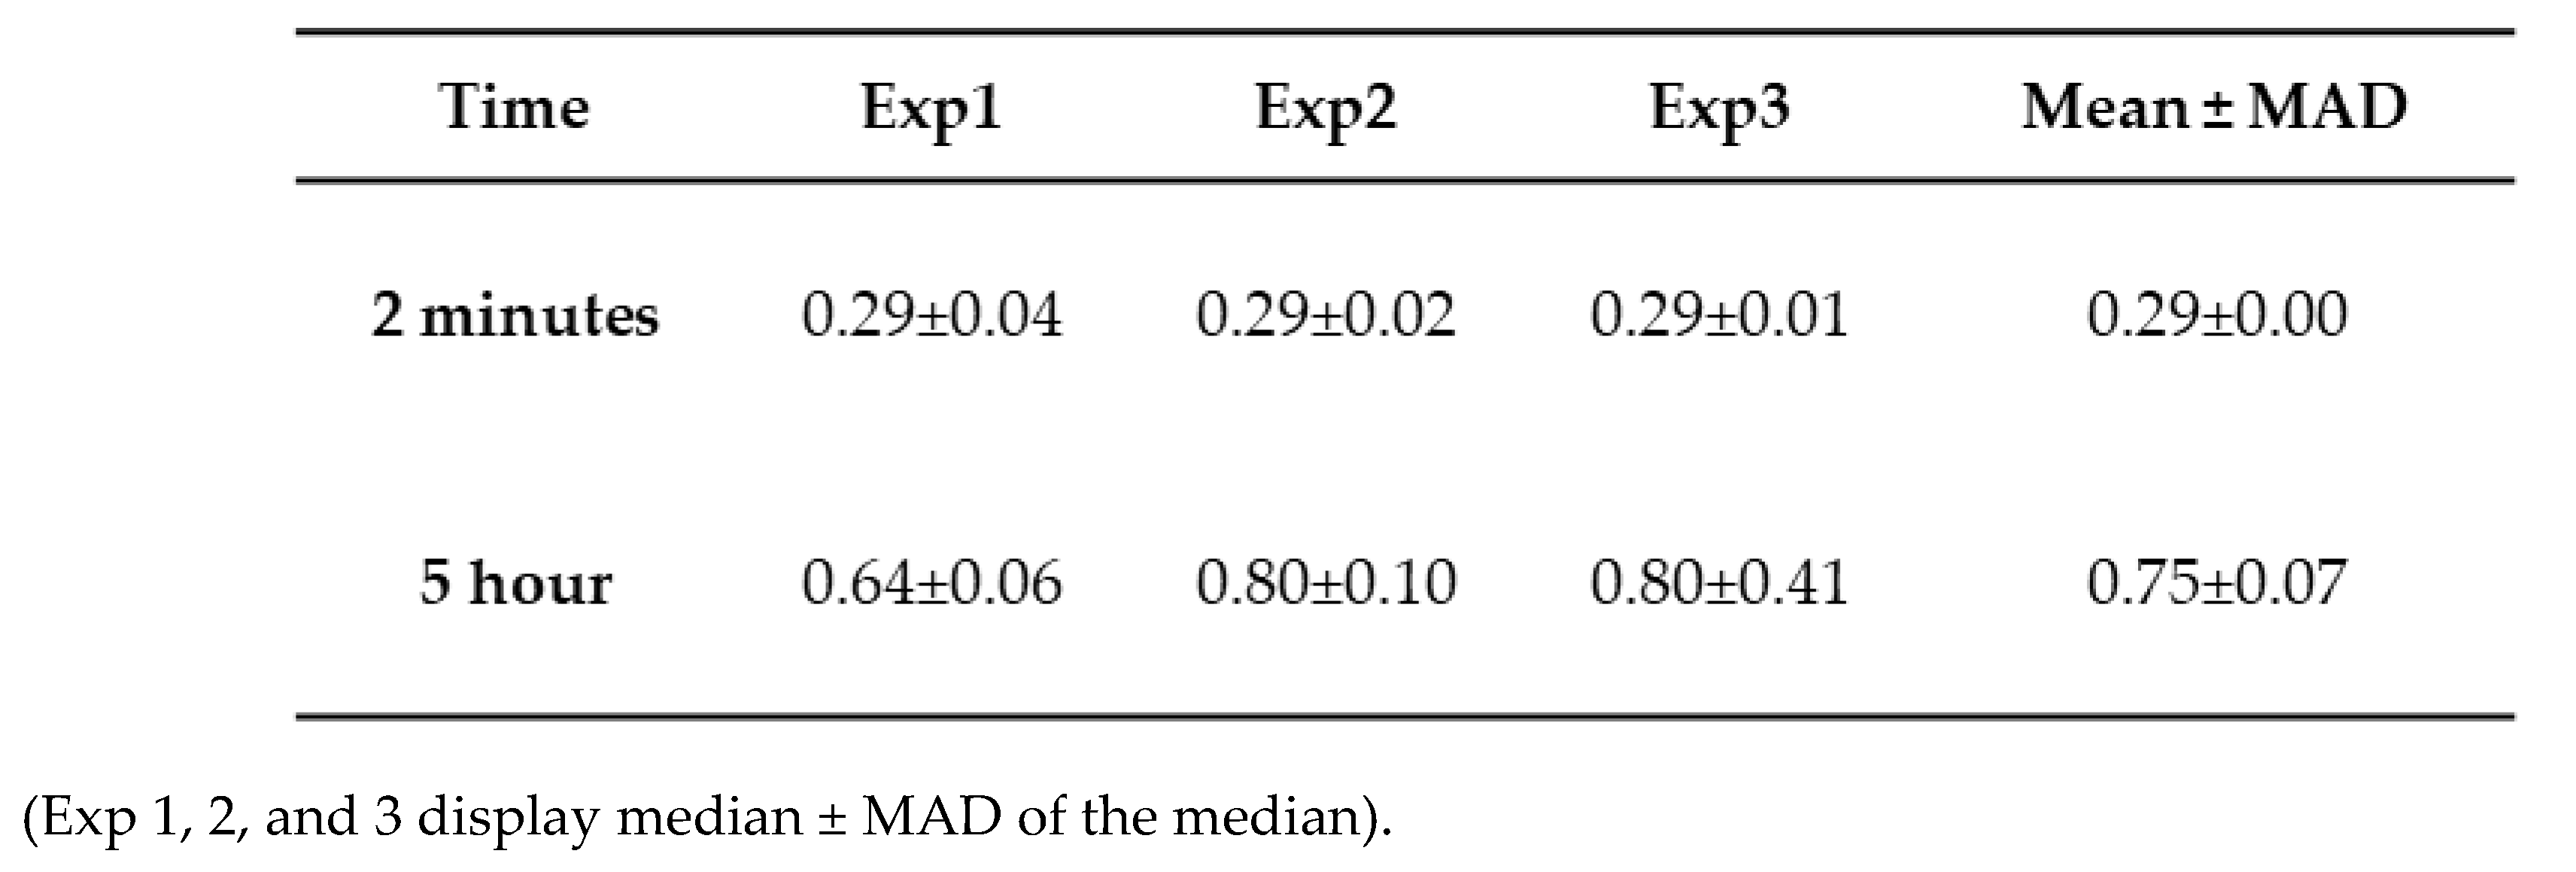
The height value analysis was conducted, and the data are presented in Figure 3d, illustrating a significant shift in height values over time. Three independent experiments were performed, and Figure S6 illustrates the overlap plot of the height traces for 2 minutes and 5 hours, providing a clearer visual representation of data reproducibility. Table 3 shows the median height measurements for each replicate (median ± MAD) of the three experiments for 2 minutes and 5 hours. The change from 2 minutes to 5 hours is statistically significant (p < 0.01).
2.5. Comparative Analysis of AFM Image Data
Figure 4a, Figure 4b, and Figure 4c provide a comparative aggregation profile by overlapping the height distributions of tau, Aβ42, and co-aggregated tau & Aβ42 at 2 minutes, 3 hours, and 5 hours. Blue, orange, and green traces represent tau, Aβ42, and tau & Aβ42, respectively. These overlays highlight that Aβ42 enhances tau aggregation, as the combined tau & Aβ42 samples consistently show higher height values, most notably at 5 hours. The data assembled at this incubation time demonstrate that there is no overlap between the height values of aggregates assembled with the tau-Aβ42 mixture (green histogram) and the histograms for the height values of the protein aggregated separately (orange and blue histograms). This finding suggests that the primary co-aggregation of these two proteins occurs more frequently than their independent aggregation.
To count the number of particles each hour, two separate frames were used for each hour, and the average is shown in Supplementary Table S2. For this particle counting, the volume cutoff for tau and Aβ42 was determined from the calibration curve [24] and used the approximate monomer size volume as a cutoff.
3. Discussion
Our studies revealed several novel features of tau aggregation and the role of Aβ42 in this process. First, we demonstrate that tau can aggregate at low nanomolar concentrations, suggesting that even small amounts of free tau in cells may be sufficient to initiate aggregation. In cells, tau is a structural protein present at concentrations of up to 2 μM as part of microtubules [25] , but spontaneous dissociation can release free tau capable of forming aggregates [26,27]. Second, whereas most studies associate tau aggregation with phosphorylation or even hyperphosphorylation [28,29], our data demonstrates unmodified, wild-type tau can aggregate, indicating that phosphorylation is not required for this process. Third, our findings suggest that Aβ42 catalyzes the aggregation of tau, as visually evident in the AFM images (Figure 3a-c). Importantly, quantitative analysis (Figure 4) further shows that these two proteins co-aggregate with no free Aβ42 aggregates found after 5 hours (Figure 4c). These results imply that all Aβ42 is associated with tau aggregates. Hence, a 10-fold difference in size allows tau to accommodate several Aβ42 molecules, possibly in the oligomeric form. We posit that misfolded tau and Aβ42 interact to form a more aggregation-prone complex. Based on these findings, we propose the model in Figure 5 for tau aggregation in the presence of Aβ42, in which a direct interaction of Aβ42 with tau leads to the co-aggregation of tau and Aβ42, occurring more rapidly than free tau aggregation. Thus, the Aβ42-defined catalysis of tau aggregation is determined by the tau-Aβ42 assembly, resulting in the misfolding and aggregation, which could contribute to the pathology process.
The significance of our findings to the pathological features of tau and Aβ42 in the AD development is discussed below.
The hallmarks of AD are senile plaques assembled primarily with Aβ42 and neurofibrillar tangles (NFT) formed by tau [30,31,32] . More recent experimental research suggests that Aβ promotes NFT development by facilitating either direct or indirect interactions with tau [20,33,34,35,36,37]. Our data directly show the catalysis of tau aggregation by Aβ42. Importantly, the tau aggregation is markedly enhanced by Aβ42, even at a low concentration of 10 nM. As previous studies show that it is within the range of the intracellular concentrations of soluble Aβ in neurons, this concentration is very significant [38].
The demonstration of tau protein aggregation, without any post-translational modifications such as phosphorylation, is another crucial finding. Most in-vitro tau aggregation studies employ chemical modifications, truncations, inducers, or mutations to induce fibrillization[18,39]. However, our findings demonstrate that full-length, unaltered tau can assemble on mica surfaces in a period comparable to that of Aβ42, under physiological conditions. While tau pathology in Alzheimer’s disease is commonly associated with hyperphosphorylation, our research suggests that tau has the inherent capacity to aggregate.
Extracellular tau oligomers have also been found to be pathologically active in Alzheimer’s disease, despite tau’s neurotoxicity traditionally being linked to its formation into intracellular neurofibrillary tangles. In animal models, short-term exposure to extracellular oligomeric tau reduces memory and hippocampus long-term potentiation (LTP), even when fibrillar deposits are not present [40,41]. The presence of Aβ extracellularly is associated with its formation of plaques; however, these extracellular Aβ monomeric or oligomeric forms can also contribute to tau aggregation. In this instance, our demonstration of on-surface aggregation of Aβ42 and tau can be a mechanism that further catalyzes their co-aggregation in the presence of cell membranes and other organelles.
We have shown that phospholipid bilayers mimicking the cell membrane catalyze Aβ42 aggregation [42,43] so this mechanism can be applied to the tau-Aβ42 co-aggregation. The findings also suggest that tau may undergo conformational changes that facilitate self-assembly in specific microenvironmental settings, such as those found in intracellular compartments or near membrane interfaces. This supports the idea that phosphorylation may not be the exclusive focus of early stages of tau aggregation, but Aβ42 can play a critical role.
4. Materials and Methods
4.1. Preparation of Protein Stock Solutions
Human recombinant wild-type protein tau-441 (2N4R), Catalog No. SPR-47, monomers were purchased from StressMarq Biosciences Inc. The lyophilized protein was reconstituted in 10 mM HEPES buffer (pH 7.4) containing 100 mM NaCl and stored at −80 °C. Working solutions were freshly prepared by serial dilution of the stock to achieve a final concentration of 10 nM in HEPES buffer (pH 7.4).
Lyophilized Aβ42 peptide (Catalog No. RP10017; GenScript, New Jersey, USA) was prepared following a previously established protocol [25,26]. To eliminate any pre-existing aggregates, the peptide was first dissolved in 1,1,1,3,3,3-hexafluoroisopropanol (HFIP) in a glass vial to a final concentration of 50 μM. The HFIP was allowed to evaporate overnight at room temperature under a gentle nitrogen stream, leaving a thin peptide film. This film was then re-dissolved in DMSO to obtain a stock solution, which was stored at −20 °C until use. Before each experiment, an aliquot of the stock solution was dialyzed against 10 mM HEPES buffer (pH 7.4) and subsequently diluted to a final concentration of 10 nM for use.
For mixed-protein aggregation experiments, tau and Aβ42 were prepared separately as described above, and equal volumes were combined to yield a final concentration of 10 nM each in 10 mM HEPES buffer (pH 7.4).
4.2. Sample Preparation to Monitor On-Surface Aggregation
Freshly cleaved mica sheets were used as substrates for the on-surface aggregation assays. Small pieces of mica were incubated with tau, Aβ42, or tau–Aβ42 mixture solutions (10 nM final protein concentration) in Eppendorf tubes for up to 5 hours. At defined time points (2minutes, 3hr, and 5hr), the mica substrates were carefully removed, rinsed thoroughly with deionized water, dried under an argon stream, and finally pasted to a metal puck with sticky tape. The samples were then kept in a vacuum overnight to ensure complete drying before AFM imaging.
4.3. AFM Imaging and Analysis
AFM images were acquired in standard tapping mode under ambient conditions using a Multimode Nanoscope IV system (Bruker-Nano, Santa Barbara, CA). TESPA probes with a nominal resonance frequency of 310–340 Hz and a spring constant of ~42 N/m were used for imaging. Before starting imaging, autotuning was performed in nanoscope software. The scan rate for the scanning was in the range of 1 to 1.5Hz. Scan size was 1.5 × 1.5 µm² with 1024 samples/line.
4.4. Image Analysis and Data Handling
Topographical images were plane-adjusted and flattened using a polynomial function in Gwyddion v2.66 (Gwyddion, Czech Republic). Direct quantification of particle size distribution becomes statistically complex due to the large degree of morphological heterogeneity. However, we can approximate aggregation through changes in baseline height. Intrinsically disordered proteins (IDPs), such as tau and AB42, are known to coat surfaces; here, we exploited this property and measured the baseline height by comparing buffer-treated controls with Ab42-treated samples. Supplementary Figure S7 displays control histograms (no protein, only buffer) and those with protein present for 2 minutes and 5 hours. In Figure S7a, a clear baseline shift of height to the right is observed when protein is present, with gray representing control and orange representing Aβ42. Figure S4b shows an even more prominent baseline shift after 5 hours, indicating increased aggregation. We acquired height traces in Gwyddion v2.66 (Gwyddion, Czech Republic), extracted the values in nm, and plotted the histograms in MagicPlot Pro v2.9.3 (St. Petersburg, Russia). The method is illustrated in the supplementary section (Figure S2). For each time point and sample type (tau, Aβ42, and their mixture), AFM images from 1.5 × 1.5 µm² scan areas were analyzed. A Student’s t-test was performed to show the statistical significance.
5. Conclusions
This work demonstrates that Aβ42 promotes and accelerates tau aggregation at physiologically low concentrations (10 nM). This can be a co-aggregation process in which the interaction of tau and Aβ42 drives the aggregation process. The finding that the process occurs at the surfaces of tau protein with no modifications suggests novel molecular mechanisms for the pathological effects of both physiologically essential proteins.
Supplementary Materials
The following supporting information can be downloaded at the website of this paper posted on Preprints.org.
Author Contributions
Conceptualization, Y.L.L.; methodology, R.C.; R.D.; validation, R.C.; R.D.; A.D. and L.S.; formal analysis, R.C.; R.D.; A.D. and L.S; investigation, R.C.; R.D.; resources, Y.L.L.; data curation, R.C.; writing—original draft preparation, R.C.; writing—review and editing, R.C.; R.D.; A.D.; Y.L.L. and L.S.; visualization, R.C. and R.D.; supervision, Y.L.L.; project administration, Y.L.L.; funding acquisition, Y.L.L. All authors have read and agreed to the published version of the manuscript.
Funding
This research was funded by the grant from NIH/NIGMS, grant number R01GM148537.
Data Availability Statement
All data are included in this paper.
Acknowledgments
We thank Dr. Lyubchenko lab members for useful insight.
Conflicts of Interest
The authors declare no conflicts of interest.:
Abbreviations
The following abbreviations are used in this manuscript:
| AFM | Atomic force microscopy |
| Aβ | Amyloid beta |
| AD | Alzheimer’s Disease |
| nM | Nanomolar |
| NFT | Neurofibrillary Tangle |
| MAD | Mean/Median Absolute Difference |
References
- Kumar, A.; Sidhu, J.; Lui, F.; Tsao, J.W. Alzheimer Disease. StatPearls 2024, 1–27. [Google Scholar]
- Rajmohan, R.; Reddy, P.H. Amyloid Beta and Phosphorylated Tau Accumulations Cause Abnormalities at Synapses of Alzheimer’s Disease Neurons. J Alzheimers Dis 2017, 57, 975. [Google Scholar] [CrossRef]
- Parihar, M.S.; Brewer, G.J. Amyloid Beta as a Modulator of Synaptic Plasticity. J Alzheimers Dis 2010, 22, 741. [Google Scholar] [CrossRef]
- Ciechanover, A.; Kwon, Y.T. Degradation of Misfolded Proteins in Neurodegenerative Diseases: Therapeutic Targets and Strategies. Experimental & Molecular Medicine 2015, 47, e147–e147. [Google Scholar] [CrossRef] [PubMed]
- Kent, S.A.; Spires-Jones, T.L.; Durrant, C.S. The Physiological Roles of Tau and Aβ: Implications for Alzheimer’s Disease Pathology and Therapeutics. Acta Neuropathologica 2020, 140, 417–447. [Google Scholar] [CrossRef] [PubMed]
- Ashraf, G.M.; Greig, N.H.; Khan, T.A.; Hassan, I.; Tabrez, S.; Shakil, S.; Sheikh, I.A.; Zaidi, S.K.; Wali, M.A.; Jabir, N.R.; et al. Protein Misfolding and Aggregation in Alzheimer’s Disease and Type 2 Diabetes Mellitus. CNS Neurol Disord Drug Targets 2014, 13, 1280. [Google Scholar] [CrossRef]
- Guerrero-Muñoz, M.J.; Gerson, J.; Castillo-Carranza, D.L. Tau Oligomers: The Toxic Player at Synapses in Alzheimer’s Disease. Front Cell Neurosci 2015, 9, 1–10. [Google Scholar] [CrossRef]
- Zhang, H.; Wei, W.; Zhao, M.; Ma, L.; Jiang, X.; Pei, H.; Cao, Y.; Li, H. Interaction between Aβ and Tau in the Pathogenesis of Alzheimer’s Disease. Int J Biol Sci 2021, 17, 2181. [Google Scholar] [CrossRef]
- Hurtado, D.E.; Molina-Porcel, L.; Iba, M.; Aboagye, A.K.; Paul, S.M.; Trojanowski, J.Q.; Lee, V.M.Y. Aβ Accelerates the Spatiotemporal Progression of Tau Pathology and Augments Tau Amyloidosis in an Alzheimer Mouse Model. Am J Pathol 2010, 177, 1977. [Google Scholar] [CrossRef] [PubMed]
- Tofigh, N.; Agahi, S.; Riazi, G.; Ghalamkar Moazzam, M.; Shahpasand, K. A Novel Phosphorylated Tau Conformer Implicated in the Tauopathy Pathogenesis of Human Neurons. Biomolecules 2025, 15, 585. [Google Scholar] [CrossRef]
- Ittner, L.M.; Götz, J. Amyloid-β and Tau — a Toxic Pas de Deux in Alzheimer’s Disease. Nature Reviews Neuroscience 2010 12:2 2010, 12, 67–72. [Google Scholar] [CrossRef] [PubMed]
- Zhang, H.; Wei, W.; Zhao, M.; Ma, L.; Jiang, X.; Pei, H.; Cao, Y.; Li, H. Interaction between Aβ and Tau in the Pathogenesis of Alzheimer’s Disease. Int J Biol Sci 2021, 17, 2181. [Google Scholar] [CrossRef]
- Gulisano, W.; Maugeri, D.; Baltrons, M.A.; Fà, M.; Amato, A.; Palmeri, A.; D’Adamio, L.; Grassi, C.; Devanand, D.P.; Honig, L.S.; et al. Role of Amyloid-β and Tau Proteins in Alzheimer’s Disease: Confuting the Amyloid Cascade. J Alzheimers Dis 2018, 64, S611. [Google Scholar] [CrossRef]
- Zhang, H.; Wei, W.; Zhao, M.; Ma, L.; Jiang, X.; Pei, H.; Cao, Y.; Li, H. Interaction between Aβ and Tau in the Pathogenesis of Alzheimer’s Disease. Int J Biol Sci 2021, 17, 2181. [Google Scholar] [CrossRef]
- Karran, E.; De Strooper, B. The Amyloid Hypothesis in Alzheimer Disease: New Insights from New Therapeutics. Nature Reviews Drug Discovery 2022, 21, 306–318. [Google Scholar] [CrossRef] [PubMed]
- Clinton, L.K.; Blurton-Jones, M.; Myczek, K.; Trojanowski, J.Q.; LaFerla, F.M. Synergistic Interactions between Abeta, Tau, and Alpha-Synuclein: Acceleration of Neuropathology and Cognitive Decline. J Neurosci 2010, 30, 7281–7289. [Google Scholar] [CrossRef] [PubMed]
- Gulisano, W.; Maugeri, D.; Baltrons, M.A.; Fà, M.; Amato, A.; Palmeri, A.; D’Adamio, L.; Grassi, C.; Devanand, D.P.; Honig, L.S.; et al. Role of Amyloid-β and Tau Proteins in Alzheimer’s Disease: Confuting the Amyloid Cascade. J Alzheimers Dis 2018, 64, S611. [Google Scholar] [CrossRef]
- Zhang, W.; Falcon, B.; Murzin, A.G.; Fan, J.; Crowther, R.A.; Goedert, M.; Scheres, S.H.W. Heparin-Induced Tau Filaments Are Polymorphic and Differ from Those in Alzheimer’s and Pick’s Diseases. Elife 2019, 8, e43584. [Google Scholar] [CrossRef]
- Nam, Y.; Shin, S.J.; Kumar, V.; Won, J.; Kim, S.; Moon, M. Dual Modulation of Amyloid Beta and Tau Aggregation and Dissociation in Alzheimer’s Disease: A Comprehensive Review of the Characteristics and Therapeutic Strategies. Translational Neurodegeneration 2025, 14, 1–16. [Google Scholar] [CrossRef]
- Miller, Y.; Ma, B.; Nussinov, R. Synergistic Interactions between Repeats in Tau Protein and Aβ Amyloids May Be Responsible for Accelerated Aggregation via Polymorphic States. Biochemistry 2011, 50, 5172–5181. [Google Scholar] [CrossRef]
- Ovod, V.; Ramsey, K.N.; Mawuenyega, K.G.; Bollinger, J.G.; Hicks, T.; Schneider, T.; Sullivan, M.; Paumier, K.; Holtzman, D.M.; Morris, J.C.; et al. Amyloid Beta Concentrations and Stable Isotope Labeling Kinetics of Human Plasma Specific to CNS Amyloidosis. Alzheimers Dement 2017, 13, 841. [Google Scholar] [CrossRef]
- Pan, Y.; Banerjee, S.; Zagorski, K.; Shlyakhtenko, L.S.; Kolomeisky, A.B.; Lyubchenko, Y.L. Molecular Model for the Surface-Catalyzed Protein Self-Assembly. [CrossRef]
- Banerjee, S.; Hashemi, M.; Lv, Z.; Maity, S.; Rochet, J.C.; Lyubchenko, Y.L. A Novel Pathway for Amyloids Self-Assembly in Aggregates at Nanomolar Concentration Mediated by the Interaction with Surfaces. Scientific Reports 2017, 7, 1–11. [Google Scholar] [CrossRef]
- Ratcliff, G.C.; Erie, D.A. A Novel Single-Molecule Study To Determine Protein−Protein Association Constants. J Am Chem Soc 2001, 123, 5632–5635. [Google Scholar] [CrossRef]
- Avila, J. Intracellular and Extracellular Tau. Front Neurosci 2010, 4, 49. [Google Scholar] [CrossRef]
- Zheng, H.; Sun, H.; Cai, Q.; Tai, H.C. The Enigma of Tau Protein Aggregation: Mechanistic Insights and Future Challenges. Int J Mol Sci 2024, 25, 4969. [Google Scholar] [CrossRef] [PubMed]
- Iqbal, K.; Liu, F.; Gong, C.-X.; Grundke-Iqbal, I. Tau in Alzheimer Disease and Related Tauopathies. Curr Alzheimer Res 2010, 7, 656. [Google Scholar] [CrossRef] [PubMed]
- Šimić, G.; Babić Leko, M.; Wray, S.; Harrington, C.; Delalle, I.; Jovanov-Milošević, N.; Bažadona, D.; Buée, L.; de Silva, R.; Giovanni, G. Di; et al. Tau Protein Hyperphosphorylation and Aggregation in Alzheimer’s Disease and Other Tauopathies, and Possible Neuroprotective Strategies. Biomolecules 2016, 6, 6. [Google Scholar] [CrossRef]
- Liu, M.; Sui, D.; Dexheimer, T.; Hovde, S.; Deng, X.; Wang, K.W.; Lin, H.L.; Chien, H.T.; Kweon, H.K.; Kuo, N.S.; et al. Hyperphosphorylation Renders Tau Prone to Aggregate and to Cause Cell Death. Mol Neurobiol 2020, 57, 4704. [Google Scholar] [CrossRef] [PubMed]
- Deture, M.A.; Dickson, D.W. The Neuropathological Diagnosis of Alzheimer’s Disease. Mol Neurodegener 2019, 14, 1–18. [Google Scholar] [CrossRef]
- Zhang, H.; Wei, W.; Zhao, M.; Ma, L.; Jiang, X.; Pei, H.; Cao, Y.; Li, H. Interaction between Aβ and Tau in the Pathogenesis of Alzheimer’s Disease. Int J Biol Sci 2021, 17, 2181. [Google Scholar] [CrossRef]
- Nelson, P.T.; Braak, H.; Markesbery, W.R. Neuropathology and Cognitive Impairment in Alzheimer Disease: A Complex but Coherent Relationship. J Neuropathol Exp Neurol 2009, 68, 1. [Google Scholar] [CrossRef]
- Eckert, A.; Hauptmann, S.; Scherping, I.; Rhein, V.; Müller-Spahn, F.; Götz, J.; Müller, W.E. Soluble Beta-Amyloid Leads to Mitochondrial Defects in Amyloid Precursor Protein and Tau Transgenic Mice. Neurodegener Dis 2008, 5, 157–159. [Google Scholar] [CrossRef]
- Hauptmann, S.; Keil, U.; Scherping, I.; Bonert, A.; Eckert, A.; Müller, W.E. Mitochondrial Dysfunction in Sporadic and Genetic Alzheimer’s Disease. Exp Gerontol 2006, 41, 668–673. [Google Scholar] [CrossRef]
- David, D.C.; Hauptmann, S.; Scherping, I.; Schuessel, K.; Keil, U.; Rizzu, P.; Ravid, R.; Dröse, S.; Brandt, U.; Müller, W.E.; et al. Proteomic and Functional Analyses Reveal a Mitochondrial Dysfunction in P301L Tau Transgenic Mice. Journal of Biological Chemistry 2005, 280, 23802–23814. [Google Scholar] [CrossRef]
- Avila, J. Intracellular and Extracellular Tau. Front Neurosci 2010, 4, 49. [Google Scholar] [CrossRef] [PubMed]
- Younas, N.; Saleem, T.; Younas, A.; Zerr, I. Nuclear Face of Tau: An inside Player in Neurodegeneration. Acta Neuropathol Commun 2023, 11, 196. [Google Scholar] [CrossRef] [PubMed]
- Ripoli, C.; Cocco, S.; Li Puma, D.D.; Piacentini, R.; Mastrodonato, A.; Scala, F.; Puzzo, D.; D’Ascenzo, M.; Grassi, C. Intracellular Accumulation of Amyloid-β (Aβ) Protein Plays a Major Role in Aβ-Induced Alterations of Glutamatergic Synaptic Transmission and Plasticity. The Journal of Neuroscience 2014, 34, 12893. [Google Scholar] [CrossRef] [PubMed]
- Rasmussen, H.Ø.; Nielsen, J.; de Poli, A.; Otzen, D.E.; Pedersen, J.S. Tau Fibrillation Induced by Heparin or a Lysophospholipid Show Different Initial Oligomer Formation. J Mol Biol 2023, 435, 168194. [Google Scholar] [CrossRef]
- Taddei, R.N.; Perbet, R.; De Gerando, A.M.; Wiedmer, A.E.; Sanchez-Mico, M.; Stewart, T.C.; Gaona, A.; Melloni, A.; Amaral, A.C.; Duff, K.; et al. Tau Oligomer–Containing Synapse Elimination by Microglia and Astrocytes in Alzheimer Disease. JAMA Neurol 2023, 80, 1209–1221. [Google Scholar] [CrossRef]
- Acquarone, E.; Argyrousi, E.K.; Van Den Berg, M.; Gulisano, W.; Fà, M.; Staniszewski, A.; Calcagno, E.; Zuccarello, E.; D’Adamio, L.; Deng, S.X.; et al. Synaptic and Memory Dysfunction Induced by Tau Oligomers Is Rescued by Up-Regulation of the Nitric Oxide Cascade. Mol Neurodegener 2019, 14, 1–19. [Google Scholar] [CrossRef]
- Banerjee, S.; Hashemi, M.; Zagorski, K.; Lyubchenko, Y.L. Cholesterol in Membranes Facilitates Aggregation of Amyloid β Protein at Physiologically Relevant Concentrations. ACS Chem Neurosci 2021, 12, 506–516. [Google Scholar] [CrossRef] [PubMed]
- Hashemi, M.; Banerjee, S.; Lyubchenko, Y.L. Free Cholesterol Accelerates Aβ Self-Assembly on Membranes at Physiological Concentration. Int J Mol Sci 2022, 23. [Google Scholar] [CrossRef] [PubMed]
Figure 1.
AFM imaging of tau aggregation. Representative AFM topographic images of tau aggregates on mica surfaces at different incubation times. (a) 2 minutes, (b) 3 hours, (c) 5 hours. Arrows indicate examples of aggregates. (a, i-iii) represents zoomed-in particles from 2 minutes. (b, i-iii) represents zoomed-in particles from 3 hours. (c, i-iii) represents zoomed-in particles from 5 hours. (d)Tau height distribution for 2 minutes, and 5 hours with baseline shift.
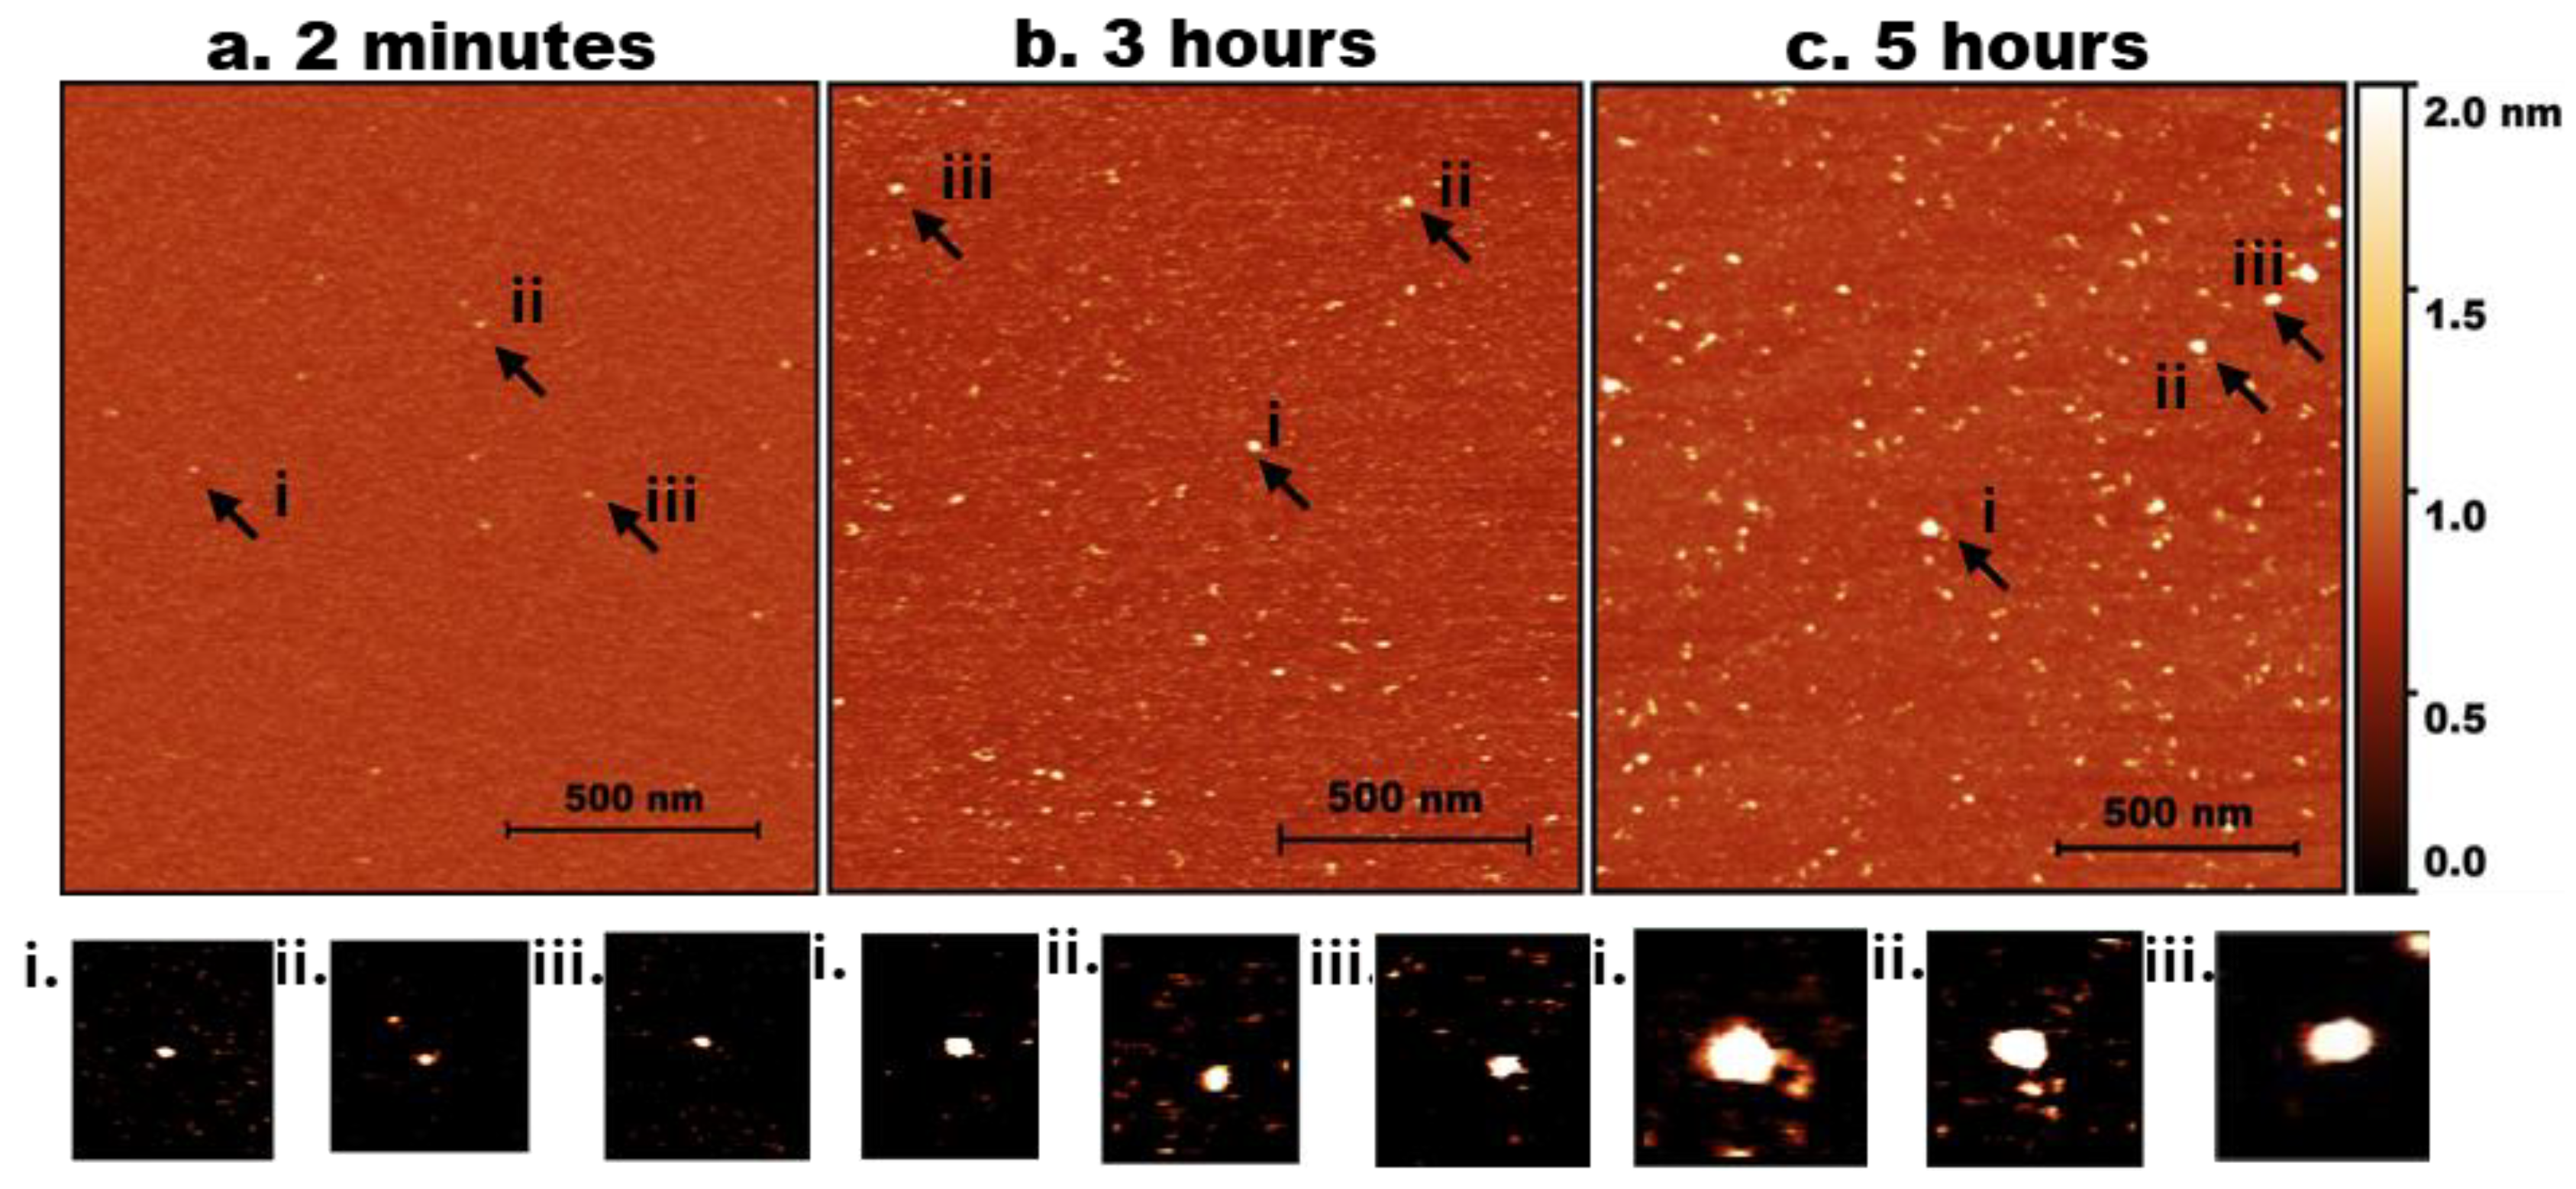
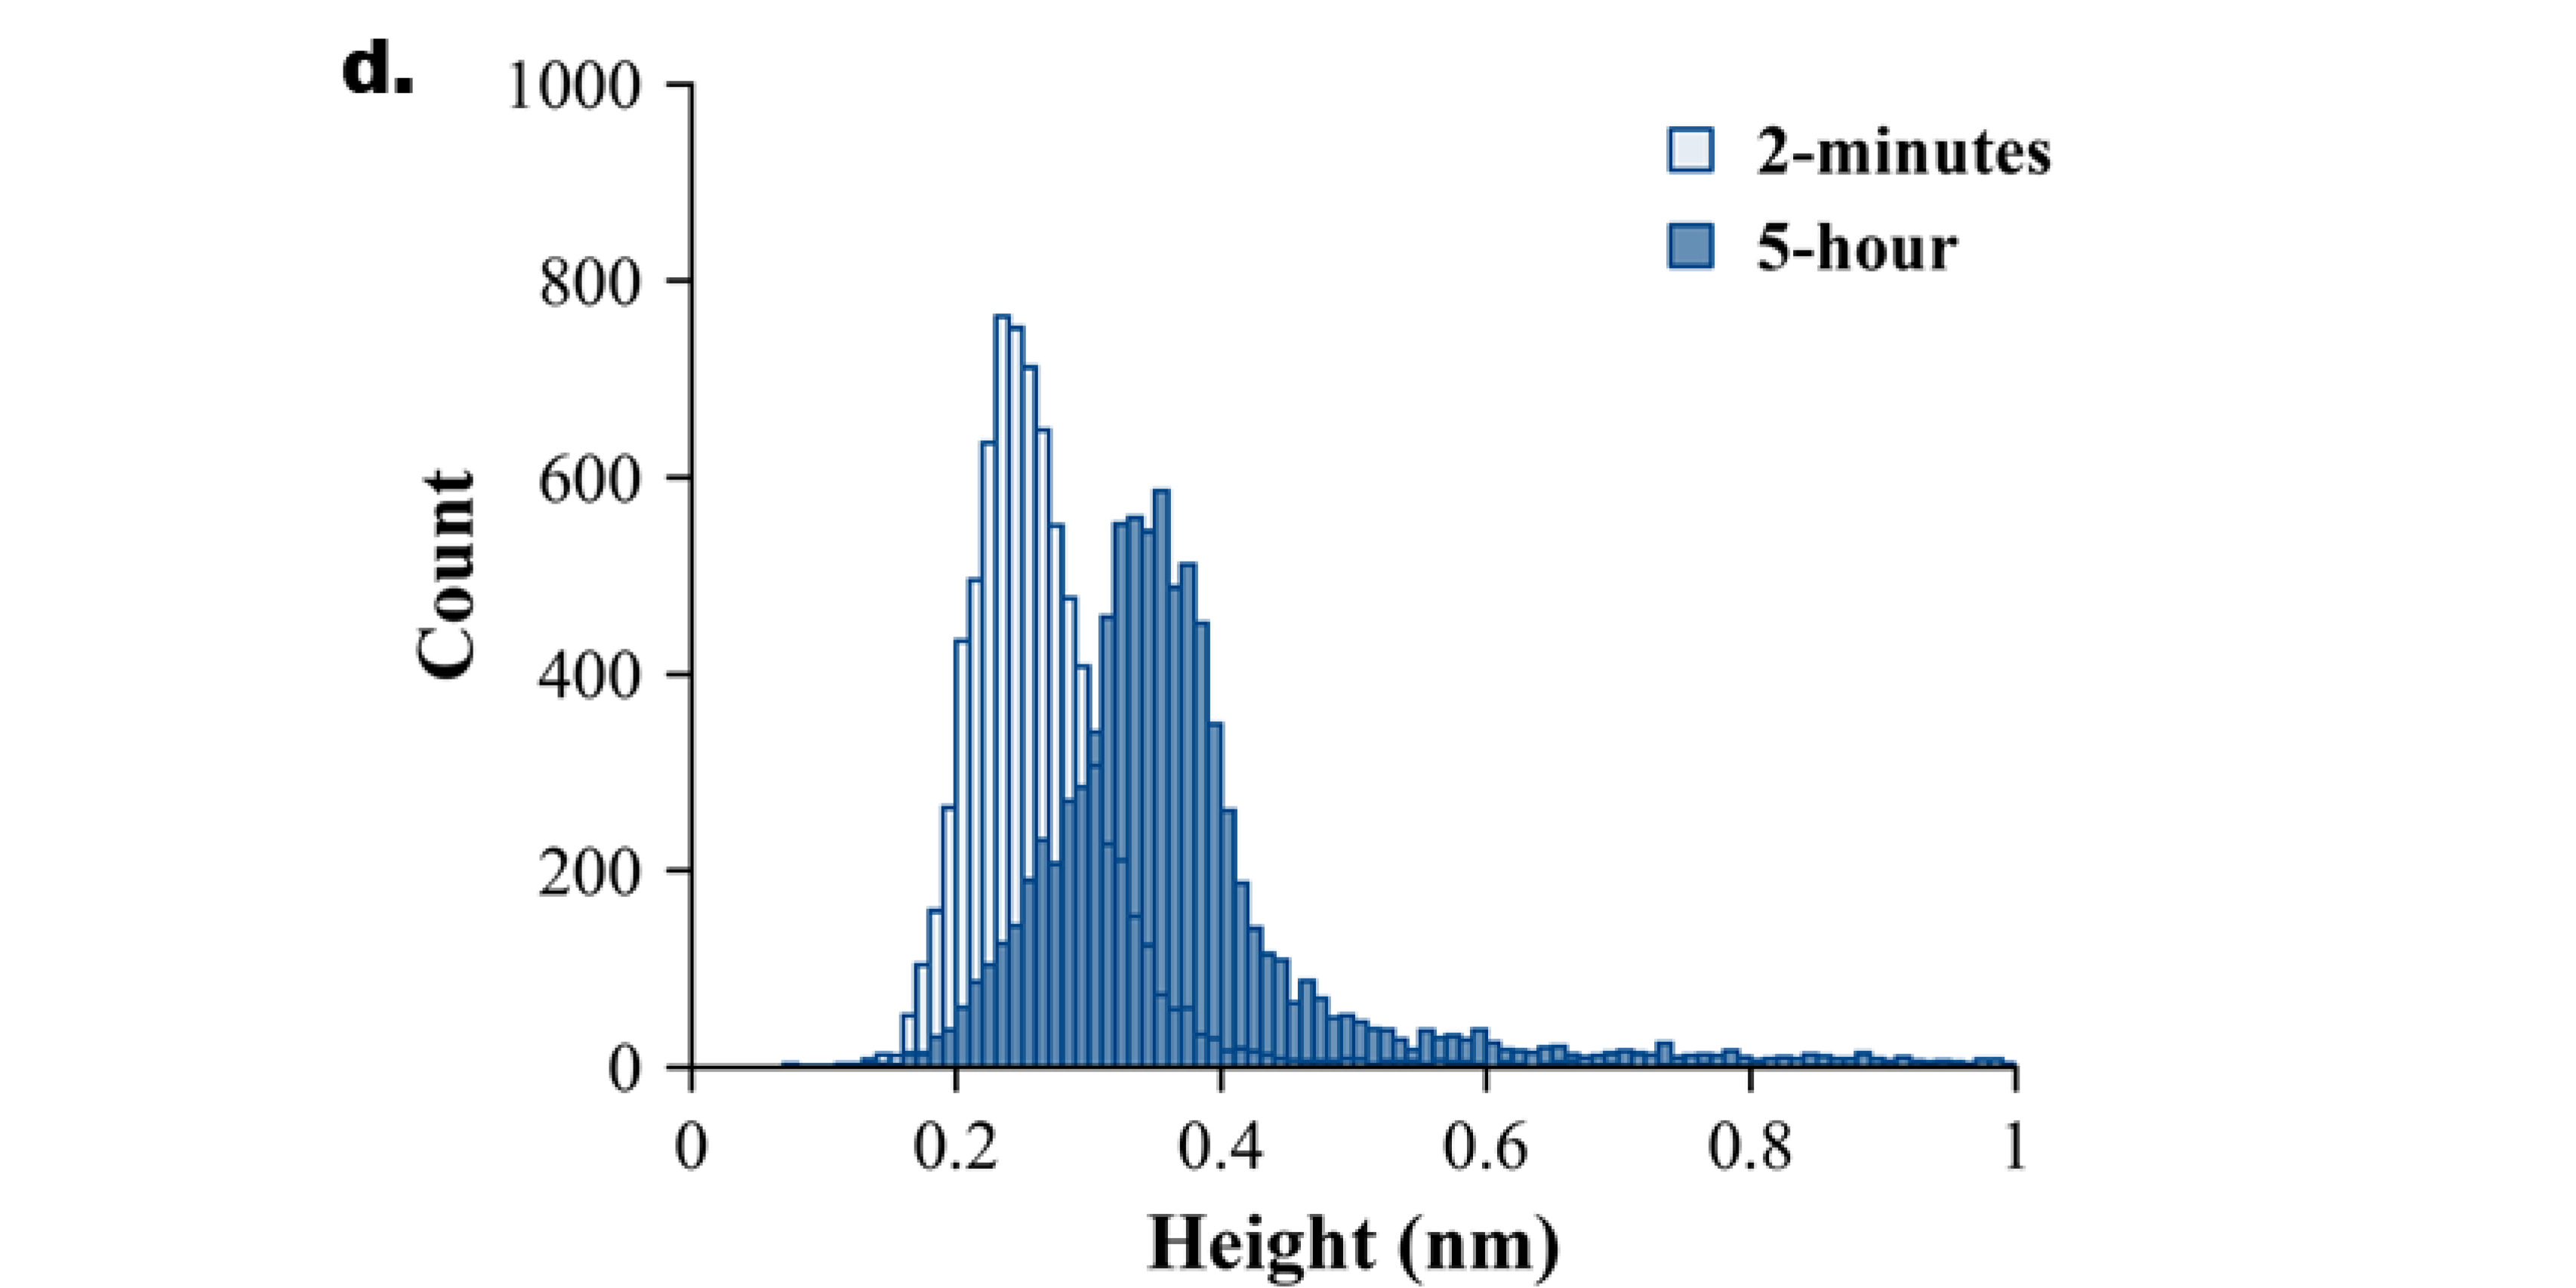
Figure 2.
Experimental data for Aß42 aggregation. AFM topographical images of the on-surface aggregation of 10nM Aß42 protein for (a) 2 minutes, (b) 3 hours, and (c) 5 hours. (d) Aβ42 height distribution for 2 minutes and 5 hours with baseline shift.
Figure 2.
Experimental data for Aß42 aggregation. AFM topographical images of the on-surface aggregation of 10nM Aß42 protein for (a) 2 minutes, (b) 3 hours, and (c) 5 hours. (d) Aβ42 height distribution for 2 minutes and 5 hours with baseline shift.
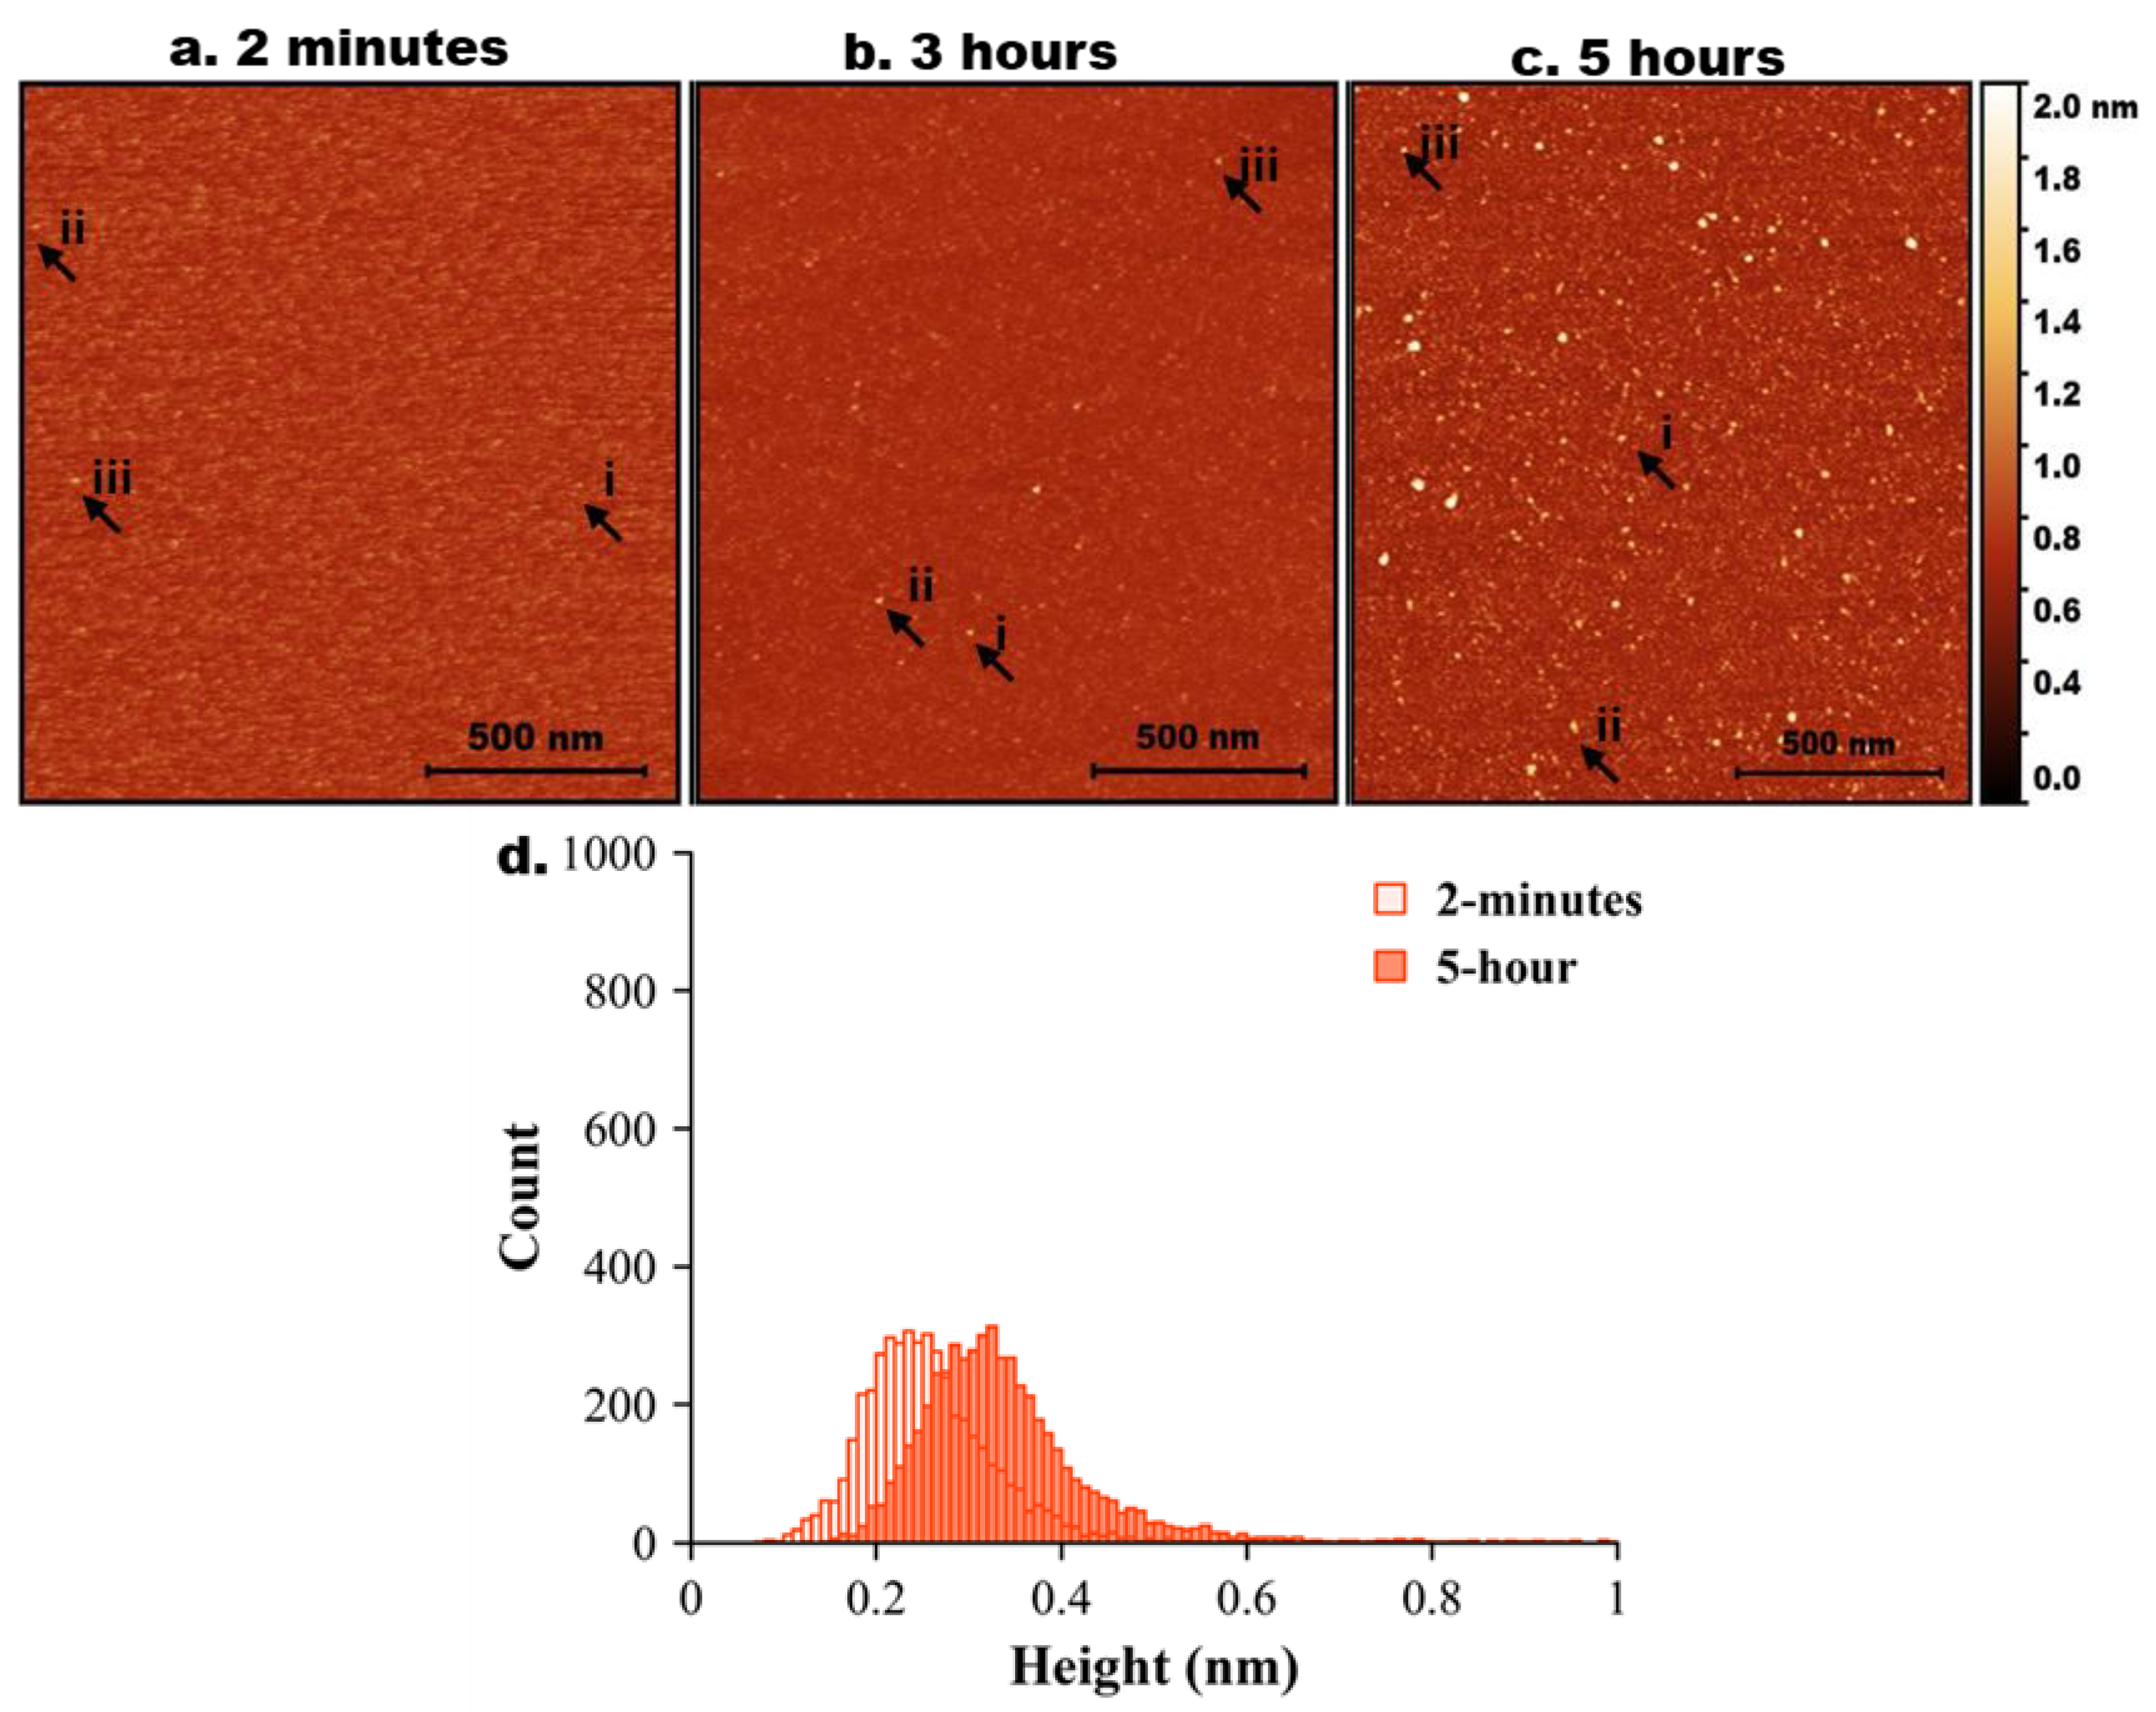
Figure 3.
AFM imaging of tau-Aβ42 coaggregation. Representative AFM topographic images of tau-Aβ42 aggregates on mica surfaces at different incubation times. (a) 2 minutes, (b) 3 hours, (c) 5 hours. Arrows indicate representative aggregates. (a, a.i-iii) represents zoomed-in particles from 2 minutes. (b, bi-iii) represents zoomed-in particles from 3 hours. (c, i-iii) represents zoomed-in particles from 5 hours. (d) Tau-Aβ42 height distribution for 2 minutes, 3 hours, and 5 hours with baseline shift.
(Exp 1, 2, and 3 display median ± MAD of the median).
Figure 4.
Comparative quantitative analysis of AFM images. (a) Overlapping height distribution of tau (blue), Aβ (orange), and tau & Aβ aggregates (green) at 2 minutes, (b) 3 hours, and (c) 5 hours.
Figure 4.
Comparative quantitative analysis of AFM images. (a) Overlapping height distribution of tau (blue), Aβ (orange), and tau & Aβ aggregates (green) at 2 minutes, (b) 3 hours, and (c) 5 hours.

Figure 5.
Graphical model of tau- Aβ42 interaction pathway. (a) Formation of Aβ oligomer. (b) Formation of tau oligomer, (c) Co-aggregation of tau-Aβ when mixed.
Figure 5.
Graphical model of tau- Aβ42 interaction pathway. (a) Formation of Aβ oligomer. (b) Formation of tau oligomer, (c) Co-aggregation of tau-Aβ when mixed.


Table 1.
Height trace measurement from tau aggregation at 2 minutes and 5 hours.
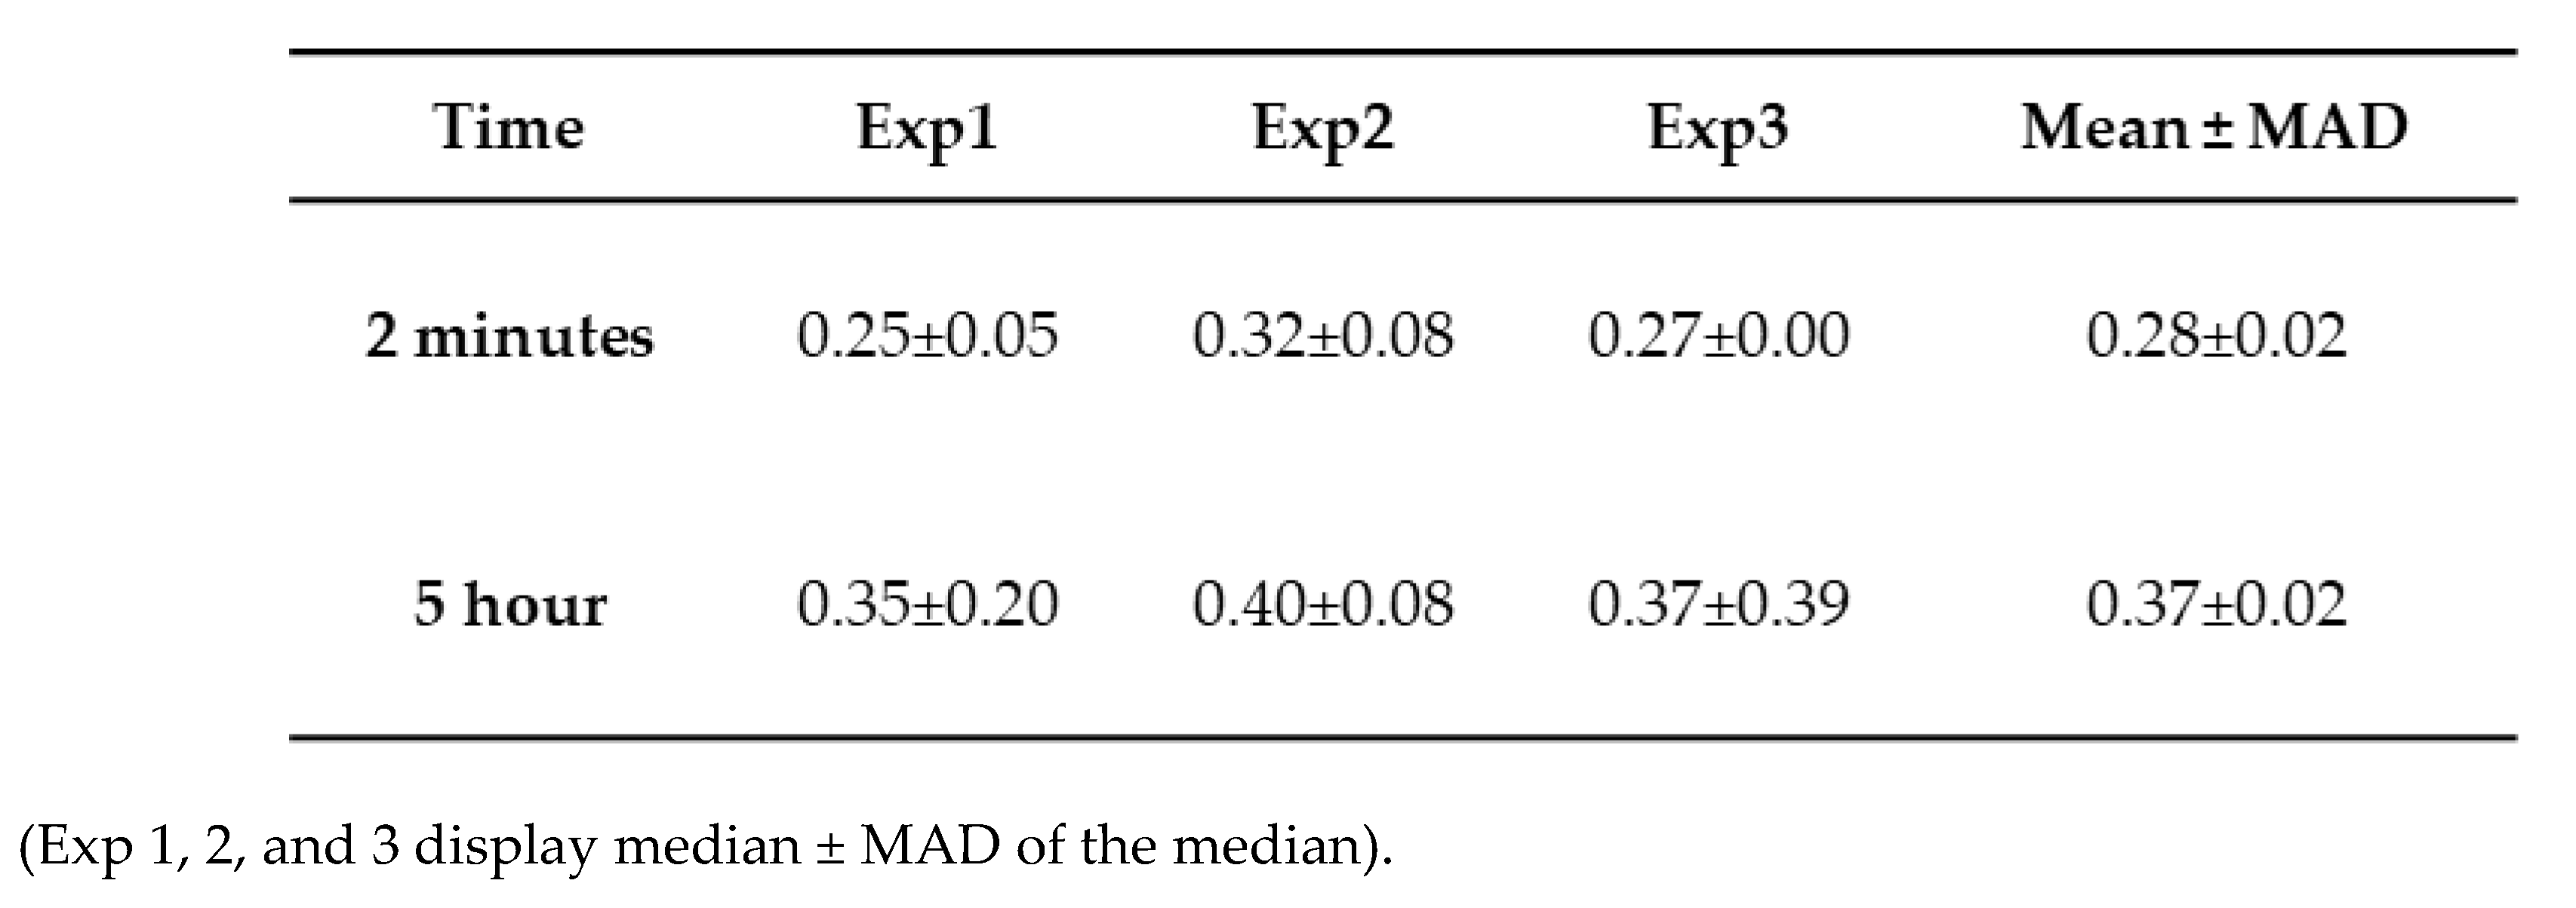
Table 2.
Height trace measurement from Aβ42 aggregation at 2 minutes and 5 hours.
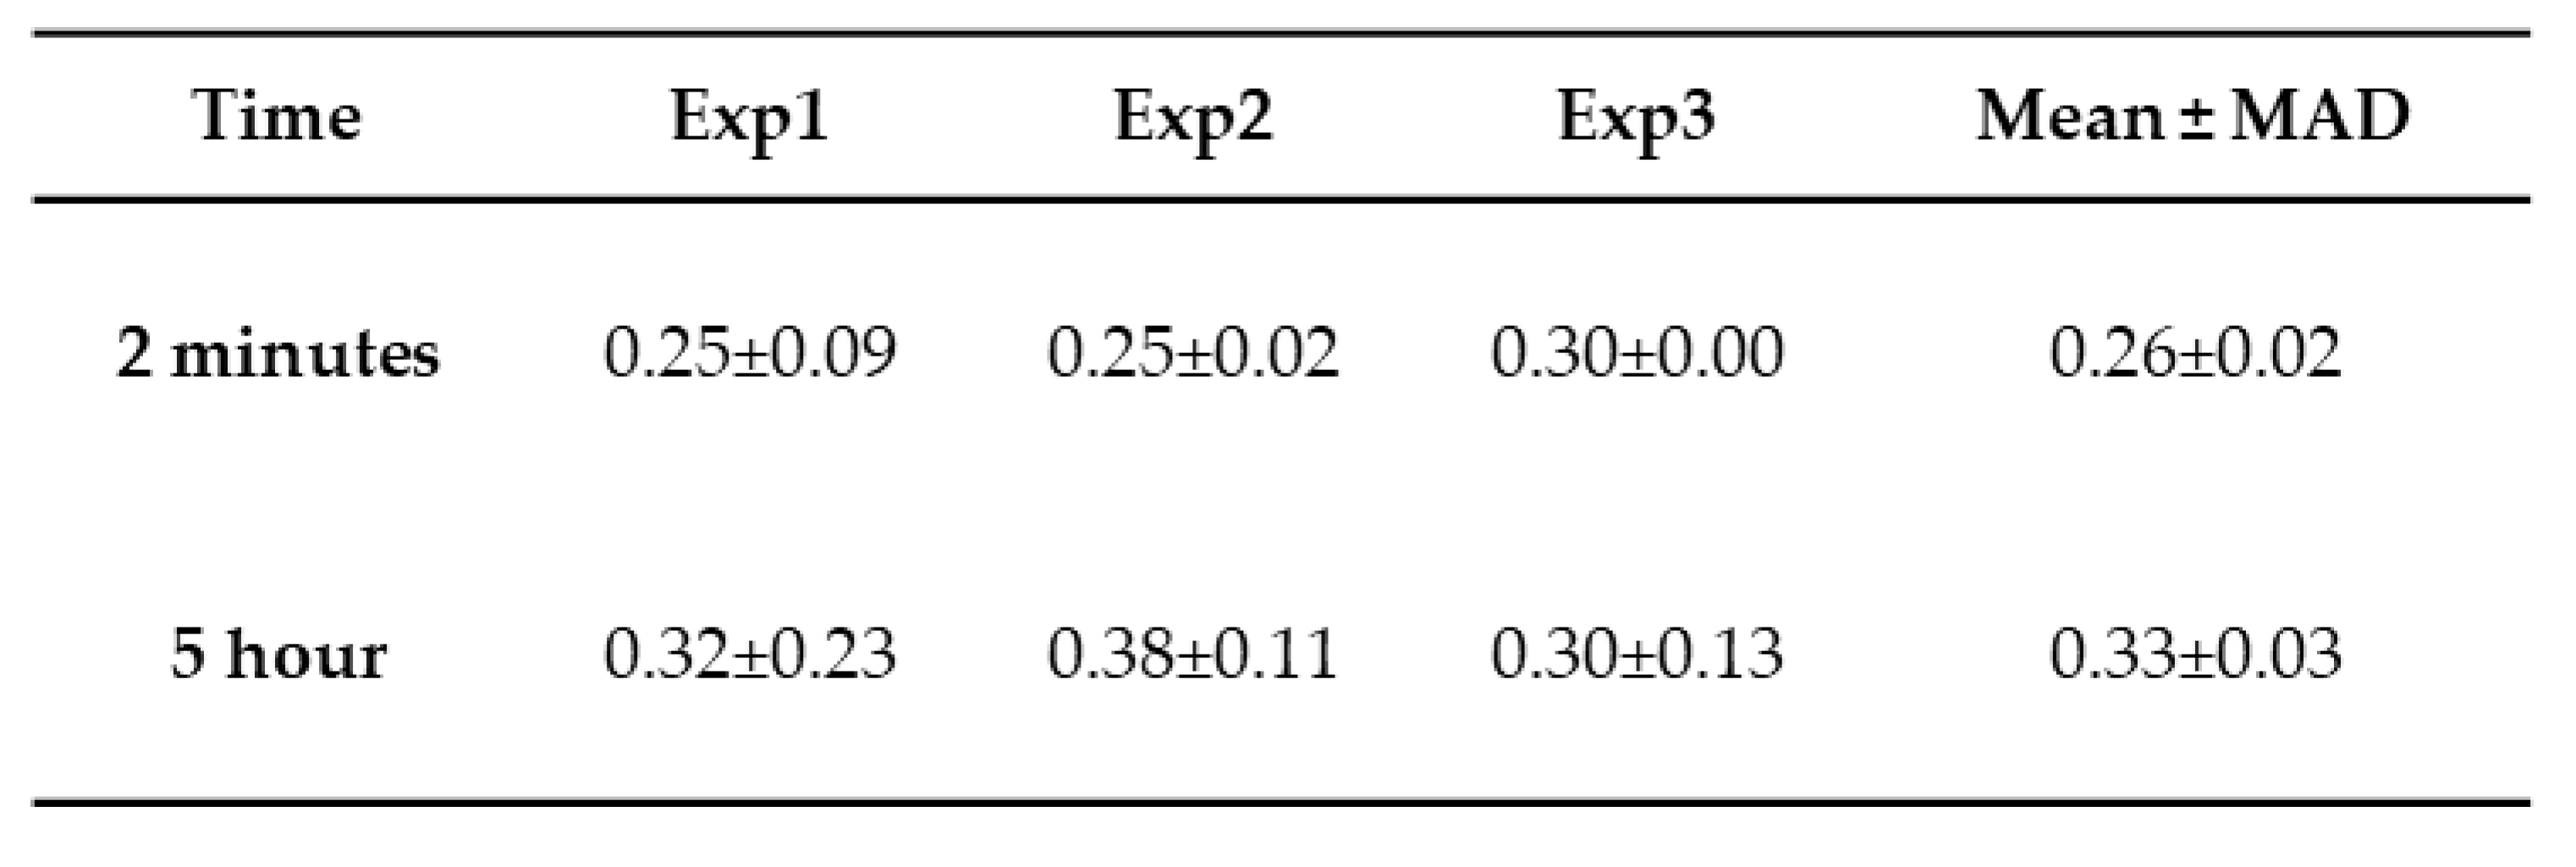
(Exp 1, 2, and 3 display median ± MAD of the median).
Table 3.
Height trace measurement from tau-Aβ42 aggregation at 2 minutes and 5 hours.
Disclaimer/Publisher’s Note: The statements, opinions and data contained in all publications are solely those of the individual author(s) and contributor(s) and not of MDPI and/or the editor(s). MDPI and/or the editor(s) disclaim responsibility for any injury to people or property resulting from any ideas, methods, instructions or products referred to in the content. |
© 2025 by the authors. Licensee MDPI, Basel, Switzerland. This article is an open access article distributed under the terms and conditions of the Creative Commons Attribution (CC BY) license (http://creativecommons.org/licenses/by/4.0/).
Copyright: This open access article is published under a Creative Commons CC BY 4.0 license, which permit the free download, distribution, and reuse, provided that the author and preprint are cited in any reuse.


