

Submitted:
03 October 2025
Posted:
07 October 2025
You are already at the latest version
Abstract
This paper introduces a new hybrid model, HAR-RV-CARMA, which combines the Heterogeneous Autoregressive model for Realized Volatility (HAR-RV) with the Continuous Autoregressive Moving Average (CARMA) model. The key innovation of this study lies in the use of a Kalman filter-based dynamic state weighting mechanism to optimally combine the predictive capabilities of both models while mitigating overfitting. The proposed model is applied to five major Covered Call Exchange-Traded Funds (ETFs): QYLD, XYLD, RYLD, JEPI, and JEPQ, utilizing daily realized volatility data from 2019 to 2024. Model performance is evaluated against standalone HAR-RV and CARMA models using metrics such as Mean Absolute Error (MAE), Root Mean Squared Error (RMSE), Quasi-Likelihood (QLIKE), Akaike Information Criterion (AIC), and Bayesian Information Criterion (BIC). Additionally, the study assesses directional accuracy and conducts a Diebold-Mariano test to compare forecast performance against the standalone models statistically. Empirical results suggest that the HAR-RV-CARMA hybrid model significantly outperforms both HAR-RV and CARMA in volatility forecasting across all evaluation criteria. It achieves lower forecast errors, superior goodness-of-fit, and higher directional accuracy, with Diebold-Mariano test outcomes rejecting the null hypothesis of equal predictive ability at significant levels. These findings highlight the effectiveness of dynamic model weighting in improving predictive accuracy and offer a strong framework for volatility modeling in financial markets.
Keywords:
volatility forecasting
; covered call
; Kalman filter
; HAR-RV
; CARMA
1. Introduction
Modeling the volatility of financial assets is essential for stakeholders, fund managers, and the government. Forecasting volatility is key for asset pricing, asset allocation, and risk management. Accurate volatility predictions can help fund managers reduce their exposure to potential market risks, and the government can use these forecasts to evaluate risk impacts on the economy and develop effective policy recommendations. Modeling volatility is challenging because it is a latent variable, meaning it cannot be observed directly and must be estimated. Researchers often estimate volatility with methods like realized volatility, which is the annualized standard deviation of log returns, and implied volatility, a forward-looking measure derived from options (Qiu et al., 2025). Realized volatility is an important indicator of market uncertainty and is widely used in derivative pricing, portfolio risk management, and volatility trading. Studies such as Anderson et al. (2003), Qiu et al. (2019), Korkusuz et al. (2023), Lin et al. (2022), and Dutta et al. (2022) have conducted comprehensive modeling of realized volatility. Conversely, implied volatility is a forward-looking measure of expected return variability, inferred from option prices using models like Black–Scholes or stochastic volatility frameworks. Studies including Psaradellis and Sermpinis (2016), Vrontos et al. (2021), Aït-Sahalia et al. (2021), Michael et al. (2025), and Jiao et al. (2024) focus on predicting, modeling, or forecasting implied volatility. Recent research has also aimed to model Value-at-Risk (VaR). VaR is a risk measure estimating the maximum expected loss at a specified confidence level over a given time horizon. Industry standards such as the VaR prescribed by financial regulators for measuring and managing market risk heavily rely on accurate volatility forecasts (Wilm et al., 2021). Peng et al. (2023) introduce a novel VaR predictor based on sublinear expectation theory to address model uncertainty in volatility distributions. Bollerslev et al. (2016) improve VaR forecasting by utilizing forecast errors in realized volatility models, such as HAR and Realized GARCH. Bayer (2017) proposed a new penalized quantile regression approach that combines VaR forecasts.
Traditional volatility models generally depend on frameworks like the heterogeneous autoregressive (HAR-RV), introduced by Corsi (2009), or on stochastic volatility models such as CARMA and GARCH (Brockwell & Lindner, 2009). While each model is robust on its own, they often treat discrete and continuous time volatility components separately. This study proposes a new HAR-RV-CARMA hybrid model that combines the forecasting strengths of HAR-RV and CARMA to improve volatility prediction. The HAR-RV model tracks volatility persistence across multiple time horizons (Corsi, 2009), serving as a standard benchmark, while the continuous-time CARMA model captures long-memory effects and jump features in volatility (Brockwell, 2001). Brockwell (2014) found that a Lévy-driven CARMA (2,1) process fits daily realized volatility series well. By merging HAR-RV and CARMA, the hybrid model leverages HAR-RV’s ability to depict volatility clustering over different periods and CARMA’s focus on mean reversion, especially in covered-call ETFs. This fusion of discrete- and continuous-time approaches enhances both short- and long-term volatility forecasts.
A key innovation in this study’s approach is the use of Kalman filter dynamic weighting to integrate the HAR and CARMA components. Rather than assigning fixed weights or combining forecasts arbitrarily, the study employs a state-space framework where optimal weights are continuously updated in real time based on evolving market conditions. Kalman filter has been used in finance to smooth data (Heo & Kim, 2025), estimate latent states (Zhuang, 2018; Wells, 1995), or combine model outputs (Khashei & Mahdavi Sharif, 2021). Its role has largely been limited to noise reduction or fusion within structurally similar models. To the best of my knowledge, this is the first study to adopt Kalman filter as a dynamic state-weighting mechanism to fuse discrete-time (HAR-RV) and continuous-time (CARMA) volatility models, offering a novel hybrid approach for volatility forecasting.
The proposed hybrid model is applied to the realized volatility of five covered call ETFs: QYLD, XYLD, RYLD, JEPI, and JEPQ. Investing in ETFs is a strategic way to reduce risk by diversifying investments across different asset classes. During periods of increased uncertainty, investors seeking reliable income and a hedge against volatility may find covered call ETFs to be a valuable addition to their portfolios. A covered call ETF is an exchange-traded fund that uses a strategy called covered call writing to generate income for investors. Covered call writing involves selling call options on the underlying security owned by the investor in exchange for premiums, while still benefiting from potential price increases up to the strike price of the options. These funds are known for delivering equity-like returns with lower volatility, making accurate volatility forecasting essential for risk management and portfolio optimization. Despite their popularity, research on the volatility behavior of covered-call ETFs remains limited. Ngwaba (2025) conducted a comprehensive forecast of covered call ETF prices; however, to the best of my knowledge, no other study has examined the realized volatility of this asset class. Traditional volatility models have been thoroughly studied on broad market indices and individual stocks, but their effectiveness in the context of option-enhanced covered call ETFs is not well understood.
Results from the study show that the HAR-RV-CARMA hybrid model consistently outperforms both the HAR-RV and CARMA benchmark standalone models in volatility forecasting across all evaluation metrics. These findings will help investors, portfolio managers, and the government manage risk and uncertainty in financial markets and the economy overall.
2. Literature Review
A growing number of studies have explored volatility forecasting using time-series, machine learning, deep learning, and hybrid models. The GARCH model plays a crucial role in volatility prediction by offering a robust and interpretable framework for modeling time-varying volatility and volatility clustering (Engle, 1982; Bollerslev, 1986). Gunnarson et al. (2024) conducted a comprehensive literature review examining studies that predict realized and implied volatility indices using artificial intelligence and machine learning. The study found that memory-based neural networks, such as LSTM and GRU, consistently rank among the top-performing models for volatility prediction. Hybrid models are increasingly popular among researchers seeking to combine time-series models with ML and DL approaches to achieve better predictive accuracy for realized and implied volatility. Vidal and Kristjanpoller (2020) propose a CNN-LSTM hybrid model to forecast gold volatility. The results demonstrate a significant improvement compared to the GARCH and LSTM models, with a 37% reduction in MSE relative to the classic GARCH model and an 18% reduction compared to the LSTM model. Zolfaghari and Gholami (2021) combine the adaptive wavelet transform (AWT) model with LSTM and HAR-RV to predict stock volatility for two major U.S. stock market indexes, including the Dow Jones Industrial Average (DJIA) and Nasdaq Composite (IXIC). Di Persio et al. (2021) employ a hybrid LSTM-GARCH (1,1) model within a volatility-target investment strategy, reporting improved risk-adjusted returns. Ma et al. (2024) and Song et al. (2023) investigate stock market volatility forecasting that incorporates macroeconomic variables, utilizing hybrid models that merge deep learning models with mixed data sampling (MIDAS).
Brockwell and Lindner (2013) enhance the modeling of spot volatility in financial time series by incorporating CARMA processes into the stochastic volatility framework, building on the foundational work of Barndorff-Nielsen and Shephard (2001). They propose using CARMA processes driven by non-decreasing Lévy processes with non-negative kernels to model spot volatility, offering greater flexibility than the traditional Ornstein-Uhlenbeck (OU) process. CARMA processes allow for a wider range of autocorrelation structures, enabling a more accurate representation of the persistent and complex dependencies commonly observed in realized volatility data. Empirically, the study applies the CARMA-based volatility model to high-frequency Deutsche Mark/US dollar exchange rate data, demonstrating its superior fit compared to the OU-based model. The results highlight the model’s ability to capture key stylized facts of financial volatility—such as volatility clustering and long-range dependence—while remaining mathematically tractable.
Gao et al. (2023) introduce a novel forecasting approach for stock market volatility by modeling upside and downside components separately and then combining their forecasts. This technique, known as the sum-of-the-parts (SOP) method, utilizes realized semi-variance to measure upside and downside volatility, whose sum equals total variance. Using intraday data from the S&P 500 index between 2014 and 2022, the authors applied seven different HAR-type models to forecast both the individual components and total volatility. The study reveals that upside volatility exhibits a longer memory than downside volatility and that leverage effects influence each component differently. These distinctions underscore the benefits of modeling the components independently. To assess forecast accuracy, the study employs both the Diebold-Mariano and Model Confidence Set (MCS) tests. Results consistently show that the SOP method significantly outperforms traditional approaches that forecast total volatility directly. The improvements in forecast accuracy are robust across both individual component models and their combinations. The paper concludes that the SOP method effectively captures the asymmetric influence of various predictors on positive and negative volatility, resulting in more accurate and reliable forecasts.
Zhuo and Morimoto (2024) propose a hybrid model for forecasting realized volatility (RV) by integrating the HAR model with Support Vector Regression (SVR). The HAR model is renowned for capturing volatility persistence through past daily, weekly, and monthly realized volatility, but it struggles to account for nonlinear patterns. In contrast, SVR—a machine learning technique—can model nonlinear relationships effectively, although it requires meticulous parameter tuning. The study introduces two hybrid approaches: a residual-based method, where SVR models the residuals of the HAR model, and a weight-based method, which linearly combines HAR and SVR forecasts using optimized weights determined by genetic algorithms. Utilizing intraday data from the Tokyo Stock Price Index (TOPIX) and selected Japanese equities, the weight-based HAR–SVR model consistently outperforms both the standard HAR model and the residual-type hybrid model. These findings underscore the effectiveness of combining econometric and machine learning approaches for volatility prediction. The study contributes to the literature by showing that automatic optimization techniques can enhance hybrid modeling performance and that the weighted HAR–SVR framework offers significant improvements over traditional HAR models.
Gunnarsson et al. (2024) review studies on the use of artificial intelligence (AI) and machine learning (ML) for forecasting realized and implied volatility. They find that memory-based neural networks—such as LSTM and GRU—as well as tree-based methods often outperform traditional models, although HAR-RV and GARCH remain key benchmarks. Hybrid and ensemble models that combine econometric techniques with ML demonstrate strong performance by capturing both linear persistence and nonlinear dynamics. Most applications focus on the equity and oil markets, primarily in the U.S., with forecast horizons ranging from intraday to monthly. Neural networks tend to perform better in short-term forecasting, while longer horizons benefit from incorporating external predictors. ML models frequently outperform traditional approaches during periods of high volatility and when richer datasets are available. A notable gap in the literature is the limited integration of explainable AI (XAI), despite ongoing concerns about the “black box” nature of ML models. The authors suggest that future research should incorporate XAI and probabilistic ML techniques to improve transparency and better capture forecast uncertainty.
Qiu et al. (2025) present a comprehensive historical review of volatility forecasting methods, tracing their development from classical econometric techniques to contemporary machine learning (ML) approaches. The study categorizes models into four groups: implied volatility (IV), statistical models such as GARCH and its variants, neural network–based methods (including LSTM, GRU, and RNN), and transformer architectures. Each category is evaluated based on its theoretical foundations, strengths, and limitations. Using thirty years of S&P 500 data, the authors benchmark representative models—GARCH (1,1), IV, a two-layer LSTM, and a basic transformer—based on forecasting accuracy metrics such as RMSE and MAE. The results indicate that ML models, particularly LSTM, outperform both traditional econometric and implied volatility models. While transformers show considerable promise, their performance deteriorates when training data is limited or during periods of financial turbulence (e.g., the 2008 financial crisis and the COVID-19 pandemic), highlighting their data-intensive nature. In contrast, LSTM models exhibit greater robustness across both stable and crisis periods.
Michael et al. (2025) present an advanced approach for forecasting daily realized volatility by enhancing the HAR model with additional predictive features derived from historical data and options markets. The study introduces novel techniques for extracting volatility estimators, including dimensionality reduction methods for implied volatility surfaces (IVS) under the Black–Scholes model, and calibration-based estimators under the Heston and Bates models. These methodologies address the high dimensionality and structural complexity inherent in implied volatility data. This paper contributes to the literature by bridging the gap between traditional volatility forecasting models and modern, machine learning–inspired approaches, highlighting the critical role of options data in improving predictive accuracy. Empirical results show that incorporating features from the options market significantly enhances forecast performance, particularly during periods of elevated market volatility. The study further demonstrates the economic relevance of these models through their application to trading strategies involving the VIX Mid-Term Futures ETF (VIXM), underscoring the practical benefits of improved volatility forecasting in real-world financial decision-making.
Zitis et al. (2024) investigate volatility forecasting in the foreign exchange (Forex) market by integrating deep learning models with complexity measures. Using high-frequency EUR/USD data, the study compares LSTM and GRU models against traditional benchmarks, incorporating complexity metrics such as entropy and fractal dimension as additional predictors. The results show that deep learning models augmented with complexity features outperform both conventional econometric models and their own unenhanced versions, particularly in capturing nonlinear dynamics and short-term volatility clustering. These findings underscore the value of combining data-driven neural networks with complexity science for volatility prediction in highly liquid markets like Forex. However, a notable limitation is that the models are trained on static samples and lack mechanisms for adapting to structural shifts or regime changes in the Forex market. The authors suggest that future research could address this gap by incorporating adaptive or regime-switching techniques to improve model responsiveness to evolving market conditions.
Christensen et al. (2023) evaluate the performance of various ML methods, such as regularized linear models, tree-based models, and neural networks, against benchmark HAR models in forecasting the realized variance of Dow Jones Industrial Average (DJIA) components. Utilizing high-frequency data, the study finds that even with minimal hyperparameter tuning, ML models consistently outperform HAR-type models, particularly over longer forecast horizons where persistence and nonlinearities play a more prominent role. ML techniques also demonstrate superior ability to extract predictive value from a range of covariates, including implied volatility, earnings announcements, macroeconomic indicators, and market sentiment. Among the ML approaches, neural networks and regularized models yield significant improvements in out-of-sample forecasting accuracy, with statistical validation provided by Diebold–Mariano tests. Importantly, the study highlights the economic relevance of these improvements through their application in VaR forecasting.
3. Data and Estimation
3.1. Data
The study uses daily historical time series data for five covered call ETFs. Table 1 shows details about the assets adopted in this study.
Table 1 provides a summary of the covered call ETFs analyzed in this study, detailing their issuer, expense ratio, assets under management (AUM), and inception date. Each ETF follows a variation of the covered call strategy, typically involving the sale of index-based call options to generate income.
QYLD employs a covered call strategy on the Nasdaq-100 Index, selling at-the-money (ATM) call options to generate monthly income from its underlying holdings. It targets income-focused investors seeking high distributions, though with limited capital appreciation due to capped upside potential. QYLD was launched on 12/12/2013, has an expense ratio of 0.61%, and manages $8.19 billion in assets.
XYLD follows a similar strategy on the S&P 500 Index, selling ATM call options to provide steady monthly income while maintaining exposure to large-cap U.S. equities. It was launched on 06/24/2013, has an expense ratio of 0.60%, and manages $3.1 billion in assets.
JEPI adopts a more active approach by combining low-volatility U.S. large-cap stocks with an options overlay. It writes out-of-the-money (OTM) calls on the S&P 500 via equity-linked notes, aiming to generate income while allowing modest capital appreciation. JEPI was launched on 05/20/2020, with an expense ratio of 0.35% and $41.16 billion in AUM.
JEPQ applies a similar strategy to JEPI on the Nasdaq-100, blending growth-oriented technology stocks with an OTM options overlay. It aims to provide higher yields while maintaining exposure to the technology sector. Launched on 05/03/2022, JEPQ has an expense ratio of 0.35% and manages $29.94 billion in assets.
RYLD utilizes a covered call strategy on the Russell 2000 Index, targeting small-cap U.S. stocks. It generates high income through ATM option sales but is subject to higher volatility compared to large-cap strategies. RYLD was introduced on 04/17/2019, has an expense ratio of 0.60%, and manages $1.26 billion in assets. (Source: etf.com)
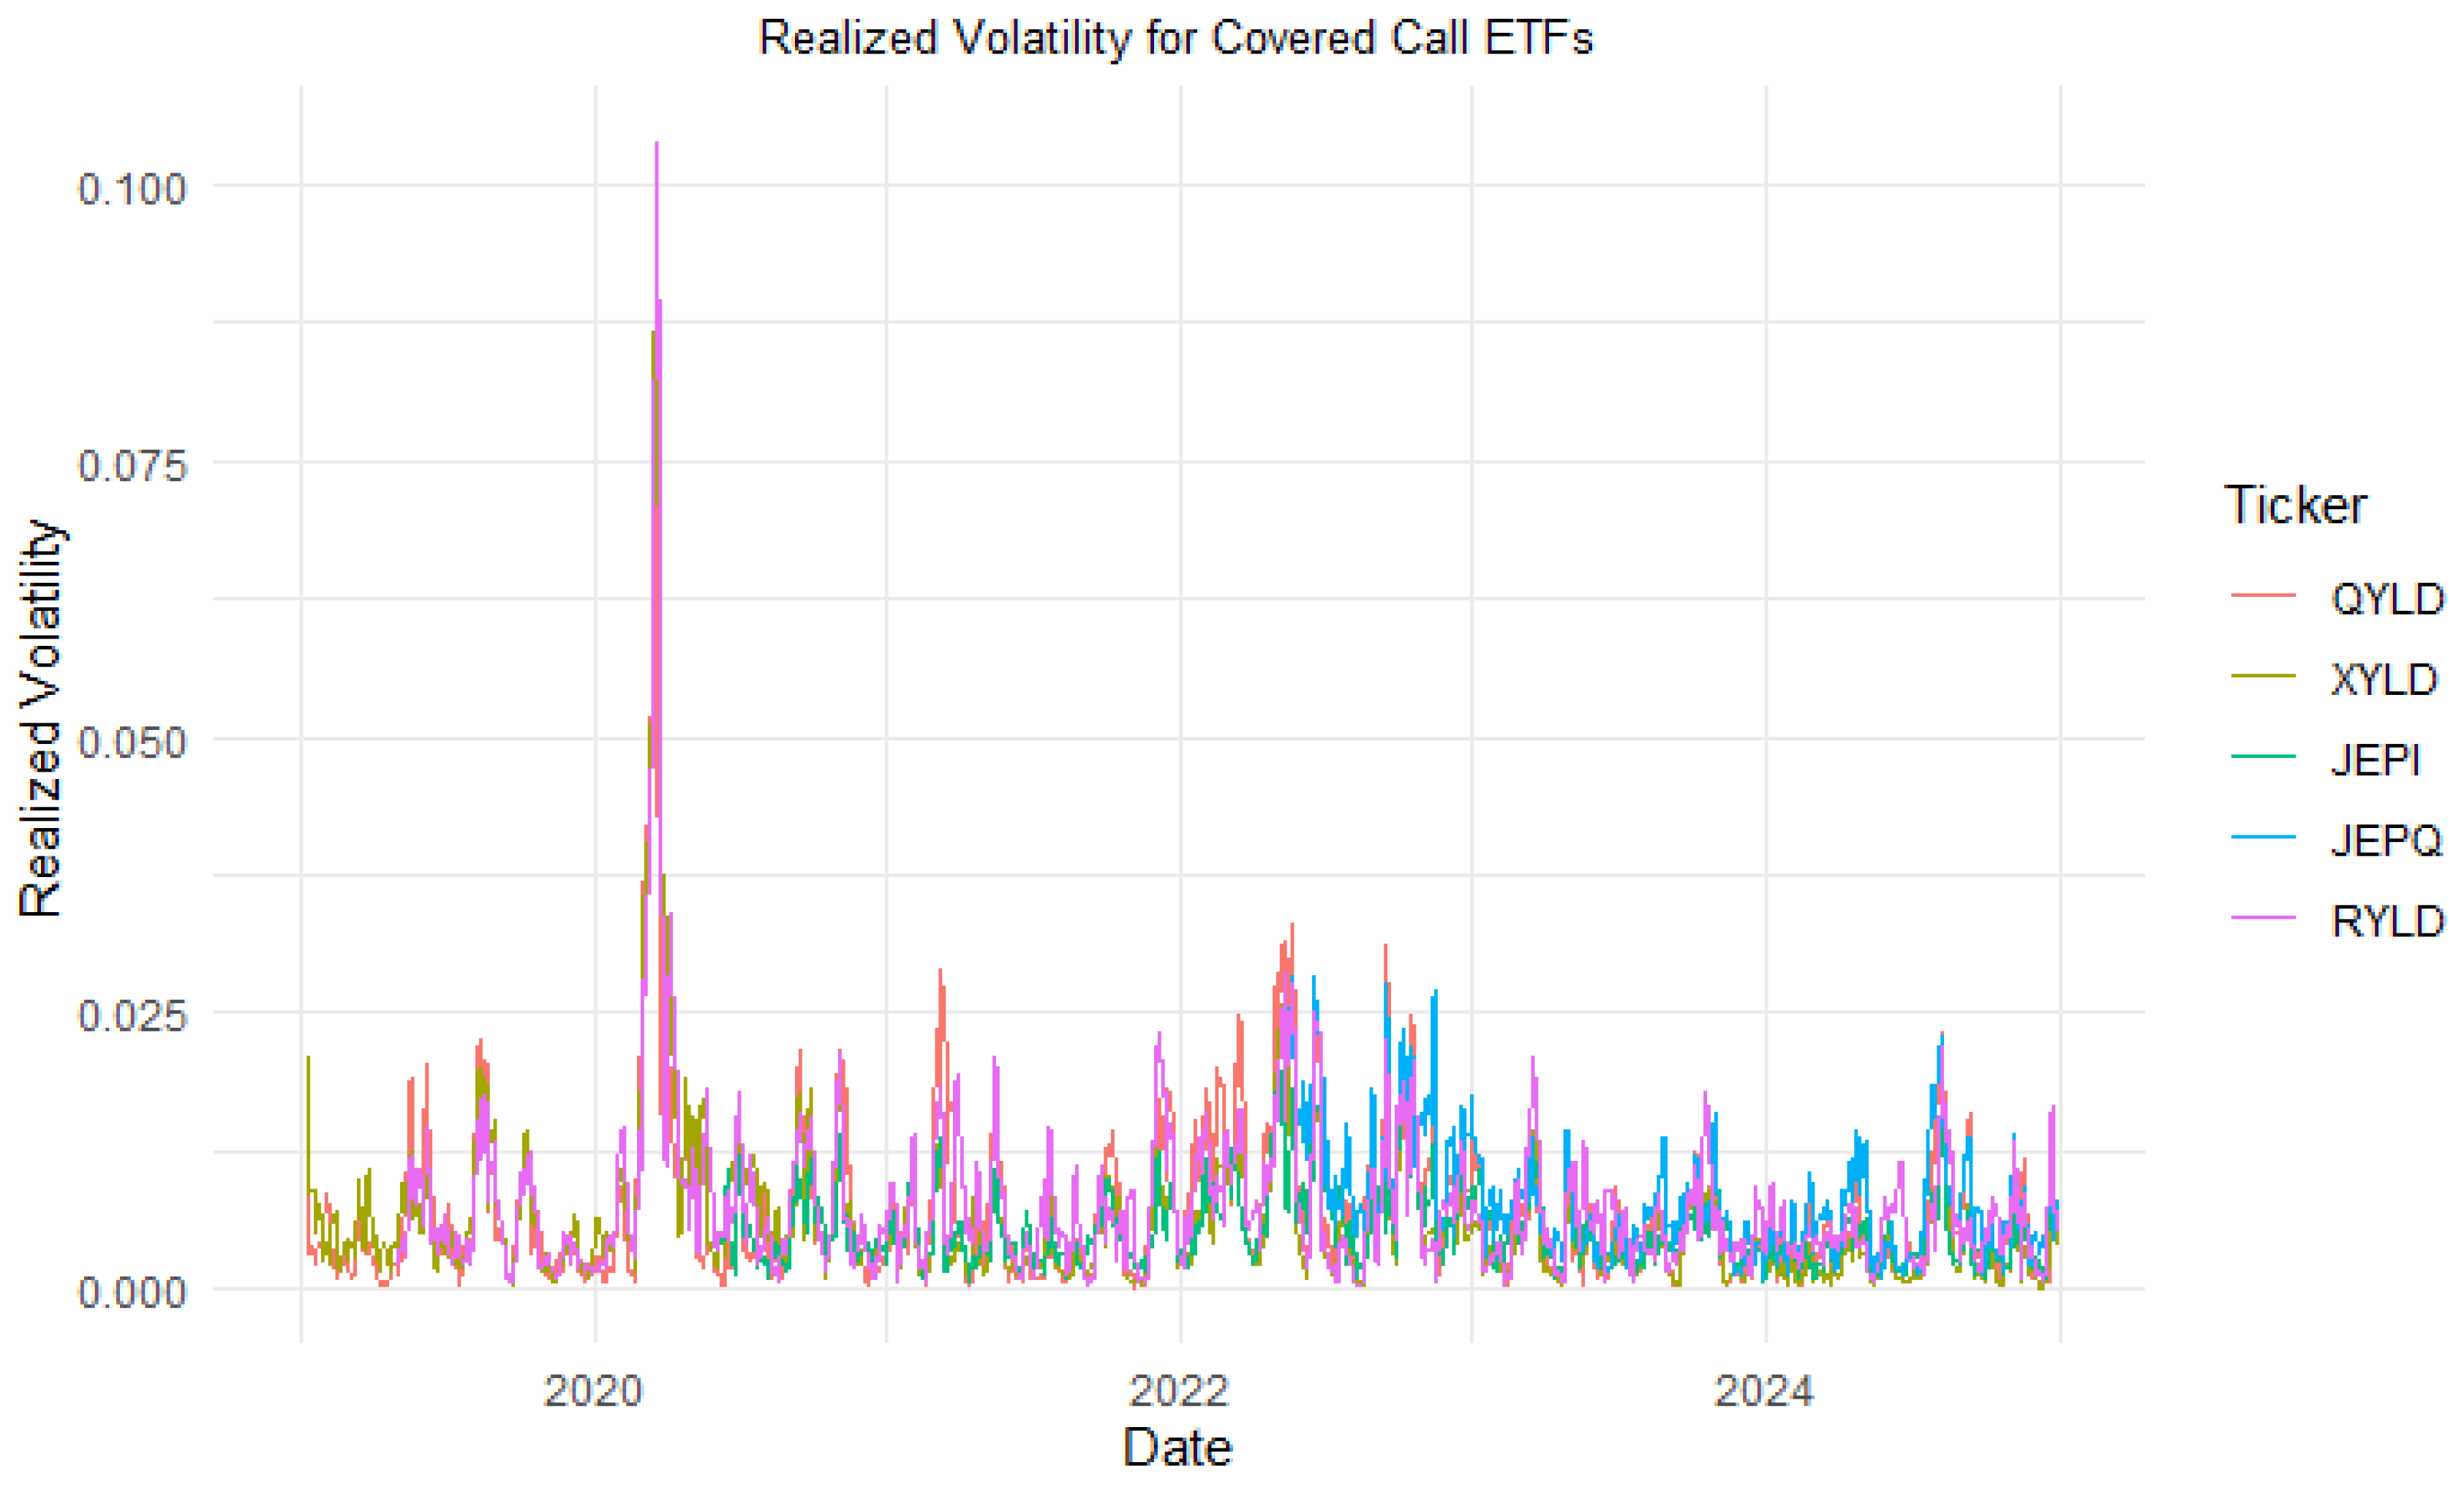
Table 2 reports the summary statistics for the daily realized volatility of the covered call ETFs used in the study. The daily covered call ETF prices (QYLD, XYLD, JEPI, JEPQ and RYLD) were obtained from Yahoo Finance for the period January 2019 to December 2024. This time frame was chosen to capture a range of high-volatility market conditions, including the COVID-19 market crash, interest rate hikes, quantitative tightening by the Federal Reserve, and significant geopolitical events. Realized volatility is computed as the annualized standard deviation of log returns over a 21-day rolling window, corresponding to approximately one trading month. The training set spans from January 2019 to December 2023, while the test set covers January to December 2024.
JEPI reports the lowest average volatility (mean = 0.1013), while JEPQ records the highest (mean = 0.1549). All volatility series are right-skewed and exhibit excess kurtosis, with particularly pronounced kurtosis values in XYLD and RYLD (kurtosis > 28), indicating heavy-tailed distributions and frequent large shocks. Although JEPI and JEPQ display distributions closer to normality, they still deviate from Gaussian behavior. In all cases, maximum volatility values substantially exceed their corresponding means, reflecting the presence of volatility clustering. The Jarque–Bera test strongly rejects the null hypothesis of normality for all ETFs, confirming their non-Gaussian characteristics. The Augmented Dickey–Fuller (ADF) test indicates stationarity at the 1% significance level for four out of the five series, with JEPQ presenting weaker evidence of stationarity. These statistical properties are consistent with well-established stylized facts of financial volatility and support the use of advanced econometric models capable of capturing persistence, asymmetry, and fat-tailed behavior.
Figure 1.
Realized volatility for Covered Call ETFs.
3.3. Forecasting Model
3.3.1. Heterogeneous Autoregressive Model for Realized Volatility (HAR-RV)
The HAR-RV model has emerged as the benchmark in the financial econometrics literature as a realized volatility forecast measure. The model can be expressed as follows:
represents the lagged daily volatility. , represents the weekly volatility. represents the monthly volatility. is the error term. The HAR-RV model is a time-series analysis framework tailored to capture dependencies across different time scales, which is especially useful in financial markets. Originally created for modeling realized volatility, it has been extended to address a range of other problems (Corsi, 2009).
3.3.2. Continuous-time Autoregressive Moving Average (CARMA)
To model high-frequency noise and mean-reverting behavior that HAR-RV does not capture, we include the CARMA model, known for its effectiveness in representing continuous-time volatility, particularly in financial data. The model can be expressed as follows:
Where is the latent state process, is the Brownian motion, A, B, and C are model parameters, is the spot volatility, and is the white noise. is the spot volatility; however, this study looks at realized volatility. To obtain our realized volatility at time , we take the integral of the spot volatility from time to .
Equation (4) is the realized volatility for the CARMA model, which is essential for representing stochastic processes that develop continuously over time.
Unlike ARMA models, which operate on data collected at fixed intervals, CARMA models provide a more natural framework for capturing dynamics in fields such as finance, engineering, and environmental science, where processes evolve continuously rather than in discrete steps. These models are especially valuable because many real-world phenomena are inherently continuous, and discrete-time observations merely approximate this ongoing evolution (Brockwell, 2004).
3.3.2. The HAR-RV-CARMA Hybrid model
This study adopts a state-space approach to optimally combine forecasts from the HAR-RV and CARMA models using the Kalman filter. The Kalman filter for adaptive model combination can be expressed as follows:
Where are the weights at time , and respectively, captures measurement uncertainty, and is the state transition variance controlling the weight flexibility. Hence, the proposed hybrid model can be expressed as follows:
Where represents the hybrid realized volatility (HAR-RV-CARMA). and are the Kalman-updated weights at time t. represents the error term.
This method enables time-varying weights to be assigned to each component based on its predictive reliability. This framework dynamically allocates optimal weights to each model’s predictions with the goal of improving forecast accuracy over time.
3.3. Assessment Indicators
This study evaluates the models' performance using a range of widely accepted statistical indicators: Mean Absolute Error (MAE), Root Mean Square Error (RMSE), Quasi-likelihood (QLIKE), Akaike Information Criterion (AIC), and Bayesian Information Criterion (BIC).
MAE estimates discrepancies between predicted and actual values, offering a direct yet effective measure of prediction accuracy.
RMSE highlights larger errors by squaring the differences before averaging and taking the square root, making it particularly sensitive to extreme deviations.
QLIKE is a volatility-specific accuracy measure that penalizes both under- and over-prediction of conditional variance, making it particularly suitable for evaluating volatility forecasts.
AIC and BIC serve as model selection tools that balance goodness-of-fit with model complexity. Both penalize models with excessive parameters, but BIC applies a stricter penalty, favoring simpler models even more.
To ensure robustness, the study includes additional tests such as the directional accuracy test and the Diebold-Mariano test.
The directional accuracy test evaluates whether a model correctly predicts the sign of changes in volatility, thereby assessing its ability to capture market dynamics.
Finally, the study employs the predictive accuracy test proposed by Diebold and Mariano (1995) to evaluate the statistical significance of improvements in forecast accuracy. The Diebold–Mariano test compares the predictive performance of two competing models by analyzing the differences in their forecast errors, determining whether these differences are statistically significant.
Together, these metrics provide a comprehensive framework for assessing predictive accuracy and model efficiency, enabling robust and well-informed conclusions about the relative performance of the models in the study.
4. Results
Table 3 provides the out-of-sample forecast results for the hybrid model (HAR-RV-CARMA) and the standalone models HAR-RV and CARMA.
Results reveal that the HAR-RV-CARMA model consistently outperforms the benchmark standalone HAR-RV and CARMA. For all five covered call ETFs, the HAR-RV-CARMA hybrid yields the lowest MAE values. The hybrid (HAR-RV-CARMA) MAE for QYLD is 0.0576 compared to 0.1241 for the HAR-RV model and 1.0174 for the CARMA model. The hybrid (HAR-RV-CARMA) MAE for XYLD is 0.029 compared to 0.0878 for the HAR-RV model and 1.0101 for the CARMA model. Similarly, the hybrid (HAR-RV-CARMA) MAE for JEPQ is 0.0717 compared to 0.1294 for the HAR-RV model and 1.0428 for the CARMA model. Furthermore, the hybrid (HAR-RV-CARMA) MAE for JEPI is 0.0424 compared to 0.0804 for the HAR-RV model and 1.0207 for the CARMA model. Finally, the hybrid (HAR-RV-CARMA) MAE for RYLD is 0.063 compared to 0.1134 for the HAR-RV model and 1.0401 for the CARMA model.
For all five covered call ETFs, the HAR-RV-CARMA hybrid yields the lowest RMSE values. The hybrid (HAR-RV-CARMA) MAE for QYLD is 0.15 compared to 0.2002 for the HAR-RV model and 1.0163 for the CARMA model. Similarly, the hybrid (HAR-RV-CARMA) RMSE for XYLD is 0.0926 compared to 0.1431 for the HAR-RV model and 1.0104 for the CARMA model. Furthermore, the hybrid (HAR-RV-CARMA) RMSE for JEPQ is 0.147 compared to 0.2109 for the HAR-RV model and 1.0413 for the CARMA model. The hybrid (HAR-RV-CARMA) RMSE for JEPI is 0.1032 compared to 0.1425 for the HAR-RV model and 1.0196 for the CARMA model. Finally, the hybrid (HAR-RV-CARMA) RMSE for RYLD is 0.1473 compared to 0.1685 for the HAR-RV model and 1.0415 for the CARMA model.
QLIKE is especially useful for volatility modeling because it penalizes under-predicting volatility. In this case, the HAR-RV-CARMA model shows lower QLIKE values compared to both benchmarks. For example, in the XYLD forecast, QLIKE improves from -2.7361 (HAR-RV) and 0.0104 (CARMA) to -5.2759 for the hybrid model. For QYLD, QLIKE improves from -2.5363 (HAR-RV) and 0.0162 (CARMA) to -4.5214 for the hybrid model. For JEPQ, QLIKE improves from -2.706 (HAR-RV) and 0.0405 (CARMA) to -3.7309 for the hybrid model. Similarly, for JEPI, QLIKE improves from -3.0687 (HAR-RV) and 0.0194 (CARMA) to -4.0855 for the hybrid model. Finally, for RYLD, QLIKE improves from -2.5017 (HAR-RV) and 0.0407 (CARMA) to -3.8809 for the hybrid model. These results confirm that the proposed hybrid model provides a much closer match to the realized volatility distribution, reducing the penalty linked to inaccurate volatility variance forecasts.
The AIC and BIC scores indicate that the model provides a better fit relative to its complexity. The HAR-RV-CARMA model consistently outperforms the benchmark models, as shown by its lower AIC and BIC values compared to the HAR-RV and CARMA models. For QYLD, the AIC and BIC values for the hybrid model are -948.235 and -941.184, respectively, compared to -799.41 and -785.308 (HAR-RV) and 12.122 and 19.173 (CARMA). This pattern is consistent across other tickers (XYLD, JEPQ, JEPI, and RYLD).
Directional accuracy measures whether the models correctly predict the direction of volatility changes. Sometimes, accurately forecasting the direction of an asset helps investors and stakeholders make better decisions. Results in Table 4 show differences among the three models. The CARMA model has a directional accuracy of 48.8% for QYLD, 44.8% (XYLD), 49.6% (JEPQ), 47.2% (JEPI), and 48.4% for RYLD. The HAR-RV model shows notable improvement, with 64.84% for QYLD, 71.6% (XYLD), 72.4% (JEPQ), 74% (JEPI), and 67.6% for RYLD. However, the hybrid model consistently outperforms both standalone benchmark models. The HAR-RV-CARMA model achieves a directional accuracy of 89.2% for QYLD, 91.2% (XYLD), 92.8% (JEPQ), 90.4% (JEPI), and 88.4% for RYLD (refer to Figure 2 for visualization). These improvements show the hybrid’s stronger ability to capture changes in volatility regimes, which is very useful for risk management and decision-making.
To evaluate the predictive performance of different forecasting models, the study uses the Diebold-Mariano test, which determines whether there is a statistically significant difference in forecast accuracy between two competing models based on their errors. Table 5 displays the results of the Diebold-Mariano test. The Diebold-Mariano statistics show the size and direction of accuracy differences, while the p-value indicates statistical significance. The results reveal significant differences in forecast accuracy among the models. The HAR-RV model outperforms the CARMA model and is significantly different at a 1% significance level (p < 0.01). The HAR-RV-CARMA model outperforms the HAR-RV model and is significantly different at a 5% significance level (p < 0.05). Similarly, the HAR-RV-CARMA model outperforms the CARMA models and is significantly different at a 1% significance level (p < 0.01). The Diebold-Mariano test results are consistent with other tests conducted in the study.
For visualization purposes, realized volatility is plotted on a logarithmic scale to mitigate the effects of extreme spikes and heteroskedasticity. This transformation compresses large values and stretches smaller ones, enabling a clearer view of time-series dynamics, volatility clustering, and relative differences across models. Figure 2 shows the log-scaled realized volatility for the HAR-RV-CARMA model, actual versus predicted volatility measured for the covered call ETFs for the test period 1 January 2024 to 31 December 2024. This is consistent with the directional accuracy test that reports 89.2% for QYLD, 91.2% (XYLD), 92.8% (JEPQ), 90.4% (JEPI), and 88.4% for RYLD.
5. Discussion
Overall, this study makes several significant contributions. First, it introduces covered call ETFs into the volatility forecasting literature, an area in which they have been underrepresented despite their growing economic relevance. Second, it proposes a novel hybrid forecasting model that combines the HAR-RV model with continuous-time dynamics via a CARMA process, creating a framework well-suited to the distinctive behavior of option-enhanced financial assets. Third, the study employs a Kalman filter–based dynamic weighting system to integrate discrete-time and continuous-time volatility models.
The successful implementation of the HAR-RV–CARMA model with Kalman filter dynamic weighting opens avenues for future research, including its extension to other asset classes and its application to implied volatility forecasting. Empirical findings show that the HAR-RV–CARMA model consistently outperforms both the benchmark HAR-RV and CARMA models. These results contribute to the expanding literature on hybrid models for volatility forecasting (Kristjanpoller & Minutolo, 2018; Loung & Dokuchaev, 2018; Liu et al., 2018; Zahid et al., 2022). The proposed hybrid framework offers a more responsive tool for risk management, portfolio volatility prediction, and derivative pricing involving option overlays. Its adaptive Kalman filter allows the model to adjust as volatility regimes evolve, making it particularly effective during periods of market uncertainty.
The results are broadly consistent with related studies. For example, Loung and Dokuchaev (2018) incorporate purified implied volatility as an additional predictor in the HAR-RV model and utilize random forest algorithms to enhance predictive accuracy. Audrino and Chassot (2024) show that a well-calibrated HAR model with carefully selected training and re-estimation windows can outperform machine learning models in realized volatility forecasting. Similarly, Skintzi and Fameliiti (2025) develop a methodology for combining realized volatility estimators using time-varying weights based on economic performance criteria. Results improve predictive accuracy, particularly during high-volatility periods.
Future research may build on this work by incorporating high-frequency order book data or transaction-level information to refine the realized volatility estimates further. Moreover, applying deep learning techniques such as neural network models could enhance the model's ability to learn latent volatility regimes or adapt to changing dynamics more efficiently.
6. Conclusions
Forecasting volatility is an essential part of managing risk for investors, institutions, and policymakers alike. Accurately predicting financial market volatility has become necessary for researchers and practitioners. Understanding how volatility evolves over time is crucial for optimizing a portfolio, pricing derivatives, or preparing for turbulent markets. However, forecasting volatility remains a significant challenge due to the nonlinear, irregular behavior of financial markets and the latent nature of volatility, which cannot be directly observed but must instead be inferred from observable data.
This study introduces the HAR-RV-CARMA hybrid model, combining the HAR-RV and the CARMA model. Its main innovation is a Kalman filter-based dynamic weighting mechanism that integrates both models, harnessing the strengths of discrete and continuous-time approaches. This hybrid model enhances volatility forecasting, offering a more accurate and robust approach. The model is applied to daily realized volatility data from five major covered call ETFs—QYLD, XYLD, JEPI, JEPQ, and RYLD—covering the period from 2019 to 2024. This time frame captures diverse market conditions.
Empirical results show that the proposed hybrid model consistently outperforms the standalone models across various statistical measures, including RMSE, MAE, QLIKE, AIC, and BIC. Additional tests, like Diebold–Mariano and directional accuracy, confirm the hybrid model's superior predictive performance. What makes this approach especially compelling is the Kalman filter’s ability to assign time-varying weights to the HAR and CARMA components, helping the model remain flexible and responsive to shifting volatility regimes. These results emphasize the benefits of integrating discrete-time and continuous-time volatility models within a state-space framework, providing researchers and practitioners with a powerful, flexible tool for volatility modeling. Besides advancing volatility forecasting literature, the model offers a practical, data-driven tool for risk managers, portfolio strategists, and derivatives traders who need forecasts that adapt in real time.
Future research could examine several extensions to this study. For example, the HAR-RV-CARMA model could be compared with advanced machine learning models like LSTM, GRU, and other AI-based methods to evaluate its performance. Additionally, applying this approach to forecast implied volatility could offer further insights into its usefulness in options pricing and other forward-looking financial analyses. These extensions would not only improve the model's utility but also contribute to the broader field of volatility modeling and prediction.
The HAR-RV-CARMA hybrid model represents a significant advancement in volatility forecasting, offering valuable theoretical insights and practical advantages for financial econometrics. Its improved accuracy and versatility make it an effective method for addressing the challenges of predicting volatility in the constantly evolving and unpredictable financial markets.
Funding
This research received no external funding.
Data Availability Statement
Data is publicly available
Conflicts of Interest
The authors declare no conflict of interest.
References
- Aït-Sahalia, Y., Li, C., & Li, C. X. Implied stochastic volatility models. The Review of Financial Studies 2021, 34(1), 394-450.
- Andersen, T. G., Bollerslev, T., Diebold, F. X., & Labys, P. Modeling and forecasting realized volatility. Econometrica 2003, 71(2), 579-625. [CrossRef]
- Audrino, F., & Chassot, J. (2024). HARd to Beat: The Overlooked Impact of Rolling Windows in the Era of Machine Learning. arXiv preprint arXiv:2406.08041. [CrossRef]
- Bayer, S. Combining value-at-risk forecasts using penalized quantile regressions. Econometrics and statistics 2018, 8, 56-77. [CrossRef]
- Bollerslev, T. Generalized autoregressive conditional heteroskedasticity. Journal of Econometrics 1986, 31(3), 307-327. [CrossRef]
- Bollerslev, T., Patton, A. J., & Quaedvlieg, R. Exploiting the errors: A simple approach for improved volatility forecasting. Journal of Econometrics 2016, 192(1), 1-18. [CrossRef]
- Barndorff-Nielsen, O. E., & Shephard, N. Non-Gaussian Ornstein–Uhlenbeck-based models and some of their uses in financial economics. Journal of the Royal Statistical Society: Series B (Statistical Methodology) 2001, 63(2), 167-241. [CrossRef]
- Brockwell, P. J. Continuous-time ARMA processes. Handbook of statistics 2001, 19, 249-276.
- Brockwell, P. J. Representations of continuous-time ARMA processes. Journal of Applied Probability 2004, 41(A), 375-382. [CrossRef]
- Brockwell, P. J. Recent results in the theory and applications of CARMA processes. Annals of the Institute of Statistical Mathematics 2014, 66, 647-685. [CrossRef]
- Brockwell, P., & Lindner, A. Integration of CARMA processes and spot volatility modelling. Journal of Time Series Analysis 2013, 34(2), 156-167. [CrossRef]
- Christensen, K., Siggaard, M., & Veliyev, B. A machine learning approach to volatility forecasting. Journal of Financial Econometrics 2023, 21(5), 1680-1727. [CrossRef]
- Corsi, F. A simple approximate long-memory model of realized volatility. Journal of Financial Econometrics 2009, 7(2), 174-196. [CrossRef]
- Dutta, A., & Das, D. Forecasting realized volatility: New evidence from time-varying jumps in VIX. Journal of Futures Markets 2022, 42(12), 2165-2189. [CrossRef]
- Diebold, F. X., & Mariano, R. S. Comparing predictive accuracy. Journal of Business and Economic Statistics 1995, 13(3), 253-263. [CrossRef]
- Di Persio, L., Garbelli, M., & Wallbaum, K. Forward-looking volatility estimation for risk-managed investment strategies during the covid-19 crisis. Risks 2021, 9(2), 33. [CrossRef]
- Engle, R. F. Autoregressive conditional heteroscedasticity with estimates of the variance of United Kingdom inflation. Econometrica: Journal of the econometric society 1982, 987-1007. [CrossRef]
- Gao, S., Zhang, Z., Wang, Y., & Zhang, Y. Forecasting stock market volatility: The sum of the parts is more than the whole. Finance Research Letters 2023, 55, 103849. [CrossRef]
- Gunnarsson, E. S., Isern, H. R., Kaloudis, A., Risstad, M., Vigdel, B., & Westgaard, S. Prediction of realized volatility and implied volatility indices using AI and machine learning: A review. International review of financial analysis 2024, 93, 103221. [CrossRef]
- Heo, W., & Kim, E. Smoothing the Subjective Financial Risk Tolerance: Volatility and Market Implications. Mathematics 2025, 13(4), 1-34. [CrossRef]
- Jiao, Y., Guo, S., & Liu, Q. (2024). Implied volatility modeling and forecasting: evidence from China. China Finance Review International. [CrossRef]
- Khashei, M., & Mahdavi Sharif, B. A Kalman filter-based hybridization model of statistical and intelligent approaches for exchange rate forecasting. Journal of Modelling in Management 2021, 16(2), 579-601. [CrossRef]
- Korkusuz, B., Kambouroudis, D., & McMillan, D. G. Do extreme range estimators improve realized volatility forecasts? Evidence from G7 stock markets. Finance Research Letters 2023, 55, 103992. [CrossRef]
- Kristjanpoller, W., & Minutolo, M. C. A hybrid volatility forecasting framework integrating GARCH, artificial neural network, technical analysis and principal components analysis. Expert Systems with Applications 2018, 109, 1-11. [CrossRef]
- Lin, Y., Lin, Z., Liao, Y., Li, Y., Xu, J., & Yan, Y. Forecasting the realized volatility of stock price index: A hybrid model integrating CEEMDAN and LSTM. Expert Systems with Applications 2022, 206, 117736. [CrossRef]
- Liu, F., Pantelous, A. A., & von Mettenheim, H. J. Forecasting and trading high frequency volatility on large indices. Quantitative Finance 2018, 18(5), 737-748. [CrossRef]
- Luong, C., & Dokuchaev, N. Forecasting of realised volatility with the random forests algorithm. Journal of Risk and Financial Management 2018, 11(4), 61. [CrossRef]
- Ma, W., Hong, Y., & Song, Y. On stock volatility forecasting under mixed-frequency data based on hybrid RR-MIDAS and CNN-LSTM models. Mathematics 2024, 12(10), 1538. [CrossRef]
- Michael, N., Cucuringu, M., & Howison, S. Options-driven volatility forecasting. Quantitative Finance 2025, 25(3), 443-470. [CrossRef]
- Ngwaba, C. A. Forecasting Covered Call Exchange-Traded Funds (ETFs) Using Time Series, Machine Learning, and Deep Learning Models. Journal of Risk and Financial Management 2025, 18(3), 120. [CrossRef]
- Peng, S., Yang, S., & Yao, J. Improving value-at-risk prediction under model uncertainty. Journal of Financial Econometrics 2023, 21(1), 228-259. [CrossRef]
- Psaradellis, I., & Sermpinis, G. Modelling and trading the US implied volatility indices. Evidence from the VIX, VXN and VXD indices. International Journal of Forecasting 2016, 32(4), 1268-1283. [CrossRef]
- Qiu, Y., Zhang, X., Xie, T., & Zhao, S. Versatile HAR model for realized volatility: A least square model averaging perspective. Journal of Management Science and Engineering 2019, 4(1), 55-73. [CrossRef]
- Qiu, Z., Kownatzki, C., Scalzo, F., & Cha, E. S. Historical Perspectives in Volatility Forecasting Methods with Machine Learning. Risks 2025, 13(5), 98. [CrossRef]
- Skintzi, V., & Fameliti, S. P. Combining realized volatility estimators based on economic performance. Journal of Asset Management 2025, 1-28. [CrossRef]
- Song, Y., Tang, X., Wang, H., & Ma, Z. Volatility forecasting for stock market incorporating macroeconomic variables based on GARCH-MIDAS and deep learning models. Journal of Forecasting 2023, 42(1), 51-59. [CrossRef]
- Vidal, A., & Kristjanpoller, W. Gold volatility prediction using a CNN-LSTM approach. Expert Systems with Applications 2020, 157, 113481. [CrossRef]
- Vrontos, S. D., Galakis, J., & Vrontos, I. D. Implied volatility directional forecasting: a machine learning approach. Quantitative Finance 2021, 21(10), 1687-1706. [CrossRef]
- Wells, C. (1995). The Kalman Filter in Finance (Vol. 32). Springer Science & Business Media.
- Wilms, I., Rombouts, J., & Croux, C. Multivariate volatility forecasts for stock market indices. International Journal of Forecasting 2021, 37(2), 484-499. [CrossRef]
- Zahid, M., Iqbal, F., & Koutmos, D. Forecasting Bitcoin volatility using hybrid GARCH models with machine learning. Risks 2022, 10(12), 237. [CrossRef]
- Zhuang, Q. (2018). Application of Kalman filtering in dynamic prediction for corporate financial distress. Kalman Filters-Theory for Advanced Applications. [CrossRef]
- Zhuo, Y., & Morimoto, T. A hybrid model for forecasting realized volatility based on heterogeneous autoregressive model and support vector regression. Risks 2024, 12(1), 12. [CrossRef]
- Zitis, P. I., Potirakis, S. M., & Alexandridis, A. Forecasting forex market volatility using deep learning models and complexity measures. Journal of Risk and Financial Management 2024, 17(12), 557. [CrossRef]
- Zolfaghari, M., & Gholami, S. A hybrid approach of adaptive wavelet transform, long short-term memory and ARIMA-GARCH family models for the stock index prediction. Expert Systems with Applications 2021, 182, 115149. [CrossRef]
Figure 2.
Forecast model comparison of the actual and predicted values (HAR-RV-CARMA).
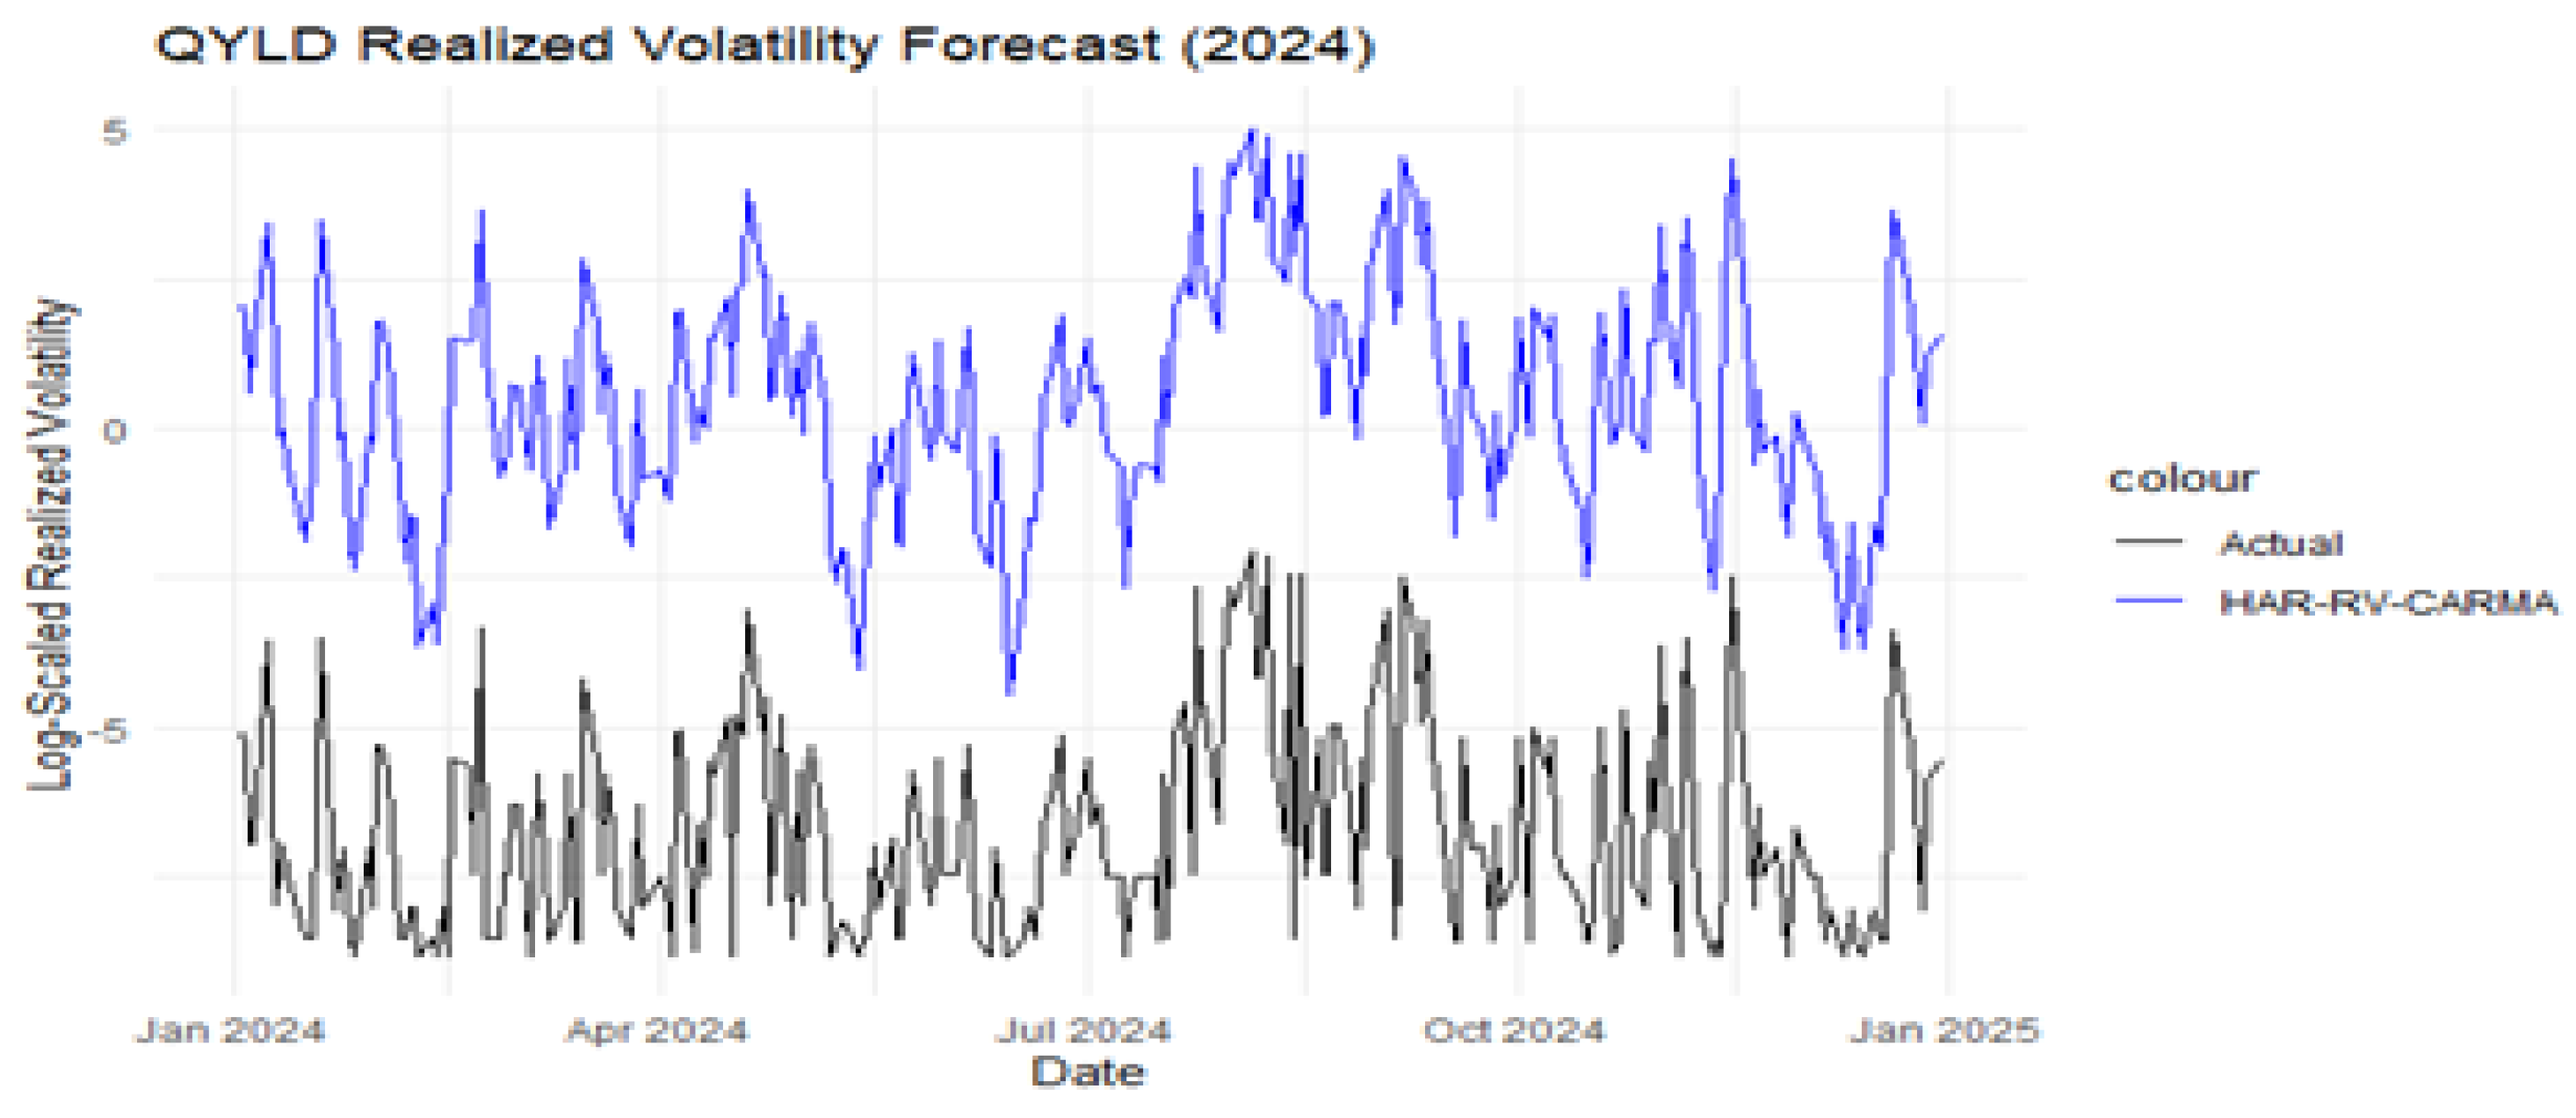
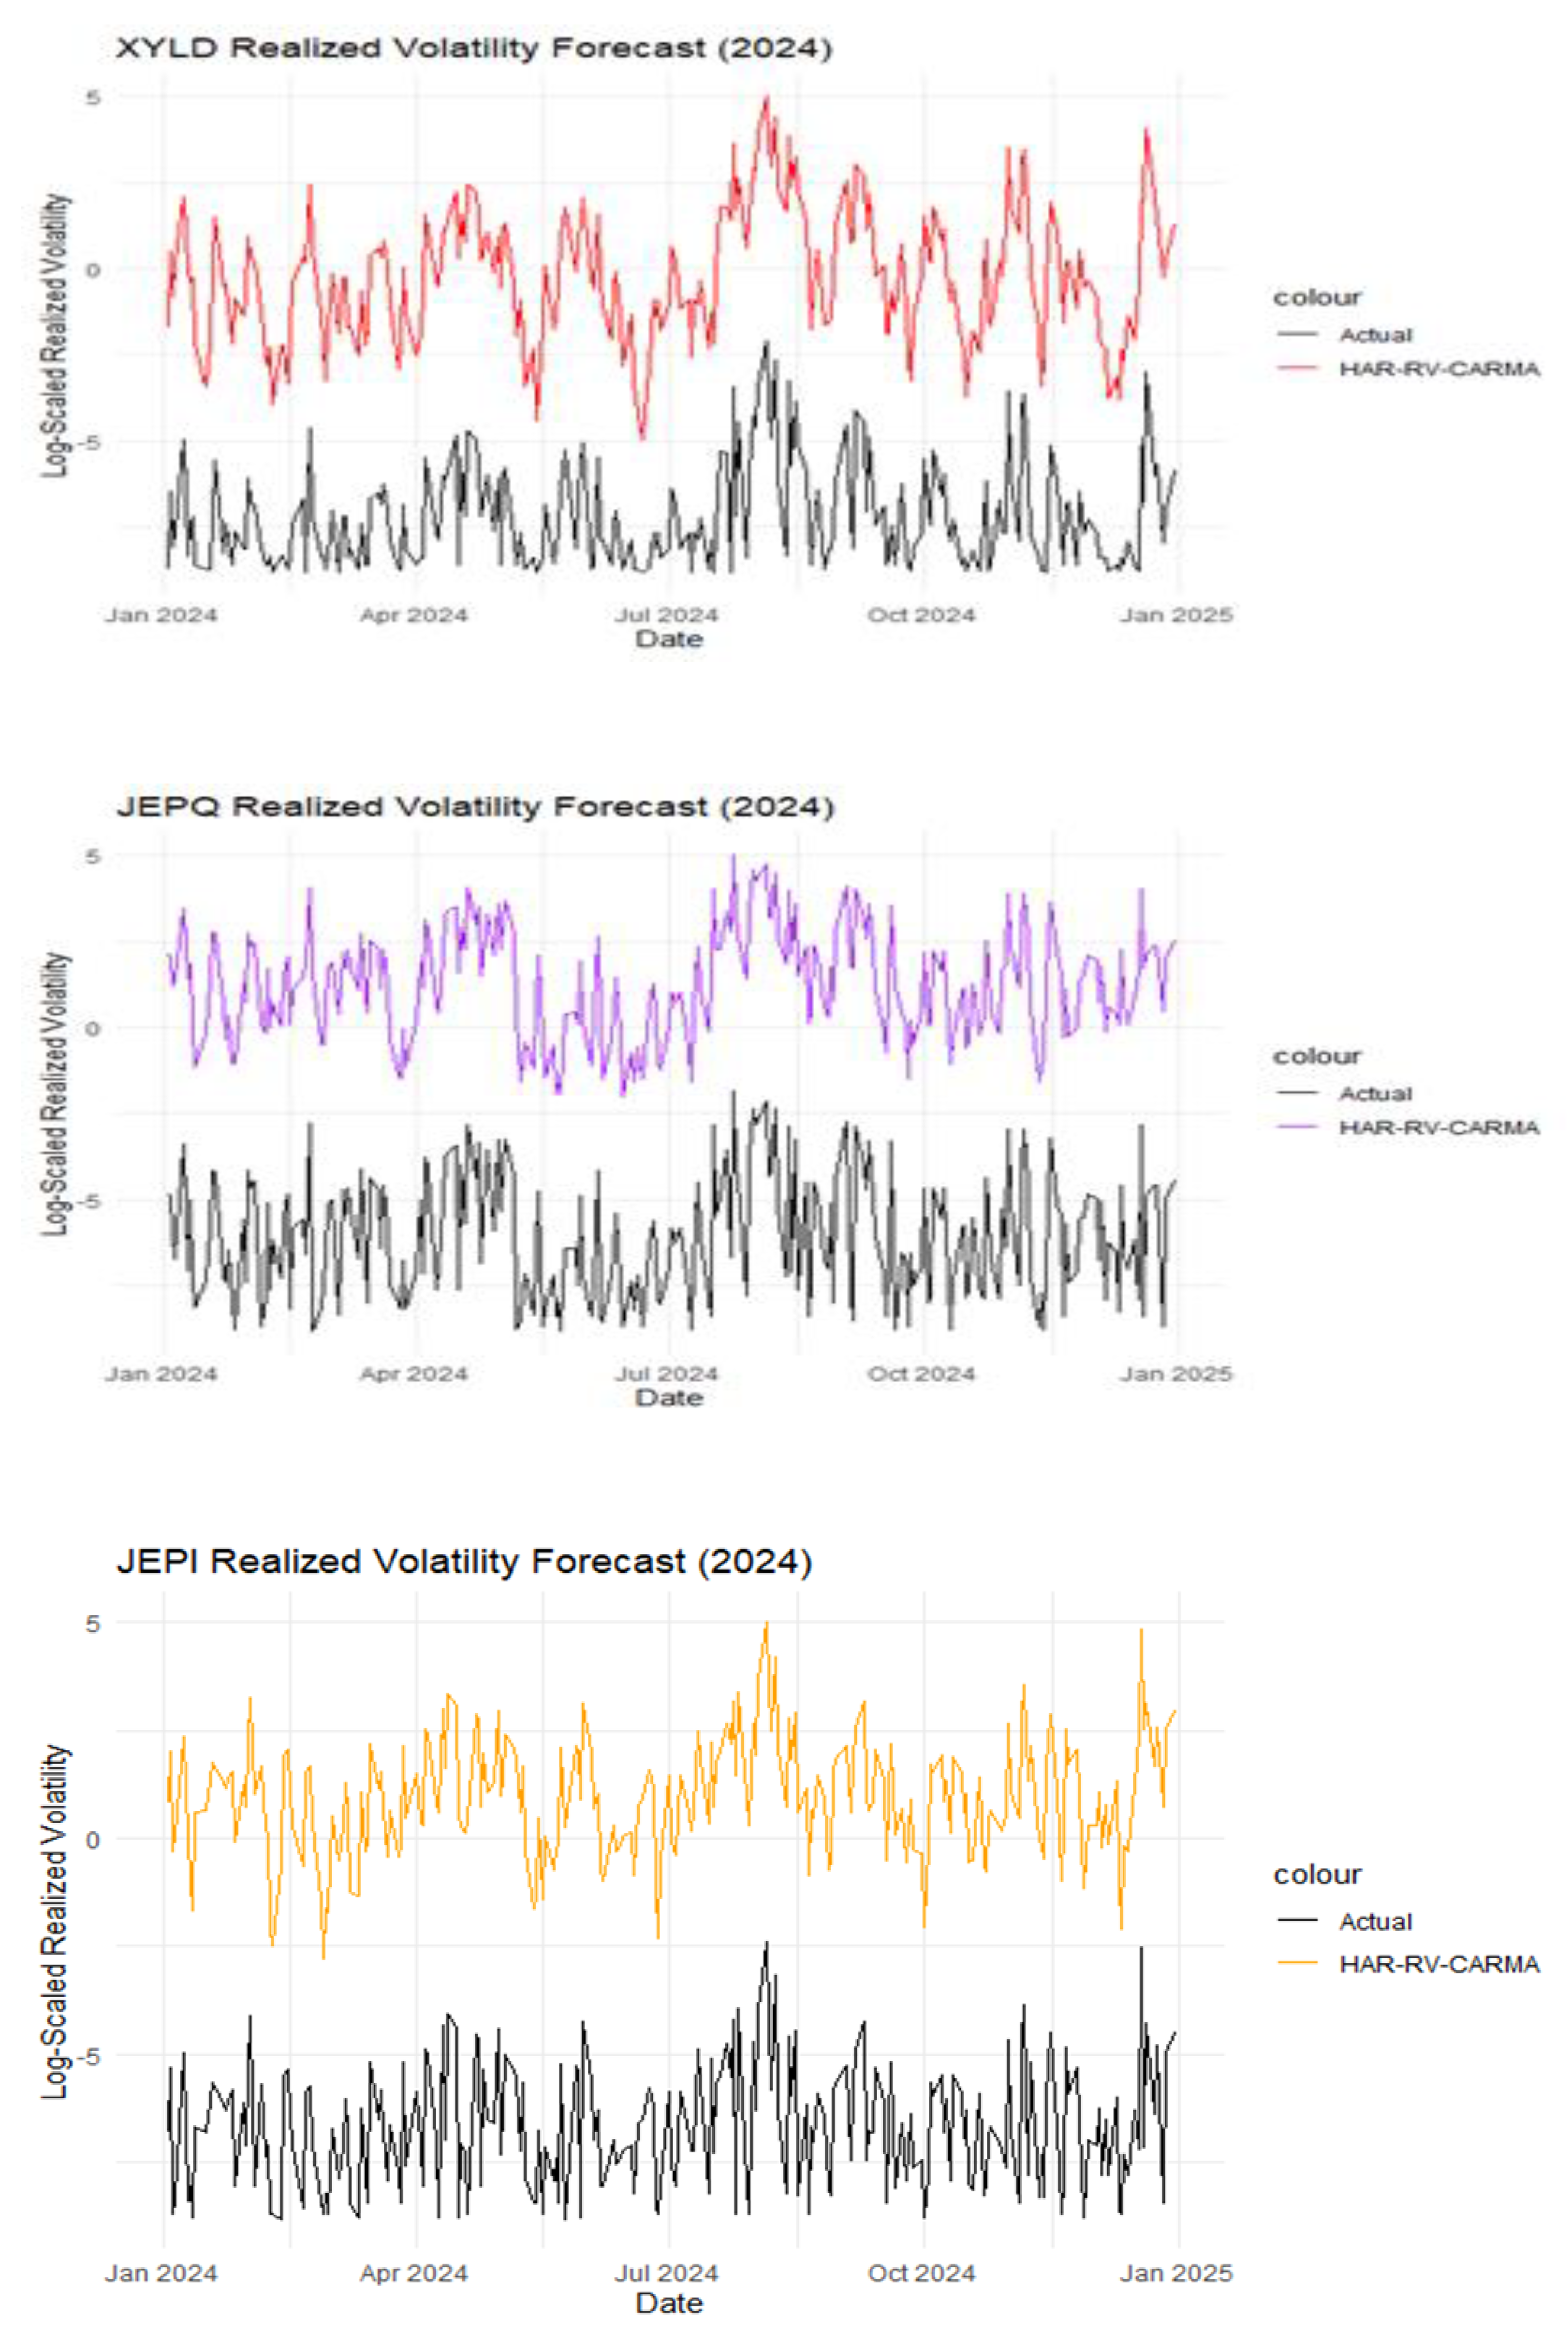
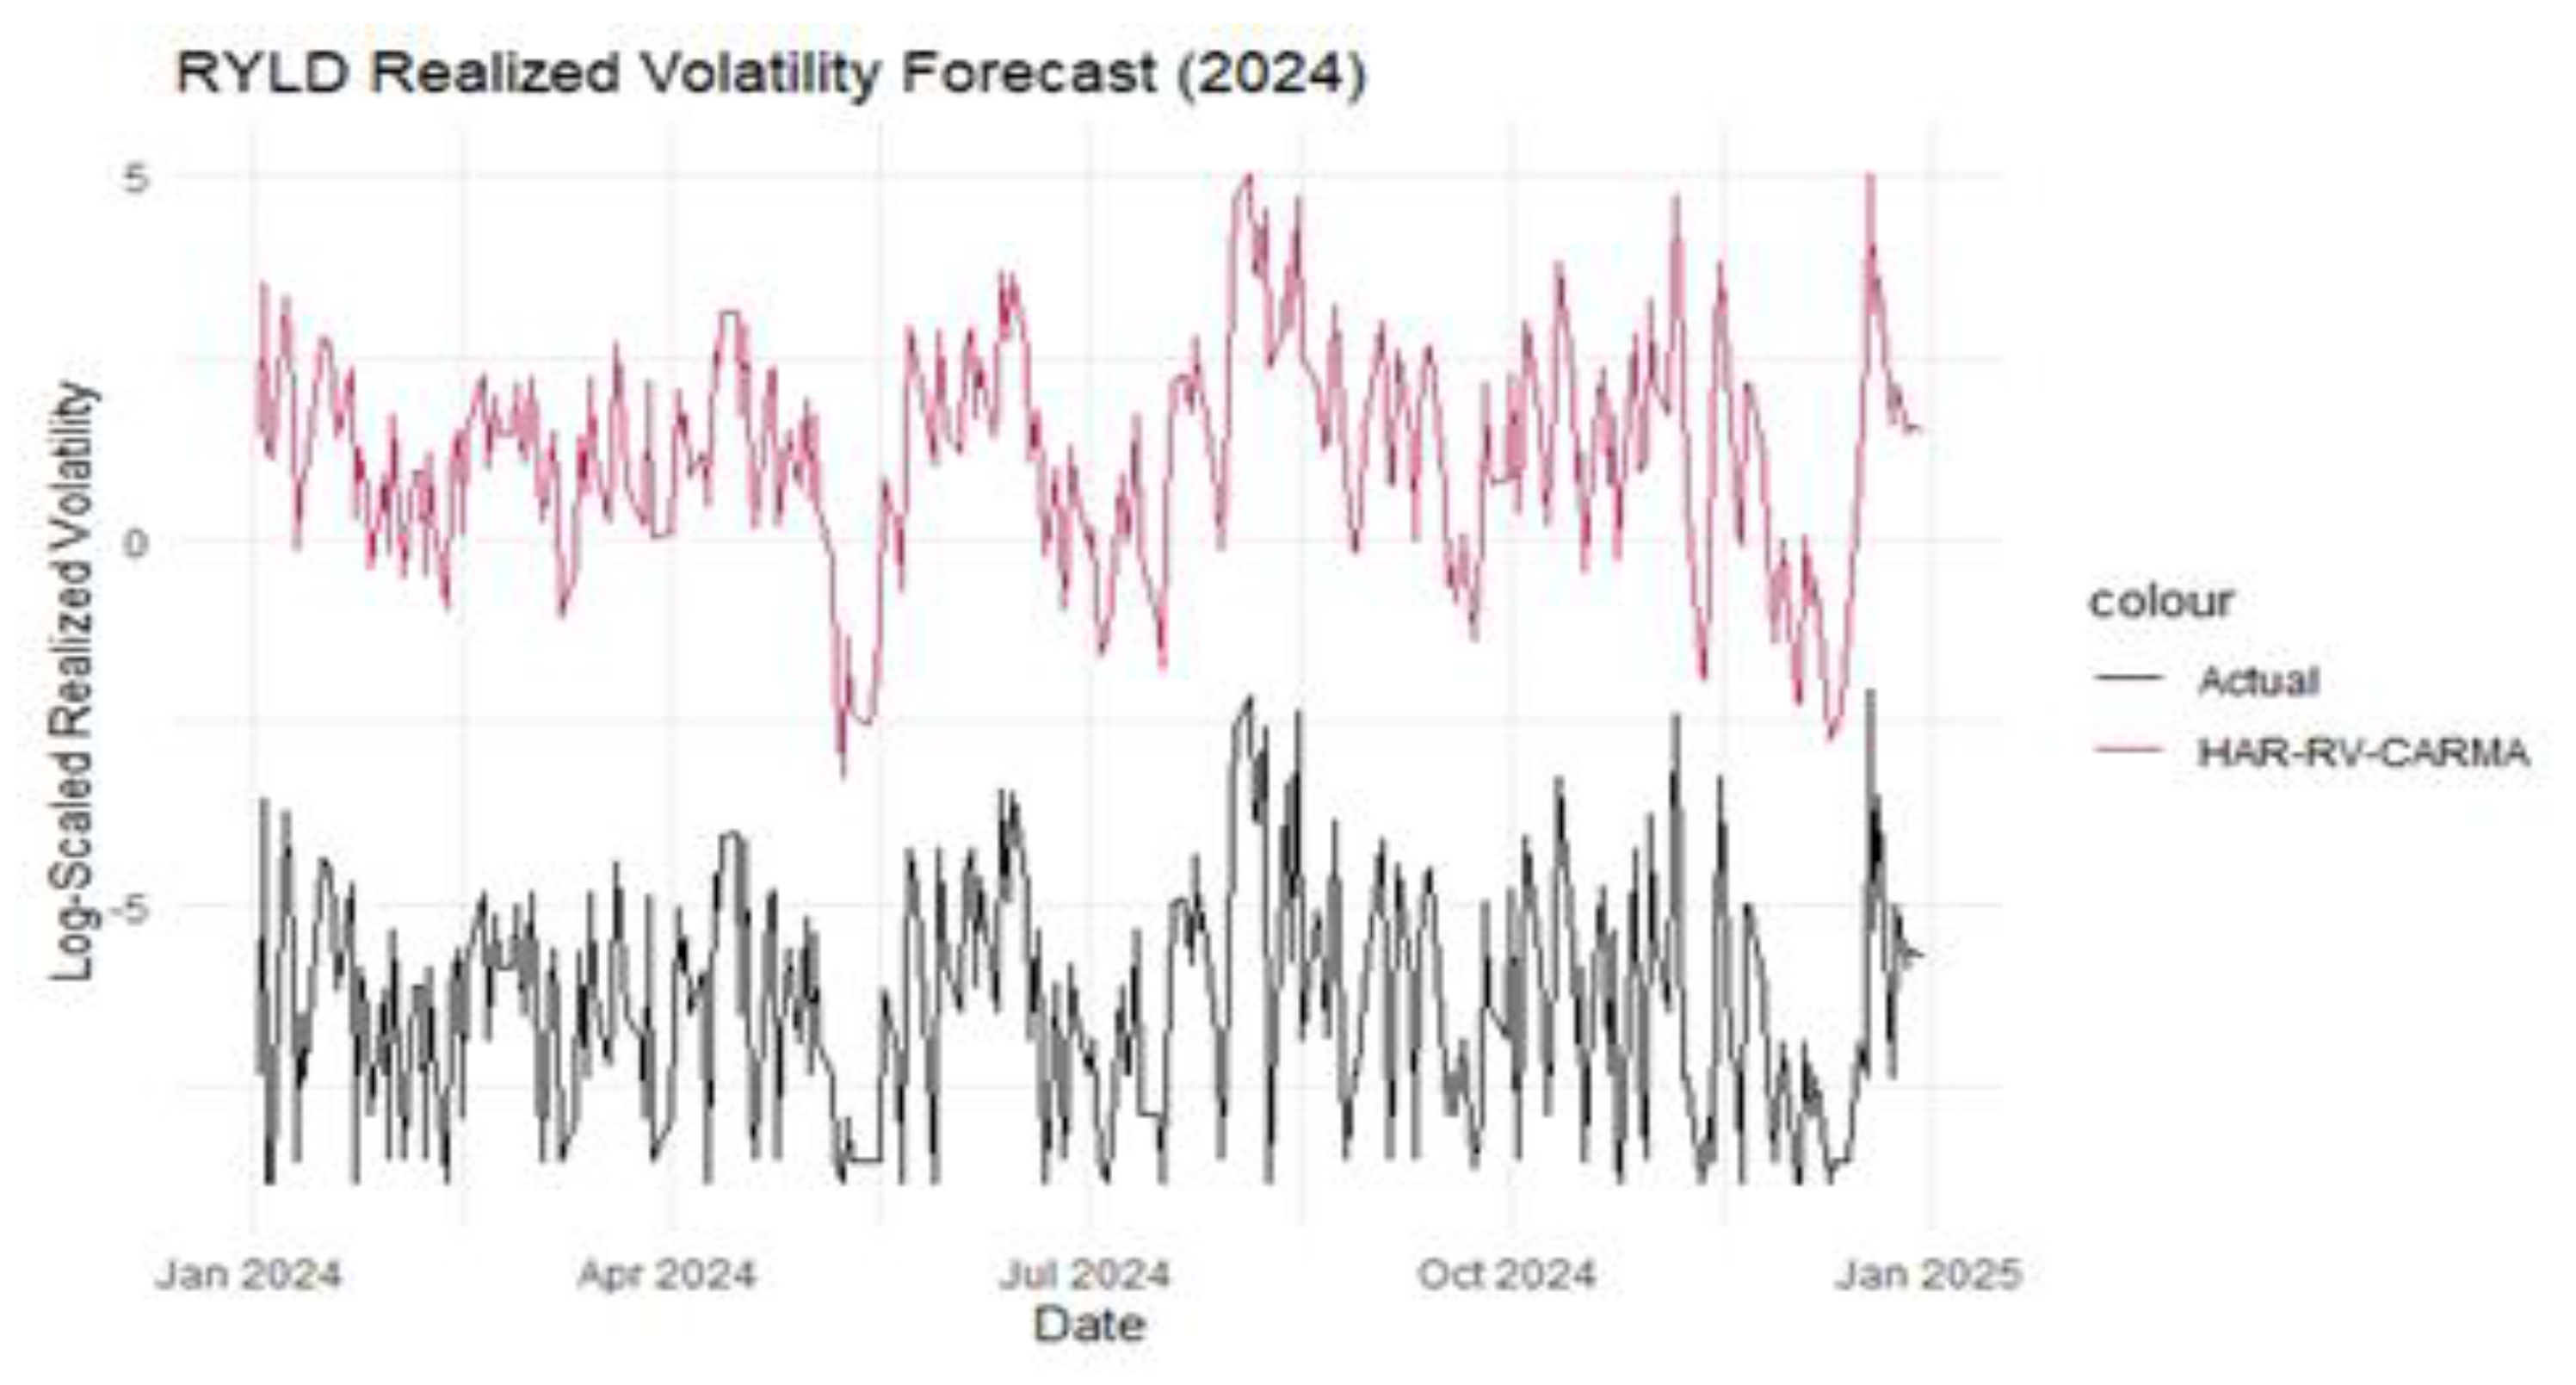

Table 1.
Summary Information for the Covered Call ETFs.
| Ticker | Name | Issuer | Expense ratio | AUM ($ Billions) | Inception Date |
|---|---|---|---|---|---|
| QYLD | Global X NASDAQ 100 Covered Call ETF | Mirae Asset | 0.61% | 8.19 | 12/12/2013 |
| XYLD | Global X S&P Covered Call ETF | Mirae Asset | 0.60% | 3.10 | 06/24/2013 |
| JEPI | JPMorgan Equity Premium Income ETF | JPMorgan Chase | 0.35% | 41.16 | 05/20/2020 |
| JEPQ | JPMorgan Nasdaq Premium Income ETF | JPMorgan Chase | 0.35% | 29.94 | 05/03/2022 |
| RYLD | Global X Russell 2000 Covered Call ETF | Mirae Asset | 0.60% | 1.26 | 04/17/2019 |
| Source: www.etf.com as of 14 September 2025 | |||||
Table 2.
Summary Statistics for Daily Realized Volatility (1 January 2019 – 30 December 2024).
| Sample Statistics | QYLD | XYLD | RYLD | JEPI | JEPQ |
|---|---|---|---|---|---|
| Mean | 0.1408 | 0.1240 | 0.1493 | 0.1013 | 0.1549 |
| Median | 0.1068 | 0.0972 | 0.1269 | 0.0984 | 0.1377 |
| Std Dev | 0.1090 | 0.1133 | 0.1199 | 0.0437 | 0.0731 |
| Skewness | 3.0853 | 4.5253 | 4.5293 | 0.9271 | 0.8028 |
| Kurtosis | 16.7387 | 28.2890 | 28.4202 | 3.3924 | 2.5699 |
| Min | 0.0188 | 0.0126 | 0.0298 | 0.0407 | 0.0610 |
| Max | 0.7859 | 0.9017 | 0.9607 | 0.2373 | 0.3310 |
| Jarque-Bera | 0.0000 | 0.0000 | 0.0000 | 0.0000 | 0.0000 |
| ADF | 0.0100 | 0.0100 | 0.0100 | 0.0100 | 0.0996 |
Table 3.
Forecast Results.
| Models | Metrics | QYLD | XYLD | JEPQ | JEPI | RYLD |
|---|---|---|---|---|---|---|
| HAR-RV | MSE | 0.0401 | 0.0204 | 0.0445 | 0.0203 | 0.0284 |
| RMSE | 0.2002 | 0.1431 | 0.2109 | 0.1425 | 0.1685 | |
| QLIKE | -2.5363 | -2.7361 | -2.706 | -3.0687 | -2.5017 | |
| AIC | -799.41 | -967.846 | -773.339 | -969.944 | -885.964 | |
| BIC | -785.308 | -953.745 | -759.237 | -955.842 | -871.862 | |
| CARMA | MSE | 1.0329 | 1.0209 | 1.0844 | 1.0395 | 1.0848 |
| RMSE | 1.0163 | 1.0104 | 1.0413 | 1.0196 | 1.0415 | |
| QLIKE | 0.0162 | 0.0104 | 0.0405 | 0.0194 | 0.0407 | |
| AIC | 12.122 | 9.1996 | 24.3296 | 13.7268 | 24.4333 | |
| BIC | 19.173 | 16.2505 | 31.3805 | 20.7777 | 31.4842 | |
| HAR-RV—CARMA | MSE | 0.0225 | 0.0086 | 0.0216 | 0.0106 | 0.0217 |
| RMSE | 0.15 | 0.0926 | 0.147 | 0.1032 | 0.1473 | |
| QLIKE | -4.5214 | -5.2759 | -3.7309 | -4.0855 | -3.8809 | |
| AIC | -948.235 | -1190.4 | -958.503 | -1136.28 | -957.367 | |
| BIC | -941.184 | -1183.3 | -951.452 | -1129.23 | -950.316 |
Table 4.
Directional Accuracy Test.
| Model | QYLD | XYLD | JEPQ | JEPI | RYLD |
|---|---|---|---|---|---|
| HAR-RV | 64.8 | 71.6 | 72.4 | 74 | 67.6 |
| CARMA | 48.8 | 44.8 | 49.6 | 47.2 | 48.4 |
| HAR-RV—CARMA | 89.2 | 91.2 | 92.8 | 90.4 | 88.4 |
Table 5.
Diebold-Mariano test results among forecast methods.
| Model | Benchmark | |
|---|---|---|
| HAR-RV | HAR-R-CARMA | |
| CARMA | -166.04*** | -214.08*** |
| HAR-RV | -1.634** |
Disclaimer/Publisher’s Note: The statements, opinions and data contained in all publications are solely those of the individual author(s) and contributor(s) and not of MDPI and/or the editor(s). MDPI and/or the editor(s) disclaim responsibility for any injury to people or property resulting from any ideas, methods, instructions or products referred to in the content. |
© 2025 by the authors. Licensee MDPI, Basel, Switzerland. This article is an open access article distributed under the terms and conditions of the Creative Commons Attribution (CC BY) license (http://creativecommons.org/licenses/by/4.0/).
Copyright: This open access article is published under a Creative Commons CC BY 4.0 license, which permit the free download, distribution, and reuse, provided that the author and preprint are cited in any reuse.


