

Submitted:
04 October 2025
Posted:
08 October 2025
You are already at the latest version
Abstract
With worsening energy and environmental issues, new energy vehicles (NEVs) have emerged as the automotive industry’s future that aims to address high energy use and carbon emissions of traditional fuel vehicles. However, NEV research mostly focuses on theoretical analysis due to short industry history, limited data, and incomplete systems, hindering accurate sales prediction. Online reviews now offer a new perspective for forecasting by influencing consumer decisions. Based on consumer behavior and neural network theories, this study reviews relevant literature, selects NEV sales-influencing factors (economy, technology, policy, consumers, with preprocessed crawled online reviews), constructs an index system screened via grey correlation analysis, and establishes four models (GRU, Seq2Seq, Attention-GRU, Attention-Seq2Seq) for training and testing. Results show online reviews, battery output, and public charging piles effectively support NEV sales prediction. The Attention-Seq2Seq model outperforms the other three across all metrics.
Keywords:
New Energy Vehicles (NEVs)
; sales forecasting
; Attention-Seq2Seq model
; grey correlation analysis
; online reviews
1. Introduction
With the global emphasis on environmental protection and sustainable development, the high pollution and energy consumption of traditional fuel vehicles have become prominent. Governments worldwide are promoting the popularization of NEVs through regulations and incentive policies. Driven by breakthroughs in battery technology, NEVs have seen improved charging efficiency, extended driving range, and reduced costs. Combined with global energy structure adjustment and market demand for intelligent vehicles, the NEV industry has ushered in development opportunities. This is also China’s strategic choice to transform from a large automobile-producing country to a strong one and address climate change, with multiple policies issued to boost the industry. In recent years, the NEV industry has grown significantly, with steady global sales growth. According to EVTank data, NEV sales in the U.S. and Europe reached 2.948 million and 1.468 million units respectively in 2023, up 18.3% and 48.0% year-on-year. Global sales hit 18.236 million units in 2024 (+24.4% year-on-year), with China’s share rising from 64.8% (2023) to 70.5%. China’s NEV production and sales in 2024 reached 12.888 million and 12.866 million units, up 34.4% and 35.5% year-on-year, ranking first globally for 10 consecutive years. Multiple forecasts indicate NEV penetration will continue to rise, and NEVs may surpass fuel vehicles in proportion around 2025. However, despite China’s leading NEV production and sales, fuel vehicles still account for a high share of the overall auto market. Though NEVs have advantages in environmental protection, low maintenance costs, and policy support, their further promotion is hindered by factors such as battery safety, driving range, charging infrastructure construction, and economic levels—all affecting consumers’ purchase decisions.
It is a widely concerned issue how to leverage market environment information to identify changes in NEV sales, drive stable production of NEV enterprises, and promote high-quality industrial development. Taking NEVs as the research object, this study applies neural network and text mining technologies to construct and validate an optimal sales prediction model. The study aims to provide a more scientific and efficient application platform and technical support for subsequent NEV sales prediction practices, thereby offering strong reference for industrial decision-making.
This paper aims to analyze factors affecting NEV sales volumes by applying text mining to online reviews. It combines these insights with traditional indicators to create a more scientific NEV sales forecasting index system. Additionally, it establishes a more accurate NEV sales forecasting model by incorporating an attention mechanism based on neural networks, thereby enhancing the prediction of NEV sales volumes. By analyzing the factors influencing NEV sales volumes, this study explores the advantages and obstacles in the development of the NEV industry, optimizes traditional sales forecasting models, and analyzes the future changing trends of NEV sales volumes. It provides reference for relevant industrial entities such as NEV enterprises in formulating production and financing plans, as well as for the government in implementing subsequent NEV industry policy guidance, so as to promote the prosperity of the NEV market and the sustainable development of the industry. This study applies time series forecasting and text mining technologies to the NEV industry, considers the impact of consumers on sales volumes in the traditional index system, and establishes a multivariate NEV sales forecasting model based on neural networks. It provides a more comprehensive and in-depth forecasting perspective, enriching research on NEV market trend forecasting.
This paper not only considers traditional structured data but also incorporates unstructured text data, enriching the theoretical framework of sales forecasting. The research demonstrates how structured and unstructured data can be effectively integrated, provides a theoretical basis and technical support for multi-source data fusion, and expands the research scope of sales forecasting. By adding an attention mechanism and the Seq2Seq model, the study better captures key information among various features, verifies the advantages of the attention mechanism in improving prediction performance, and through case studies, proves its important role in enhancing model performance and interpretability. This contributes to the theoretical development of time series forecasting, provides theoretical reference for enterprise and government decision-making, and promotes the healthy development of the NEV industry.
This paper conducts an in-depth investigation into the current development status and trends of the NEV industry. By analyzing the factors influencing NEV sales volumes and constructing a prediction model, it provides a basis for government departments to adjust relevant subsidy and incentive policies for NEVs and deploy infrastructure in advance. It offers references on NEV sales market development trends for the NEV industry, promoting the optimization of resource allocation and the long-term, sustainable, and healthy development of the industry. It also provides reference for enterprises to formulate scientific production plans and financing strategies, helping enterprises reasonably plan product production capacity and iteration cycles, scientifically evaluate return on investment and risks, identify potential market risks, and formulate targeted response measures in the actual decision-making process. Through scientific sales forecasting, enterprises can more accurately predict the demand for spare parts, optimize inventory levels, reduce capital occupation and warehousing costs, and provide new ideas for the intelligent management of the NEV industry.
2. Literature Review
2.1. Research on Vehicle Sales Forecasting
Theoretical and applied research on sales forecasting in the automotive industry involves multiple models, such as time series regression, neural network, and grey forecasting models. Domestic and international studies on these models include optimizing model combinations or incorporating factors influencing NEV sales to expand the input data of forecasting models.
Due to the early development of the international vehicle industry, the research on the sales forecasting of the automobile industry started earlier, and the research results are more abundant. In 1957, Marc established a regression prediction model based on the relationship between the new demand for automobiles, the number of scrapped vehicles in the previous period and the total number of vehicles in use, and made short-term predictions on the changes in the total number of automobiles in the United States [1]. In the 1980s, scholars such as Patrick considered indicators like household income, government policies, and employment situations to construct regression models in order to study the factors influencing the demand for automobiles [2]. Chen et al. utilized the monthly vehicle sales data from January 2001 to June 2011 and established a prediction model for automobile demand in China based on the Autoregressive Integrated Moving Average (ARIMA) time series model. The research results showed that the prediction effect of the model was good [3]. Wang et al. proposed an adaptive network fuzzy reasoning model and input factors such as historical car sales volume, price index and revenue into the model for training and prediction [4]. The empirical results showed that the application of adaptive network fuzzy inference model was better than that of autoregressive integrated moving average model and artificial neural network. Pai constructed the Least Squares Support Vector Regression (LSSVR) model using social media data and stock market values to predict the total monthly car sales in the United States. The results showed that social media data and stock values played an important role in the prediction of car sales [5]. Till et al. selected factors such as purchase price, operating cost, energy price and charging infrastructure to establish a market diffusion model, and made sales predictions for electric vehicles in the United States and Germany respectively. The results showed that the important input factors affecting the sales of electric vehicles in the United States were purchase price and operating cost, while for Germany, they were energy price and charging infrastructure [6]. Pei et al. established a nonlinear grey Bernoulli model based on array analysis based on the quarterly fluctuation characteristics of new energy vehicle sales in China, and utilized the particle swarm optimization algorithm to optimize the model parameters and improve the prediction accuracy. According to the prediction results of the model, the sales of new energy vehicles in China will increase by 57% from 2019 to 2020, and there will be quarterly fluctuations [7]. Choi et al. proposed a vehicle replacement model, which derives the expected sales and inventory shares of the market by identifying the purchase timing. The results showed that consumers tend to choose the same models as their existing ones, and compared with traditional cars, consumers are more inclined to postpone the purchase of electric vehicles [8]. Chandriah et al. proposed a recurrent neural network/Long Short-Term memory (RNN/LSTM) method based on the improved Adam optimizer for the purpose of better predicting the demand for vehicle spare parts [9]. Kumar et al. found that random forest performs better in electric vehicle sales prediction by comparing different types of machine learning techniques [10].
In terms of time series prediction of China’s automobile sales forecasting research, Guo established a sum-autoregressive moving average model to predict China’s vehicle sales in 2013 based on monthly vehicle sales data [11]. Zhang established the ARIMA model and the multiple regression model based on economic factors and environmental factors respectively, and conducted a theoretical study on the prediction of private car ownership in China [12]. Zhang et al. selected factors such as the new car ratio (sales volume of new energy vehicles/sales volume of automobiles), gasoline production, electricity consumption for urban and rural residents’ daily life, registered urban unemployment rate, and per capita consumption expenditure of urban residents to establish a multiple regression model, which was used to predict and analyze the sales volume of new energy vehicles in 2018 [13]. Chen Kexiu et al. established the ARIMA (7,2,1) model and used the sales data of 12 months in 2019 as samples to predict the sales of ORA in China from January to February 2021 [14].
In terms of neural network prediction, Wang Xutian took BP neural network technology as the main line, combined with the ARIMA model and principal component analysis, to predict the monthly sales volume and annual sales volume of automobiles respectively [15]. Ge Na et al. constructed a Prophet-LSTM neural network combination model to predict the product sales of a certain enterprise, which verified that the combination model has stronger applicability and higher accuracy than the single model in the sales time series prediction [16]. Zhou Yanfu et al. extracted eight factors affecting the sales volume of new energy vehicles, and described the influence ability of each influencing factor on the sales volume of new energy vehicles by using the grey correlation degree. Then, a grey neural network model (FOA-GNN) optimized by the fruit fly algorithm was constructed to predict the monthly sales volume of new energy vehicles in China in 2019 [17]. Ouyang Hongbing and Huang Kang verified that the LSTM neural network has higher prediction accuracy in processing time series by comparing the prediction effects of the LSTM neural network with four models: multi-layer perceptron, support vector machine, K-nearest neighbor, and GARCH [18]. Liu Jihua et al. designed a vehicle sales prediction model based on convolutional neural networks according to the characteristics of online search volume data and sales volume data, and found that the prediction accuracy of convolutional neural networks was higher compared with the RBF model, ARIMA model, and ARIMA+RBF hybrid model [19].
In terms of other prediction models, Li Yi and Wen Rui established a fixed-effect model of web search and car sales, and adopted a rolling window approach to predict vehicle sales in the recent 12 months [20]. Zhang Chunhui and He Jinlan respectively established multiple regression model, quadratic exponential smoothing method, grey prediction model and combination prediction model obtained by combination of three single prediction models to predict the number of private vehicles in the future [21]. Liu Lianyi et al. proposed an improved grey power model with multiple parameters and predicted the market sales volume of new energy vehicles [22].
2.2. Sales Forecasting Based on Text Mining
Feldman et al. first proposed text mining in their research on unstructured data [26]. As an emerging interdisciplinary technology, it aims to extract valuable structured information from online texts by analyzing text content features and their potential association patterns [27].
With advances in artificial intelligence and deep learning, text mining has developed rapidly and been applied in various fields. For example, online reviews, as post-purchase feedback from customers, are an important source for enterprises to obtain consumer needs, with great commercial value in information extraction, recommendation services, competitive analysis, and product development, attracting researchers’ attention. Chevalier and Mayzlin analyzed online reviews of books on Amazon, finding that reviews significantly promoted sales growth [28]. Duan et al. found that online user reviews played a leading role in driving movie box office revenue [29]. Hao used customer review mining to build a product recommendation model based on feature-opinion pairs, proving it could provide reliable data for such recommendations and effectively help users make purchase decisions [30]. Hong et al. proposed a framework to summarize customer opinions from product reviews: it identified phrases containing product attributes and corresponding opinions from raw reviews using grammatical rules and LDA models, then automatically generated readable and concise summaries from these phrases via deep neural networks to provide users with valuable insights into product attributes [31].
As the text mining research deepens, scholars have found that online review texts contain emotional information reflecting consumers’ psychological acceptance and expectations of products or services. Thus, some scholars have focused on sentiment analysis of review texts. Lee et al. found that the sentiment polarity of online reviews had a negative impact on new product acceptance [32]. Huang et al. proposed a commodity attribute clustering method based on combined neural networks and a sentiment analysis method for commodity reviews using word2vec and sentiment similarity calculation, verifying accuracy with real reviews [33]. Berezina et al. point out in the article that the study, using text mining to analyze 2,510 TripAdvisor reviews of Sarasota, Florida hotels, explores what drives hotel customers’ satisfaction/dissatisfaction. It finds common review categories, notes satisfied customers focus more on intangibles (e.g., staff) and dissatisfied ones on tangibles (e.g., furnishings) [34]. Sun and Shen classified consumers’ product demand preferences via correlation analysis based on mutual information and semantic similarity, and used improved two-step clustering to segment smartphone users according to demand preference scores from sentiment analysis, summarizing the characteristics of each user group [35]. Liu et al. point out in the article that social-media user portraits boost Internet info service quality. To address current methods’ failure to distinguish gender/age emotional differences (multi-modality, no domain sentiment labels), they use image-text sentiment analysis, instance transfer learning, multi-modal attention mechanism to build MPCM [36].
Beyond user portrait construction and consumer demand analysis, some studies have applied online reviews to product sales forecasting, including vehicle sales forecasting. In forecasting applications: Fan et al. extracted sentiment scores from automotive online reviews and combined them with the Bass/Norton model to forecast product sales, achieving good results [37]. Ming et al. proposed predicting automotive sales using time series and RBF neural network methods, based on historical data from China Association of Automobile Manufacturers [38]. Wang et al. proposed a 3-month differentiated e-commerce forecast strategy: ARIMA for monthly inventory predictions, LSTM for daily sales forecasts [39]. Xie et al. proposed researching NEV sales drivers amid carbon goals, focusing on under-explored tech innovation. Using 2015-2022 China data & NEV tech patent quality as a proxy, they found tech innovation boosts sales (valid with IVs), chain-link innovations (midstream/downstream) help, BEVs benefit more, and market values innovation’s overall effect over quality level [40]. Jiang et al. integrated word-of-mouth reviews and search data to build an Attention-LSTM vehicle sales forecasting model; experiments showed the model had advantages in addressing high-dimensional nonlinear time series forecasting tasks [41]. Wang et al. combined review quantity and web search data to establish an autoregressive model for forecasting sales of vehicles at different price levels, finding varying prediction performance: the best for low-priced vehicles, followed by mid-priced, and the worst for high-priced ones [42]. Relevant literature recognizes the importance of online reviews for vehicle sales and addresses review processing but mostly uses traditional forecasting models and rarely combines them with traditional economic and technical indicators.
2.3. Summary and Research Gaps
A review of existing literature reveals a wealth of studies on vehicle sales forecasting, featuring diverse research methods and perspectives that cover various forecasting models. However, these studies mostly focus on optimizing forecasting models/algorithms and their applications in different contexts (e.g., countries, timeframes). For instance, some analyze the impact of macro-factors on vehicle sales, such as fluctuations in fuel/electricity prices, changes in consumer income levels, and variations in highway mileage or patent counts; others concentrate on improving forecast accuracy by comparing models (e.g., time series, regression, machine learning) to select the optimal one. Given the relatively short development history of NEV, in-depth research on NEV sales forecasting remains limited, leaving significant research gaps and market value in this field.
From the literature on vehicle sales forecasting, most scholars rely on historical sales data for predictions. Many studies prioritize traditional macro-indicators (e.g., GDP growth rate, unemployment rate)—while these indicators are important, they fail to provide a full reflection of market dynamics and the diversity of consumer behavior. With the development of the Internet, online reviews and social media data have become critical information sources for consumer decision-making, yet existing research often overlooks or does not sufficiently consider these factors. For example, analyzing online reviews and social media data could reveal consumers’ emotional attitudes toward NEVs, thereby predicting potential purchase behavior; moreover, word-of-mouth (WOM) spread on social media exerts a significant impact on vehicle sales, a factor that existing studies also rarely adequately addressed. Although some scholars have developed models by combining historical sales data with traditional economic indicators, few have incorporated WOM review-related features, and researchers have not yet established unified standards for researching WOM reviews. Additionally, many studies rely on a single data source—primarily official statistical data—while neglecting other potential sources; they mostly focus on structured data (e.g., sales volume, price, economic indicators), failing to effectively leverage the value of unstructured data. Furthermore, while official data is reliable, it has low update frequency and inherent lag, making it difficult to reflect real-time market changes.
With the popularization of the Internet, online WOM reviews increasingly influence consumers, and automotive manufacturers are paying greater attention to user reviews on online media. Therefore, integrating user online reviews with traditional indicators can establish a more comprehensive sales forecasting index system, enabling more holistic capture of factors affecting sales. Traditional indicators provide macro and overall market trends, while online reviews offer real-time consumer feedback and emotional attitudes. The combination of these two can better utilize multi-source data, enrich model inputs, and improve the reliability, accuracy, and precision of forecasts—holding significance for the expansion and application of NEV sales forecasting models.
3. Basic Model Selection
We focus on comparing Support Vector Regression (SVR), Convolutional Neural Network (CNN), Long Short - Term Memory Network (LSTM), and Gated Recurrent Unit (GRU). These four models represent different types of algorithms: GRU and LSTM are typical recurrent neural networks suitable for time - series data with long - term dependencies; CNN excels at extracting spatial or local features, which can be valuable for capturing patterns in sales data; SVR is a traditional machine learning-based model based on statistical learning theory. By comparing these representative models, we aim to provide clear insights into the performance of different model types in the specific context of predicting Chinese NEV sales, considering factors such as model complexity, interpretability, and prediction accuracy.
3.1. Support Vector Regression (SVR)
As a kind of time series prediction, the sales prediction of new energy vehicles involves a variety of prediction models. Among various prediction models, the Support vector machine (SVM), as a machine learning-based model for solving separable binary classification problems, appears earlier and is widely applied [23]. The algorithm in this model maps the low-dimensional nonlinear data to the high-dimensional linear space through the kernel function, and constructs an optimal hyperplane in this high-dimensional space to divide all the samples in the feature space. The sample point closest to the optimal hyperplane is known as a support vector. Through the support vector, we can calculate the hyperplanes α1 and α2 on both sides of the optimal hyperplane. The larger the distance between α1 and α2, the more reliable the classification result. SVM is referred to as SVR when applied to regression problems. The purpose of this algorithm is to find a regression hyperplane that is closest to all sample points. SVR can achieve the best prediction effect with only a small amount of sample data, which to a certain extent solves problems such as overfitting and local extremum. Its strong nonlinear modeling ability and flexibility make it have certain advantages in time series prediction.
The SVR regression estimation function is given by as Equation (1):
In Equation (1): is the dimension of the feature space, is the mapping from the lower dimension to the higher dimension, and is the bias term. The optimization problem is given by as Equation (2) and Equation (3):
In Equations (2) and (3), is the insensitive factor, and are the relaxation variables, and is the penalty parameter. To solve Equation (2), the Lagrange multiplier method is introduced, as shown in Equation (4) and Equation (5):
In equation (4), is the sum function.
3.2. Convolutional Neural Network (CNN)
In addition to support vector machines, neural networks, as emerging models, have sparked research enthusiasm in many fields since their advent and have been applied to various tasks, including the field of time series prediction. Research on neural networks is common in network structure optimization and hyper-parameter selection. During this process, researchers have proposed many excellent models. Among them, CNN [24] and RNN [25] are two representative improved models.
CNN is a type of deep neural network with wide applications and excellent performance, and it has extensive application value in many fields. Its core operation is to extract local data features through convolution calculation in the convolutional layer, and then introduce activation function to enhance the nonlinear fitting ability of the model [24]. Meanwhile, a pooling layer is also set up in CNN to perform data down-sampling and feature dimensionality reduction. Due to the characteristics of convolutional operation and shared weights, CNN has obvious advantages in dealing with high-dimensional data. With the problem of sequence analysis in the context of big data attracting more and more attention, many literature/studies have attempted to improve CNN to introduce sequence learning.
The principle of CNN for time series prediction is to use the ability of convolutional kernel to feel the changes in historical data over a period and make predictions according to the changes in this historical data. Pooling operations can retain key information and reduce information redundancy. Convolutional neural networks can effectively reduce the human resources consumption of feature extraction by previous algorithms and avoid the generation of human errors at the same time. The convolutional neural network requires a huge amount of sample input and is primarily utilized by researchers to predict datasets with spatial characteristics. Its internal structure consists of input layer, convolutional layer, pooling layer, fully connected layer and output layer.
3.3. Long Short - Term Memory Network (LSTM)
The sales volume of new energy vehicles usually varies over time, and future sales often depend on past data and market trends. Time series data has obvious order and dependence. RNN and its variants can effectively capture these long-term dependencies, while traditional time series based analysis methods may be difficult to deal with complex long-term dependencies. RNN and its variants can be tailored and optimized for specific application scenarios. For example, researchers can modify parameters such as the size and number of hidden layers to adapt them to different datasets and prediction tasks. With the increase of data and the continuous training of the model, RNN can gradually enhance its prediction ability to adapt to the dynamic changes of the data. As a variant of RNN, LSTM neural network introduces input gate, forget gate and output gate to save historical information and long-term state, and uses gating to control the flow of information.
At time step t, the input and output vectors of the hidden layer of LSTM are and respectively, and the memory unit is . The input gate is used to control how much of the current input data of the network flows into the memory unit, that is, how much can be saved to , as shown in Equation (6):
In Equation (6), i represents the input gate, represents the multiplication of corresponding elements, W and b represent the weight matrix and bias vector of the network.
The forget gate is a key component of the LSTM unit that controls what information to keep and what to forget, and somehow avoids the vanishing and exploding gradient problems that arise when gradients are back-propagated over time. The forget gate controls the self-connecting unit and can determine which parts of the historical information will be discarded. That is the influence of the information in the last time memory unit on the current memory cell . The calculation is derived in Equations (7) and (8):
In Equations (7) and (8), represents the forget gate, represents the multiplication of corresponding elements, W and b represent the weight matrix and bias vector of the network.
The output gate controls the influence of the memory unit on the current output value , that is, which part of the memory unit will output at time step t. The value of the output gate is given by Equation (9), and the output of the LSTM at time t can be obtained by Equation (10).
In Equations (9) and (10), represents the output gate, represents the multiplication of corresponding elements, W and b represent the weight matrix and bias vector of the network.
3.4. Gated Recurrent Unit (GRU)
The GRU neural network in RNN is a simplified version of LSTM, but it retains the advantages of LSTM in dealing with long short-term memory and can effectively avoid the gradient vanishing problem, so that the model can better capture long-term dependencies. Compared with LSTM, the structure of the GRU model is more simplified and its computational efficiency is higher. Through the gating mechanism (update gate and reset gate), GRU can control the flow of information and effectively capture the long-term dependencies in the time series. This is particularly important for sales volume prediction because long-term factors such as market trends and policy changes have a significant impact on sales volume.
In summary, in order to determine the appropriate prediction model, this paper selects SVR in the traditional prediction model, CNN in the neural network, and LSTM neural network and GRU neural network in the recurrent neural network, analyzes the four prediction models, and selects the appropriate prediction model according to the experimental results.
3.5. Comparative Analysis of Basic Model
Considering the availability and tractability of data, this paper selects the quarterly sales data of new energy vehicles in China from July 2018 to December 2024 as the basic sample data, and the data comes from the Dolphin Magic Cube professional vehicle data platform. This platform provides one-stop data query and analysis services, real-time data online query, in-depth data analysis, and multi-dimensional car sales ranking. The time span is long, so this platform is selected as the source of sales data. The platform takes new energy passenger vehicles as the statistical caliber, including many kinds of car sales, configuration, price and other data, and has a large statistical time span and high reference value. For the convenience of analysis, this paper combines the monthly sales volumes and conducts the analysis with one quarter as a time scale, which can take into account both micro and macro perspectives to explore market trends. Table 1 shows the specific quarterly sales data of new energy vehicles in China from the third quarter of 2018 to the fourth quarter of 2024.
This paper uses the Tensorflow in Python to build a univariate sales prediction model. The quarterly historical sales data is taken as the data set, and the data set is divided into the training set and the test set. Considering the data volumes of the training set and the test set, in the data division of the new energy vehicle prediction model, the training set accounts for 85% and the test set accounts for 15%. Establish the GRU neural network, LSTM neural network, CNN neural network and support vector regression machine. Set random seeds to ensure the reproducibility of the experiment. This paper makes a prediction of the sales volume of new energy vehicles for a certain period as a reference. Considering the convenience of comparison with subsequent models, the parameters are kept as consistent as possible in the model design for the convenience of comparison. The number of neurons in the new energy neural network prediction model is set to 4, the time step is set to 4 (four quarters), and the batch size is set to 1. The support vector machine model is established using the sklearn in Python, and the parameters were set to default. The parameters of the CNN prediction model are set as filters to 64, kernel size to 2, pool size to 2, and the activation function is the Relu function. After the model training and testing, the evaluation indicators of each model are calculated respectively.
Four evaluation metrics were used to assess the performance of the models: Root Mean Square Error (RMSE), Mean Absolute Error (MAE), Mean Absolute Percentage Error (MAPE), and Symmetric Mean Absolute Percentage Error (SMAPE).
The formula of RMSE is shown as Equation (11):
In Equation (11), n represents the number of samples, represents the true value, and represents the predicted value.
The formula of MAE is shown as Equation (12):
The formula of MAPE is shown as Equation (13):
The formula of SMAPE is shown as Equation (14):
In the above equations, n represents the number of samples, represents the true value, and represents the predicted value.
After establishing the model, the model is trained and tested, and the corresponding index data is calculated. The indicator data of the new energy vehicle sales prediction model is shown in Table 2.
In conclusion, the GRU neural network prediction model outperforms LSTM, CNN and SVR in terms of RMSE, MAE, MAPE and SMAPE indicators. According to the indicator data results, GRU neural network can be used as a basic prediction model.
4. Proposed Model
When developing sales forecasting models, although GRU neural networks inherently handle long-sequence data, integrating the attention mechanism enables the model to better capture critical information at different time points in the sequence. This is particularly important for sales forecasting, as key factors—such as residents’ consumption levels, technological development, and consumer attention—may be distributed across different segments of the time series. A notable advantage of the attention mechanism is its ability to focus on relevant information while ignoring irrelevant data; it establishes direct dependencies between inputs and outputs without recursion, enhancing parallelization and significantly improving operational speed [43,44]. It overcomes limitations of traditional neural networks, including performance degradation with increasing input length, low computational efficiency due to unreasonable input order, and insufficient feature extraction and enhancement. Moreover, the attention mechanism effectively models variable-length sequence data, further strengthening its capability to capture long-range dependencies, reducing hierarchical depth, and improving prediction accuracy [45].
Sales forecasting is essentially a time series forecasting task. The Sequence-to-Sequence (Seq2Seq) model can capture long-term dependencies in time series, The Seq2Seq model is a type of Encoder-Decoder structure. In the Encoder-Decoder framework, the encoder converts the input sequence into a vector containing specific information through recurrent neural network structures (such as LSTM and GRU). After corresponding semantic encoding, the decoder then uses recurrent neural network structures to translate this vector into output information.
However, the performance of the Seq2Seq model degrades when the input sequence is too long, while the attention mechanism helps the model focus on the parts of the input sequence that are most relevant to the current prediction. The Attention mechanism focuses on contextual information by inputting different c at each time step. Each c performs a weighted summation of information from all hidden layers of the input sequence (h1, h2, ..., hₜ) to select the contextual information that is most appropriate for the currently required output y, i.e., , where is the weight. The state output of the Decoder at time t is derived from a non-linear function of the previous state , , and , as shown in Figure 1.
In time series forecasting, Seq2Seq modeling with the attention mechanism—via encoder-decoder architecture—not only accommodates variable-length sequence data but also links the current input to the previous output and the model’s own state. This increases model complexity, thereby improving prediction accuracy and ensuring good scalability [46].
Therefore, this study takes the GRU neural network as the foundation to construct a Seq2Seq model where both the encoder and decoder are based on GRU neural networks. Additionally, an attention mechanism is integrated, and the study discusses whether there are changes in the prediction accuracy among different models.
To facilitate valid comparisons between multi-variable and single-variable sales forecasting models, their structural differences were minimized as much as possible. The dataset was split into a training set (75%) and a test set (25%) for the NEVs forecasting models. Three models were constructed: a standalone GRU neural network, a Seq2Seq model (with GRU for both encoder and decoder), and an attention-augmented Seq2Seq model (also using GRU for encoder/decoder). A random seed was set to ensure experimental reproducibility. For the NEV forecasting models, the number of neurons was set to 14, time steps to 3, batch size to 1, and training iterations to 500. After training and testing each model, evaluation metrics including RMSE, MAE, MAPE, and SMAPE were calculated to evaluate their prediction accuracy.
5. Data
The long-term development trend of the NEV industry is influenced by multiple factors. Therefore, when constructing a NEV sales forecasting model, it is necessary to consider various key factors affecting sales. Combining macro and micro perspectives, this chapter incorporates the impact of online reviews on sales in addition to economic, policy, and technological factors. From these four dimensions, characteristic indicators of factors influencing NEV sales were selected. The grey relational analysis method was used to rank and screen these indicators based on their correlation degrees, and an NEV sales forecasting index system was established using the screened indicators.
Given that NEV sales are affected by multiple aspects, this study analyzes various influencing factors of NEV sales from four dimensions—economy, technology, policy, and consumers—supported by relevant theories and literature. Indicators that can better describe the development trend of the NEV market were selected to construct the NEV sales forecasting index system. A total of 20 indicators were chosen from the four dimensions (economy, technology, policy, consumers) to form the index system, which is presented in Table 3.
To balance data accessibility and processability, this study selects data spanning from July 2018 to December 2024. Economic indicator data are sourced from the National Bureau of Statistics (NBS) (monthly/quarterly data) and the Pan-Internet Venture Capital Project Information Database, processed at a quarterly time scale. Technological indicator data are obtained from national government websites, the China Automotive Power Battery Industry Innovation Alliance, and patent databases. Policy indicator data come from national government websites, the People’s Bank of China, and the China Charging Alliance. Among consumer-related indicators, Baidu Search Index data are retrieved from Baidu Index.
For consumer-related indicators, online review data are derived from processing semi-structured text reviews, with the raw text sourced from https://www.autohome.com.cn/ and https://autowww.12365auto.com/. Autohome’s forum section aggregates a large number of users who share driving experiences, vehicle usage tips, and maintenance advice. Through this word-of-mouth sharing, potential consumers gain real-user feedback, which plays a crucial role in purchase decisions. https://www.12365auto.com/ is a leading domestic platform for collecting defective automotive product information and handling consumer complaints. Leveraging its unique advantages in collecting valid complaints, providing professional automotive product reviews, and conducting data analysis, https://www.12365auto.com/ not only helps resolve vehicle quality and service issues for car owners (offering key references for automotive consumption) but also provides authoritative data support and solutions for automakers and dealers in product R&D, quality control, and after-sales service improvement.
Given their long-term focus on the automotive sector, broad user bases, long time spans of reviews, and large review volumes, https://www.autohome.com.cn/ and https://www.12365auto.com/ are representative platforms for NEV user reviews. Thus, they are selected as the sources of online review data for NEVs in this study.
Online reviews of NEVs were crawled using the Selenium automation testing tool (in Python) and the Edge browser driver. After removing out-of-time reviews and duplicates, a total of 97,887 NEV reviews were obtained from the two platforms. The crawled content includes the posting time and detailed text of each review.
The number of reviews was extracted as a basic review information feature. For the detailed review text, features were extracted through sentiment analysis and topic modeling. Both the basic information features and review-derived features were used as specific consumer-related indicators in the NEV sales forecasting index system.
After collecting the reviews, text preprocessing was performed to facilitate sentiment analysis and topic modeling, following these steps:
Punctuation and noise removal: Punctuation in review text was deleted to avoid interference with topic modeling statistics. Raw automotive online reviews contain numerous internet symbols and emojis, which may disrupt word segmentation logic, cause irrational segmentation results, impair segmentation quality, and even lead to significant deviations between actual meanings and segmentation outcomes. Additionally, crawled text often includes incomplete and useless noise data. Thus, before text processing, data cleaning was conducted to eliminate meaningless noise, redundant reviews, and stopwords (words irrelevant to content analysis).
Stopword removal: Stopwords (e.g., conjunctions like “because”, pronouns like “we”, and adverbs like “and”) were removed using a Chinese stopword list. These words have no practical meaning but high frequency, which would interfere with topic distribution analysis.
Word segmentation: The Jieba library (in Python) was used to segment review text into individual words.
Topic modeling: Latent Dirichlet Allocation (LDA) was applied to obtain topic distribution.
Sentiment analysis: Sentiment analysis was conducted to acquire sentiment data of reviews.
Indicator integration: The processed data were used as the corresponding indicator data.
This study employs the LDA topic model for topic modeling of review text. For sentiment score calculation, the SnowNLP library (in Python) was used, which adopts a Naive Bayes classifier to categorize text into positive, neutral, and negative sentiment classes. During training, a large volume of text data was labeled to extract features of each text; the Naive Bayes classifier was then trained on these features to derive the probability of each feature corresponding to a sentiment class. These probabilities were synthesized to determine the sentiment class of the text. The sentiment method in SnowNLP outputs a score between 0 and 1 (scores closer to 1 indicate more positive sentiment, while scores closer to 0 indicate more negative sentiment).
The average semi-annual sentiment score of reviews was calculated as the text sentiment data. Reviews with a sentiment score ≥ 0.5 were classified as positive, and those with a score < 0.5 as negative. Indicators including the number of semi-annual positive/negative reviews, the average sentiment score of all semi-annual reviews, and the average sentiment score of reviews under the most probable topic were computed.
The data is presented in Table 4, where indicator names are replaced with simplified symbols; “Y” denotes quarterly NEV sales, and “Q3 2018” represents the third quarter of 2018.
Numerous factors influence NEV sales, yet an excessive number of input indicators would overcomplicate the model, hindering its ability to solve practical problems efficiently. Additionally, not all preselected indicators exhibit strong correlation or high impact on NEV sales. Therefore, it is necessary to screen the 21 preselected indicators (mentioned above) before incorporating them into the NEV sales forecasting index system as model inputs.
Among methods for analyzing NEV sales-influencing factors, grey relational analysis (GRA) has low data requirements—making it suitable for the NEV industry, where rapid development has resulted in relatively limited historical data. Moreover, GRA can comprehensively examine relationships between multiple influencing factors and sales, facilitating a holistic understanding of the sales impact mechanism.
In this study, NEV sales data were used as the reference sequence, while 20 influencing factors (including gross domestic product (GDP) and per capita disposable income of urban residents) served as comparison sequences. Due to the rapid development trend of the NEV industry, its indicator data show approximately exponential growth characteristics and significant volatility in data distribution. To improve the accuracy of subsequent analysis, the Z-score normalization method was adopted to standardize the original data: for each variable in the time series, the difference between its actual value and the mean value was divided by the variable’s standard deviation. After data normalization, grey relational analysis was conducted; the analysis results and ranking are presented in Table 5.
From Table 5, it can be observed that indicators related to technology, policy, economy, and consumers exhibit varying degrees of correlation with NEV sales—some with high correlation and others with low correlation. This can be attributed to the following reasons:
Dependence on electricity-related factors: Due to the unique nature of NEVs, their sales are particularly reliant on electricity-related factors. For instance, the technological level of power batteries in NEVs directly affects driving range—NEVs with longer ranges better meet user needs. Meanwhile, advancements in power battery technology also improve charging speed, reduce charging time, and enhance user experience.
Impact of public charging infrastructure: The distribution density of public charging piles and charging convenience directly influence users’ acceptance of NEVs. Limited by battery range, NEV consumers have higher frequency of charging needs; the popularization of charging piles provides more charging points and increases the practicality of NEVs.
Role of online user reviews: Online user reviews are direct feedback from consumers on NEVs, reflecting actual product usage experiences. Positive reviews enhance potential consumers’ purchase confidence, while negative reviews may inhibit purchase intentions. Different review topics also affect consumer purchase decisions—for example, reviews highlighting strong power performance of a specific NEV brand will attract consumers with similar preferences.
Lagged/indirect impact of the aftermarket: The automotive aftermarket (e.g., maintenance, servicing, spare parts) primarily serves existing vehicles rather than directly influencing new car purchase decisions. NEV sales depend more on pre-purchase factors such as policy incentives, technical performance, and price competitiveness; the impact of aftermarket activities on sales is lagged or indirect, resulting in relatively low correlation.
Diluted impact of interest rates: Although loan interest rates may affect car purchase costs, NEV consumers are more sensitive to direct subsidies (e.g., purchase tax exemptions, local subsidies) or usage costs (e.g., charging fees, battery leasing). If policy subsidies are substantial, the marginal impact of interest rates may be diluted.
Based on the grey relational analysis results, the overall indicator correlation is greater than 0.6, indicating a strong correlation with sales. To further improve the accuracy of the forecasting model, this study identifies indicators with a correlation greater than 0.7 (among the 21 preselected indicators) as highly correlated with NEV sales. Specifically, the top 18 indicators by correlation were selected to construct the NEV sales forecasting index system, which serves as the input data for the model. The NEV sales forecasting index system is presented in Table 6.
Finally, 18 indicators were identified to establish the NEV sales forecasting index system, which provides data input for subsequent sales forecasting.
6. Results
The prediction fitting results of the Attention-Seq2Seq model, along with the GRU neural network, Attention-GRU model, and Seq2Seq model, are presented in Figure 2, Figure 3, Figure 4 and Figure 5.
In Figure 2, the red line represents actual values, the green line denotes training data derived from the training set, and the blue line indicates test data from the test set. The test data shows a trend of first increasing then decreasing, while the actual data exhibits a linear upward trend, indicating a certain prediction error of the model.
In Figure 3, the red line is actual values, the green line is training data, and the blue line is test data. The test data trends that first increase then stabilize, contrasting with the linear upward trend of actual data, resulting in a certain prediction error.
In Figure 4, the red line represents actual values, the green line training data, and the blue line test data. The test data shows a first-increaseing-then-decreasing trend, inconsistent with the linear upward actual data, leading to a certain prediction error.
In Figure 5, the red line is actual values, the green line training data, and the blue line test data. Both the test data and actual data exhibit a linear upward trend, with the predicted data closely matching the actual values.
Detailed evaluation metrics of each model are provided in Table 7.
As shown in Table 7, compared with the GRU network, the Attention-GRU model reduces RMSE by 14.73%, MAE by 20.19%, MAPE by 19%, and SMAPE by 18.60%.
The Seq2Seq model (with GRU as both encoder and decoder) achieves higher prediction accuracy than the GRU neural network, with RMSE reduced by 15.06%, MAE by 8.16%, MAPE by 6.03%, and SMAPE by 8.7%. When compared with the Attention-GRU model, the Seq2Seq model shows a 0.39% reduction in RMSE but increases in MAE (15.06%), MAPE (16.01%), and SMAPE (12.16%), indicating mixed performance between the two models.
The Attention-Seq2Seq model outperforms the other three models across all metrics:
Versus the GRU neural network: RMSE (-53.08%), MAE (-52.35%), MAPE (-45.99%), SMAPE (-47.44%).
Versus the Attention-GRU model: RMSE (-44.97%), MAE (-40.3%), MAPE (-33.31%), SMAPE (-35.43%).
Versus the Seq2Seq model: RMSE (-44.75%), MAE (-48.11%), MAPE (-45.52%), SMAPE (-42.43%).
These comparisons confirm that the Attention-Seq2Seq model (with GRU as both encoder and decoder) delivers superior performance in multi-variable NEV sales forecasting compared to the GRU neural network, Attention-GRU, and Seq2Seq models. This is because:
Compared with standalone GRU, the encoder-decoder structure better leverages the capabilities of neural networks. The attention mechanism focuses on all parts of the input sequence (rather than just the previous time step’s output) when processing each time step’s output, enabling more effective capture of long-term dependencies in the input sequence. Additionally, the attention mechanism allows the model to flexibly focus on critical input segments and ignore irrelevant information.
While GRU can capture dependencies, it has limitations in handling complex sequences. Unlike standalone GRU (which processes input and output at each time step), the Seq2Seq model’s encoder-decoder structure transmits and utilizes information more efficiently to capture complex sequence relationships. However, traditional Seq2Seq relies on a fixed-length context vector generated by the encoder, which may cause information loss. By introducing the attention mechanism, the decoder can directly access all hidden states of the encoder, dynamically selecting relevant information to compensate for the shortcomings of fixed-length context vectors.
The attention mechanism helps the model accurately focus on key information in the input sequence, while GRU provides strong sequence modeling capabilities. Their combination enables the model to capture complex input-output relationships more precisely, thereby improving prediction accuracy.
7. Conclusions
Building on existing research, this study explores factors influencing NEV sales and constructs an NEV sales forecasting model. The key conclusions are as follows:
(1) To improve the accuracy of the forecasting model, an attention mechanism was further integrated into the neural network framework. After collecting and preprocessing sales data and indicator data, forecasting was conducted using a GRU neural network. On this basis, the performance of a Seq2Seq model (with GRU as both encoder and decoder) was evaluated, and the extent to which the attention mechanism enhances neural network prediction was verified. Experimental results show that models incorporating the attention mechanism yield better prediction performance, and the Seq2Seq model (GRU-based encoder/decoder) outperforms the standalone GRU neural network. Both the attention mechanism and Seq2Seq model better capture contextual connections while selectively focusing on critical segments of the sequence.
(2) By analyzing the current development status of the NEV industry, this study deeply identifies factors influencing NEV development. Based on research on theories such as consumer behavior, 21 characteristic indicators of influencing factors were extracted from four dimensions (economy, policy, technology, and consumers), including power battery output, number of public charging piles, per capita disposable income of residents, average sentiment score of reviews, number of NEV-related policies, and number of basic NEV patent applications in China. Grey relational analysis was used to rank these indicators by their correlation with NEV sales. Indicators such as battery output, number of public charging piles, online reviews, and consumer spending levels exert a greater impact on sales, while indicators like investment events/amounts in the automotive aftermarket and bank loan interest rates have a smaller impact. Eighteen indicators were selected based on the grey relational degree to construct the NEV sales forecasting index system.
(3) Beyond the traditional forecasting index system, this study incorporates the impact of user online reviews on NEV sales and establishes a sales forecasting model by combining online review data with traditional indicators. This not only improves model accuracy but also better accounts for demand-side factors affecting NEVs. Experimental results confirm the important role of online reviews in NEV sales forecasting research.
Author Contributions
Both authors have significantly contributed to the conceptualization, design, data acquisition, analysis, or interpretation presented in this article. All authors have read and agreed to the published version of the manuscript.
Funding
This research was funded by Projects of the 14th Five-Year Plan for Education Science in Jilin Province China (NO.GH24173).
Institutional Review Board Statement
Not applicable.
Informed Consent Statement
Not applicable.
Data Availability Statement
The raw data supporting the conclusions of this article will be made available by the authors on request.
Conflicts of Interest
The authors declare no conflict of interest.
References
- Marc, N. A note on long-run automobile demand. Journal of Marketing 1957, 22, 57–64. [Google Scholar] [CrossRef]
- Patrick, S.M. Market price and income elasticities of new vehicle demands. The Review of Economics and Statistics 1996, 78, 543–547. [Google Scholar] [CrossRef]
- Chen, D. Chinese automobile demand prediction based on ARIMA model. In Proceedings of the International Conference on Biomedical Engineering and Informatics, IEEE, 2011, 2197-2201.
- Wang, F.K.; Chang, K.K.; Tzeng, C.W. Using adaptive network-based fuzzy inference system to forecast automobile sales. Expert Systems with Applications 2011, 38, 10587–10593. [Google Scholar] [CrossRef]
- Pai, P.F.; Liu, C.H. Predicting vehicle sales by sentiment analysis of twitter data and stock market values. IEEE Access 2018, 6, 57655–57662. [Google Scholar] [CrossRef]
- Till, G.; Stephens, T.S.; Zhenhong, L.; et al. What drives the market for plug-in electric vehicles?—A review of international PEV market diffusion models. Renewable and Sustainable Energy Reviews, 2018, 93, 158–164. [Google Scholar] [CrossRef]
- Pei, L.L.; Li, Q. Forecasting quarterly sales volume of the new energy vehicles industry in China using a data grouping approach-based nonlinear grey bernoulli model. Sustainability 2019, 11. [Google Scholar] [CrossRef]
- Hyunhong, C.; Yoonmo, K. Do I have to buy i t now? A vehicle replacement model considering strategic consumer behavior. Transportation Research Part D 2019, 73. [Google Scholar] [CrossRef]
- Chandriah, K.K.; Naraganahalli, R.V. RNN/LSTM with modified Adam optimizer in deep learning approach for automobile spare parts demand forecasting. Multimedia Tools and Applications 2021, 1–15. [Google Scholar] [CrossRef]
- Kumar, S.; Singh, V.; Goel, R. Strategic forecasting for electric vehicle sales: a cutting edge holistic model leveraging key factors and machine learning technique. Transportation in Developing Economies 2024, 10. [Google Scholar] [CrossRef]
- Guo, S.; Wang, L.; Huang, K. The forecasting model of automobile sales volume based on times series. Mechanical Engineer 2013, 05, 8–10. [Google Scholar]
- Zhang, M. The prediction theory of private car ownership based on ARIMA and linear regression. Journal of Shandong Industrial Technology 2018. [Google Scholar]
- Zhang, S. Forecast of new energy vehicle market development trend based on multiple regression model. Policy Research & Exploration 2019, 01, 77. [Google Scholar]
- Chen, K.; Liu, J. Sales forecast of euler black cat new energy vehicles based on ARIMA model. Modern Industrial Economy and Informationization 2022, 12, 169–171. [Google Scholar] [CrossRef]
- Wang, X. Research on sales forecasts of cars by BP neural network. Donghua University, Shanghai, 2016.
- Ge, N.; Sun, L.; S, X.; et al. Research on sales forecast of prophet-LSTM combination model. Computer Science 2019, 46, 6. [Google Scholar]
- Zhou, Y.; Wang, H. Research on monthly sales forecasting model of new energy vehicles in China. Software Guide 2019, 18, 149–153. [Google Scholar]
- Ouyang, H.; Huang, K.; Yan, H. Prediction of financial time series based on LSTM neural network. Chinese Journal of Management Science 2020. [Google Scholar]
- Liu, J.; Zhang, M.; Peng, H.; et al. Automobile sales forecasting model based on convolutional neural network. Computer Science 2021, 48. [Google Scholar]
- Li, Y.; Wen, R.; Yang, L. The relationship between the online search data and the automobile sales—based on the keywords by text mining. Journal of Modern Information 2016, 36. [Google Scholar]
- Zhang, C.; He, J. Prediction of private car quantity in Sichuan province based on combination prediction method. Scientific and Technological Innovation 2022. [Google Scholar]
- Liu, L.; Liu, S.; Wu, L. New energy vehicle sales forecast based on siscrete time grey power model. Chinese Journal of Management Science 2024, 32, 106–114. [Google Scholar]
- Cortes, C.; Vapnik, V. Support-vector networks. Machine Learning 1995, 20, 273–297. [Google Scholar] [CrossRef]
- Le, C.Y.; Boser, B.; Denker, J.S.; et al. Backpropagation applied to handwritten zip code recognition. Neural Computation 1989, 1, 541–551. [Google Scholar] [CrossRef]
- Zaremba, W.; Sutskever, I.; Vinyals, O. Recurrent neural network regularization. arXiv 2014, arXiv:1409.2329. [Google Scholar] [CrossRef]
- Feldman, R.; Dagan, I. Knowledge discovery in textual databases. AAAI Press, 1995, 8, 112–117. [Google Scholar]
- Kim, J.; Chung, J. Analysis of Service Quality in Smart Running Applications Using Big Data Text Mining Techniques. Journal of Theoretical and Applied Electronic Commerce Research. 2024, 19, 3352–3369. [Google Scholar] [CrossRef]
- Chevalier, J.A.; Mayzlin, D. The effect of word of mouth on sales: online book reviews. Journal of Marketing Research, 2006, 43, 345–354. [Google Scholar] [CrossRef]
- Duan, W.; Gu, B.; Whinston, A.B. Do online reviews matter? An empirical investigation of panel data. Decision Support Systems, 2008, 45, 1007–1016. [Google Scholar] [CrossRef]
- Ali, N.M.; Alshahrani, A.; Alghamdi, A.M.; Novikov, B. SmartTips: Online Products Recommendations System Based on Analyzing Customers Reviews. Applied Sciences. 2022, 12, 8823. [Google Scholar] [CrossRef]
- Hong, M.; Wang, H. Research on customer opinion summarization using topic mining and deep neural network. Mathematics and Computers in Simulation, 2021, 185, 88–114. [Google Scholar] [CrossRef]
- Lee, K.Y.; Yang, S.B. The role of online product reviews on information adoption of new product development professionals. Internet Research Electronic Networking Applications & Policy, 2015, 25, 435–452. [Google Scholar] [CrossRef]
- Huang, R.; Zhang, W. Study on sentiment analyzing of internet commodities review based on Word2vec. Computer Science, 2016, 43 (Suppl. 1), 387–399. [Google Scholar]
- Berezina; Bilgihan; Cobanoglu; et al. Understanding satisfied and dissatisfied hotel customers: text mining of online hotel reviews. Journal of Hospitality Marketing & Management 2016, 38. [CrossRef]
- Sun, B.; Shen, R. Online reviews for product demand preference discrimination and customer segmentation: a case study of the smart phone data. Chinese Journal of Management Science. 2023, 31, 217–227. [Google Scholar] [CrossRef]
- Liu, J.; Li, L. MPCM: Multi-modal user portrait classification model based on collaborative learning. Information Technology & Control 2023, 52. [Google Scholar] [CrossRef]
- Fan, Z.P.; Che, Y.J.; Chen, Z.Y. Product sales forecasting using online reviews and historical sales data: A method combining the Bass model and sentiment analysis. Journal of Business Research 2017, 74, 90–100. [Google Scholar] [CrossRef]
- Ming, Z.; Chong, C. Research of automotive sales forecasting model based on data mining algorithm. Journal of Hubei University of Automotive Technology 2013. [Google Scholar]
- Wang, C.; Wang, J. Research on e-commerce inventory sales forecasting model based on ARIMA and LSTM algorithm. Mathematics 2025, 13, 1838. [Google Scholar] [CrossRef]
- Xie, W.; Zhao, W.; Ding, B. Empirical research on the impact of technological innovation on new energy vehicle sales. Sustainability 2024, 16, 8794. [Google Scholar] [CrossRef]
- Jiang, C.; Wang, X.; Zhao, W. Forecasting car sales based on consumer attention. Data Analysis and Knowledge Discovery 2021, 5, 128–139. [Google Scholar] [CrossRef]
- Wang, S.; Lin, Y.; Zhu, G.; Y, Y. Research on car sales prediction based on online reviews and Internet search. Journal of Northeastern University (Natural Science) 2023, 44, 752–760. [Google Scholar]
- Hardman, S.; Ta, L.G. Exploring the decision to adopt a high-end battery electric vehicle: role of financial and nonfinancial Motivations. Transportation Research Record 2016, 2572. [Google Scholar] [CrossRef]
- Ma, S.C.; Fan, Y.; Feng, L. An evaluation of government incentives for new energy vehicles in China focusing on vehicle purchasing restrictions. Energy Policy 2017, 110, 609–618. [Google Scholar] [CrossRef]
- Zeng, Z. Policy Research on the development of China’s new energy automobile industry from the perspective of financial support. South China University of Technology, 2020.
- Chen, Y.; Peng, G.; Zhu, Z.; et al. A novel deep learning method based on attention mechanism for bearing remaining useful life prediction. Applied Soft Computing 2020, 86, 105919. [Google Scholar] [CrossRef]
Figure 1.
Attention-Seq2Seq Model.
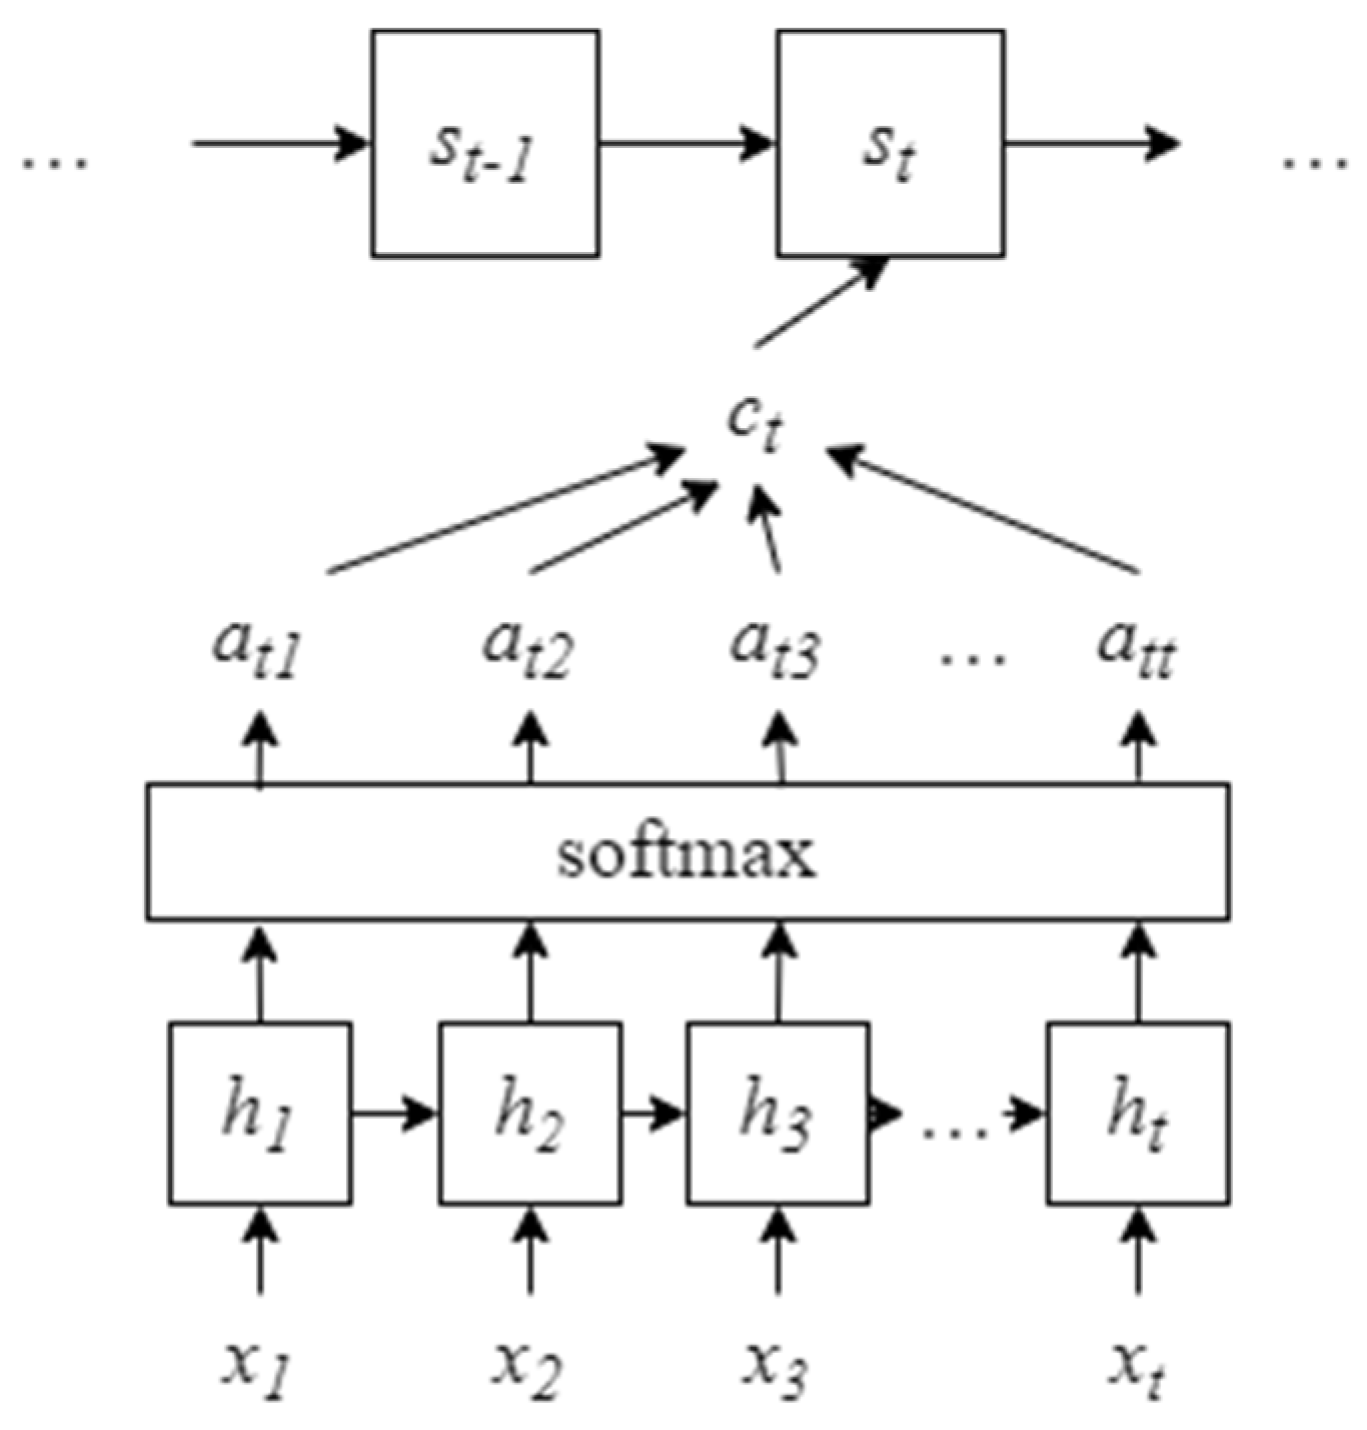
Figure 2.
GRU Sales Forecasting Model.
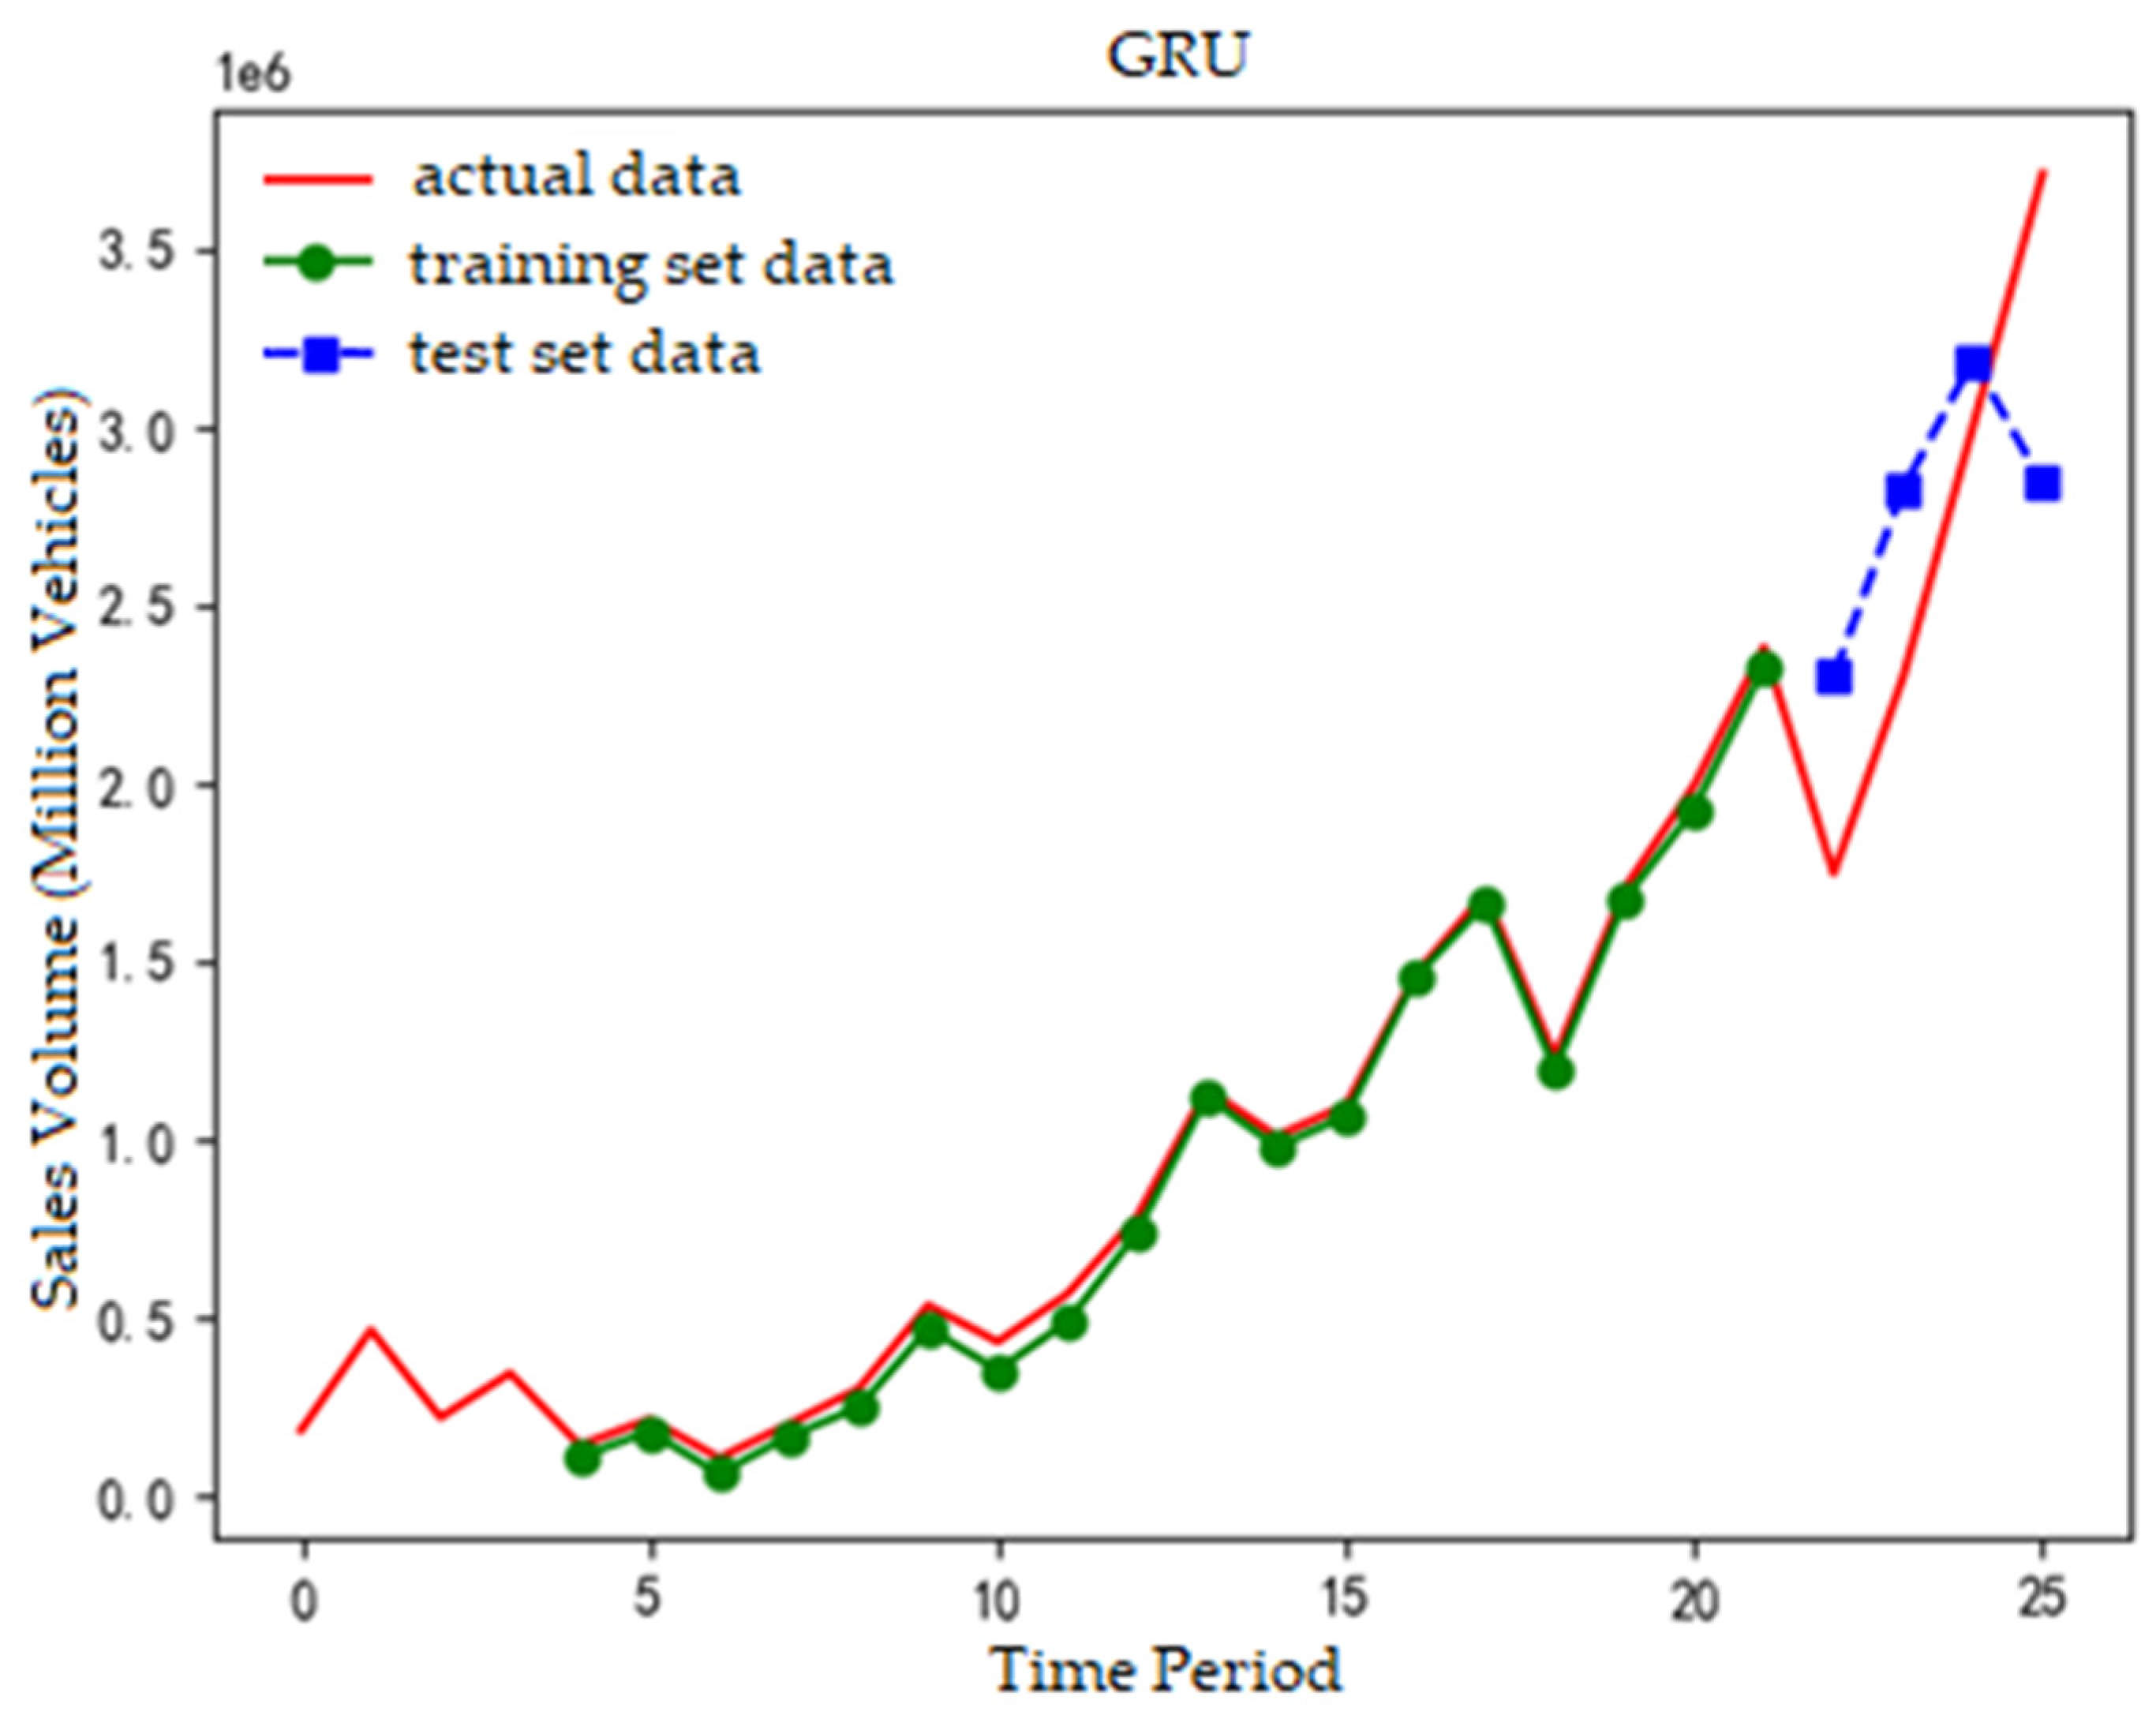
Figure 3.
Attention-GRU Sales Forecasting Model.
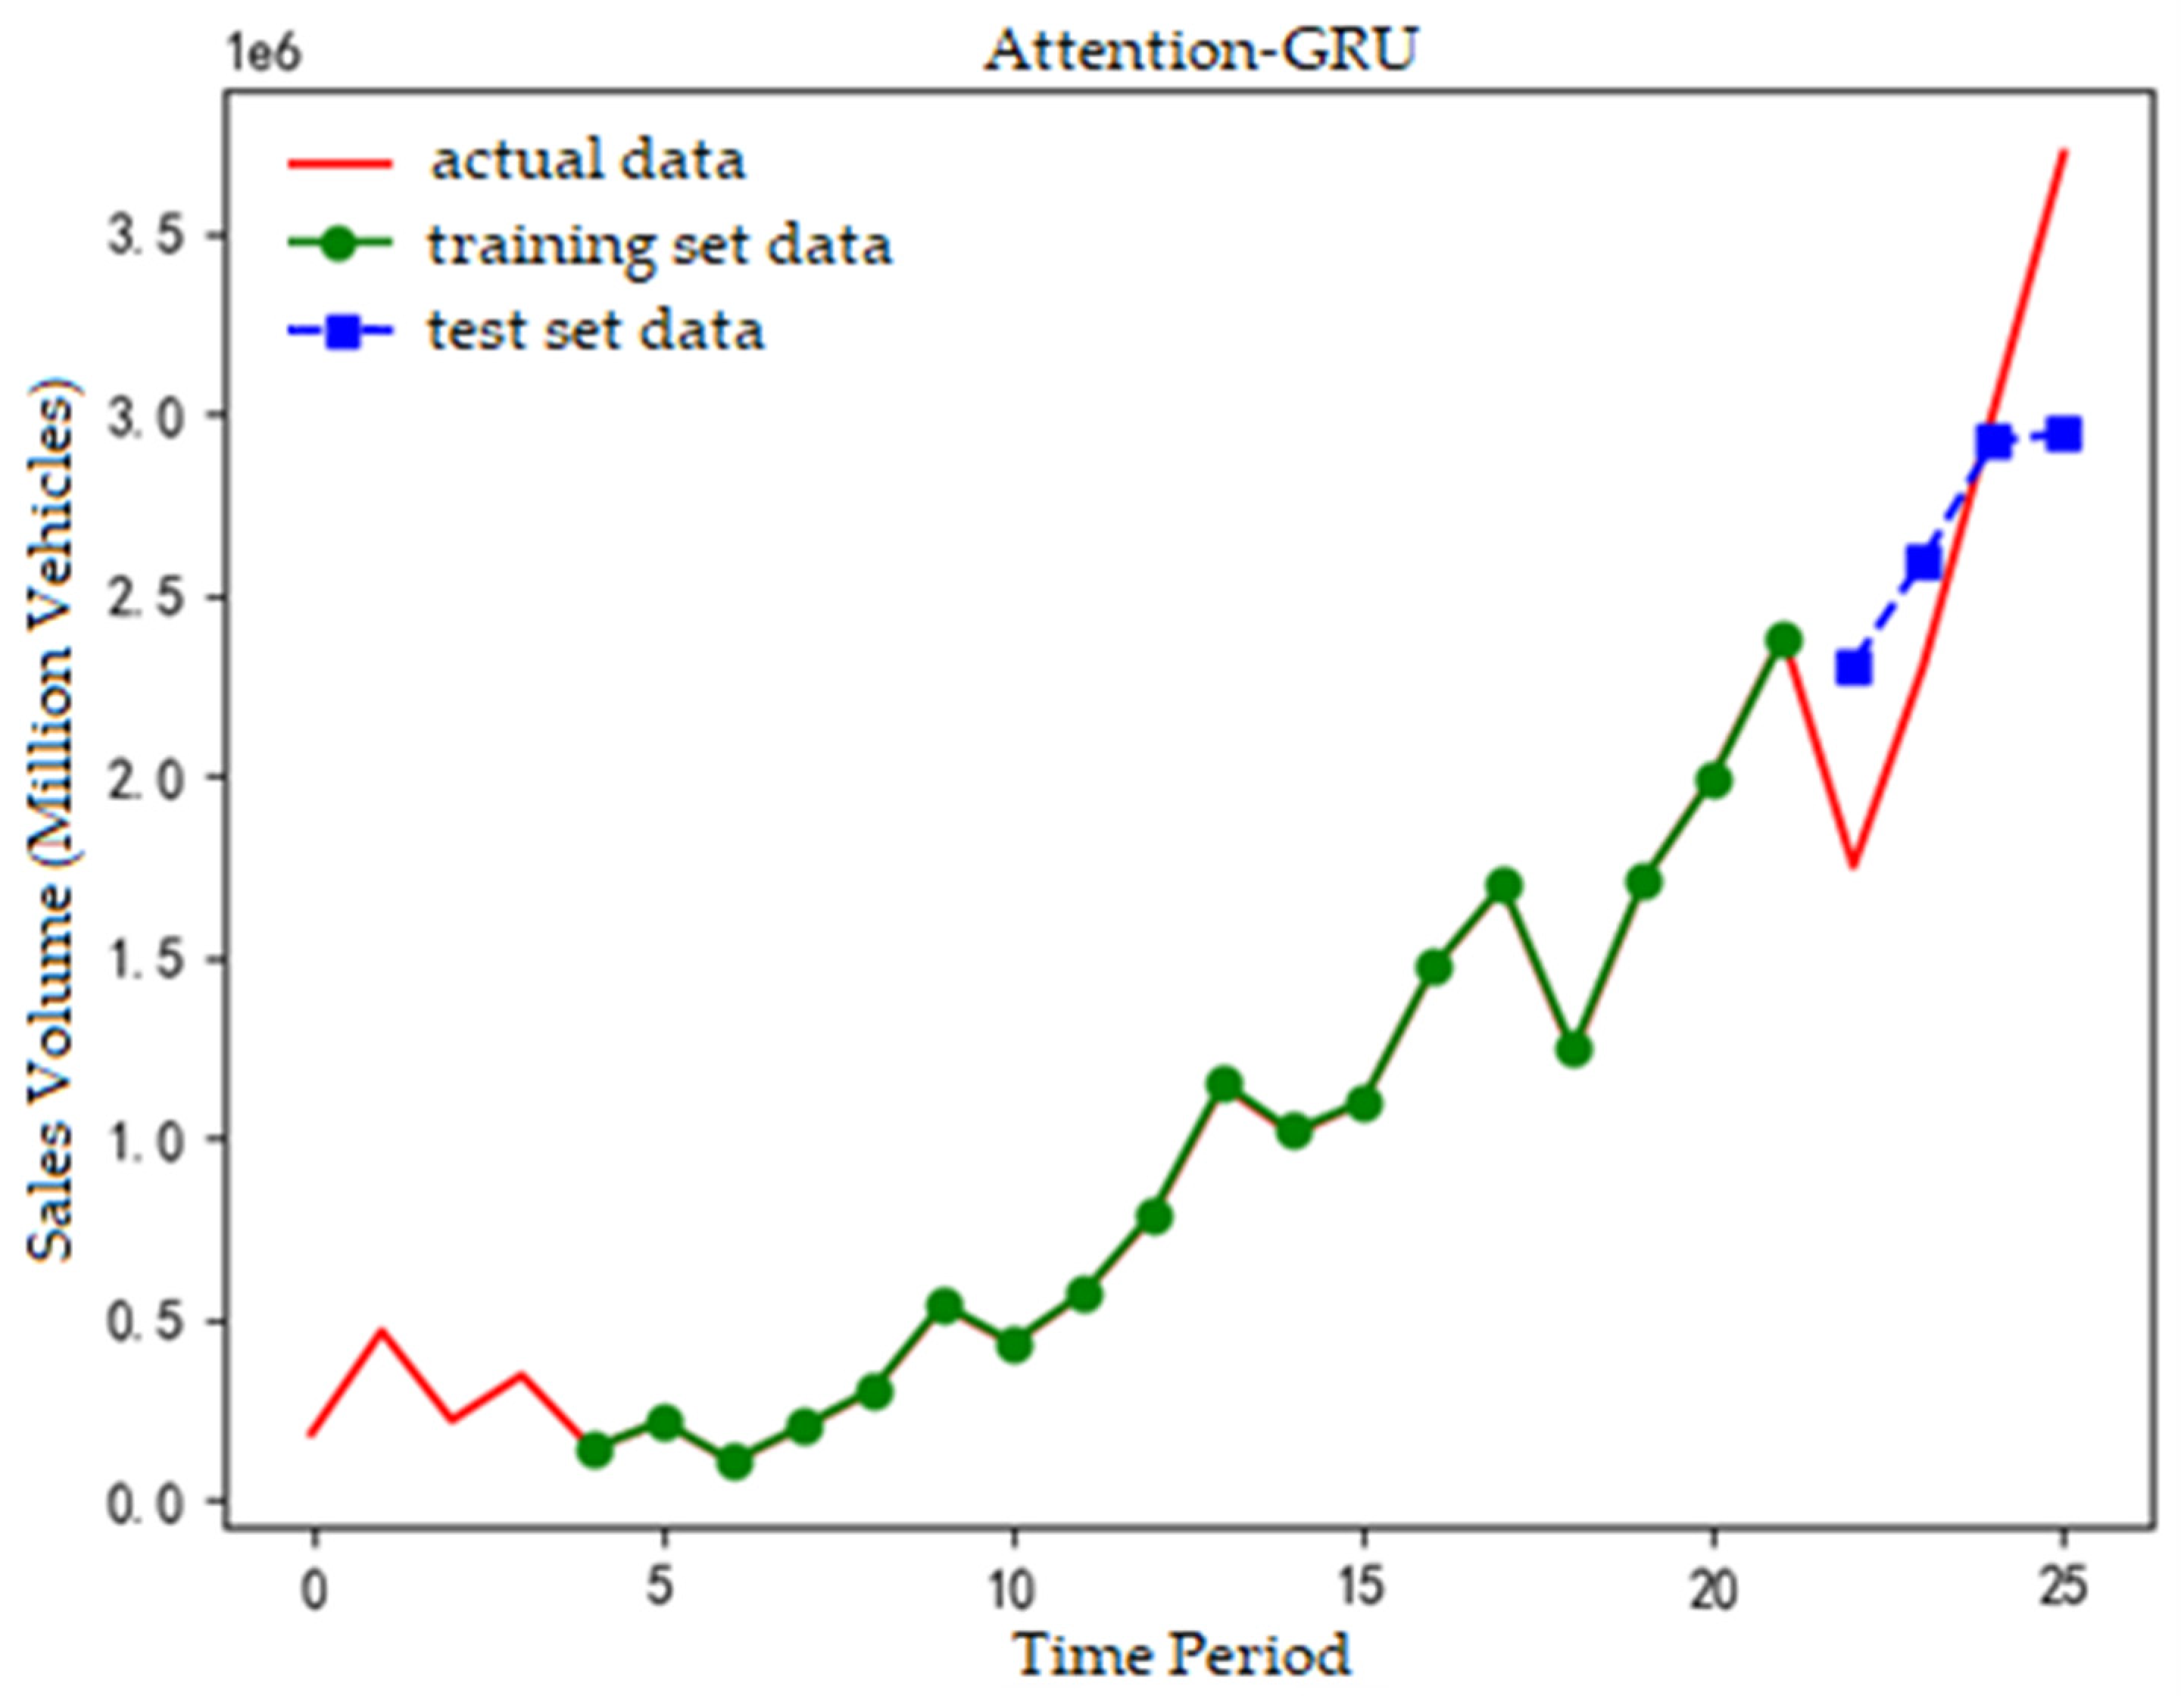
Figure 4.
Seq2Seq Sales Forecasting Model.
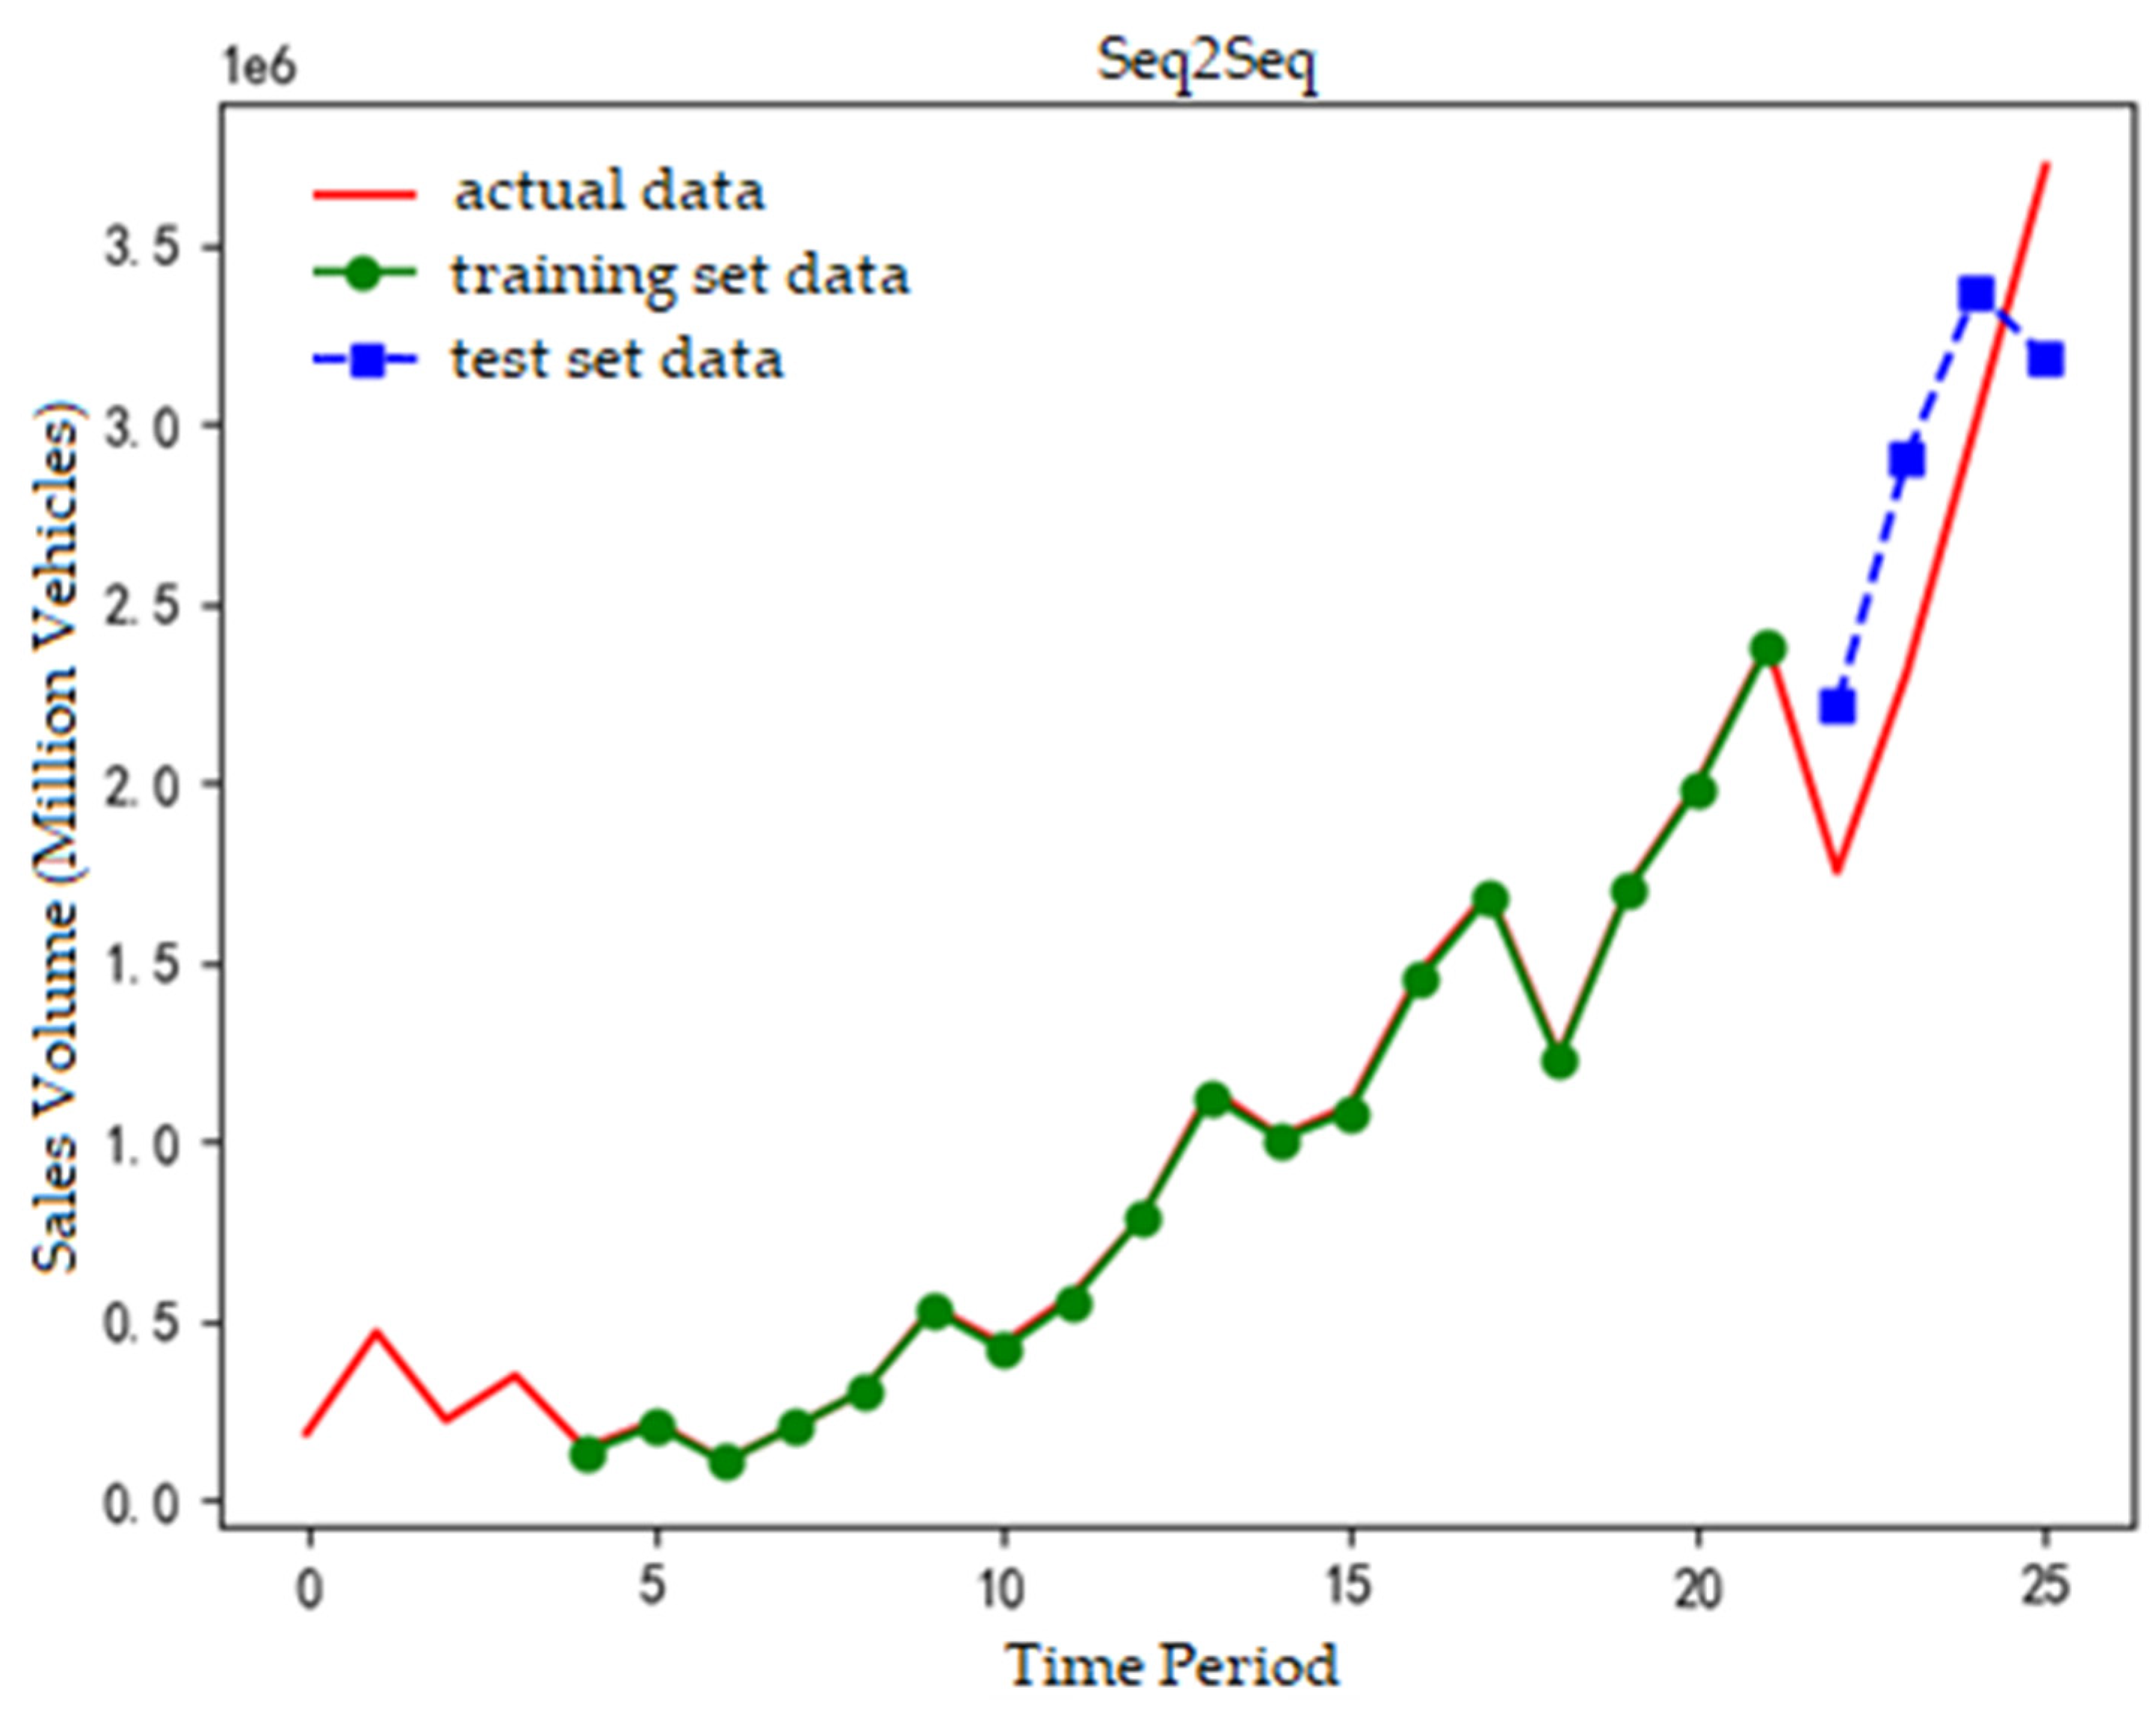
Figure 5.
Attention-Seq2Seq Sales Forecasting Model.
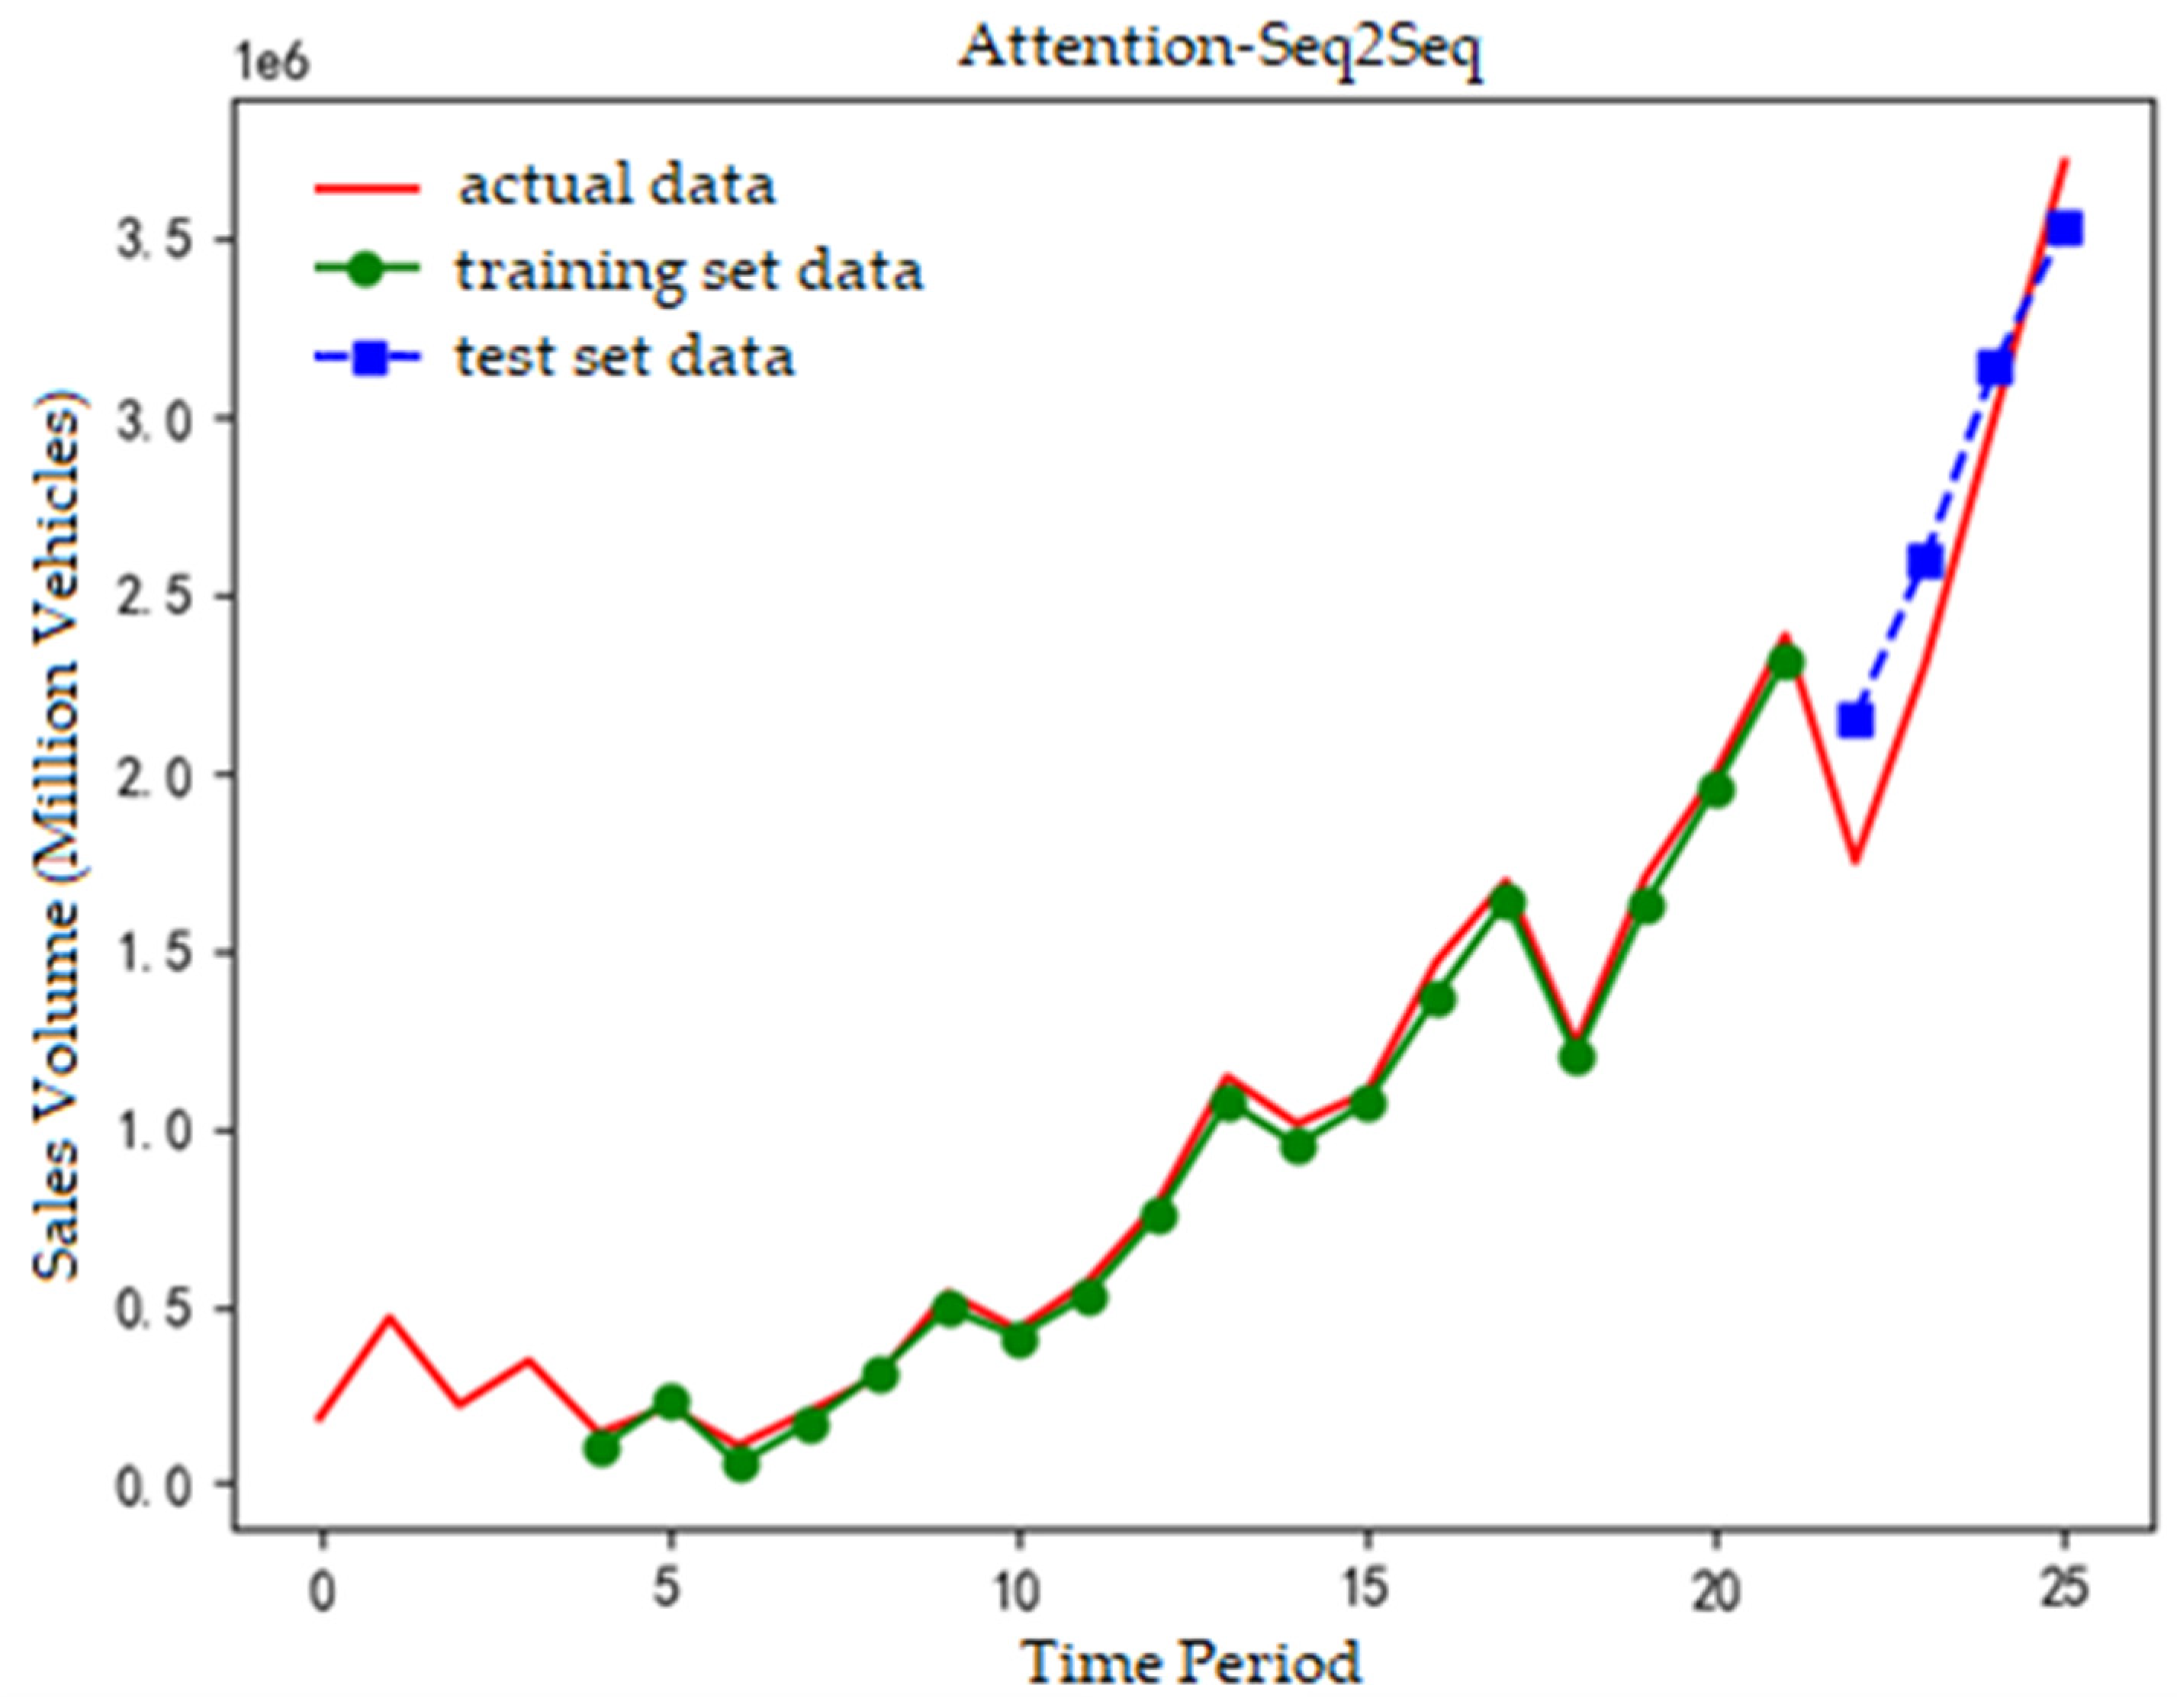

Table 1.
Quarterly Sales of New Energy Vehicles in China from 2018 to 2024.
| 2018 | 2019 | 2020 | 2021 | 2022 | 2023 | 2024 | |
| The first quarter | 220149 | 106316 | 432717 | 1010583 | 1233872 | 1749048 | |
| The second quarter | 344161 | 201151 | 566774 | 1097500 | 1706675 | 2303370 | |
| The third quarter | 184301 | 141727 | 300326 | 784300 | 1467201 | 1997438 | 3005597 |
| The fourth quarter | 465817 | 215001 | 535030 | 1143663 | 1693701 | 2385676 | 3716736 |
Table 2.
Indicator data of univariate prediction model for new energy vehicles.
| Model | RMSE | MAE | MAPE | SMAPE |
| GRU | 614099.63 | 534567.94 | 20.27% | 20.15% |
| LSTM | 853922.08 | 674150.28 | 21.81% | 25.27% |
| CNN | 847003.70 | 761006.87 | 26.67% | 31.30% |
| SVR | 1942586.60 | 1796243.31 | 63.93% | 95.61% |
Table 3.
Preliminary selection table of NEV sales forecasting index system.
| Target Layer | Criterion Layer | Indicator Layer |
| NEV Sales Forecasting Index System | Economic-related Indicators | X1 Gross Domestic Product (GDP) (100 million yuan) |
| X2 Per Capita Disposable Income of Residents (yuan) | ||
| X3 Urban Survey Unemployment Rate (%) | ||
| X4 Gasoline Price (yuan/ton) | ||
| X5 NEV Industry Investment Amount (100 million yuan) | ||
| X6 Number of NEV Industry Investment Events (item) | ||
| X7 Per Capita Consumption Expenditure of Residents (yuan) | ||
| X8 Automotive Aftermarket Industry Investment Amount (100 million yuan) | ||
| X9 Number of Automotive Aftermarket Industry Investment Events (item) | ||
| Technological-related Indicators | X10 Power Battery Output (GWh) | |
| X11 Number of Basic NEV Patent Applications in China (item) | ||
| X12 Number of NEV-related Policies (item) | ||
| Policy-related Indicators | X13 Number of Public Charging Piles (unit) | |
| X14 Bank Loan Interest Rate (%) | ||
| Consumer-related Indicators | X15 Baidu Search Index (index) | |
| X16 Number of Reviews (item) | ||
| X17 Average Sentiment Score of Reviews (%) | ||
| X18 Number of Positive Reviews (item) | ||
| X19 Number of Negative Reviews (item) | ||
| X20 Most Probable Topic of Reviews (serial number) | ||
| X21 Average Sentiment Score under the Most Probable Topic (%) |
Table 4.
Data of preliminary selection indicators for NEV sales forecasting.
| Time | Y | X1 | X2 | X3 | X4 | X5 | X6 | X7 | X8 | X9 | X10 | ||
| Q3 2018 | 184301 | 238796.8 | 6972 | 5 | 8536.667 | 122.25 | 21 | 4672 | 92.3 | 23 | 21.6 | ||
| Q4 2018 | 465817 | 263435.6 | 7193 | 4.866667 | 8257.143 | 92.07 | 24 | 5572 | 37.06 | 22 | 23.3 | ||
| Q1 2019 | 220149 | 221453.9 | 8493 | 5.2 | 7695 | 14.66 | 12 | 5538 | 154.84 | 24 | 19.8 | ||
| Q2 2019 | 344161 | 246193.9 | 6801 | 5.033333 | 7902.5 | 101.36 | 20 | 4792 | 8.13 | 11 | 23.6 | ||
| Q3 2019 | 141727 | 256023.2 | 7588 | 5.233333 | 7556 | 104.5 | 16 | 5134 | 22.22 | 22 | 20 | ||
| Q4 2019 | 215001 | 282201.4 | 7851 | 5.133333 | 7670 | 152.89 | 27 | 6095 | 27.56 | 19 | 21.9 | ||
| Q1 2020 | 106316 | 209671.1 | 8561 | 5.8 | 6905 | 43.53 | 8 | 5082 | 24.22 | 11 | 8.3 | ||
| Q2 2020 | 201151 | 253450 | 7105 | 5.866667 | 6210 | 193.4 | 19 | 4636 | 33.69 | 17 | 15.2 | ||
| Q3 2020 | 300326 | 269910.2 | 8115 | 5.566667 | 6261.667 | 135.2 | 16 | 5205 | 28.12 | 11 | 22.1 | ||
| Q4 2020 | 535030 | 301836.2 | 8408 | 5.233333 | 6253 | 161.2 | 11 | 6287 | 11.57 | 16 | 37.7 | ||
| Q1 2021 | 432717 | 255055.2 | 9730 | 5.4 | 7112.5 | 169.82 | 30 | 5978 | 65.95 | 19 | 32.8 | ||
| Q2 2021 | 566774 | 287979.2 | 7912 | 5.033333 | 7705 | 190.59 | 24 | 5493 | 171.39 | 22 | 41.9 | ||
| Q3 2021 | 784300 | 297961.9 | 8623 | 5.033333 | 7964 | 233.78 | 29 | 5804 | 74.73 | 30 | 60.1 | ||
| Q4 2021 | 1143663 | 332826.7 | 8863 | 5 | 8330 | 218.3 | 31 | 6825 | 96.1 | 23 | 84.9 | ||
| Q1 2022 | 1010583 | 277175.8 | 10345 | 5.533333 | 8940 | 235.43 | 37 | 6393 | 43.08 | 23 | 100.6 | ||
| Q2 2022 | 1097500 | 299111.5 | 8118 | 5.833333 | 10185.86 | 94.46 | 25 | 5363 | 27.19 | 19 | 105.9 | ||
| Q3 2022 | 1467201 | 315399.6 | 9187 | 5.4 | 9745.833 | 222.14 | 27 | 6122 | 101.24 | 26 | 156.4 | ||
| Q4 2022 | 1693701 | 342342.4 | 9233 | 5.566667 | 9367 | 334.45 | 37 | 6660 | 20.5 | 16 | 178.7 | ||
| Q1 2023 | 1233872 | 292368.8 | 10870 | 5.466667 | 8856.25 | 148.06 | 23 | 6738 | 19.95 | 21 | 130 | ||
| Q2 2023 | 1706675 | 316237.5 | 8802 | 5.2 | 8677.143 | 84.26 | 24 | 6001 | 13.87 | 19 | 163.7 | ||
| Q3 2023 | 1997438 | 328440.7 | 9726 | 5.166667 | 9243 | 195.97 | 34 | 6791 | 15.07 | 11 | 211.7 | ||
| Q4 2023 | 2385676 | 357224.8 | 9730 | 5.033333 | 9240.833 | 50.77 | 26 | 7266 | 7.4 | 14 | 242.7 | ||
| Q1 2024 | 1749048 | 304761.8 | 11539 | 5.233333 | 8923.75 | 127.73 | 24 | 7299 | 36.59 | 16 | 184.6 | ||
| Q2 2024 | 2303370 | 328837.6 | 9194 | 5 | 9279.167 | 66.8 | 20 | 6302 | 24.42 | 18 | 245.4 | ||
| Q3 2024 | 3005597 | 341758 | 10208 | 5.2 | 8918 | 69.9 | 18 | 7030 | 12.17 | 18 | 304.4 | ||
| Q4 2024 | 3716736 | 373726.2 | 10373 | 5.033333 | 8566.667 | 233.35 | 26 | 7596 | 20.13 | 19 | 355.4 | ||
| Time | X11 | X12 | X13 | X14 | X15 | X16 | X17 | X18 | X19 | X20 | X21 | ||
| Q3 2018 | 6610 | 46 | 284652 | 4.4 | 6177 | 220 | 0.783065 | 172 | 48 | 1 | 0.925372 | ||
| Q4 2018 | 8124 | 35 | 331294 | 4.5 | 6914 | 255 | 0.767942 | 193 | 62 | 1 | 0.921265 | ||
| Q1 2019 | 4602 | 24 | 383571 | 4.264167 | 5183 | 283 | 0.823184 | 233 | 50 | 1 | 0.949958 | ||
| Q2 2019 | 6295 | 25 | 411619 | 4.264167 | 4156 | 537 | 0.839123 | 451 | 86 | 1 | 0.939131 | ||
| Q3 2019 | 6818 | 24 | 466101 | 4.225 | 3868 | 825 | 0.859542 | 710 | 115 | 1 | 0.938503 | ||
| Q4 2019 | 8578 | 27 | 516396 | 4.166667 | 3444 | 747 | 0.863146 | 643 | 104 | 1 | 0.950768 | ||
| Q1 2020 | 4807 | 18 | 541672 | 4.083333 | 3167 | 561 | 0.825094 | 465 | 96 | 1 | 0.930557 | ||
| Q2 2020 | 7786 | 38 | 558422 | 3.85 | 3074 | 1040 | 0.886634 | 924 | 116 | 1 | 0.932917 | ||
| Q3 2020 | 9257 | 24 | 605991 | 3.85 | 4537 | 1515 | 0.874337 | 1326 | 189 | 1 | 0.951711 | ||
| Q4 2020 | 10645 | 26 | 807398 | 3.85 | 4240 | 1909 | 0.90498 | 1731 | 178 | 1 | 0.964121 | ||
| Q1 2021 | 6729 | 20 | 850590 | 3.85 | 3960 | 1736 | 0.909059 | 1583 | 153 | 1 | 0.965397 | ||
| Q2 2021 | 7774 | 27 | 923381 | 3.85 | 4423 | 2511 | 0.889705 | 2236 | 275 | 1 | 0.964062 | ||
| Q3 2021 | 9614 | 33 | 1044337 | 3.85 | 4570 | 3370 | 0.865922 | 2920 | 450 | 1 | 0.971137 | ||
| Q4 2021 | 11334 | 26 | 1146956 | 3.833333 | 4695 | 4758 | 0.869939 | 4142 | 616 | 1 | 0.964045 | ||
| Q1 2022 | 7412 | 33 | 1231825 | 3.7 | 5371 | 3905 | 0.880627 | 3444 | 461 | 1 | 0.976571 | ||
| Q2 2022 | 10414 | 33 | 1527867 | 3.7 | 6789 | 5414 | 0.908547 | 4926 | 488 | 1 | 0.97022 | ||
| Q3 2022 | 11448 | 38 | 1635826 | 3.666667 | 11823 | 5462 | 0.926735 | 5066 | 396 | 1 | 0.982156 | ||
| Q4 2022 | 12892 | 34 | 1797488 | 3.65 | 4211 | 6914 | 0.923398 | 6389 | 525 | 1 | 0.981575 | ||
| Q1 2023 | 9105 | 31 | 1958173 | 3.65 | 6286 | 6374 | 0.929679 | 5931 | 443 | 1 | 0.986164 | ||
| Q2 2023 | 12098 | 30 | 2148583 | 3.616667 | 12085 | 5652 | 0.928127 | 5252 | 400 | 1 | 0.981508 | ||
| Q3 2023 | 12604 | 22 | 2461556 | 3.483333 | 5520 | 5410 | 0.928937 | 5031 | 379 | 2 | 0.862749 | ||
| Q4 2023 | 14272 | 65 | 2726003 | 3.45 | 5031 | 5229 | 0.925197 | 4840 | 389 | 2 | 0.883118 | ||
| Q1 2024 | 8772 | 29 | 2908911 | 3.45 | 38128 | 4150 | 0.936017 | 3889 | 261 | 2 | 0.873313 | ||
| Q2 2024 | 10036 | 19 | 3121811 | 3.45 | 51408 | 6218 | 0.933388 | 5803 | 415 | 2 | 0.859522 | ||
| Q3 2024 | 7533 | 8 | 3328570 | 3.35 | 9380 | 8188 | 0.938612 | 7689 | 499 | 2 | 0.87274 | ||
| Q4 2024 | 4853 | 12 | 3579043 | 3.1 | 11560 | 12799 | 0.917418 | 11755 | 1044 | 2 | 0.834208 | ||
Table 5.
The result of grey relational analysis.
| Evaluation Item | Relational Grade | Ranking |
| X10 Power Battery Output | 0.966 | 1 |
| X13 Number of Public Charging Piles | 0.933 | 2 |
| X18 Number of Positive Reviews | 0.909 | 3 |
| X16 Number of Reviews | 0.905 | 4 |
| X1 GDP | 0.872 | 5 |
| X19 Number of Negative Reviews | 0.86 | 6 |
| X7 Per Capita Consumption Expenditure of Residents | 0.844 | 7 |
| X20 Most Probable Topic of Reviews | 0.84 | 8 |
| X17 Average Sentiment Score of Reviews | 0.822 | 9 |
| X4 Gasoline Price | 0.819 | 10 |
| X2 Per Capita Disposable Income of Residents | 0.817 | 11 |
| X15 Baidu Search Index | 0.799 | 12 |
| X11 Number of Basic NEV Patent Applications in China | 0.793 | 13 |
| X12 Number of NEV-related Policies | 0.761 | 14 |
| X6 Number of NEV Industry Investment Events | 0.758 | 15 |
| X5 NEV Industry Investment Amount | 0.727 | 16 |
| X3 Urban Survey Unemployment Rate | 0.716 | 17 |
| X8 Automotive Aftermarket Industry Investment Amount | 0.709 | 18 |
| X9 Number of Automotive Aftermarket Industry Investment Events | 0.693 | 19 |
| X21 Average Sentiment Score under the Most Probable Topic | 0.672 | 20 |
| X14 Bank Loan Interest Rate | 0.654 | 21 |
Table 6.
NEV sales forecasting index system.
| Target Layer | Criterion Layer | Indicator Layer |
| NEV Sales Forecasting Index System | Economic-related Indicators | X1 GDP |
| X2 Per Capita Disposable Income of Residents | ||
| X3 Urban Survey Unemployment Rate | ||
| X4 Gasoline Price | ||
| X5 NEV Industry Investment Amount | ||
| X6 Number of NEV Industry Investment Events | ||
| X7 Per Capita Consumption Expenditure of Residents | ||
| X8 Automotive Aftermarket Industry Investment Amount | ||
| Technological-related Indicators | X10 Power Battery Output | |
| X11 Number of Basic NEV Patent Applications in China | ||
| X12 Number of NEV-related Policies | ||
| Policy-related Indicators | X13 Number of Public Charging Piles | |
| Consumer-related Indicators | X15 Baidu Search Index | |
| X16 Number of Reviews | ||
| X17 Average Sentiment Score of Reviews | ||
| X18 Number of Positive Reviews | ||
| X19 Number of Negative Reviews | ||
| X20 Most Probable Topic of Reviews |
Table 7.
Indicator data of NEV forecasting model.
| Model | RMSE | MAE | MAPE | SMAPE |
| Attention-Seq2Seq | 275473.70 | 254803.62 | 11.37% | 10.57% |
| Seq2Seq | 498632.88 | 491080.69 | 19.78% | 18.36% |
| Attention-GRU | 500606.98 | 426794.62 | 17.05% | 16.37% |
| GRU | 587055.11 | 534739.12 | 21.05% | 20.11% |
Disclaimer/Publisher’s Note: The statements, opinions and data contained in all publications are solely those of the individual author(s) and contributor(s) and not of MDPI and/or the editor(s). MDPI and/or the editor(s) disclaim responsibility for any injury to people or property resulting from any ideas, methods, instructions or products referred to in the content. |
© 2025 by the authors. Licensee MDPI, Basel, Switzerland. This article is an open access article distributed under the terms and conditions of the Creative Commons Attribution (CC BY) license (http://creativecommons.org/licenses/by/4.0/).
Copyright: This open access article is published under a Creative Commons CC BY 4.0 license, which permit the free download, distribution, and reuse, provided that the author and preprint are cited in any reuse.


