Submitted:
03 October 2025
Posted:
08 October 2025
You are already at the latest version
Abstract
The Niger Delta faces severe ecological stress, with anthropogenic stressors and pollution contributing to species depauperation and declining ecosystem integrity. Plankton, as keystone and sensitive bioindicators, provide critical insights into trophic interactions and ecosystem health. This study employed a mixed-method study design involving field sampling, ecological surveys, and ethnobiological questionnaires to examine plankton distribution in the Otuoke Creek channel. Water samples from three randomly selected locations (each with two sampling points) were analyzed alongside physicochemical parameters (temperature, DO, BOD, TDS, turbidity, conductivity, pH) and meteorological factors (humidity, wind speed, temperature). Findings revealed significant variation in plankton abundance, diversity, and trophic structure, driven by climatic conditions, anthropogenic pollution, natural dynamics and ethnobiological practices. Species distribution followed an atypical trophic sequence: phytoplankton (Autotrophs, 76.6%, n=372) > phyto-zooplanktivores (Omnivores, 21%, n=103) > phytoplanktivores (Herbivores, 1.4%, n=8) > zooplanktivores (Carnivores, 1%, n=5). These patterns suggest interactive stressor effects (synergistic, antagonistic, or additive) that influence ecosystem resilience. Ethnobiological data further underscored awareness and role of human activities in nutrient enrichment and habitat alteration. Overall, the study demonstrates that plankton communities serve as effective indicators of environmental change and should inform adaptive management, conservation, and community-driven monitoring strategies in the Niger Delta.
Keywords:
plankton
; environmental pollution
; ethnobiology
; trophic level
; aquatic-ecosystem health
1. Introduction
Plankton communities, comprising phytoplankton (e.g., Diatoms, Melosira, Navicula, Closterum, Spirogyra) and zooplankton (e.g., Copepods, Rotifers, Cladocerans), underpin aquatic food webs through nutrient cycling and energy transfer (Dexter & Bollens, 2020; Wu et al., 2022). Phytoplankton act as primary producers, while zooplankton link primary production to higher trophic levels, regulating biodiversity and ecosystem stability (Baumgartner et al., 2020; Uwadiae, 2020). Their dynamics in inland waters reflect hydrological, physicochemical, climatic, and anthropogenic drivers, including oil pollution, dredging, and land-use change (Qu et al., 2018; Yang et al., 2021; Edegbene et al., 2020).
Pollution remains a persistent stressor in the Niger Delta, with contaminants like hydrocarbons and heavy metals suppressing plankton growth, survival, and reproduction (Ogamba et al., 2021; Sikoki & Zabbey, 2017). Reports from the Nun and Orashi rivers highlight declines in phytoplankton diversity and fish production following oil spills (Davies & Ugwumba, 2019; Zabbey & Tanee, 2019). Dredging, common in the creeks of the Niger Delta, elevates turbidity and disrupts habitats, reducing plankton abundance and altering community composition (Ohimain et al., 2019; Abowei & Sikoki, 2017).
Seasonality further modulates plankton distribution. Wet-season runoff enriches nutrients, driving phytoplankton blooms, while dry-season flows concentrate pollutants and reduce habitat quality (Edegbene et al., 2021; Akinyemi & Nwankwo, 2020). Similar patterns in the Ogun and Imo rivers suggest that climatic variability strongly influences community structure (Ugbomeh & Atubi, 2019). Intensifying rainfall and flooding linked to climate change may exacerbate these effects (Nwankwoala & Mmom, 2019).
The ecological vulnerability of the Niger Delta is amplified by socio-economic reliance on artisanal fisheries. Plankton declines reduce fish yields, undermining food security and local livelihoods (Akintoye & Obi, 2021; Udo & Akpan, 2021). Despite evidence that over 60% of communities depend on fisheries, ethnobiological and socio-economic consequences remain poorly quantified (Ogamba et al., 2021; Nwankwoala & Mmom, 2019).
Plankton therefore represent sensitive bioindicators of environmental change. Understanding their dynamics under combined anthropogenic and climatic stress is essential for developing community-based conservation and sustainable management strategies in the inland drainages of the wider Niger Delta (Zabbey & Uyi, 2018; Ekubo & Abowei, 2019).
2. Materials and Methods
Study Area
The study was conducted in Otuoke Creek (Lat. 4.75° N, Long. 6.50° E), a freshwater body in Ogbia Local Government Area, Bayelsa State, Nigeria. The creek supports diverse aquatic organisms, including plankton, and is influenced by spatial changes, temporal changes and by anthropogenic activities (like fishing and domestic use). The study area is characterized by distinct wet (April to October) and dry (November to March) seasons (Edegbene et al., 2021; Akinyemi and Nwankwo, 2020).
Sampling, Collection and Identification
The study was a mixed-method observational study design (descriptive-observational-field and cross sectional study design) employing the use of ecology, field observations, and questionnaires. Sample locations were chosen at random with three sampling locations selected, namely: Community, Otuaba, and Azikiel Watersides (Table 1). Field sampling was conducted in the early hours between 07:00hrs and 10:00hrs. Water samples were collected using standard conical plankton net (55 µm mesh, 30 cm mouth diameter) by slanting the net in the opposite direction of water currents, towing the plankton net horizontally for 3 to 5 minutes and transferring the water samples into 500ml dark water sampling bottles.
At the laboratory, water samples were allowed to settle, gently allowing particles to concentrate. An aliquot was placed directly onto a glass slide using a pipette and observed under a compound microscope (100× to 400× magnification) for any plankton species. Detailed Identification to genus and species level was done using identification guides and standard keys for easy observations of individuals per taxon. Questionnaires (21) were organized and distributed to respondents in the three locations respectively (7 questionnaires per location). This was done to gather data on ethnobiological activities, cues and orientations relating to the creek and anthropogenic impacts.
Water Physicochemical Analysis
Water physicochemical characteristics were measured for each sampling location to assess underlying conditions. The parameters included temperature (oC), pH, conductivity (COD), total dissolved solids (TDS), biological oxygen demand (BOD), turbidity (TURB) and dissolved oxygen (DO). Temperature was estimated using a digital thermometer, pH using a digital pH meter, conductivity using a digital conductivity meter, TDS using a total solid concentration meter, while dissolved oxygen was estimated using Winkler titration method.
Environmental Diversity Indices
Estimation of diversity indices was used to evaluate ecological health, plankton diversity and community structure based on identified taxa. These was achieved using: Shannon-Wiener Index (H’), Margalef’s Richness Index (D), Pielou’s Evenness Index (J), and Simpson’s Dominance Index.
Data and Statistical Analysis
Organized data were illustrated and represented as tables. Microsoft-Excel was used to compute data, estimate statistical data and to also convert data to illustrations.
3. Results
Results were cumulated and presented in tables. Table 1 details sampling locations, their descriptions while Table 2 meteorological conditions where water samples were collected. Table 3a posits an account of the abundance, diversity, and trophic levels of phytoplankton and zooplankton across various locations (L1, L2, and L3; Figure 1). Table 3b gives an account of all phytoplankton species and individuals (autotrophs) observed while Table 3c gives account of the zooplankton species (heterotrophs), individuals observed and their various trophic levels. Based on the observed plankton species data, diversity indices were calculated (Table 4) for both phytoplankton (P) and zooplankton (Z) in all three locations. The indices estimated, include: Shannon-Wiener Index (H’), Margalef’s Richness Index (D), Pielou’s Evenness Index (J), and Simpson’s Dominance Index (1-D). Water physicochemical parameters were estimated to assess hydrologic conditions affecting plankton diversity (Table 5). This section explores awareness and investigation through ethnobiological questionnaire survey (Table 6a-d). Questionnaire data on demographic responses, ethnobiological knowledge and investigation, responses to change, domestic activities carriedout within and around the creek channel.
4. Discussion
Field observations (Table. 1.) and ethnobiological surveys (Table 6a-d) revealed that Otuoke Creek is central to community life, supporting transport, fishing, and domestic activities, but also subjected to waste disposal and other anthropogenic pressures. Such interactions are consistent with reports that human settlements and socioeconomic activities significantly alter habitats like aquatic ecosystems, often leading to pollution and long-term ecological stress (Issaksson, 2018).
Meteorological variables such as temperature, humidity, and wind speed emerged as important drivers of plankton dynamics (Table 2.). Temperature influenced species richness by favoring heat-tolerant taxa while reducing sensitive ones, whereas wind-driven mixing enhanced productivity up to a threshold but reduced stability under excessive turbulence. High relative humidity stabilized aquatic conditions, supporting plankton persistence. Uzoekwe et al. (2025), also posited atmospheric mositure as media for contaminant introduction into aquatic ecosystems. These findings agree with previous reports on climate-linked variability in freshwater plankton communities (Righetti et al., 2022; Jacob et al., 2024; IPCC, 2021).
Community composition (Table 3a, b and c) showed a dominance of phytoplankton (76.6%) followed by phyto-zooplanktivores (21%), phytoplanktivores (1.4%), and zooplanktivores (1%). Such trophic structuring, with phytoplankton dominance and limited higher-level consumers, suggests environmental perturbation and reduced resilience (Ugbomeh & Atubi, 2019; Akinyemi & Nwankwo, 2020). Diversity indices (Table. 4) further highlighted spatial variation: Station 2 exhibited the highest Shannon-Wiener and Simpson values, reflecting stable conditions and even distribution of species, whereas Station 3 recorded the lowest indices, indicating ecological stress likely associated with anthropogenic perturbation, nutrient limitation or pollution inputs.
Physicochemical parameters (pH 6.5–6.8, DO 4.2–4.3 mg/L, BOD 2.4–2.5 mg/L, turbidity 23–24 NTU, and TDS 15–28 ppm; Table. 5) indicated moderately supportive water quality, though values suggested potential for organic loading and light limitation. These conditions align with earlier observations that physicochemicals like moderate BOD and turbidity sustain productivity but can impair sensitive taxa when elevated (Pandey et al., 2014; Inyang et al., 2022).
Ethnobiological data (Table 6a, b, c, and d) confirmed that local communities are aware of ecological changes and pollution sources, including oil spills, defaecation, and waste disposal. However, the persistence of harmful practices such as refuse dumping and bathing within the creek underscores a gap between awareness and sustainable action. Similar studies have shown that integrating traditional ecological knowledge with scientific monitoring enhances biodiversity conservation and promotes culturally relevant management strategies (Rodrigues et al., 2022; Lee, 2025).
The observed variability in plankton abundance and diversity across the three creek locations reflects the combined influence of multiple stressors, including natural dynamics, crude oil pollution, domestic effluents, dredging activities, and fluctuating physicochemical parameters. According to Heys et al. (2016), these drivers of change often interact in complex ways, producing additive, antagonistic, or synergistic effects on aquatic communities. In some cases, the impacts might be additive and cause reductions in phytoplankton density. The combined contributions of stressors like elevated turbidity and petroleum hydrocarbons, each exert a measurable but predictable share of the decline. Conversely, antagonistic interactions could elevate turbidity from dredging activity. This can reduce photosynthetic efficiency, may simultaneously shield phytoplankton from direct oil toxicity and solar radiation, thereby moderating the expected degree of mortality or affecting photosynthetic species.
More critically, synergistic interactions could occur. Low dissolved oxygen levels could co-occur with hydrocarbon contamination or other stressors, producing disproportionate reductions in zooplankton abundance. The joint stress of hypoxia and petroleum toxicity can likely amplify the vulnerability of sensitive taxa, accounting for the sharper biodiversity declines observed in some stations relative to others. This complex interactions and ecological perspective underscores the importance of adopting multistressor management approaches in accounting for the ecological consequences, mitigating the risks to biodiversity and sustaining ecosystem services in oil-producing creeks of the Niger Delta.
Overall, the findings suggest that plankton communities in the creek reflect the combined influence of physicochemical variability, climatic fluctuations, and anthropogenic pressures. The observed patterns reduced trophic balance, spatial heterogeneity in diversity, and ethnobiological drivers indicate that the ecosystem is under moderate stress but could worsen with further perturbation. Research is continuous and can not be exhausted. Continued monitoring, coupled with the incorporation of community knowledge into management frameworks, is essential to safeguard ecological integrity and ensure sustainable use.
5. Conclusion
This study elucidates how ecological, physicochemical, meteorological, and ethnobiological factors collectively shape plankton diversity in Otuoke Creek. Marked spatial differences in plankton community structure were closely tied to fluctuations in temperature, dissolved oxygen, pH, and nutrient loads, influenced by both climatic variability and anthropogenic pressures. Seasonal rainfall amplified contaminant inputs, with waste disposal, agricultural chemicals, effluents, leachates, crude oil spills, and domestic activities identified as key pollution drivers. These stressors likely act through additive, antagonistic, or synergistic interactions, altering plankton abundance and diversity, thereby signaling ecosystem stress.
Ethnobiological practices emerged as critical determinants of ecosystem health. Communities engaged in sustainable fishing, pollution control, and habitat management maintain higher trophic diversity, whereas unsustainable practices reduced biodiversity. Plankton thus serve as sentinels of ecological integrity, reflecting the interplay between natural and anthropogenic stressors.
Conclusively, findings emphasize the need for integrated management approaches that combine environmental monitoring with community participation. Strengthening traditional ecological knowledge alongside scientific assessments can enhance conservation outcomes. Long-term monitoring and adaptive strategies are essential to safeguard biodiversity, sustain ecosystem services, and guide resource management in Otuoke Creek and comparable freshwater systems.
Conflict of Interest
The corresponding author is the innovator of this research and the co-authors contributed into writing and investigation. However there were no conflicts of interests that relatively affect the study.
References
- Abowei, J.F.N. , and Sikoki, F.D. Impact of dredging on aquatic ecosystems in the Niger Delta. Journal of Environmental Protection 2017, 8(11), 1345–1356. [Google Scholar]
- APHA. Standard Methods for the Examination of Water and Wastewater (23rd ed.). Accessed 23rd June 2017, 2025.
- Akintoye, O.A., and Obi, C.N. Water quality dynamics in the Niger Delta: Implications for aquatic ecosystems. Journal of Water Resource and Protection 2021, 13 (4), 245–260.
- Akinyemi, S.A., and Nwankwo, D.I. Seasonal dynamics of phytoplankton in the Ogun River, Nigeria. African Journal of Aquatic Science 2020, 45(3), 345–354.
- Barcelona Field Studies Centre, (2025.) Simpson’s Diversity Index. https://geographyfieldwork.com/Simpson’sDiversityIndex.html. Accessed 23 July, 2025.
- Baumgartner, M.T., Piana, P.A., Baumgartner, G., and Gomes, L.C. Zooplankton community structure in subtropical reservoirs: The role of environmental and morphometric factors. Hydrobiologia 2020, 847 (3), 805–821.
- Burian, A., Mauersberger, R., and Winder, M. Zooplankton community responses to environmental stressors in temperate lakes. Freshwater Biology 2020, 65(7), 1234–1246.
- Cefas. Relative Margalef diversity index - Marine online assessment tool. https://moat.cefas.co.uk/biodiversity-food-webs-and-marine-protected-areas/benthic-habitats/relative-margalef-diversity-index/. Accessed 23 July 2023, 2025.
- Davies, O.A., and Ugwumba, A.A.A. Plankton community structure in response to oil pollution in the Nun River, Nigeria. Journal of Applied Sciences and Environmental Management 2019, 23(6), 1075–1082.
- Dexter, E. , and Bollens, S.M. Modeling the trophic impacts of invasive zooplankton in a highly invaded river. PLOS ONE 2020, 15(12), e0243002. [Google Scholar] [CrossRef] [PubMed]
- Edegbene, A.O., Arimoro, F.O., and Odoh, O. Seasonal variation in macroinvertebrate and plankton communities in relation to water quality in a tropical river. Ecohydrology & Hydrobiology 2020, 20(4), 572–584.
- Edegbene, A.O. , Arimoro, F.O., and Odume, O.N. Exploring the distribution patterns of macroinvertebrates in response to water quality and habitat variables in tropical rivers. Environmental Monitoring and Assessment 2021, 193(5), 1–15. [Google Scholar]
- Environmental Protection Agency-US.EPA. Climate Change Impacts and Risk Analysis (CIRA). https://www.epa.gov/cira. Accessed 23 June 2025, 2025.
- Ezenwa, I.M., and Omoigberale, M.O. Phytoplankton diversity in response to water quality in the Ethiope River, Nigeria. Journal of Aquatic Sciences 2019, 34(1), 15–24.
- Heys, K., Shore, R., Pereira, M., Jones, K. and Martin, F. (2016). Risk assessment of environmental mixture effects. Royal Society of Chemistry Adv. 6.
- Intergovernmental Panel on Climate Change-IPCC. (2021). Intergovernmental Panel on Climate Change’s Sixth Assessment Report. Https//www.ipcc.ch). Accessed 23 June, 2025.
- nyang A.I., Wang Y.S and Cheng H. (2022) Application of Microalgae Assemblages’ Parameters for Ecological Monitoring in Mangrove Forest. Frontiers in Marine Science. 9:872077.
- Isaksson, C. 2018. Impact of Urbanization on Birds: How They Arise, Modify and Vanish. Bird Species 235-257.
- Jacob, B.G, Astudillo O., Dewitte B, Valladares M., Alvarez-Vergara G., Medel C., Crawford, D.W., Uribe, E. and Yanicelli, B. (2024). Abundance and diversity of diatoms and dinoflagellates in an embayment off Central Chile (30°S): evidence of an optimal environmental window driven by low and high frequency winds. Frontiers in Marine Science. 11:1434007.
- Lee, S. (2025). Understanding Shannon-Wiener Index. Number Analytics. https://www.numberanalytics.com/blog/ultimate-guide-to-shannon-wiener-index. Accessed June 23, 2025.
- Nwankwoala, H.O., and Mmom, P.C. Environmental challenges of the Niger Delta: Implications for sustainable development. Journal of Environmental Protection 2019, 10(6), 801–815.
- Ogamba, E.N. , Izah, S.C., and Ofoni-Ofoni, A.S. Bioaccumulation of heavy metals in fish species from the Niger Delta. Environmental Monitoring and Assessment 2021, 193(2), 1–10. [Google Scholar]
- Ohimain, E.I. , Imoobe, T.O.T., and Benka-Coker, M.O. Eco-livelihood assessment of inland river dredging: The Kolo and Otuoke creeks, Nigeria, a case study. Journal of Environmental Management 2019, 245, 135–144. [Google Scholar]
- Ohimain, E.I., and Akinnibosun, H.A. Environmental impacts of oil exploration in the Niger Delta: A review. Journal of Ecology and Natural Environment 2020, 12(3), 92–102.
- Pandey, J., Singh, A., and Singh, R. BOD and plankton diversity: Indicator of water quality at river Ghaghara, India. Research Journal of Biology 2014, 2(2), 37-43.
- Qu, Y. , Wu, N., Guse, B., and Fohrer, N. Riverine phytoplankton shifting along a lentic-lotic continuum under changing environmental controls. Science of the Total Environment 2018, 634, 1507–1518. [Google Scholar]
- Righetti, D. , Vogt, M., Gruber, N., Psomas, A., and Zimmermann, N. E. Temperature is a key driver of marine phytoplankton diversity at the global scale. Science Advances 2022, 5(8), eaau6253. [Google Scholar]
- Sikoki, F.D. , and Zabbey, N. Environmental impacts of oil pollution on Niger Delta aquatic ecosystems. African Journal of Environmental Science and Technology 2017, 11(6), 277–286. [Google Scholar]
- Statology. Simpson’s Diversity Index: Definition & Examples. https://www.statology.org/simpsons-diversity-index/. Accessed 23 July 2021, 2025.
- Udo, J.P. , and Akpan, E.R. Plankton community structure in a polluted tropical estuary. Journal of Environmental Biology 2021, 42(3), 345–354. [Google Scholar]
- Ugbomeh, A.P., and Atubi, A.O. Water quality and plankton dynamics in the Epie Creek, Niger Delta. Journal of Aquatic Sciences 2019, 34(2), 45–53.
- Uwadiae, R.E. Zooplankton community structure in response to environmental variables in the Lagos Lagoon. African Journal of Ecology 2020, 58(3), 567–576. [Google Scholar]
- Uzoekwe, S.A., Abdulsalam, R.R., and Onwudiegwu C.A. (2025). Polycyclic Aromatic Hydrocarbon Concentrations in Rainwater and the Ecological and Health Effects on Inhabitants in Some Crude Oil Producing Communities of Niger-Delta. Abstract of Conference Proceedings of the ACS-Federal University Otuoke Chapter Conference 2025: Theme: Harnessing Green Chemistry and Artificial Intelligence for Sustainable Development.
- Wu, N., Qu, Y., Guse, B., and Fohrer, N. Ecological health evaluation of rivers based on phytoplankton biological integrity index. Frontiers in Microbiology 2022, 13, 942205.
- Yang, J. , Zhang, Y., and Wang, H. Water quality and habitat drive phytoplankton taxonomic and functional group patterns in the Yangtze River. Ecological Processes 2021, 10(1), 1–15. [Google Scholar]
- Zabbey, N. , and Uyi, H. Community responses to oil spill remediation in the Niger Delta. Environmental Development 2018, 26, 83–92. [Google Scholar]
- Zabbey, N. , and Uzo, P. Plankton dynamics in response to oil pollution in the Niger Delta. Journal of Environmental Biology 2019, 40(4), 567–575. [Google Scholar]
- Zabbey, N., and Tanee, F.B.G. Assessment of heavy metal pollution in the Bodo Creek, Niger Delta. Environmental Monitoring and Assessment 2019, 191(6), 1–14.
Figure 1.
Bar Chart showing Abundance of Plankton Diversity and in Trophic Levels.
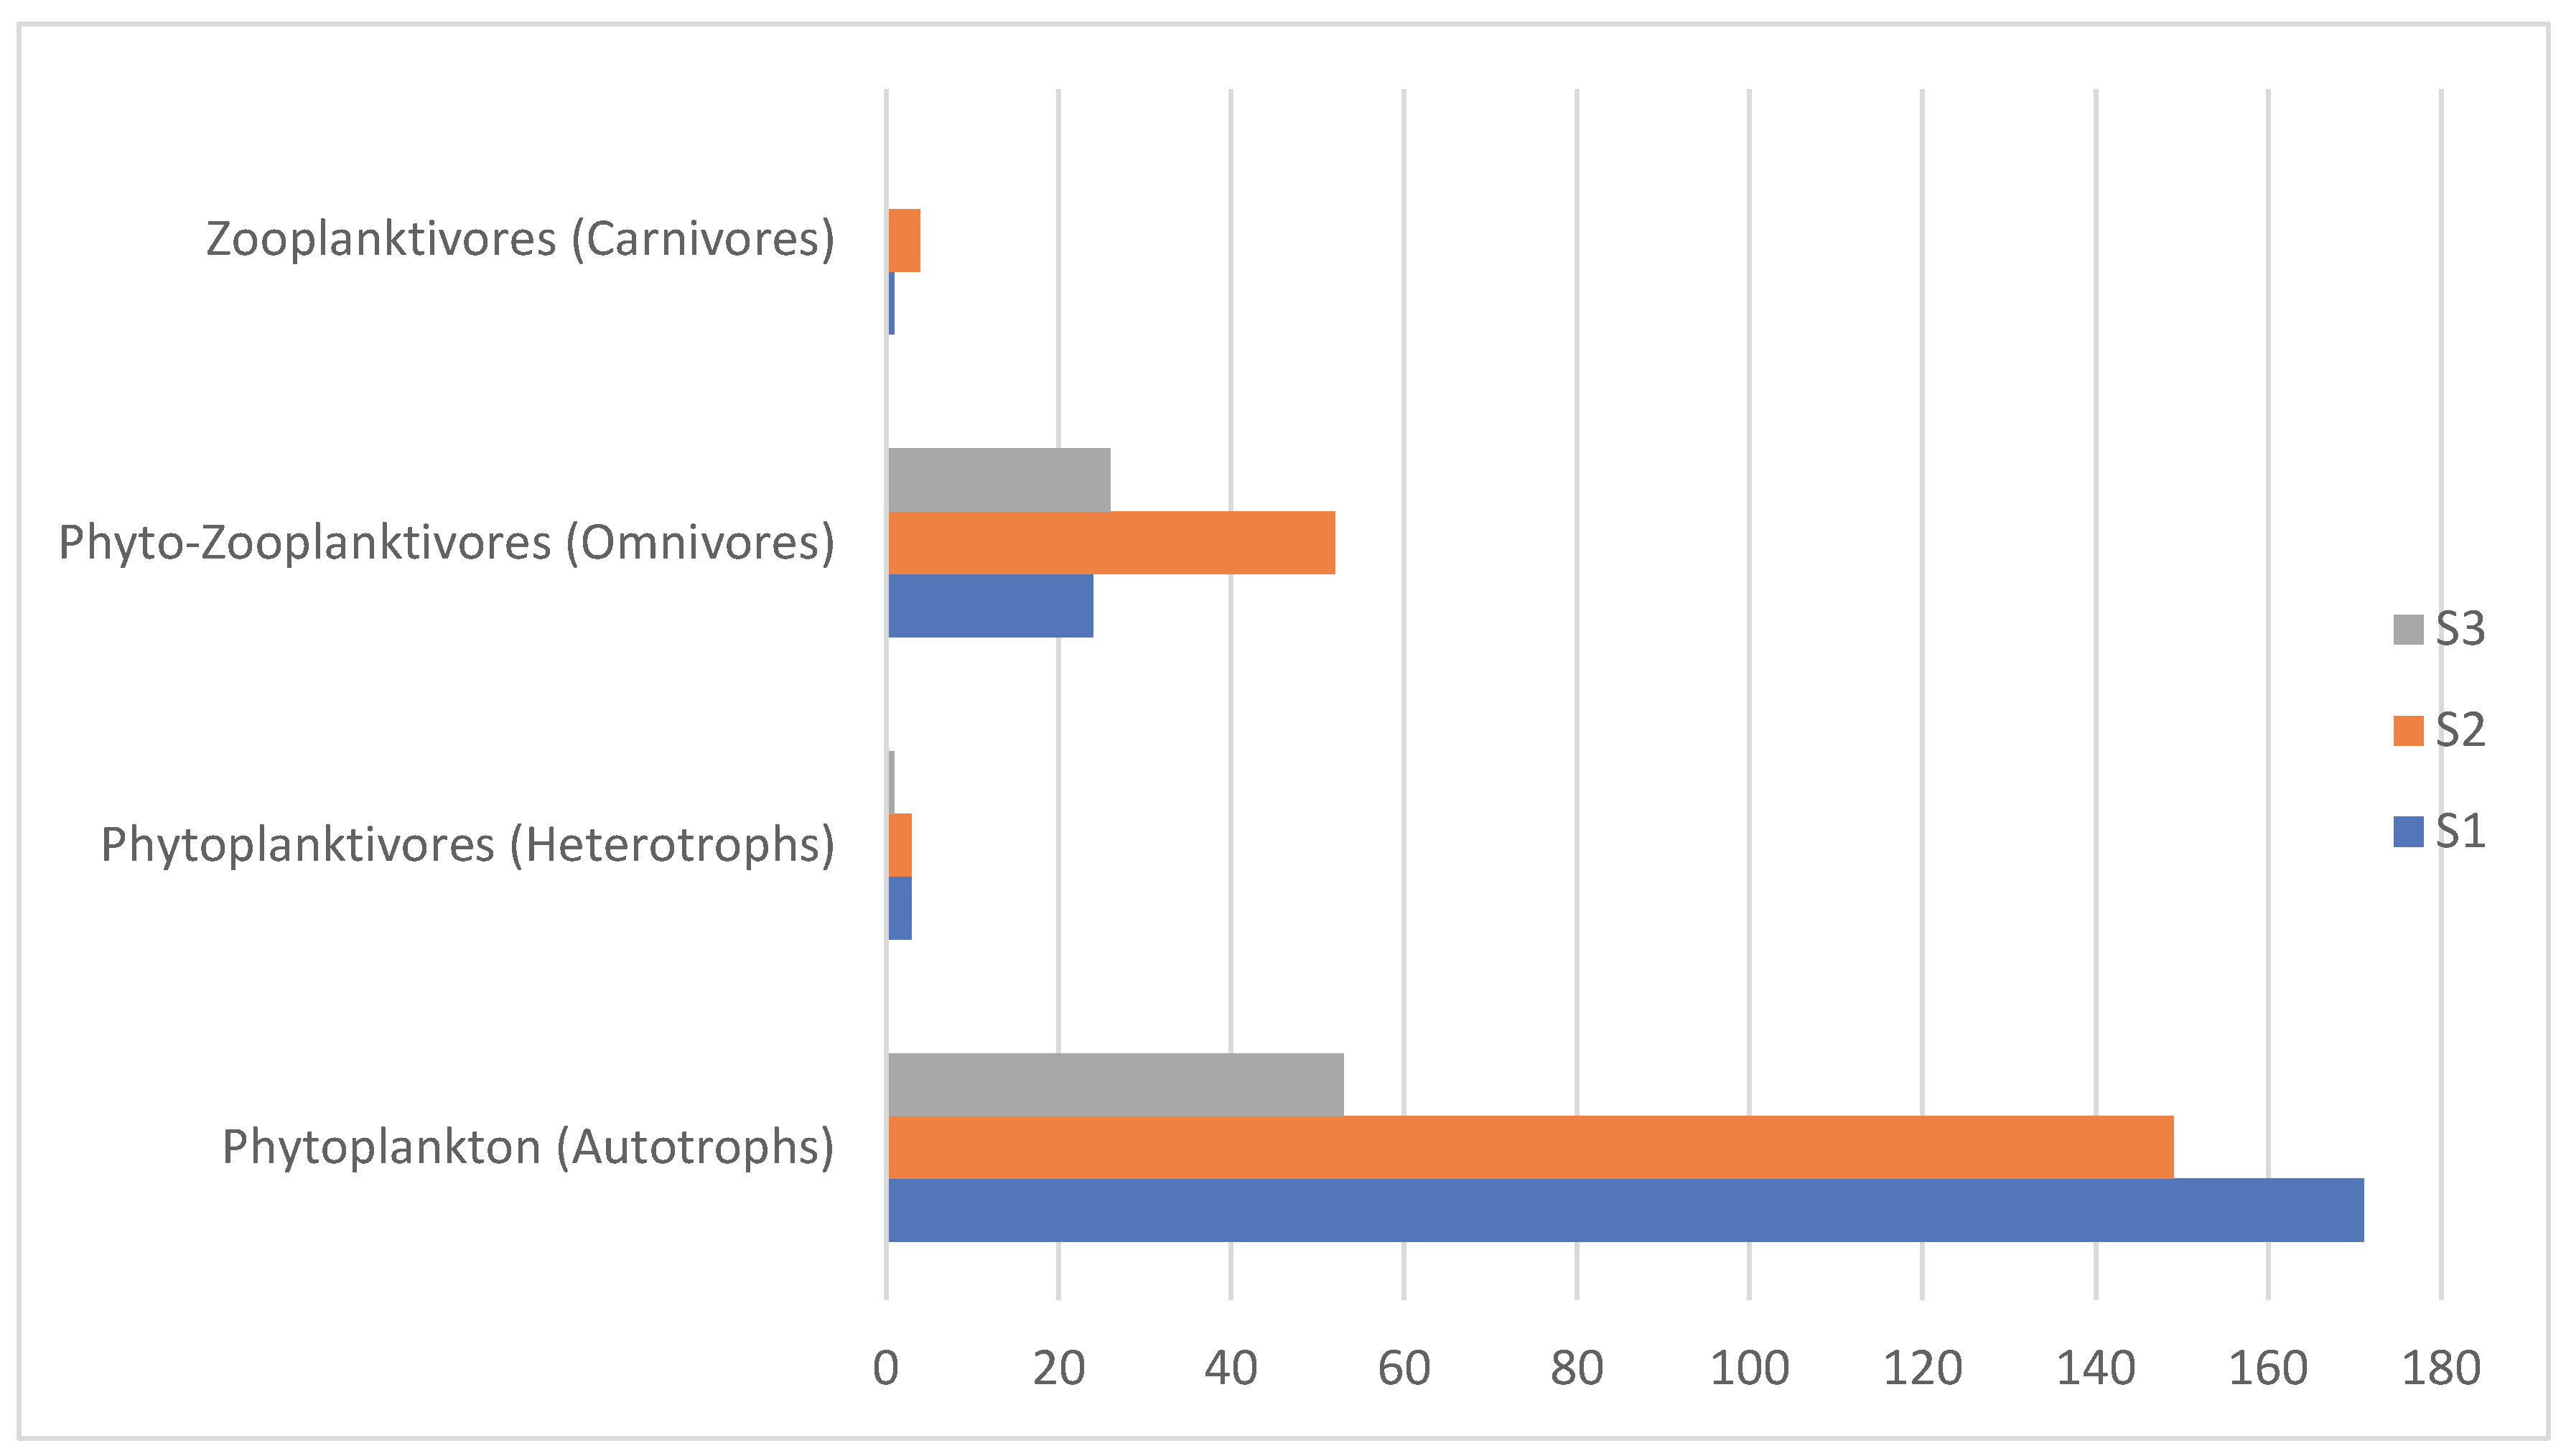

Table 1.
Sampling Locations, Sample Points, and Coordinates.
| Sampling Location | Location Code | Sample Points | Coordinates |
|---|---|---|---|
| Otuaba Waterside (OTU) | L1 | Otuaba 1 Otuaba 2 |
4.7531° N, 6.5156° E |
| Community Waterside (COM) | L2 | Community 1 Community 2 |
4.7550° N, 6.5200° E |
| Azikiel Waterside (AZI) | L3 | Azikiel Water Side 1 Azikiel Water Side 2 |
4.7600° N, 6.5250° E |
Table 1.
Sample Locations Field Observations.
| Location | Observations within and around locations |
|---|---|
| 1 | Human settlements, heaped refuse, floating and surrounding vegetation, canoes tied to bank, and an army lookout post. |
| 2 | Refuse was observed heaped at the bank, floating and surrounding vegetation, locales were seen bathing/washing (clothes and kitchen wares), canoes tied to the bank and observed human settlements. |
| 3 | Floating and surrounding vegetation, canoes tied to the bank and one single building was observed |
Table 2.
Sample Location Meteorological Characteristics.
| Sample Location | Wind-Speed (km/hr) | Relative Humidity (%) | Atmospheric Temp. (°C) |
|---|---|---|---|
| 1 | 10-25 km/hr | 79%-95% | 23-28 °C |
| 2 | 10-25 km/hr | 80%-95% | 23-28 °C |
| 3 | 10-25 km/hr | 81%-95% | 23-28 °C |
Table 3.
a: Trophic Level Abundance.
| Trophic Level | %Total | Species | L1 | % | L2 | % | L3 | % | Total |
|---|---|---|---|---|---|---|---|---|---|
| Phytoplankton (Autotrophs) | 76.22% | 28 | 171 | 85.5% | 149 | 71.64% | 52 | 65.0% | 372 |
| Zooplankton | |||||||||
| Phytoplanktivores (Herbivores) | 1.64% | 5 | 4 | 2% | 3 | 1.44% | 1 | 1.25% | 8 |
| Phyto-Zooplanktivores (Omnivores/Protists) | 21.11% | 5 | 24 | 12% | 52 | 25% | 27 | 33.75% | 103 |
| Zooplanktivores (Carnivores) | 1.03% | 2 | 1 | 0.05% | 4 | 1.93% | 0 | 0% | 5 |
| Total | 100% | 40 | 200 | 100% | 208 | 100% | 80 | 100% | 488 |
| b: Phytoplankton Abundance and Trophic level (Autotrophic Level). | |||||||||
| Organisms/Location | L1-1 | L1-2 | L2-1 | L2-2 | L3-1 | L3-2 | |||
| Spirogyra grevillana | 22 | 11 | 13 | 9 | 3 | 5 | |||
| Spirogyra crassa | 3 | 1 | 1 | 0 | 2 | 1 | |||
| Spirogyra dubia | 2 | 3 | 3 | 1 | 0 | 0 | |||
| Nodularia sphaerocarpa | 4 | 1 | 0 | 0 | 0 | 0 | |||
| Tradeliomonas subtilis | 0 | 1 | 2 | 0 | 0 | 0 | |||
| Lyngbya major | 0 | 0 | 4 | 1 | 0 | 0 | |||
| Closterum intermediul | 7 | 4 | 3 | 4 | 2 | 0 | |||
| Closterum gracile | 5 | 8 | 8 | 3 | 0 | 3 | |||
| Cryptomonas magnsonii | 3 | 0 | 2 | 0 | 0 | 0 | |||
| Clostridium juncundum | 2 | 1 | 0 | 0 | 0 | 4 | |||
| Tradeliomonas volvoxina | 0 | 1 | 0 | 0 | 0 | 0 | |||
| Raphidiopsis mediterranea | 0 | 0 | 0 | 0 | 0 | 5 | |||
| Tetracholomonas eu albiora | 0 | 0 | 1 | 4 | 0 | 0 | |||
| Melosira pusilia | 3 | 0 | 0 | 0 | 0 | 0 | |||
| Ankistrodesmus falcatus | 1 | 0 | 0 | 1 | 0 | 0 | |||
| Microasterias rotata | 0 | 0 | 1 | 0 | 0 | 1 | |||
| Spirogyra princeps | 0 | 0 | 3 | 4 | 3 | 1 | |||
| Tradeliomonas dubia | 2 | 0 | 0 | 0 | 0 | 1 | |||
| Tradeliomonas tamboricza | 0 | 0 | 0 | 0 | 0 | 2 | |||
| Volvox sp | 6 | 1 | 0 | 3 | 1 | 0 | |||
| Euglena viridis | 5 | 3 | 4 | 1 | 3 | 1 | |||
| Euglena deses | 2 | 1 | 3 | 1 | 0 | 0 | |||
| Euglena caudata | 7 | 8 | 5 | 6 | 1 | 0 | |||
| Closterum strigosum | 2 | 1 | 0 | 0 | 3 | 0 | |||
| Pinnularia kapelica | 4 | 1 | 0 | 0 | 0 | 0 | |||
| Navicula sp | 15 | 4 | 7 | 3 | 4 | 3 | |||
| Stephanodiscus sp | 5 | 3 | 4 | 2 | 1 | 1 | |||
| Chlamydomonas sp | 5 | 3 | 4 | 2 | 1 | 1 | |||
| c: Zooplankton Abundance and Trophic Levels. | |||||||||
| Trophic Level/Organism/Location | L1-1 | L1-2 | L2-1 | L2-2 | L3-1 | L3-2 | |||
| Phytoplanktivores (Heterotrophs) | |||||||||
| Monostyla closterocerca | 0 | 0 | 0 | 0 | 0 | 1 | |||
| Brachionus calyciflorus | 0 | 1 | 0 | 2 | 0 | 0 | |||
| Diaptomus binucleatus | 2 | 0 | 0 | 0 | 0 | 0 | |||
| Centropages aculeata | 0 | 0 | 0 | 1 | 0 | 0 | |||
| Rotaria neptunia | 1 | 0 | 0 | 0 | 0 | 0 | |||
| Phyto-Zooplanktivores (Omnivores) | |||||||||
| Vorticella spp | 0 | 1 | 2 | 1 | 0 | 5 | |||
| Paramecium spp | 11 | 8 | 7 | 15 | 3 | 4 | |||
| Amoeba spp | 5 | 6 | 7 | 19 | 5 | 9 | |||
| Stentor polymorphus | 0 | 0 | 0 | 0 | 0 | 1 | |||
| Eucyclops sporatus | 1 | 2 | 0 | 1 | 0 | 0 | |||
| Zooplanktivores (Carnivores) | |||||||||
| Pleurotrocha denticulatus | 1 | 0 | 0 | 0 | 0 | 0 | |||
| Cyclops scutifer | 0 | 0 | 1 | 3 | 0 | 0 | |||
Table 4.
Ecological Diversity Indices.
| Sampling Location | Margalef Index (D) |
Shannon Index (H’) | Pielou’s Evenness (J) | Simpson Index (1-D) |
|---|---|---|---|---|
| Location 1 | 4.133 (P) 1.650 (Z) |
2.704 (P) 1.350 (Z) |
0.875 (P) 0.690 (Z) |
0.909 (P) 0.692 (Z) |
| Location 2 | 4.019 (P) 1.470 (Z) |
2.707 (P) 1.320 (Z) |
0.942 (P) 0.680 (Z) |
0.925 (P) 0.827 (Z) |
| Location 3 | 4.345 (P) 0.910 (Z) |
2.448 (P) 1.120 (Z) |
0.944 (P) 0.810 (Z) |
0.922 (P) 0.797 (Z) |
Table 5.
Physicochemical Characteristics of Sample Locations.
| Location | pH | BOD | Temp (oc) | COD (µS/cm) | TDS | DO | TURB (NTU) |
|---|---|---|---|---|---|---|---|
| 1 | 6.5184 | 2.4mgll | 31oc | 3.3 µS/cm | 28.00ppm | 4.2mgll | 23.40 |
| 2 | 6.7190 | 2.4mgll | 31oc | 3.3 µS/cm | 20.00ppm | 4.2mgll | 23.46 |
| 3 | 6.8195 | 2.5mgll | 30oc | 3.1 µS/cm | 15ppm | 4.3mgll | 23.41 |
Table 6.
a: Demographic Data Responses.
| Gender | N | Age Range | N | Occupation | N | Ethnicity | N |
|---|---|---|---|---|---|---|---|
| Male | 13 | 18-24 | 17 | Fisherman | - | Ijaw | 10 |
| Female | 8 | 29-38 | 4 | Farmer | 10 | Igbo | 4 |
| 39-46 | - | Employee | 2 | Yoruba | 2 | ||
| 49-58 | - | Entrepreneur | 5 | Bini | 1 | ||
| 59-68 | - | No response | 4 | Unidentified | 1 | ||
| Uhobo | 1 | ||||||
| Ika | 1 | ||||||
| Isoko | 1 | ||||||
| TOTAL | 21 | 21 | 21 | 21 | 21 | 21 | |
| b: Ethnobiological Knowledge and Investigation. | |||||||
| Question/Observation | YES | NO | No Response | TOTAL | |||
| If water intake water or channel is polluted | 14 | 3 | 4 | 21 | |||
| Notice of change during the rainy season | 15 | 6 | 0 | 21 | |||
| Observed unusual events | 14 | 6 | 1 | 21 | |||
| Observation of times with fewer organisms | 10 | 10 | 1 | 21 | |||
| Do you carry out any domestic activities around the creek | 7 | 9 | 5 | 21 | |||
| Opinion on effect of socioeconomic activities around the creek | 17 | 0 | 4 | 21 | |||
| Did you find the questionnaire helpful | 19 | 1 | 1 | 21 | |||
| c: Responses to Change in Water Quality Causes. | |||||||
| Causes | Responses | ||||||
| Refuse dumping | - | ||||||
| Defecation | 3 | ||||||
| Oil pollution | 3 | ||||||
| Farm chemicals | 1 | ||||||
| Runoffs/water flow from outside the creek | 1 | ||||||
| No response | 1 | ||||||
| All of the above | 9 | ||||||
| Defecation and oil pollution | 3 | ||||||
| Refuse dumping and oil pollution | - | ||||||
| Refuse dumping and defaecation | - | ||||||
| d: Domestic and Personal Activities Carriedout. | |||||||
| Activities | Response | No response | |||||
| Washing clothes | - | 16 | |||||
| Washing kitchen and cooking wares | 1 | ||||||
| Bathing | 3 | ||||||
| Defecation | 1 | ||||||
| Refuse dumping | 1 | ||||||
| All of the above | |||||||
Disclaimer/Publisher’s Note: The statements, opinions and data contained in all publications are solely those of the individual author(s) and contributor(s) and not of MDPI and/or the editor(s). MDPI and/or the editor(s) disclaim responsibility for any injury to people or property resulting from any ideas, methods, instructions or products referred to in the content. |
© 2025 by the authors. Licensee MDPI, Basel, Switzerland. This article is an open access article distributed under the terms and conditions of the Creative Commons Attribution (CC BY) license (http://creativecommons.org/licenses/by/4.0/).
Copyright: This open access article is published under a Creative Commons CC BY 4.0 license, which permit the free download, distribution, and reuse, provided that the author and preprint are cited in any reuse.


