
Submitted:
03 February 2025
Posted:
04 February 2025
You are already at the latest version
Abstract
Rising sea temperatures, driven by climate change, pose significant threats to coastal ecosystems. This study investigates the impact of thermal effluents from power plants, as proxies for climate-driven temperature increases, on Posidonia oceanica meadows and associated fish communities. Using a gradient-based approach, we analyzed environmental variables, seagrass indicators, fish assemblages, and functional group (FG) dynamics across a thermal gradient extending from the effluent outfall itself. Results indicate that temperature is the dominant factor influencing P. oceanica, with reduced leaf length, shoot density, and rhizome weight characterising samples closest to the effluent. Despite compensatory mechanisms, the overall photosynthetic biomass and resilience declined under thermal stress.
Fish assemblages exhibited reduced species richness and biodiversity close to the thermal effluent, with opportunistic and thermophilic species dominating. FG analysis revealed disrupted seasonal patterns, shifts in trophic dynamics, and functional compensation among species, highlighting potential ecological imbalances. Notably, transient predators thrived near the effluent, while more sedentary and temperate species were displaced.
These findings underscore the cascading effects of rising temperatures on coastal habitats such as P. oceanica meadows and on their associated communities, emphasizing the urgency for conservation measures. By identifying critical thresholds and adaptive responses, this study contributes valuable insights into the consequences of localized impacts of thermal stress on coastal biodiversity and ecosystem services.
Keywords:
Climate change
; Thermal pollution
; Functional ecology
; Seagrass
; Fish community
Introduction
Sea temperature increases represent a significant ecological challenge on a global scale [1]. Decades of research have highlighted growing concerns within the scientific community on such an issue, resulting in a diverse but occasionally contentious body of literature [2]. Recent studies employing modeling [3], remote sensing [4], and time series analysis [5] have strengthened the consensus that the unchecked rise in water temperatures, both at and beneath the sea surface, urgently calls for expanded monitoring programs and for emergency protocols supported by reliable forecasting systems [6].
The Mediterranean Sea, characterized by restricted circulation dynamics, is experiencing the effects of climate change at an intensified pace [7]. Its warming rate is 20% higher than the global average, impacting a wide range of biomes, habitats, and ecological communities [8]. Over the past decade, the region has witnessed frequent marine heatwave events [9], which pose significant threats to the more vulnerable components of its ecosystems.
A substantial body of research has explored the uncertain consequences of this phenomenon through laboratory mesocosm trials and in situ experiments conducted near hydrothermal vents. However, both methods have inherent conceptual and practical limitations. While controlled laboratory experiments offer convenience and precision, they lack the complex ecosystem interactions found in natural environments, which are difficult to replicate accurately [10]. In contrast, studies conducted at hydrothermal vents often have to grapple with confounding factors such as CO2 and H2S enrichment, making it challenging to isolate the effects of temperature from the additional variables [11].
Thermal discharges from power generation facilities into the marine environment remain relatively underexplored, with only a limited number of studies available, most of which focus on the impact on individual ecosystem components [12,13,14,15,16,17].
The Maltese archipelago has a limited power supply, making it heavily reliant on the Delimara power station, which meets approximately 68% of the country’s energy needs [18]. Located at the south-eastern extremity of the island of Malta, this power station discharges large volumes of cooling water, reaching peak temperatures exceeding 38°C in summer, into a sheltered embayment. The heated water then flows over the surrounding area and disperses into the open sea. This localized phenomenon presents a unique opportunity to observe, on a manageable scale, the potential effects of rising sea temperatures on a typical coastal Mediterranean ecosystem and its associated communities [17,19].
In this study, we aimed to assess whether the in situ temperature gradient is affecting local community components, with particular focus on Posidonia oceanica meadows and on fish assemblages. Posidonia oceanica, a seagrass endemic to the Mediterranean Sea, is adapted to the unique conditions of this semi-enclosed regional sea, including higher salinity levels significant seasonal temperature fluctuations than those encountered within the open ocean [20,21]. Its crucial role in providing numerous ecosystem services and as one of the most important infralittoral habitats makes it an ideal model for studying the impacts of sea temperature changes [22,23,24,25] as well as for assessing the potential economic losses associated with these changes [26,27]. Fish assemblages, being among the most mobile components of marine ecosystems, have the ability to move away from disturbances or toward areas with more favourable conditions [28,29]. Additionally, many fish species are closely linked to P. oceanica meadows, which offer refuge, food, and breeding grounds [30]. This seagrass-fish community relationship provides a valuable opportunity to explore the interactions between habitat and fish communities within the context of potential climate change impacts.
Traditional biodiversity metrics, however, may not always capture the complexity of the ecological relationships under scrutiny [31,32]. To address this, we analysed fish functional groups (FGs), which can serve as proxies for ecosystem functioning [33]. This approach allows us to assess whether functionally-similar species with varying temperature tolerance levels exhibit compensation or redundancy within specific ecological niches.
We hypothesized that the thermal effluent would have varying effects on local habitats and on fish communities, depending on the temperature gradient, with different responses based on exposure levels. To test this hypothesis, we conducted analyses at three increasing distances from the thermal effluent, comparing them with a control site located within a similar and adjacent embayment unaffected by the thermal discharge. To differentiate between the effects of seasonality and inter-annual consistency, the study was carried out over two years, with sampling conducted across two distinct seasons.
The ultimate objective of this study was to evaluate the response of the coastal community to thermal effluents through a comprehensive approach, encompassing broad biodiversity measurements alongside detailed analyses of individual functional groups.
Materials and Methods
Study Site and Sampling Design
The study area is located at the south-eastern extremity of the island of Malta, within the central Mediterranean Maltese archipelago. (Figure 1). It consists of a system of twin bays, Il-Ħofra ż-Żgħira (HZ) and Il-Ħofra l-Kbira (HK), which share similar environmental characteristics but are separated by a peninsula that limits water mixing between the two. The geological features of the bays are nearly identical, with depths of approximately 15 meters towards their mouths. Although there are no riverine inputs, both embayments are surrounded by blue clay dunes, which may influence turbidity levels during rainy events as a result of runoff from land.
A thermal effluent is located along the western side of the HZ embayment (but not in HK), discharging hot water with peak temperatures reaching 38°C during the summer season. The cooling water is drawn from Marsaxlokk Bay, located a few kilometres away from the thermal effluent, passes through the Delimara power station's cooling system (which has been operational since 1990), and is then released via underground pipes at sea level. Upon discharge, the cooling water flows turbulently from the outlet, partially stratifying within the first two meters from the surface (depending on the season) before gradually dispersing into the surrounding waters.
Access to both bays from land is restricted due to the cliffs bordering the area, making them primarily accessible by boat. For most of the year, human activity in the bays is minimal, with occasional visits from anglers. However, during the summer, the bays are frequently visited by boats for bathing purposes, resulting in extensive disturbance to the seabed through anchoring, by virtue of their sheltered nature.
A preliminary survey was conducted to characterize the embayment using a combination of multiparametric probes and drifters, allowing for an empirical description of thermal dispersion within the HZ bay. Based on these findings, three sampling stations were selected at increasing distances from the effluent (50 m, 160 m, and 290 m), with water temperatures decreasing as the distance increased. An additional fourth sampling station (the control one) was carefully chosen in the adjacent HK bay (Figure 1b) in order to exclude the effect of the thermal effluent while ensuring the presence of a comparable marine ecosystem [34]. The four sampling stations are referred to as Distance 1 (35.836457, 14.560321), 2 (35.837209, 14.561281), 3 (35.837723, 14.562980), and 4 (35.840386, 14.562899.
In order to investigate potential seasonal patterns, two sampling seasons were included: Spring (S), conducted in early May, and Autumn (A), conducted in late October. Sampling activities were carried out over two years (2022 and 2023), with all samples collected in triplicate. This experimental design was consistently applied across all sampling events.
Environmental Parameters
In order to characterize the selected sampling stations and in order to differentiate them from other confounding factors, an array of environmental variables (temperature, surface pH, dissolved oxygen, and salinity) was recorded in situ, using a CTD multiparametric probe. All measurements were collected from surface waters (1.5 meters deep) so as to better detect gradients caused by the water flowing from the thermal discharge.
Posidonia Oceanica Meadows
The seagrass Posidonia oceanica and the meadows it forms were prioritized for inclusion in this study so as to assess the thermal influence on their distribution and attributes. For each sampling event, two SCUBA divers were deployed, with only one collecting samples in order to minimize potential sampling bias due to subjectivity. The density of P. oceanica meadows at each sampling station was estimated using 0.5 m² quadrats. From each quadrat, five P. oceanica shoots were sampled and preserved at -20°C for further phenological analysis.
In the laboratory, P. oceanica shoots were dissected in order to obtain traditional biometric measures [35]. Each leaf was classified as either adult or juvenile, based on the presence of the ligula [35]. Leaf length (distinguishing between living and necrotic tissue) and width were measured, and the leaves were cleaned of epiphytes. Both leaves and epiphytes were dried separately in an oven at 70°C overnight and then weighed to the nearest 0.1 mg. Rhizomes were also dried and weighed separately.
From the phenological analysis, the photosynthetic Leaf Area Index (pLAI; m²/m²) was calculated by considering the mean leaf surface area of each rhizome and the relative density of the meadow (rhizomes per m²) [35].
Fish Assemblages Sampling, Biodiversity Metrics and Functional Groups
The fish community was sampled using stationary underwater visual censuses [36]. This method, rather than the more traditional transect-based census, was chosen due to the limited spatial scale of the study area and in order to focus on the observation of the fish community recorded within the selected stations along the temperature gradient from the effluent. At each station and for each replicate, a 10-meter radius area was adopted, and species abundances were estimated and recorded on a slate.
Traditional biodiversity metrics were derived from the raw data matrix, including species richness (S), number of individuals (N), and the Shannon index (H’). In order to advance beyond merely assessing fish assemblage composition and in order to evaluate the effects of the thermal effluent on functional groups (FGs), the raw data matrix was further processed as follows:
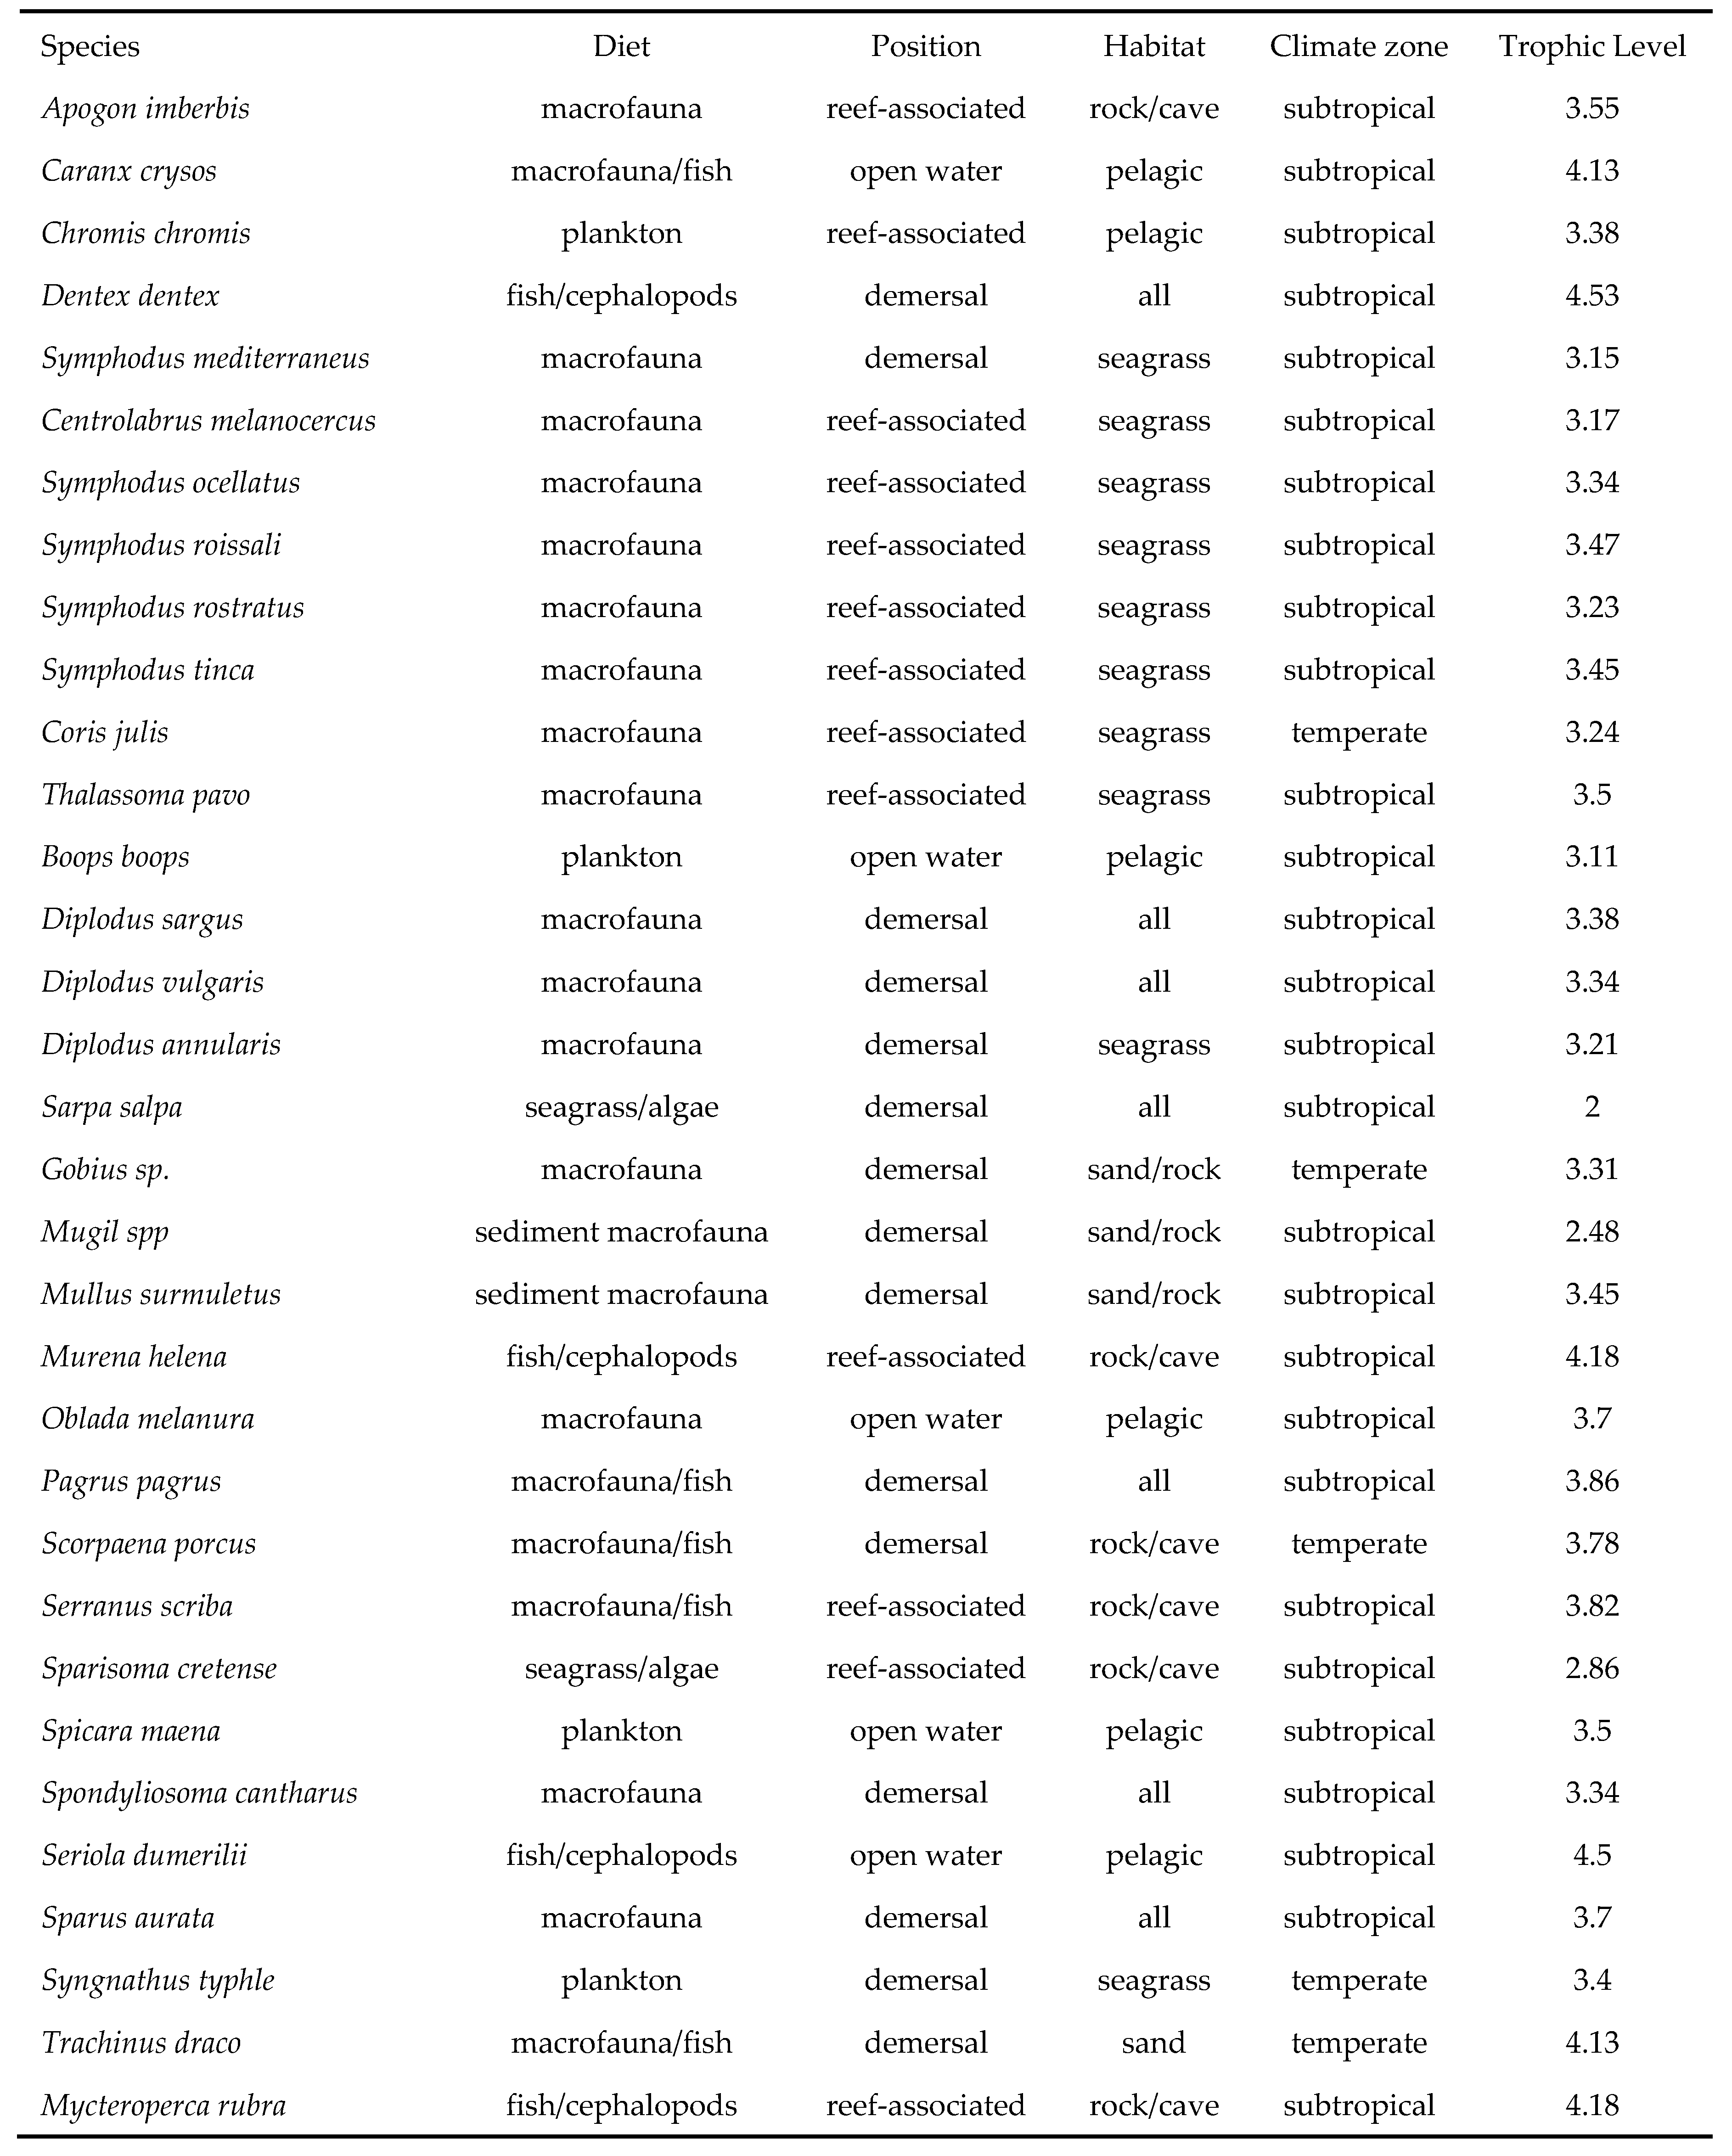
For each observed species, five ecologically significant traits were selected, with relevant information obtained from FishBase.org (Table 1).
The list of observed species was then reorganized so as to group species with similar traits, merging their relative abundances into nine FGs [37], as follows:
FG1 included pelagic predators, such as Caranx crysos. FG2 represented reef-associated predators, like Serranus scriba. FG3 was primarily composed of Labridae species associated with Posidonia oceanica meadows. FG4 featured Sparidae species with similar feeding habits and habitats, such as Diplodus sargus. FG5 consisted of mesopelagic planktivorous species, like Chromis chromis. FG6 included obligate herbivorous species, Sarpa salpa and Sparisoma cretense. FG7 included species that feed on sediment and have the highest bioturbation potential, such as Mullus surmuletus. FG8 listed two temperate species associated with seagrass meadows, Coris julis and Syngnathus typhle. Finally, FG9 consisted of sedentary temperate species specialized in ambush feeding (e.g. Scorpaena porcus).
Statistical Analysis
Statistical analyses were carried out within both univariate and multivariate frameworks. In particular, a parametric species-environment non-linear model was adopted using the senlm package in R [38]. This methodology allows for the detection of the best mean to describe a species' response along a gradient, paired with a statistical error distribution to account for residual variation, which accommodates the noisy and often zero-inflated nature of ecological field data. Our analysis included six mean functions—gaussian, beta, uniform, mixgaussian, sech, and hofIV—paired with eight error distributions: zinb, zip, poisson, zinbl.mu, zipl.mu, zipl, zinbl, and negbin. We conducted a cross-fitting procedure, resulting in 48 model combinations, and identified the optimal model based on the lowest Akaike Information Criterion (AIC) value. Given the flexibility of this methodology, rather than applying it to individual species, we used it to detect potential trends across the nine functional groups adopted in this study, considering their distances from the thermal effluent.
Multivariate analyses were performed using the Primer 7 statistical software with the PERMANOVA+ add-on package [39]. The environmental data matrix, featuring 4 exclusively environmental variables and 12 Posidonia oceanica indices, was normalized prior to the application of the Principal Component Analysis (PCA) routine [40].
The fish assemblage raw matrix was transformed using a square-root transformation after applying a dispersion weighting technique, so as to downsize the prominence of dominant species abundances that might mask the role of rarer species. To test for significant differences, a PERMANOVA test with a three-factor design was adopted, featuring:
i) Distance from the effluent (four levels: Distance 1, 2, 3 and 4 as a control station), ii) Season (two levels: S & A), and iii) Year (two levels: 2022 & 2023). For graphical representation, a bootstrap average was used instead of a traditional nMDS plot, in order to enhance the dataset by artificially resampling within each group (38 bootstraps per group). This approach, supported by a reliable stress value, provided a more interpretable visual representation [41].
The biodiversity indices, extracted from the raw matrix, were analyzed using the same three-factor PERMANOVA design after normalization and resemblance through a Euclidean-based distance matrix, and then visualized with boxplots.
For the analysis of the Functional Groups (FGs), the same pre-treatment routine applied to the fish assemblage was also employed, using the same PERMANOVA design mentioned earlier, so as to detect significant differences within the factors. Further investigation was conducted through pairwise testing among the levels for the different factors.
In order to explore the potential influence of environmental variables in shaping the composition of the FGs, a BEST analysis [40] was applied so as to identify the most strongly-correlated variables. Once screened, the subset of environmental variables was used as predictors for constructing Distance-based Linear Models (DistLM) [42], testing for any significant influences of the environmental and Posidonia variables in shaping the composition of the FGs within the factors included in this study.
Results
A total of 4,518 individuals belonging to 36 fish species were recorded and identified during this study, including Chromis chromis, which accounted for 2,346 individuals and represented nearly 52% of the entire fish assemblage (the full list of species is provided in Appendix B).
Within the PCA for the 16 environmental variables, including those related to Posidonia oceanica indices, PC1 explained 46.5% of the total variation, while PC2 accounted for 22.3% of the variation (Figure 2). The direction of the eigenvectors revealed that the increase in temperature was correlated with a reduction in P. oceanica indices, particularly with the number of adult leaves and with the LAI index. On the other hand, the length of the rhizome and the density of Posidonia shoots appeared to be correlated with increased pH levels, in contrast to dissolved oxygen concentration and salinity.
The results of the PERMANOVA applied to the biodiversity indices indicated significant differences for the factors ‘Distance’ and ‘Seasons’, but not between the two years studied (Table 2). In particular, species richness did not show any relevant difference in Spring between different sampling stations, while in Autumn, proximity to the effluent was associated with higher species richness compared to the other stations.
Individual fish abundances did not exhibit significant trends; however, our results (Figure 3) suggest that the thermal effluent still attracted a higher abundance of fish, particularly Chromis chromis, which was recorded in very low numbers at locations far from Station 1 and 2 (the closest to the effluent). Nonetheless, the Shannon index value significantly increased with distance from the thermal effluent, reaching its highest values at location 3, before decreasing at the control station (Station 4).
When examining the entire fish assemblage, the PERMANOVA detected significant differences for all the factors analyzed (Table 2, Figure 4). The pairwise test showed that Location 1 was significantly different from all other levels within the same factor, as well as in terms of seasonality. In contrast, minor to not significant differences were detected between the other levels of distance from the thermal effluent. These locations were found to differ from each other only in terms of seasonality.
The analysis of the assemblage in terms of functional groups (FGs) provided new insights into the population dynamics within the studied area.
PERMANOVA applied to the entire FGs dataset showed significant differences for all the three factors tested (Table 4). Within the same PERMANOVA design, the pairwise test results for the Distance factor revealed that significant differences were only detected between Distance 1 and all other levels, while no differences were recorded between other combinations (Table 4).
In order to better understand the effects of Distance and Seasonality, another pairwise test was performed for these two factors within each level of Distance. No significant differences were recorded in terms of seasonality at the closest station to the thermal effluent (Station 1). However, significant differences were observed at all other distances, with a p-value of 0.003 for the control site (Station 4).
The BEST analysis applied to the environmental matrix and to the P. oceanica indices identified five variables as the most influential in shaping the structure of the FGs dataset. Specifically, the weight of epiphytes and water salinity were the primary factors, followed by the number of adult leaves, the weight of the rhizome, and surface water temperature.
Based on these variables, a DistLM was run on the FGs, considering the factors Distance and Season. The weight of epiphytes was found to be the most influential variable driving the variance in the FGs (p = 0.001), followed by surface salinity, temperature, and the weight of the rhizome. However, the number of adult leaves did not contribute significantly to explaining the resultant variance in the FGs (Table 4). The model, with its first two axes, explained up to 60.51% of the total variance, with axis 1 accounting for 31.39% and axis 2 for 29.12% of the resultant variance (Figure 5; Table 5).
The senlm approach conducted for each functional group revealed trends related to the distance from the thermal effluent (Figure 6).
For pelagic predators (FG1) and for mesopelagic planktivorous species (FG5), individual fish abundances decreased as the distance from the cooling water source increased. Reef-associated predators (FG2), on the other hand, showed a preference for locations less impacted by the effluent, as well as Labridae species (FG3) favouring areas with minimal influence of the thermal effluent rather than the control site. Sparidae species (FG4) exhibited no significant trends in relation to the thermal effluent, showing little variation along the distance gradient. The abundances of herbivorous species (FG6) and of sediment feeders (FG7) slightly decreased as the distance from the effluent increased. Finally, temperate species (FG8 and FG9) showed comparable trends, with their abundances increasing with distances from the effluent.
Discussion
The effects of rising sea water temperatures due to climate change are a major concern within both the scientific community and beyond [43]. This study highlights the complex and multifaceted impacts that these changes may have on coastal ecosystems, particularly those characterized by Posidonia oceanica meadows and associated fish assemblages [44]. Thermal effluents from power plants may trigger cascading ecological responses across multiple trophic levels, serving as a useful proxy for in situ effects of climate change [45]. In this study, we provide a detailed examination of the observed changes in environmental variables, in the structure of P. oceanica meadows and in fish community composition, supported by an analysis of FGs, offering valuable insights into broader ecological implications [46].
Environmental Drivers and Impacts on Posidonia Oceanica Meadow Structure and Health
From the analysis of all environmental variables and of the phenological indices of Posidonia oceanica, interesting relationships emerged. As expected, temperature was the dominant environmental factor influencing P. oceanica indices. In fact, PC1 explained 46.5% of the total variation, and by examining the orientation of the eigenvectors, significant trends were identified. As surface temperature increased, most P. oceanica-related parameters decreased, particularly the number and length of the leaves, the LAI index, photosynthetic biomass, and the weight of epiphytes. Conversely, PC2, which accounted for 22.3% of the total variation, indicated that increases in dissolved oxygen and salinity were linked with decreases in rhizome weight and meadow density.
The recorded pH values, which were lower closer to the effluent, did not fully align with typical studies on ocean acidification's impact on meadows, suggesting that in our case, pH may not directly affect P. oceanica [47]. However, pH variations, along with temperature, appear to influence the nature and composition of epiphytes [48]. While epiphyte species were not exhaustively identified in this study, a shift was observed from calcareous species dominating stations located further away from the effluent towards turf algae which dominated stations located near the thermal discharge, a change that could be supported by rising water temperatures [49].
The LAI index, which serves as an indicator of the meadow’s status and health, did not show significant differences between stations along the thermal effluent gradient. However, by examining the components used to calculate this index, opposing trends were observed, both in terms of shoot density, leaf length and surface area. Close to the thermal effluent, P. oceanica leaves were shorter, with a higher degree of necrotic tissue, and the shoot density was lower compared to that from other sites. Interestingly, the number of leaves per shoot was higher at this station. As the distance from the effluent increased, the meadow showed an increase in shoot density, leaf length, and surface area, except for the number of leaves, which decreased until station 3 and then increased at the control site.
These findings suggest that the meadow responds to thermal stress by employing physiological mechanisms that compensate for the loss of shoot density and leaf length through an increase in the number of leaves [21,50]. Despite these compensatory mechanisms, the overall photosynthetic biomass was lower closer to the effluent compared to the control site. This suggests that the warm plume interferes with the seagrass's typical growth and ontogenetic processes [25] and may even induce flowering events [51]. In support of this theory, the weight of the rhizomes, another key indicator of P. oceanica health, was significantly lower closer to the effluent. This suggests that the seagrass is diverting its resources from storage to survival and repair mechanisms [21].
Fish Assemblage Responses to Thermal Pollution
The analysis of the fish assemblage and its biodiversity indices revealed significant trends related to both the gradient of exposure to thermal effluents and seasonality. A noteworthy reduction in species richness and diversity at Distance 1 highlights the detrimental effects of thermal pollution on the local fish community. The Shannon index was the lowest near the thermal effluent, reflecting a simplified community structure, while individuals’ abundance was particularly high. This suggests that thermal stress filters out less tolerant species, favoring those capable to adapt to the altered conditions.
Moreover, the differences observed between Distance 1 and all other stations suggest that this site, located closest to the effluent, may differ from the others for reasons beyond water temperature alone. The high turbulence observed at this site could be a contributing factor. While the waters were not enriched with external nutrient loads, the resuspension of sediment may attract opportunistic species. Additionally, during the Underwater Visual Census (UVC), it was observed that the outfall conduits were populated by Brachidontes pharaonis, an invasive alien species. This small bivalve likely plays a role in sustaining local food webs through the provision of dead individuals.
Furthermore, highly mobile predatory species, such as Seriola dumerili and Caranx crysos, were attracted to the area due to the abundance of small prey species (as for example Mugil sp. or Chromis chromis), which could in turn be favoured by the significant turbulency of the thermal effluent. These species are known to take advantage of such conditions, further contributing to the altered ecosystem dynamics.
These observations, in line with those from other studies [52,53], offer a glimpse into the potentially catastrophic cascade effects that rising temperatures could have on the ecosystem. By favouring alien or thermophilic species, thermal stress might disrupt the local biodiversity and ecosystem balance, exacerbating the ecological challenges posed by climate change.
Functional Group Dynamics and Ecosystem Implications
The detailed analysis of Functional Groups (FGs) proved to be an effective tool in describing the fish communities, especially when traditional biodiversity metrics failed to provide valuable insights or highlight hidden patterns [37]. By applying the same statistical routines used on the fish assemblage matrix, we were able to reveal significant patterns for the distribution of FGs along the thermal effluent gradient and across the two seasons studied.
Although it is well documented that P. oceanica plays a limited direct role in sustaining local food webs [54], our results suggest that it is also a crucial factor in shaping the composition of the FGs. This aligns with the findings of Lin et al. [14], who observed a similar pattern but with different community components. Specifically, within the same study, the loss of phytoplankton caused by the thermal discharge negatively impacted the macrobenthos, although it was found not to be directly influenced by surface temperatures. The number of adult leaves in P. oceanica, for instance, contributes to increasing habitat complexity and for providing refuges for more vulnerable species [55]. Likewise, the weight of the rhizomes, an indicator of meadow health, can be linked to a more structured and diverse community [24].
Epiphytes also emerged as a key factor in influencing the distribution of FGs, with a strong correlation to both distance from the thermal effluent and to seasonality. Although a deeper taxonomic identification of epiphyte species was beyond the scope of our study, we can speculate that higher epiphyte dry weight is associated with encrusting, calcareous-dominated communities, while lower dry weight is linked to turf algae, which tend to have higher water content values. This pattern is consistent with that in previous relevant literature, which suggests that high water temperature surges, often resulting from anthropogenic impacts or from seasonal changes, inhibit slow-growing calcareous algae while favouring faster-growing turf algae, generally more tolerant to elevated temperatures [56].
These insights provide further evidence of the significant role that P. oceanica and its associated epiphyte community play in shaping the broader fish assemblage and functional group distribution in coastal ecosystems. The thermal effluent and seasonal temperature variations appear to be key drivers in altering these dynamics, underscoring the potential cascading effects of climate change on coastal biodiversity.
Upon reviewing the results of our model and of the PERMANOVA analysis, we observed significant trends in the structure of the FGs across seasons (Spring and Autumn) and along the thermal gradient. The FGs composition varied notably with distance from the thermal effluent, which, as a proxy for temperature rise, alters the natural seasonal cycle of the impacted marine ecosystem. At the control site in HK, which is unaffected by the effluent, the FGs structure differed considerably between Spring and Autumn, reflecting a typical seasonal pattern of variation in community composition. However, as we approached the effluent in HZ, the seasonal differences became less pronounced, with no significant differences observed at the closest and warmest sampling station.
This result strongly supports the theory that future temperature increases may lead to a flattening of seasonal variation, potentially leading to detrimental effects on the entire community [7]. Such a change could have broader ecological implications, as not only would marine biodiversity be affected, but also a consequent loss of various FGs, which serve as proxies for important ecosystem services [57], would result. These losses could have serious consequences, potentially compromising the functionality of coastal ecosystems and the services they provide to human communities [58].
By analyzing the trends of each functional group (FG) in detail, we can gain valuable insights into how this impacted coastal system and its associated community have responded to thermal impacts from the effluent. As previously mentioned, the station closest to the thermal effluent (Distance 1) exhibits distinct features when compared to all other sites, attracting a diverse array of species across multiple trophic levels. Notably, both transient predators (FG1), such as Seriola dumerili and Caranx crysos, and mesopelagic planktivores (FG5), appear to be more abundant sta this station, suggesting that this location, characterized by higher temperatures and by potentially other factors, supports a unique community structure.
The increased role of transient predators at this site aligns with findings from Zubak et al. [30], who observed that in similar P. oceanica-dominated systems, the fish assemblage composition was strongly influenced by the presence of transient predators. This pattern is consistent with our results, highlighting how the thermal effluent may favour these more mobile and thermophilic species.
On the other hand, FG7, representing detritivorous species, shows a clear pattern of niche compensation along the thermal gradient. For example, Mullus surmuletus appears to be replaced by Mugil species closer to the effluent. While this shift helps maintain a level of functional compensation, ensuring that sediment bioturbation persists within the system [59], it also leads to potential socio-economic implications. M. surmuletus is a species of high market value, and its replacement by Mugil species, which may have lower commercial appeal, could result in economic losses for local fisheries.
A similar pattern of functional compensation was observed within the herbivorous species group (FG6). Surprisingly, only two native species belonging to this functional group were recorded in this study, with no sightings of Siganus luridus, a well-established Invasive Alien Species (IAS) within the Maltese archipelago [60]. The two main herbivorous species observed, Sparisoma cretense and Sarpa salpa, exhibited contrasting trends along the thermal effluent gradient.
S. cretense was primarily recorded at sites close to the effluent, suggesting it is adapted to or even thrives in the warmer, thermophilic conditions associated with the effluent [61]. In contrast, S. salpa was abundant at the control site (HK, Distance 4) and at the furthest site in HZ (Distance 3), which were associated with healthier seagrass meadows. This indicates that S. salpa may prefer areas with more robust and intact seagrass meadows, potentially due to the presence of high-quality forage resources.
Interestingly, these findings contrast with those from Buñuel et al. [62], who observed that in conditions of sea warming, S. salpa tends to shift its feeding preference from macroalgae to P. oceanica. Our results suggest that the preference of S. salpa for P. oceanica meadows may vary depending on local environmental conditions and meadow health. Given the critical role of herbivory in shaping seagrass meadows and in maintaining their overall health, we recommend that future studies should explore this phenomenon in greater detail. This should include an examination of the interaction between native herbivores and invasive alien species such as Siganus luridus [63], which may further complicate the dynamics between herbivory and seagrass meadow integrity under warming scenarios.
With regards to the FGs listing more sedentary species, the chronic exposure to the thermal effluent seems to force these species to move to cooler waters. For example, the FG2 predators, characterised by a reduced mobility, were recorded mainly at the furthest distances from the hot waters. In fact, contrary to highly mobile predators, which can sustain a short exposure to thermal stress, the more sedentary ones from FG2 might have searched cooler conditions, which in this scenario can be obtained through a larger distance from the effluent, while in hypothetical future warmer sea temperature scenario, these cooler conditions could be obtained through greater water depths [64]. A similar trend was observed for the FG8 (Labridae species) whose observed distribution in this study might be shaped by the optimal temperatures registered far from the effluent, the healthier seagrass meadow on which they rely and/or, lower predation activity [59].
Finally, for FG8 and FG9, which represent temperate species, it is not surprising that they were rare or absent at Distance 1, the site closest to the thermal effluent, but that they were more common at greater distances (Distance 3 and Control). In particular, Coris julis (within FG8) showed a clear preference for cooler sites, in line with previous studies observing a partitioning between Coris julis and Thalassoma pavo based on depth, and consequently, on temperature range [65]. Both species are known to have distinct thermal preferences, with Coris julis typically favouring cooler and deeper waters, as opposed to Thalassoma pavo which better tolerates warmer conditions and is found closer to the surface as a result.
In conclusion, this study highlights the significant impacts of rising sea temperatures, modelled through thermal effluents, on Posidonia oceanica meadows and on associated ecosystems. Temperature emerged as the primary driver of meadow health, with declines in key indicators such as leaf length, shoot density, and rhizome weight being recorded near the effluent. While adaptive mechanisms, like increased leaf numbers, partially compensated for thermal stress, overall meadow productivity and resilience were compromised.
These changes, in turn, influence associated fish assemblages, leading to alterations in species abundance, biodiversity, and in functional group distribution. FG analysis revealed disrupted seasonal patterns and the displacement of temperature-sensitive species, threatening critical ecological functions like sediment bioturbation and habitat complexity. These changes have cascading implications for ecosystem services and economic resources.
Thermal effluents provide a valuable proxy for studying climate change effects, revealing how rising temperatures may homogenize seasonal cycles and degrade coastal ecosystems. These findings underscore the need for conservation strategies so as to mitigate both localized thermal impacts and broader climate-driven changes, ensuring the preservation of P. oceanica meadows and the associated biodiversity they support.
Author Contributions
A.M., F.A., H.R., M.S., M.M. and E.C.L.M., participated in sampling and data collection. A.M. performed data analyses, prepared the figures, and drafted the manuscript. A.R., V.M., A.G., S.M. and A.D. revised critically the intellectual content and the English language giving the final approval of the version to be published. All authors have read and agreed to the published version of the manuscript.
Funding
This work was funded as part of A.M.’s PhD project and through the Interreg Italia-Malta SenHAR.
Institutional Review Board Statement
Not applicable.
Informed Consent Statement
Not applicable.
Data Availability Statement
The original contributions presented in the study are available and it can be requested directly to the corresponding author.
Acknowledgments
We would like to thank Blanca Mendiguren, Johann Galdies and Rosario Badalamenti for the precious field and laboratory support during this study. Special thanks also go to Kevin Sciberras, who provided the diving gears and boat support.
Conflicts of Interest
The authors declare that they have no known competing financial interest or personal relationships that could have appeared to influence the work reported in this paper.
Appendix A
References
- Venegas, R.M.; Acevedo, J.; Treml, E.A. Three decades of ocean warming impacts on marine ecosystems: A review and perspective. Deep Sea Res. Part II Top. Stud. Oceanogr. 2023, 212, 105318. [Google Scholar] [CrossRef]
- Khojasteh, D.; Haghani, M.; Nicholls, R.J.; Moftakhari, H.; Sadat-Noori, M.; Mach, K.J.; Glamore, W. The evolving landscape of sea-level rise science from 1990 to 2021. Commun. Earth Environ. 2023, 4, 257. [Google Scholar] [CrossRef]
- Zhao, X.; Qi, J.; Yu, Y.; Zhou, L. Deep learning for ocean temperature forecasting: A survey. Intell. Mar. Technol. Syst. 2024, 2, 28. [Google Scholar] [CrossRef]
- Pivato, M.; Carniello, L.; Viero, D.P.; Soranzo, C.; Defina, A.; Silvestri, S. Remote sensing for optimal estimation of water temperature dynamics in shallow tidal environments. Remote Sens. 2019, 12, 51. [Google Scholar] [CrossRef]
- Embury, O.; Merchant, C.J.; Good, S.A.; Rayner, N.A.; Høyer, J.L.; Atkinson, C.; Donlon, C. Satellite-based time-series of sea-surface temperature since 1980 for climate applications. Sci. Data 2024, 11, 326. [Google Scholar] [CrossRef] [PubMed]
- Taylor, J.; Feng, M. A deep learning model for forecasting global monthly mean sea surface temperature anomalies. Front. Clim. 2022, 4, 932932. [Google Scholar] [CrossRef]
- Pastor, F.; Valiente, J.A.; Khodayar, S. A warming Mediterranean: 38 years of increasing sea surface temperature. Remote Sens. 2020, 12, 2687. [Google Scholar] [CrossRef]
- Bianchi, C.N.; Morri, C. Global sea warming and "tropicalization" of the Mediterranean Sea: Biogeographic and ecological aspects. Biogeographia 2003, 24, 319–327. [Google Scholar] [CrossRef]
- Garrabou, J.; Gómez-Gras, D.; Medrano, A.; Cerrano, C.; Ponti, M.; Schlegel, R.; Harmelin, J.G. Marine heatwaves drive recurrent mass mortalities in the Mediterranean Sea. Glob. Chang. Biol. 2022, 28, 5708–5725. [Google Scholar] [CrossRef]
- Pansch, C.; Hiebenthal, C. A new mesocosm system to study the effects of environmental variability on marine species and communities. Limnol. Oceanogr. Methods 2019, 17, 145–162. [Google Scholar] [CrossRef]
- Fanelli, E.; Di Giacomo, S.; Gambi, C.; Bianchelli, S.; Da Ros, Z.; Tangherlini, M.; Danovaro, R. Effects of Local Acidification on Benthic Communities at Shallow Hydrothermal Vents of the Aeolian Islands (Southern Tyrrhenian, Mediterranean Sea). Biology 2022, 11(2), 321. [Google Scholar] [CrossRef]
- Bamber, R.N.; Spencer, J.F. The benthos of a coastal power station thermal discharge canal. J. Mar. Biol. Assoc. UK 1984, 64, 603–623. [Google Scholar] [CrossRef]
- Krishnakumar, V.; Sastry, J.S.; Swamy, G.N. Implication of thermal discharges into the sea—A review.
- Lin, J.; Zou, X.; Huang, F. Effects of the thermal discharge from an offshore power plant on plankton and macrobenthic communities in subtropical China. Mar. Pollut. Bull. 2018, 131, 106–114. [Google Scholar] [CrossRef] [PubMed]
- Bevilacqua, S.; Clara, S.; Terlizzi, A. The impact assessment of thermal pollution on subtidal sessile assemblages: A case study from Mediterranean rocky reefs. Ecol. Quest. 2020, 31, 101–110. [Google Scholar] [CrossRef]
- Huang, F.; Lin, J.; Zheng, B. Effects of thermal discharge from coastal nuclear power plants and thermal power plants on the thermocline characteristics in sea areas with different tidal dynamics. Water 2019, 11, 2577. [Google Scholar] [CrossRef]
- Agius, A.; Wright, L.S.; Borg, J.A. Impacts of thermal effluent on Posidonia oceanica and associated macrofauna. Mar. Ecol. Prog. Ser. 2023, 707, 15–29. [Google Scholar] [CrossRef]
- National Statistics Office Malta. Electricity Supply 2023. Available online: https://nso.gov.mt/electricity-supply-2023 (accessed on 27 January 2025).
- Cardoso-Mohedano, J.G.; Bernardello, R.; Sanchez-Cabeza, J.A.; Ruiz-Fernández, A.C.; Alonso-Rodriguez, R.; Cruzado, A. Thermal impact from a thermoelectric power plant on a tropical coastal lagoon. Water Air Soil Pollut. 2015, 226, 1–11. [Google Scholar] [CrossRef]
- Sánchez-Lizaso, J.L.; Romero, J.; Ruiz, J.; Gacia, E.; Buceta, J.L.; Invers, O.; Manzanera, M. Salinity Tolerance of the Mediterranean Seagrass Posidonia oceanica: Recommendations to Minimize the Impact of Brine Discharges from Desalination Plants. Desalination 2008, 221(1–3), 602–607.
- Ruiz, J.M.; Marín-Guirao, L.; García-Muñoz, R.; Ramos-Segura, A.; Bernardeau-Esteller, J.; Pérez, M.; Procaccini, G. Experimental evidence of warming-induced flowering in the Mediterranean seagrass Posidonia oceanica. Mar. Pollut. Bull. 2018, 134, 49–54. [Google Scholar] [CrossRef]
- Montefalcone, M. Ecosystem health assessment using the Mediterranean seagrass Posidonia oceanica: A review. Ecol. Indic. 2009, 9, 595–604. [Google Scholar] [CrossRef]
- Personnic, S.; Boudouresque, C.F.; Astruch, P.; Ballesteros, E.; Blouet, S.; Bellan-Santini, D.; Ruitton, S. An ecosystem-based approach to assess the status of a Mediterranean ecosystem, the Posidonia oceanica seagrass meadow. PLoS ONE 2014, 9, e98994. [Google Scholar] [CrossRef]
- Abadie, A.; Pace, M.; Gobert, S.; Borg, J.A. Seascape ecology in Posidonia oceanica seagrass meadows: Linking structure and ecological processes for management. Ecol. Indic. 2018, 87, 1–13. [Google Scholar] [CrossRef]
- Rinaldi, A.; Martinez, M.; Badalamenti, F.; D’Anna, G.; Mirto, S.; Marín-Guirao, L.; Montalto, V. The ontogeny-specific thermal sensitivity of the seagrass Posidonia oceanica. Front. Mar. Sci. 2023, 10, 1183728. [Google Scholar] [CrossRef]
- Vassallo, P.; Paoli, C.; Rovere, A.; Montefalcone, M.; Morri, C.; Bianchi, C.N. The value of the seagrass Posidonia oceanica: A natural capital assessment. Mar. Pollut. Bull. 2013, 75, 157–167. [Google Scholar] [CrossRef] [PubMed]
- El Zrelli, R.; Hcine, A.; Yacoubi, L.; Roa-Ureta, R.H.; Gallai, N.; Castet, S.; Rabaoui, L.J. Economic losses related to the reduction of Posidonia ecosystem services in the Gulf of Gabes (Southern Mediterranean Sea). Mar. Pollut. Bull. 2023, 186, 114418. [Google Scholar] [CrossRef]
- Smith, W.E.; Kwak, T.J. Tropical insular fish assemblages are resilient to flood disturbance. Ecosphere 2015, 6, 1–16. [Google Scholar] [CrossRef]
- Ceccarelli, D.M.; Emslie, M.J.; Richards, Z.T. Post-disturbance stability of fish assemblages measured at coarse taxonomic resolution masks change at finer scales. PLoS ONE 2016, 11, e0156232. [Google Scholar] [CrossRef] [PubMed]
- Zubak, I.; Kruschel, C.; Schultz, S.T. Predators structure fish communities in Posidonia oceanica meadows: Meta-analysis of available data across the Mediterranean basin. Mar. Ecol. Prog. Ser. 2017, 566, 145–157. [Google Scholar] [CrossRef]
- Fleishman, E.; Noss, R.F.; Noon, B.R. Utility and limitations of species richness metrics for conservation planning. Ecol. Indic. 2006, 6, 543–553. [Google Scholar] [CrossRef]
- Daly, A.J.; Baetens, J.M.; De Baets, B. Ecological Diversity: Measuring the Unmeasurable. Mathematics 2018, 6(7), 119. [Google Scholar] [CrossRef]
- Lam-Gordillo, O.; Baring, R.; Dittmann, S. Ecosystem functioning and functional approaches on marine macrobenthic fauna: A research synthesis towards a global consensus. Ecol. Indic. 2020, 115, 106379. [Google Scholar] [CrossRef]
- Lardicci, C.; Rossi, F.; Maltagliati, F. Detection of thermal pollution: Variability of benthic communities at two different spatial scales in an area influenced by a coastal power station. Mar. Pollut. Bull. 1999, 38, 296–303. [Google Scholar] [CrossRef]
- Buia, M.C.; Gambi, M.C.; Dappiano, M. Seagrass systems. Biol. Mar. Mediterr. 2004, 10 (Suppl.), 133–183. [Google Scholar]
- Samoilys, M.A.; Carlos, G. Determining methods of underwater visual census for estimating the abundance of coral reef fishes. Environ. Biol. Fish. 2000, 57, 289–304. [Google Scholar] [CrossRef]
- Marrone, A.; Mangano, M.C.; Deidun, A.; Berlino, M.; Sarà, G. Effects of habitat fragmentation of a Mediterranean marine reef on the associated fish community: Insights from biological traits analysis. J. Mar. Sci. Eng. 2023, 11, 1957. [Google Scholar] [CrossRef]
- Anderson, M.J.; Walsh, D.C.; Sweatman, W.L.; Punnett, A.J. Non-linear models of species' responses to environmental and spatial gradients. Ecol. Lett. 2022, 25, 2739–2752. [Google Scholar] [CrossRef]
- Anderson, M.J. Permutational Multivariate Analysis of Variance; Department of Statistics, University of Auckland: Auckland, New Zealand, 2005; Volume 26, pp. 32–46. [Google Scholar]
- Clarke, K.R.; Gorley, R.N. PRIMER: Getting Started with v6; PRIMER-E Ltd: Plymouth, UK, 2005. [Google Scholar]
- Rousselet, G.; Pernet, C.R.; Wilcox, R.R. An introduction to the bootstrap: A versatile method to make inferences by using data-driven simulations. Meta-Psychol. 2023, 7.
- Anderson, M.J. Distance-based tests for homogeneity of multivariate dispersions. Biometrics 2006, 62, 245–253. [Google Scholar] [CrossRef]
- Lindsey, R. Climate change: Global sea level. Available online: Climate.gov (accessed on 14 August 2020).
- Ventura, P.; Gautier-Debernardi, J.; Di Franco, E.; Francour, P.; Di Franco, A.; Pey, A. Habitat-specific response of fish assemblages in a small fully protected urban MPA. ICES J. Mar. Sci. 2024, 81, 1575–1583. [Google Scholar] [CrossRef]
- Kalloniati, K.; Christou, E.D.; Kournopoulou, A.; Gittings, J.A.; Theodorou, I.; Zervoudaki, S.; Raitsos, D.E. Long-term warming and human-induced plankton shifts at a coastal Eastern Mediterranean site. Sci. Rep. 2023, 13, 21068. [Google Scholar] [CrossRef]
- Appolloni, L.; Pagliarani, A.; Cocozza di Montanara, A.; Rendina, F.; Donnarumma, L.; Ciorciaro, D.; Russo, G.F. Benthic fish communities associated with Posidonia oceanica beds may reveal the fishing impact and effectiveness of marine protected areas: Two case studies in the southern Tyrrhenian Sea. Water 2023, 15, 1967. [Google Scholar] [CrossRef]
- Cox, T.E.; Schenone, S.; Delille, J.; Díaz-Castañeda, V.; Alliouane, S.; Gattuso, J.P.; Gazeau, F. Effects of ocean acidification on Posidonia oceanica epiphytic community and shoot productivity. J. Ecol. 2015, 103, 1594–1609. [Google Scholar] [CrossRef]
- Borg, J.A.; Rowden, A.A.; Attrill, M.J.; Schembri, P.J.; Jones, M.B. Spatial variation in the composition of motile macroinvertebrate assemblages associated with two bed types of the seagrass Posidonia oceanica. Mar. Ecol. Prog. Ser. 2010, 406, 91–104. [Google Scholar] [CrossRef]
- Cornwall, C.E.; Nelson, W.A.; Aguirre, J.D.; Blain, C.O.; Coyle, L.; D’Archino, R.; Thomsen, M.S. Predicting the impacts of climate change on New Zealand’s seaweed-based ecosystems. N. Z. J. Bot. 2023, 1–27. [Google Scholar] [CrossRef]
- Stipcich, P.; Marín-Guirao, L.; Pansini, A.; Pinna, F.; Procaccini, G.; Pusceddu, A.; Ceccherelli, G. Effects of current and future summer marine heat waves on Posidonia oceanica: Plant origin matters? Front. Clim. 2022, 4, 844831. [Google Scholar] [CrossRef]
- Diaz-Almela, E.; Marbà, N.; Duarte, C.M. Consequences of Mediterranean warming events in seagrass (Posidonia oceanica) flowering records. Glob. Chang. Biol. 2007, 13, 224–235. [Google Scholar] [CrossRef]
- Beca-Carretero, P.; Winters, G.; Teichberg, M.; Procaccini, G.; Schneekloth, F.; Zambrano, R.H.; Reuter, H. Climate change and the presence of invasive species will threaten the persistence of the Mediterranean seagrass community. Sci. Total Environ. 2024, 910, 168675. [Google Scholar] [CrossRef] [PubMed]
- González-Andrés, C.; Ramírez-Romero, E.; Guijarro, B.; Farre, M.; Macias, D.; Massutí, E. Warming promotes expansion of a key demersal fishing resource of the western Mediterranean. Front. Mar. Sci. 2024, 11, 1494177. [Google Scholar] [CrossRef]
- Deidun, A.; Azzopardi, F.; Marrone, A.; Massa-Gallucci, A.; Cutajar, K.; Hayden, B. Assessing the contribution of Posidonia oceanica to Mediterranean secondary production through stable isotope analysis. J. Mar. Sci. Eng. 2024, 12, 2197. [Google Scholar] [CrossRef]
- Guidetti, P. Differences among fish assemblages associated with nearshore Posidonia oceanica seagrass beds, rocky–algal reefs and unvegetated sand habitats in the Adriatic Sea. Estuar. Coast. Shelf Sci. 2000, 50, 515–529. [Google Scholar] [CrossRef]
- Verlaque, M.; Giraud, G.; Boudouresque, C.F. Effects of a thermal power plant on the Mediterranean marine phytobenthos: The area of high frequency temperature changes. Bot. Mar. 1981, 24, 81–89. [Google Scholar] [CrossRef]
- Beauchard, O.; Veríssimo, H.; Queirós, A.M.; Herman, P.M.J. The use of multiple biological traits in marine community ecology and its potential in ecological indicator development. Ecol. Indic. 2017, 76, 81–96. [Google Scholar] [CrossRef]
- Tsirintanis, K.; Azzurro, E.; Crocetta, F.; Dimiza, M.; Froglia, C.; Gerovasileiou, V.; Katsanevakis, S. Bioinvasion impacts on biodiversity, ecosystem services, and human health in the Mediterranean Sea. Aquat. Invasions 2022, 17, 308–352. [Google Scholar] [CrossRef]
- Weinert, M.; Kröncke, I.; Meyer, J.; Mathis, M.; Pohlmann, T.; Reiss, H. Benthic ecosystem functioning under climate change: Modelling the bioturbation potential for benthic key species in the southern North Sea. PeerJ 2022, 10, e14105. [Google Scholar] [CrossRef] [PubMed]
- Ragkousis, M.; Zenetos, A.; Souissi, J.B.; Hoffman, R.; Ghanem, R.; Taşkın, E.; Karachle, P.K. Unpublished Mediterranean and Black Sea records of marine alien, cryptogenic, and neonative species.
- Espino, F.; González, J.A.; Haroun, R.; Tuya, F. Abundance and Biomass of the Parrotfish Sparisoma cretense in Seagrass Meadows: Temporal and Spatial Differences between Seagrass Interiors and Seagrass Adjacent to Reefs. Environmental Biology of Fishes 2015, 98, 121–133. [Google Scholar] [CrossRef]
- Buñuel, X.; Alcoverro, T.; Romero, J.; Arthur, R.; Ruiz, J.M.; Pérez, M.; Pages, J.F. Warming intensifies the interaction between the temperate seagrass Posidonia oceanica and its dominant fish herbivore Sarpa salpa. Mar. Environ. Res. 2021, 165, 105237. [Google Scholar] [CrossRef]
- Santana-Garcon, J.; Bennett, S.; Marbà, N.; Vergés, A.; Arthur, R.; Alcoverro, T. Tropicalization shifts herbivore pressure from seagrass to rocky reef communities. Proc. R. Soc. B 2023, 290, 20221744. [Google Scholar] [CrossRef]
- Hidalgo, M.; El-Haweet, A.E.; Tsikliras, A.C.; Tirasin, E.M.; Fortibuoni, T.; Ronchi, F.; Vasconcellos, M. Risks and adaptation options for the Mediterranean fisheries in the face of multiple climate change drivers and impacts. ICES J. Mar. Sci. 2022, 79, 2473–2488. [Google Scholar] [CrossRef]
- Milazzo, M.; Quattrocchi, F.; Azzurro, E.; Palmeri, A.; Chemello, R.; Di Franco, A.; García-Charton, J.A. Warming-related shifts in the distribution of two competing coastal wrasses. Mar. Environ. Res. 2016, 120, 55–67. [Google Scholar] [CrossRef]
Figure 1.
Map featuring location of the study area in the Mediterranean Sea, and in the Maltese Archipelago. The two embayments studied are Il-Ħofra ż-Żgħira (HZ) and Il-Ħofra l-Kbira (HK). The red circle indicates the thermal effluent and numbers from 1 to 4 indicates the sampling stations with 4 taken as Control.
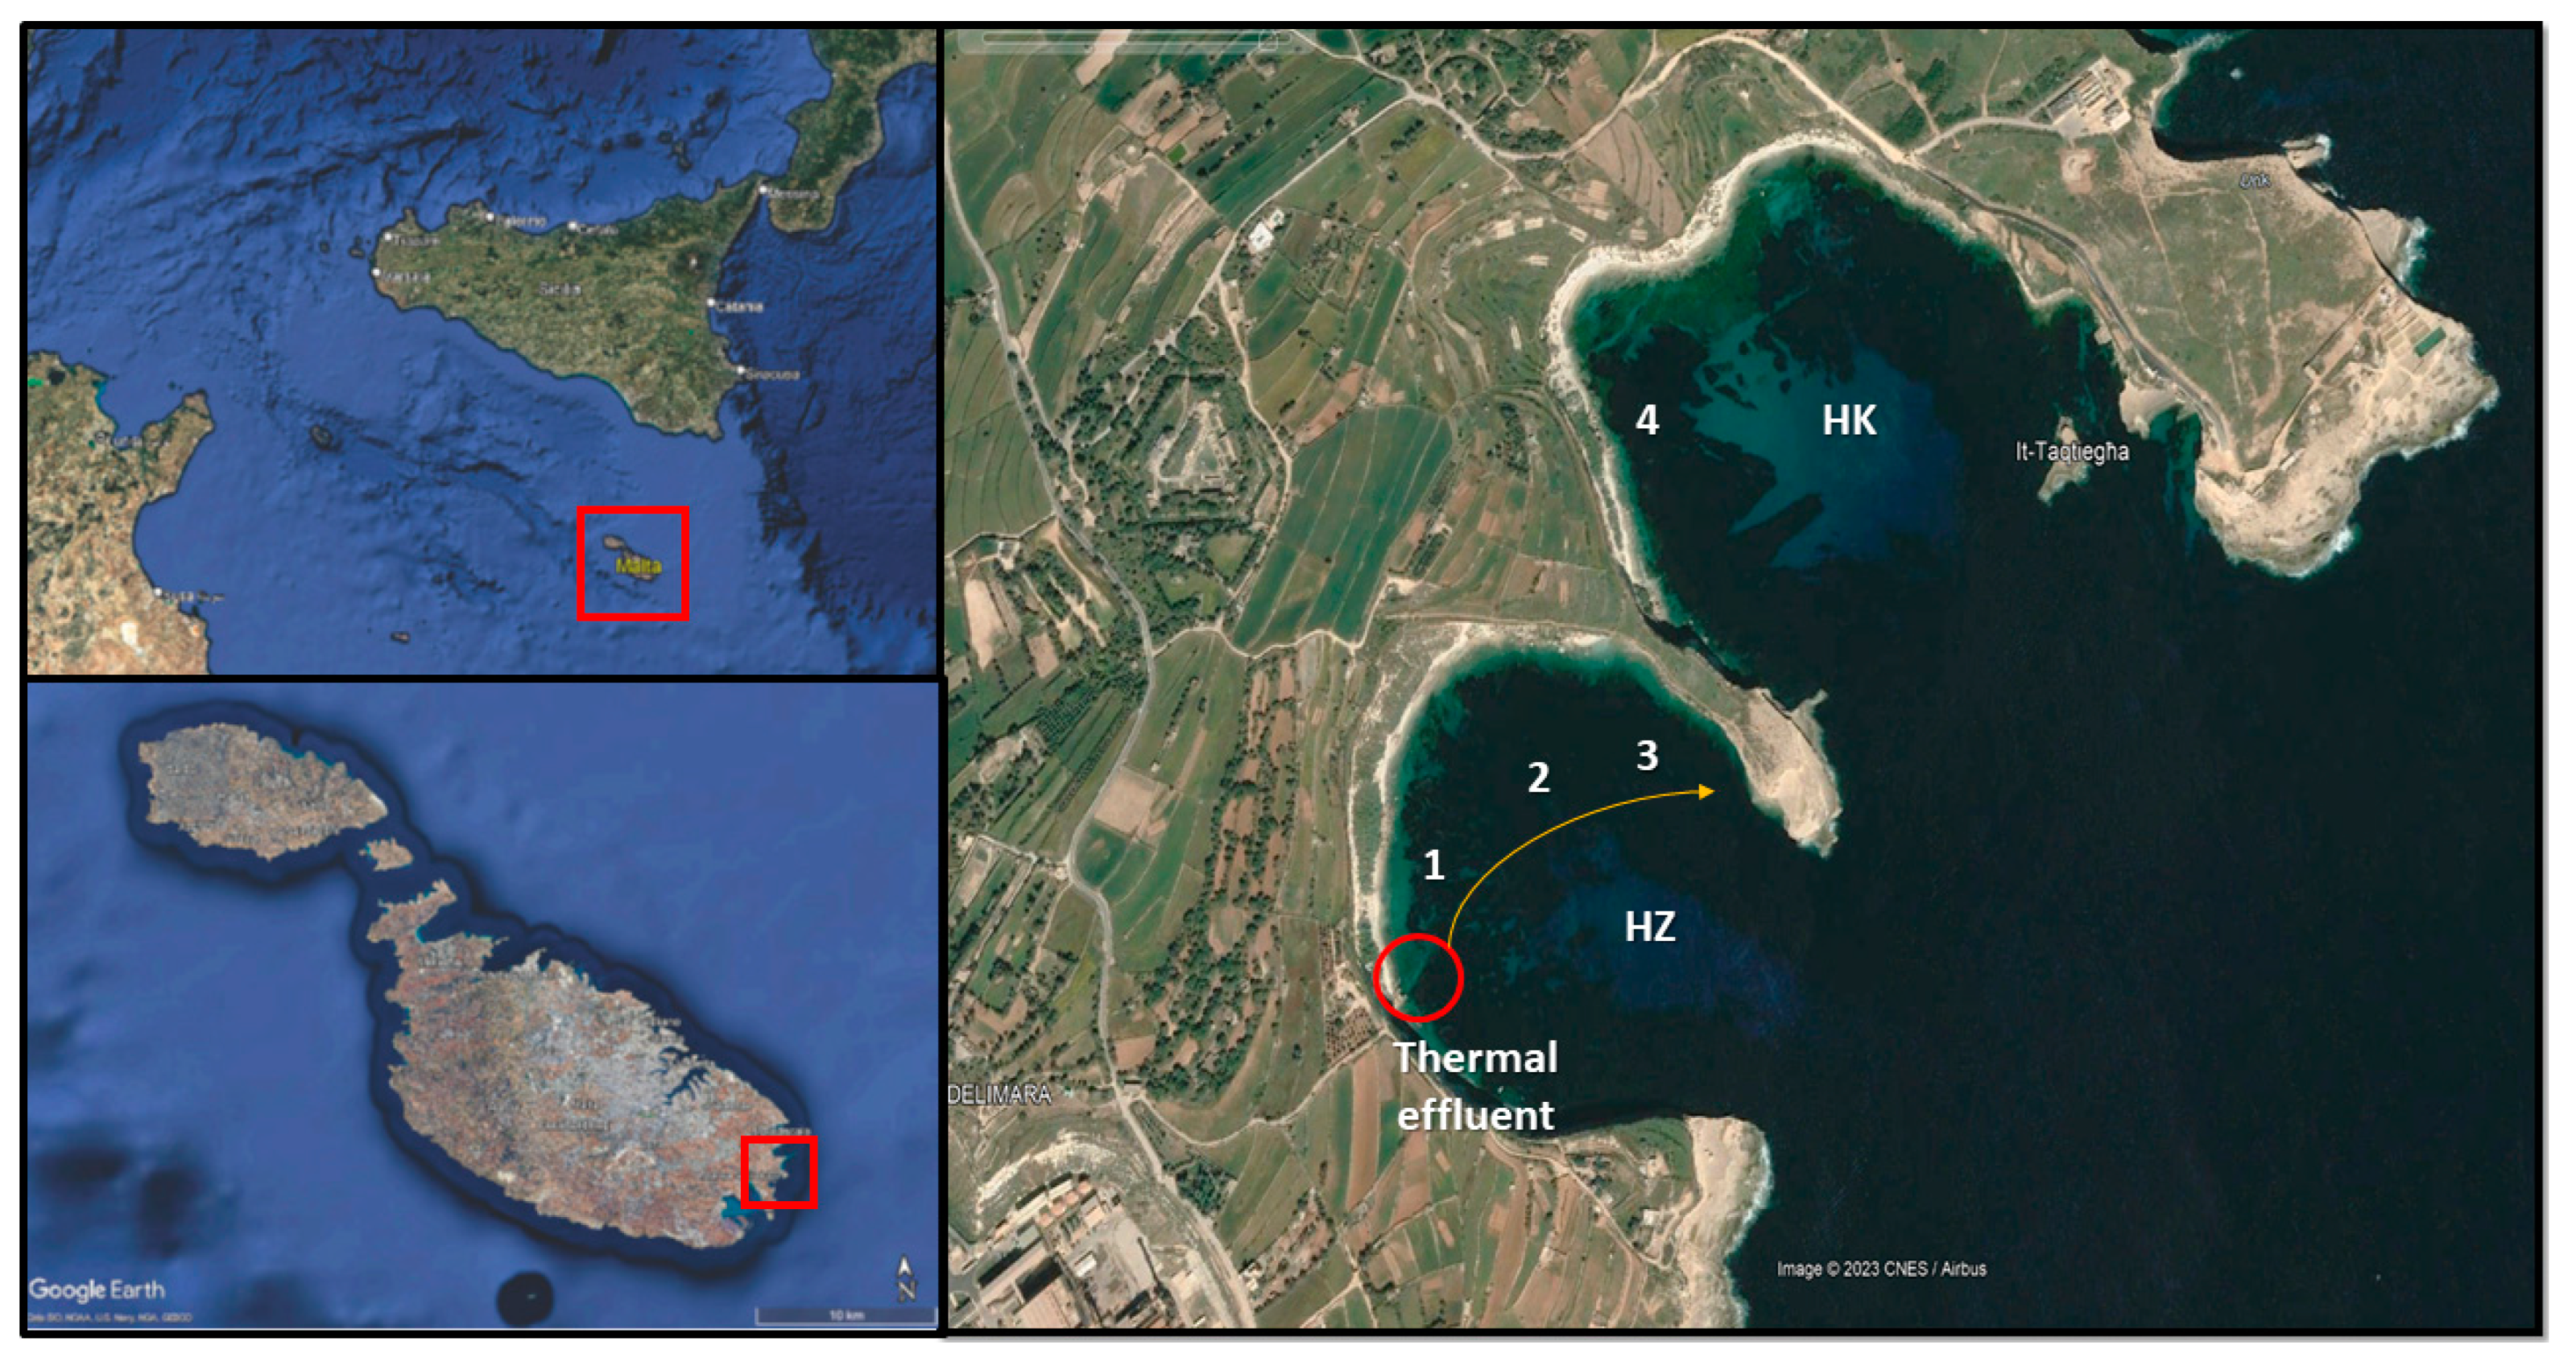
Figure 2.
Principal Component Analysis (PCA) of the Environmental variables and the Posidonia oceanica metrics.
Figure 2.
Principal Component Analysis (PCA) of the Environmental variables and the Posidonia oceanica metrics.
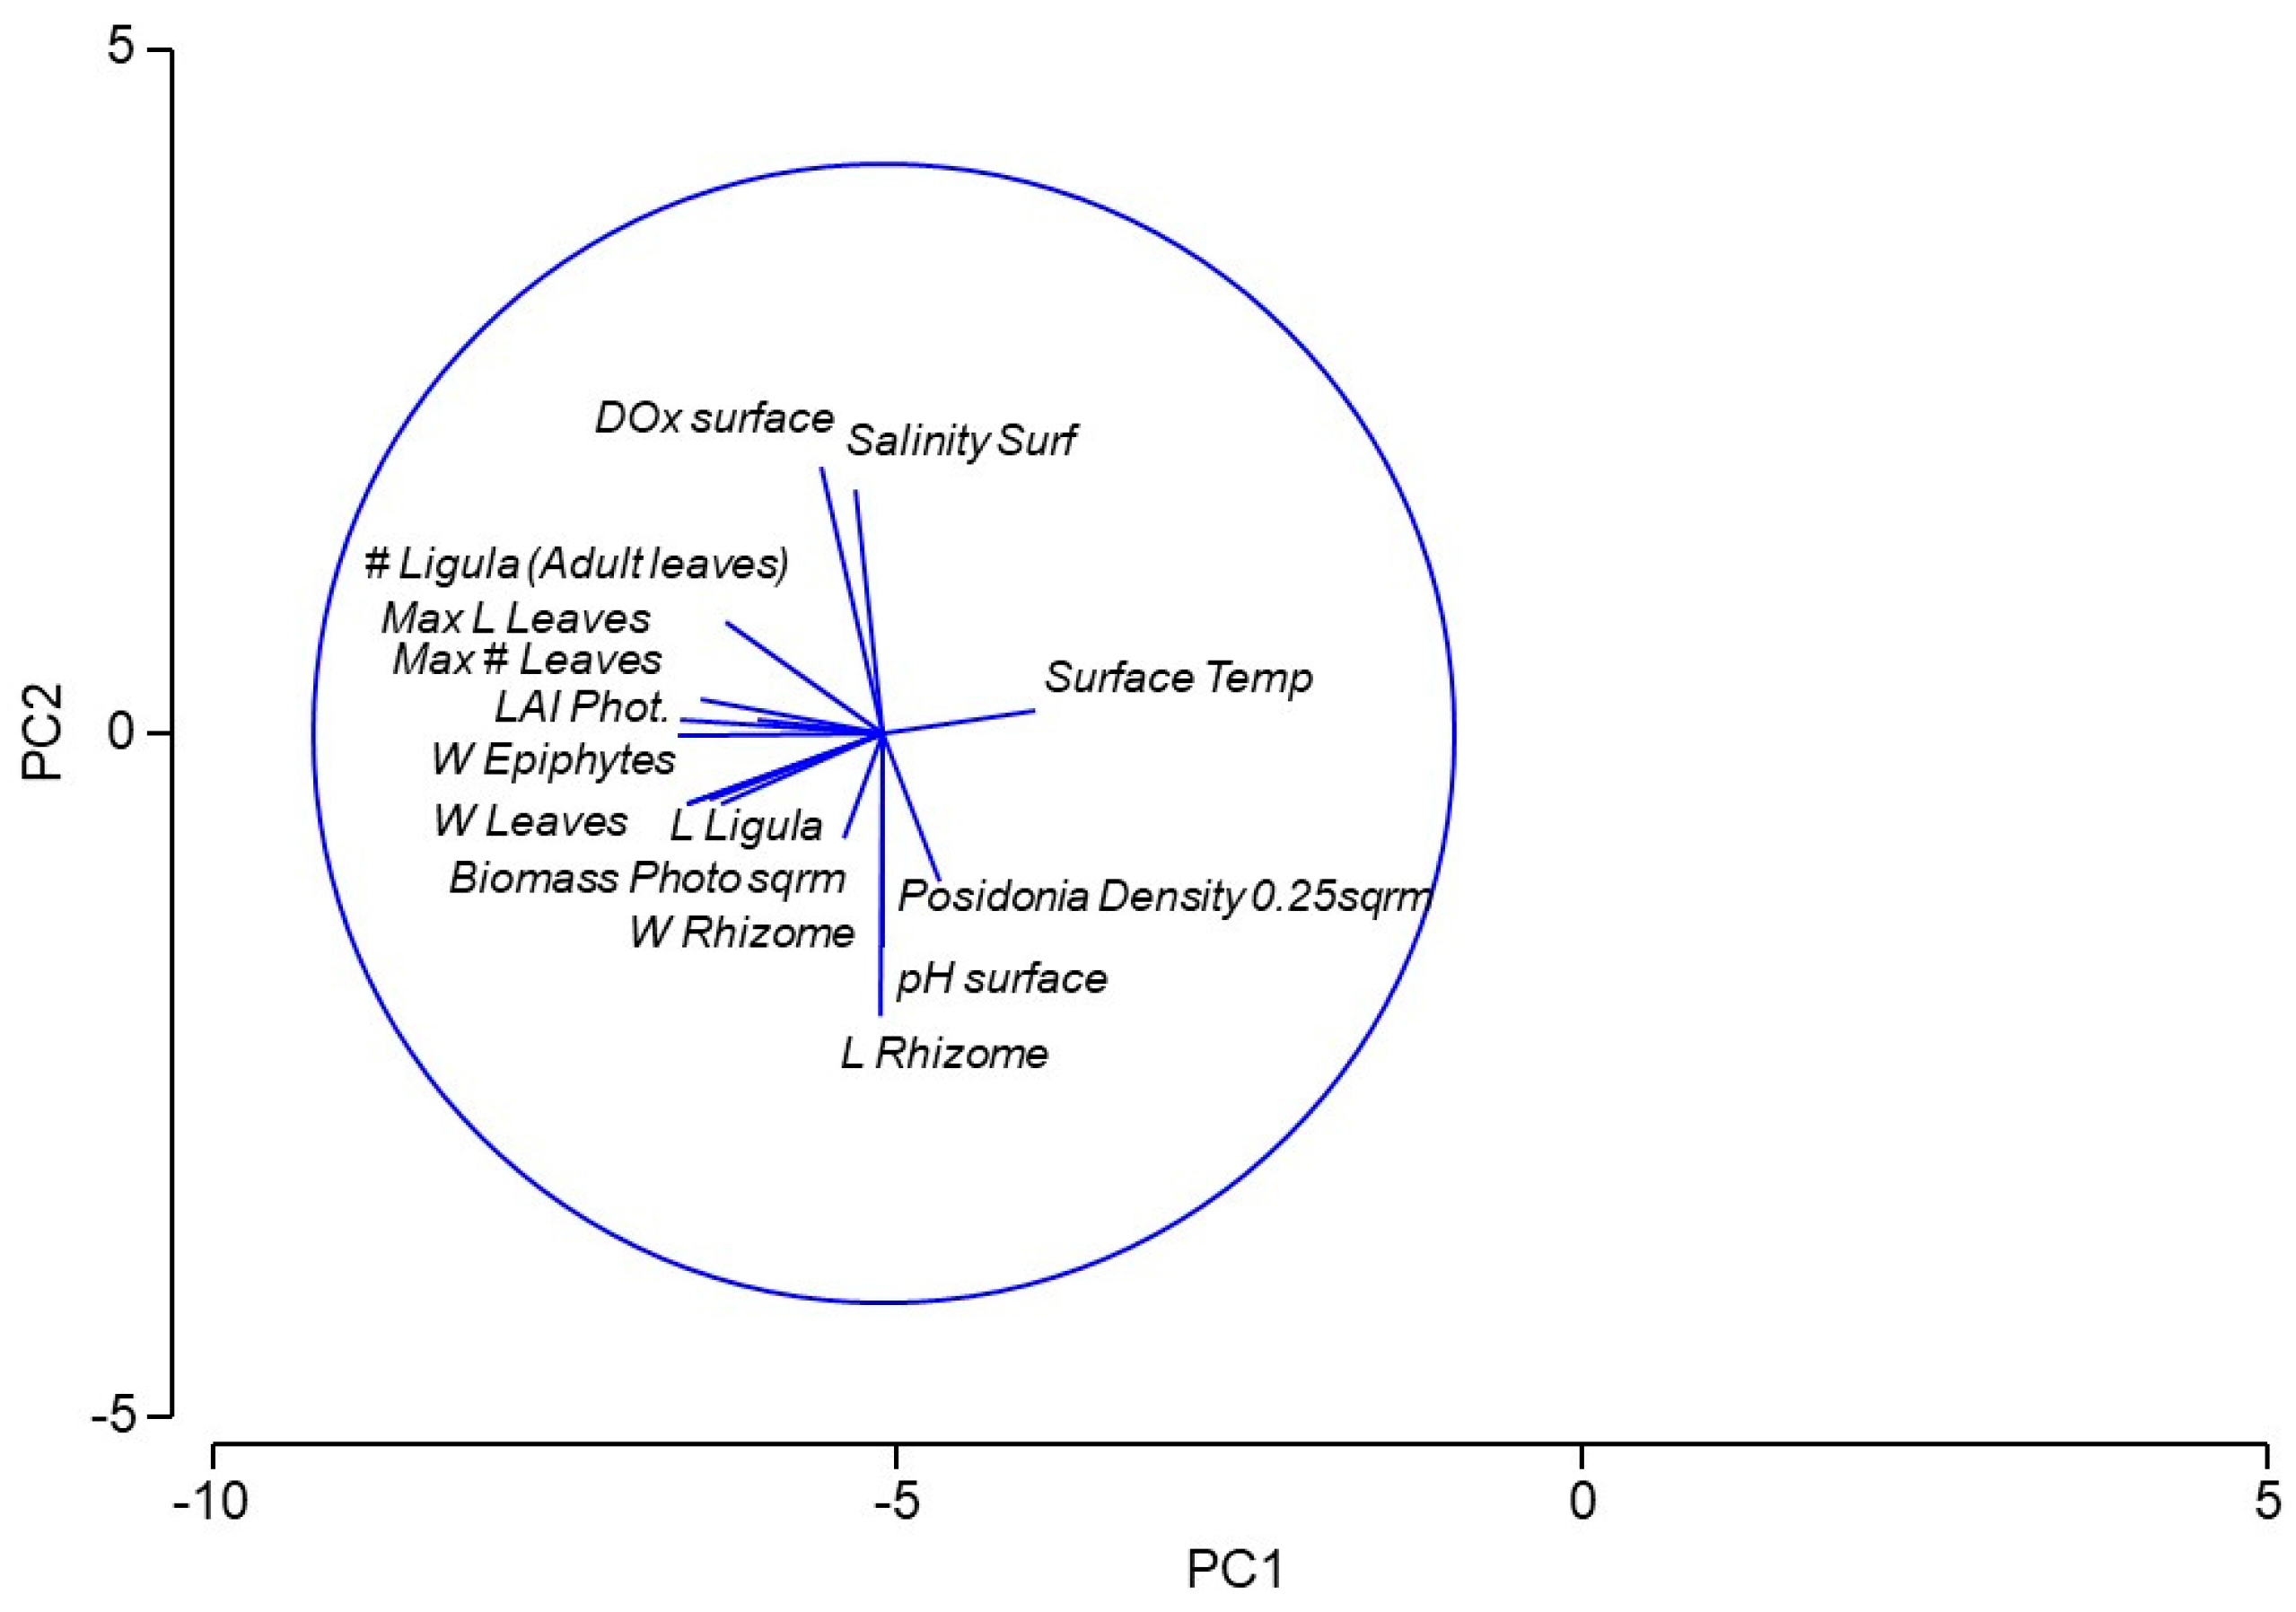
Figure 3.
Boxplot of the differences for biodiversity metrics with Number of species (S), total abundance of individuals (N) and the Shannon index (H’). Circle marks highlight outliners.
Figure 3.
Boxplot of the differences for biodiversity metrics with Number of species (S), total abundance of individuals (N) and the Shannon index (H’). Circle marks highlight outliners.
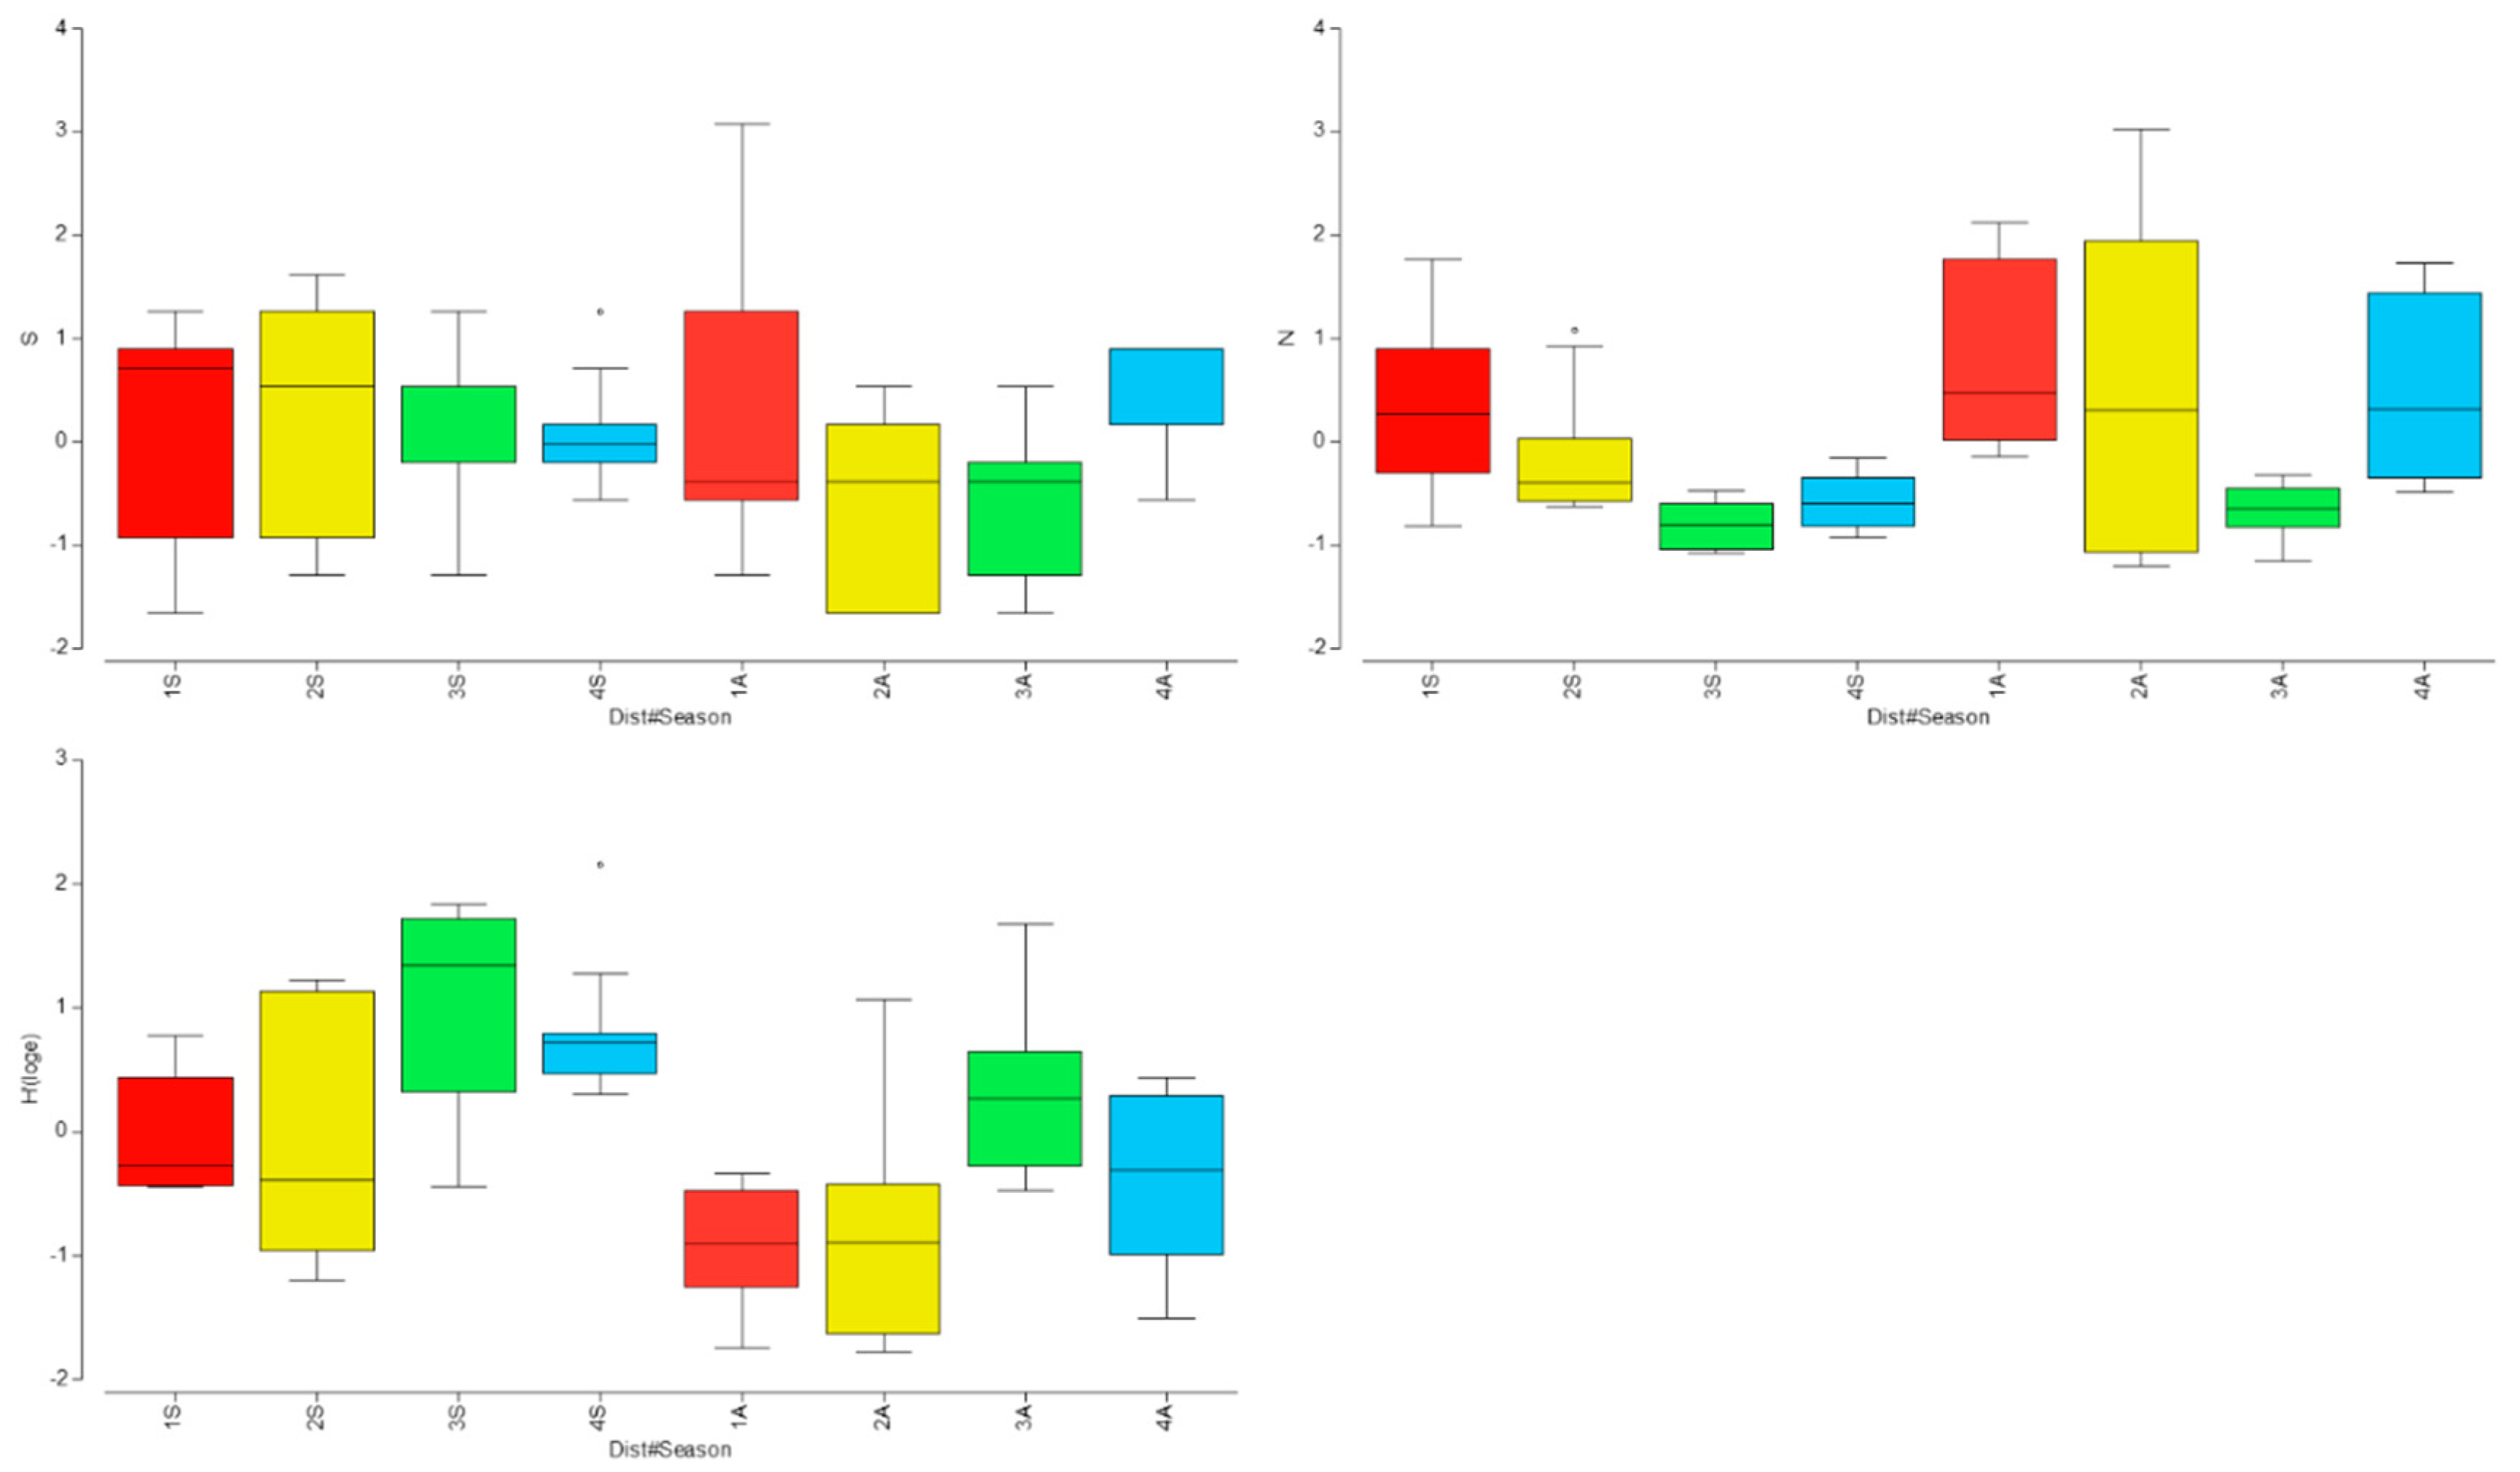
Figure 4.
Non-metric MDS of the fish assemblage after application of bootstrap average technique. Levels of Distance from the thermal effluent (1-4) and, Season Spring (S) and Autumn (A). Stress value indicated < 0.20.
Figure 4.
Non-metric MDS of the fish assemblage after application of bootstrap average technique. Levels of Distance from the thermal effluent (1-4) and, Season Spring (S) and Autumn (A). Stress value indicated < 0.20.
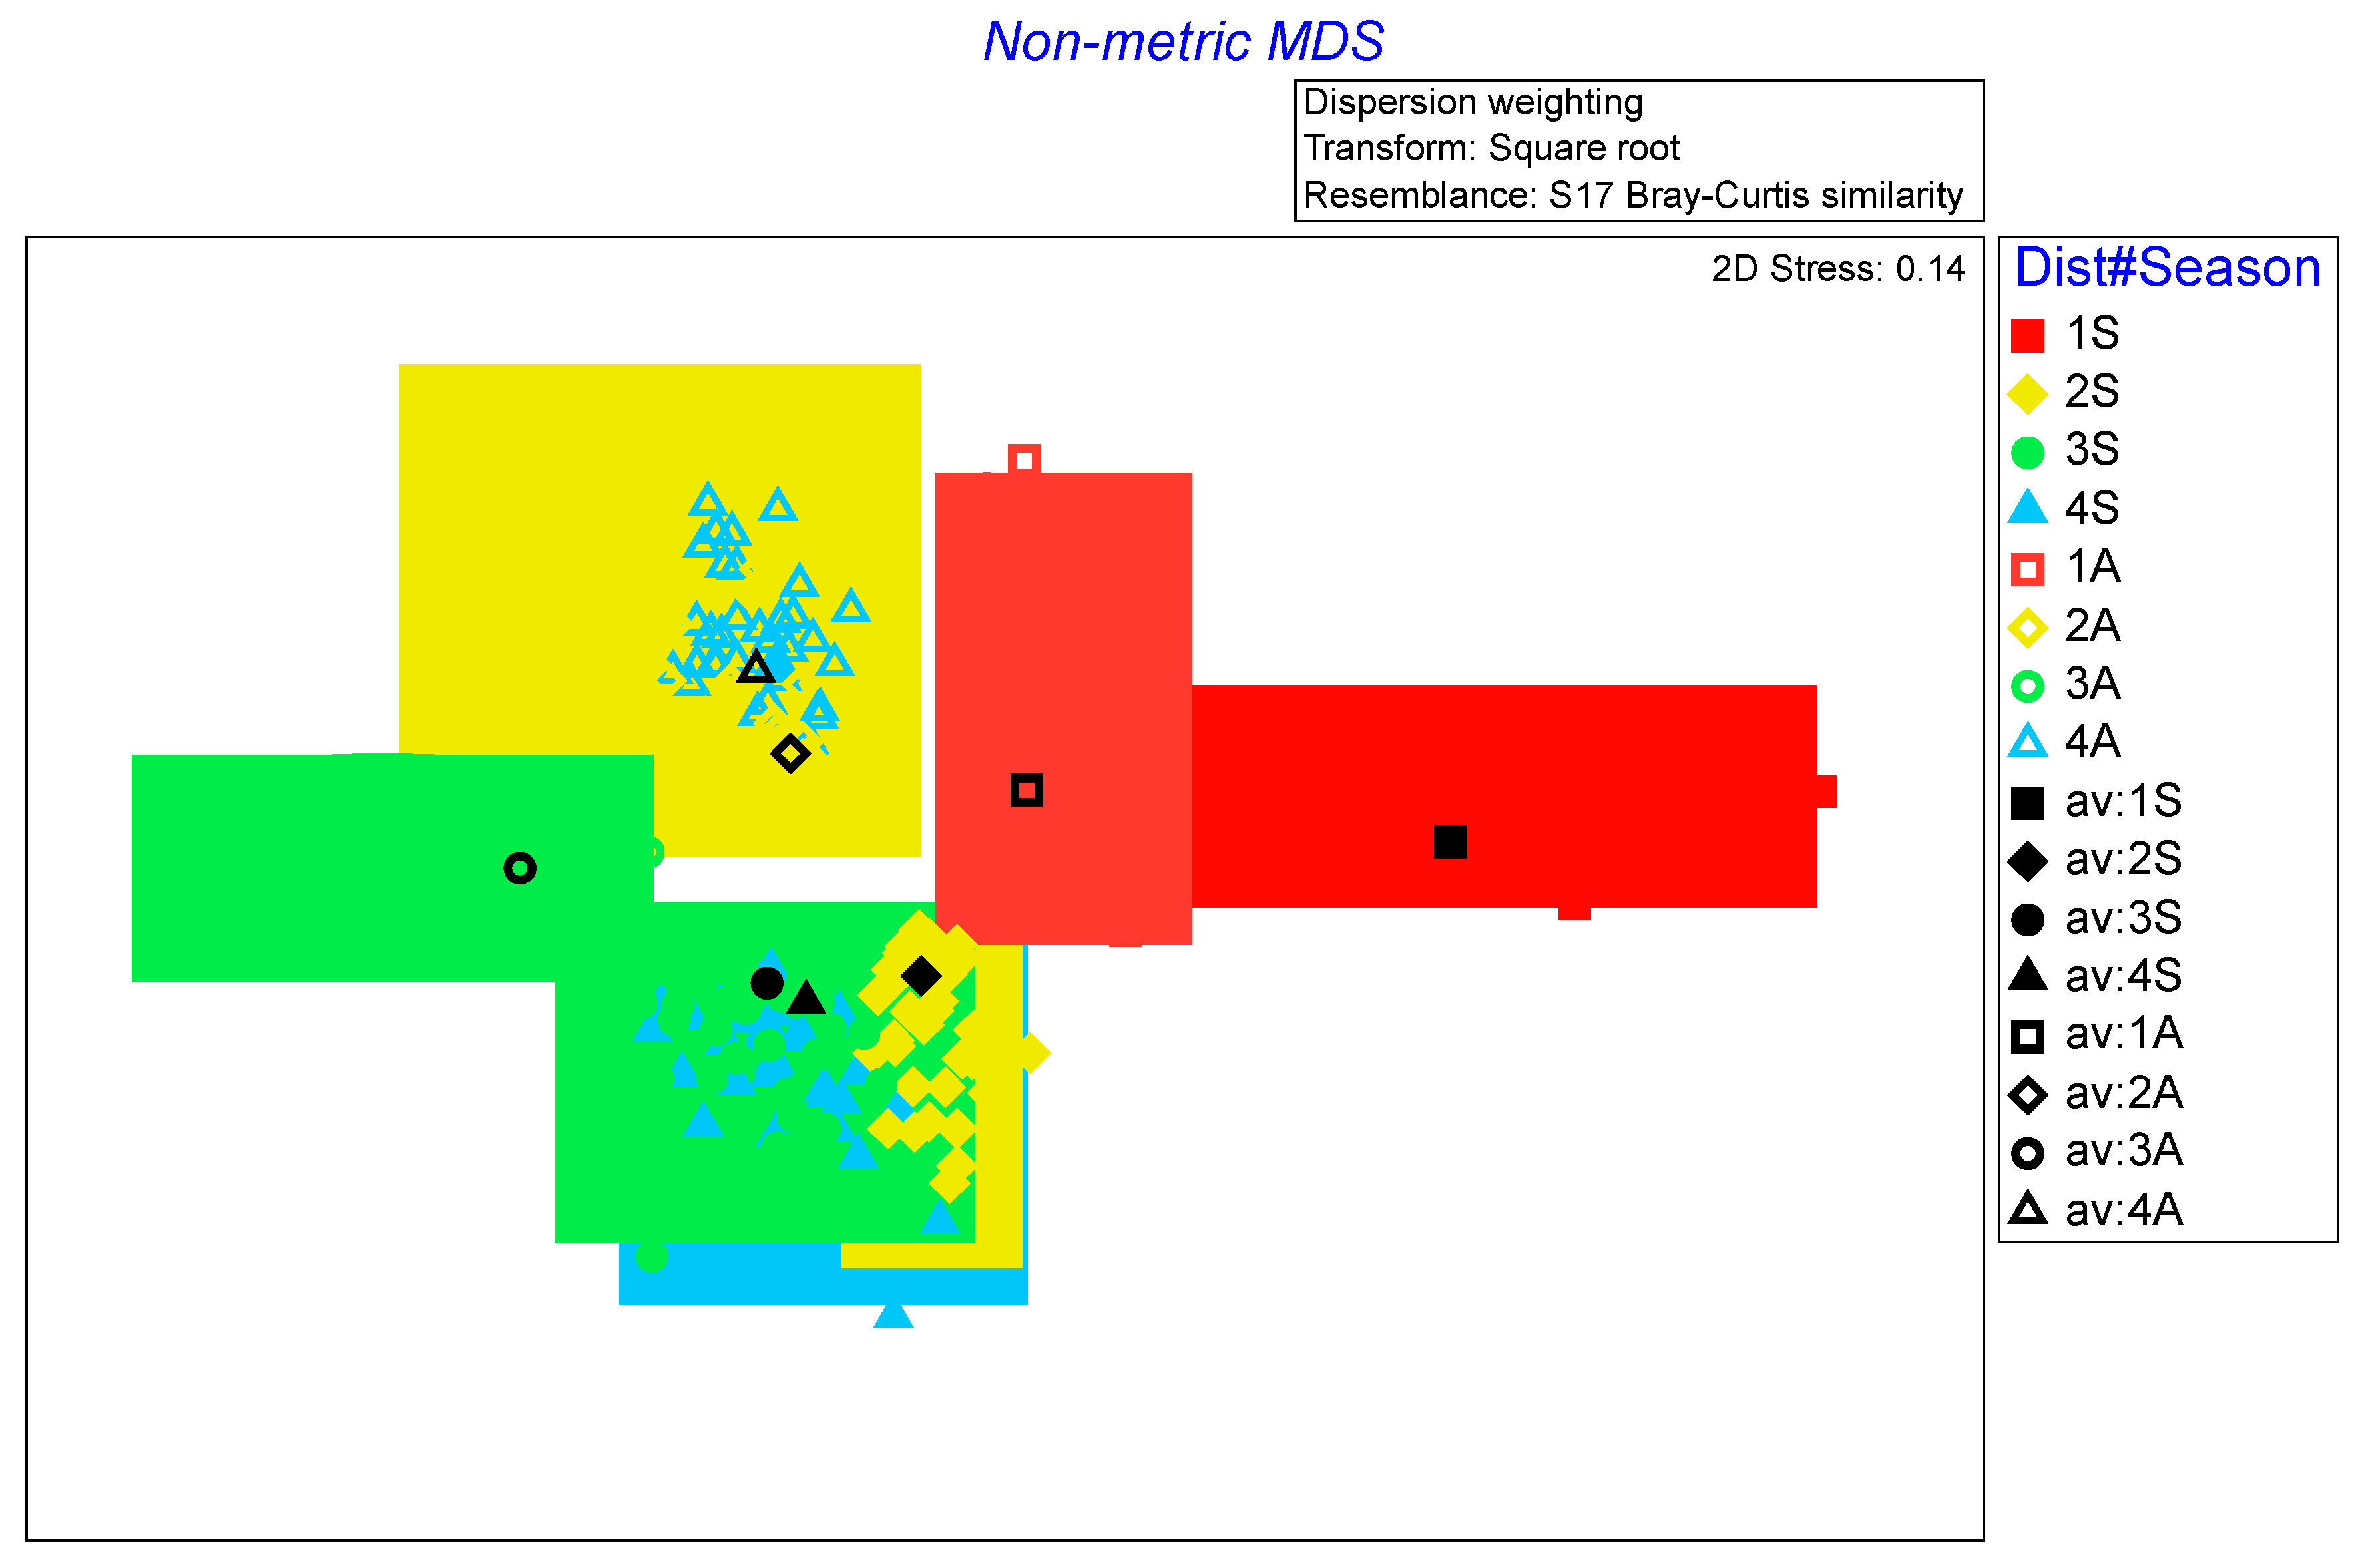
Figure 5.
FGs DISTLM graphical representation including vectors for the predictor variables as identified from the BEST routine. Levels of Distance from the thermal effluent (1-4) and, Season Spring (S) and Autumn (A).
Figure 5.
FGs DISTLM graphical representation including vectors for the predictor variables as identified from the BEST routine. Levels of Distance from the thermal effluent (1-4) and, Season Spring (S) and Autumn (A).
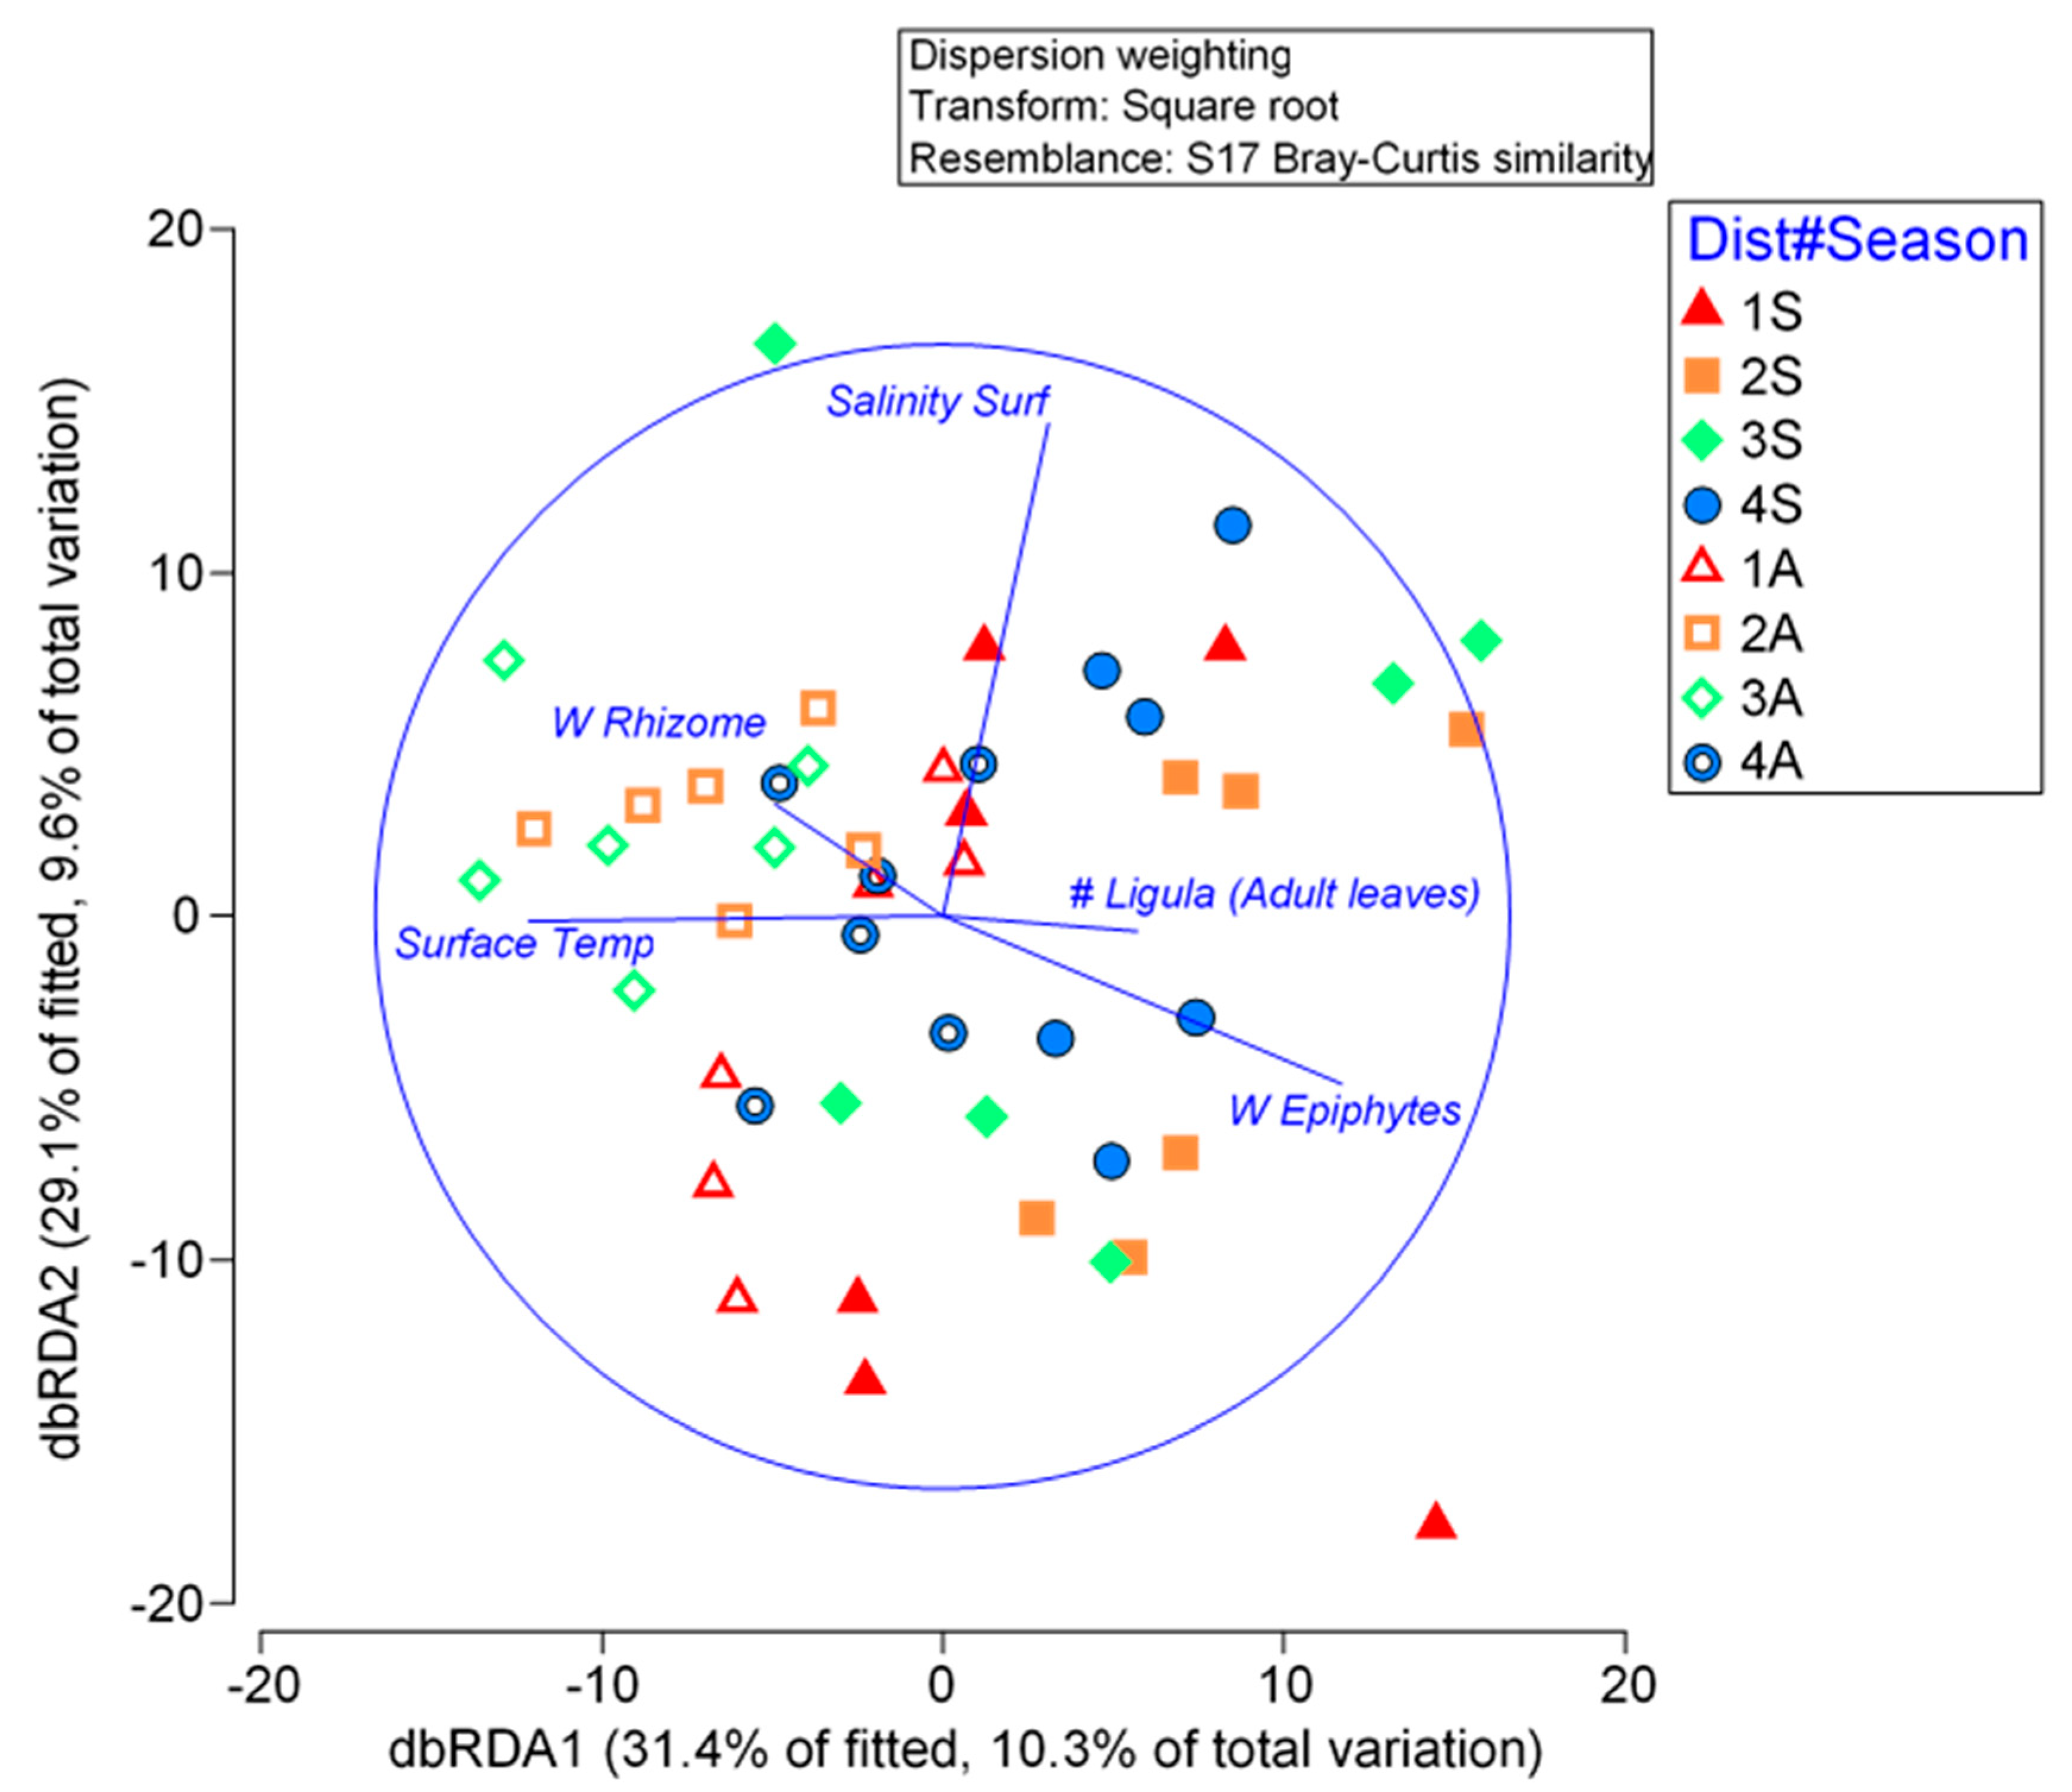
Figure 6.
Species-environment non-linear model for the nine FGs. Optimal model selection based on the lowest AIC value.
Figure 6.
Species-environment non-linear model for the nine FGs. Optimal model selection based on the lowest AIC value.
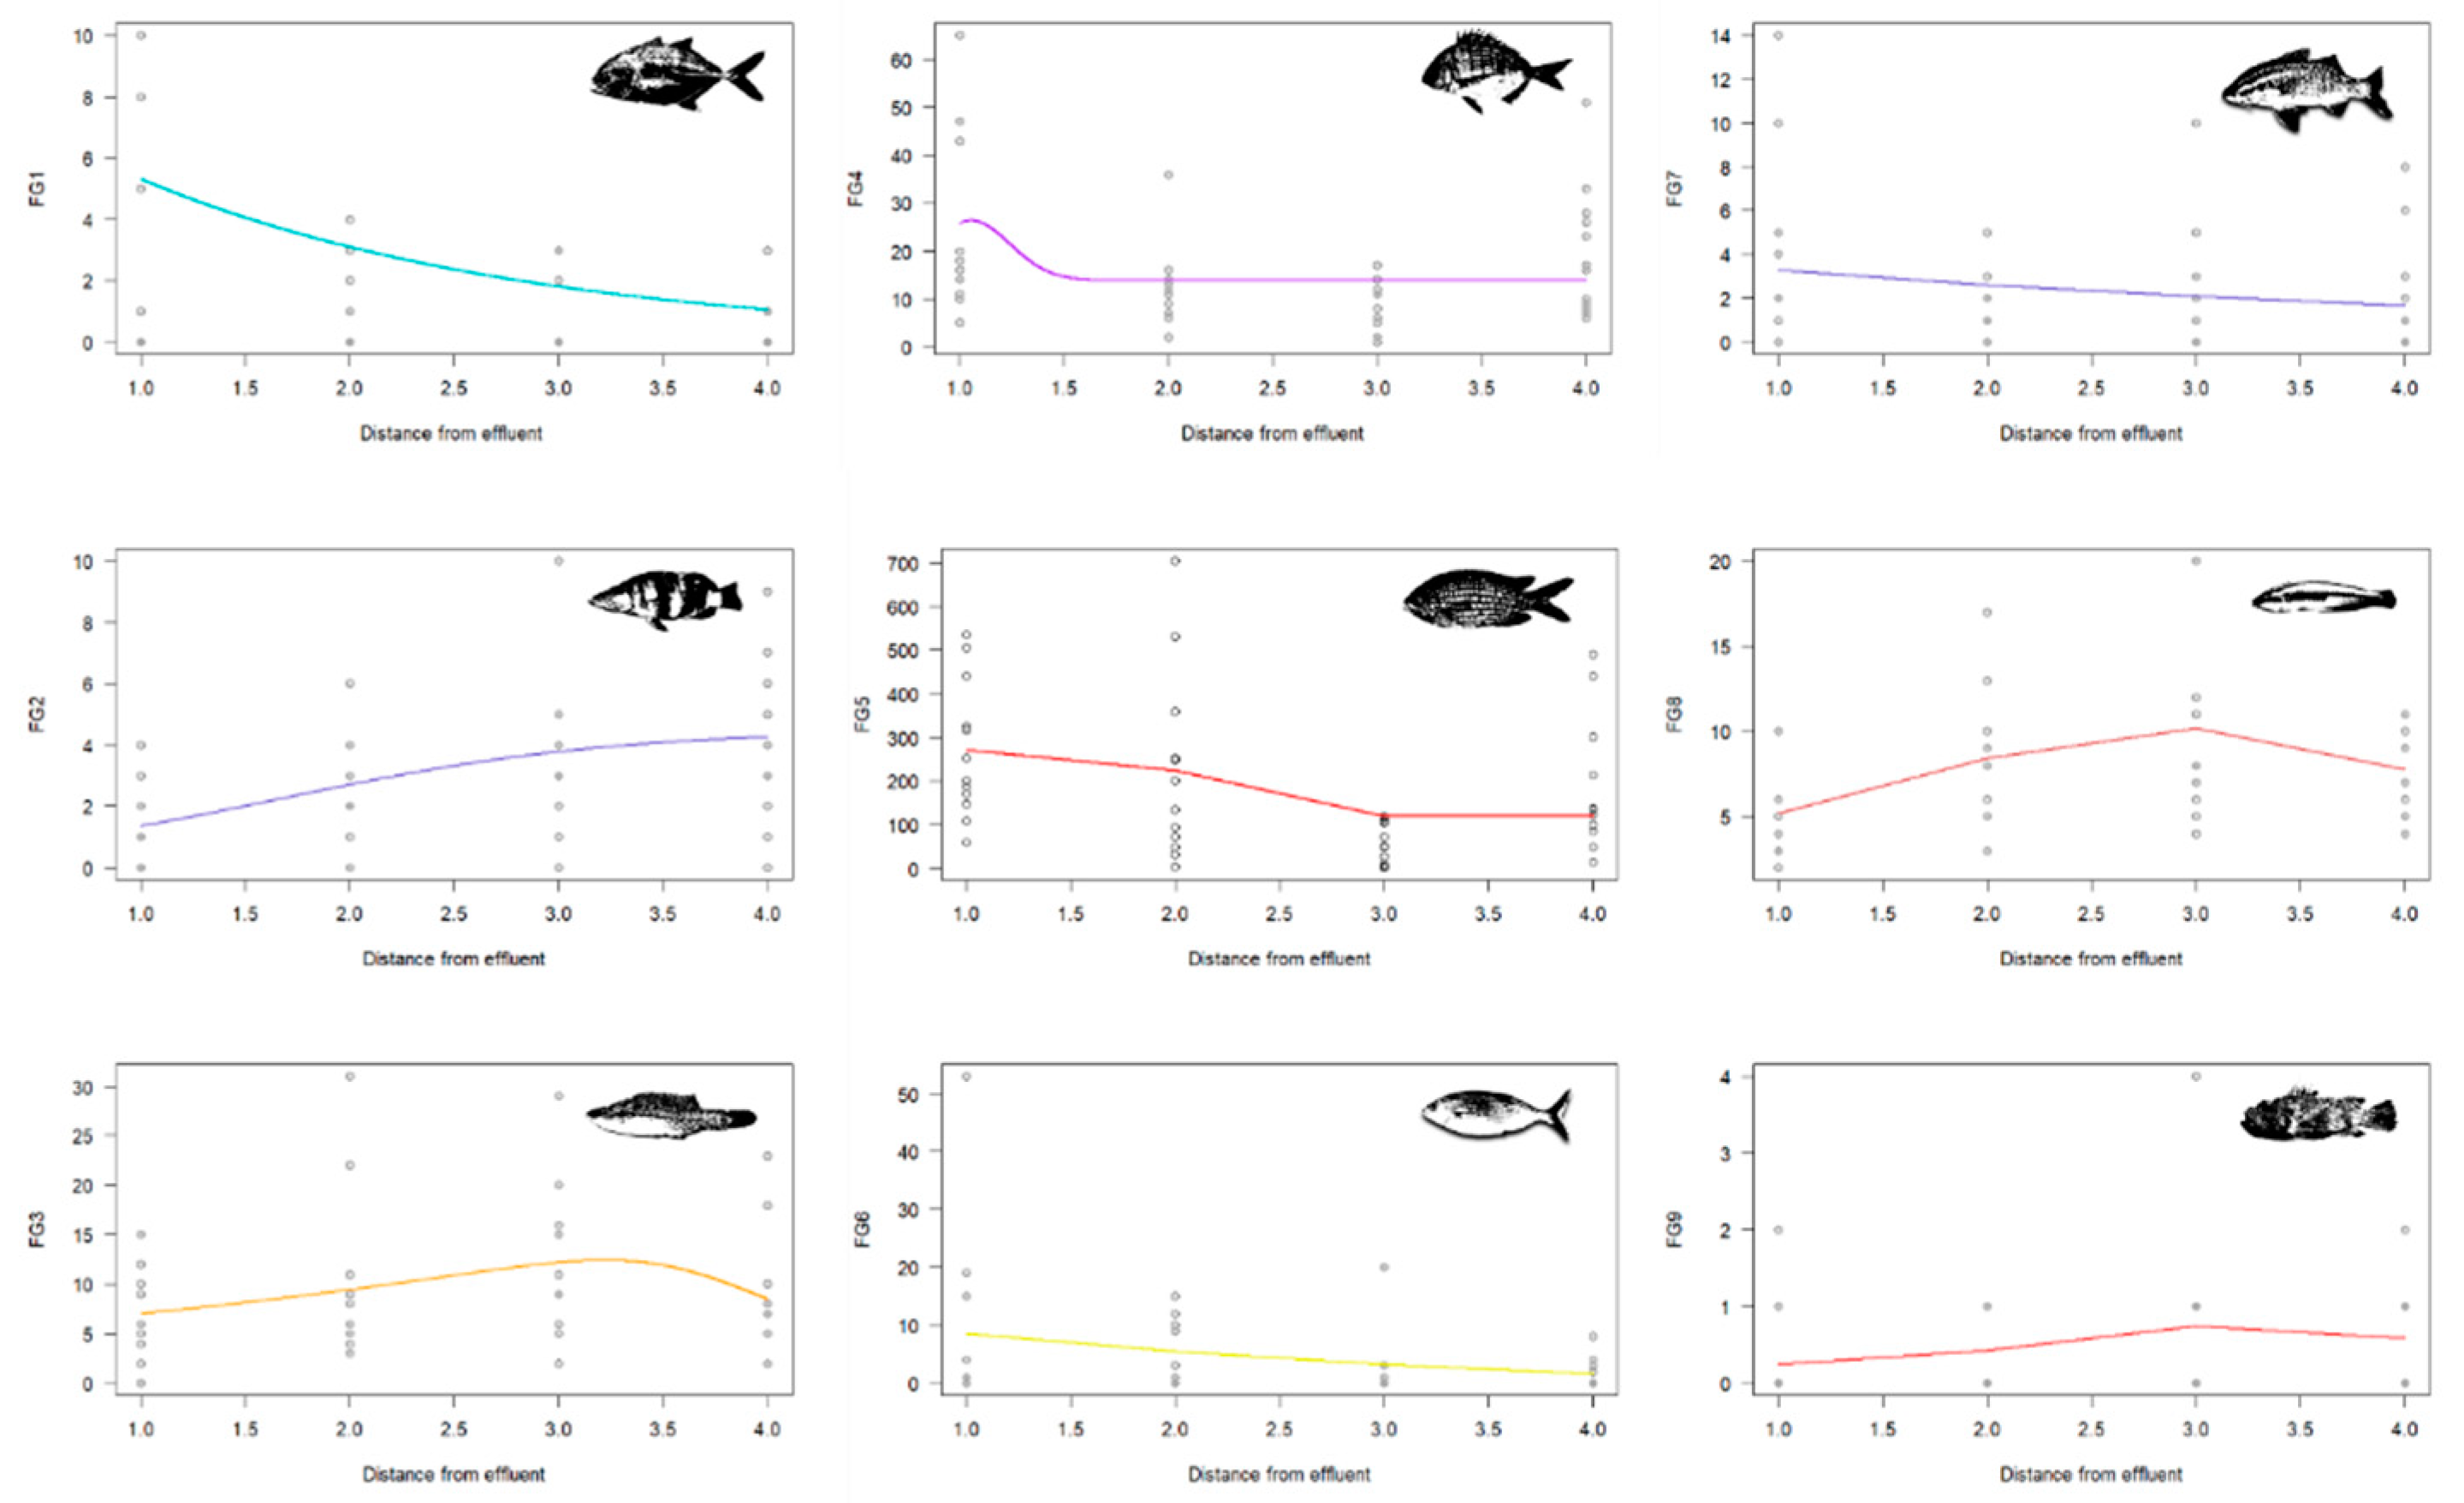

Table 1.
List of the five selected Biological Traits (BTs) with relative categories.
| BTs | Categories | |||||
|---|---|---|---|---|---|---|
| Diet | macrofauna | macrofauna/fish | fish/cephalopods | plankton | seagrass/algae | sediment macrofauna |
| Position | open water | reef associated | demersal | |||
| Habitat | pelagic | rock/cave | seagrass | sand/rock | all | |
| Climate zone | subtropical | temperate | ||||
| trophic Level | 2-4.53 |
Table 2.
Diversity metrics PERMANOVA for factors ‘Distance’, ‘Season’ and ‘Year’. Level of significance is indicated (p <0.001 ***).
Table 2.
Diversity metrics PERMANOVA for factors ‘Distance’, ‘Season’ and ‘Year’. Level of significance is indicated (p <0.001 ***).
| Diversity metrics PERMANOVA Distance x Season x Year | |||
|---|---|---|---|
| Source | df | MS | P (perm) |
| Distance | 3 | 8,1732 | 0,001*** |
| Season | 1 | 14,085 | 0,001*** |
| Year | 1 | 2,7891 | 0,185 |
| Distance x Season | 3 | 1,4887 | 0,541 |
| Distance x Year | 3 | 3,4462 | 0,05* |
| Season x Year | 1 | 4,4167 | 0,062 |
| Distance x Season x Year | 3 | 8,693 | 0,001*** |
Table 3.
Fish assemblage PERMANOVA for factors ‘Distance’, ‘Seasons’ and ‘Year’ with pair‐wise test for pairs
of levels for the factor ‘Distance’. Level of significance is indicated (p < 0.05 *; < 0.01 **; < 0.001 ***).
Table 3.
Fish assemblage PERMANOVA for factors ‘Distance’, ‘Seasons’ and ‘Year’ with pair‐wise test for pairs
of levels for the factor ‘Distance’. Level of significance is indicated (p < 0.05 *; < 0.01 **; < 0.001 ***).
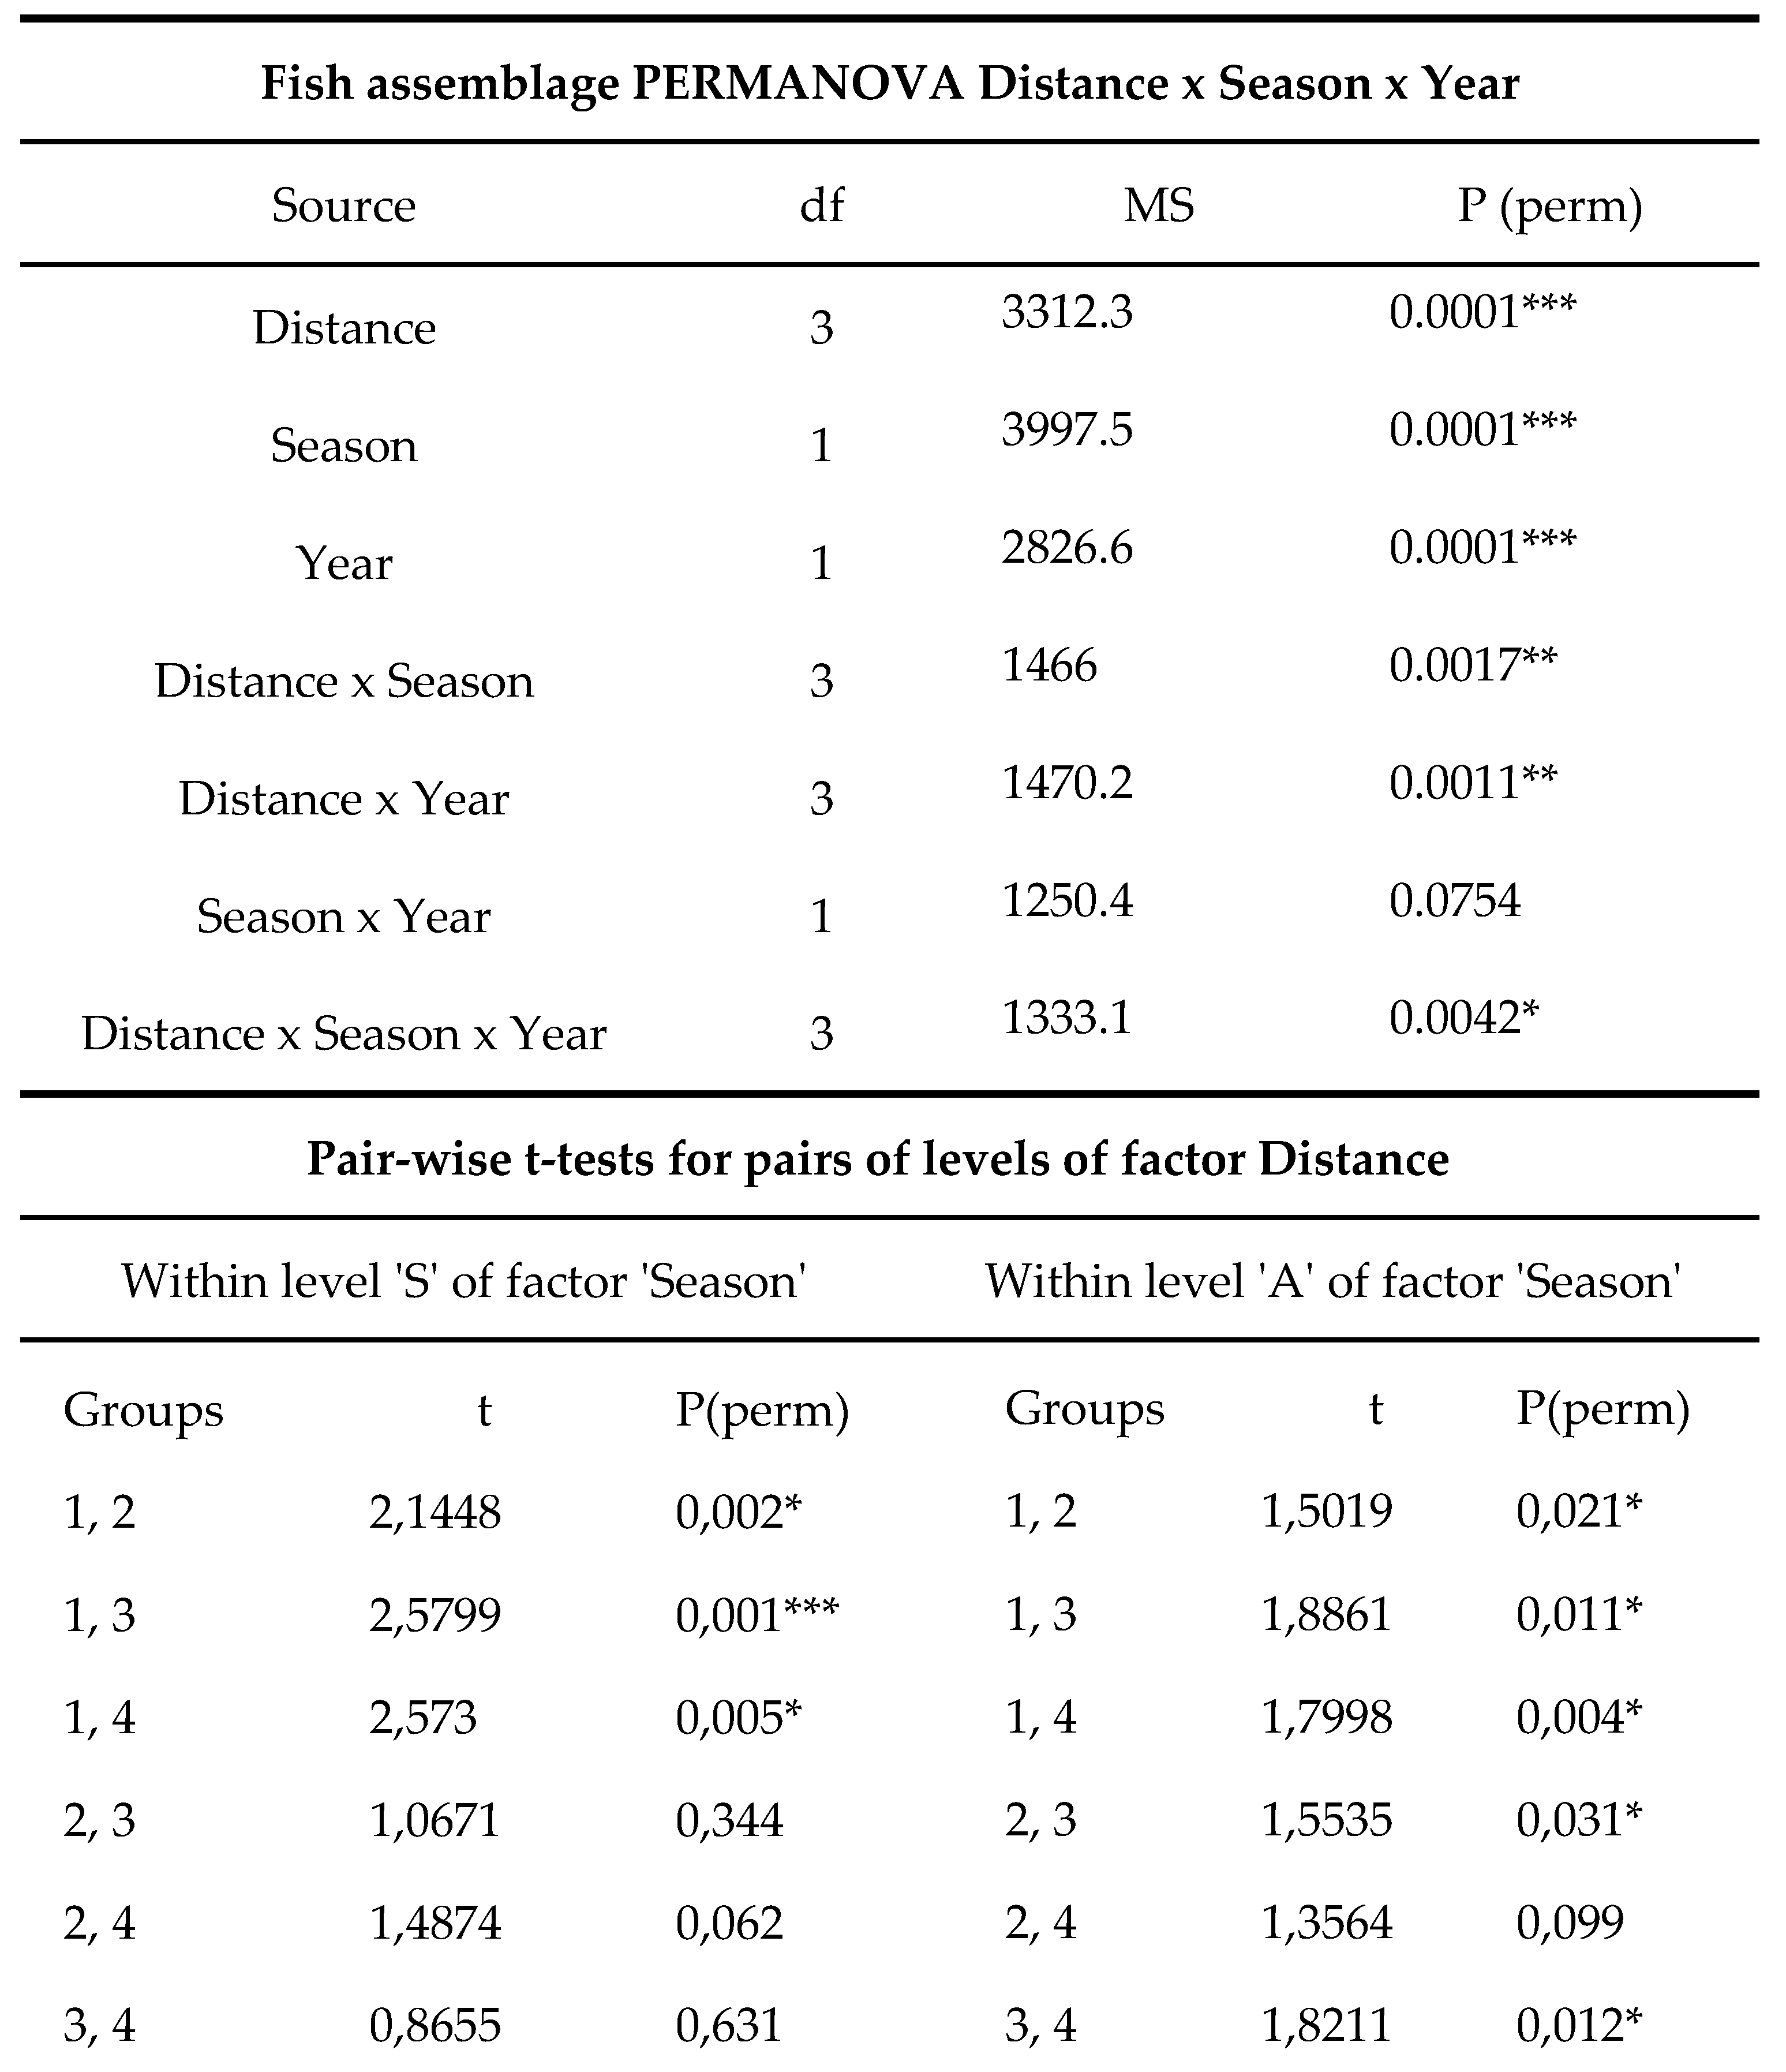
Table 4.
FGs PERMANOVA for factors ‘Distance’, ‘Seasons’ and ‘Year’ with pair‐wise test for pairs of levels for
the factor ‘Season’. Level of significance is indicated (p < 0.05 *; < 0.01 **; < 0.001 ***).
Table 4.
FGs PERMANOVA for factors ‘Distance’, ‘Seasons’ and ‘Year’ with pair‐wise test for pairs of levels for
the factor ‘Season’. Level of significance is indicated (p < 0.05 *; < 0.01 **; < 0.001 ***).
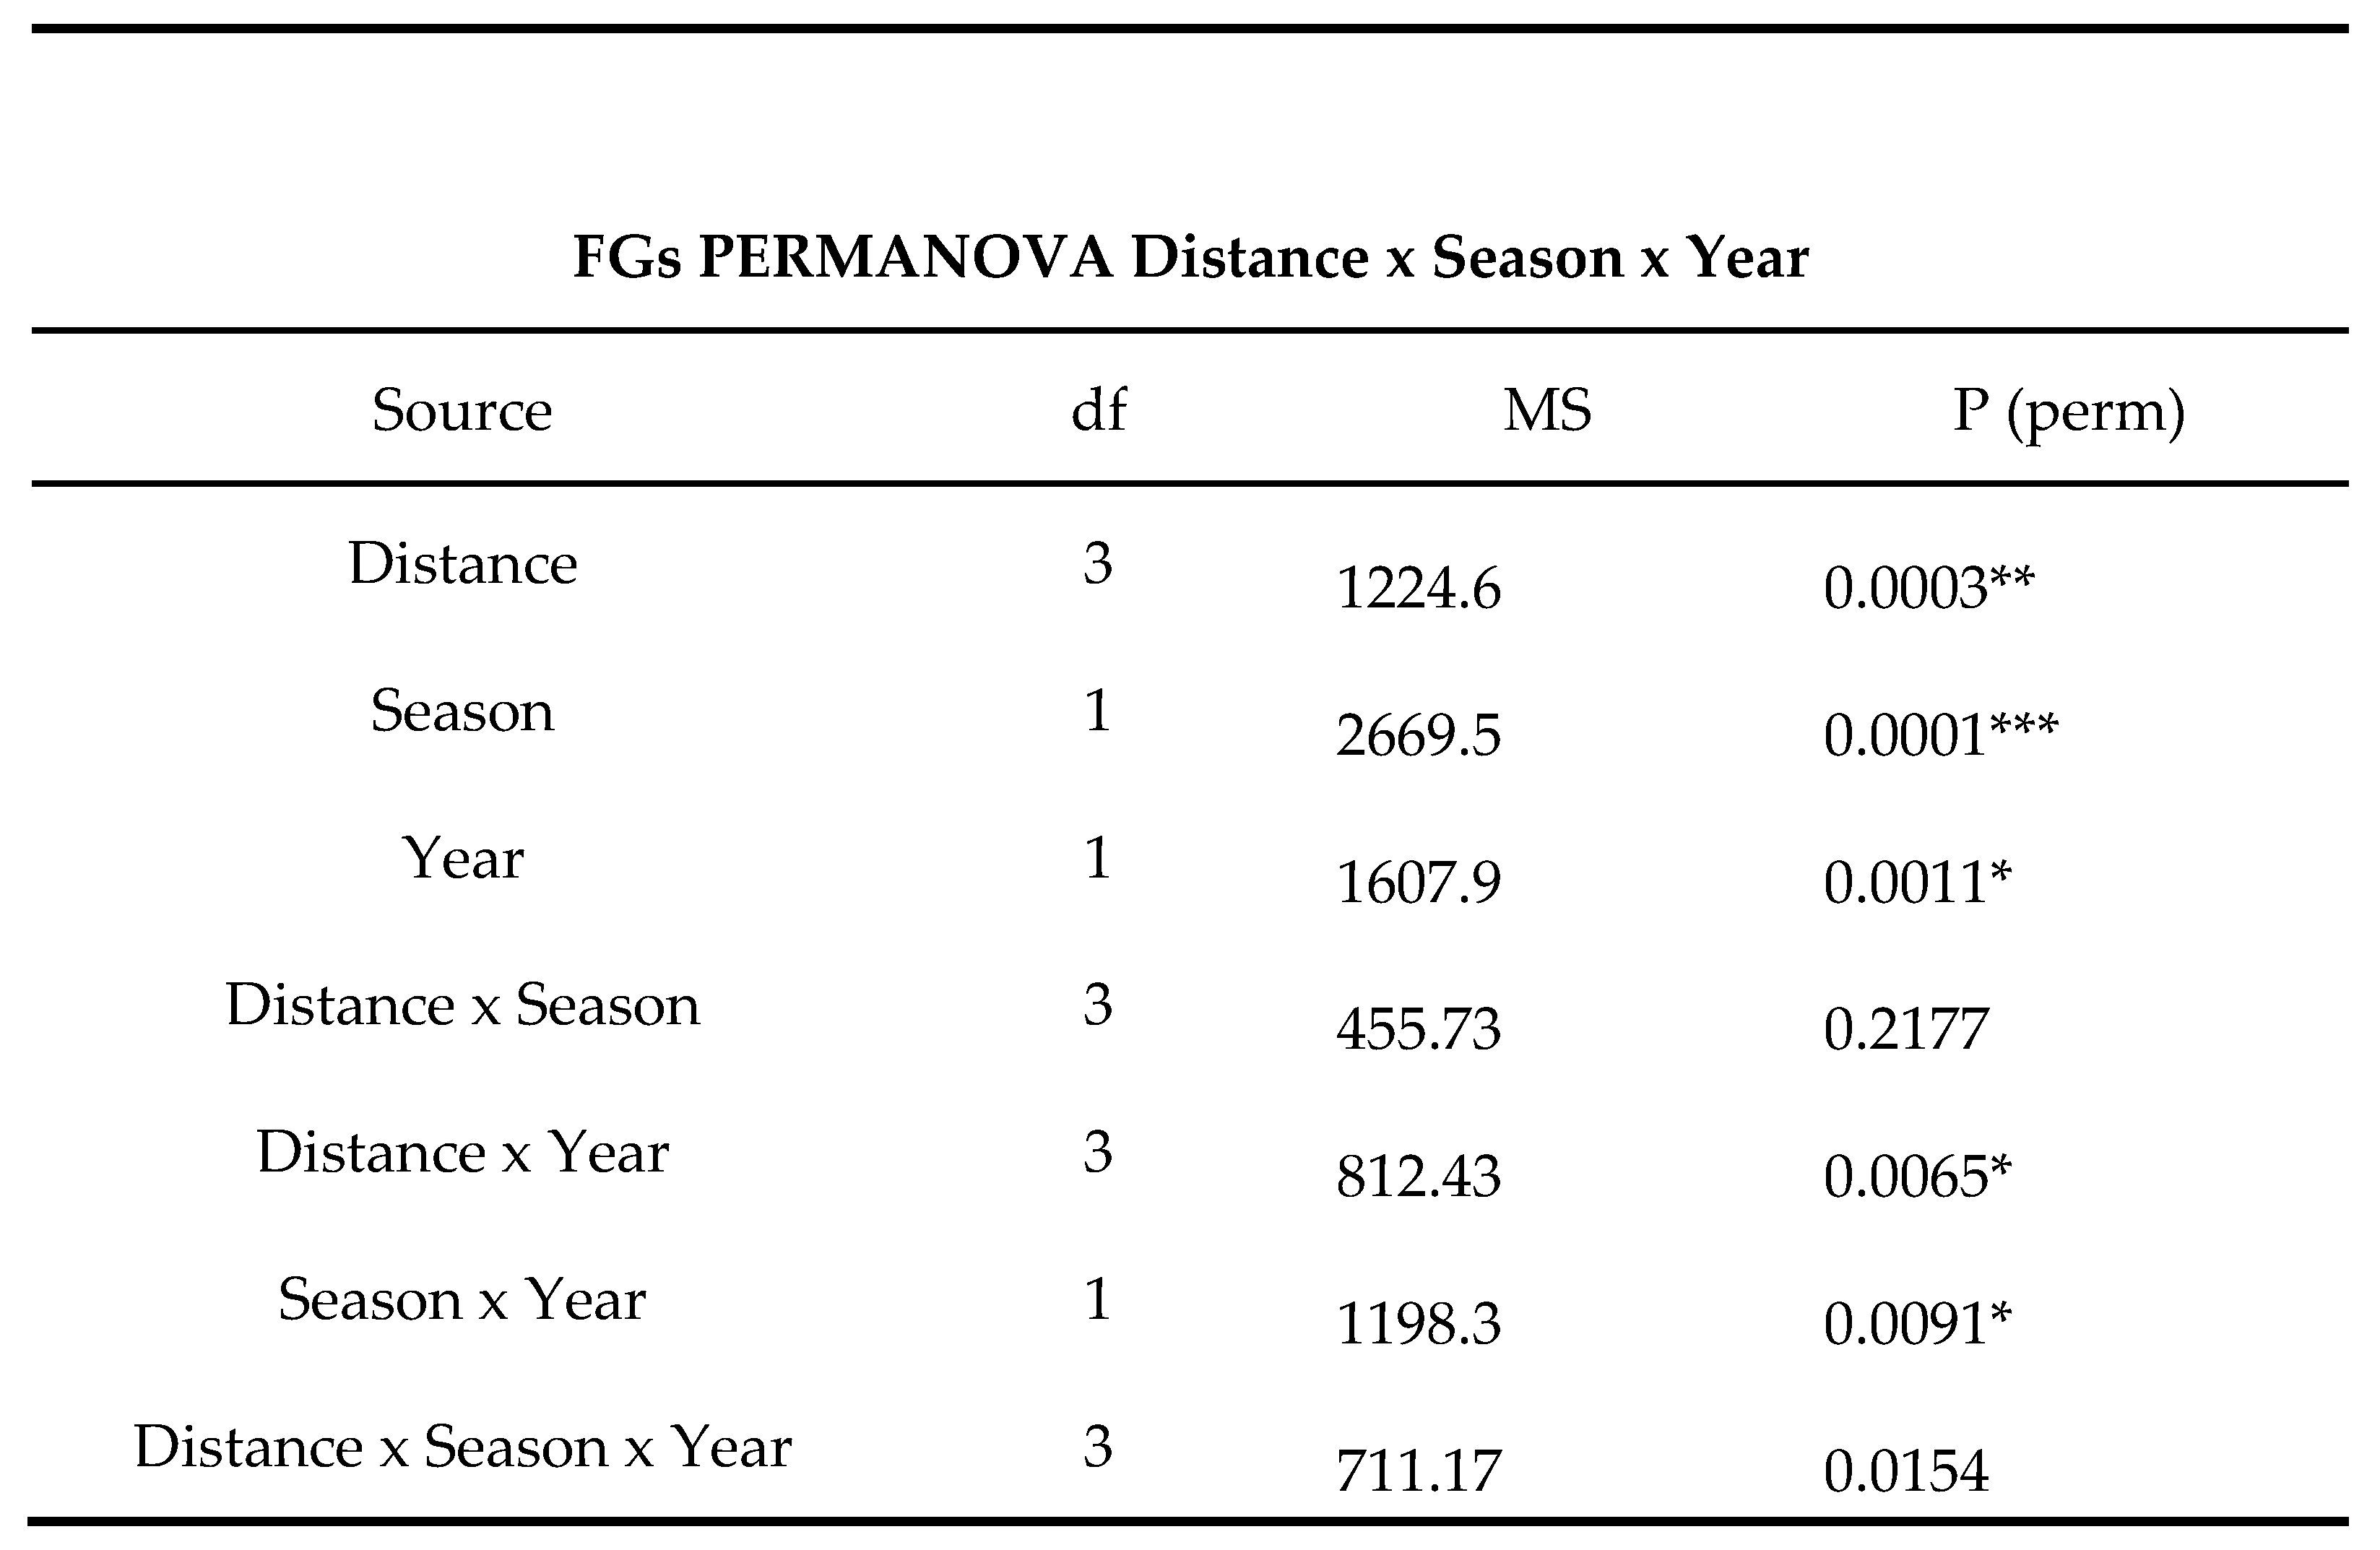
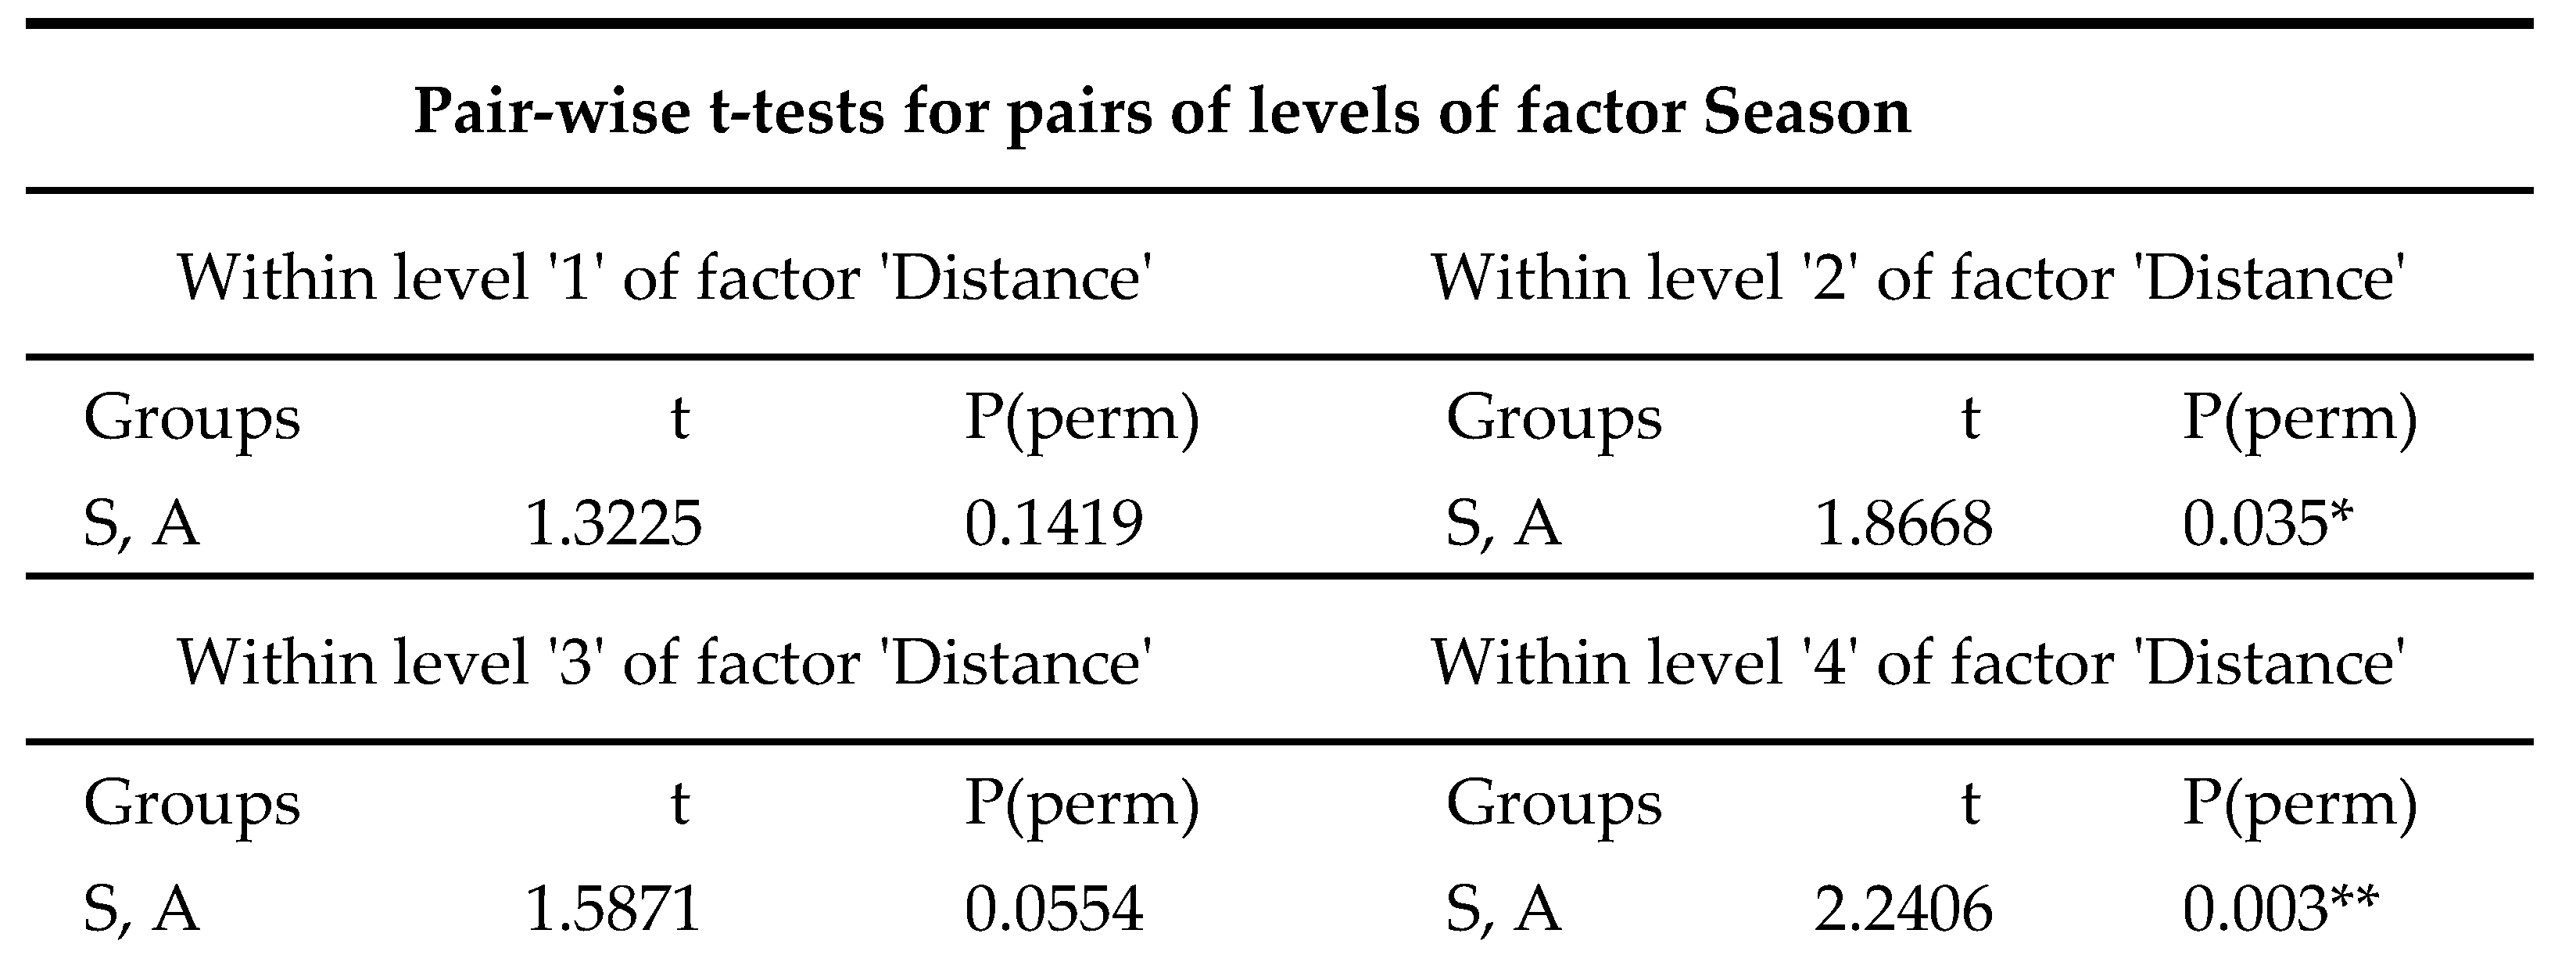
Table 5.
DISTLM analysis on FGs with Marginal Test for the included variables as identified from the BEST routine. (p < 0.05 *; < 0.01 **).
Table 5.
DISTLM analysis on FGs with Marginal Test for the included variables as identified from the BEST routine. (p < 0.05 *; < 0.01 **).
| FGs DISTLM Marginal Test | |||
|---|---|---|---|
| Variable | Pseudo-F | P | R2 |
| # Ligula (Adult leaves) | 1,7235 | 0,142 | 0,036115 |
| W Rhizome | 3,1256 | 0,006* | 0,063625 |
| W Epiphytes | 3,8116 | 0,001** | 0,076521 |
| Surface Temp | 3,8092 | 0,003* | 0,076476 |
| Salinity Surf | 4,2628 | 0,002* | 0,084809 |
Disclaimer/Publisher’s Note: The statements, opinions and data contained in all publications are solely those of the individual author(s) and contributor(s) and not of MDPI and/or the editor(s). MDPI and/or the editor(s) disclaim responsibility for any injury to people or property resulting from any ideas, methods, instructions or products referred to in the content. |
© 2025 by the authors. Licensee MDPI, Basel, Switzerland. This article is an open access article distributed under the terms and conditions of the Creative Commons Attribution (CC BY) license (http://creativecommons.org/licenses/by/4.0/).
Copyright: This open access article is published under a Creative Commons CC BY 4.0 license, which permit the free download, distribution, and reuse, provided that the author and preprint are cited in any reuse.


