
Submitted:
04 October 2025
Posted:
06 October 2025
You are already at the latest version
Abstract
Colorectal cancer (CRC) is the fourth and the third most common and deadlycancer, respectively, worldwide. Even with alternative therapies, some patients do notrespond to treatment. Identifying modulations in the tumor microenvironment (TME) ofCRC is indeed a challenge due to the complex and dynamic nature of the TME. Theintestinal epithelial cells (IECs) are composed by different types of secretory-lineagecells, such as goblet, tuft, paneth and enteroendocrine cells (EECs). Yet, the relevanceof each subtype of secretory IEC in the tumor microenvironment is still a matter of debate.This study investigated the involvement of IECs in CRC through an integrativebioinformatics analysis using publicly available datasets from National Center forBiotechnology Information (NCBI) and The Cancer Genome Atlas Program (TCGA),encompassing both human and mouse CRC samples. Our findings reveal a CRC TMEfeatured by elevated expression levels of genes associated with WNT pathway activity.Remarkably, there was an increased expression of Paneth cell-associated markers andtranscription factors, such as WISP1, LYZ, SOX9, and DEFA1 while enteroendocrinecells-specific gene markers, such as GCG (encoding Glucagon like Peptide-1) andCHGA exhibited a significant downregulation in CRC tissue compared with health tissue.Gene ontology (GO) analysis showed a species-conserved downregulation inhormone/peptide secretion-related pathways of CRC in mouse and human. Of note,lower levels of GCG and CHGA correlated with reduced overall survival andchemotherapy-unresponsive patients. These results suggest that disruption of EECsignaling is a hallmark of CRC development and may hold prognostic and therapeuticvalue for treating CRC patients.
Keywords:
colorectal cancer
; intestinal epithelial cells
; Paneth cells
; enteroendocrine cells
; bioinformatic
; gene expression
1. Introduction
According to data from GloboCAN, 20 million new cases of cancer occurred worldwide in 2022, resulting in a mortality rate of 9.7 million people. Colorectal cancer constitutes the third most commonly diagnosed malignancy worldwide, being surpassed only by sex-specific cancers— prostate cancer in men and breast cancer in women—thus representing the leading non–sex-specific cancer in terms of global incidence [1]. Some risk factors are associated with CRC progression, such as environmental, genetic, and inflammatory factors [2]. Furthermore, diet and obesity linked to the development and progression of type II diabetes [3], which, in turn, is associated with the development of some types of cancer, such as CRC [4] and colitis-associated colorectal cancer (CAC), suggesting that the growth rate of the disease is directly linked to dietary habits [1,5,6]. Even with some therapeutic alternatives (surgery, chemotherapy, radiation therapy, and immunotherapy), some patients do not respond to treatment. Additionally, habits considered modern are risk factors for the development and progression of the disease. Importantly, the appearance of CRC in young people, ranked it as the second most deadly in the world, is becoming even more frequent, impacting the higher mortality rate [7]. This highlights the need for further studies to unravel new molecules and pathways associated with onset or progression of CRC that could be targeted to develop new drugs and therapies for the disease.
The development of CRC is complex which involves different molecules, pathways, cells and environmental factors. It is directly linked to mutations in intestinal epithelial cells (IECs) and breakdown of the epithelial barrier. The intestinal epithelium is composed of cell subtypes originating from intestinal stem cells (leucine rich repeat containing G protein coupled receptor 5, LGR5+). These, upon induction of signaling pathways, including Wnt, beta-catenin, and Notch, coordinately activate specific transcription factors, promoting the differentiation of stem cells into different IEC subtypes. IECs can be differentiated into either absorptive cell, called enterocytes, differentiated by the transcription factor of the hes family bHLH transcription factor 1 (HES1), or secretory cells such as enteroendocrine cells (EECs), Tuft cells, goblet cells, and Paneth cells, which are differentiated by the transcription factors Neurogenin 3 (NEUROG3), POU class 2 homeobox 3 (POU2F3), Kruppel-like factor 4 (KLF4) and SRY-box transcription factor 9 (SOX9), respectively [8,9,10].
In addition to their transcription factors, these secretory IECs are also characterized according to their molecules or compounds that are produced and/or secreted by them. Tuft cells function as chemoreceptors, facilitating communication between the intestinal lumen, immune cells, and the neural network. They produce several molecules, such as neurotransmitters—acetylcholine and eicosanoids—and cytokines, such as interleukin-25 [11]. Goblet cells, on the other hand, have the primary function of protecting the epithelium through the production and secretion of mucus, which acts as a protective barrier, aiding in defense against pathogens [12]. Paneth cells are typically found in the small intestine and are uncommon in the large intestine under homeostasis. However, when found in high numbers in the large intestine, it can be related to abnormal characteristic, often associated with metaplasia in patients with inflammatory bowel disease (IBD) [13]. Paneth cells are responsible for producing essential antimicrobial proteins and peptides, as alpha-defensin, playing a fundamental role against infection and in regulating the gut microbiome [14]. The last secretory-lineage IECs is the EECs. EECs represent about 1% of the epithelium distributed throughout the intestinal epithelium and are characterized by hormone production, found mainly in the small intestine, and, to a lesser extent, in the large intestine. The hormone production is stimulated through the most diverse compounds, such as macronutrients—glucose, amino acids and fatty acids —, but also by structural components of microorganisms, such as lipopolysaccharides [15]. Among the hormones produced by EECs, stands out the group of incretins - Gastric inhibitory polypeptide (GIP) and Glucagon-like peptide 1 (GLP-1) - responsible for systemic functions in the body, such as stimulation of insulin secretion, appetite control in the central nervous system, modulation of inflammation, and the immune system [16]. EECs and peptide hormones regulate key functions of the gut epithelial including digestion control, appetite regulation, glucose homeostasis and immune function, making them potential targets for study in intestinal pathologies such as CRC, due to the role of hormones in mediating intestinal homeostasis [17,18].
It is known that IECs change its transcriptional profile and perform functions according to the microenvironment, and that this can be modulated by various perturbations, such as in a neoplastic situation, but whether secretory IECs as well as their secreted products are associated with CRC onset or progression is unknown. Therefore, here, we aimed to better understand these transcriptional factors and its modulation by performing a comprehensive analysis of experimental and human intestinal tissue gene expression datasets of the composition of secretory IECs present in the TME of CRC. We characterize not only the abundance of specific markers of these populations compared to healthy tissue but also identify potential prognostic markers for patient survival and response to chemotherapy.
2. Results
2.1. Differential Expression of IECs Markers in CRC
In order to gain a clearer understanding of the role that enteroendocrine hormones and secretory IECs play in the complex setting of CRC, we started by examining gene expression to identify potential molecular targets and gain a clearer understanding of the role that enteroendocrine hormones and secretory IECs play in the complex setting of CRC. To explore the presence or absence of secretory IECs markers, analysing three different mouse CRC microarray datasets from National Center for Biotechnology Information (NCBI) GEO database (GSE86299, GSE31105, and GSE64658), with CRC induced by a well-established inflammation-associated CRC model induced with azoxymethane (AOM) followed by administration of dextran sulfate sodium (DSS) [19].
To assess data consistency and explore transcriptional variability between experimental groups, we conducted a principal component analysis (PCA). In mice, PCA clearly separated adenoma samples (red) from control samples (blue) (Figure 1A, Figure S1A,B). We then asked if human CRC data would show the same pattern. Applying the same method to three different human CRC datasets (GSE8671, GSE18105, and GSE110225), again showed a clear split between adenoma and nearby non-tumorous tissue (Figure 1B, Figure S1C,D).
Next, we carried out differential gene expression analysis using a false discovery rate (FDR) threshold of 0.05, classifying genes with a log2 fold-change ≤ −1 as downregulated (blue) and ≥ 1 as upregulated (red). In the mouse datasets—GSE8671, GSE18105, and GSE110225—we found 257, 537, and 216 genes downregulated, and 639, 1,151, and 189 genes upregulated, respectively (Figure 1C, Figure S1E,F). As expected, genes related to inflammatory processes, such as chemokines and receptors, cell migration regulators and growth factors, were upregulated. Strikingly, several key EEC genes—including chromogranin A (Chga), glucagon (Gcg), neurogenic differentiation 1 (Neurod1), peptide YY (Pyy), and glucagon-like peptide 1 receptor (Glp1r)—were consistently reduced in the AOM/DSS-induced CRC model.
The human CRC biopsy datasets revealed a similar pattern, with 634, 415, and 286 genes downregulated, and 637, 343, and 240 genes upregulated, respectively. As in mice, genes involved in EEC differentiation and hormone production were consistently decreased in tumor tissue compared with normal tissue (Figure 1D, Figure S1G,H). Taken together, these results show distinct transcriptional profiles between adenoma and normal tissue in both mouse and human CRC, with a consistent decrease in gene expression of the genes associated with EEC in tumors.
2.2. Antimicrobial Peptide-Related Pathways Are Upregulated While Hormonal Processes Are Downregulated in Colorectal Cancer
After identifying differences in gene expression between normal and CRC tissues, we next examined which biological pathways were most affected in tumor samples. Using Venn diagram to identify analysis and to analysis unbiased pathways, we first identified genes consistently upregulated or downregulated across all three mouse datasets and all three human datasets. In mice, 39 downregulated genes (Figure 1E, left) and 87 upregulated genes (Figure 1E, right) were common to all studies. In humans, 119 downregulated genes (Figure 1F, left) and 58 upregulated genes (Figure 1F, right) were shared among the datasets.
We then performed Gene Ontology (GO) Biological Process enrichment analysis on these shared genes. In mice, 295 pathways were enriched in the upregulated gene set while 66 pathways were associated with the downregulated set (Tables S1 and S2). In humans, we found 157 and 167 pathways associated with up and downregulated genes, respectively (Tables S3 and S4). As with up-regulated genes, the increased pathways in a tumor context are mainly related to the inflammatory response and positive regulation of the cell cycle (Figure 2A,B), which was expected according to existing data [20].
One notable finding was the consistent, in mice and humans, enrichment of pathways of genes that were upregulated in the tumor samples linked to antimicrobial peptide—mediated immune responses in both species (Figure 2A,B). Paneth cells, known producers of antimicrobial peptides, interact with the gut microbiota and can influence immune cell activity [21]. In contrast, pathways associated with hormonal processes—many of which depend on products secreted by EECs—were consistently enriched in genes that were downregulated in tumor tissue. These analyses suggest that tumor samples showed conserved stronger activity in pathways related to antimicrobial peptide production, potentially driven by Paneth cells, and weaker activity in pathways tied to hormone-related functions of EECs.
2.3. Upregulation of Paneth Cell-Related Markers and Downregulation of Enteroendocrine Cell Genes Is a Conserved Phenomenon Regardless the Origin of Colon Tumor
Given the observed upregulation of antimicrobial peptide pathways and alterations in hormone-related processes in CRC tissue, we wanted to explore whether markers and transcription factors associated with other secretory IECs were also dysregulated. To address this, we examined marker genes for secretory IECs subtypes, including transcription factors critical for their differentiation as well as the products they secrete (Table 1). To consider any IECs marker, it should be differently expressed between healthy and tumor samples, in the same direction (up or down regulated) across all data sets. For that, we selected Tuft cell markers: SRY-Box Transcription Factor 4 (SOX4) and POU2F3. However, they did not exhibit a consistent pattern of regulation; (Figure 3A). In contrast, goblet cell markers, such as KLF4, Mucin 2 (MUC2) and SAM pointed domain-containing Ets transcription factor (SPDEF), were consistently downregulated in tumor tissue relative to healthy tissue, aligning with existing literature that describes a reduced goblet cell population in neoplastic intestinal epithelium [22,23].
Consistent with our enrichment analysis, transcription factors essential for EEC differentiation—such as NEUROD1 and Aristaless related-homeobox (ARX)—were downregulated in both murine and human tumor microenvironments. Moreover, genes involved in the transcription of hormones produced by EECs, which also serve as canonical EEC markers (e.g., GCG and PYY), were likewise reduced in tumor tissue (Figure 3A). In contrast, markers of Paneth cells, including Defensin alpha 1 (DEFA1), Lysozyme (LYZ), and SOX9, were upregulated in tumor tissue. Additionally, WNT1-inducible signaling pathway protein 1 (WISP1)—a recognized transitional marker of Paneth cell differentiation [10]—also showed increased expression in tumor tissue relative to normal tissue (Figure 3A). Together, these data suggest that in tumor samples there is a shift in the expression of IECs standard markers with an increase in paneth cells markers while a decrease in EEC and Globet cells markers.
Trying to explore whether this shift in the IEC markers expression of Paneth and EECs could also happen in spontaneously CRC development, meaning without clear induction of inflammation; we examined the dataset GSE107139, obtained from the APCmin CRC model—a well-established genetic model in which animals carry a deficiency in the tumor suppressor gene APC [42]. Consistent with our previous observations, APCmin animals exhibited a downregulation of EECs markers and an upregulation of Paneth cell markers in tumor tissue, our data similarly emphasize the robust pattern of increased Paneth cell marker expression and decreased EEC markers (Figure S2A,C). Since we could confirm the CRC origin in the previous datasets, we next assessed whether human colitis-associated colorectal cancer—i.e., accompanied by inflammation—exhibits a similar pattern of dysregulated genes through the GSE37283 dataset. Again, this dataset revealed an upregulation of LYZ and WISP1, alongside a downregulation of GCG, PYY, CHGA, and NEUROD1, all of which are related to EEC identity (Figure S2B,C). Notably, in our analysis we did not observe a reduction of Goblet cell markers, suggesting that this phenomenon may be specific to CAC rather than spontaneous models or human tumors, further reinforcing the centrality of Paneth cell expansion and EEC loss as conserved features across tumorigenesis (Figure S2A-C). Taken together, these analyses suggest that in both CRC and CAC, there is a conserved modulation of IEC expression, with an increase in Paneth cell expression and a decrease in IECs in the tumor microenvironment.
Given the interesting findings observed on RNA-level, we sought to understand whether this shift in IECs markers CRC occurs at protein level. Using the human protein atlas, we analyzed the protein expression in IEC. As expected, 100% of all normal tissues were positive for EECs (GCG, PYY, CHGA and NK2 homeobox 2 (NKX2.2)) and almost 100% for Paneth (DEFA1, LYZ, SOX9 and WISP1) (Figure S3A). While, no changes were observed in the percentage of Paneth cells markers in CRC and normal tissue, the percentage of CRC tissues positive for EECs marker was rare (Figure S3A). Immunohistochemistry imaging available on the platform allows us to visualize the staining of CHGA—EEC marker— and DEFA1—Paneth cell marker— (Figure S3A-C). The STRING platform allows the visualization and analysis of protein–protein interaction (PPI) networks, helping to identify potential functional connections among genes of interest. Considering the downregulated genes from the Venn Diagram analysis (Figure 1F), we identified the largest interaction cluster, mainly involving enteroendocrine-related genes, with GCG as the central node (Figure 4A). In line with the enrichment analysis, which highlighted the involvement of hormonal processes downregulated (Figure 2B), the interaction network revealed a possible role for EEC genes in human CRC tissue. However, upregulated genes did not form a highly connected network related to Paneth cells, with interactions restricted to only two genes (Figure S4A).
Together with the gene expression data, these results suggest a possible balance favoring a decrease in EECs and an increase/maintenance in Paneth cell markers in the TME, where the GCG gene shows as a potential marker of this phenomenon.
2.4. RNA-Seq Analysis from the TCGA Platform Identified GCG and PYY as One of the Top 25 Most Downregulated Genes in Colorectal Adenocarcinoma (COAD) Tumor Samples
So far, our analysis consistently suggests a conserved shift between IEC markers where GCG appears as a potential core gene in this context. Therefore, to identify target genes for a CRC marker and potential therapeutic drugs, we followed our analysis with human databases. The Cancer Genome Atlas Program (TCGA) database contains a large collection of RNA sequencing data from patients with colorectal adenocarcinoma (COAD). We first validate the observed downregulation of EECs and other IECs markers by analyzing RNA-seq data from a separate COAD cohort within TCGA. Remarkably, examining the top 25 most downregulated genes in COAD tissue we observed two EEC markers—GCG and PYY—among them (Figure 5A). In contrast, none of the top 25 upregulated genes were associated with other IECs subtypes (Figure S5A). These findings indicate that EECs-related genes are disproportionately represented among the downregulated transcripts in human tumor tissue, reinforcing the observation of consistent EECs marker downregulation across COAD tumor samples.
2.5. The Downregulation of EECs–Associated Genes and the Upregulation of Paneth Cell–Related Genes Within the COAD Tumor Microenvironment Occur Independently of Tumor Stage
We next want to know whether this shift between IECs markers could be related to tumor development. According to the American Cancer Society, colon cancer stages I through IV are defined based on the extent of tumor infiltration into deeper tissue layers and its spread to distant organs [43]. When comparing COAD stages and assessing the expression of IEC–associated genes, no difference was exhibited considering the stage of the tumor (Figure S6A–X). Although most IEC markers did not vary significantly across stages, analysis of metastatic versus non-metastatic COAD tissue revealed that EEC–related genes (GCG, PYY, CHGA, NEUROD1) were consistently downregulated in both tumor versus normal tissue and between metastatic versus normal tissue (Figure 6A). This data suggests that the reduction in EEC markers occurs in the early stages of tumorigenesis and persists throughout the tumor development, even in metastatic progression. For Paneth cell markers, we observed an increase in tumor samples without any difference regarding the tumor stage (Figure 6A).
2.6. High Expression Levels of GCG and CHGA Are Positively Associated with Improved Overall Survival and Enhanced Chemotherapy Responsiveness in Patients with COAD Tumors
We next evaluated whether this up regulation of Paneth cells markers and downregulation of EECs could predict patient survival and response to treatment. Survival analyses were performed for all target genes. Interestingly, only GCG and LYZ demonstrated a significant association with patient outcomes (Figure 7A,B), while the remaining genes did not show any notable differences (data not shown). Specifically, high GCG expression was associated with longer 5-year survival in patients with COAD tumors (Figure 7A). Similarly, the EEC marker CHGA showed a positive association between elevated expression and prolonged survival (Figure 7B). None of Paneth cells markers was associated with 5-year patients’ survival. We next investigated whether expression of these genes correlates with chemotherapy responsiveness. Our analysis showed that chemotherapy-responsive patients tended to have higher GCG expression, but this association was not observed for CHGA (Figure 7C,D). Collectively, these findings indicate that downregulation of EEC markers directly impacts patient survival and, in the case of GCG, is also linked to chemotherapy response.
3. Discussion
In silico analyses using publicly available sequencing data are an excellent tool, providing a comprehensive overview or translational conclusion about a given phenomenon. Our findings showed that tumor tissue from CRC patients and experimental CRC models exhibited differences in IEC markers when comparing tumor tissue with non-neoplastic -called adjacent tissue—both in patients and in experimental models of CRC, reinforcing the concept that IEC cellular subtypes play distinct roles in the tumor microenvironment. IECs play different roles according to their subtype; among these, goblet cells—responsible for mucus production—are particularly affected during tumor development. In a tumor context, these cells are found in a reduced form compared to a homeostatic situation, associated with reduced mucus secretion, which is directly related to a worse and more aggressive prognosis [44]. In this work we showed transcriptional alterations in the genes, MUC2, KLF4 and SPDEF, which are important for the differentiation and function of goblet cells, in agreement with data established in the literature.
EECs are known to secrete gut hormones with systemic physiological effects. However, their role in tumor biology remains controversial: while some studies suggest that EECs promote tumor progression in certain types of cancer, others indicate that they may exert a protective and antineoplastic influence [45,46]. This duality likely reflects tumor type specificity, as well as the action of these hormones on the system, which can act on distant organs and modulate metabolic and immunological pathways. We know that these metabolic pathways and the immune system are extremely important in remodulating the tumor microenvironment, altering the interactions between epithelial cells, microorganisms, and immune populations, suggesting that these hormones may function as regulatory molecules in the tumor microenvironment. Our analyses revealed a decrease in EECs markers in tumor tissue, including their marker CHGA, as well as the differentiation marker NEUROD1, and some genes responsible for hormone transcription, such as GCG and PYY. Interestingly, Paneth cells, which are responsible for the production of antimicrobial peptides that interact directly with the gut microbiota and can act as immune cell modulators [21], were increased in tumor tissue through the upregulation of the genes LYZ1, DEFA1, SOX9, and WISP1. The differentiation of secretory IECs from stem cells is determined by transcription factors. Combined with these dysregulated genes, our enrichment analyses strengthen the hypothesis that there is a balance between these two populations of secretory IECs in the tumor microenvironment. GO Enrichment analysis allowed us to evaluate some pathways that would potentially be up or downregulated in tumor tissue, therefore, we were able to identify that the arrangement of upregulated genes in human and mouse tumor tissue correlated with immune processes mediated by microbial peptides. Furthermore, the analysis showed that hormonal processes, response to peptide hormones, and hormonal metabolic processes are associated with downregulated genes in tumor tissues. It is important to mention that Paneth cells are not find in large intestine that this increase of Paneth cells markers highlights the complexity of tumor cell development and further studies are warranted to investigate to understand the impact of this shift in tumor progression, anti-tumor immunity and changes in the microbiota composition [39,47].
The WNT pathway is required for the differentiation of all secretory lineages. Pinto et al. showed that mice deficient in this signaling pathway do not develop any secretory epithelial cells [48]. In contrast, WNT hyperactivation only increases Paneth cell differentiation [49]. Associated with this, in vitro organoids require activation of the WNT signaling pathway for Paneth cell differentiation [50]. Interestingly, our findings demonstrate, through the WISP1 gene, the WNT signaling pathway was upregulated in tumor tissue, thus indicating that the tumor microenvironment potentially upregulates Paneth cells through increased WNT signaling. This corroborates the previous findings that the accumulation of Paneth cells in CRC patients is associated with the activation of WNT/β-catenin signaling and a poor prognosis [51]. However, experiments are needed to confirm this mechanism and to determine which possible modulations in this pathway and these cell populations could influence tumor formation.
The analyses were conducted exclusively with publicly available datasets, restricting validation to primary human samples, particularly at the protein level. Several target markers were absent from the protein expression datasets, and in some cases, the antibodies failed to produce detectable staining in any of the tissues examined. These limitations highlight the need for follow-up experimental work to confirm these transcriptomic patterns and understand the importance of this balance between EEC and Paneth cell populations in the development of CRC.
For last, our findings across multiple cohorts are consistent and demonstrate this dynamic modulation, conserved in mice and humans, between different populations of IECs—primarily EECs and Paneth cells—within the TME. This cellular interaction appears to have important clinical implications, as it is linked to differences in therapeutic response and overall patient outcome. A recent study reported a positive correlation between GCG expression in immune cells within COAD tumors and gene expression profiles linked to patient survival [52]. Consistently, here we identified two enteroendocrine-related genes, GCG and CHGA, as key genes associated with survival in CRC patients. High expression of these markers correlated with a better prognosis in patients with COAD, and higher levels of GCG or CHGA significantly improved survival. These observations suggest that the molecular signature of epithelial subpopulations not only reflects tumor biology but may also serve as a prognostic indicator and potential therapeutic target in CRC.
4. Materials and Methods
4.1. Databases Collection
Datasets were retrieved from the NCBI containing intestinal samples from both animal models and human subjects diagnosed with CAC, all of which had undergone large-scale gene expression profiling. For subsequent analyses, we selected the three datasets available on the NCBI platform that had the same cancer induction model as well as the same sequencing and data analysis method. From mice, we included GSE86299, GSE31105, and GSE64658, representing experimental models of CAC induced by azoxymethane and dextran sulfate sodium, as well as GSE107139 from APCmin mice, which spontaneously develop colorectal tumors due to a mutation in the tumor suppressor gene APC. From human samples, we analyzed datasets derived from colorectal adenocarcinoma biopsies (GSE8671, GSE18105, and GSE110225) and from cases of colitis-associated colorectal cancer (GSE37283).
4.2. Differential Expression Analysis Datasets from NCBI
Datasets from microarray differential expression were analyzed using the Network Analyst platform [53] associated with the limma package, considering cut-offs of p<0.05 and logFC (Fold Change) <-1 and >1. Within these criteria, we performed the PCA graph and volcano plot. Using these data, we created a Bubble-Based Heatmap in https://www.datylon.com. To perform the enrichment, we filtered the genes using the same cut-offs and separated them into up- and downregulated ones [54].
4.3. RNAseq Differential Expression Analysis from TCGA Database
RNAseq analysis of TCGA-COAD database was segmented by tumor stage and performed using the Oncodb platform, which uses the same cut-offs mentioned above [55]. Stages I, II, III, and IV are based on the American Cancer Society. The top 1-25 genes up and downregulated in Colon Adenocarcinoma from TCGA were obtained from an integrated cancer data analysis platform Ualcan [56]. The network between genes upregulated in tumor tissue was performed on the string platform [57].
4.4. Survival Analysis and Chemotherapy Responder
The analysis and association of survival with gene expression and protein levels (IHC) was performed using the TCGA COAD patient database in its platform [58]. Overall survival curves were generated through Kaplan–Meier analysis and evaluated using the log-rank test. Moreover, the correlation between chemotherapy responders and GCG and CHGA expression was performed using the Rocplot.org platform [59].
5. Conclusions
Our findings reveal a dynamic gene expression balance between EECs and Paneth cells markers within the colorectal TME, conserved in mice and humans. This balance is accompanied by an upregulation of biological pathways involved in antimicrobial peptide–mediated immune responses, alongside a downregulation of hormone-related processes. Furthermore, we show that reduced expression of key enteroendocrine-associated genes—GCG and CHGA—is linked to poorer survival outcomes in patients with CRC.
Supplementary Materials
The following supporting information can be downloaded at the website of this paper posted on Preprints.org, Figure S1. Differential expression analysis of microarray from experimental and human colorectal cancer tissue. Figure S2. Differential expression analysis of microarray from experimental APCmin and human colitis-associated colorectal cancer. Figure S3. The downregulation of protein Glucacon (GCG) and upregulation of Defensin, alpha 1 (DEFA1) in human colorectal (CRC) tissue. Figure S4. The String interaction of upregulated genes in human colorectal cancer (CRC) tissue. Figure S5. RNAseq analysis from the The Cancer Genome Atlas (TCGA) platform with the top 25 upregulated genes in the Colon adenocarcinoma (COAD) tumor. Figure S6. Differential expression of intestinal epithelial cells (IECs) genes in human Colon Adenocarcinoma (COAD) stages. Table S1. A total of 295 biological processes were found to be upregulated in mice, encompassing a comprehensive range of functional pathways. Table S2. A total of 66 biological processes were identified as downregulated in mice, representing a diverse set of functional pathways. Table S3. In humans, 157 biological processes were identified as being upregulated, reflecting a diverse array of molecular and cellular pathways. Table S4. A total of 167 biological processes were found to be downregulated in humans, encompassing a broad range of molecular and cellular pathways.
Author Contributions
Eloisa M. da Silva: Conceptualization, Methodology, Formal Analysis, Investigation, Data Curation, Writing, Original Draft Preparation, Funding Acquisition. Marcella Cipelli: Methodology and Writing – Review & Editing. Mariana A. do Amaral: Methodology and Writing – Review & Editing. Alvaro Pacheco-Silva: Supervision and Project Administration. Niels O. S. Câmara: Supervision and Project Administration. Vinicius Andrade-Oliveira: Supervision, Project Administration, Funding Acquisition and Writing – Review & Editing. All author has reviewed and approved the final published version of the manuscript.
Funding
This study received support by Fundação de Amparo à Pesquisa do Estado de São Paulo (FAPESP) (grants number 2020/14388-4, 2019/14755-0 and 2017/05264-7).
Informed Consent Statement
Not applicable.
Conflicts of Interest
The authors affirm that they have no conflicts of interest and that no personal or financial considerations influenced the objectivity or integrity of this research.
References
- Bray, F.; Laversanne, M.; Sung, H.; Ferlay, J.; Siegel, R.L.; Soerjomataram, I.; Jemal, A. Global Cancer Statistics 2022: GLOBOCAN Estimates of Incidence and Mortality Worldwide for 36 Cancers in 185 Countries. CA Cancer J Clin 2024, 74, 229–263. [Google Scholar] [CrossRef] [PubMed]
- Terzić, J.; Grivennikov, S.; Karin, E.; Karin, M. Inflammation and Colon Cancer. Gastroenterology 2010, 138, 2101–2114.e5. [Google Scholar] [CrossRef] [PubMed]
- Bray, G.A.; Heisel, W.E.; Afshin, A.; Jensen, M.D.; Dietz, W.H.; Long, M.; Kushner, R.F.; Daniels, S.R.; Wadden, T.A.; Tsai, A.G.; et al. The Science of Obesity Management: An Endocrine Society Scientific Statement. Endocr Rev 2018, 39, 79–132. [Google Scholar] [CrossRef] [PubMed]
- Kolb, R.; Sutterwala, F.S.; Zhang, W. Obesity and Cancer: Inflammation Bridges the Two. Curr Opin Pharmacol 2016, 29, 77–89. [Google Scholar] [CrossRef]
- Park, S.-Y.; Kim, J.-S.; Seo, Y.-R.; Sung, M.-K. Effects of Diet-Induced Obesity on Colitis-Associated Colon Tumor Formation in A/J Mice. Int J Obes 2012, 36, 273–280. [Google Scholar] [CrossRef]
- Moghaddam, A.A.; Woodward, M.; Huxley, R. Obesity and Risk of Colorectal Cancer: A Meta-Analysis of 31 Studies with 70,000 Events. Cancer Epidemiology, Biomarkers & Prevention 2007, 16, 2533–2547. [Google Scholar] [CrossRef]
- Rustgi, A.K. The Genetics of Hereditary Colon Cancer. Genes Dev 2007, 21, 2525–2538. [Google Scholar] [CrossRef]
- Worthington, J.J.; Reimann, F.; Gribble, F.M. Enteroendocrine Cells-Sensory Sentinels of the Intestinal Environment and Orchestrators of Mucosal Immunity. Mucosal Immunol 2018, 11, 3–20. [Google Scholar] [CrossRef]
- Li, H.J.; Ray, S.K.; Singh, N.K.; Johnston, B.; Leiter, A.B. Basic Helix-loop-helix Transcription Factors and Enteroendocrine Cell Differentiation. Diabetes Obes Metab 2011, 13, 5–12. [Google Scholar] [CrossRef]
- Bastide, P.; Darido, C.; Pannequin, J.; Kist, R.; Robine, S.; Marty-Double, C.; Bibeau, F.; Scherer, G.; Joubert, D.; Hollande, F.; et al. Sox9 Regulates Cell Proliferation and Is Required for Paneth Cell Differentiation in the Intestinal Epithelium. J Cell Biol 2007, 178, 635–648. [Google Scholar] [CrossRef]
- Hendel, S.K.; Kellermann, L.; Hausmann, A.; Bindslev, N.; Jensen, K.B.; Nielsen, O.H. Tuft Cells and Their Role in Intestinal Diseases. Front Immunol 2022, 13. [Google Scholar] [CrossRef]
- Birchenough, G.M.H.; Johansson, M.E.; Gustafsson, J.K.; Bergström, J.H.; Hansson, G.C. New Developments in Goblet Cell Mucus Secretion and Function. Mucosal Immunol 2015, 8, 712–719. [Google Scholar] [CrossRef] [PubMed]
- Koehne de Gonzalez, A.; del Portillo, A. P754 Beyond Paneth Cell Metaplasia: Small Intestinal Metaplasia of the Sigmoid Colon in Patients with Inflammatory Bowel Disease. J Crohns Colitis 2023, 17, i885–i886. [Google Scholar] [CrossRef]
- Bevins, C.L.; Salzman, N.H. Paneth Cells, Antimicrobial Peptides and Maintenance of Intestinal Homeostasis. Nat Rev Microbiol 2011, 9, 356–368. [Google Scholar] [CrossRef] [PubMed]
- Gunawardene, A.R.; Corfe, B.M.; Staton, C.A. Classification and Functions of Enteroendocrine Cells of the Lower Gastrointestinal Tract. Int J Exp Pathol 2011, 92, 219–231. [Google Scholar] [CrossRef]
- Drucker, D.J. The GLP-1 Journey: From Discovery Science to Therapeutic Impact. Journal of Clinical Investigation 2024, 134. [Google Scholar] [CrossRef]
- Yu, Y.; Yang, W.; Li, Y.; Cong, Y. Enteroendocrine Cells: Sensing Gut Microbiota and Regulating Inflammatory Bowel Diseases. Inflamm Bowel Dis 2020, 26, 11–20. [Google Scholar] [CrossRef]
- da Silva, E.M.; Yariwake, V.Y.; Alves, R.W.; de Araujo, D.R.; Andrade-Oliveira, V. Crosstalk between Incretin Hormones, Th17 and Treg Cells in Inflammatory Diseases. Peptides (N.Y.) 2022, 155, 170834. [Google Scholar] [CrossRef]
- Okayasu, I.; Ohkusa, T.; Kajiura, K.; Kanno, J.; Sakamoto, S. Promotion of Colorectal Neoplasia in Experimental Murine Ulcerative Colitis. Gut 1996, 39, 87–92. [Google Scholar] [CrossRef]
- Tominaga, O.; Nita, M.E.; Nagawa, H.; Fujii, S.; Tsuruo, T.; Muto, T. Expressions of Cell Cycle Regulators in Human Colorectal Cancer Cell Lines. Japanese Journal of Cancer Research 1997, 88, 855–860. [Google Scholar] [CrossRef]
- Luvhengo, T.; Mabasa, S.; Molepo, E.; Taunyane, I.; Palweni, S.T. Paneth Cell, Gut Microbiota Dysbiosis and Diabetes Mellitus. Applied Sciences 2023, 13, 6605. [Google Scholar] [CrossRef]
- Wang, L.; Shen, F.; Stroehlein, J.R.; Wei, D. Context-Dependent Functions of KLF4 in Cancers: Could Alternative Splicing Isoforms Be the Key? Cancer Lett 2018, 438, 10–16. [Google Scholar] [CrossRef]
- Abdullayeva, G.; Liu, H.; Liu, T.-C.; Simmons, A.; Novelli, M.; Huseynova, I.; Lastun, V.L.; Bodmer, W. Goblet Cell Differentiation Subgroups in Colorectal Cancer. Proceedings of the National Academy of Sciences 2024, 121. [Google Scholar] [CrossRef]
- Habib, A.M.; Richards, P.; Cairns, L.S.; Rogers, G.J.; Bannon, C.A.M.; Parker, H.E.; Morley, T.C.E.; Yeo, G.S.H.; Reimann, F.; Gribble, F.M. Overlap of Endocrine Hormone Expression in the Mouse Intestine Revealed by Transcriptional Profiling and Flow Cytometry. Endocrinology 2012, 153, 3054–3065. [Google Scholar] [CrossRef] [PubMed]
- Gierl, M.S.; Karoulias, N.; Wende, H.; Strehle, M.; Birchmeier, C. The Zinc-Finger Factor Insm1 (IA-1) Is Essential for the Development of Pancreatic β Cells and Intestinal Endocrine Cells. Genes Dev 2006, 20, 2465–2478. [Google Scholar] [CrossRef] [PubMed]
- Naya, F.J.; Huang, H.-P.; Qiu, Y.; Mutoh, H.; DeMayo, F.J.; Leiter, A.B.; Tsai, M.-J. Diabetes, Defective Pancreatic Morphogenesis, and Abnormal Enteroendocrine Differentiation in BETA2/NeuroD-Deficient Mice. Genes Dev 1997, 11, 2323–2334. [Google Scholar] [CrossRef] [PubMed]
- Deacon, C.F. Dipeptidyl Peptidase-4 Inhibitors in the Treatment of Type 2 Diabetes: A Comparative Review. Diabetes Obes Metab 2011, 13, 7–18. [Google Scholar] [CrossRef] [PubMed]
- Collombat, P.; Mansouri, A.; Hecksher-Sørensen, J.; Serup, P.; Krull, J.; Gradwohl, G.; Gruss, P. Opposing Actions of Arx and Pax4 in Endocrine Pancreas Development. Genes Dev 2003, 17, 2591–2603. [Google Scholar] [CrossRef]
- Estall, J.L.; Drucker, D.J. Glucagon-Like Peptide-2. Annu Rev Nutr 2006, 26, 391–411. [Google Scholar] [CrossRef]
- Gradwohl, G.; Dierich, A.; LeMeur, M.; Guillemot, F. Neurogenin3 Is Required for the Development of the Four Endocrine Cell Lineages of the Pancreas. Proceedings of the National Academy of Sciences 2000, 97, 1607–1611. [Google Scholar] [CrossRef]
- Gross, S.; Garofalo, D.C.; Balderes, D.A.; Mastracci, T.L.; Dias, J.M.; Perlmann, T.; Ericson, J.; Sussel, L. Lmx1a Functions in Intestinal Serotonin-Producing Enterochromaffin Cells Downstream of Nkx2.2. Development 2016. [Google Scholar] [CrossRef]
- Katz, J.P.; Perreault, N.; Goldstein, B.G.; Lee, C.S.; Labosky, P.A.; Yang, V.W.; Kaestner, K.H. The Zinc-Finger Transcription Factor Klf4 Is Required for Terminal Differentiation of Goblet Cells in the Colon. Development 2002, 129, 2619–2628. [Google Scholar] [CrossRef]
- Van der Sluis, M.; De Koning, B.A.E.; De Bruijn, A.C.J.M.; Velcich, A.; Meijerink, J.P.P.; Van Goudoever, J.B.; Büller, H.A.; Dekker, J.; Van Seuningen, I.; Renes, I.B.; et al. Muc2-Deficient Mice Spontaneously Develop Colitis, Indicating That MUC2 Is Critical for Colonic Protection. Gastroenterology 2006, 131, 117–129. [Google Scholar] [CrossRef]
- Noah, T.K.; Kazanjian, A.; Whitsett, J.; Shroyer, N.F. SAM Pointed Domain ETS Factor (SPDEF) Regulates Terminal Differentiation and Maturation of Intestinal Goblet Cells. Exp Cell Res 2010, 316, 452–465. [Google Scholar] [CrossRef] [PubMed]
- Gerbe, F.; Sidot, E.; Smyth, D.J.; Ohmoto, M.; Matsumoto, I.; Dardalhon, V.; Cesses, P.; Garnier, L.; Pouzolles, M.; Brulin, B.; et al. Intestinal Epithelial Tuft Cells Initiate Type 2 Mucosal Immunity to Helminth Parasites. Nature 2016, 529, 226–230. [Google Scholar] [CrossRef]
- Gracz, A.D.; Samsa, L.A.; Fordham, M.J.; Trotier, D.C.; Zwarycz, B.; Lo, Y.-H.; Bao, K.; Starmer, J.; Raab, J.R.; Shroyer, N.F.; et al. Sox4 Promotes Atoh1-Independent Intestinal Secretory Differentiation Toward Tuft and Enteroendocrine Fates. Gastroenterology 2018, 155, 1508–1523.e10. [Google Scholar] [CrossRef] [PubMed]
- Shroyer, N.F.; Wallis, D.; Venken, K.J.T.; Bellen, H.J.; Zoghbi, H.Y. Gfi1 Functions Downstream of Math1 to Control Intestinal Secretory Cell Subtype Allocation and Differentiation. Genes Dev 2005, 19, 2412–2417. [Google Scholar] [CrossRef]
- Valdez-Miramontes, C.E.; De Haro-Acosta, J.; Aréchiga-Flores, C.F.; Verdiguel-Fernández, L.; Rivas-Santiago, B. Antimicrobial Peptides in Domestic Animals and Their Applications in Veterinary Medicine. Peptides (N.Y.) 2021, 142, 170576. [Google Scholar] [CrossRef]
- Yu, S.; Balasubramanian, I.; Laubitz, D.; Tong, K.; Bandyopadhyay, S.; Lin, X.; Flores, J.; Singh, R.; Liu, Y.; Macazana, C.; et al. Paneth Cell-Derived Lysozyme Defines the Composition of Mucolytic Microbiota and the Inflammatory Tone of the Intestine. Immunity 2020, 53, 398–416.e8. [Google Scholar] [CrossRef] [PubMed]
- Yu, M.; Qin, K.; Fan, J.; Zhao, G.; Zhao, P.; Zeng, W.; Chen, C.; Wang, A.; Wang, Y.; Zhong, J.; et al. The Evolving Roles of Wnt Signaling in Stem Cell Proliferation and Differentiation, the Development of Human Diseases, and Therapeutic Opportunities. Genes Dis 2024, 11, 101026. [Google Scholar] [CrossRef]
- Barker, N.; van Es, J.H.; Kuipers, J.; Kujala, P.; van den Born, M.; Cozijnsen, M.; Haegebarth, A.; Korving, J.; Begthel, H.; Peters, P.J.; et al. Identification of Stem Cells in Small Intestine and Colon by Marker Gene Lgr5. Nature 2007, 449, 1003–1007. [Google Scholar] [CrossRef] [PubMed]
- Ren, J.; Sui, H.; Fang, F.; Li, Q.; Li, B. The Application of ApcMin/+ Mouse Model in Colorectal Tumor Researches. J Cancer Res Clin Oncol 2019, 145, 1111–1122. [Google Scholar] [CrossRef]
- Amin, M.B.; Greene, F.L.; Edge, S.B.; Compton, C.C.; Gershenwald, J.E.; Brookland, R.K.; Meyer, L.; Gress, D.M.; Byrd, D.R.; Winchester, D.P. The Eighth Edition <scp>AJCC</Scp> Cancer Staging Manual: Continuing to Build a Bridge from a Population-based to a More “Personalized” Approach to Cancer Staging. CA Cancer J Clin 2017, 67, 93–99. [Google Scholar] [CrossRef]
- Betge, J.; Schneider, N.I.; Harbaum, L.; Pollheimer, M.J.; Lindtner, R.A.; Kornprat, P.; Ebert, M.P.; Langner, C. MUC1, MUC2, MUC5AC, and MUC6 in Colorectal Cancer: Expression Profiles and Clinical Significance. Virchows Archiv 2016, 469, 255–265. [Google Scholar] [CrossRef]
- Koehler, J.A.; Kain, T.; Drucker, D.J. Glucagon-Like Peptide-1 Receptor Activation Inhibits Growth and Augments Apoptosis in Murine CT26 Colon Cancer Cells. Endocrinology 2011, 152, 3362–3372. [Google Scholar] [CrossRef]
- Koehler, J.A.; Baggio, L.L.; Yusta, B.; Longuet, C.; Rowland, K.J.; Cao, X.; Holland, D.; Brubaker, P.L.; Drucker, D.J. GLP-1R Agonists Promote Normal and Neoplastic Intestinal Growth through Mechanisms Requiring Fgf7. Cell Metab 2015, 21, 379–391. [Google Scholar] [CrossRef]
- Shin, J.H.; Park, J.; Lim, J.; Jeong, J.; Dinesh, R.K.; Maher, S.E.; Kim, J.; Park, S.; Hong, J.Y.; Wysolmerski, J.; et al. Metastasis of Colon Cancer Requires Dickkopf-2 to Generate Cancer Cells with Paneth Cell Properties. Elife 2024, 13. [Google Scholar] [CrossRef]
- Pinto, D.; Gregorieff, A.; Begthel, H.; Clevers, H. Canonical Wnt Signals Are Essential for Homeostasis of the Intestinal Epithelium. Genes Dev 2003, 17, 1709–1713. [Google Scholar] [CrossRef]
- Andreu, P.; Peignon, G.; Slomianny, C.; Taketo, M.M.; Colnot, S.; Robine, S.; Lamarque, D.; Laurent-Puig, P.; Perret, C.; Romagnolo, B. A Genetic Study of the Role of the Wnt/β-Catenin Signalling in Paneth Cell Differentiation. Dev Biol 2008, 324, 288–296. [Google Scholar] [CrossRef] [PubMed]
- Colozza, G.; Lee, H.; Merenda, A.; Wu, S.-H.S.; Català-Bordes, A.; Radaszkiewicz, T.W.; Jordens, I.; Lee, J.-H.; Bamford, A.-D.; Farnhammer, F.; et al. Intestinal Paneth Cell Differentiation Relies on Asymmetric Regulation of Wnt Signaling by Daam1/2. Sci Adv 2023, 9. [Google Scholar] [CrossRef] [PubMed]
- López-Arribillaga, E.; Yan, B.; Lobo-Jarne, T.; Guillén, Y.; Menéndez, S.; Andreu, M.; Bigas, A.; Iglesias, M.; Espinosa, L. Accumulation of Paneth Cells in Early Colorectal Adenomas Is Associated with Beta-Catenin Signaling and Poor Patient Prognosis. Cells 2021, 10, 2928. [Google Scholar] [CrossRef]
- Du, W.; Miao, Y.; Zhang, G.; Luo, G.; Yang, P.; Chen, F.; Zhang, B.; Yang, C.; Li, G.; Chang, J. The Regulatory Role of Neuropeptide Gene Glucagon in Colorectal Cancer: A Comprehensive Bioinformatic Analysis. Dis Markers 2022, 2022, 1–17. [Google Scholar] [CrossRef]
- Zhou, G.; Soufan, O.; Ewald, J.; Hancock, R.E.W.; Basu, N.; Xia, J. NetworkAnalyst 3.0: A Visual Analytics Platform for Comprehensive Gene Expression Profiling and Meta-Analysis. Nucleic Acids Res 2019, 47, W234–W241. [Google Scholar] [CrossRef]
- Zhou, Y.; Zhou, B.; Pache, L.; Chang, M.; Khodabakhshi, A.H.; Tanaseichuk, O.; Benner, C.; Chanda, S.K. Metascape Provides a Biologist-Oriented Resource for the Analysis of Systems-Level Datasets. Nat Commun 2019, 10, 1523. [Google Scholar] [CrossRef] [PubMed]
- Tang, G.; Cho, M.; Wang, X. OncoDB: An Interactive Online Database for Analysis of Gene Expression and Viral Infection in Cancer. Nucleic Acids Res 2022, 50, D1334–D1339. [Google Scholar] [CrossRef] [PubMed]
- Chandrashekar, D.S.; Karthikeyan, S.K.; Korla, P.K.; Patel, H.; Shovon, A.R.; Athar, M.; Netto, G.J.; Qin, Z.S.; Kumar, S.; Manne, U.; et al. UALCAN: An Update to the Integrated Cancer Data Analysis Platform. Neoplasia 2022, 25, 18–27. [Google Scholar] [CrossRef]
- Szklarczyk, D.; Franceschini, A.; Wyder, S.; Forslund, K.; Heller, D.; Huerta-Cepas, J.; Simonovic, M.; Roth, A.; Santos, A.; Tsafou, K.P.; et al. STRING V10: Protein–Protein Interaction Networks, Integrated over the Tree of Life. Nucleic Acids Res 2015, 43, D447–D452. [Google Scholar] [CrossRef]
- Uhlén, M.; Fagerberg, L.; Hallström, B.M.; Lindskog, C.; Oksvold, P.; Mardinoglu, A.; Sivertsson, Å.; Kampf, C.; Sjöstedt, E.; Asplund, A.; et al. Tissue-Based Map of the Human Proteome. Science (1979) 2015, 347. [Google Scholar] [CrossRef]
- Fekete, J.T.; Győrffy, B. ROCplot.Org: Validating Predictive Biomarkers of Chemotherapy/Hormonal Therapy/Anti-HER2 Therapy Using Transcriptomic Data of 3,104 Breast Cancer Patients. Int J Cancer 2019, 145, 3140–3151. [Google Scholar] [CrossRef] [PubMed]
Figure 1.
Differential expression analysis of microarray from experimental and human colorectal cancer tissue. A, B. Public dataset of Microarray study from mouse GSE86299 (A) and human GSE8671 (B) tissues analyzing normal colon (blue) and colorectal cancer (CRC) tissue (red) by principal component analysis (PCA) plot, mouse n= 8 per group and human n= 32 per group. Representative datasets of a total of 3 analyzed (Figure S1). C, D. Volcano plot with differential gene expression comparing murine (C) and human (D) colorectal cancer tissue with adjacent tissue. Genes down and upregulated in cancer tissue are highlighted in blue and red, respectively. E. Venn diagram considering three experimental mouse models of colitis-associated colorectal cancer (CAC) from gene expression omnibus (GEO) datasets, showing the common up and downregulated genes from all datasets. F. Venn diagram considering three human CRC datasets from GEO, showing the common up and downregulated common genes in all datasets. FDR <0.05 and log fold change= 1 or -1 using limma package.
Figure 2.
Antimicrobial peptide-related pathways are upregulated while hormonal processes are downregulated in colorectal cancer. A. GO Biological Process analysis considering up (red) and down (blue) pathways from common genes observed from Venn Diagrams on mouse colitis-associated colorectal cancer (CAC) studies. B. GO Biological Process analysis considering up (red) and down (blue) pathways from common genes observed from Venn Diagrams on human colorectal cancer (CRC) studies. Analysis from Metascape platform.
Figure 3.
Upregulation of Paneth cell-related markers and downregulation of Enteroendocrine cell genes in experimental and human colorectal cancer. A. Genes were selected by previously described in the literature as specific-markers of secretory intestinal epithelial cells (IECs) as well as their transcriptional regulators. Bubble-Based Heatmap with IECs genes considering the log fold change (logFC) -2 to 2. Colored circle refers to the size of the difference while the size of the circle is related to the level of significance of the adjusted p value (p.adj) (-Log10). Blue: Enteroendocrine cells; Yellow: Tuft cells; Red: Paneth cells; Green: Goblet cells.
Figure 4.
The String interaction shows Glucagon (GCG) as the gene with the highest number of interactions with other Enteroendocrine cells markers. A. String of downregulated genes obtained from Venn Diagrams in human colorectal (CRC), using the minimum required interaction score high confidence, analysis from string-db plataform.
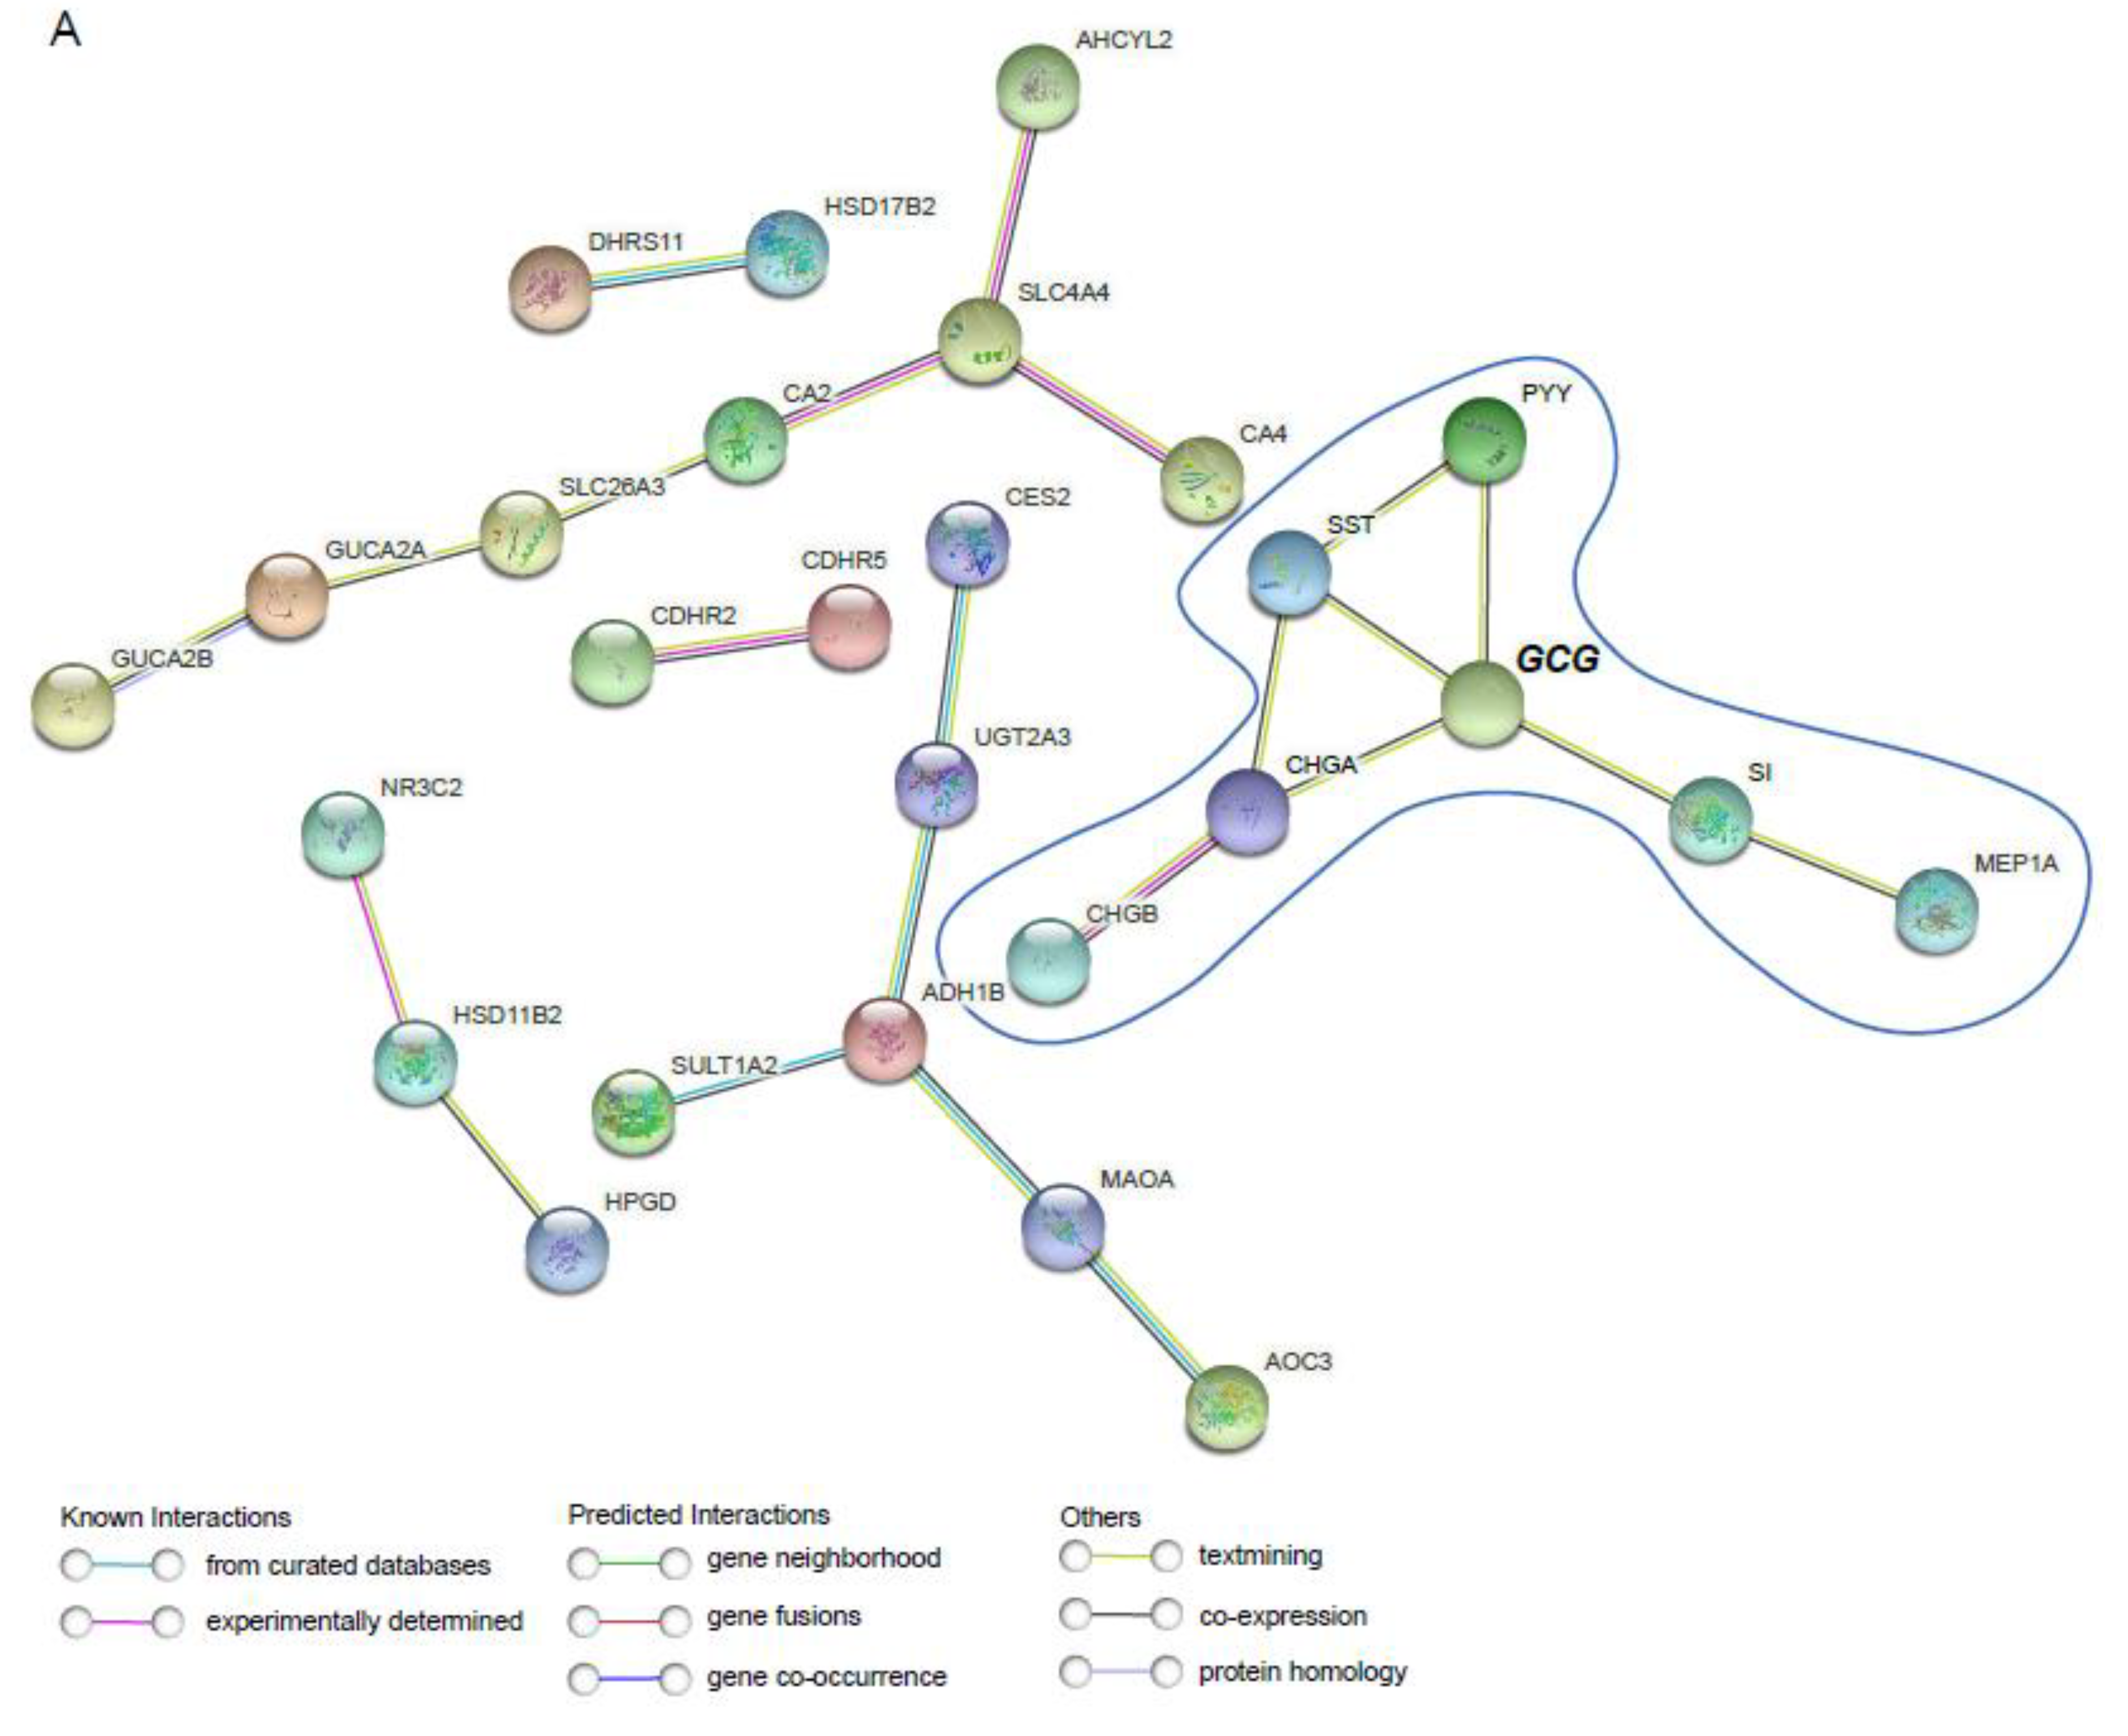
Figure 5.
RNA-seq analysis from the The Cancer Genome Atlas (TCGA) platform identified Glucagon (GCG) and Peptide YY (PYY) as one of the top 25 most downregulated genes in colorectal adenocarcinoma (COAD) tumor samples. A. The top 25 downregulated genes in human colorectal cancer (CRC) tissue from the TCGA (RNAseq) database, color range considering Log2 normalized transcript per million (log2-TPM) comparing normal and colorectal cancer tissue. Among our target genes, GCG and PYY were found, which are related to enteroendocrine cells and which we highlight in blue. Analysis from UALCAN platform.
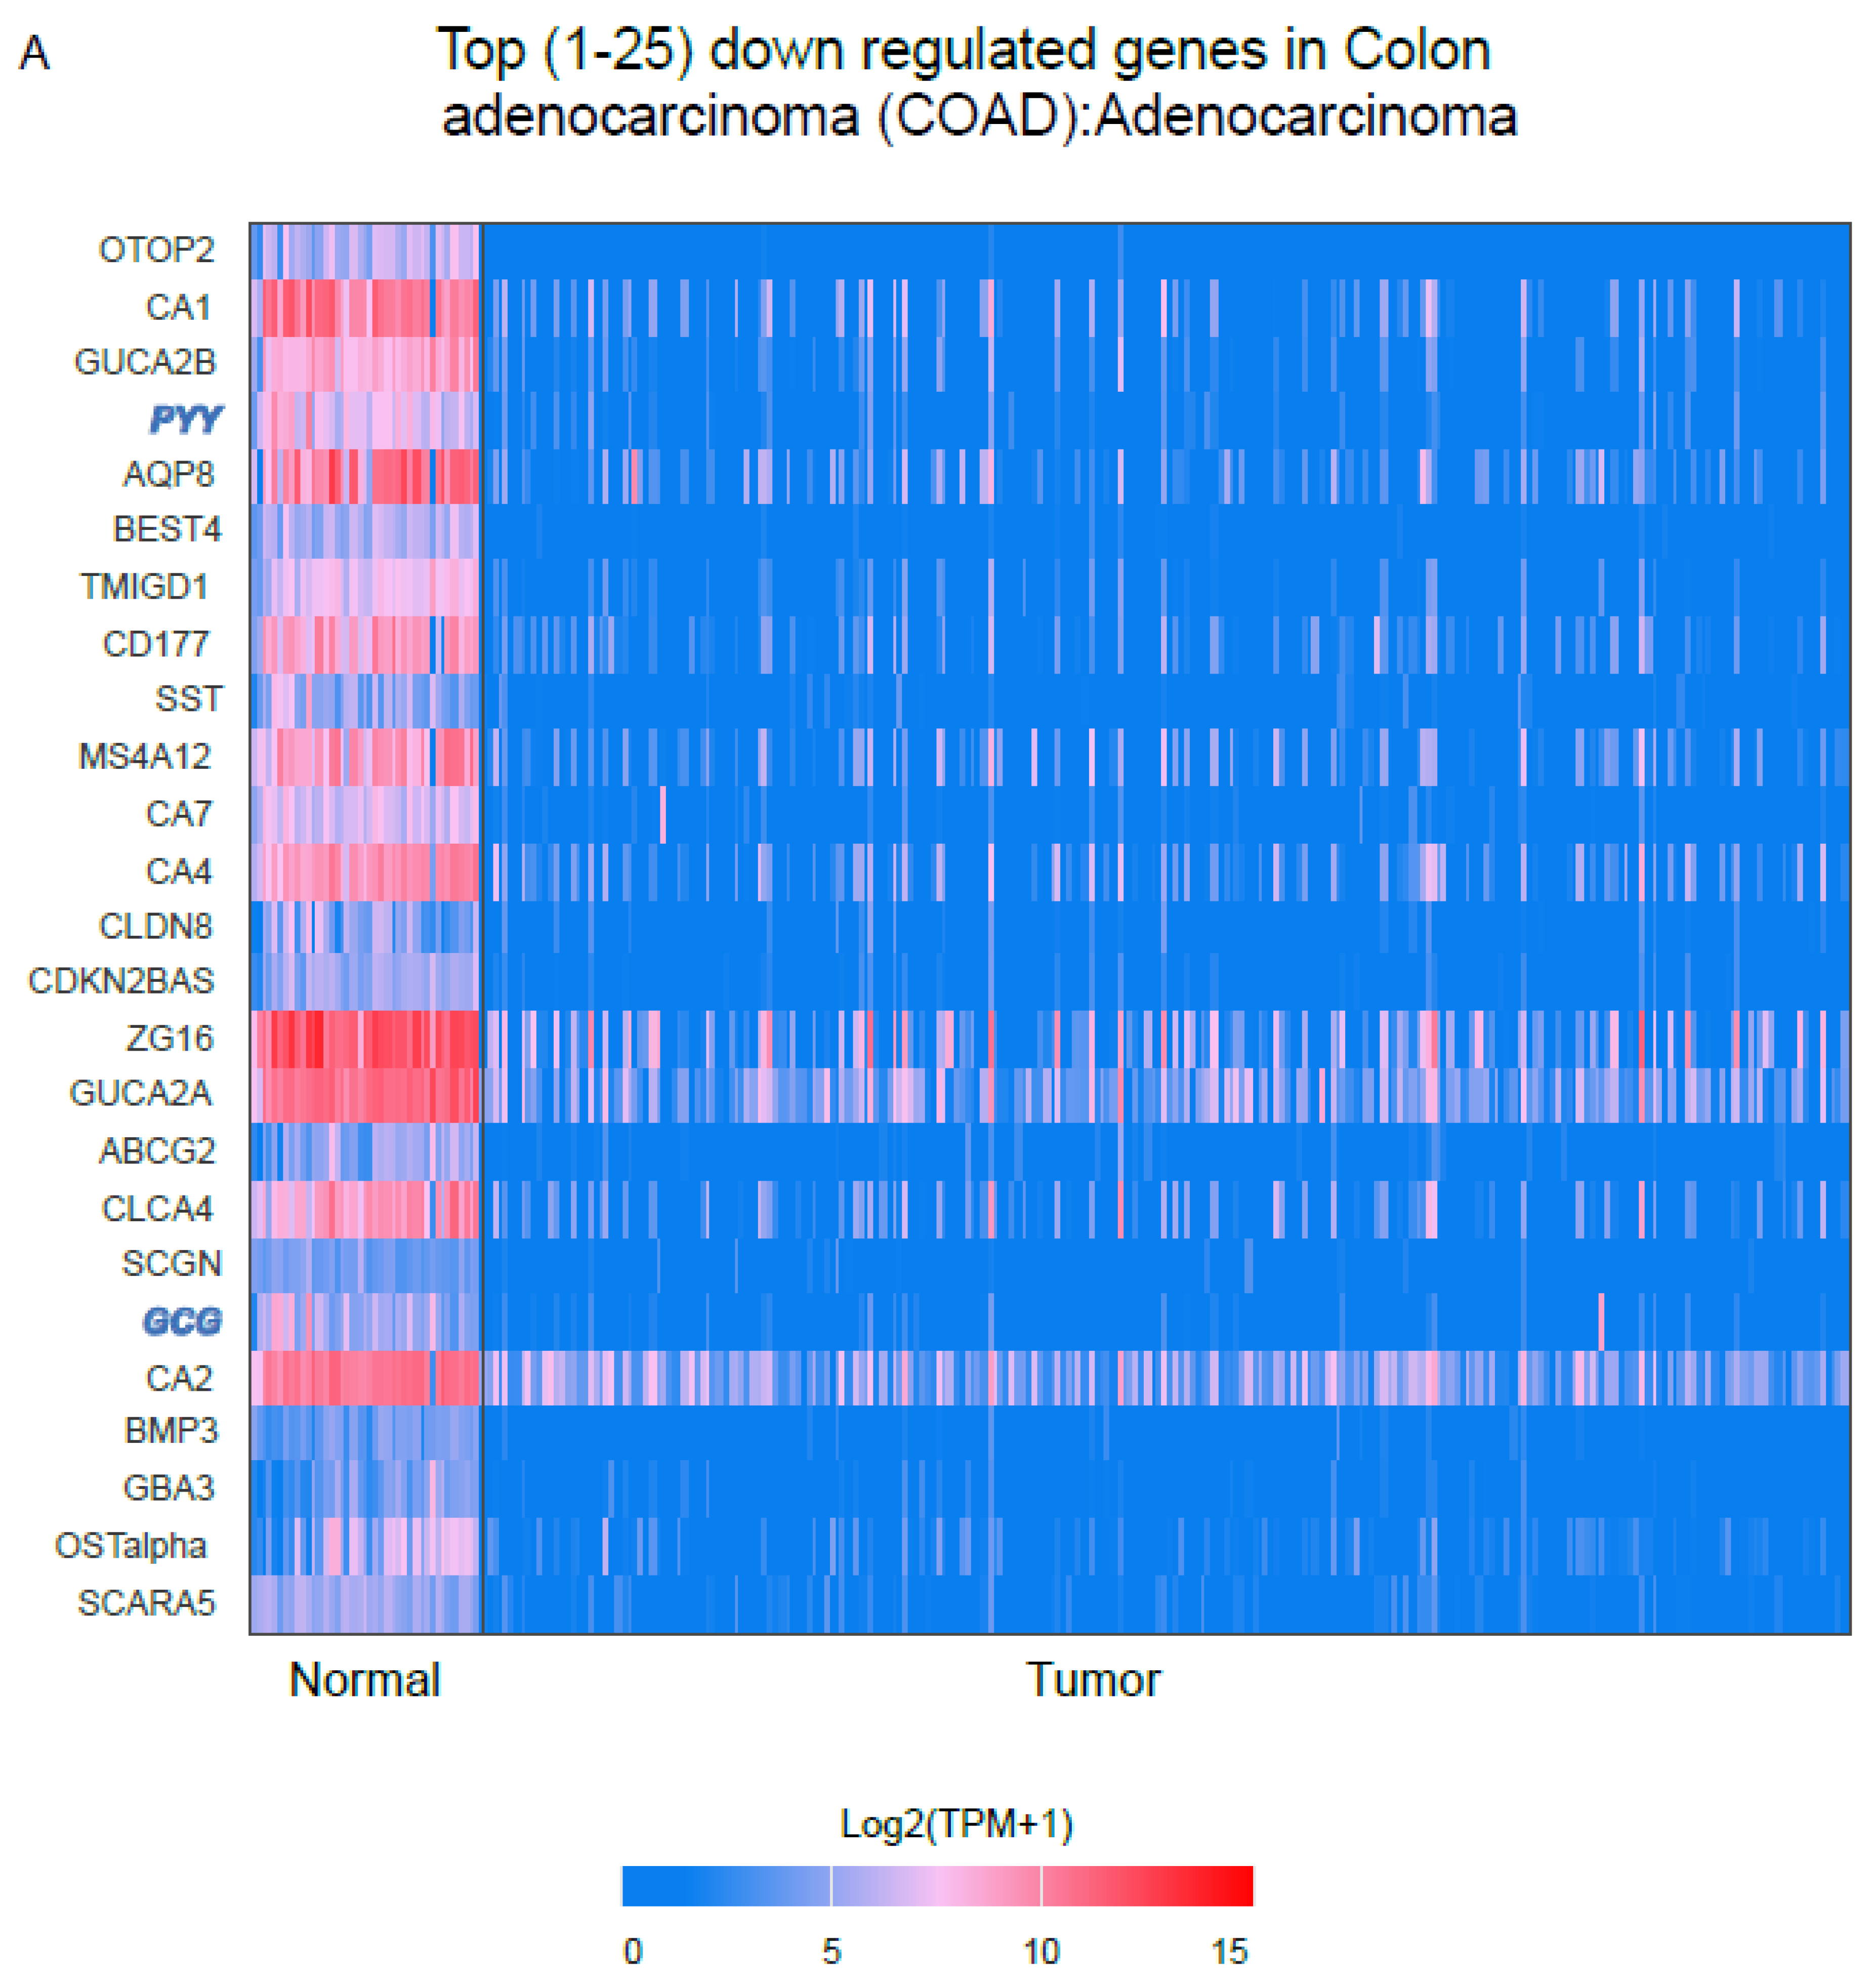
Figure 6.
RNAseq analysis from The Cancer Genome Atlas (TCGA) Colon adenocarcinoma (COAD) database, differential expression between intestinal epithelial cells (IECs) markers in metastatic colorectal cancer. A. Bubble-Based Heatmap comparing normal, tumor, and metastatic tissue from colorectal cancer (CRC) human tissue with IECs genes considering the log fold change (logFC) -2 to 2. Colored circle refers to the size of the difference while the size of the circle is related to the level of significance of adjusted p value (p.adj) (-Log10). Blue: Enteroendocrine cells; Yellow: Tuft cells; Red: Paneth cells; Green: Goblet cells.
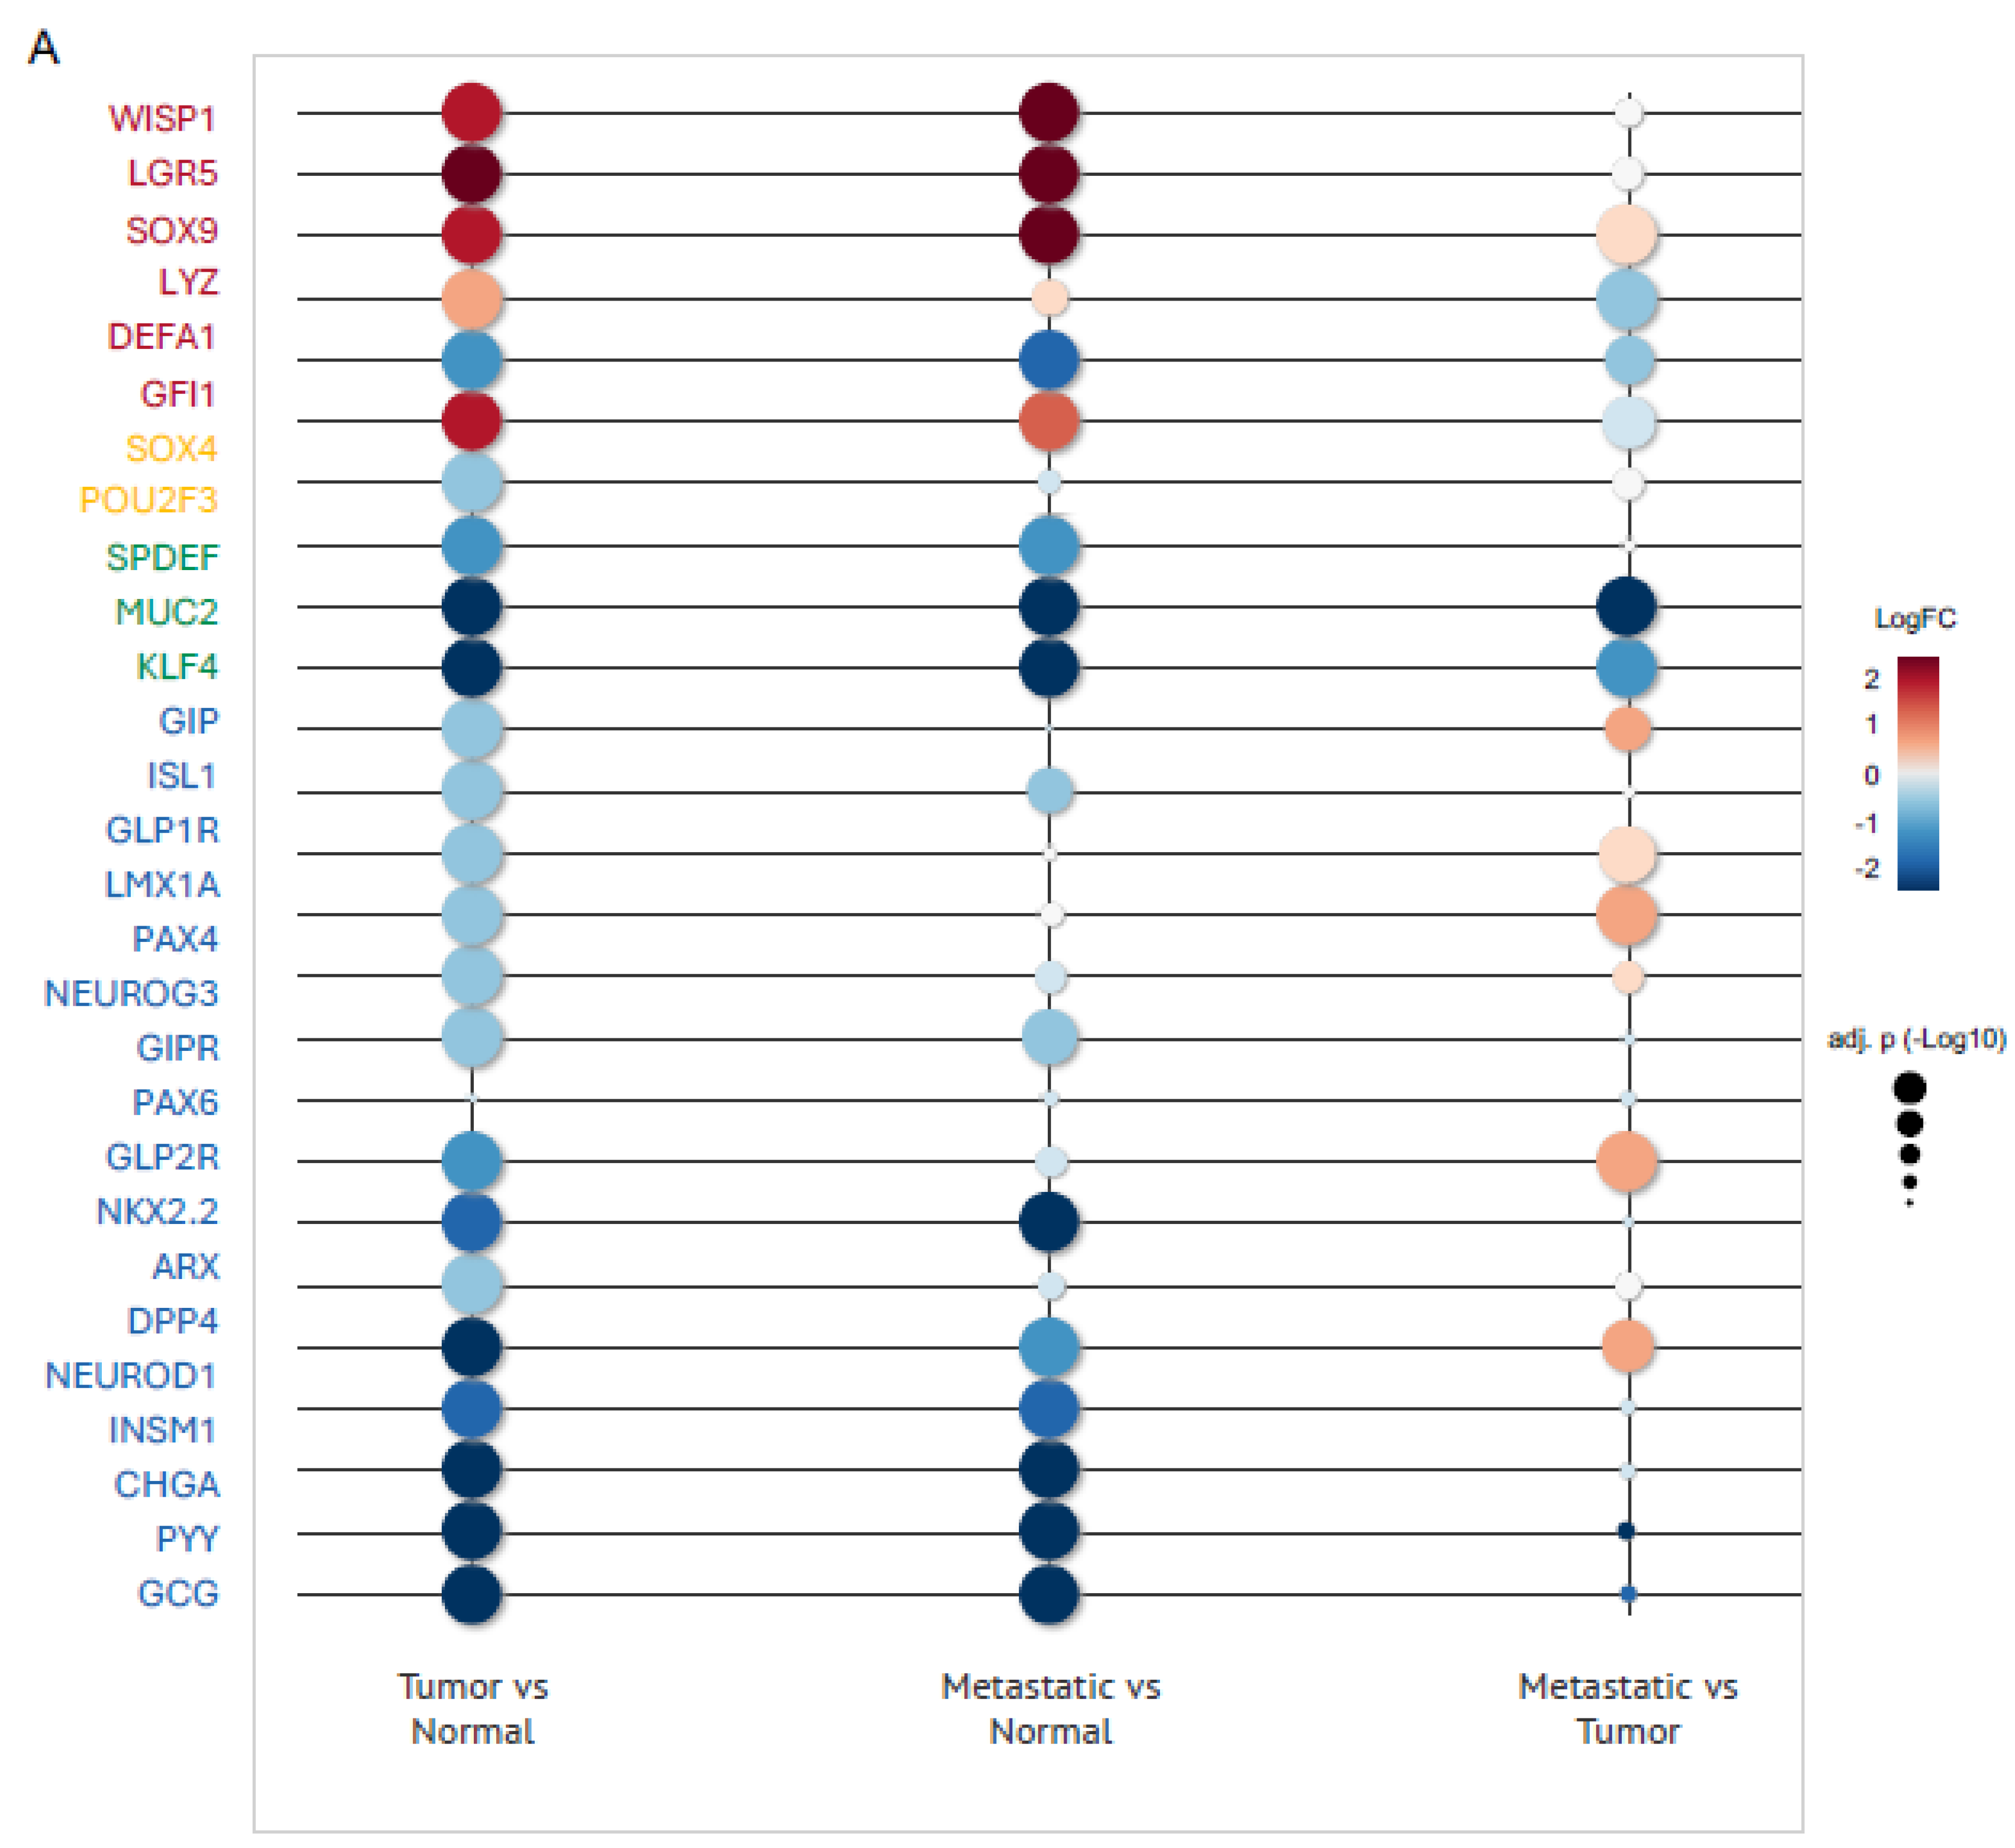
Figure 7.
High expression levels of Glucagon (GCG) and Chromogranin A (CHGA) are positively associated with improved overall survival and enhanced chemotherapy responsiveness in patients with Colon adenocarcinoma (COAD) tumors. A-B. 5-years survival curves of patients with colorectal cancer (CRC) stratified based on GCG (A) and CHGA (B) expression. Kaplan-Meier plot from Protein Atlas. C-D. Analysis of patients with CRC classified as responder or non-responder to chemotherapy. C. Expression of GCG and the difference between responder and non-responder patients. D. Expression of CHGA and the difference between responder and non-responder patients. ROCplot from rocplot.org.
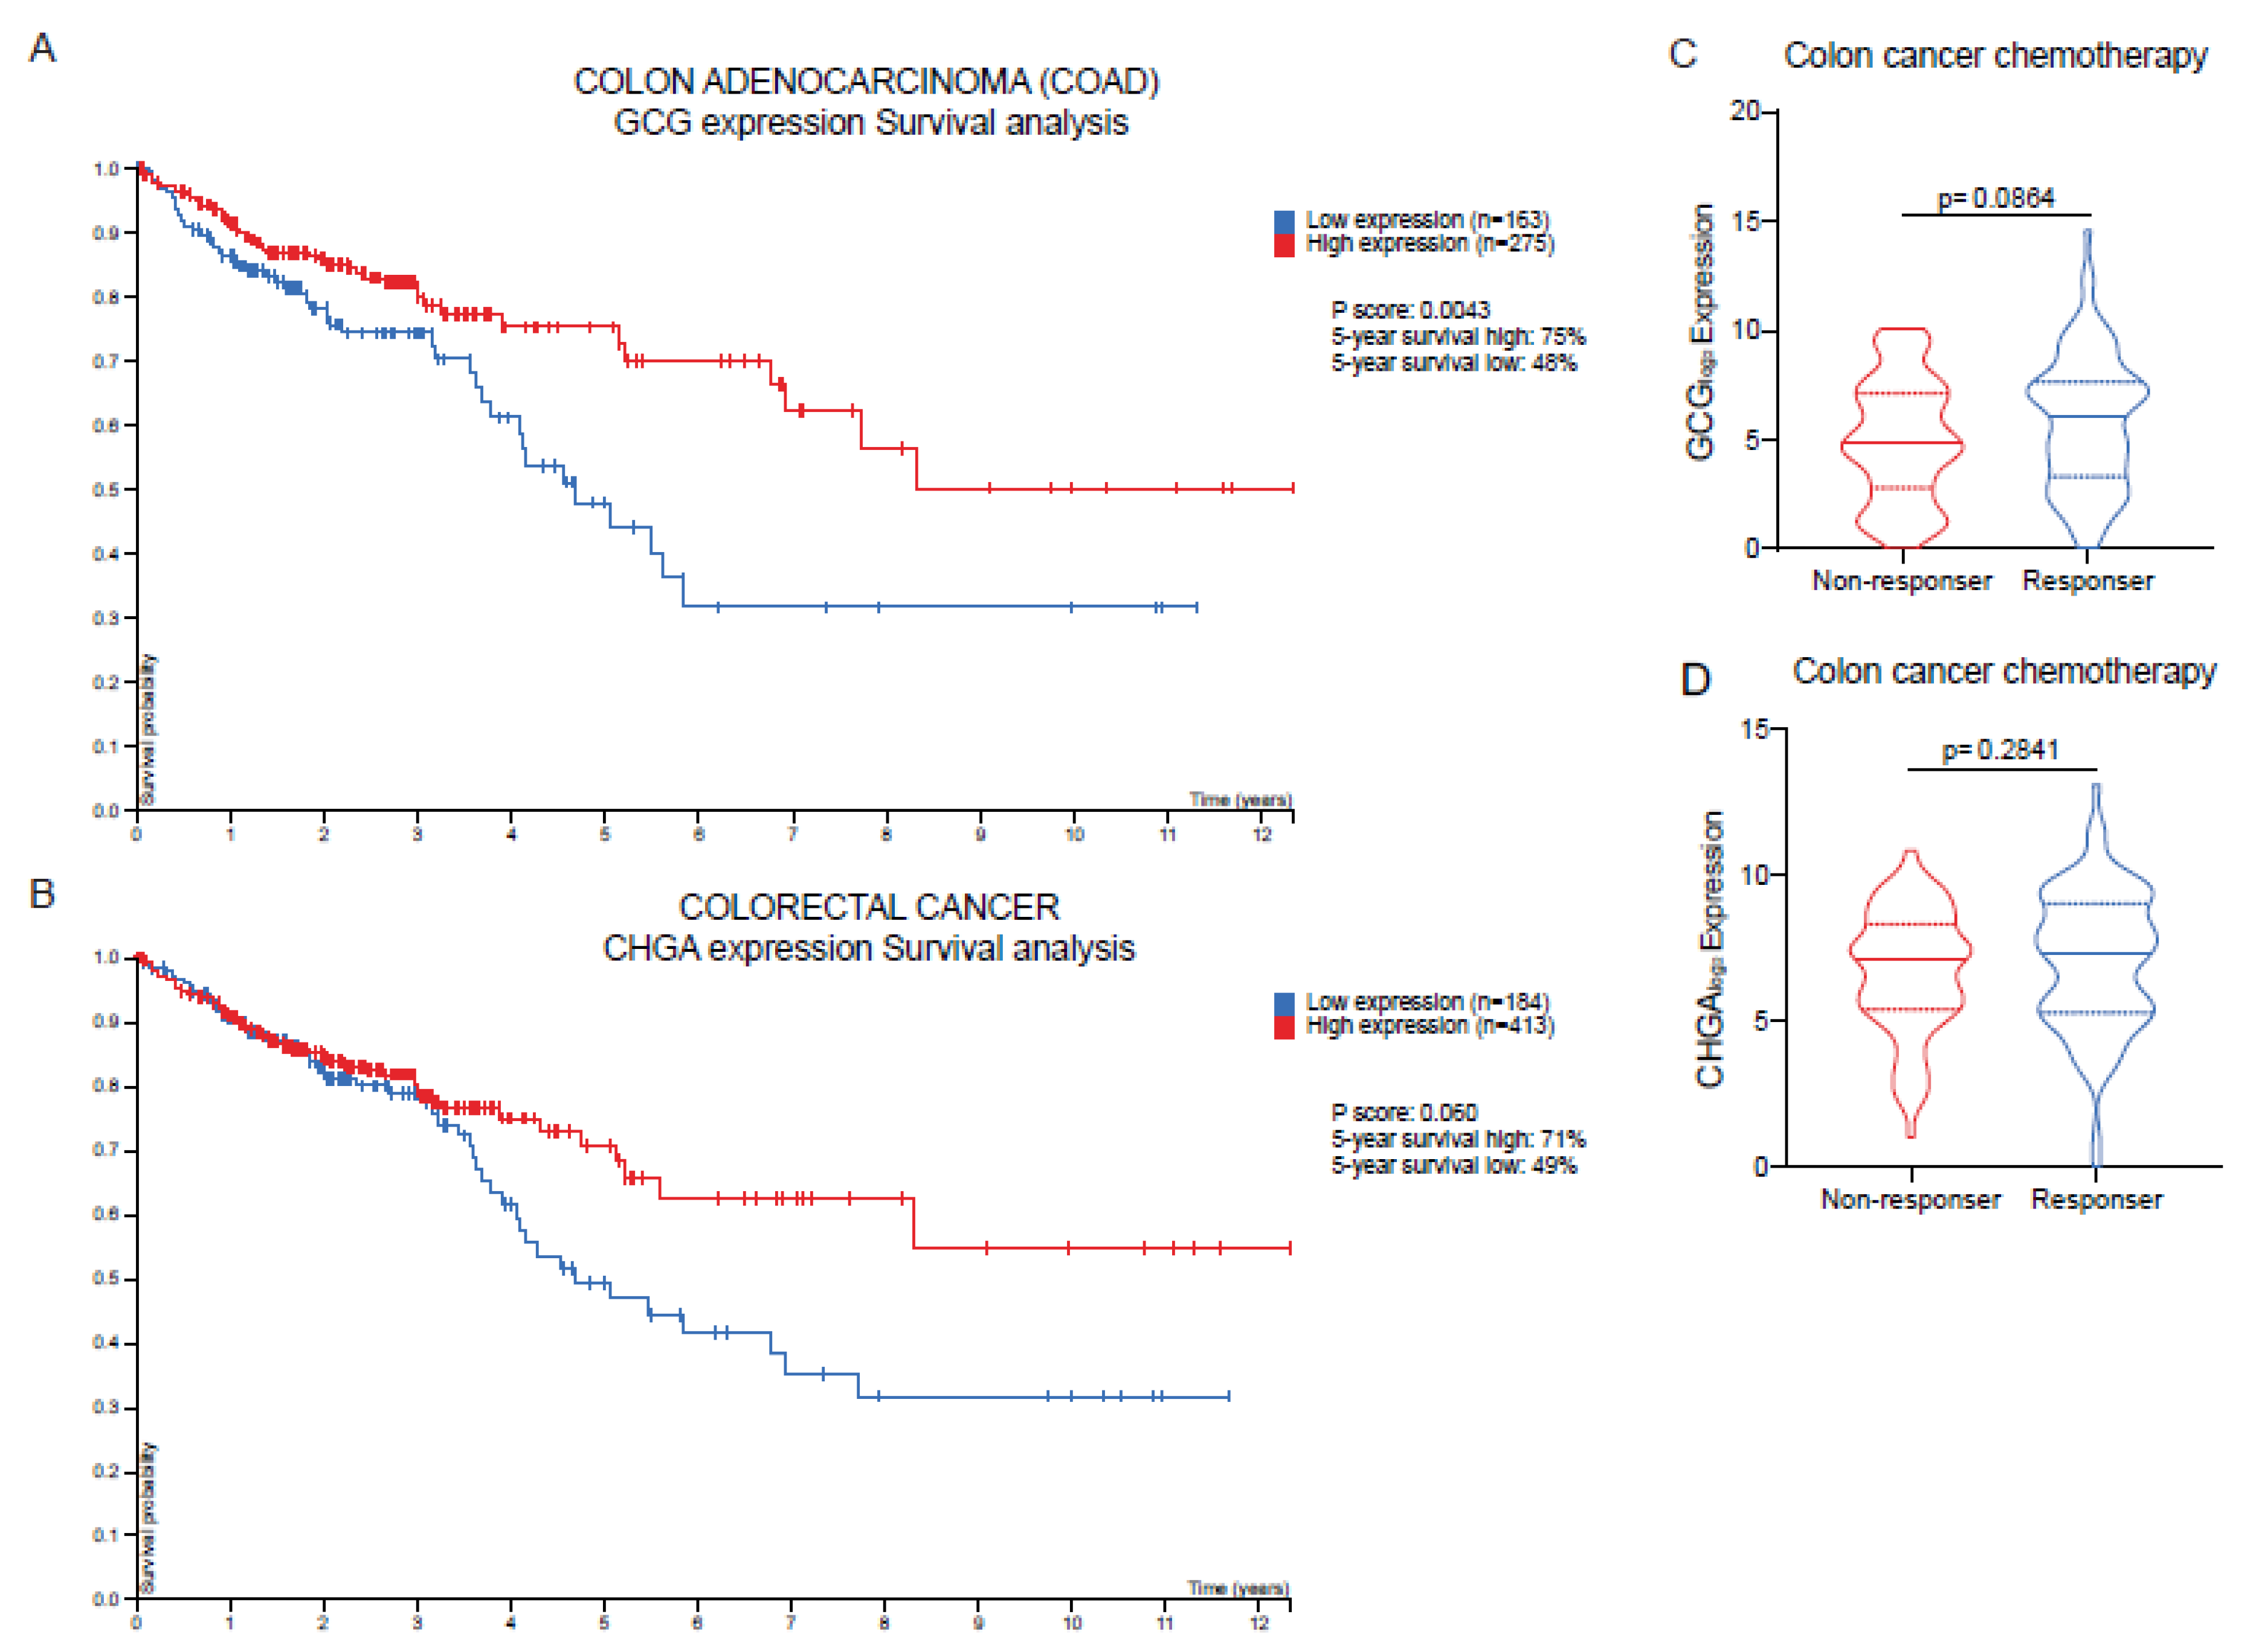

Table 1.
Genes related to each intestinal epithelial cell subtype and their description.
| Cell type | Gene | Gene Function / Description | Reference |
|---|---|---|---|
| Enteroendocrine cell | GCG | GLP-1/2 hormone L-cell marker | [24] |
| PYY | Hormone secreted by L-cells | ||
| CHGA | Classical marker | [15] | |
| INSM1 | Neuroendocrine transcription factor | [25] | |
| NEUROD1 | Neuroendocrine differentiation | [26] | |
| DPP4 | Incretin degradation (GLP-1, GIP) | [27] | |
| ARX | Regulates the fate of endocrine subtypes | [28] | |
| NKX2.2 | Required for intestinal endocrine differentiation | [24] | |
| GLP2R | GLP-2 receptor | [29] | |
| PAX6 | Regulates EEC subtypes | [24] | |
| GIPR | GIP receptor | ||
| NEUROG3 | EEC master regulator | [30] | |
| PAX4 | Intestinal endocrine development | [24] | |
| LMX1A | Regulates serotonin | [31] | |
| GLP1R | GLP-1 receptor | [24] | |
| ISL1 | Endocrine regulation | ||
| GIP | Hormone produced by K cells | ||
| Goblet cell | KLF4 | Goblet cell differentiation | [32] |
| MUC2 | Major secreted mucin | [33] | |
| SPDEF | Essential for goblet cells | [34] | |
| Tuft cell | POU2F3 | Tuft cell master regulator | [35] |
| SOX4 | Tuft development | [36] | |
| Paneth cell | GFI1 | Regulation of Paneth cells | [37] |
| DEFA1 | Antimicrobial peptide produced by Paneth cell | [38] | |
| LYZ | Lysozyme a classic marker | [39] | |
| SOX9 | Essential transcription factor | [10] | |
| WISP1 | Maintains niche and Paneth differentiation | [40] | |
| Stem cell | LGR5 | Intestinal stem cell marker | [41] |
Disclaimer/Publisher’s Note: The statements, opinions and data contained in all publications are solely those of the individual author(s) and contributor(s) and not of MDPI and/or the editor(s). MDPI and/or the editor(s) disclaim responsibility for any injury to people or property resulting from any ideas, methods, instructions or products referred to in the content. |
© 2025 by the authors. Licensee MDPI, Basel, Switzerland. This article is an open access article distributed under the terms and conditions of the Creative Commons Attribution (CC BY) license (http://creativecommons.org/licenses/by/4.0/).
Copyright: This open access article is published under a Creative Commons CC BY 4.0 license, which permit the free download, distribution, and reuse, provided that the author and preprint are cited in any reuse.


