Preprint
Article

This version is not peer-reviewed.

Analysis of ROMO1 Expression Levels and its Oncogenic Role in Gastrointestinal Tract Cancers

A peer-reviewed article of this preprint also exists.

Submitted:

21 November 2024

Posted:

21 November 2024

You are already at the latest version

Abstract

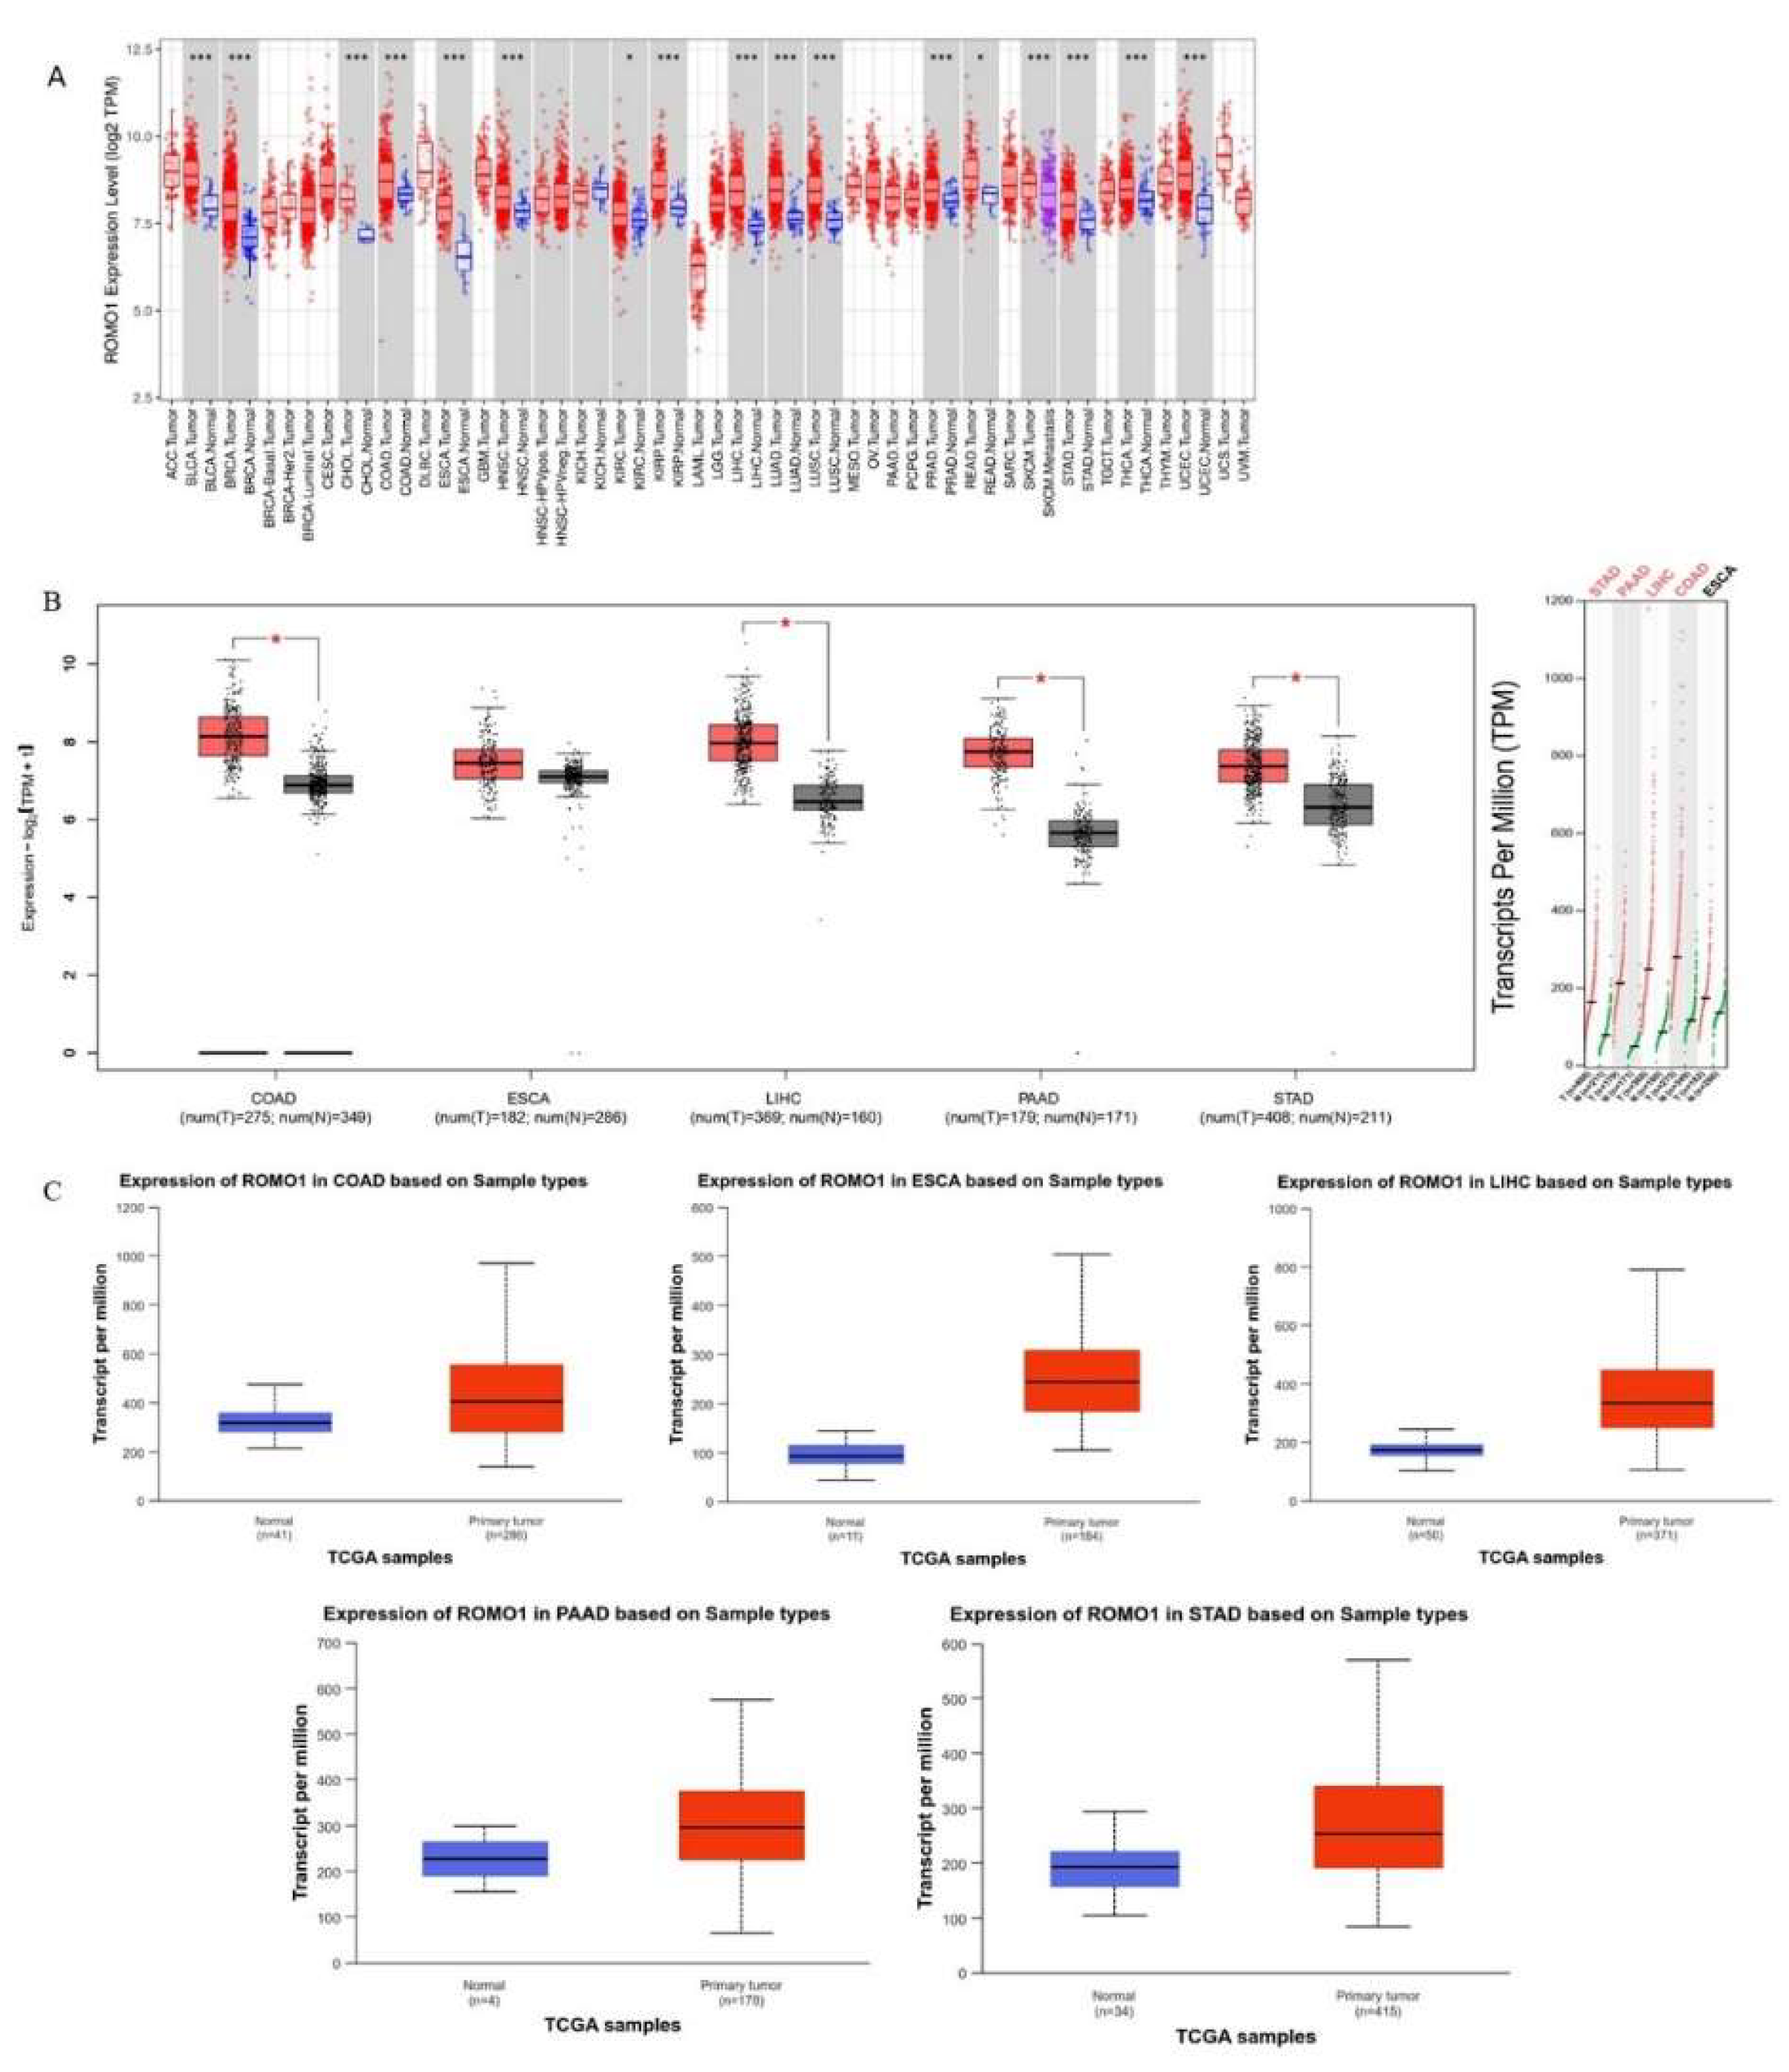
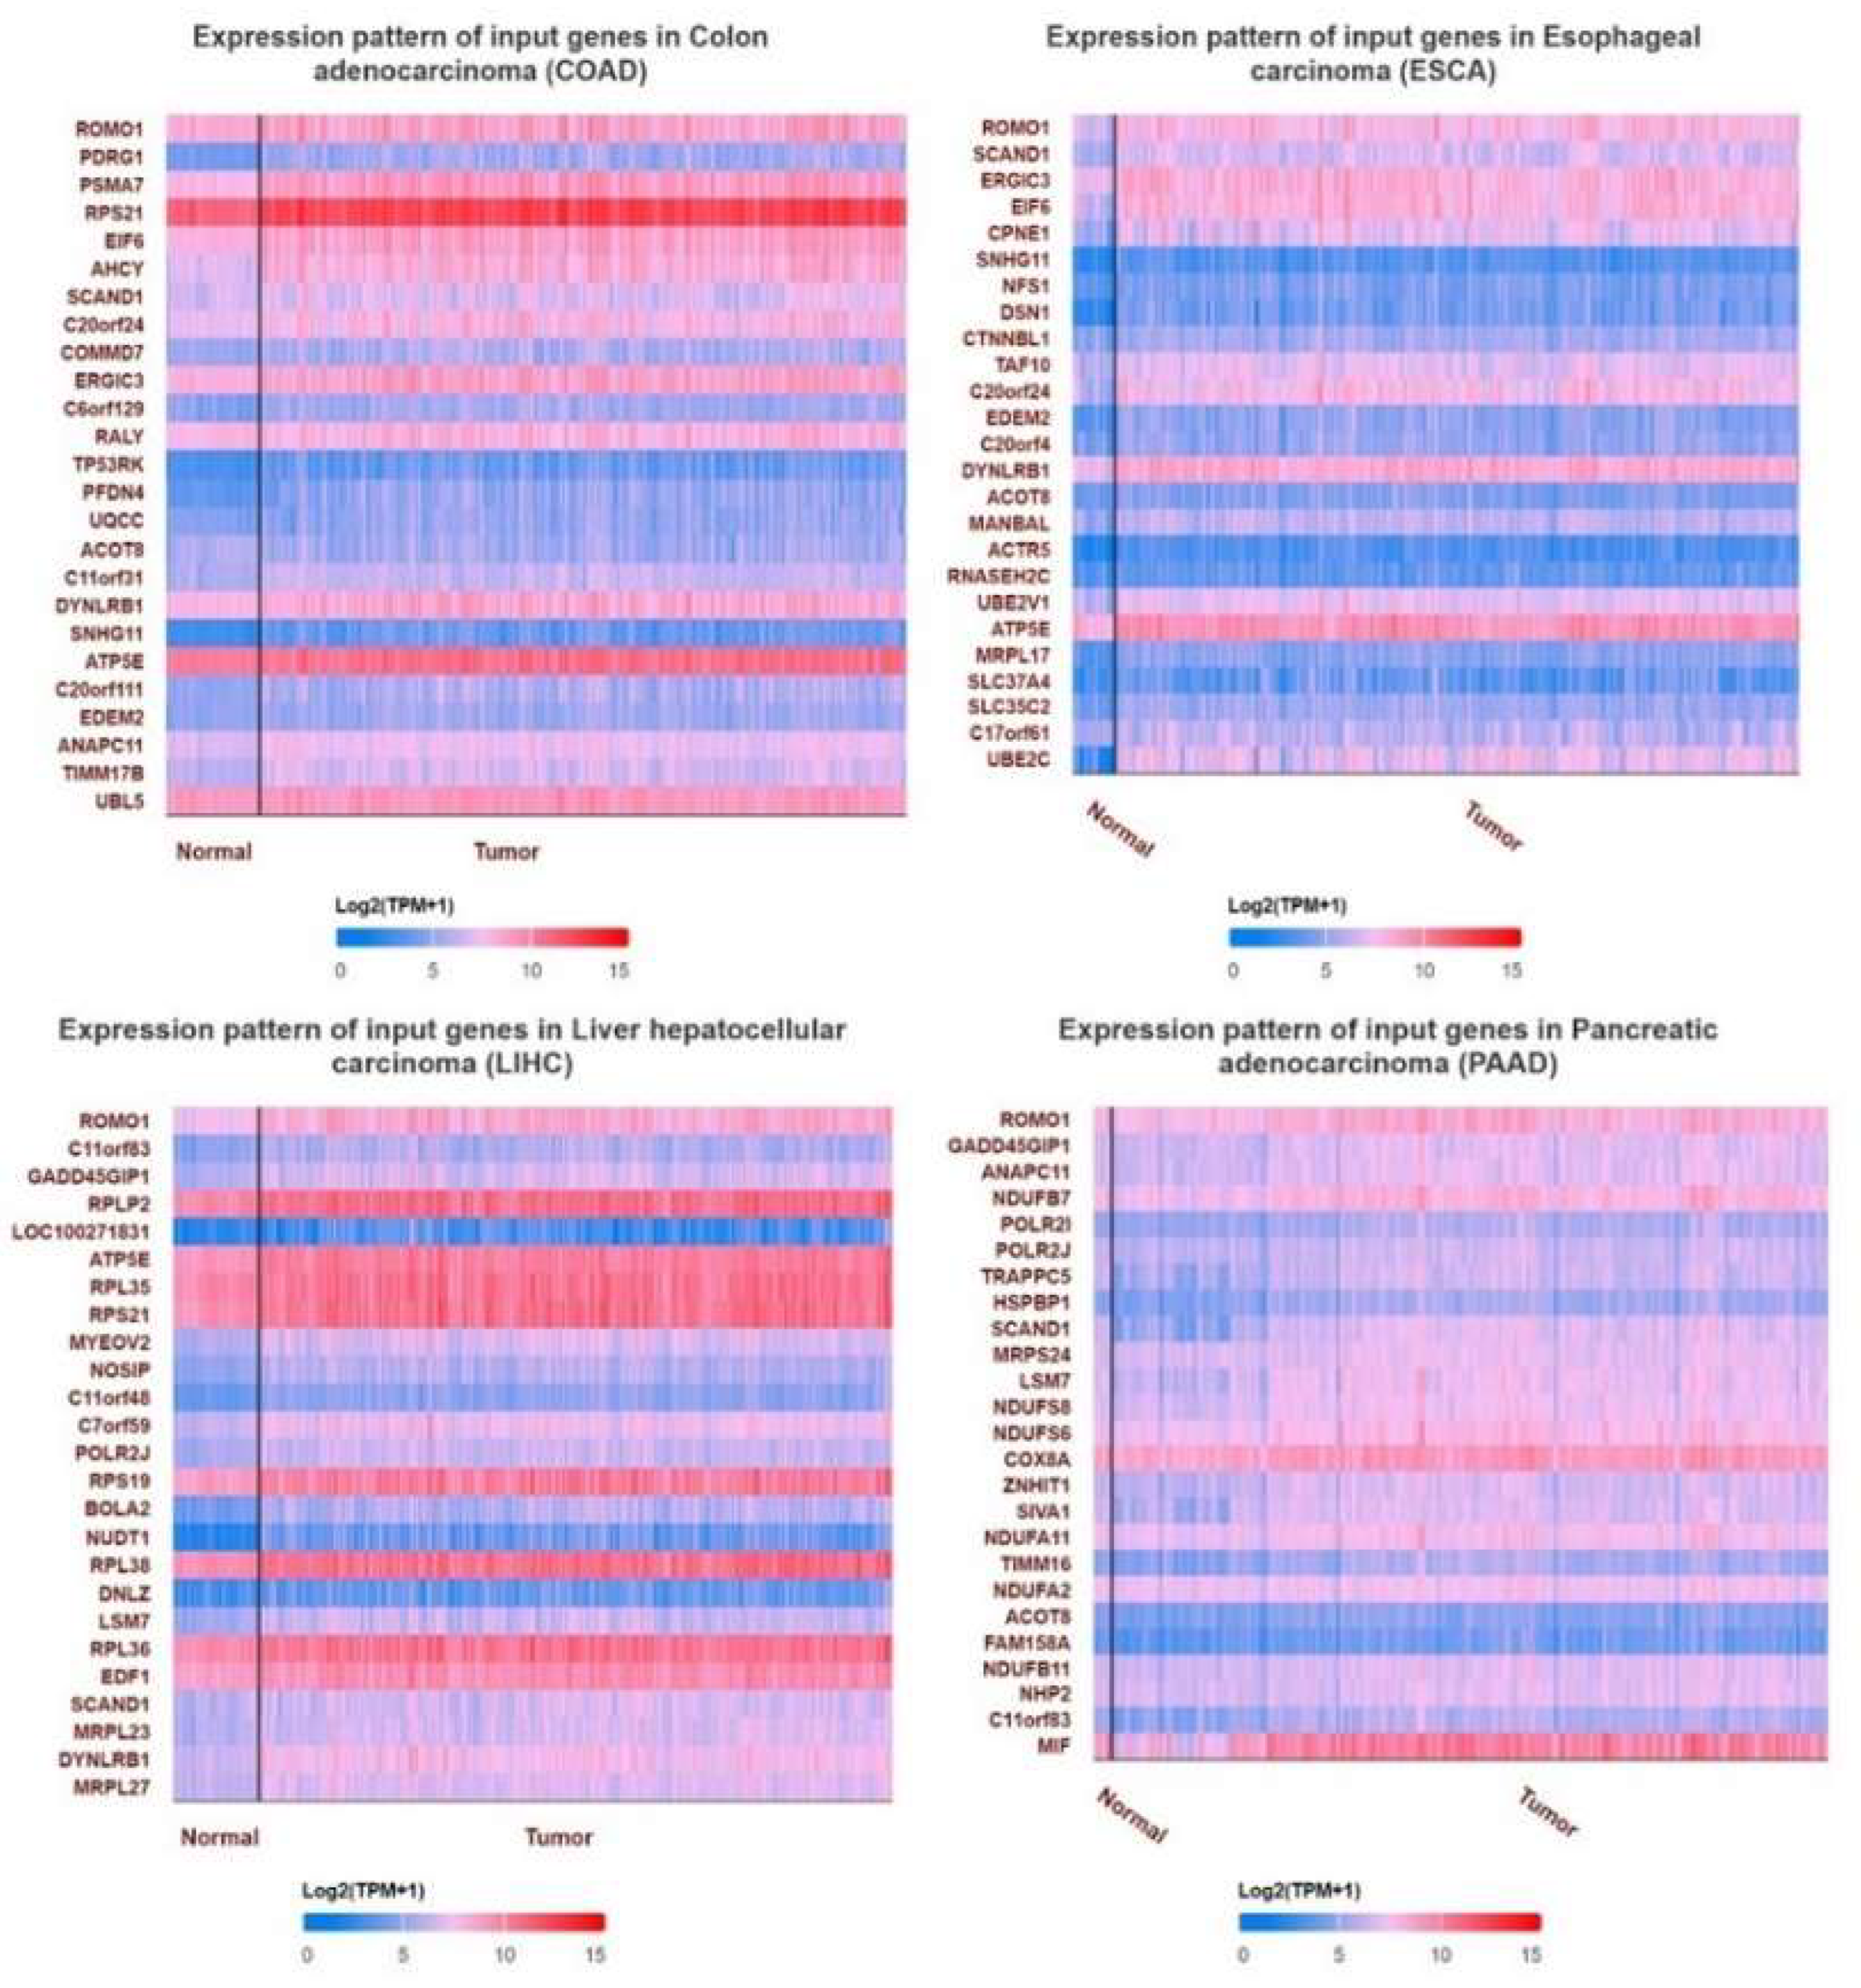
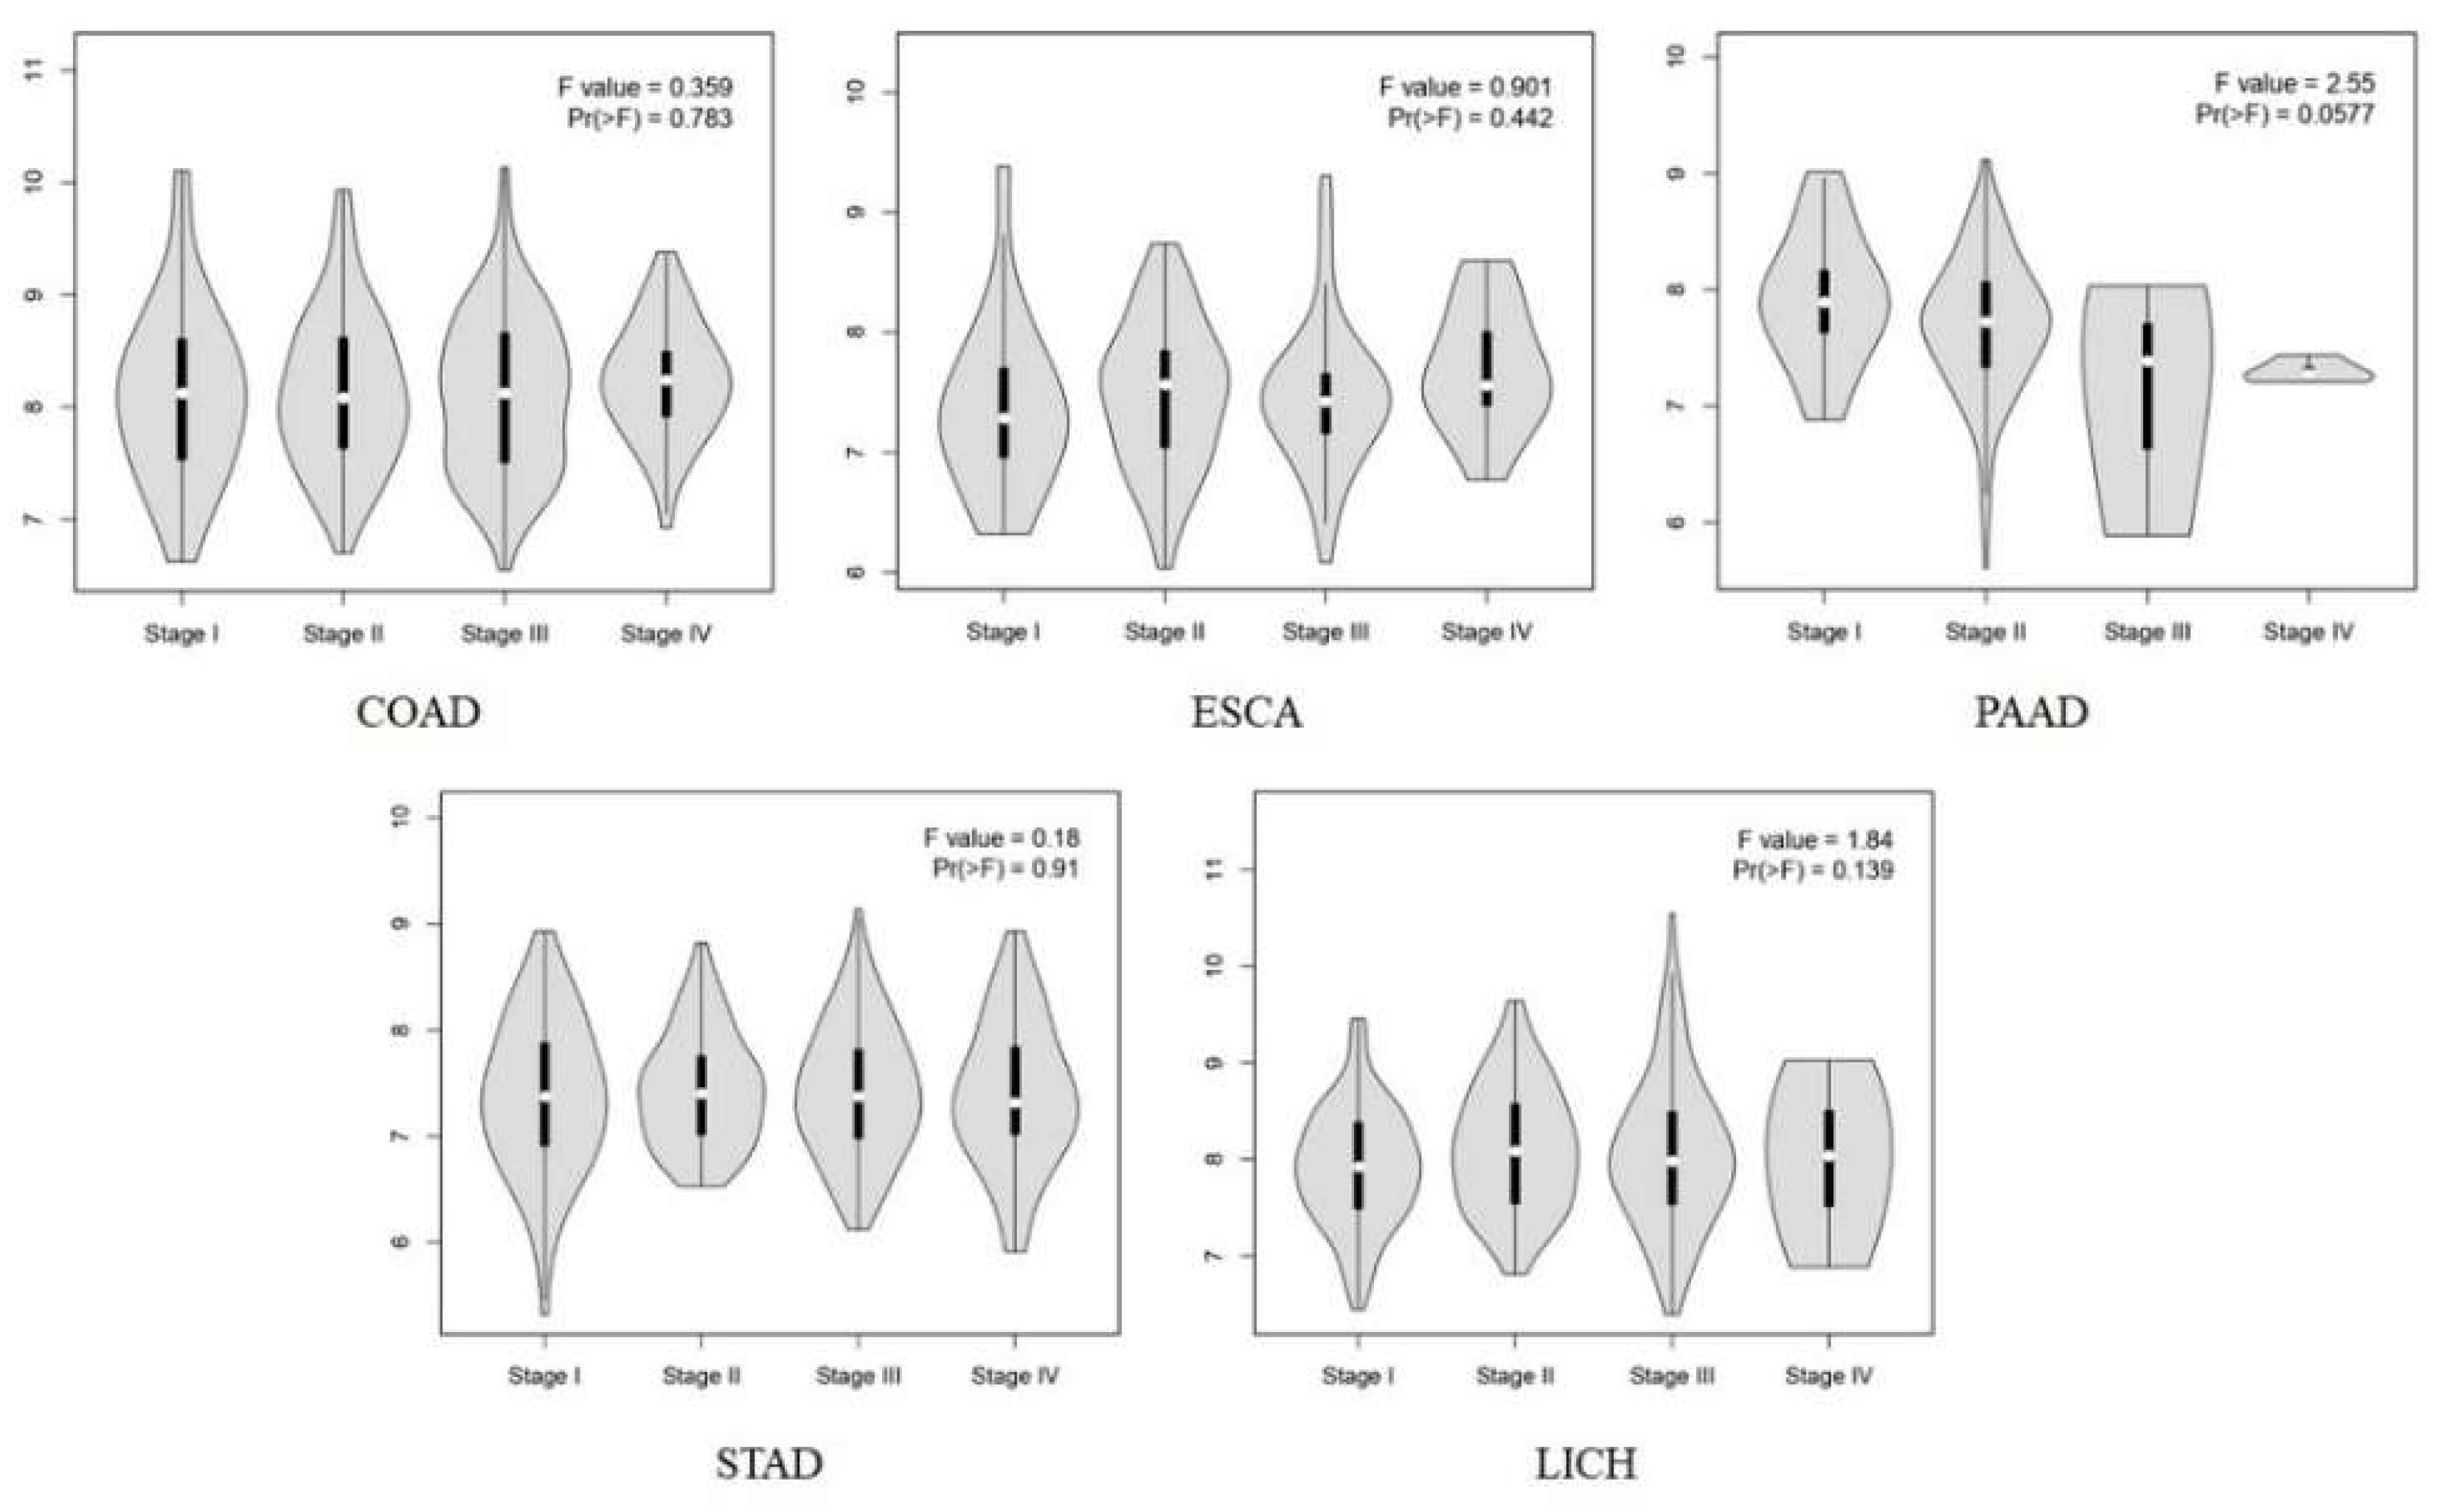
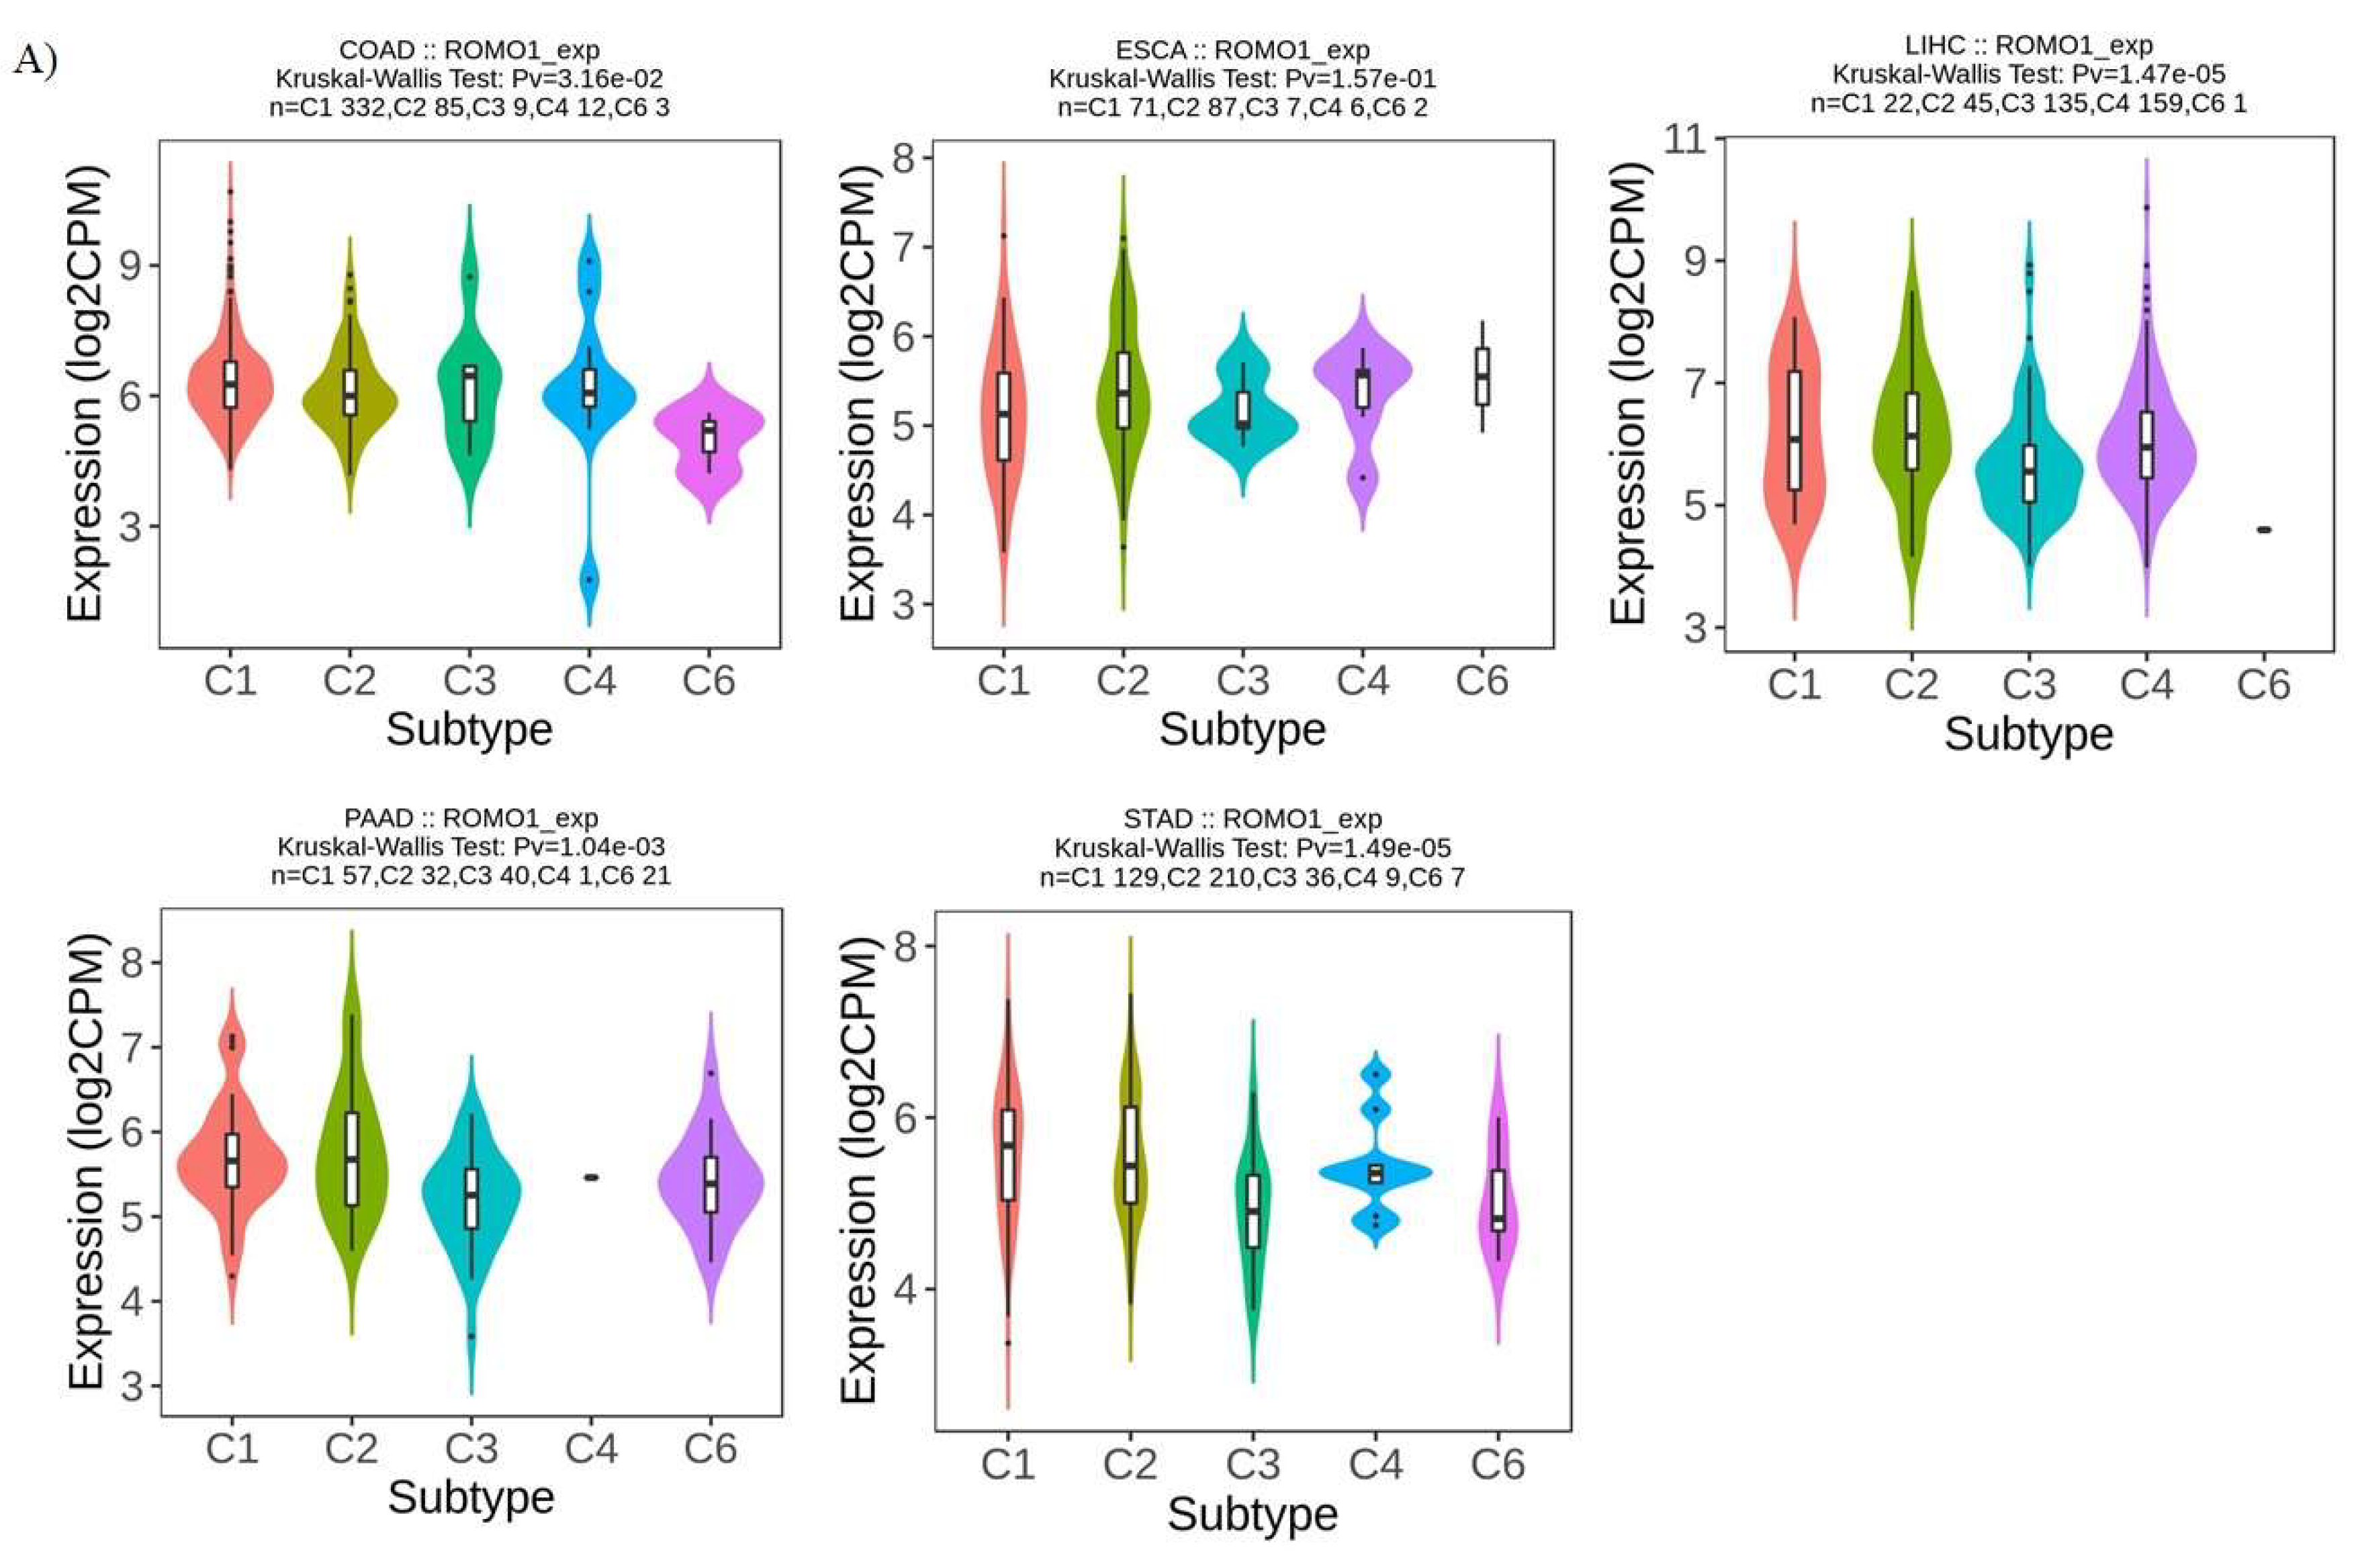
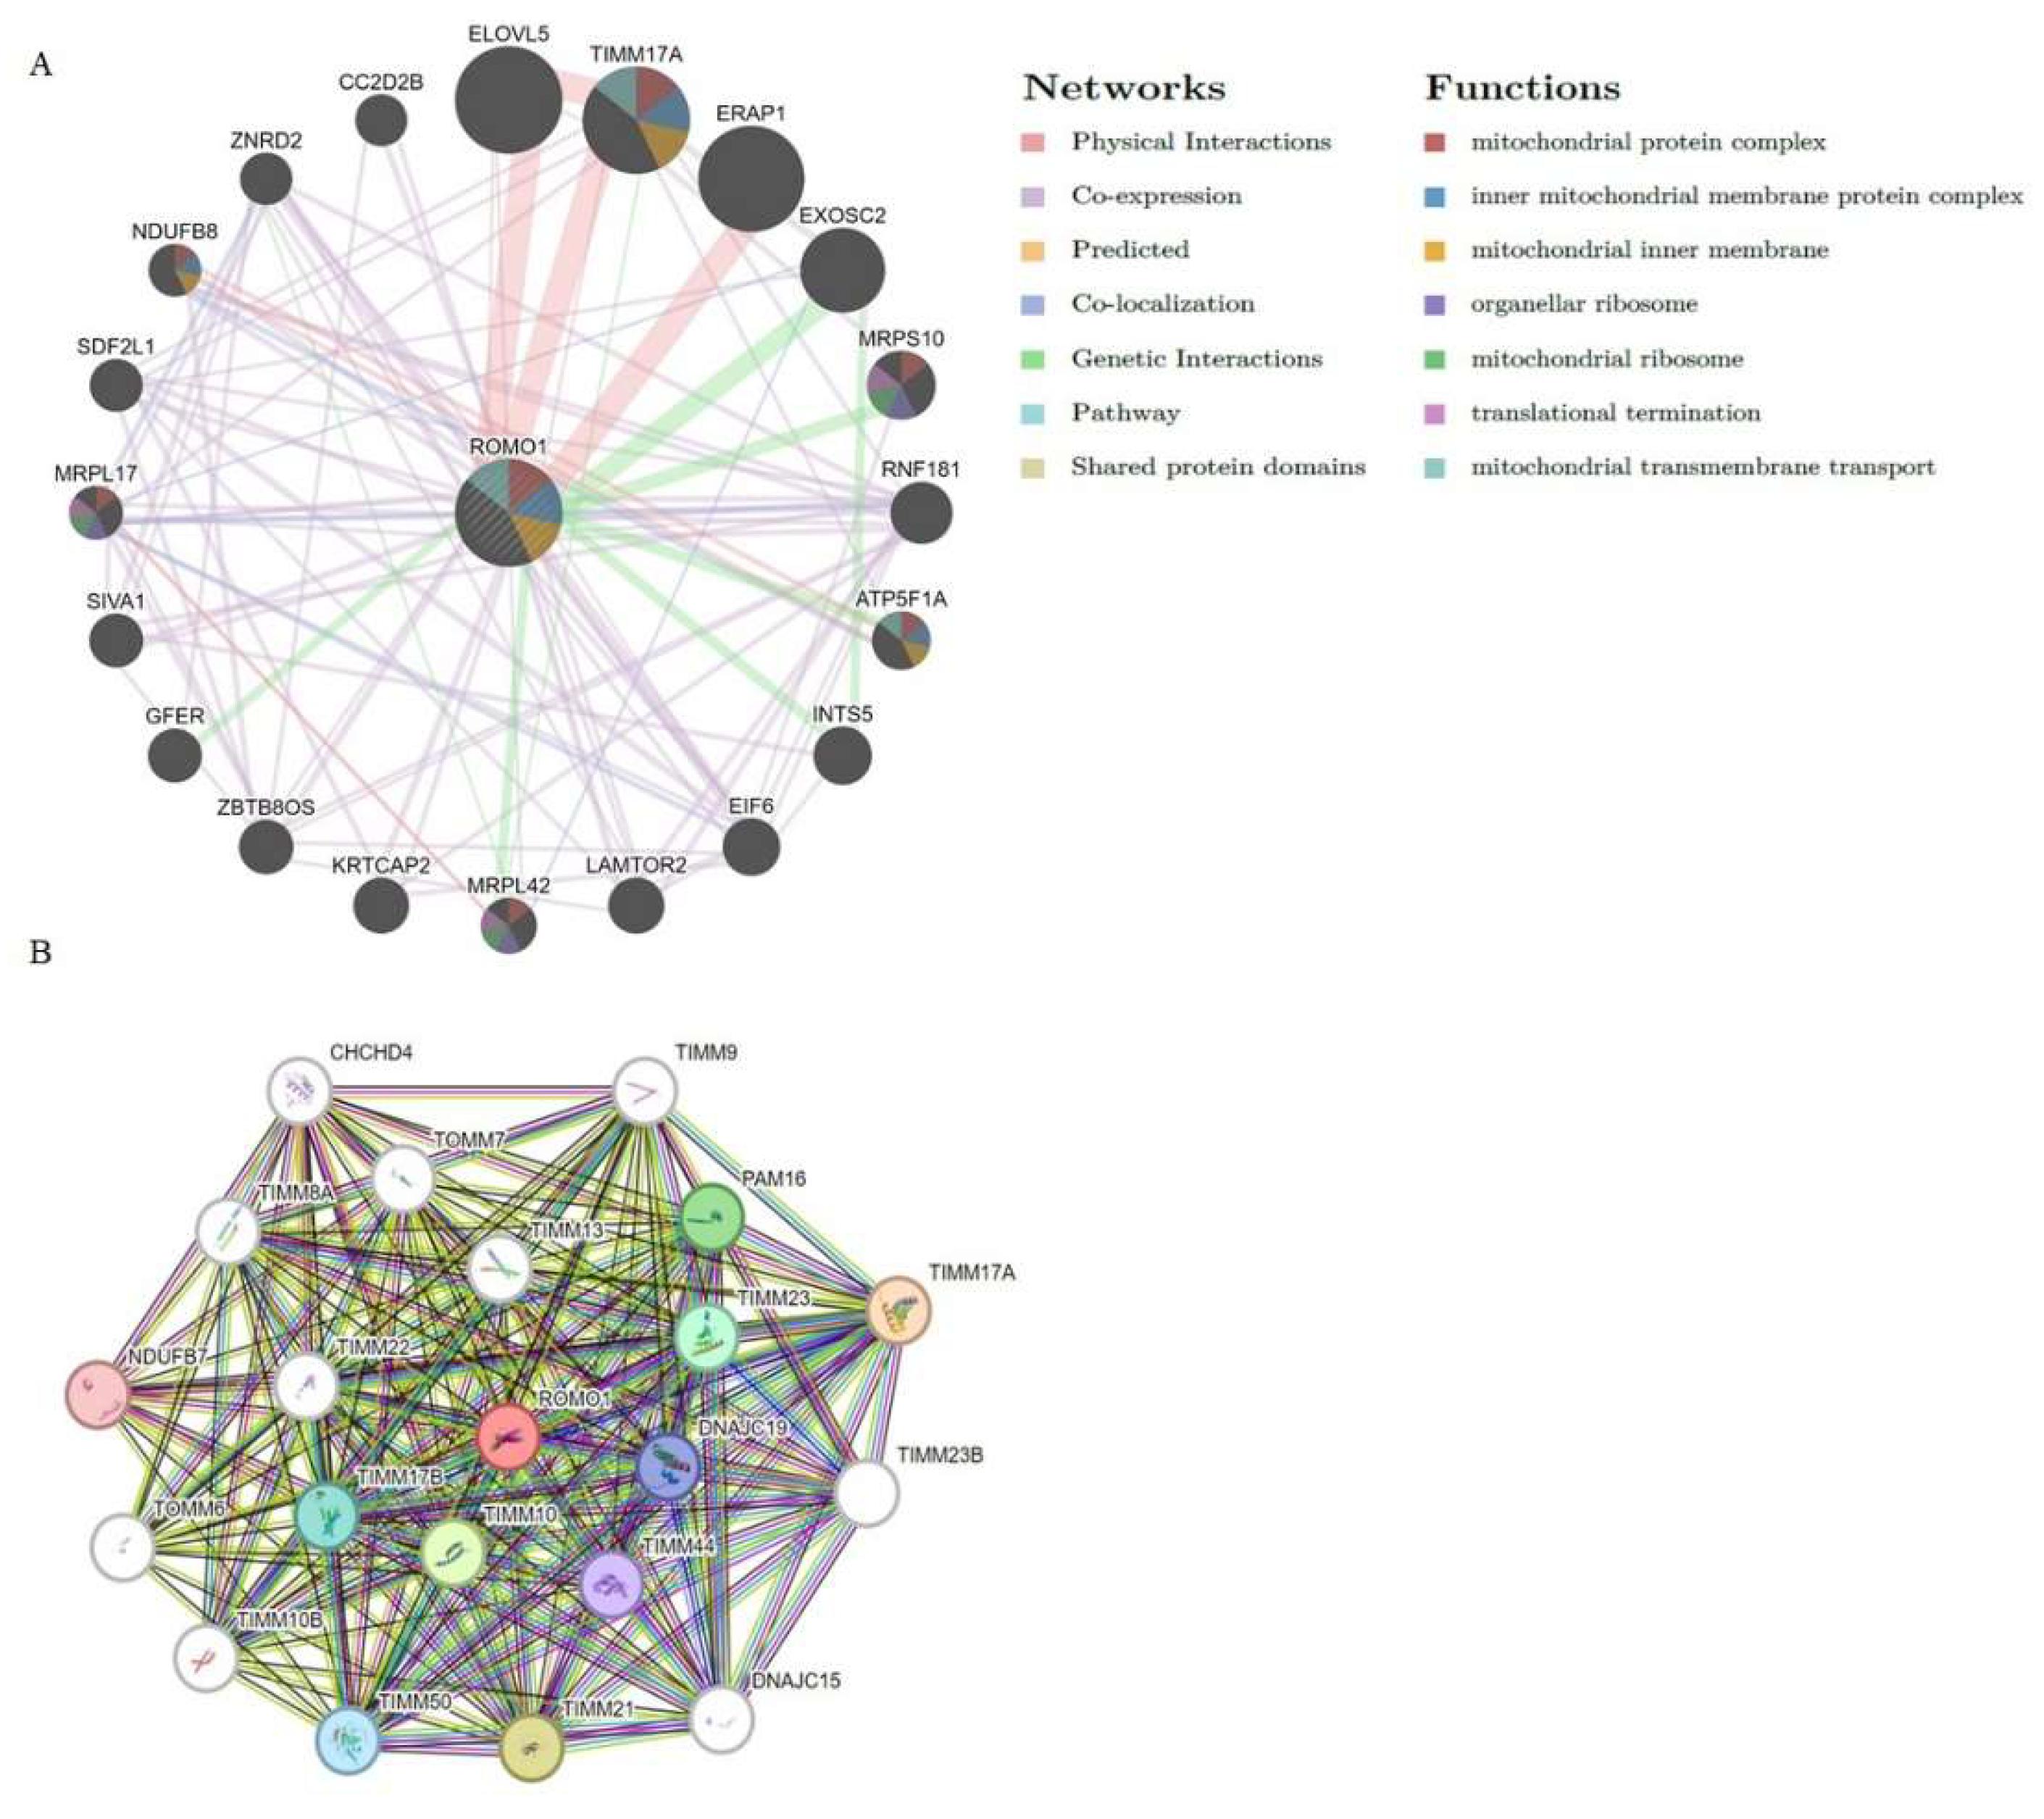
Background:Gastrointestinal tract cancers account for approximately one-third of cancer-related deaths. Early diagnosis and effective treatment are the most important ways to prevent cancer-related morbidity and mortality. ROMO1 has been shown to play an important role in many types of cancer. However, the biological function of ROMO1 is still poorly understood in gastrointestinal system cancers. The aim of this study is to reveal the expression change and oncogenic role of ROMO in gastrointestinal system cancers. Methods:Gene Expression Profiling Interactive Analysis (GEPIA), UALCAN, TIMER, GeneMANIA, TISIDB and STRING were applied to assess the biological function of ROMO1 in gastrointestinal cancers (Colon adenocarcinoma (COAD), Esophageal carcinoma (ESCA), Liver hepatocellular carcinoma (LIHC), Pancreatic adenocarcinoma (PAAD), and Stomach adenocarcinoma (STAD)). Results:ROMO1 is significantly increased in gastrointestinal cancers and overexpression of ROMO1 was associated with clinicopathological features. In addition, ROMO1 has been found to be closely associated with between tumor-infiltrating immune cells in gastrointestinal cancers. ROMO1 is closely related to the inner mitochondrial membrane proteins (TIMM) family. Conclusison: The study revealed that ROMO1 is of significant clinical importance for gastrointestinal cancers and may have potential clinical utility in treatment and prognosis.

Keywords: 
;  ;  

1. Introduction

Cancer is a heterogeneous disease characterized by processes such as excessive proliferation of cells, dysfunction of cell death mechanisms, invasion, and metastasis [1]. Today, it is one of the leading health problems due to its incidence and mortality rate [2]. Gastrointestinal (GI) tract cancers are a group of cancers of the GI tract and digestive organs, such as the stomach, heart, bile ducts, pancreas, esophagus, colon, and rectum [3].GI accounts for almost one-third of cancer-related deaths. It has been reported that GI accounted for approximately 26% of total cancer incidence and approximately 35% of all cancer-related deaths in 2018 [4]. GI is estimated to reach 7.5 million new cases and 5.6 million deaths by 2040 [5]. Despite advances in technology and new treatment strategies, GI cancers remain a significant global burden to human health [6, 7]. Therefore, it is essential to study the development of GI cancers at the molecular level, identify the genetic factors that play a role in their pathogenesis, and improve our understanding of their early diagnosis and treatment.
Reactive oxygen species modulator 1 (ROMO1) is a mitochondrial inner membrane channel protein that plays a role in reactive oxygen species (ROS) production and regulation [8, 9]. It also plays a critical role in maintaining the morphology of mitochondria and the integrity of their inner membrane structures [9, 10]. ROS and oxidative stress are the most important causes that play a role in the development and progression of cancer [8,11].ROMO1, a protein that regulates ROS production, has been shown to play an essential role in many types of cancer [8, 12]. ROS can lead to proliferation and metastasis in various types of cancer through different pathways, including NF-κB, ERK, MAPK, p53, and PI3-K [9, 13-15]. For example, ROMO1 has been associated with poor prognosis in colorectal cancer patients [13], and poor survival in non-small cell lung cancer (NSCLC) patients [16]. ROMO1 has been indicated to regulate ROS production and cell growth in gliomas [17].
In clinical laboratories, a number of tumor markers are used to diagnose and identify a neoplasm. However, according to the information mentioned above, this ROMO1 may have properties that can be used as a tumor marker in diagnostic laboratories and also as a treatment option. Since ROMO1 is associated with the level of oxidative stress and ROS production in cancer cells, and by regulating its expression, it can reduce cancer symptoms and better response to chemotherapy [11]. Therefore, it is important to study the effects of ROMO1.
These days, bioinformatics analyses using big sample sizes and sophisticated algorithms are far more representative and dependable due to the quick development of biological databases. The use of bioinformatic analysis to analyze the course of cancer and pinpoint prospective treatment targets has increased significantly in recent years. These investigations have the advantage of being able to overcome conflicting results seen in the literature because of their various sample sizes, microarray technology, and sequencing platforms [18].
A thorough comprehension of the molecular mechanism underlying GI pathogenesis is probably going to offer justification for creating and constructing a suitable treatment. Herein, we used a variety of bioinformatics techniques to investigate romo1 expression profiles, diagnostic value, genetic alteration, protein methylation level, immunological infiltration, and functional states in GI. This comprehensive analysis revealed the oncogenic role of ROMO1 in gastrointestinal tract cancers, the potential value of ROMO1 in the diagnosis of GI, the underlying molecular mechanisms of romo1 in GI pathogenesis and the effects of romo1 in anti-tumor immune response and therapeutic target in the treatment of GI.

2. Materials and Methods

2.1. Expression Analysis of ROMO1

The “Diff Exp” module of the Tumor Immunity Evaluation Resource (TIMER)website (http://timer.cistrome.org/) was used to investigate various primary tumor types and normal control tissues in the TCGA database [19]. Gene Expression Profiling Interactive Analysis, version 2 (GEPIA2) l (http://gepia2. cancer- pku. cn/# analy sis), and UALCAN tools (http://ualcan.path.uab.edu/) were used to analyze the gene expression of ROMO1 in gastrointestinal cancers (Colon adenocarcinoma (COAD), Esophageal carcinoma (ESCA), Liver hepatocellular carcinoma (LIHC), Pancreatic adenocarcinoma (PAAD), and Stomach adenocarcinoma (STAD)). Using the gene expression profiling database GEPIA(http://gepia.cancer-pku.cn/) database, we identified changes in the expression of identified genes between GIand healthy tissue [20]. UALCAN is a fast and effective online analysis and mining website, mainly based on the TCGA database related cancer data, and can provide a large number of comprehensive analysis, including gene expression, survival analysis, and epigenetic regulation [21].

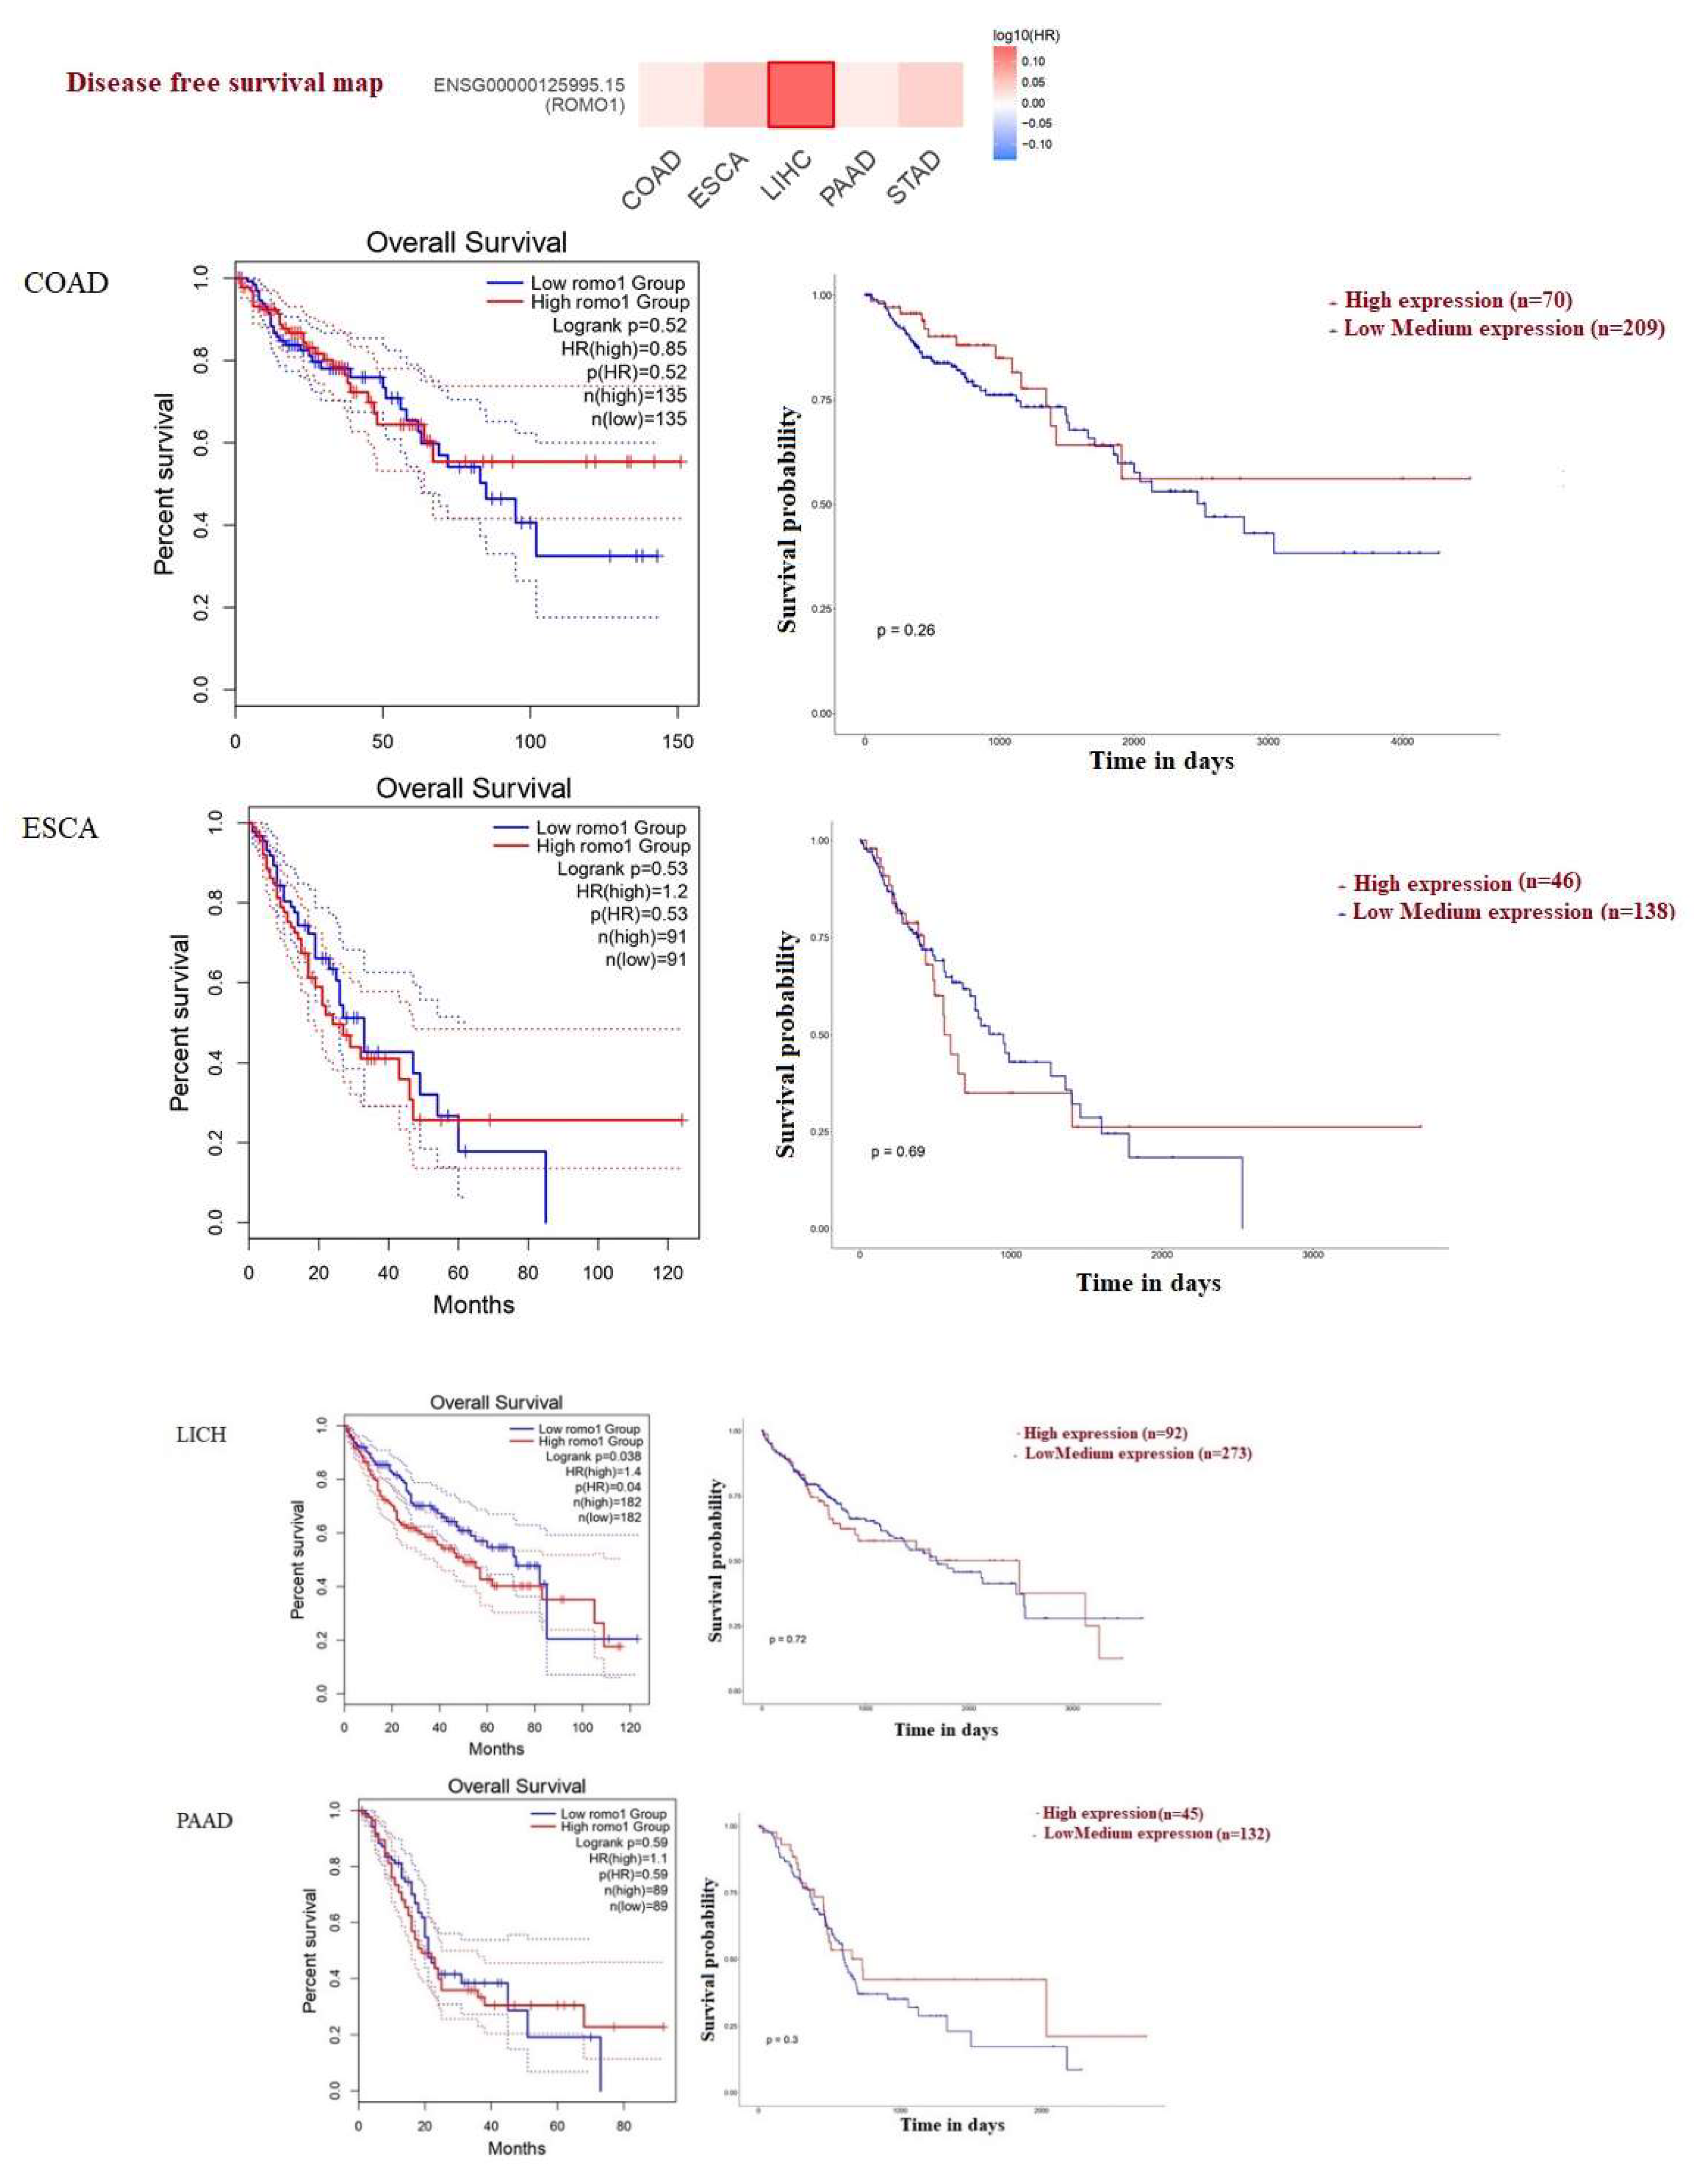
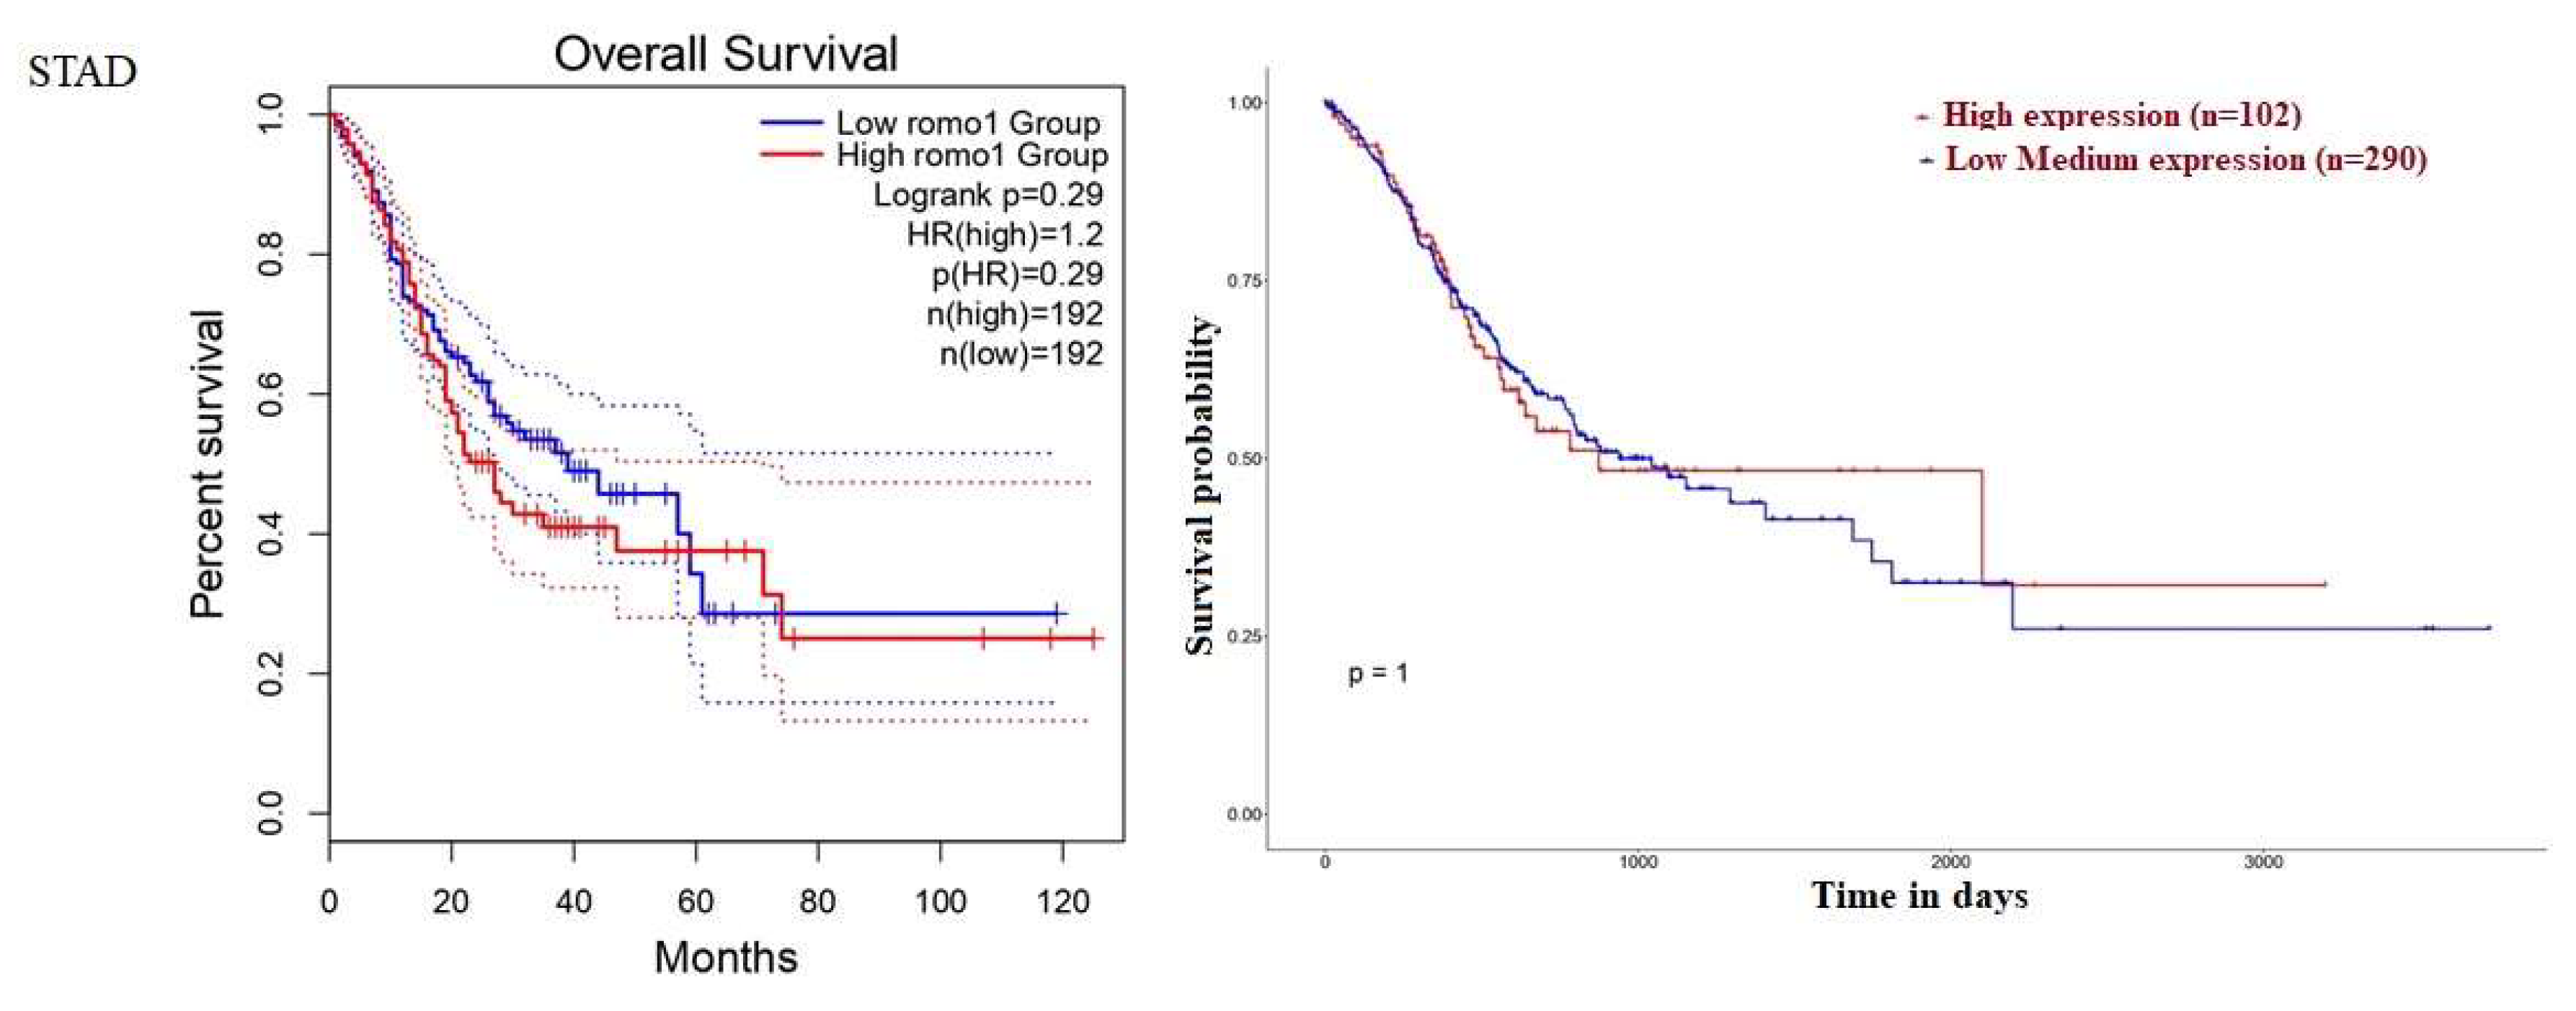
2.2. Survival Analysis of ROMO1

Overall survival (OS) map data of ROMO1 for COAD, ESCA, LIHC, PAAD and STAD were obtained from the “Survival Map” module in GEPIA with a 50% cut-off value to separate groups into high expression and low expression, and Disease-free survival (DFS) was determined [20]. UALCAN has made it possible for users to assess the expression of protein-coding genes and how it affects patient survival in 33 different cancer types. Additionally,the UALCAN online tool was used to perform survival analysis of ROMO1 in the same cancer types [21].

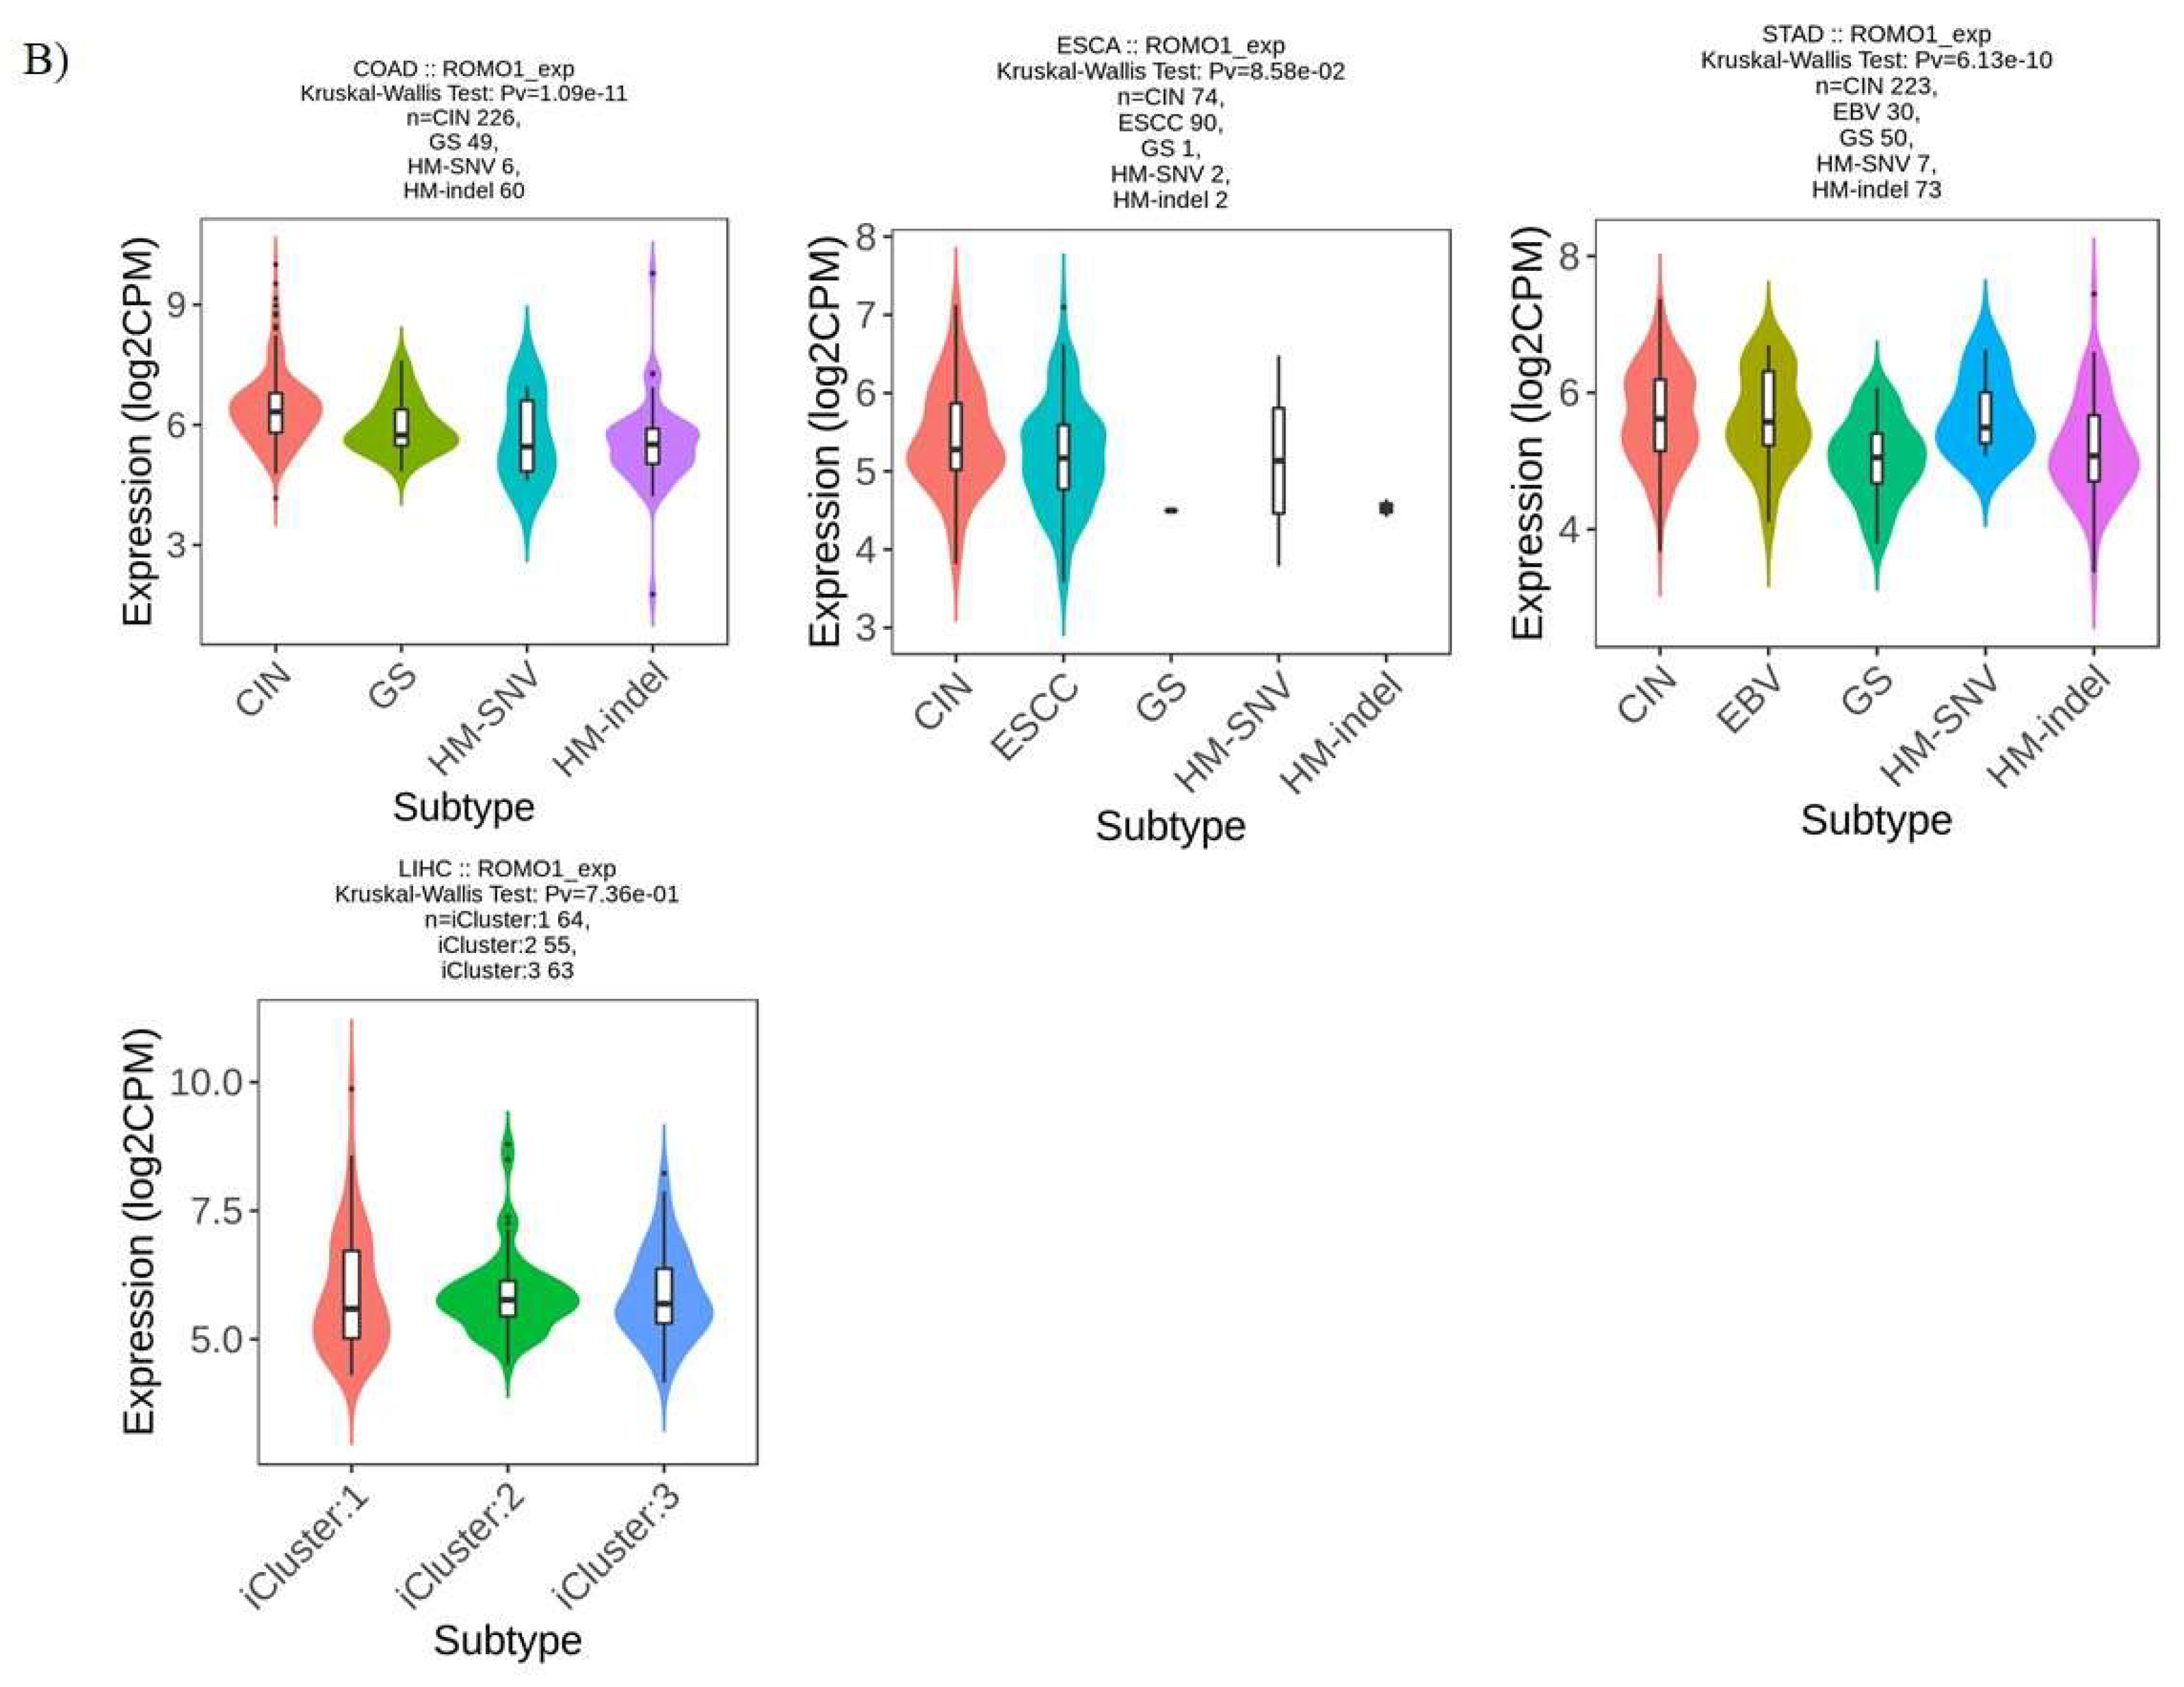
2.3. ROMO1 Expression in Molecular and Immune Subtypes of GI

Tumor-Immune System Interaction Database (TISIDB) is an online platform that integrates many heterogeneous data sources for tumor and immune system interaction. TISIDB (http:// cis. hku. hk/ TISIDB/), a comprehensive database, can be used to examine how neoplasms and the immune system interact [22]. The TISIDB database was used to analyze the association between ROMO1 expression and molecular or immune subtypes in COAD, ESCA, LIHC, PAAD, and STAD.

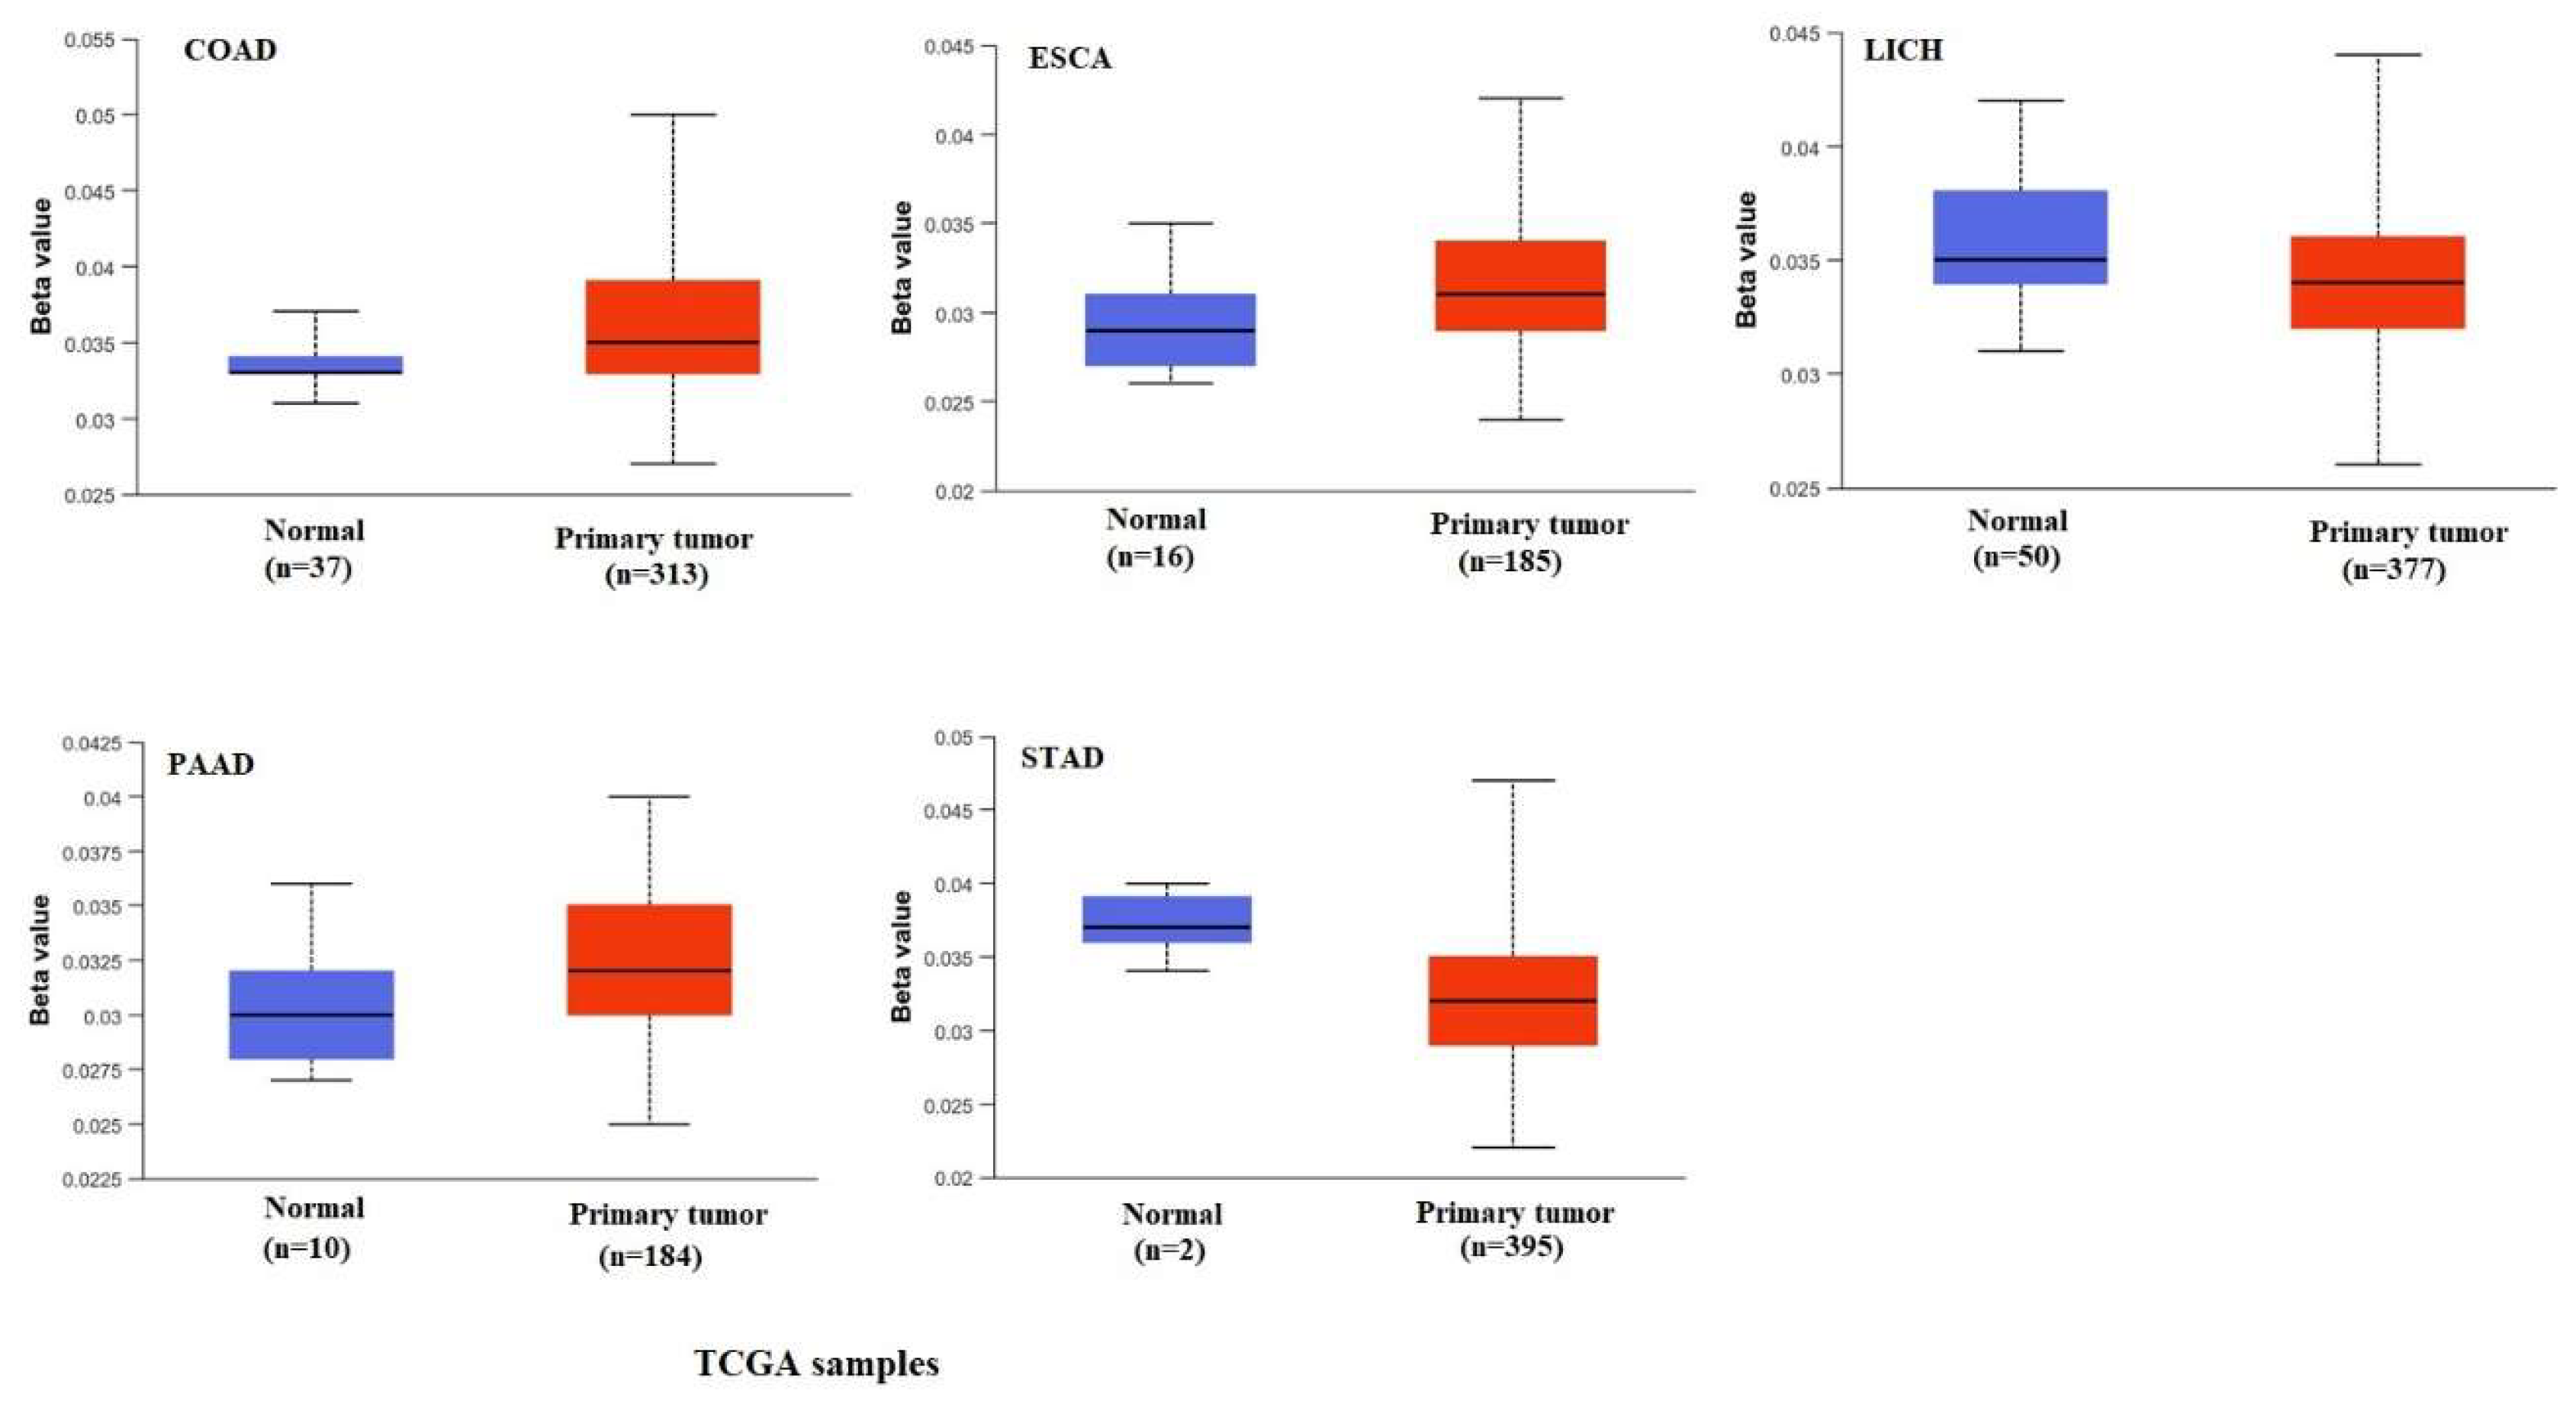
2.4. DNA Methylation Analysis

Methylation level of ROMO1 in GI and corresponding normal tissues was investigated in the UALCAN database [21]. In this database, you can set the conditions for filtering and data mining. The screening conditions set in this study are: Gene: ROMO1; Cancer Type: COAD, ESCA, LIHC, PAAD, and STAD; Data Type: TCGA dataset.The Beta value indicates level of DNA methylation ranging from 0 (unmethylated) to 1 (fully methylated).

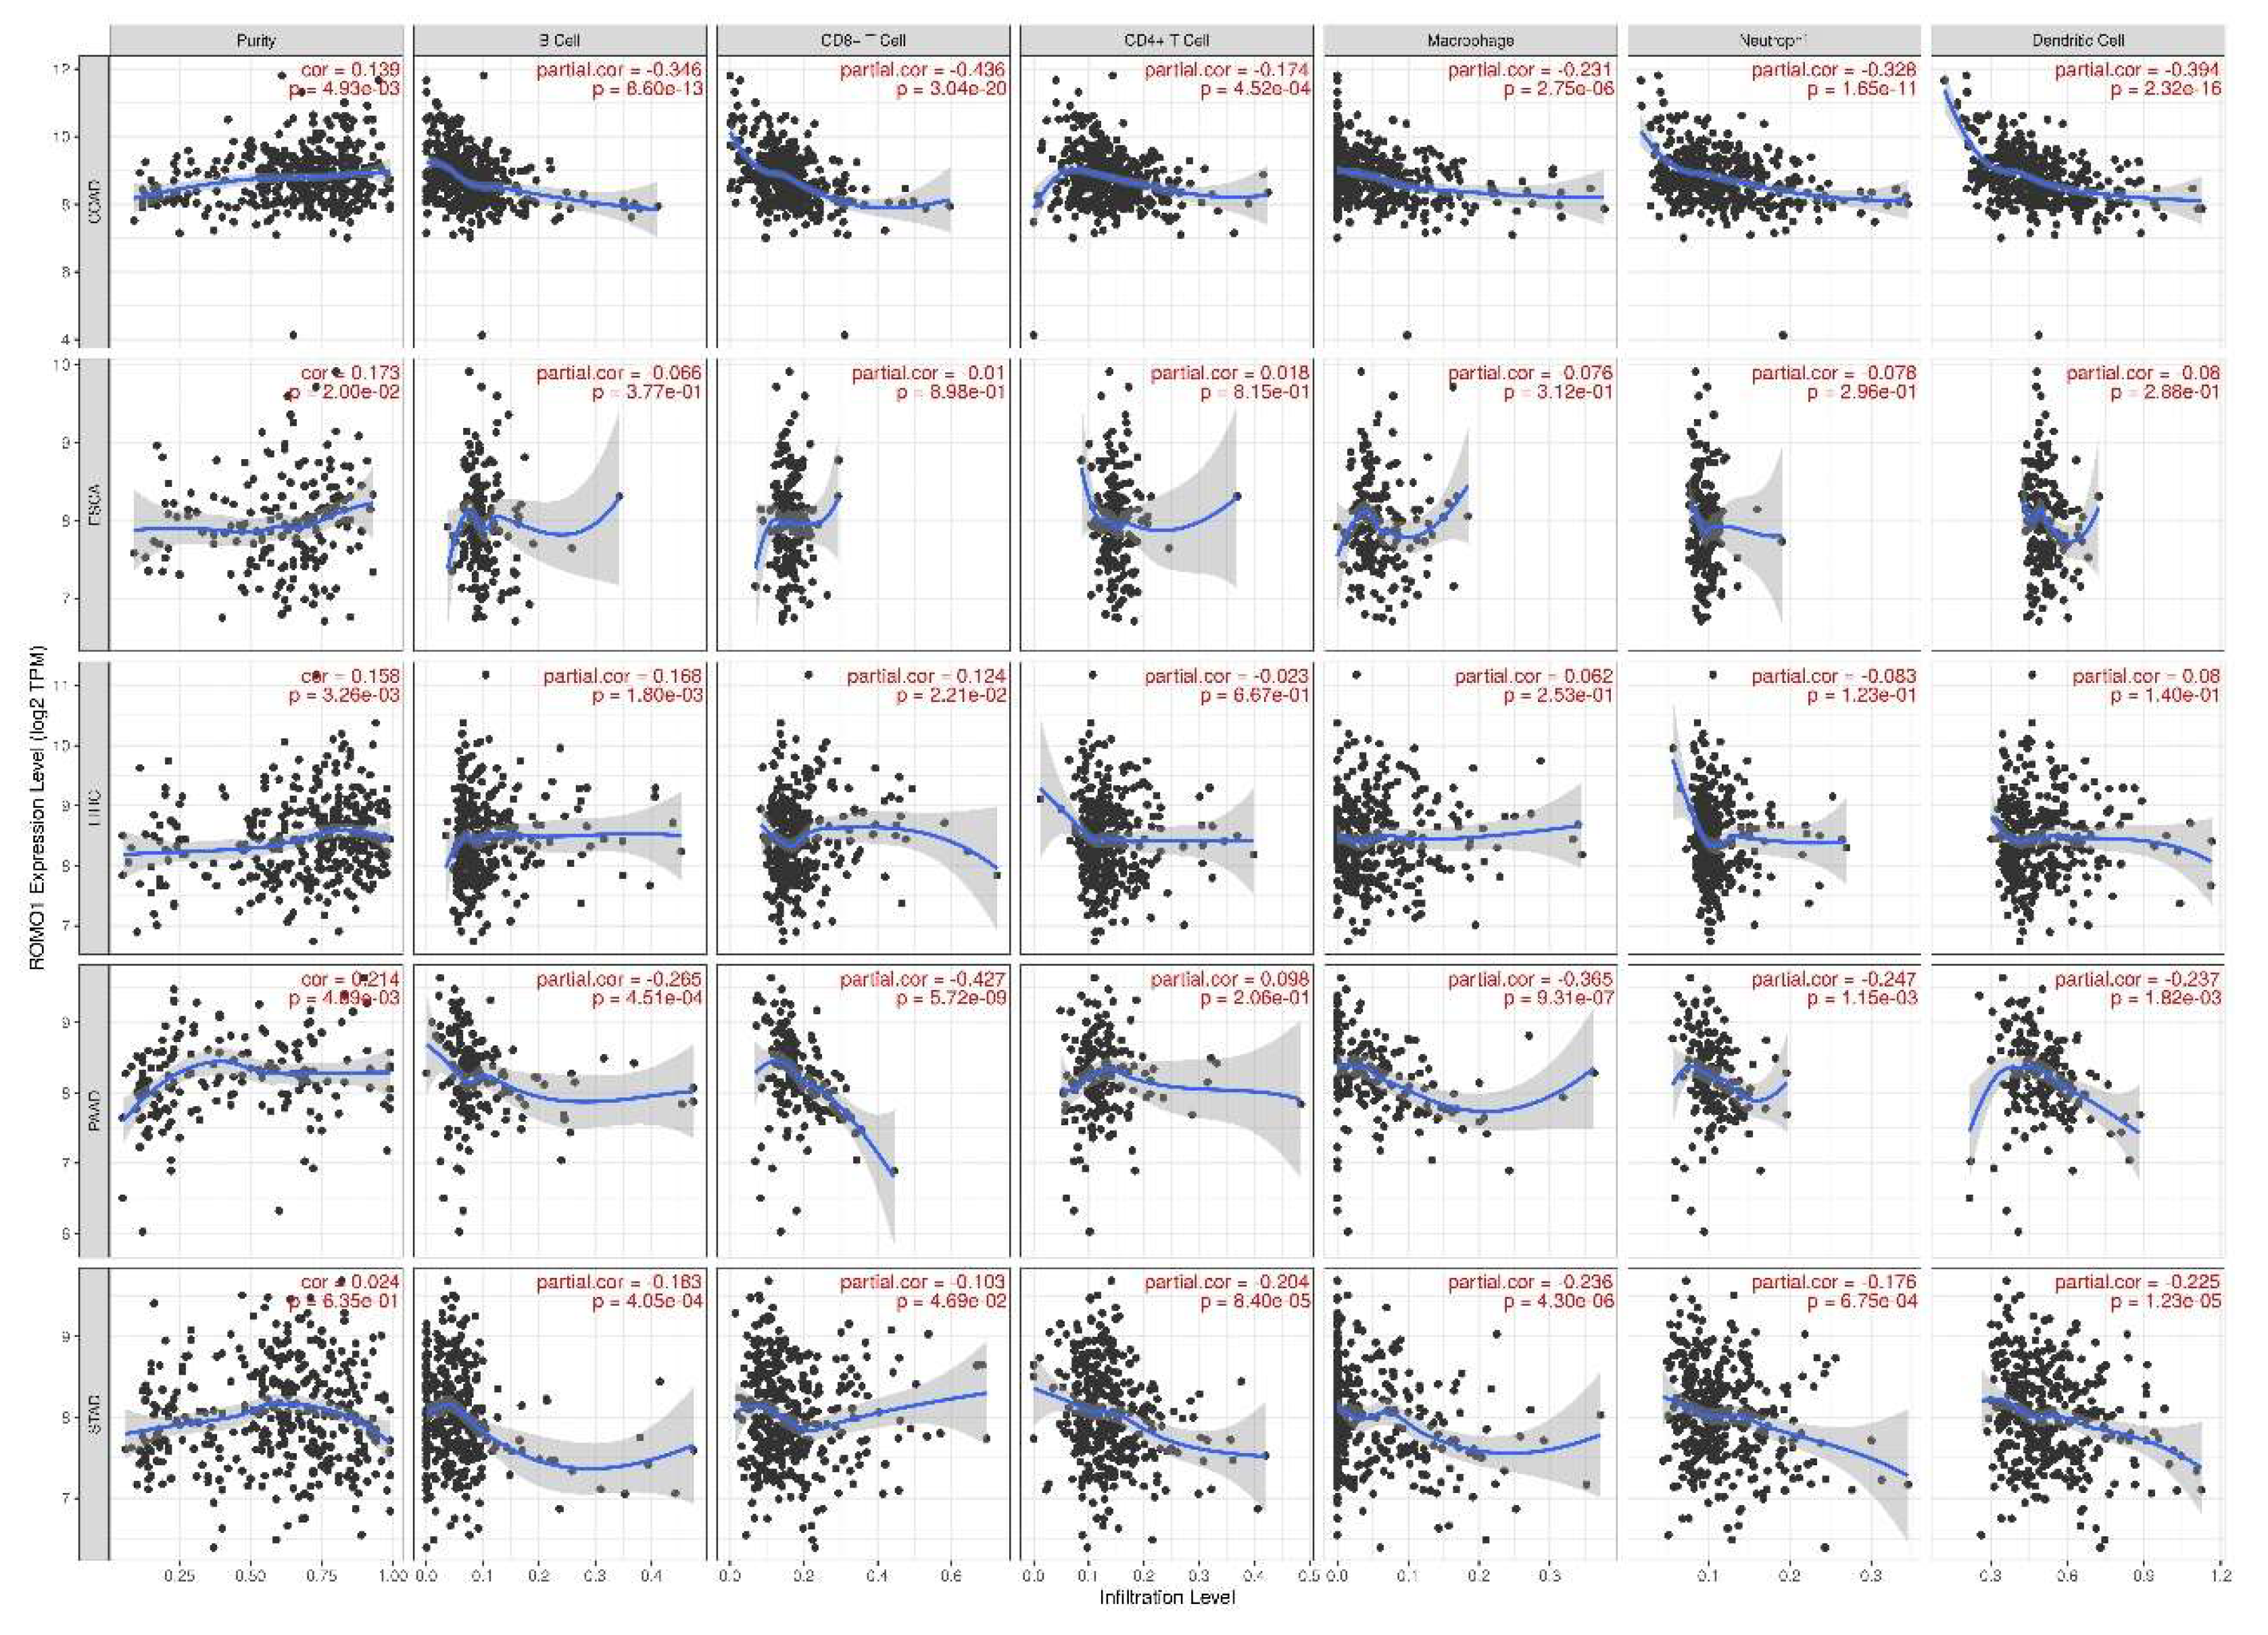
2.5. Correlation Between ROMO1 and Immune Infiltration

TIMER is a visualization website that can analyze immune infiltration in various tumors [19]. The correlation between ROMO1 and the abundance of six immune infiltrates (B cells, CD4+ T cells, CD8+ T cells, Neutrophils, Macrophages and Dendritic cells) was evaluated. The TIMER2.0 web server was used to investigate the correlation between ROMO1 and the infiltration of immune cells in COAD, ESCA, LIHC, PAAD, and STAD in TCGA. The findings were considered reliable when similar results were obtained using at least two algorithms. p values were calculated by Spearman’s rank correlation test.

2.6. Analysis of the Gene and Protein That Interact with ROMO1 in Pan-Cancer

STRING database (http://www.string-db.org/) was used to construct protein interaction networks of ROMO1 in cancer, and GeneMANIA (http://genemania.org/) was employed to analyze the interaction gene with the ROMO1. The STRING ( http://www.string-db.org/), database is a protein-protein association network that provides all known and predicted information about the direct (physical) and indirect (functional) relationships that occur between different proteins [23]. Another online resource, GeneMANIA (http://genemania.org/) is a database consisting of an intuitive interface for gene function predictions and interactions of genes with each other [24].

3. Results

Initially, we examined the mRNA and protein expression levels of ROMO1 in various GI.
We used the TIMER database to examine the expression of ROMO1 in different cancer types. ROMO1 was found to have high expression in COAD, ESCA, PAAD, LIHC, and STAD (Figure 1A). In addition, analysis of ROMO1 mRNA expression between normal tissues and cancers using GEPIA revealed that ROMO1 showed significantly higher expression in COAD, ESCA, PAAD, LIHC and STAD (Figure 1B). Then, UALCAN was applied to determine the protein expression level of ROMO1. ROMO1 was also be highly expressed in COAD, ESCA, PAAD, LIHC, and STAD (Figure 1C). Overall, these results indicate that ROMO1 expression is upregulated in gastrointestinal tract cancers. Moreover, a heatmap image of ROMO1, and related genes in COAD, ESCA, LIHC and PAAD is shown in Figure 2. 25 genes positively correlated with ROMO1 were shown in COAD, ESCA, LIHC and PAAD. These heatmaps were visualized as scatter plots using Pearson correlation listcoefficient. Genes with extremely low expression (Median TPM < 0.5) were filtered from the list.
To determine whether ROMO1 was differentially expressed among pathological stages, we first analyzed the correlations between mRNA expression of ROMO1 and pathological stages among gastrointestinal tumors using GEPIA2. The results showed that ROMO1 expression was not significantly associated with the pathological stage of gastrointestinal cancer types (p < 0.05, Figure 3).
Correlation analysis was performed between the expression of ROMO1 in intestinal cancers and molecular or immune subtypes from the TISIDB database. For immune subtypes of GI (C1: wound healing, C2: IFN-gamma dominant, C3: inflammatory, C4: lymphocyte depleted, C5: immunologically silent, C6: TGF-b dominant), ROMO1 expression was observed to be significantly different (Figure 4A).The results showed that ROMO1 was differentially expressed in GI for molecular subtypes (Figure 4B).
It has been established that DNA methylation is crucial to the development and spread of malignancies. Furthermore, DNA methylation across the genome is an epigenetic alteration that helps control genes lin-ked to cancer in a number of malignancies.The underlying roles of ROMO1 methylation in various cancers remain largely unclear.We evaluated the methylation level of ROMO1 in normal and GI tissues using the UALCAN database. In our study, we demonstrated the decreased promoter methylation level of ROMO1 for LICH., STADand increased promoter methylation level of ROMO1 for COAD, ESCA, and PAAD (Figure 5).Median values of ROMO1 promoter methylation level for normal and tumor tissue COAD (Median:0.033, 0.035), ESCA(Median: 0.029, 0.031), LICH (Median:0.035, 0.034), PAAD (Median:0.03, 0.032), and STAD (Median:0,037, 0,032).
We used GEPIA andULACAN to evaluate the survival and prognostic value of ROMO1 in COAD, ESCA, LICH, PAAD, and STAD. A high expression of ROMO1 was not related to poor OS in COAD, ESCA, PAAD, and STAD. High expression of ROMO1 (P=0.038) predicted poor OS and high expression was associated with poor disease-free survival (DFS) in LICH (Figure 6). These results indicated the promising roles of ROMO1 in the patients’ prognosis of LICH.
The immune cell infiltration was obtained from the TIMER website. The expression level of ROMO1 was found to be strongly correlated with the abundance of six immune infiltrates (B cells, CD4+ T cells, CD8+ T cells, Neutrophils, Macrophages, and Dendritic cells) in COAD, LIHC, PAAD, and STAD (Figure 7).
Finally, to better understand the molecular mechanism of romo1 in tumorigenesis and development, we used the STRING and GeneMANIAtool to construct the romo1-interacted molecule network.To explore the regulatory mechanism of ROMO1, GeneMANIA was used to search for related genes (Figure8A). We found that the main 20 genes were associated with ROMO1, such as ELOVL5, TIMM17A, ERAP1, EXOSC2, MRPS10, RNF181, ATP5F1A, INTS5, EIF6, LAMTOR2, MRPL42, KRTCAP2, ZBTB8OS, GFER, SIVA1, MRPL17, SDF2L1, NDUFB8, ZNRD2 and CC2D2B.The proteins most closely associated with ROMO1 are TIMM23B, DNAJC15, TIMM17A, TIMM21, TIMM10, PAM16, TIMM23, TIMM17B, TIMM50, DNAJC19, TIMM44, NDUFB7, TIMM23B, DNAJC15, TIMM22, TIMM9, TIMM13, TIMM10B, TIMM8A, TOMM7, CHCHD4, and TOMM6 (Figure 8B). These proteins appear active in cell proliferation, cell cycle, and cell death pathways.

4. Discussion

Gastrointestinal tract cancers account for almost one-third of cancer-related deaths [2]. A fundamental feature of all gastrointestinal cancers is the involvement of genomic and epigenomic alterations. Cancer cells further complicate the disease by altering the molecular and cellular biological processes of cells [1]. Intratumoral heterogeneity and the increasingly complex process of malignancies with disease progression continue to be the biggest obstacles to cancer treatment [25]. Therefore, early diagnosis and prognosis prediction for various malignancies are the most important ways to prevent cancer-related morbidity and mortality [2]. Although many anti-tumor treatments have been developed in recent years based on differences in tumor cell metabolism [26], further studies are needed to understand the mechanisms underlying cancer development and to provide more effective and new treatment strategies. This study aimed to investigate the clinical relevance of ROMO1 expression in gastrointestinal cancers.
ROMO1 is a membrane protein in mitochondria that regulates mitochondrial ROS production, redox, mitochondrial dynamics, and apoptosis [27-29]. Increased ROS production alters intracellular oxidative stress homeostasis, can cause cell death, inflammation, persistent oxidative stress, enhance malignancy, and promote cancer development and progression [30]. Recent studies have implicated ROMO1 in various types of cancer, including hepatocellular carcinoma, colorectal, prostate, gastric, bladder, lung, and glioma [8, 9, 13, 16, 28, 30, 31]. In our study, we evaluated ROMO1 in gastrointestinal cancers in terms of mRNA and protein expression, clinical outcomes, and immune cells using various databases.ROMO1 expression was observed to differ among cancer types and to have high expression in gastrointestinal cancers (Figure1). Particularly, high expression of ROMO1 was associated with poor prognosis in LICH.Studies in the literature have shown that ROMO1 expression is increased in cancer types such as bladder [32], glioblastoma [33], prostate [28], and gastric cancer[8]. Jo et al. reported that ROMO1 protein is increased in colorectal cancer patients and may serve as a diagnostic marker [13]. Another study has shown that ROMO1 and the NF-κB pathway may regulate oxidative stress-induced tumor cell invasion in hepatocellular carcinoma [34].
ROMO1 survival and predictive value in COAD, ESCA, LIHC, PAAD, and STAD were assessed using OS and DFS. The survival analysis results with GEPIA tools showed that high expression levels of ROMO1 did not correlate with a poor prognosis concerning COAD, ESCA, PAAD, and STAD (Figure 6). In particular, upregulation of ROMO1 was associated with poor prognosis in LIHC. ROMO1 may be a potential target for the diagnosis and treatment of LIHC.These findings also showed that ROMO1 might have distinct functions in GI. More research is required to elucidate the mechanism and determine whether ROMO1 has a specific function in various cancer types.
The immune system plays a vital role in preventing and treating tumors [35]. Tumor immune infiltration analysis showed that ROMO1 expression in COAD, LIHC, PAAD, and STAD was associated with the infiltration of immune cells (B cells, CD4+ T cells, CD8+ T cells, neutrophils, macrophages, and dendritic cells) (Figure 7). Another study reported that ROMO1 expression in prostate cancer was also associated with immune cells infiltrating the tumor, leading to changes in the tumor microenvironment and further increasing tumor heterogeneity [28].
It has been reported that ROS produced by ROMO1 triggers various signaling agents such as ERK, TGF-β pathway, NF-κB extracellular matrix (ECM) proteins and epithelial mesenchymal transition (EMT) factors, leading to metastasis, proliferation and invasion [12,14, 36, 37]. The protein/gene interactions associated with ROMO1 and its potential molecular regulatory mechanisms were examined. ROMO1 is closely related to the inner mitochondrial membrane proteins (TIMM) family, such as TIMM17A, TIMM9, and TIMM8A (Figure 8B). In recent years, the translocase of the TIMM proteins has been implicated in the development of various types of human cancer [38].
However, the article has some limitations; the role of ROMO1 needs to be experimentally confirmed in vivo and in vitro. Also, larger sample sizes in cancer and healthy groups are needed.

5. Conclusions

ROMO1 is significantly upregulated in gastrointestinal cancers and closely associated with clinicopathological features, which may play an essential role in the development of these cancers. Moreover, ROMO1 expression was closely associated with immune infiltration and may play a role in the regulation of tumor immunity.Despite the need for more experimental and clinical verification, some molecules within this network have the potential to function as disease diagnostic and treatment biomarkers. This might reveal fresh information about the molecular causes of GI and possible treatment targets.

Author Contributions

S.Y.; Conceptualization (lead); data curation (lead); methodology (lead); software (equal); writing – original draft (lead). O.A.; Conceptualization (supporting); data curation (equal); formal analysis (equal). M.V.; Data curation (equal); investigation (equal); methodology (equal),review and editing (equal) S.M.; Data curation (equal); resources (lead); methodology (equal); software (equal); Formal analysis (equal),review and editing (equal). S.O.Y.; Supervision (lead); Validation (equal); Methodology (equal); supervision (equal); writing – review and editing (equal).

Funding

Not applicable.

Institutional Review Board Statement

Not applicable.

Informed Consent Statement

Not applicable.

Data Availability Statement

The data supporting this study's findings are available on request from the corresponding author.

Acknowledgments

TIMER: GEPIA, UALCAN, GeneMANIA, and STRING for which the authors are grateful.

Conflicts of Interest

The authors declare that they have no conflict of interest.

References

  1. Grady WM, Yu M, Markowitz SD. Epigenetic Alterations in the Gastrointestinal Tract: Current and Emerging Use for Biomarkers of Cancer. Gastroenterol. 2021, 160, 690–709. [Google Scholar] [CrossRef] [PubMed]
  2. Wadhwa V, Patel N, Grover D, et al. Interventional gastroenterology in oncology. CA Cancer J Clin. 2023, 73, 286–319. [Google Scholar] [CrossRef] [PubMed]
  3. Roshani M, Molavizadeh D, Sadeghi S, et al. Emerging roles of miR-145 in gastrointestinal cancers: A newparadigm. Biomed Pharmacother. 2023, 166, 115264. [Google Scholar] [CrossRef]
  4. Siegel RL, Miller KD, Fuchs HE, et al. Cancerstatistics, 2022. CA Cancer J Clin. 2022, 72, 7–33. [CrossRef]
  5. Arnold M, Abnet CC, Neale RE, et al. Global Burden of 5 Major Types of Gastrointestinal Cancer. Gastroenterol. 2020, 159, 335–349.e15. [Google Scholar] [CrossRef]
  6. Marusawa H, Jenkins BJ. Inflammation and gastrointestinal cancer: an overview. Cancer Lett. 2014, 345, 153–6. [Google Scholar] [CrossRef] [PubMed]
  7. Roshani M, Jafari A, Loghman A, et al. Applications of resveratrol in the treatment of gastrointestinal cancer. Biomed Pharmacother. 2022, 153, 113274. [Google Scholar] [CrossRef]
  8. Amini MA, Karimi J, Khodadadi I, et al. Overexpression of ROMO1 and OMA1 are Potentially Biomarkers and Predict Unfavorable Prognosis in Gastric Cancer. J Gastro in test Cancer. 2020, 51, 939–946. [Google Scholar] [CrossRef]
  9. Ghasemi H, Amini MA, Pegah A, et al. Over expression of reactive oxygen species modulator 1 is associated with advanced grades of bladde rcancer. Mol Biol Rep. 2020, 47, 6497–6505. [Google Scholar] [CrossRef]
  10. Norton M, Ng AC, Baird S, et al. ROMO1 is an essential redox-dependent regulator of mitochondrial dynamics. Science Signaling. 2014, 7, ra10. [Google Scholar] [CrossRef]
  11. Amini MA, Talebi SS, Karimi J. Reactive Oxygen Species Modulator 1 (ROMO1), a New Potential Target for Cancer Diagnosis and Treatment. ChonnamMed J. 2019, 55, 136–143. [Google Scholar] [CrossRef] [PubMed]
  12. Liu D, Liu Y, Xia Z, et al. Reactive oxygen species modulator 1 regulates oxidative stres and induces renal and pulmonary fibrosis in a unilateral ureteral obstructionrat model and in HK-2 cells. Mol Med Rep. 2017, 16, 4855–4862. [Google Scholar] [CrossRef] [PubMed]
  13. Kim HJ, Jo MJ, Kim BR, et al. Reactive oxygenspecies modulator-1 (Romo1) predicts unfavorable prognosis in colorectal cancer patients. PLoSOne. 2017, 12, e0176834. [Google Scholar] [CrossRef]
  14. Na, A. R. ,Chung, Y. M., Lee, S. B., Park, S. H., Lee, M. S., & Do Yoo, Y. A critical role for Romo1-derived ROS in cell proliferation. Biochemical and biophysical research communications 2008, 369, 672–678. [Google Scholar]
  15. You BR, Park WH. The enhancement of propylgallate-induced HeLa cell death by MAPK inhibitors is accompanied by increasing ROS levels. Mol Biol Rep. 2011, 38, 2349–58. [Google Scholar] [CrossRef]
  16. Lee SH, Min JW, Lee JS, et al. Reactive oxygen species modulator 1 (Romo1) over expression is an independent predictor of poor survival in NSCLC patients who under go surgical resection. Lung Cancer. 2015, 87, 45–52. [Google Scholar] [CrossRef]
  17. Yu MO, Song NH, Park KJ, et al. Romo1 is associated with ROS production and ellular growth in human gliomas. J Neurooncol. 2015, 121, 73–81. [Google Scholar] [CrossRef]
  18. Misir S, Ozer Yaman S, Petrović N, et al. Identification of a Novel hsa_circ_0058058/miR-324-5p Axis and Prognostic/Predictive Molecules for Acute Myeloid Leukemia Outcome by Bioinformatics-Based Analysis. Biology 2024, 13, 487. [Google Scholar] [CrossRef]
  19. Li T, Fan J, Wang B, et al. TIMER: A Web Server for Comprehensive Analysis of Tumor-Infiltrating Immune Cells. CancerRes. 2017, 77, e108–e110. [Google Scholar] [CrossRef]
  20. Tang Z, Li C, Kang B, et al. GEPIA: a web server for cancer and normal gene expression profiling and interactive analyses. NucleicAcidsRes. 2017, 45, W98–W102. [Google Scholar] [CrossRef]
  21. Chandrashekar DS, Bashel B, Balasubramanya SAH, et al. UALCAN: A Portal for Facilitating Tumor Subgroup Gene Expression and Survival Analyses. Neoplasia. 2017, 19, 649–658. [Google Scholar] [CrossRef] [PubMed]
  22. Ru B, Wong CN, Tong Y,et al. TISIDB: an integrated repository portal for tumor-immune system interactions. Bioinformatics. 2019, 35, 4200–4202. [Google Scholar] [CrossRef] [PubMed]
  23. Szklarczyk D, Franceschini A, Kuhn M, et al. The STRING database in 2011: functional interaction networks of proteins, globally integrated and scored. Nucleic Acids Res. 2011, 39, D561–D568. [Google Scholar] [CrossRef]
  24. Warde-Farley D, Donaldson SL, Comes O, et al. The Gene MANIA prediction server: biological network integration for gene prioritization and predicting gene function. NucleicAcidsRes. 2010, 38, W214–W220. [Google Scholar] [CrossRef]
  25. Deng L, Jiang A, Zeng H, et al. Comprehensive analyses of PDHA1 that serves as a predictive biomarker for immunotherapy response in cancer. Front Pharmacol. 2022, 13, 947372. [Google Scholar] [CrossRef]
  26. Li F, Simon MC. CancerCellsDon't Live Alone: Metabolic Communication within Tumor Microenvironments. Dev Cell. 2020, 54, 183–195. [Google Scholar] [CrossRef] [PubMed]
  27. Wang P, Geng J, Gao J, et al. Macrophage achieves self-protection against oxidative stress-induced ageing through the Mst-Nrf2 axis. NatCommun. 2019, 10, 755. [Google Scholar] [CrossRef]
  28. Wang L, Liu X, Liu Z, et al. Network models of prostate cancer immune microenvironments identify ROMO1 as heterogeneity and prognostic marker. SciRep. 2022, 12, 192. [Google Scholar] [CrossRef]
  29. Tsoneva E, Vasileva-Slaveva M, Kostov S, et al. ROMO1 – a potential immuno histochemical prognostic marker for cancer development. Oncologie. 2023, 25, 753–758. [Google Scholar] [CrossRef]
  30. Kim T, Cha YJ, Park JH, et al. Reactive oxygen species modulator 1 expression predicts lymphnode metastasis and survival in early-stagenon-small cell lung cancer. PLoSOne. 2020, 15, e0239670. [Google Scholar] [CrossRef]
  31. Chung JS, Park S, Park SH, et al. Over expression of Romo1 promotes production of reactive oxygen species and invasiveness of hepatic tumor cells. Gastroenterology. 2012, 143, 1084–94.e7. [Google Scholar] [CrossRef] [PubMed]
  32. Yang Y, Zhang F, Huang H, Xie Z, Huang W, Xie H, Wang F. Long noncoding RNA LINC00319 regulates ROMO1 expression and promotes bladder cance rprogression via miR-4492/ROMO1 axis. J Cell Physiol. 2020, 235, 3768–3775. [Google Scholar] [CrossRef] [PubMed]
  33. Sun G, Cao Y, Qian C, Wan Z, Zhu J, Guo J, Shi L. Romo1 is involved in the immune response of glioblastoma by regulating the function of macrophages. Aging (Albany NY). 2020, 12, 1114–1127. [Google Scholar] [CrossRef]
  34. Lee S, Park YH, Chung JS, et al. Romo1 andthe NF-κB pathway are involved in oxidative stress-induced tumor cell invasion. Int J Oncol. 2015, 46, 2021–8. [Google Scholar] [CrossRef]
  35. Muenst S, Läubli H, Soysal SD, et al. The immune system and cancer evasion strategies: therapeutic concepts. J InternMed. 2016, 279, 541–62. [Google Scholar] [CrossRef]
  36. Kim IG, Kim SY, Kim HA, et al. Disturbance of DKK1 level is partly involved in survival of lung cancer cells via regulation of ROMO1 and γ-radiation sensitivity. Biochem Biophys Res Commun. 2014, 443, 49–55. [Google Scholar] [CrossRef]
  37. Martinez-Bernabe, T.; Pons, D.G.; Oliver, J.; Sastre-Serra, J. Oxidative Phosphorylation as a Predictive Biomarker of Oxaliplatin Response in Colorectal Cancer. Biomolecules 2024, 14, 1359. [Google Scholar] [CrossRef]
  38. Wang Z, Li S, Xu F, et al. ncRNAs-mediated high expression of TIMM8A correlates with poor prognosis and act as an oncogene in breast cancer. Cancer Cell Int. 2022, 22, 177. [Google Scholar] [CrossRef]
Figure 1. A) The expression status ofthe ROMO1gene in different cancer types was analyzed through TIMER2 (data from TCGA). ** p <0.01; *** p < 0.001. B) The expression status of the ROMO1gene in COAD, ESCA, LIHC, PAAD and STAD was analyzedthrough GEPIA2 (data from TCGA and GTEx). * p < 0.05. C) The expression of ROMO1 in COAD, ESCA, LIHC, PAAD and STAD analysis using the UALCAN database.
Preprints 140419 g001
Figure 2. Heatmaps of significant ROMO1 inCOAD, ESCA, LIHC and PAAD.
Preprints 140419 g002
Figure 3. The expression levels of the ROMO1 genewere analyzed by the main pathological stages (stage I, stage II, stage III, and stage IV) of COAD, ESCA, LIHC, PAAD and STAD.
Preprints 140419 g003
Figure 4. A) Correlations between ROMO1 expression and immune subtypes in GI. B) Correlations between ROMO1 expression and molecular subtypes in GI. Correlation analysis between ROMO1 expression and immune subtypes, and molecular subtypes was performed on the TISIDB database.
Preprints 140419 g004aPreprints 140419 g004b
Figure 5. DNA methylation features of ROMO1 in GI. The methylation level of ROMO1 obtained using UALCAN database.
Preprints 140419 g005
Figure 6. Disease-free survival for ROMO1, Analysis of the overall survival for ROMO1 in COAD, ESCA, LIHC, PAAD and STAD using the GEPIA andULACAN databases.
Preprints 140419 g006aPreprints 140419 g006b
Figure 7. Association between ROMO1 and immune infiltration in COAD, ESCA, LIHC, PAAD and STAD using the TIMER.
Preprints 140419 g007
Figure 8. A) The STRING database was employed to construct the protein interaction network of ROMO1. B) The gene interaction network of ROMO1 was constructed using GeneMANIA.
Preprints 140419 g008
Disclaimer/Publisher’s Note: The statements, opinions and data contained in all publications are solely those of the individual author(s) and contributor(s) and not of MDPI and/or the editor(s). MDPI and/or the editor(s) disclaim responsibility for any injury to people or property resulting from any ideas, methods, instructions or products referred to in the content.
Copyright: This open access article is published under a Creative Commons CC BY 4.0 license, which permit the free download, distribution, and reuse, provided that the author and preprint are cited in any reuse.
Prerpints.org logo

Preprints.org is a free preprint server supported by MDPI in Basel, Switzerland.

Subscribe

Disclaimer

Terms of Use

Privacy Policy

Privacy Settings

© 2025 MDPI (Basel, Switzerland) unless otherwise stated