
Submitted:
03 October 2025
Posted:
07 October 2025
You are already at the latest version
Abstract
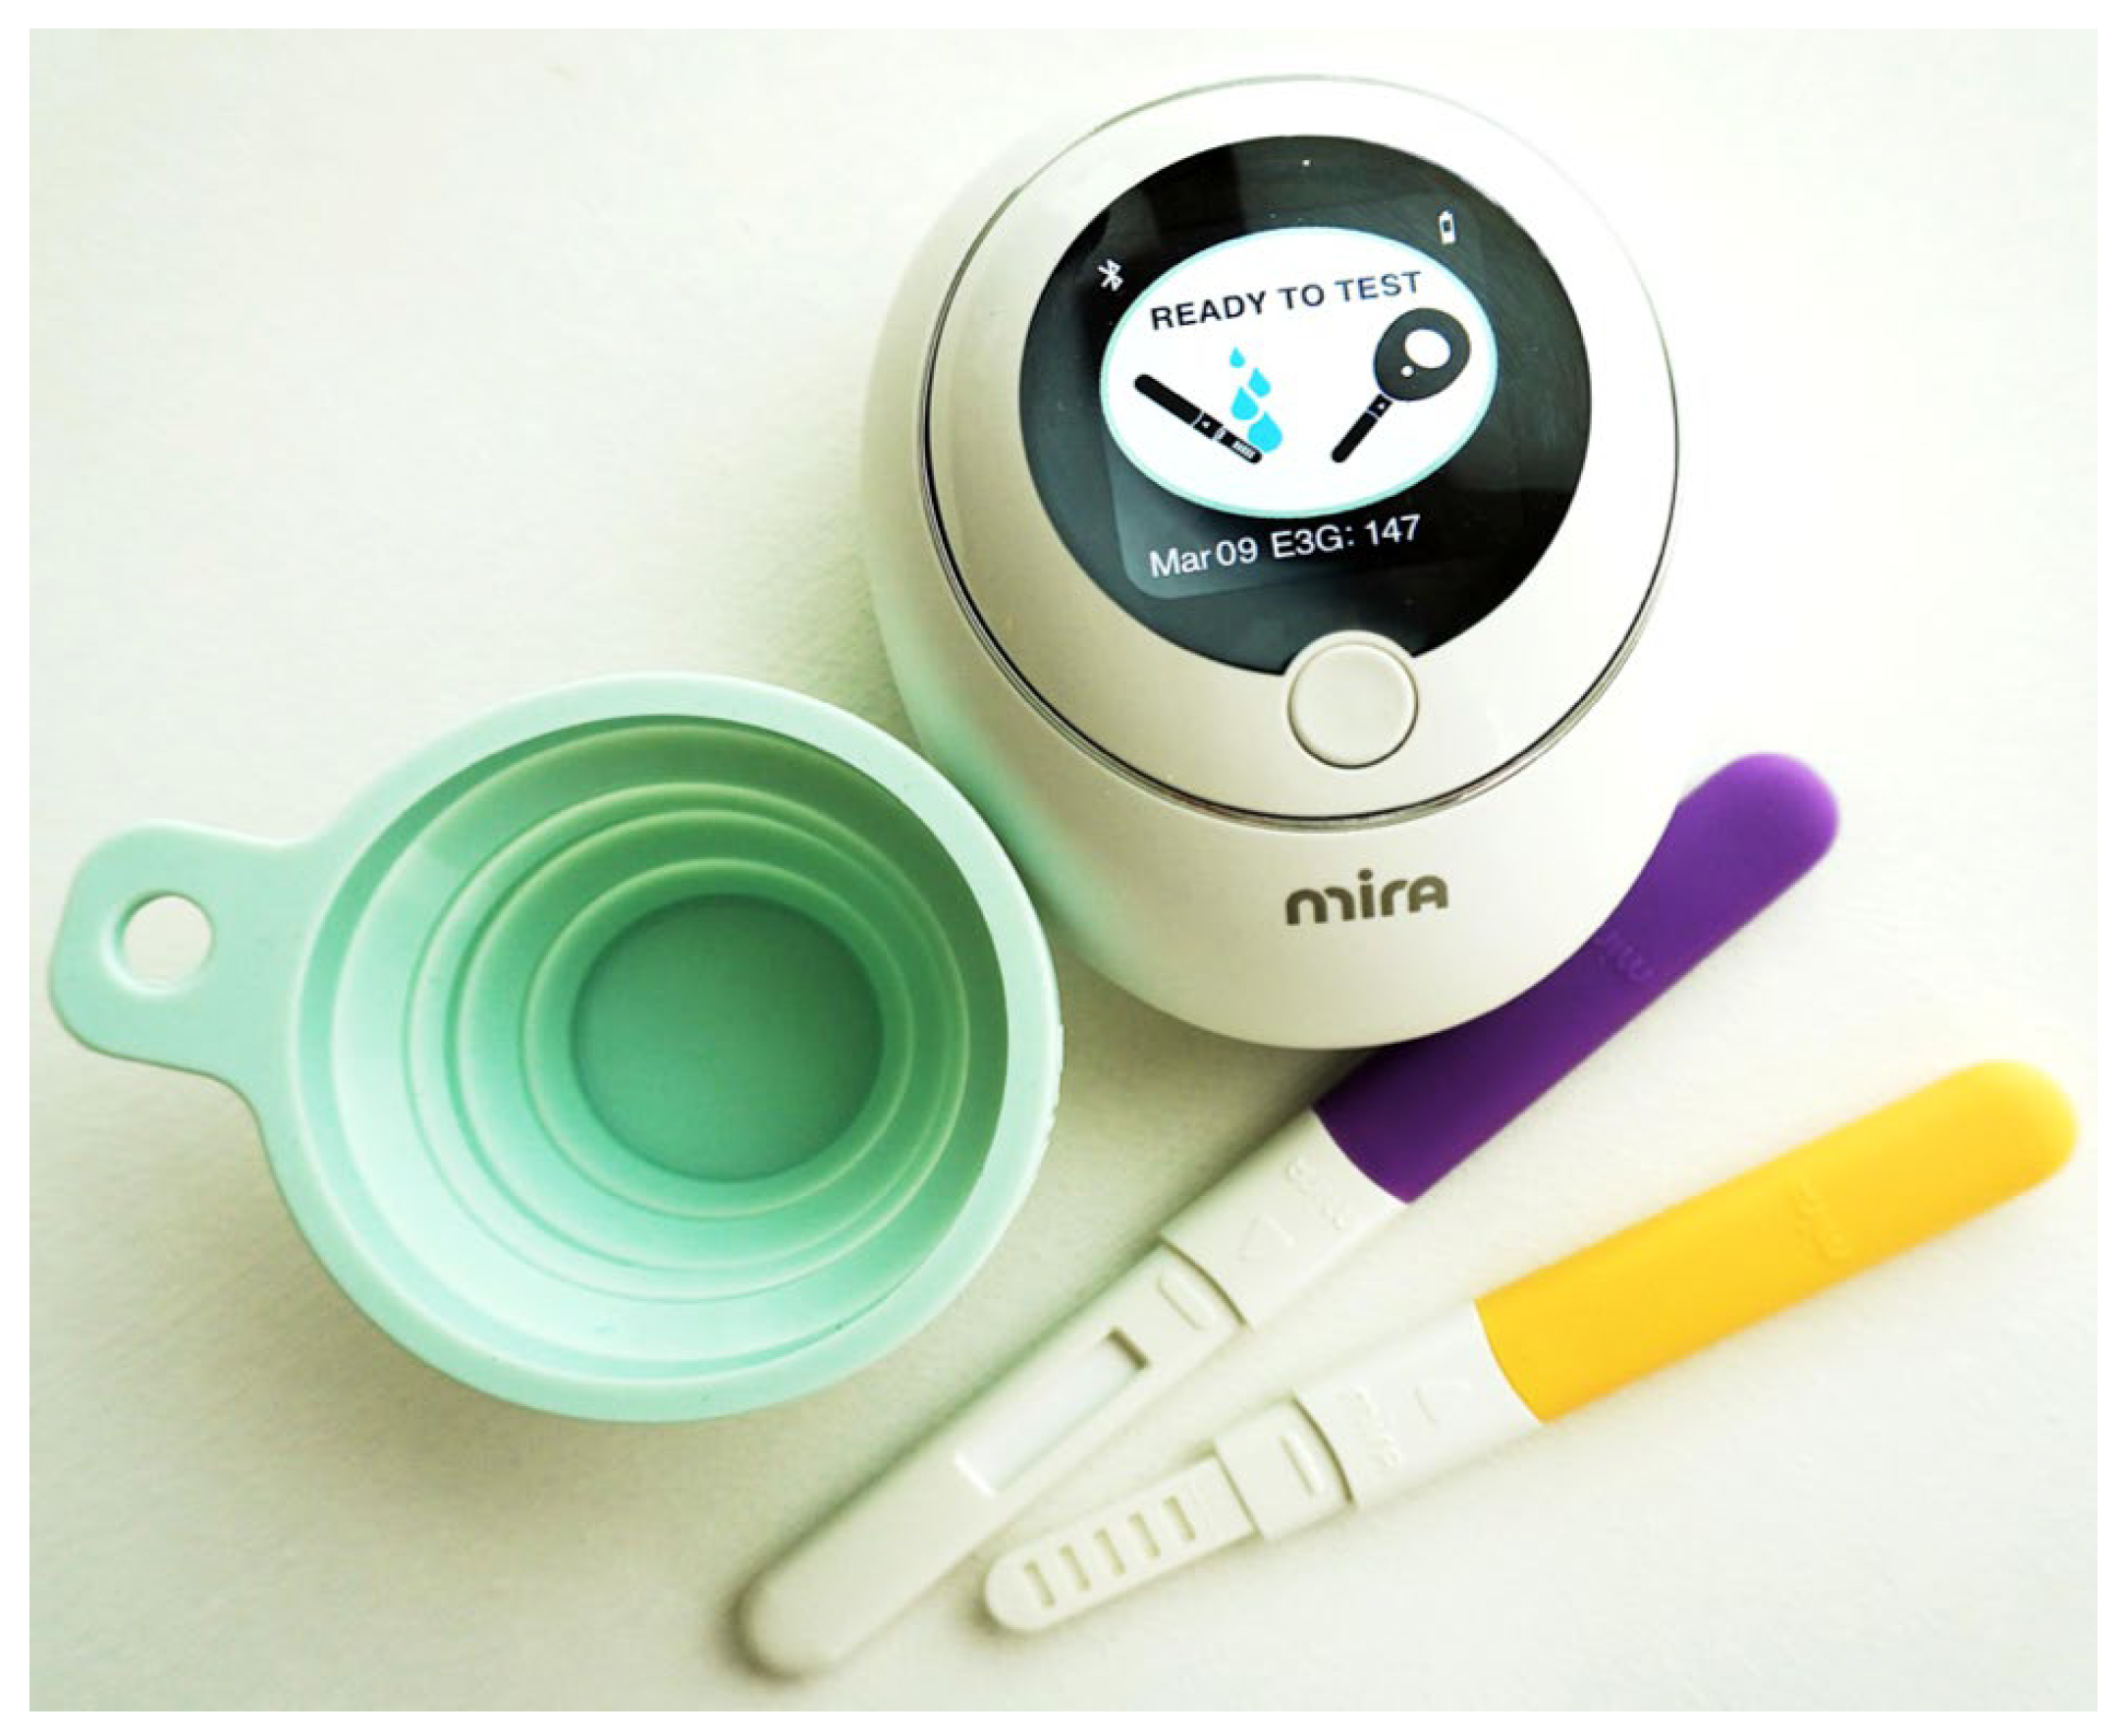
Background/Objectives: Quantitative urine monitors are increasingly being used for a personalized approach to improve menstrual cycle knowledge and to manage fertility. Although several studies have evaluated urine fertility monitors in regular cycles, there is limited research in the use of quantitative monitors in reproductive disorders, such as polycystic ovarian syndrome (PCOS). Methods: Urine hormone data was collected with the Mira monitor from 20 participants, 10 of whom had PCOS and a matched group who had regular cycles. The main aim of this study was to evaluate the levels of luteinizing hormone (LH), estrone-3-glucuronide (E13G), and pregnanediol glucuronide (PDG) in PCOS menstrual cycles compared to regular cycles. Results: Women with PCOS had higher BMI than regular cycling women (p=0.02). PCOS cycles were longer (p<0.05), peak day was later in the menstrual cycle (p<0.001), and luteal length was shorter (p < 0.01) compared to regular cycles. In whole cycle comparisons, E13G was found to be lower in PCOS cycles (p<0.01) and PDG was found to be higher in PCOS cycles (p<0.05). E13G was also lower in the follicular phase of and late luteal phase of PCOS cycles (p<0.00001). Conclusions: The results of this study demonstrate the feasibility of detecting hormonal differences in PCOS compared to regular cycles with at-home measurements with the Mira monitor. The metabolic dysregulation of PCOS is a possible factor in these hormone changes. Larger studies with different sub-types of PCOS will be needed to further clarify these changes and to understand the pathophysiology behind these hormonal changes.
Keywords:
1. Introduction
2. Materials and Methods
3. Results
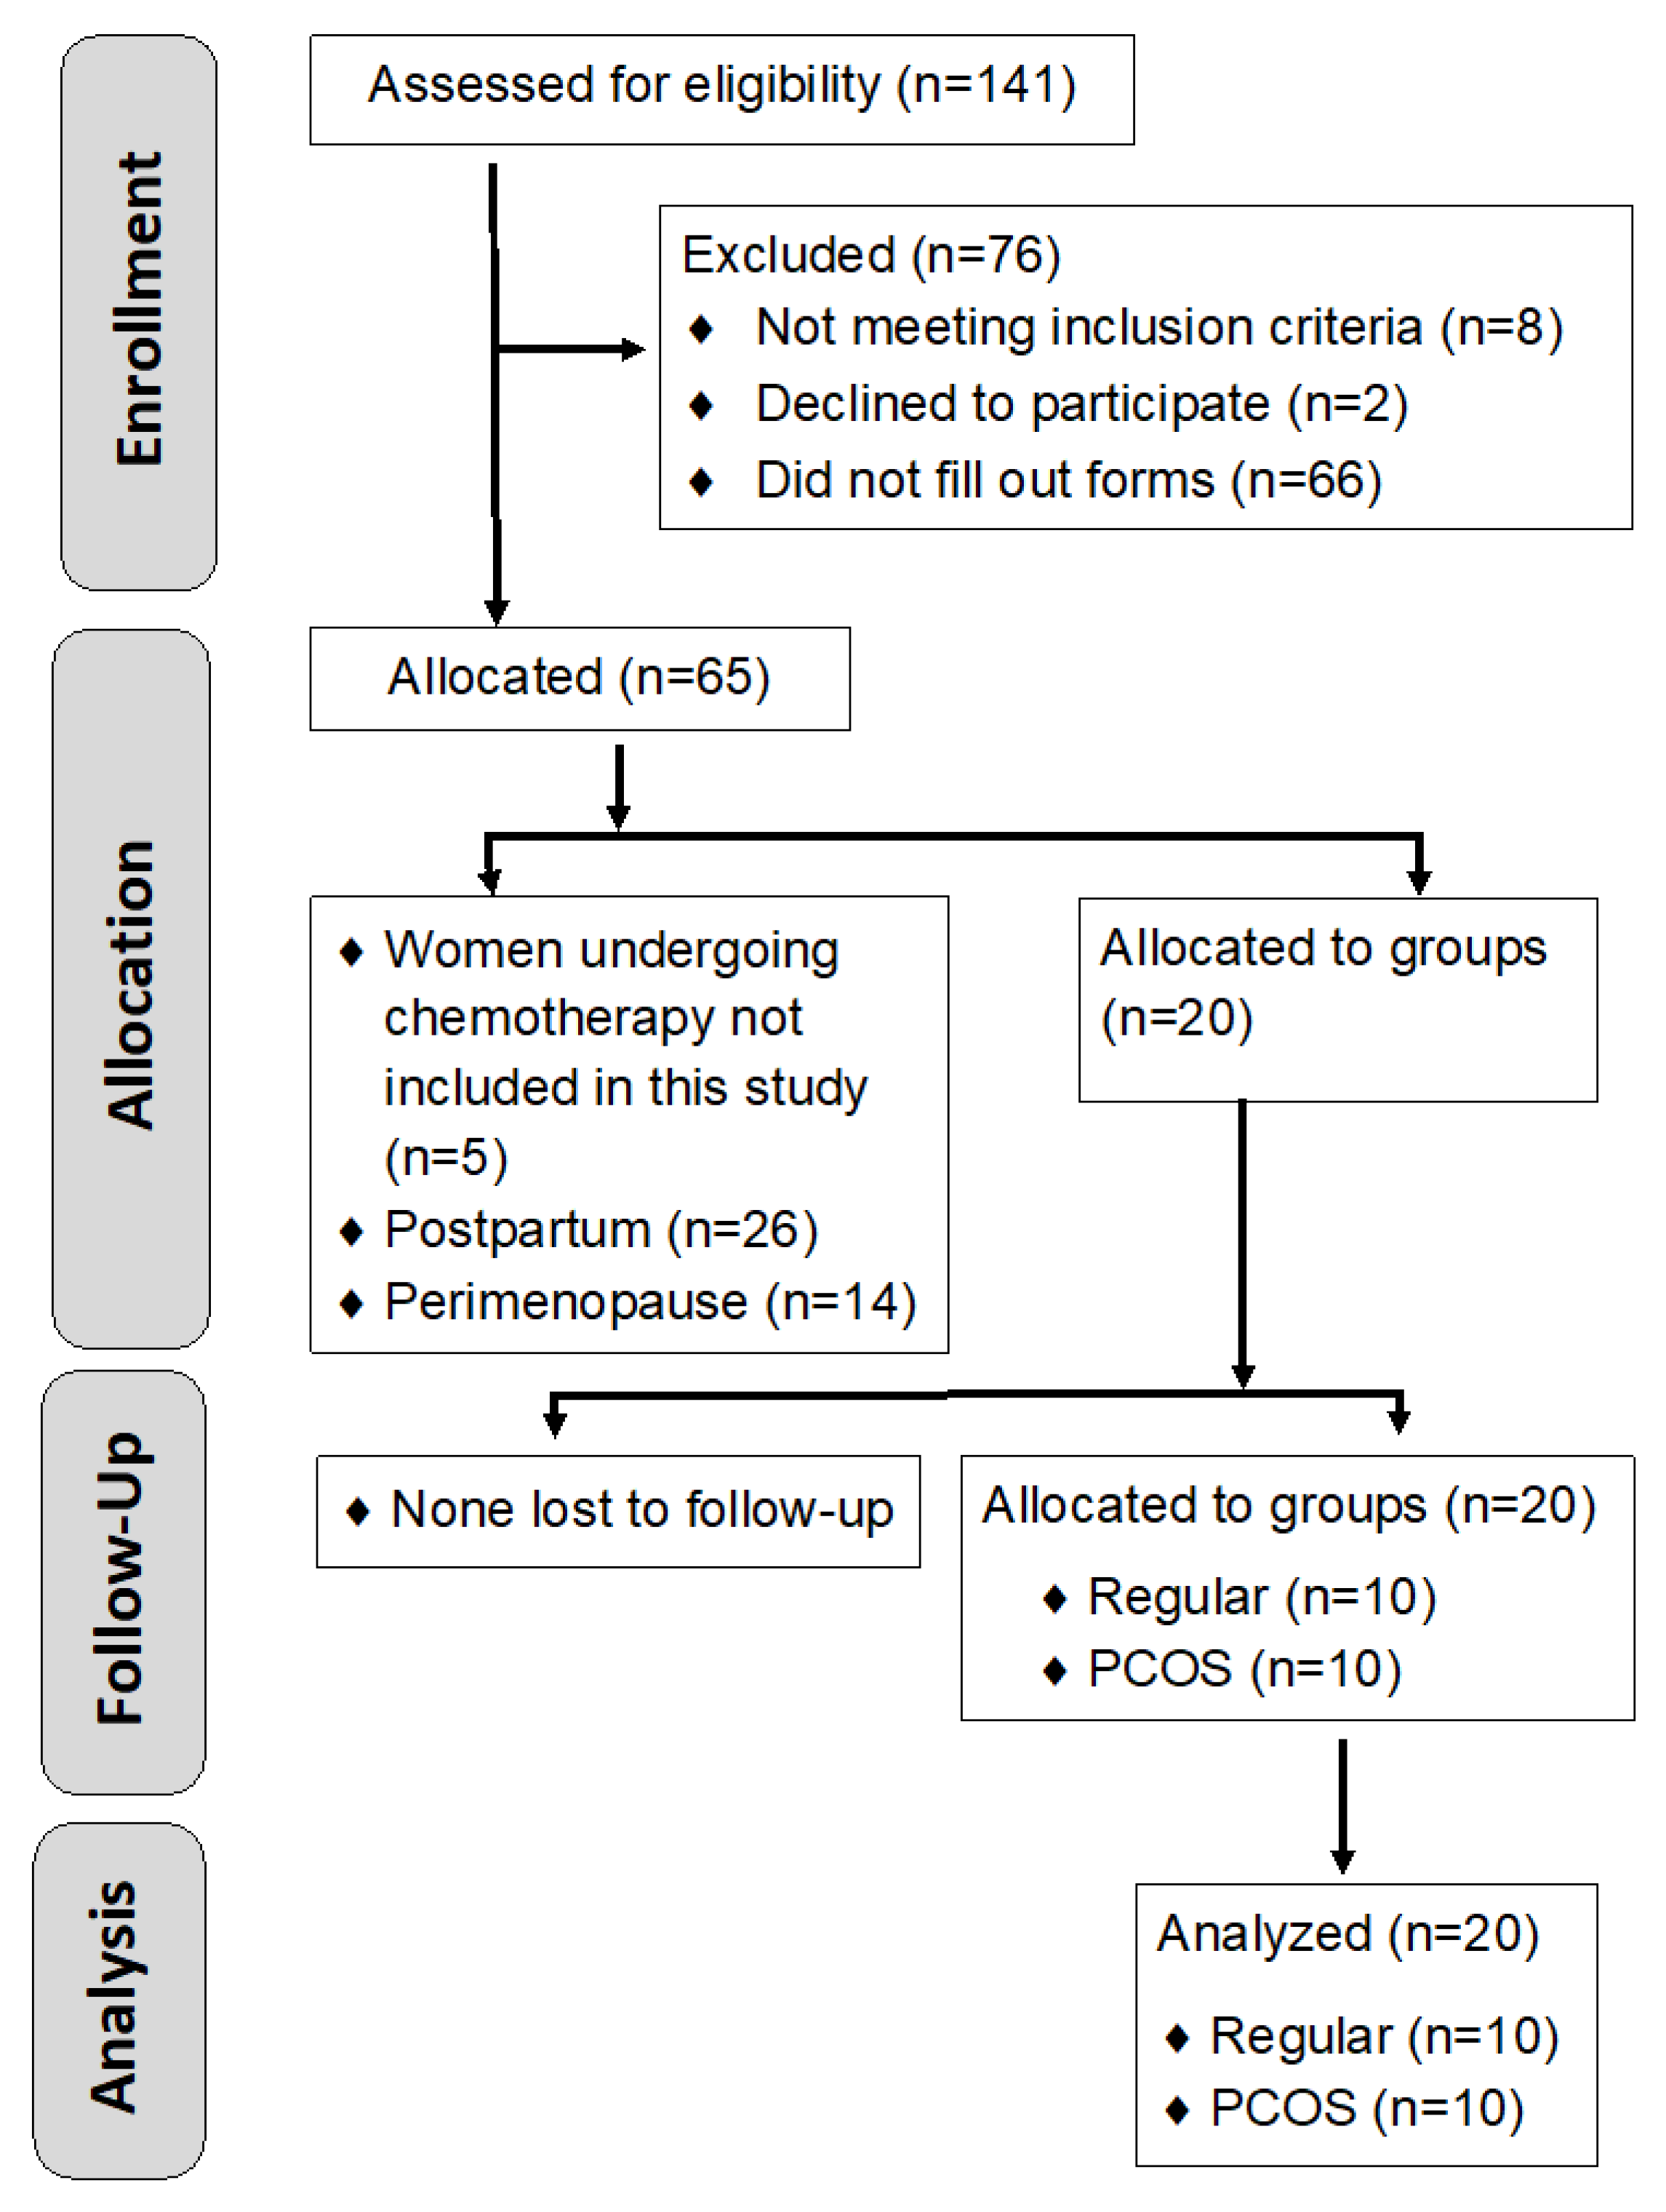
3.1. Recruitment
3.2. Demographics
3.3. Cycle Parameters
3.3.1. Ovulatory Cycles
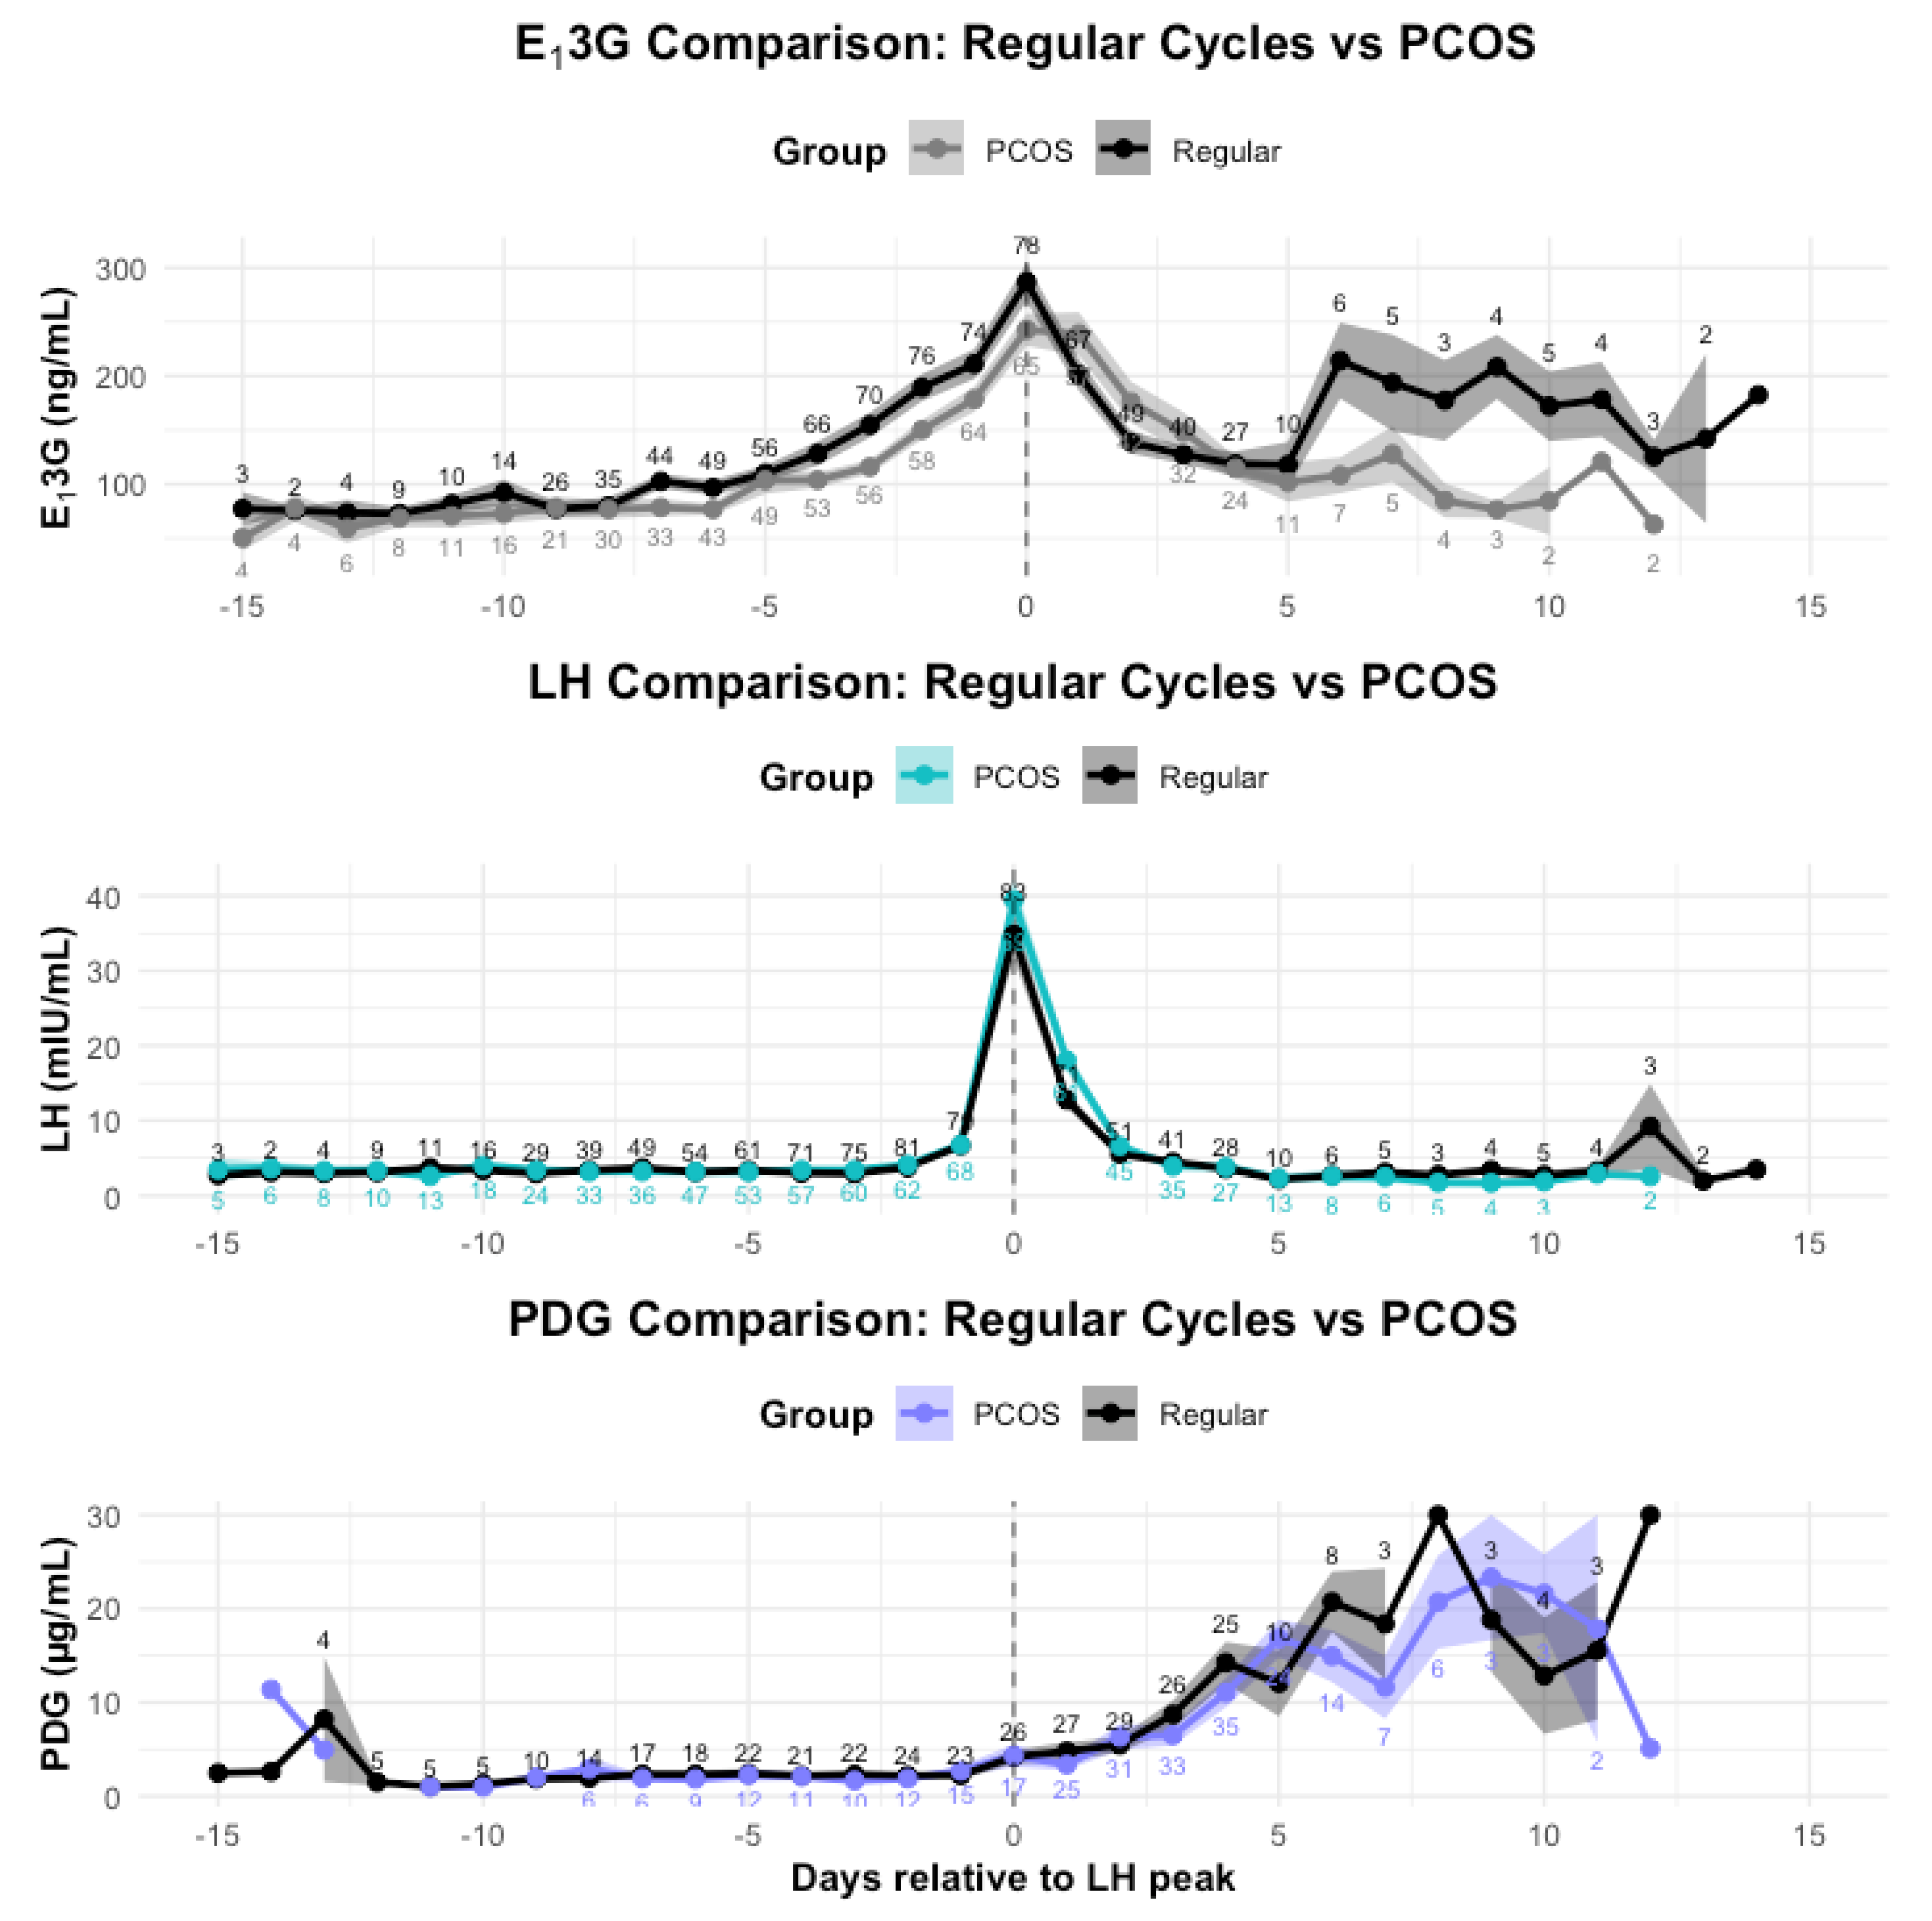
3.4. Hormone Comparisons
3.4.1. Whole Cycle Hormone Differences
3.4.2. Follicular Phase Hormone Differences

|
Regular Cycle n=10 |
Min | Max | ||
| E13G (ng/mL) | Mean* | 154.60 | 10.00 | 640.00 |
| PDG (µg/mL) | Mean | 2.51 | 0.99 | 28.23 |
|
PCOS n=10 |
Min | Max | ||
| E13G (ng/mL) | Mean* | 126.25 | 10.00 | 640.01 |
| PDG (µg/mL) | Mean | 3.02 | 0.99 | 30.01 |
3.4.3. LH surge day Hormone Differences
3.4.4. Luteal Phase Hormone Differences
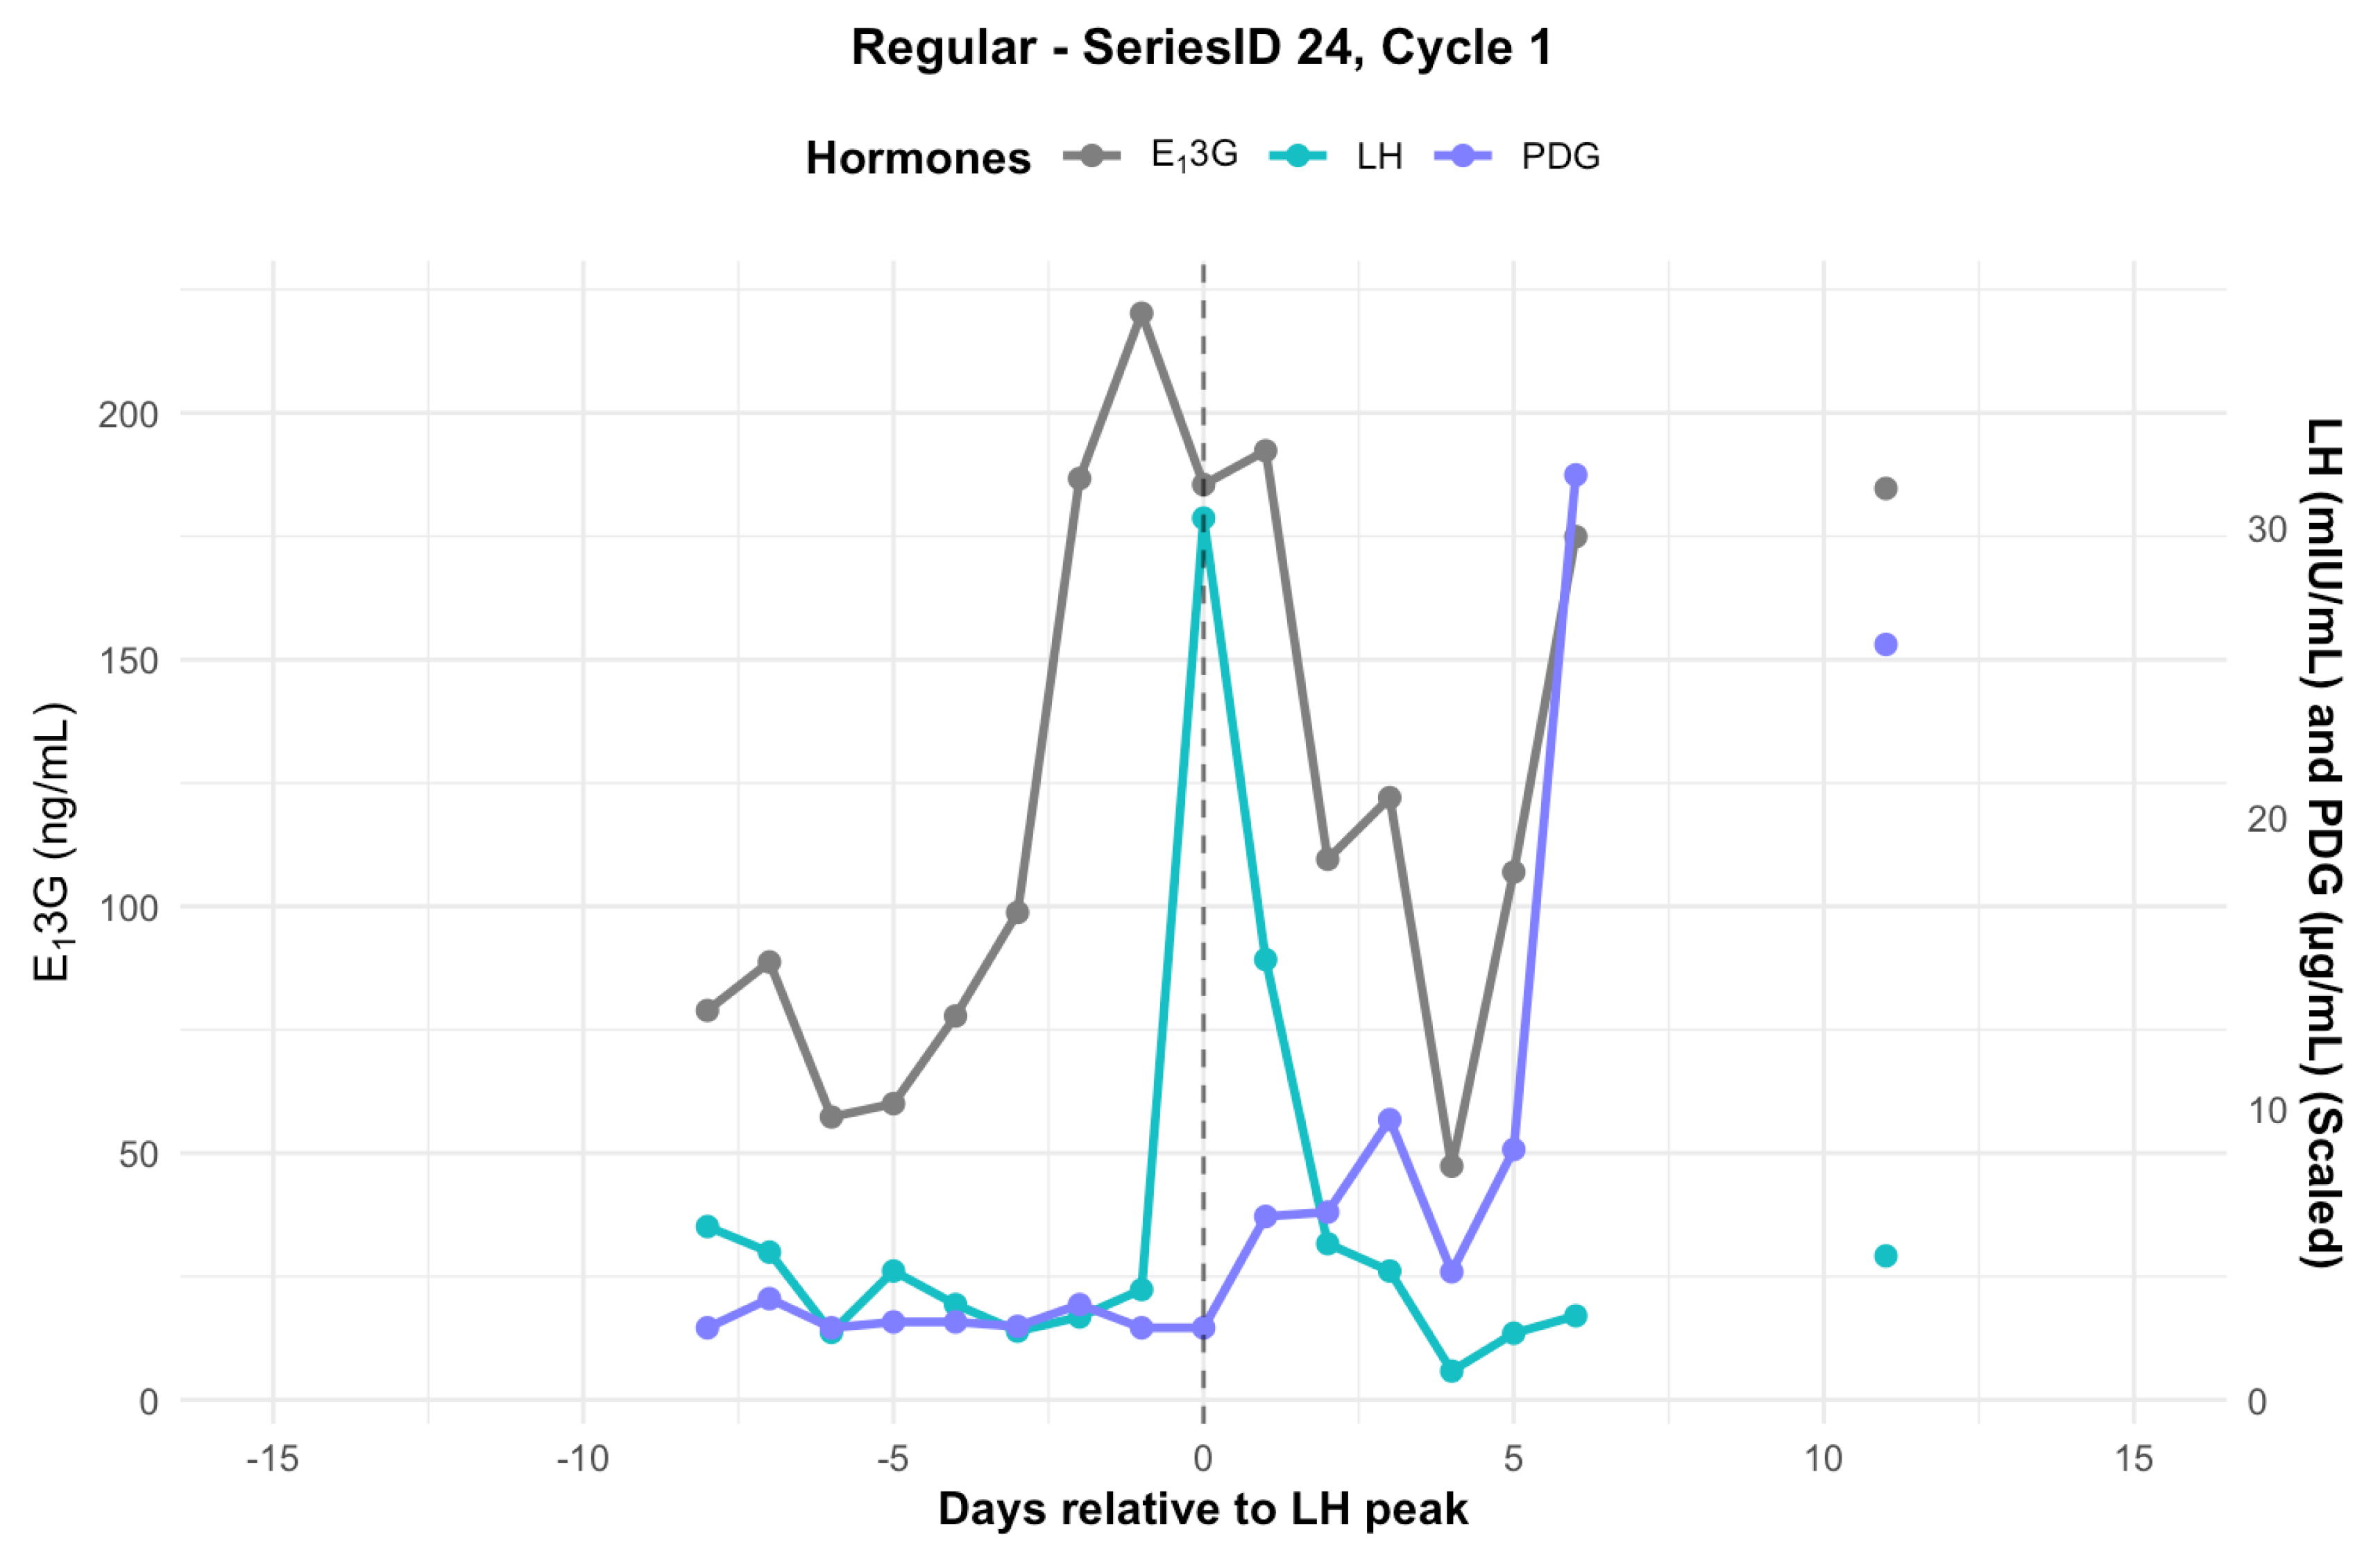
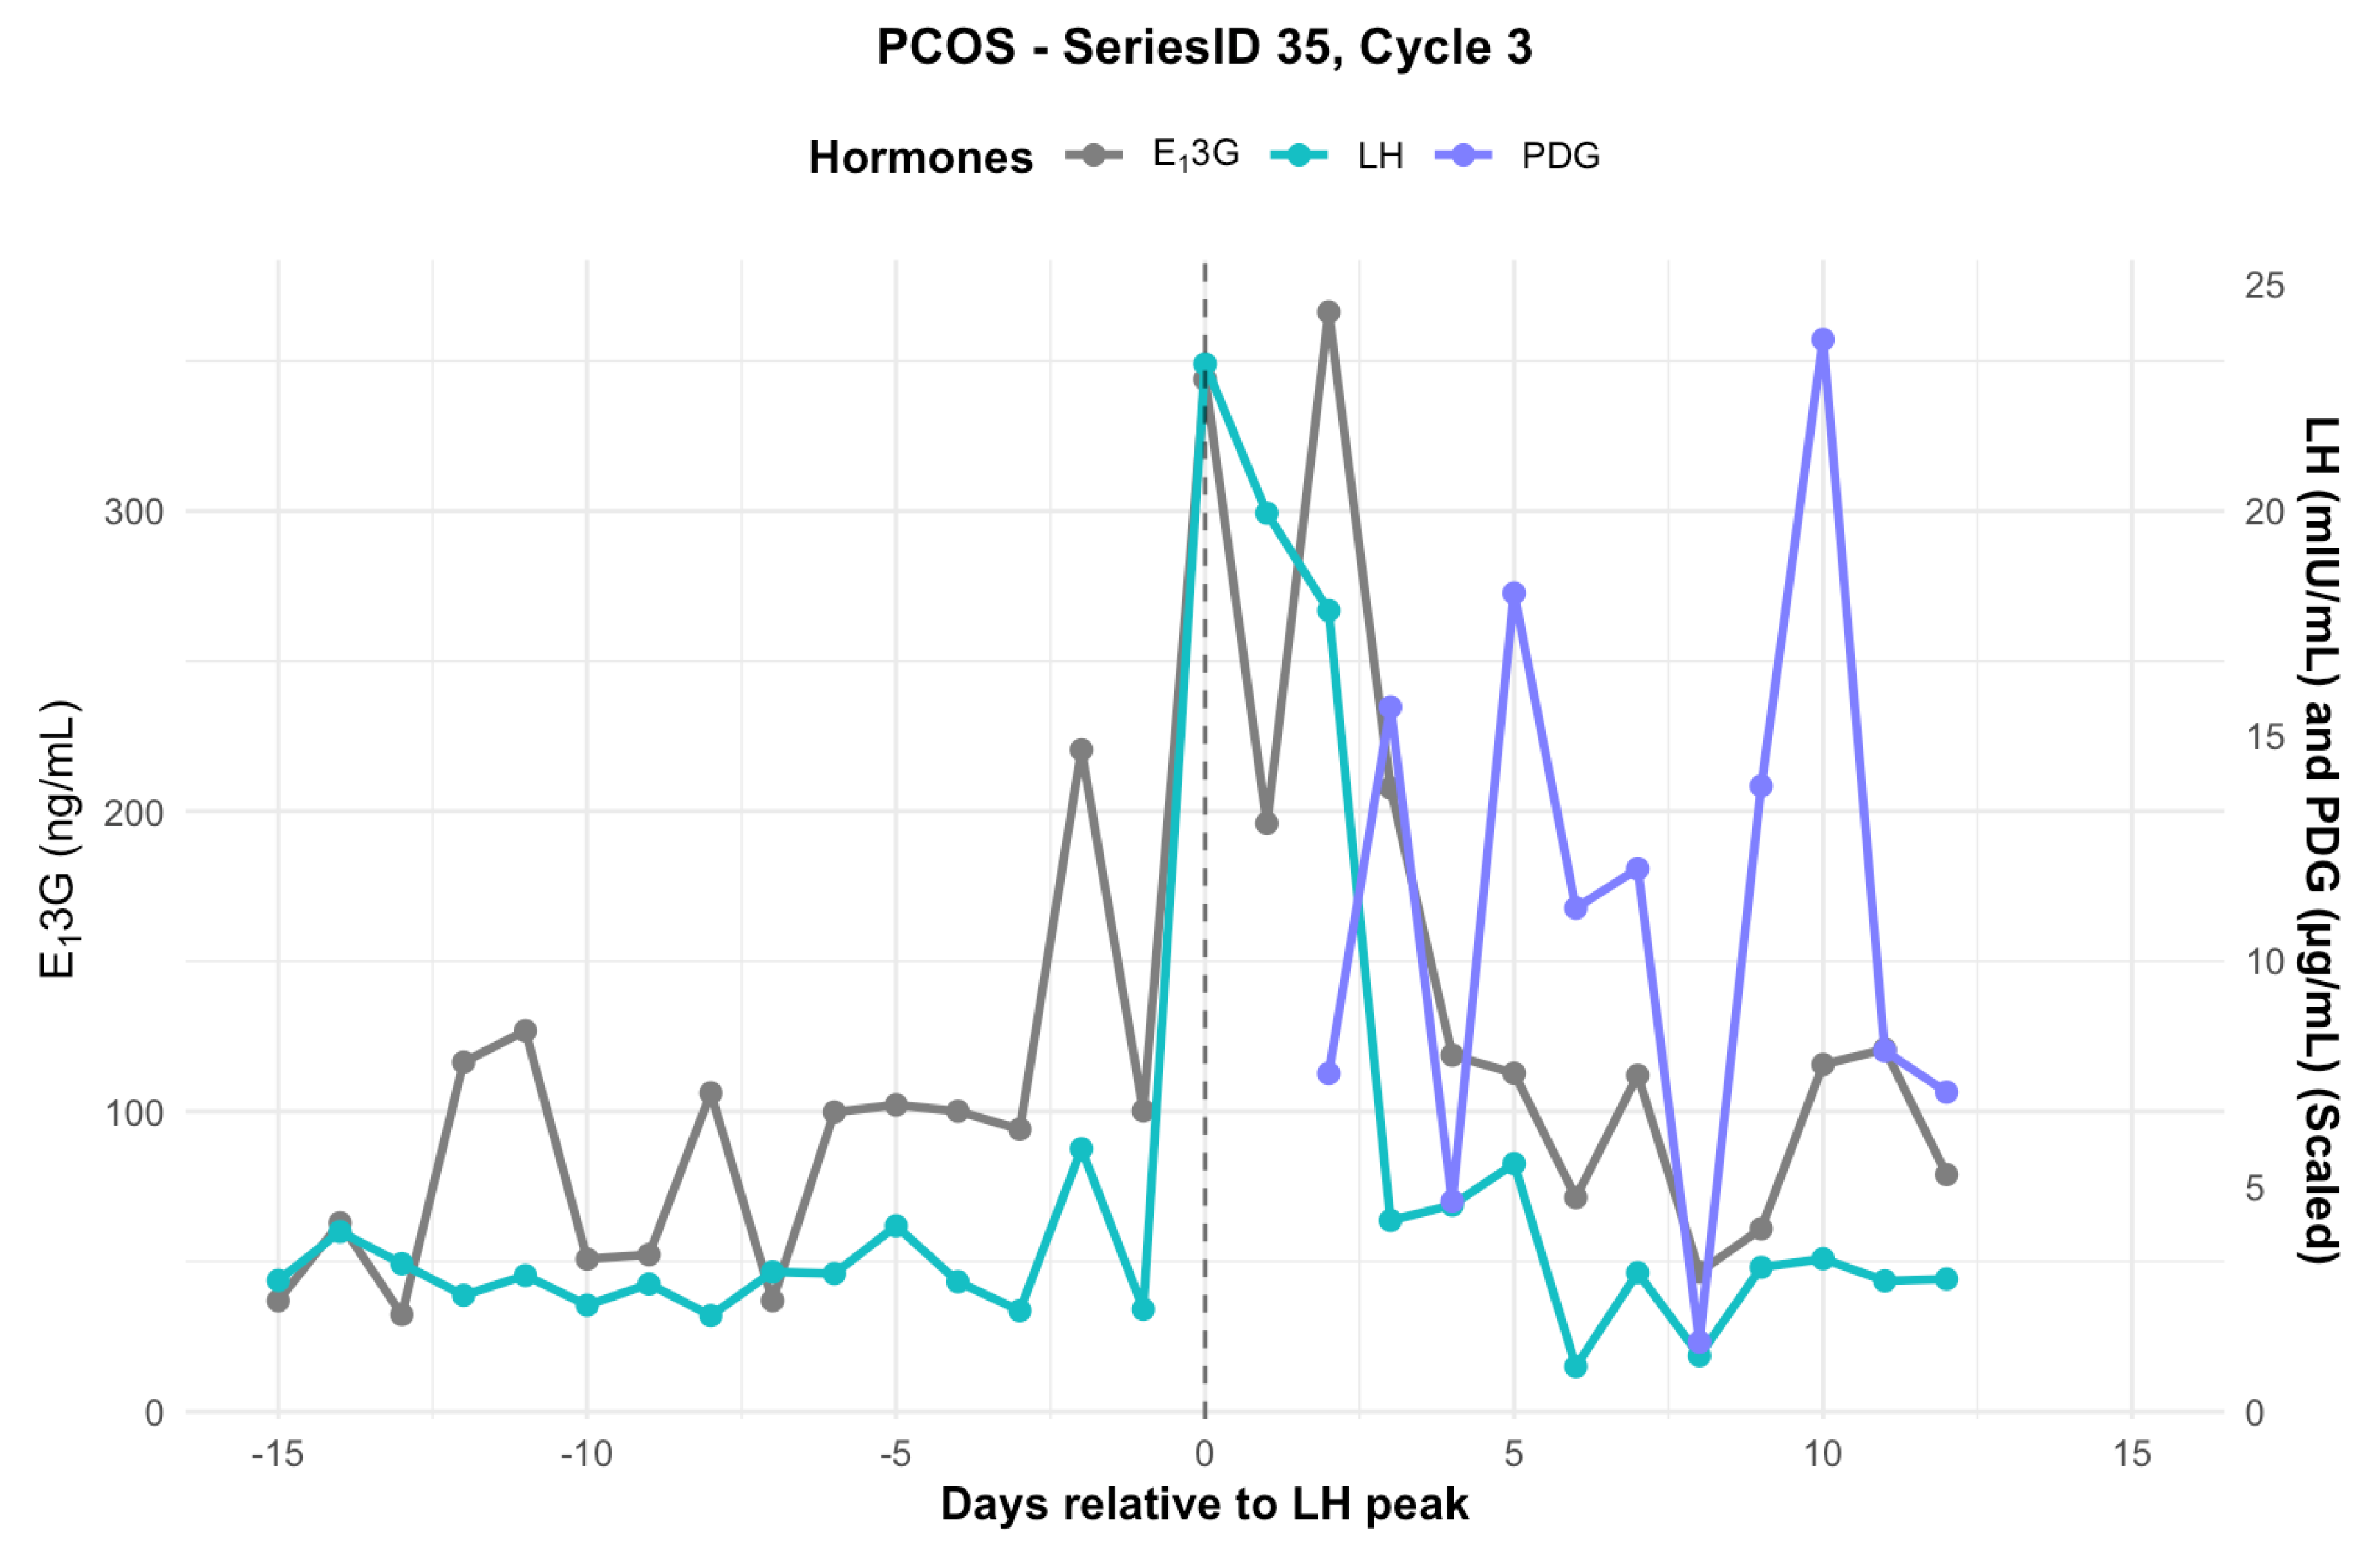
3.5. Individual Hormone Profiles
4. Discussion
5. Conclusions
Author Contributions
Funding
Institutional Review Board Statement
Informed Consent Statement
Data Availability Statement
Acknowledgments
Conflicts of Interest
Abbreviations
| AMH | Anti-mullerian hormone |
| CBFM | ClearBlue Fertility Monitor |
| E13G | Estrone-3-glucuronide |
| GnRH | Gonadotropin releasing hormone |
| LH | Luteinizing hormone |
| PCOS | Polycystic ovarian syndrome |
| PDG | Pregnanediol glucuronide |
References
- Roux, F.; Burns, S.; Hendriks, J.; Chih, H. “What’s Going on in My Body?”: Gaps in Menstrual Health Education and Face Validation of My Vital Cycles®, an Ovulatory Menstrual Health Literacy Program. Aust. Educ. Res. 2024, 51, 1141–1160. [Google Scholar] [CrossRef]
- Houghton, L.C. Menstruation as the Next Vital Sign. JAMA Network Open 2024, 7, e2412778. [Google Scholar] [CrossRef] [PubMed]
- Diaz, A.; Laufer, M.R.; Breech, L.L. Menstruation in Girls and Adolescents: Using the Menstrual Cycle as a Vital Sign. Obstetrics & Gynecology 2015, 126, e143–e146. [Google Scholar] [CrossRef]
- Vollmar, A.K.R.; Mahalingaiah, S.; Jukic, A.M. The Menstrual Cycle as a Vital Sign: A Comprehensive Review. F&S Reviews 2025, 6. [Google Scholar] [CrossRef]
- Mu, Q.; Hanson, L.; Hoelzle, J.; Fehring, R.J. Young Women’s Knowledge About Fertility and Their Fertility Health Risk Factors. Journal of Obstetric, Gynecologic & Neonatal Nursing 2019, 48, 153–162. [Google Scholar] [CrossRef]
- Stujenske, T.M.; Mu, Q.; Pérez Capotosto, M.; Bouchard, T.P. Survey Analysis of Quantitative and Qualitative Menstrual Cycle Tracking Technologies. Medicina 2023, 59, 1509. [Google Scholar] [CrossRef]
- Cromack, S.C.; Walter, J.R. Consumer Wearables and Personal Devices for Tracking the Fertile Window. American Journal of Obstetrics and Gynecology 2024, 231, 516–523. [Google Scholar] [CrossRef]
- Alzueta, E.; De Zambotti, M.; Javitz, H.; Dulai, T.; Albinni, B.; Simon, K.C.; Sattari, N.; Zhang, J.; Shuster, A.; Mednick, S.C.; et al. Tracking Sleep, Temperature, Heart Rate, and Daily Symptoms Across the Menstrual Cycle with the Oura Ring in Healthy Women. IJWH 2022, 14, 491–503. [Google Scholar] [CrossRef]
- Bouchard, T.P. Using Quantitative Hormonal Fertility Monitors to Evaluate the Luteal Phase: Proof of Concept Case Study. Medicina 2023, 59, 140. [Google Scholar] [CrossRef]
- Bouchard, T.; Yong, P.; Doyle-Baker, P. Establishing a Gold Standard for Quantitative Menstrual Cycle Monitoring. Medicina 2023, 59, 1513. [Google Scholar] [CrossRef]
- Bouchard, T.P.; Fehring, R.J.; Mu, Q. Quantitative versus Qualitative Estrogen and Luteinizing Hormone Testing for Personal Fertility Monitoring. Expert Review of Molecular Diagnostics 2021, 21, 1349–1360. [Google Scholar] [CrossRef] [PubMed]
- Lujan, M.E.; Chizen, D.R.; Pierson, R.A. Diagnostic Criteria for Polycystic Ovary Syndrome: Pitfalls and Controversies. Journal of Obstetrics and Gynaecology Canada 2008, 30, 671–679. [Google Scholar] [CrossRef] [PubMed]
- Dason, E.S.; Koshkina, O.; Chan, C.; Sobel, M. Diagnosis and Management of Polycystic Ovarian Syndrome. CMAJ 2024, 196, E85–E94. [Google Scholar] [CrossRef]
- Unfer, V.; Kandaraki, E.; Pkhaladze, L.; Roseff, S.; Vazquez-Levin, M.H.; Laganà, A.S.; Shiao-Yng, C.; Yap-Garcia, M.I.M.; Greene, N.D.E.; Soulage, C.O.; et al. When One Size Does Not Fit All: Reconsidering PCOS Etiology, Diagnosis, Clinical Subgroups, and Subgroup-Specific Treatments. Endocrine and Metabolic Science 2024, 14, 100159. [Google Scholar] [CrossRef]
- Carmina, E.; Lobo, R.A. Comparing Lean and Obese PCOS in Different PCOS Phenotypes: Evidence That the Body Weight Is More Important than the Rotterdam Phenotype in Influencing the Metabolic Status. Diagnostics 2022, 12, 2313. [Google Scholar] [CrossRef]
- Pratama, G.; Wiweko, B.; Asmarinah; Widyahening, I. S.; Andraini, T.; Bayuaji, H.; Hestiantoro, A. Mechanism of Elevated LH/FSH Ratio in Lean PCOS Revisited: A Path Analysis. Sci Rep 2024, 14, 8229. [Google Scholar] [CrossRef]
- Mendonça, H.C.; Montenegro Junior, R.M.; Foss, M.C.; Silva De Sá, M.F.; Ferriani, R.A. Positive Correlation of Serum Leptin with Estradiol Levels in Patients with Polycystic Ovary Syndrome. Braz J Med Biol Res 2004, 37, 729–736. [Google Scholar] [CrossRef]
- Luan, Y.-Y.; Zhang, L.; Peng, Y.-Q.; Li, Y.-Y.; Liu, R.-X.; Yin, C.-H. Immune Regulation in Polycystic Ovary Syndrome. Clin Chim Acta 2022, 531, 265–272. [Google Scholar] [CrossRef]
- Yong, P.J.; Khan, Z.; Wahl, K.; Bouchard, T.P.; Doyle-Baker, P.K.; Prior, J.C. Menstrual Health Literacy, Equity and Research Priorities. Journal of Obstetrics and Gynaecology Canada 2024, 46. [Google Scholar] [CrossRef]
- Bouchard, T.P.; Schweinsberg, K.; Smith, A.; Schneider, M. Using Quantitative Hormone Monitoring to Identify the Postpartum Return of Fertility. Medicina 2023, 59, 2008. [Google Scholar] [CrossRef]
- Bouchard, T.; Yong, P.; Doyle-Baker, P. Establishing a Gold Standard for Quantitative Menstrual Cycle Monitoring. Medicina 2023, 59, 1513. [Google Scholar] [CrossRef] [PubMed]
- Bouchard, T.P.; Fehring, R.J.; Meyers, M.; Stujenske, T.; Boychuk, L.; Smith, A.; Schweinsberg, K.; Scarpa, B.; Schneider, M. Modeling Fertile Window Differences Across the Reproductive Lifespan with Quantitative Urine Hormone Monitoring of the Menstrual Cycle 2025.
- Huang, P.L. A Comprehensive Definition for Metabolic Syndrome. Disease Models & Mechanisms 2009, 2, 231–237. [Google Scholar] [CrossRef] [PubMed]
- Baerwald, A.R.; Adams, G.P.; Pierson, R.A. Ovarian Antral Folliculogenesis during the Human Menstrual Cycle: A Review. Human Reproduction Update 2012, 18, 73–91. [Google Scholar] [CrossRef] [PubMed]
- Dozortsev, D.I.; Pellicer, A.; Diamond, M.P. Premature Progesterone Rise as a Trigger of Polycystic Ovarian Syndrome. Fertility and Sterility 2020, 114, 943–944. [Google Scholar] [CrossRef]
- Lesoon, L.A.; Mahesh, V.B. Stimulatory and Inhibitory Effects of Progesterone on FSH Secretion by the Anterior Pituitary. The Journal of Steroid Biochemistry and Molecular Biology 1992, 42, 479–491. [Google Scholar] [CrossRef]
- Christ, J.P.; Vanden Brink, H.; Brooks, E.D.; Pierson, R.A.; Chizen, D.R.; Lujan, M.E. Ultrasound Features of Polycystic Ovaries Relate to Degree of Reproductive and Metabolic Disturbance in Polycystic Ovary Syndrome. Fertility and Sterility 2015, 103, 787–794. [Google Scholar] [CrossRef]
- Practice Committees of the American Society for Reproductive Medicine and the Society for Reproductive Endocrinology and Infertility Diagnosis and Treatment of Luteal Phase Deficiency: A Committee Opinion. Fertility and Sterility 2021, 115, 1416–1423. [CrossRef]
- Suh, B.Y.; Betz, G. Altered Luteinizing Hormone Pulse Frequency in Early Follicular Phase of the Menstrual Cycle with Luteal Phase Defect Patients in Women. Fertility and Sterility 1993, 60, 800–805. [Google Scholar] [CrossRef]
- Schweiger, U.; Laessle, R.G.; Tuschl, R.J.; Broocks, A.; Krusche, T.; Pirke, K.-M. Decreased Follicular Phase Gonadotropin Secretion Is Associated with Impaired Estradiol and Progesterone Secretion during the Follicular and Luteal Phases in Normally Menstruating Women*. The Journal of Clinical Endocrinology & Metabolism 1989, 68, 888–892. [Google Scholar] [CrossRef]
|
Regular Cycle n=10 |
Min | Max | ||
|---|---|---|---|---|
| BMI (kg/m2) | Mean, SD* | 24.93, 2.92 | 19.73 | 30.41 |
| Age (years) | Mean, SD | 30.90, 3.10 | 24.00 | 34.40 |
| Pregnancy | Median, IQR | 2.50, 3.50 | 0.00 | 5.00 |
| Living children | Median, IQR | 2.50, 1.75 | 0.00 | 4.00 |
|
PCOS n=10 |
Min | Max | ||
| BMI (kg/m2) | Mean, SD* | 28.98, 6.30 | 20.22 | 39.48 |
| Age (years) | Mean, SD | 30.20, 4.98 | 24.00 | 38.00 |
| Pregnancy | Median, IQR | 1.00, 3.25 | 0.00 | 7.00 |
| Living children | Median, IQR | 1.00, 1.00 | 0.00 | 7.00 |
|
Regular Cycle n=10 |
Min | Max | ||
|---|---|---|---|---|
| Cycle length | Mean, SD* | 28.61, 2.61 | 23.00 | 38.00 |
| Peak day | Mean, SD*** | 14.95, 2.71 | 9.00 | 25.00 |
| Luteal length | Mean, SD** | 13.66, 2.71 | 10.00 | 23.00 |
|
PCOS n=10 |
Min | Max | ||
| Cycle length | Mean, SD* | 30.54, 5.73 | 24.00 | 67.00 |
| Peak day | Mean, SD*** | 17.77, 6.11 | 10.00 | 57.00 |
| Luteal length | Mean, SD** | 12.77, 6.11 | 6.00 | 17.00 |
|
Regular Cycle n=10 |
Min | Max | ||
| LH (mIU/mL) | Mean | 7.28 | 0.99 | 228.28 |
| E13G (ng/mL) | Mean** | 154.18 | 10.00 | 640.01 |
| PDG (µg/mL) | Mean* | 5.62 | 0.99 | 30.01 |
|
PCOS n=10 |
Min | Max | ||
| LH (mIU/mL) | Mean | 7.82 | 0.99 | 113.30 |
| E13G (ng/mL) | Mean** | 136.6 | 10.00 | 640.0 |
| PDG (µg/mL) | Mean* | 6.93 | 0.99 | 30.01 |
|
Regular Cycle n=10 |
Min | Max | ||
| LH (mIU/mL) | Mean, SD | 34.83, 28.80 | 9.54 | 228.28 |
|
PCOS n=10 |
Min | Max | ||
| LH (mIU/mL) | Mean, SD | 39.44, 23.59 | 10.41 | 50.56 |
| (A) | ||||
|
Regular Cycle n=10 |
Min | Max | ||
| PDG (µg/mL) | Mean | 10.20 | 0.99 | 30.01 |
|
PCOS n=10 |
Min | Max | ||
| PDG (µg/mL) | Mean | 10.19 | 0.99 | 30.01 |
| (B) | ||||
|
Regular Cycle n=10 |
Min | Max | ||
| E13G (ng/mL) | Mean | 155.84 | 26.75 | 640.00 |
|
PCOS n=10 |
Min | Max | ||
| E13G (ng/mL) | Mean | 175.53 | 10.00 | 640.01 |
| (C) | ||||
|
Regular Cycle n=10 |
Min | Max | ||
| E13G (ng/mL) | Mean* | 175.95 | 47.96 | 317.69 |
|
PCOS n=10 |
Min | Max | ||
| E13G (ng/mL) | Mean* | 95.45 | 46.48 | 222.90 |
Disclaimer/Publisher’s Note: The statements, opinions and data contained in all publications are solely those of the individual author(s) and contributor(s) and not of MDPI and/or the editor(s). MDPI and/or the editor(s) disclaim responsibility for any injury to people or property resulting from any ideas, methods, instructions or products referred to in the content. |
© 2025 by the authors. Licensee MDPI, Basel, Switzerland. This article is an open access article distributed under the terms and conditions of the Creative Commons Attribution (CC BY) license (http://creativecommons.org/licenses/by/4.0/).


