Submitted:
02 October 2025
Posted:
04 October 2025
Read the latest preprint version here
Abstract
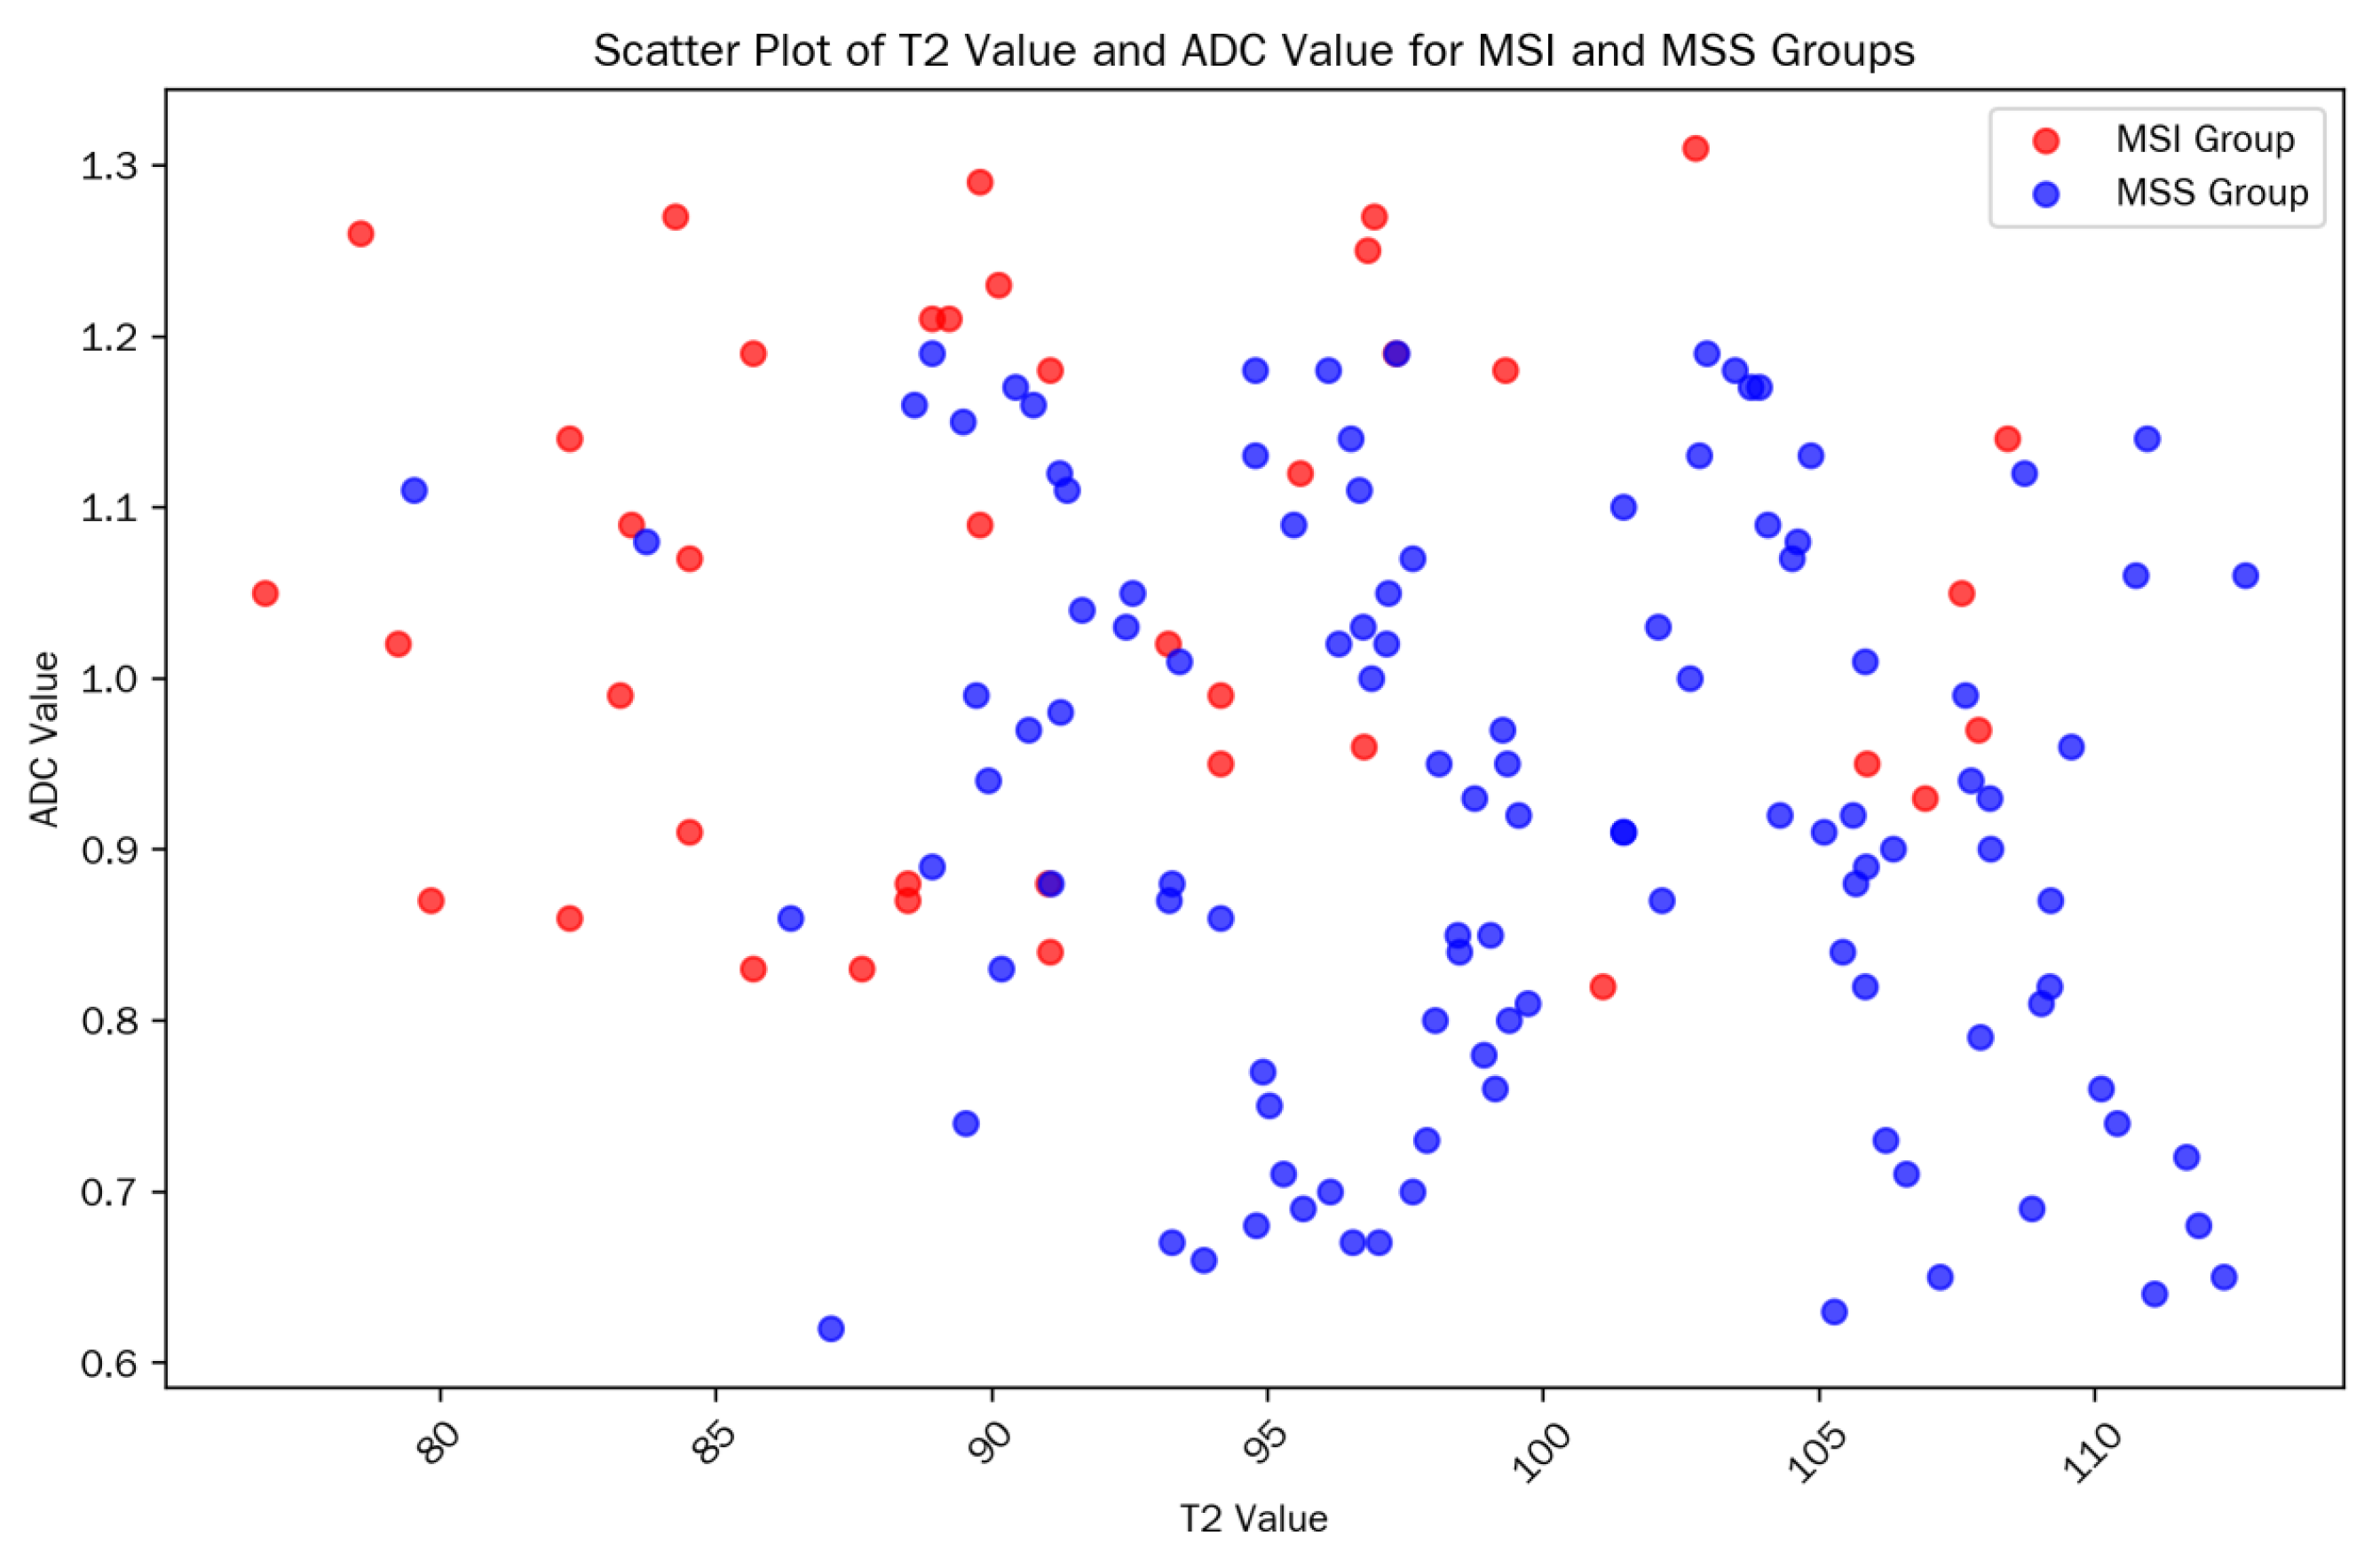
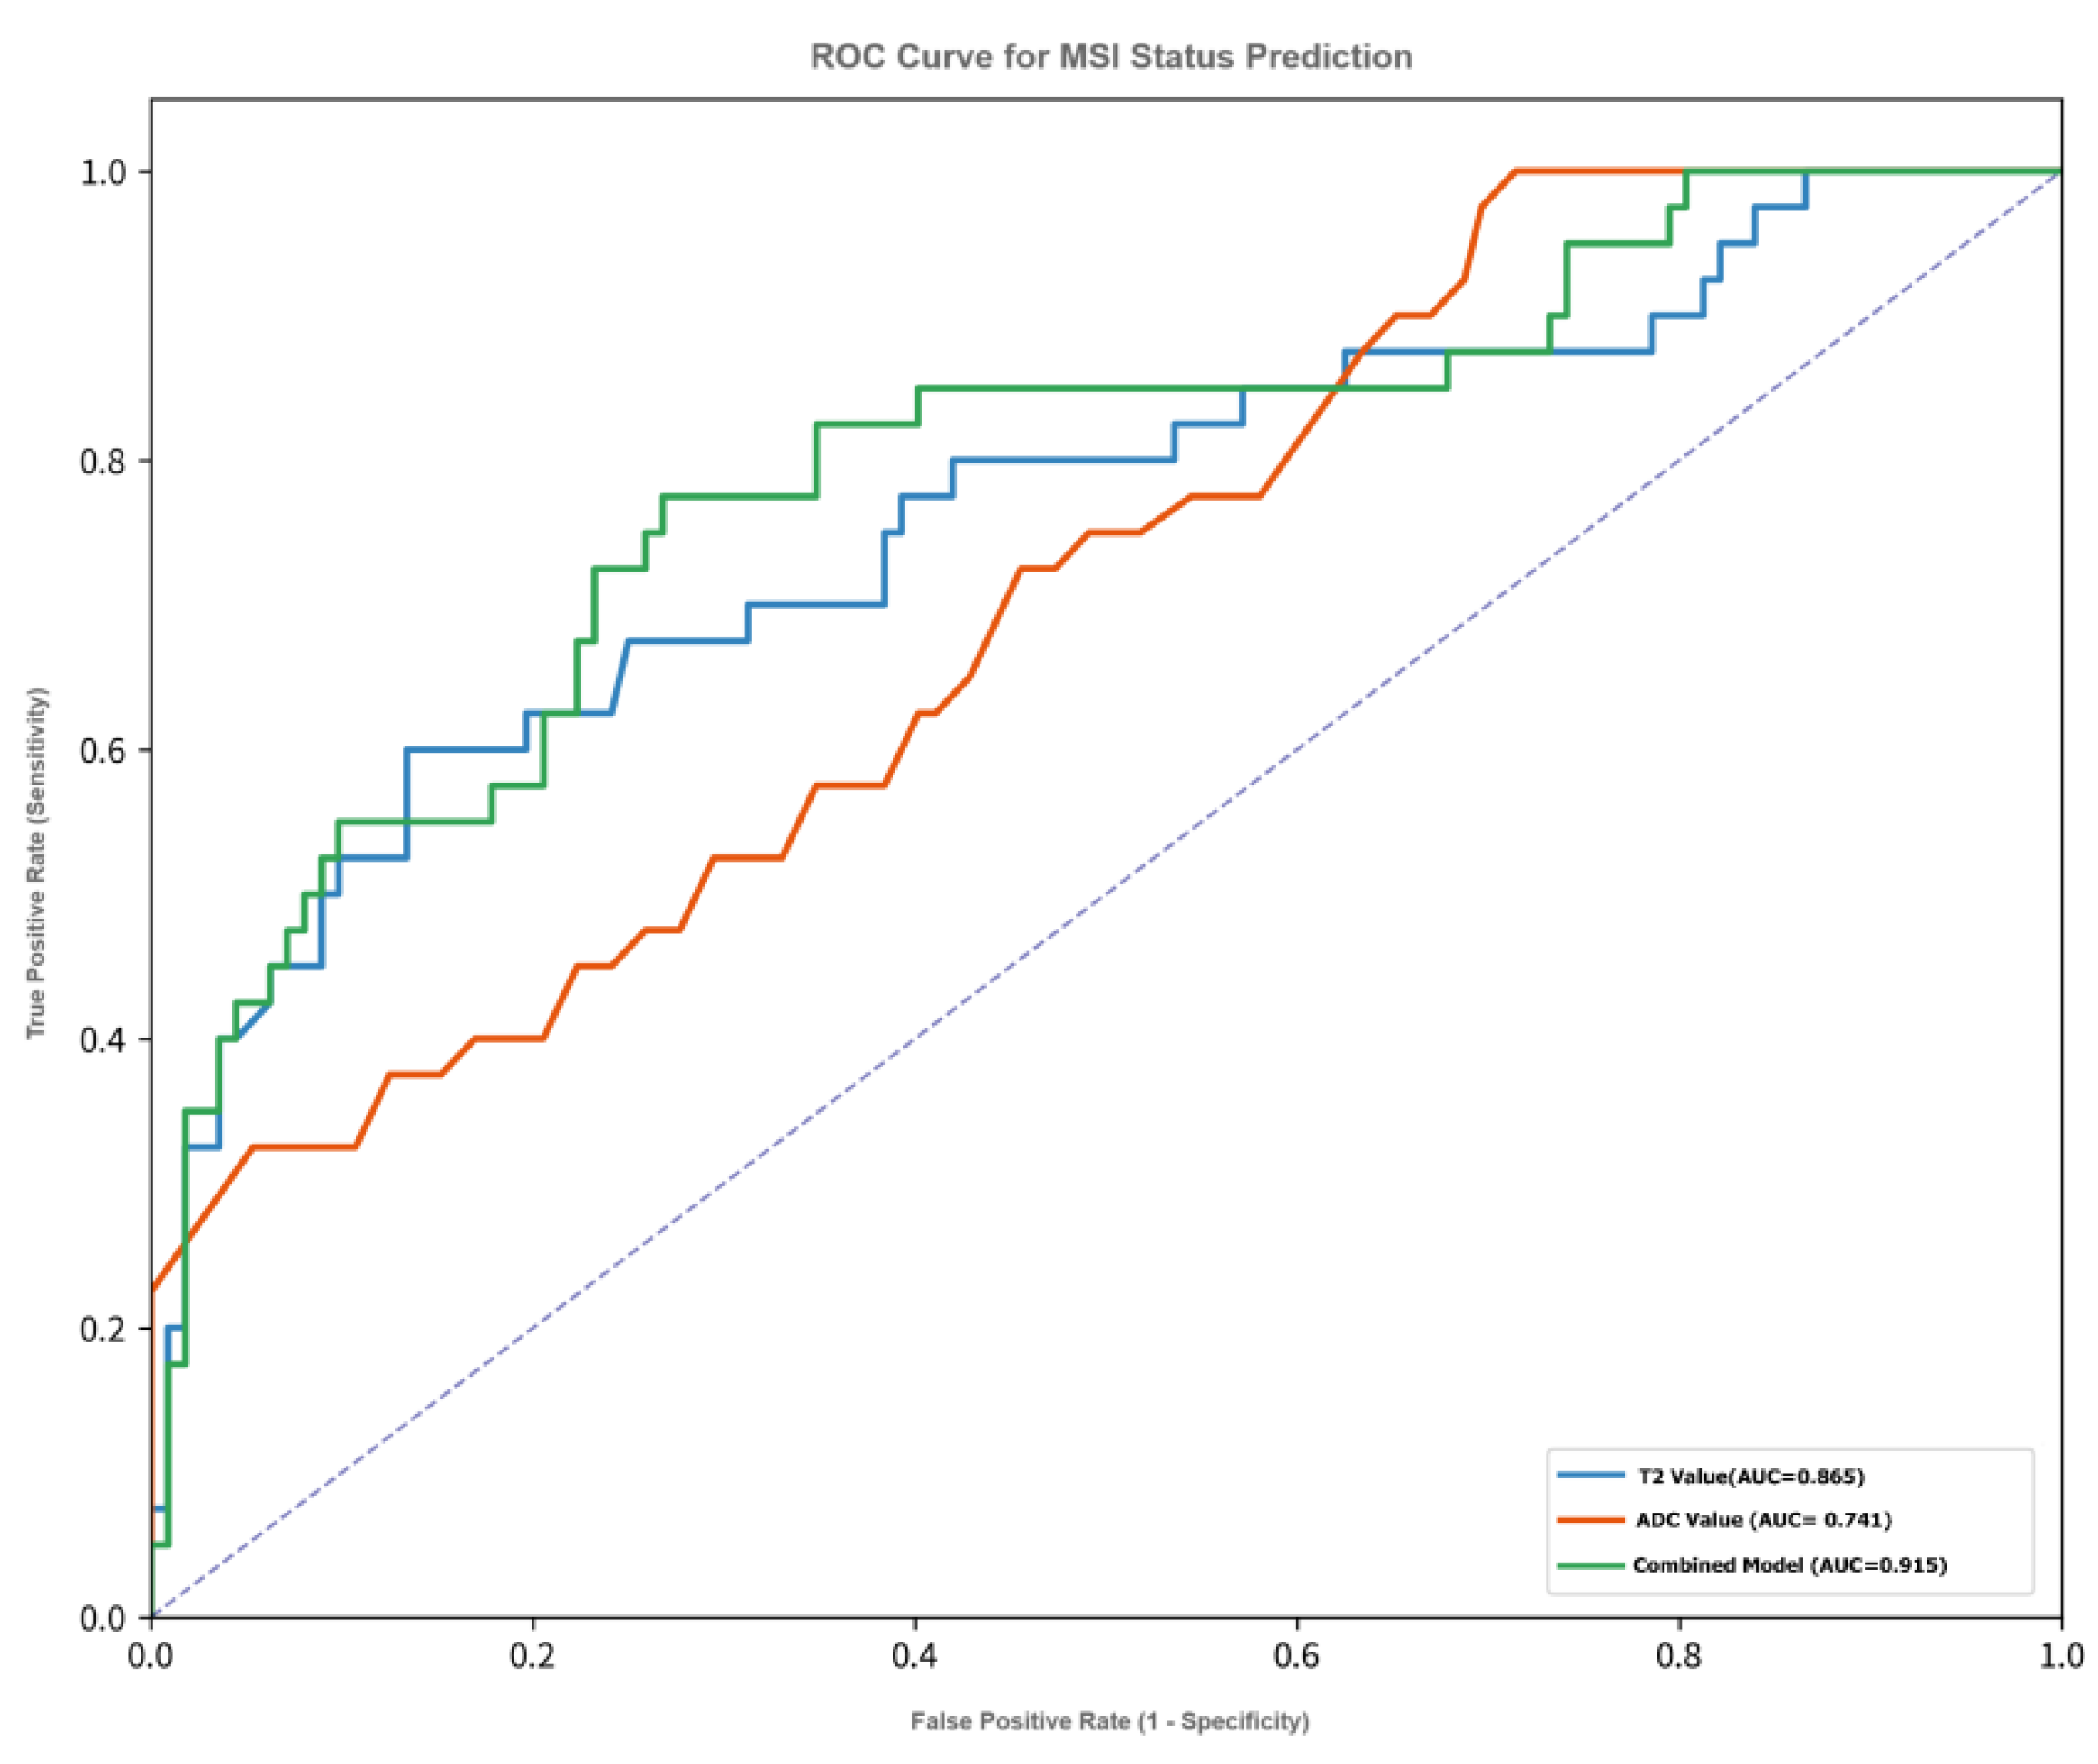
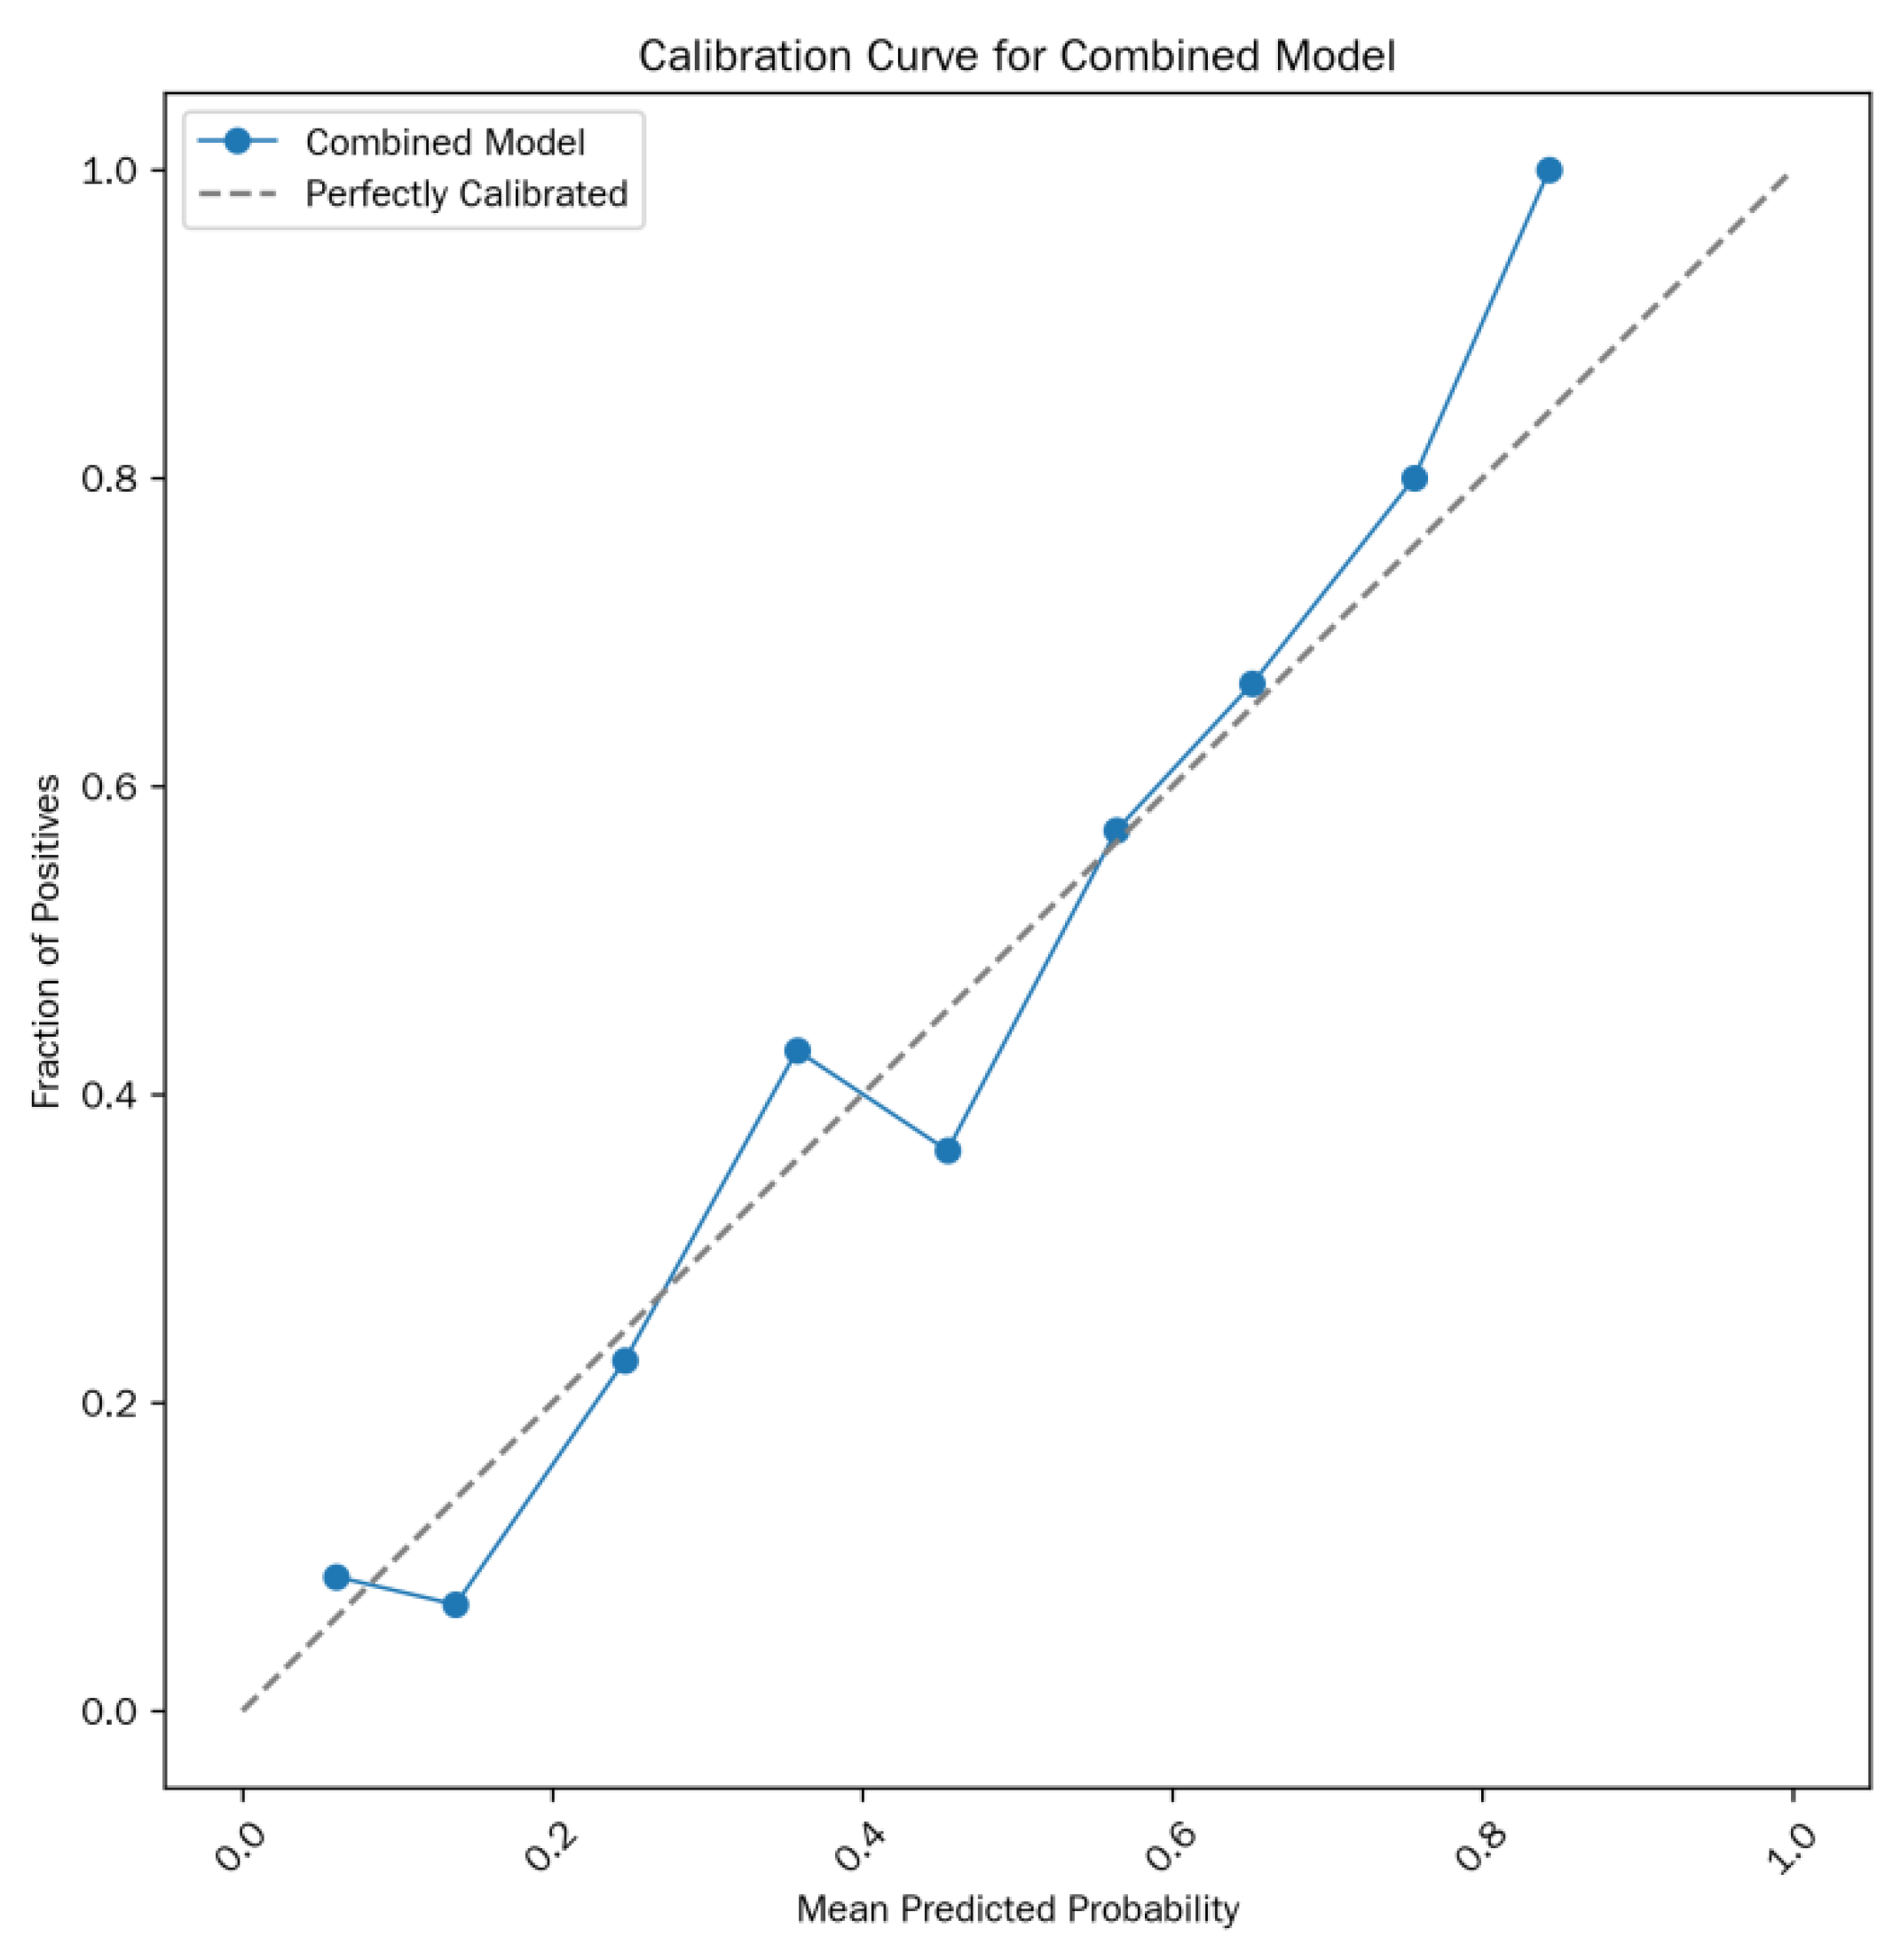
Objective: To explore the feasibility and diagnostic efficacy of T₂ mapping technique combined with apparent diffusion coefficient (ADC) value in preoperatively predicting the microsatellite instability (MSI) status of rectal cancer. Methods: A retrospective analysis was performed on MRI data of 152 patients with pathologically confirmed rectal cancer from January 2022 to June 2025, including 40 cases in the MSI group and 112 cases in the microsatellite stability (MSS) group. All patients underwent T₂ mapping and diffusion-weighted imaging (DWI) scans, and the tumor T₂ values and ADC values were measured. Independent samples t-test was used to compare differences between groups, receiver operating characteristic (ROC) curve analysis was applied to evaluate diagnostic efficacy, multivariate logistic regression was used to construct a combined prediction model, and 10-fold cross-validation and Bootstrap resampling were conducted to assess model stability. Results: The T₂ value in the MSI group was significantly lower than that in the MSS group (92.18 ± 7.21 ms vs. 99.47 ± 7.85 ms, p < 0.001), and the ADC value in the MSI group was significantly higher than that in the MSS group (1.06 ± 0.18 vs. 0.91 ± 0.19 × 10⁻³ mm²/s, p < 0.001). The area under the curve (AUC) of T₂ value for predicting MSI was 0.865, and that of ADC value was 0.741; the AUC of the combined model increased to 0.915 (sensitivity: 82.5%, specificity: 89.3%). The model showed good stability (Bootstrap AUC = 0.913). Conclusion: T₂ mapping combined with ADC value can non-invasively and accurately predict the MSI status of rectal cancer. The diagnostic efficacy of the combined model is significantly superior to that of a single parameter, indicating high potential for clinical translation.
Keywords:
1. Introduction
2. Materials and Methods
2.1. General Data
2.2. Equipment and Methods
2.3. Image Analysis
2.4. Statistical Analysis
3. Results
3.1. Baseline Characteristics of Patients

| Parameter | MSI group (n=40) | MSS group (n=112) | Test statistic | p-value |
|---|---|---|---|---|
| Age (years) | 62.5 ± 10.3 | 63.8 ± 9.6 | t = -0.71 | 0.478 |
| Gender (male/female) | 18/22 | 60/52 | χ² = 0.12 | 0.728 |
| BMI (kg/m²) | 24.1 ± 2.3 | 23.8 ± 2.5 | t = 0.65 | 0.516 |
| Tumor location (low/middle/high) | 15/17/8 | 42/50/20 | χ² = 0.58 | 0.748 |
| T₂ value (ms) | 92.18 ± 7.21 | 99.47 ± 7.85 | t = -5.89 | < 0.001 |
| ADC value (×10⁻³ mm²/s) | 1.06 ± 0.18 | 0.91 ± 0.19 | t = 4.78 | < 0.001 |
| Clinical stage (I/II/III) | 12/18/10 | 28/50/34 | χ² = 0.35 | 0.84 |
3.2. Results of Univariate Analysis
3.3. Comparison of Imaging Parameters Among Different Clinical Stages (Table 2)
| Clinical Stage | Number of Cases (MSI/MSS) | AUC (95% CI) | Sensitivity (%) | Specificity (%) | PPV (%) | NPV (%) |
| Stage I | 12/28 | 0.89 (0.81-0.97) | 83.3 | 89.3 | 76.2 | 92.9 |
| Stage II | 18/50 | 0.92 (0.86-0.98) | 82.2 | 90.0 | 77.8 | 92.3 |
| Stage III | 10/34 | 0.90 (0.82-0.98) | 80.0 | 88.2 | 72.7 | 91.2 |
3.4. Construction of Multivariate Logistic Regression Model
| Variable | β coefficient | Standard error (SE) | Wald χ² value | p-value | OR (95% CI) |
|---|---|---|---|---|---|
| Intercept | -13.15 | 3.38 | 15.22 | < 0.001 | - |
| T₂ value | 0.09 | 0.03 | 7.31 | 0.006 | 1.09 (1.03-1.16) |
| ADC value | 4.32 | 1.43 | 8.98 | 0.002 | 74.15 (8.53-643.21) |
| BMI | -0.05 | 0.03 | 2.81 | 0.094 | 0.95 (0.89-1.01) |
| Tumor location (middle vs. low) | 0.13 | 0.36 | 0.13 | 0.719 | 1.14 (0.55-2.30) |
| Image quality (2 points vs. 1 point) | -0.22 | 0.39 | 0.32 | 0.573 | 0.80 (0.40-1.59) |
3.5. Diagnostic Efficacy of the Combined Model
4. Discussion
5. Conclusions
Author Contributions
Funding
Institutional Review Board Statement
Informed Consent Statement
Data Availability Statement
Acknowledgments
Conflicts of Interest
Abbreviations
| ANOVA | Analysis of Variance |
| AUC | Area Under the Curve |
| BMI | Body Mass Index |
| CI | Confidence Interval |
| dMMR | Deficient Mismatch Repair |
| MMR | Mismatch Repair |
| MRI | Magnetic Resonance Imaging |
| MSI | Microsatellite Instability |
| MSI-H | Microsatellite Instability-High |
| MSI-L | Microsatellite Instability-Low |
| MSS | Microsatellite Stability |
| ROI | Region of Interest |
| ROC | Receiver Operating Characteristic |
References
- Swets, M.; Graham Martinez, C.; van Vliet, S.; et al. Microsatellite instability in rectal cancer: What does it mean? A study of two randomized trials and a systematic review of the literature. Histopathology 2022, 81, 352–362. [Google Scholar] [CrossRef]
- O'Connell, E.; Reynolds, I.S.; McNamara, D.A.; Prehn, J.H.M.; Burke, J.P. Microsatellite instability and response to neoadjuvant chemoradiotherapy in rectal cancer: A systematic review and meta-analysis. Surg Oncol. 2020, 34, 57–62. [Google Scholar] [CrossRef]
- Desir, A.D.; Ali, F.G. Microsatellite Instability in Colorectal Cancer: The Evolving Role of Immunotherapy. Dis Colon Rectum 2023, 66, 1303–1307. [Google Scholar] [CrossRef]
- Xia, F.; Wang, Y.; Wang, H.; et al. Randomized Phase II Trial of Immunotherapy-Based Total Neoadjuvant Therapy for Proficient Mismatch Repair or Microsatellite Stable Locally Advanced Rectal Cancer (TORCH). J Clin Oncol 2024, 42, 3308–3318. [Google Scholar] [CrossRef]
- Cai, Z.; Xu, Z.; Chen, Y.; et al. Multiparametric MRI subregion radiomics for preoperative assessment of high-risk subregions in microsatellite instability of rectal cancer patients: A multicenter study. Int J Surg 2024, 110, 4310–4319. [Google Scholar] [CrossRef]
- Mahmoud, N.N. Colorectal Cancer: Preoperative Evaluation and Staging. Surg Oncol Clin N Am 2022, 31, 127–141. [Google Scholar] [CrossRef]
- Ludford, K.; Ho, W.J.; Thomas, J.V.; et al. Neoadjuvant Pembrolizumab in Localized Microsatellite Instability High/Deficient Mismatch Repair Solid Tumors. J Clin Oncol 2023, 41, 2181–2190. [Google Scholar] [CrossRef]
- REACCT Collaborative. Microsatellite instability in young patients with rectal cancer: Molecular findings and treatment response. Br J Surg 2022, 109, 251–255. [Google Scholar] [CrossRef]
- Yu, J.H.; Xiao, B.Y.; Li, D.D.; et al. Neoadjuvant camrelizumab plus apatinib for locally advanced microsatellite instability-high or mismatch repair-deficient colorectal cancer (NEOCAP): A single-arm, open-label, phase 2 study. Lancet Oncol 2024, 25, 843–852. [Google Scholar] [CrossRef]
- Zheng, X.; Lu, T.; Tang, Q.; Yang, M.; Fan, Y.; Wen, M. The clinical value of applying diffusion-weighted imaging combined with T2-weighted imaging to assess diagnostic performance of muscularis propria invasion in mid-to-high rectal cancer. Abdom Radiol (NY) 2025, 50, 598–607. [Google Scholar] [CrossRef]
- Tosi, F.; Salvatore, L.; Tamburini, E.; et al. Curative immune checkpoint inhibitors therapy in patients with mismatch repair-deficient locally advanced rectal cancer: A real-world observational study. ESMO Open 2024, 9, 103929. [Google Scholar] [CrossRef]
- Alshenaifi, J.Y.; Vetere, G.; Maddalena, G.; et al. Mutational and co-mutational landscape of early onset colorectal cancer. Biomarkers 2025, 30, 64–76. [Google Scholar] [CrossRef]
- Zhang, W.; Huang, Z.; Zhao, J.; et al. Development and validation of magnetic resonance imaging-based radiomics models for preoperative prediction of microsatellite instability in rectal cancer. Ann Transl Med 2021, 9, 134. [Google Scholar] [CrossRef]
- Li, Y.; Tan, L.; Chen, N.; et al. Neoadjuvant Immunotherapy Alone for Patients With Locally Advanced and Resectable Metastatic Colorectal Cancer of dMMR/MSI-H Status. Dis Colon Rectum 2024, 67, 1413–1422. [Google Scholar] [CrossRef]
- Zhang, H.; Huang, J.; Xu, H.; et al. Neoadjuvant immunotherapy for DNA mismatch repair proficient/microsatellite stable non-metastatic rectal cancer: A systematic review and meta-analysis. Front Immunol. 2025, 16, 1523455. [Google Scholar] [CrossRef]
- Su, W.; Ling, Y.; Yang, X.; Wu, Y.; Xing, C. Tumor microenvironment remodeling after neoadjuvant chemoradiotherapy in local advanced rectal cancer revealed by single-cell RNA sequencing. J Transl Med 2024, 22, 1037. [Google Scholar] [CrossRef]
- Cianchi, F.; Palomba, A.; Messerini, L.; et al. Tumor angiogenesis in lymph node-negative rectal cancer: Correlation with clinicopathological parameters and prognosis. Ann Surg Oncol 2002, 9, 20–26. [Google Scholar] [CrossRef]
- Ambrosini, M.; Rousseau, B.; Manca, P.; et al. Immune checkpoint inhibitors for POLE or POLD1 proofreading-deficient metastatic colorectal cancer. Ann Oncol 2024, 35, 643–655. [Google Scholar] [CrossRef]
- Junior, J.N.A.; Preto, D.D‘.; Lazarini, M.E.Z.N.; et al. PD-L1 expression and microsatellite instability (MSI) in cancer of unknown primary site. Int J Clin Oncol 2024, 29, 726–734. [Google Scholar] [CrossRef]
- Wang, Y.; Xie, B.; Wang, K.; et al. Multi-parametric MRI Habitat Radiomics Based on Interpretable Machine Learning for Preoperative Assessment of Microsatellite Instability in Rectal Cancer. Acad Radiol. 2025. [CrossRef]
- Yao, X.; Deng, S.; Han, X.; et al. Deep Learning Algorithm-Based MRI Radiomics and Pathomics for Predicting Microsatellite Instability Status in Rectal Cancer: A Multicenter Study. Acad Radiol 2025, 32, 1934–1945. [Google Scholar] [CrossRef] [PubMed]
- Xing, X.; Li, D.; Peng, J.; Shu, Z.; Zhang, Y.; Song, Q. A combinatorial MRI sequence-based radiomics model for preoperative prediction of microsatellite instability status in rectal cancer. Sci Rep 2024, 14, 11760. [Google Scholar] [CrossRef] [PubMed]
- Zheng, C.Y.; Zhang, J.M.; Lin, Q.S.; et al. Noninvasive prediction of microsatellite instability in stage II/III rectal cancer using dynamic contrast-enhanced magnetic resonance imaging radiomics. World J Gastrointest Oncol 2025, 17, 108362. [Google Scholar] [CrossRef] [PubMed]
Disclaimer/Publisher’s Note: The statements, opinions and data contained in all publications are solely those of the individual author(s) and contributor(s) and not of MDPI and/or the editor(s). MDPI and/or the editor(s) disclaim responsibility for any injury to people or property resulting from any ideas, methods, instructions or products referred to in the content. |
© 2025 by the authors. Licensee MDPI, Basel, Switzerland. This article is an open access article distributed under the terms and conditions of the Creative Commons Attribution (CC BY) license (https://creativecommons.org/licenses/by/4.0/).


