
Submitted:
02 October 2025
Posted:
03 October 2025
You are already at the latest version
Abstract
Background: Sarcopenia is a major cause of physical decline in older adults with type 2 diabetes (T2DM). Nutritional interven-tions, especially high-protein diets, are clinically recommended, but their long-term effectiveness and tolerability in very elderly diabetes patients remain unclear.
Objective: We investigated whether an 18-month dietary intervention improves muscle mass and strength in patients aged ≥75 years with T2DM, and whether serum amino acids (AAs) and hormonal profiles reflect these changes.
Methods: We enrolled 44 subjects aged ≥75 years with T2DM. Nutritional counseling was provided at baseline, 6, 12, and 18 months. Skeletal muscle index (SMI), grip strength, and gait speed as well as fasting plasma hormones and AAs were assessed at each visit. Sex-normalized SMI (nSMI) and grip strength (nGrip) were calculated, and multiple linear regression analysis was per-formed.
Results: SMI improved at 6 and 12 months; gait speed improved at 6 months. Grip strength showed a significant increase at 12 months. Changes in ΔnSMI were independently associated with Δglucagon (positive) and ΔC-peptide (CPR)(negative), while Δn-Grip was inversely associated with Δglucagon at 6 months. Increases in two AAs were linked to reduced ΔnSMI and increases in 16 AAs were linked to reduced ΔnGrip. Renal and hepatic function remained stable over 18 months.
Conclusion: Long-term dietary intervention is effective for improving sarcopenia-related outcomes in very elderly patients with T2DM while maintaining general metabolic stability. Early changes in glucagon, CPR, and AAs levels may contribute to these improvements.
Keywords:
amino acid
; glucagon
; sarcopenia
; dietary guidance
; elderly T2DM
1. Introduction
The growth of the aging population has led to a substantial increase in elderly individuals with type 2 diabetes mellitus (T2DM) worldwide, a group often suffering from multiple comorbidities such as sarcopenia, osteoporosis, and cognitive impairment. In Japan, approximately 70% of patients with T2DM are aged ≥65 years, and the decline in physical and cognitive function among these individuals often results in loss of independence and reduced healthy life expectancy. Notably, sarcopenia has been reported to be approximately three times more prevalent in individuals with T2DM compared to those without diabetes [1]. In addition, East Asians are characterized by less obesity and insulin secretion compared to Caucasians [2], suggesting the possibility of increased susceptibility to sarcopenia. Comprehensive strategies to maintain musculoskeletal health and function in this population are urgently needed.
Moreover, elderly patients with long-standing T2DM often experience progressive renal impairment, prompting dietary restrictions including reduced protein and sodium intake. In patients with moderate to severe chronic kidney disease (CKD), a protein-restricted diet (typically less than 0.8 g/kg/day) is often recommended to slow the decline in estimated glomerular filtration rate (eGFR) and reduce nitrogenous waste production [3]. Nutritional management therefore plays a critical role in preventing sarcopenia among older adults. The European Society for Clinical Nutrition and Metabolism (ESPEN) recommends a protein intake of at least 1.0 g/kg/day in older individuals to preserve muscle mass and function [4]. However, the optimal level of protein intake that balances the prevention of sarcopenia with renal safety in older adults with T2D (particularly those aged 75 years and above) remains problematic.
Insulin and amino acids (AAs), particularly branched-chain amino acids (BCAAs), are essential regulators of skeletal muscle protein synthesis [5,6]. In contrast, glucagon, a counter-regulatory hormone to insulin, is markedly stimulated by protein intake and plays a central role in hepatic AAs catabolism, thereby contributing to systemic AAs homeostasis [7,8,9,10]. Thus, not only nutrients but also nutrient-stimulated hormones such as glucagon regulate AAs metabolism [11]. As a result, plasma AAs concentrations are tightly regulated by dietary protein intake and the coordinated actions of insulin and glucagon. Furthermore, fibroblast growth factor 21 (FGF21), which is regulated by protein intake [12], is a hepatokine involved in energy expenditure, glucose metabolism, and the regulation of body composition [13]. These hormonal factors and AAs profiles may reflect an individual’s protein nutritional status as well as influence skeletal muscle mass and function Thus, in T2DM, patients, dysregulated glucagon secretion, hepatic steatosis, and altered AAs profiles all may contribute to alterations in skeletal muscle mass and bone metabolism. The interrelationship among dietary protein intake, pancreatic/hepatic hormonal signaling, hepatic function, AAs metabolism, and musculoskeletal health in elderly patients with T2DM remains insufficiently explored.
This study evaluates muscle mass and strength and potential declines in renal and liver function under long-term dietary intervention in Japanese T2DM patients aged ≥75 years. We also investigate serum AAs and hormonal profiles as reflective of muscle mass and strength in these patients.
2. Materials and Methods
2.1. Study Population
We enrolled consecutive outpatients aged ≥75 years with T2DM who visited the outpatient department of Fujita Health University Hospital between March 2021 and March 2023.
2.2. Study Designs
This was a single-arm, exploratory, prospective, open-label interventional study aimed at evaluating the effects of individualized nutritional counseling on sarcopenia-related indicators in older adults with T2DM. The intervention consisted of non-invasive, standard-of-care dietary guidance delivered as part of routine clinical practice.
2.3. Intervention and Follow-Up Schedule
Registered dietitians provided individualized nutritional counseling at baseline, 6 months, and 12 months, targeting protein intake ≥1.0 g/kg/day and energy intake 25–35 kcal/kg/day. Adequate calcium and vitamin D intake and moderate physical activity were encouraged. Clinical assessments were performed at baseline and every 6 months up to 18 months (visits 1–4).
2.4. Outcomes and Assessments
Primary outcomes were skeletal muscle index (SMI), grip strength, and gait speed. SMI was measured by bioelectrical impedance analysis (InBody 770; InBody Co., Ltd., Seoul, Korea). Grip strength was assessed in the dominant hand using a digital handgrip dynamometer (Smedley Hand Dynamometer®; Saehan Corporation, Changwon, Korea). Each test was performed three times within a 5-minute period, and the mean value was recorded. Gait speed was evaluated using a 6-meter usual gait speed test recommended by the Asian Working Group for Sarcopenia (AWGS) 2019 criteria [14]. Sarcopenia was diagnosed according to the AWGS 2019 consensus criteria: SMI <7.0 kg/m² in men or <5.7 kg/m² in women; grip strength <28 kg in men or <18 kg in women; gait speed <1.0 m/s. Secondary outcomes included serum AAs concentrations, renal function (eGFR based on creatinine, eGFRcreat; and eGFR based on cystatin C, eGFRcys), hepatic steatosis/fibrosis (controlled attenuation parameter, CAP [dB/m]; liver stiffness by elastography [kPa]), insulin resistance indices (TG/HDL-C ratio[Triglyceride/High-Density Lipoprotein Cholesterol ratio], TyG index[Triglyceride/Glucose index]), and endocrine/metabolic markers (glucagon, C-peptide [CPR], FGF21, hemoglobin A1c [HbA1c], free fatty acids [FFA]). CKD was defined as eGFRcreat <60 mL/min/1.73 m² [15]. Dietary intake was assessed by a validated Food Frequency Questionnaire (FFQ) suitable for estimating AAs intake in Japanese populations [16], together with blood biochemistry. Nutritional counseling followed the 7th edition of the Food Exchange List for Dietary Therapy in Diabetes (Japan Diabetes Society) [17]. Fasting blood samples were collected in the morning. Glucagon was measured using a glucagon ELISA (Mercodia, Uppsala, Sweden) and FGF21 using an FGF21 ELISA (BioVendor, Brno, Czech Republic). Routine biochemistry was analyzed on an automated analyzer (LABOSPECT 008; Hitachi High-Tech, Tokyo, Japan). Serum AAs were quantified at four time points (baseline, 6, 12, 18 months) by high-performance liquid chromatography (HPLC). Hepatic steatosis and fibrosis were assessed by transient elastography (FibroScan; Echosens, Paris, France) to obtain CAP (dB/m) and liver stiffness (kPa). eGFRcys and eGFRcreat were calculated at baseline, 6, 12, and 18 months. TG/HDL-C ratio and TyG index were calculated at baseline and every 6 months. Linear mixed-effects models (LMMs) with time as a fixed effect and participant as a random intercept were used to estimate longitudinal trends; annualized slopes (β/year) were derived.
2.5. Statistical Analysis
Analyses were performed using JMP version 18.0.1 (SAS Institute Inc., Cary, NC, USA). Continuous data is presented as mean ± SD. Paired t-tests were used to assess changes versus baseline. We computed Pearson correlation coefficients between AAs (n=24; including BCAAs and total AAs), SMI, grip strength, and gait speed; partial correlations were additionally adjusted for age and sex (sex coded 0=male, 1=female). Stepwise multiple linear regression identified independent predictors of the three sarcopenia indices. Two-sided p<0.05 was considered statistically significant.
2.6. Principal Component Analysis (PCA) of Δ AAs
For multivariate profiling, PCA was performed on 6-month changes in serum AAs concentrations. Each change was defined as ΔAAs = AAs 6M – AAs baseline (three-letter codes). The dataset for PCA comprised already standardized Δ values (mean 0, SD 1) for 22 AAs; no additional difference or standardization procedures were performed. To avoid imputation-related artifacts, participants with any missing value among the 22 standardized ΔAAs were excluded listwise (final N=39 for PCA). PCA analysis was conducted on the correlation structure (equivalently, the covariance of z-scored variables) using singular value decomposition without rotation; components were ordered by decreasing eigenvalues. Eleven components explained 90.38% of total variance. Scree plot, loading matrices, and component scores were used for interpretation.
3. Results
3.1. Participant Flow and Baseline Characteristics
A total of 44 older adults with T2DM underwent baseline assessments at study entry (Figure 1). During follow-up, five participants were discontinued due to pancreatic cancer, prostate cancer, death, lower-limb amputation, or voluntary withdrawal. In accordance with the intention-to-treat principle, data obtained prior to withdrawal were included in the analysis. Ultimately, 39 participants completed the 18-month follow-up and were included in the longitudinal evaluation.
Forty-four older adults with T2DM were enrolled at baseline (Visit 1). Withdrawals occurred before Visit 2 (n = 1), Visit 3 (n = 1), and Visit 4 (n = 3) due to pancreatic cancer, voluntary discontinuation, death, prostate cancer, or lower limb amputation. Data from withdrawn participants was included in analyses when available. Final sample sizes were n = 43 at 6 months, n = 42 at 12 months, and n = 39 at 18 months.
Baseline characteristics of the 44 participants (19 men, 25 women) are summarized in Table 1. The mean age was 80.0 ± 3.8 years, without a sex difference. Men had significantly greater height, weight, total body water, protein mass, muscle mass, skeletal muscle mass, and SMI than women. Grip strength was higher in men, whereas gait speed and lower-limb muscle power did not differ by sex. Biochemically, men showed higher serum creatinine and lower eGFRcreat, consistent with higher muscle mass; uric acid was also higher in men. No sex differences were observed for aspartate aminotransferase (AST), alanine aminotransferase (ALT), gamma-glutamyl transferase (GGT), Fibrosis-4 index (FIB4 index), liver stiffness (elastography), or CAP. Glycemic markers (HbA1c, fasting glucose), endocrine markers (CPR, glucagon, FGF21), lipid profiles (triglycerides, low-density lipoprotein cholesterol[LDL-C], and high-density lipoprotein cholesterol [HDL-C]) were comparable between sexes. Overall, participants were functionally independent with relatively preserved muscle mass; however, lower grip strength in women suggested greater vulnerability to sarcopenia.
3.2. Baseline Nutritional Intake
Dietary intake at baseline was compared with targets recommended by dietitians at intervention start (Table 2). Targets reflect the levels intended to be achieved through counseling (not post-intervention intake). Protein intake was advised to increase from 1.26 ± 0.37 g/kg IBW at baseline to a target of 1.41 ± 0.23 g/kg IBW, with total energy intake maintained.
3.3. Changes in Sarcopenia-Related Indices, Organ/Metabolic Parameters, and Metabolic Hormones
The prevalence of sarcopenia (AWGS 2019 criteria [14]) declined from 22/44 (50.0%) at baseline (11 men, 11 women) to 14/44 (31.8%) at 6 months, 15/42 (35.7%) at 12 months, and 17/39 (43.6%) at 18 months; the proportion at 6 months was significantly lower than baseline. Physical function and muscle-related outcomes improved (Figure 2). SMI increased significantly at 6 and 12 months, grip strength trended upward at 6 months and reached significance at 12 months, and gait speed improved at 6 months. None of these indices showed significant deterioration during follow-up. Subgroup analyses suggested larger gains in SMI and grip strength among men than women.
Renal, hepatic, and metabolic trajectories are shown in Figure 3. The prevalence of CKD (eGFRcreat <60 mL/min/1.73 m² [15]) was 14/44 (31.8%) at baseline, 19/43 (44.2%) at 6 months, 13/42 (31.0%) at 12 months, and 13/39 (33.3%) at 18 months, with no significant change over time. Over 18 months, eGFRcys declined significantly with an annualized slope of −2.97 mL/min/1.73 m² per year (p = 0.00042), while eGFRcreat showed no significant change (+0.18 mL/min/1.73 m² per year; p = 0.867). Hepatic measures were stable overall. ΔCAP was −3.89 dB/m per year (p = 0.422) and liver stiffness was +0.13 kPa per year (p = 0.454). Atherogenic/metabolic indices showed no linear trends. ΔTG/HDL-C ratio was −0.14 per year (p = 0.179) and ΔTyG index was +0.049 per year (p = 0.260).
Temporal patterns of HbA1c, glucagon, CPR, and FGF21 are presented in Figure 4. HbA1c decreased at 6 and 12 months (modeled slope −0.26% per year). Glucagon increased at 12 and 18 months (modeled slope +3.49 pg/mL per year). CPR remained stable (slope −0.03 ng/mL per year). FGF21 declined at 12 and 18 months (slope −72.94 pg/mL per year).
3.4. Baseline Associations of AAs and Hormones with Sarcopenia-Related Indices
Cross-sectional associations at baseline are shown in Table 3. In univariate analyses, SMI correlated positively with total AAs, especially BCAAs (valine [Val], leucine [Leu], isoleucine [Ile]), ornithine (Orn), glutamic acid (Glu), and proline (Pro). After adjustment for age and sex, significant associations were found for cysteine (Cys), Orn, and Glu.
Grip strength correlated positively with Val and Leu in unadjusted models; these associations attenuated and were not significant after adjustment. By contrast, gait speed showed negative associations with Ile, alanine (Ala), and total AAs. After adjustment for age and sex, Leu, Ile, Ala, BCAAs, and total AAs showed inverse associations with gait speed.
We next explored associations of hormonal biomarkers with clinical/functional variables (Table 4). CPR correlated positively with BMI and fat mass, SMI, serum creatinine, and cystatin C, and negatively with eGFRcreat, eGFRcys, and HDL-C after adjustment for age and sex. CPR also correlated positively with ALT, γ-GTP, triglycerides, and FGF21. Glucagon showed no associations with any parameters in the adjusted model. FGF21 correlated positively with fat mass, cystatin C, and triglycerides, and negatively with gait speed, and grip strength.
3.5. Longitudinal Changes in AAs
Longitudinal changes in serum AAs are shown in Figure 5 (baseline, 6, 12, 18 months). Several AAs increased from baseline: Phe at 6 months; Cys at 12 months; Arg at 6 and 12 months; Cit at 6 and 18 months; Ala at 6, 12, and 18 months; and his at 12 and 18 months. Ser and Lys decreased from baseline at 12 and 18 months. Total AAs and the sum of BCAAs did not show significant longitudinal changes.
3.6. PCA and Multivariable Modeling of Changes in Sarcopenia Outcomes
PCA on standardized 6-month Δ AAs identified 11 components explaining 90.38% of total variance (Figure 6). PC1 and PC2 explained 34.0% and 13.8% (cumulative 47.8%). Loadings on PC1 were largest for BCAAs (ΔVal, ΔLeu, ΔIle), aromatic amino acids (aromatic AAs; ΔThr, ΔPhe, ΔTrp), and essential AAs (ΔLys, ΔMet, ΔHis). PC2 contrasted glucogenic/non-essential ΔAAs (ΔGly, ΔSer, ΔGln; with ΔAla positive) versus BCAAs/aromatic AAs (negative). PC3 opposed urea-cycle/acidic/basic ΔAAs (ΔAsp, ΔGlu, ΔCit, ΔOrn, ΔArg, ΔLys; negative) to ΔAla/ΔCys/ΔPro/ΔTrp (positive). The loading tables (PC1–PC11) are shown in Figure 6.
Multiple linear regression analyses were performed to identify predictors of changes in sarcopenia-related outcomes. The dependent variables were changes in sex-normalized SMI (ΔnSMI) and grip strength (ΔnGrip). Sex normalization was conducted by dividing each value by the sex-specific diagnostic thresholds (SMI: 7.0 kg/m² for men, 5.7 kg/m² for women; grip strength: 28 kg for men, 18 kg for women). The regression model for ΔnSMI was statistically significant (Table 5). ΔGlucagon was positively associated with ΔnSMI, whereas ΔCPR and PC8 were negatively associated (standardized β ≈ +0.41, −0.41, and −0.42; p ≈ 0.020, 0.022, and 0.0045, respectively). By contrast, PC2, PC3, and PC9 were not significant predictors. Inspection of PC8 loadings indicated a contrast between a positive side enriched for Gln/Gly (gluconeogenic/one-carbon) and Cit (urea-cycle), together with selected essential/BCAAs/aromatic AAs signals (Val, Met, Thr, Trp), versus a negative side marked by Phe (aromatic AAs), Ser/Asn (gluconeogenic), Glu (acidic), and His (basic), consistent with a nitrogen-disposal–oriented routing that blunts net muscle accretion. The regression model for ΔnGrip was also significant. ΔGlucagon was negatively associated with ΔnGrip. In addition, PC1 and PC7 were also negatively associated with ΔnGrip. Six-month increases in the concentrations of BCAAs (Val, Leu, Ile), aromatic AAs (Tyr, Phe, Trp), Thr, Ser, Asn, Pro, Ala, Met, His, Orn, Lys, and Arg, were associated with reduced nGrip. Changes in gait speed could not be modeled adequately, likely due to multicollinearity or limited variance.
4. Discussion
In the present study, we demonstrate that provision of nutritional guidance interventions every six months for 18 months to individuals aged 75 years or older with T2DM resulted in a transient increase in gait speed and sustained increases in muscle mass and grip strength without worsening renal function. Furthermore, we also found that changes in SMI were positively correlated with the changes of plasma glucagon levels and negatively correlated with the changes of plasma CPR levels, whereas changes in grip strength were inversely correlated with the changes of plasma glucagon.
Muscle mass decreases with age, but it is known that lower-limb muscle strength declines in older adults before muscle mass decreases [18]. Particularly in individuals with diabetes, the decline in muscle strength and muscle mass is pronounced due to insufficient insulin secretion and action [19]. AAs contributes to muscle synthesis alongside insulin [20]. Previous studies have reported a positive correlation between protein intake and muscle mass or strength in both elderly individuals with and without diabetes [21,22]. However, there are few clinical studies that have examined these muscle parameters after the intervention of a high-protein diet in elderly individuals. Recently, it was reported that providing high-protein intake at 1.5 g/kg/day for 6 months to hospitalized individuals aged 75 years or older with cancer, fractures, pneumonia, or urinary tract infections resulted in increased grip strength in comparison with individuals receiving standard protein intake at 1.0 g/kg/day [23]. In the present study, we first conducted a long-term intervention of 18 months, providing high-protein dietary guidance (1.5 g/kg/day) to individuals aged 75 years or older with diabetes and evaluating their muscle parameters. Temporal heterogeneity of responses was evident across sarcopenia indices. Gait speed improved early (6 months), consisting of rapid neuromuscular adaptations and task familiarity, but did not remain statistically different thereafter. SMI increased at 6 and 12 months, indicating structural accretion during the mid-phase of the intervention, yet the effect was not sustained at 18 months, possibly reflecting waning adherence, reduced sample size, or biological plateauing in very old adults. Grip strength peaked at 12 months only, suggesting delayed translation of mass accretion into strength with subsequent attenuation. Collectively, these findings argue for booster strategies (e.g., supervised resistance exercise blocks, adherence reinforcement, protein timing/quality optimization) to maintain gains beyond 12 months, particularly in 75 years and above populations with multimorbidity. Lower-limb motor function is determined by multiple factors, including balance, posture, vision, pain, and cognitive function [24,25]. It is possible that the improvement in lower-limb muscle strength was temporary due to impairments in multiple factors in the super-elderly aged 75 years or older in our study.
An important aspect of our study is the relationship between AAs and hormonal profiles with changes in muscle parameters. Some AAs promote glucagon secretion from pancreatic alpha cells [26], and glucagon regulates the metabolism of AAs in the liver [9]. Various animal models deficient in glucagon action show hyperaminoacidemia due to impaired glucagon signaling in the liver [10]. Glucagon receptor-deficient mice show increased lean mass [27], and glucagon-deficient mice display increased lean mass and grip strength concomitant with a slow-to-fast transition in type II fibers of skeletal muscle [28], likely due to hyperaminoacidemia. These findings led us to investigate the relationship between plasma glucagon and AAs levels and muscle parameters. In univariate analyses, baseline SMI and grip strength showed a positive correlation with plasma BCAAs levels, as previously reported [29], but this correlation was not observed after adjusting for age and sex in our super-elderly T2DM subjects. On the other hand, baseline gait speed displayed a negative correlation with plasma BCAAs, Ala, and total AAs levels after adjusting for age and sex. This suggests that AAs may play distinct roles in regulating upper- and lower-limb muscles. However, it remains to be investigated whether increased muscle breakdown in the lower limbs compared to the upper limbs leads to a decline in lower-limb strength concomitant with elevated plasma AAs concentrations, including Ala [30].Next, we examined the changes in plasma AAs and glucagon levels in super-elderly T2DM subjects. Although plasma total AAs and BCAAs remained unchanged over time, plasma Phe, Cys, Arg, Cit, Ala, His, and glucagon levels increased after the intervention. AAs such as Arg and Ala stimulate glucagon secretion in rodents and humans [31,32]. Thus, the increase in plasma glucagon concentration under fasting conditions may be caused by the rise in these AAs.
We further investigated whether changes in plasma AAs and glucagon influenced changes in SMI and muscle strength during the first 6 months of dietary guidance, when improvements in SMI and muscle strength were most pronounced. Longitudinal changes in plasma AAs were associated with changes in SMI and grip strength. Interestingly, plasma Ser and Lys concentrations decreased following dietary instruction, and their decline was paradoxically associated with improvements in grip strength. This contrasts with recent reports linking low Ser and Lys to early sarcopenia [33]. This discrepancy may be explained by differences in study duration, participant age, or difference in the proportion of patients with diabetes. Which factors regulate plasma Ser and Lys concentrations, including insulin resistance, remain unclear. While BCAAs are well-known contributors to muscle mass and strength [34], the effects of Ser and Lys on muscle health in super-elderly T2DM subjects require further investigation.
On the other hand, the change in plasma glucagon levels was negatively associated with the change in grip strength. These results are consistent with mouse studies showing that blockade of glucagon action enhances grip strength [28]. Interestingly, changes in glucagon were positively associated, and changes in CPR negatively associated, with changes in SMI in our subjects. HbA1c improved despite no change in plasma CPR levels after the intervention, suggesting that insulin sensitivity may have been enhanced. Although markers of insulin resistance (ΔTG/HDL-C ratio, ΔTyG index) as well as liver stiffness and steatosis indices (CAP) showed no significant change after the intervention, plasma FGF21 levels decreased despite stable BMI.
FGF21 levels rise in response to nutritional stress such as protein restriction and in metabolic states including insulin resistance, sarcopenia, and frailty, reflecting heightened metabolic stress and reduced functional reserve [12,36,37]. Thus, muscle mass and muscle strength may have distinct regulatory mechanisms. While insulin sensitivity is key to increasing muscle mass in the super-elderly with T2DM [35], how FGF21 contributes to muscle mass gain remains a topic for future investigation.
Multivariate analyses further revealed that specific AAs patterns and hormonal responses, particularly those involving BCAAs, urea cycle metabolites, glucagon, and FGF21, reflect complex metabolic states that extend beyond single-marker assessments. These findings support the clinical feasibility of protein-focused dietary strategies for preserving muscle health in very elderly adults and highlight the potential value of integrated biomarker profiling in informing personalized nutritional and therapeutic approaches.
This study has several strengths. It specifically targeted very old adults with T2DM, a population at particularly high risk for sarcopenia and underrepresented in prior research. Nutritional guidance was standardized and provided by dietitians, with explicit protein intake targets. Comprehensive, multi-system readouts, including muscle, renal, hepatic, and endocrine outcomes, were assessed longitudinally. Furthermore, we applied multivariate principal component analysis to characterize coordinated changes in AAs networks, providing an integrated view of metabolic adaptations.
Nonetheless, several limitations should be acknowledged. First, the absence of a control group limits our ability to distinguish intervention effects from natural changes in muscle function over time. Second, because our study population consisted exclusively of super-elderly individuals with T2DM, the sample size was relatively small, which may limit the generalizability of our findings. Third, dietary intake was assessed using FFQ, so the accuracy of the self-reported dietary data may be compromised due to age-related cognitive decline for some participants. Fourth, all biochemical assessments, including plasma AAs profiles and related hormones, were performed under fasting conditions rather than in the postprandial state. Therefore, protein intake may not have been fully reflected in circulating AAs and hormone concentrations, and our findings might not precisely capture dynamic changes in muscle protein synthesis. Future studies involving larger, multicenter cohorts, and detailed assessments of postprandial AAs kinetics are required to validate our observations and clarify the underlying mechanisms linking AAs homeostasis and sarcopenia.
5. Conclusions
In conclusion, long-term individualized nutritional guidance is safe and effective for mitigating sarcopenia in super-elderly patients with T2DM aged 75 years or older. In addition, early changes in glucagon, CPR, and amino acid profiles may serve as biomarkers of the intervention response, despite their divergent relationships with muscle mass and strength that highlight the need for further studies. Our present findings provide a foundation for the development of precision nutritional strategies aimed at preserving independence and quality of life in the oldest-old with diabetes.
Large-scale trials are warranted to validate and expand upon these findings and their effectiveness in maintaining independence and quality of life in this vulnerable population.
Author Contributions
The authors’ contributions are as follows: Conceptualization, T.T., Y.S., and A.S.; methodology, H.T., T.T., Y. S and A.S.; investigation, H.T., T.T., R.M., Y.A., S.H.,Y.Y., I.H., M.S., A.W., S.A., and A.I.; formal analysis, H.T., T.T, Y.F., H.K., Y.H., and S.H.; resources, A.W., S.A., A.I., and K.K.; date curation., H.T., T.T.; writing (original draft preparation), H.T., T.T., Y.S., and A.S.; writing (review and editing), H.T., T.T., Y.S., and A.S.; visualization; T.T., H.T.; supervision; A.S.; project administration; T.T., Y.S.; funding acquisition; Y.S., Y.A. All authors approve of the final version to be published. T.T. is the guarantor of this work and has full access to all data in the study and takes responsibility for the integrity of the data and the accuracy of the data analysis. All authors have read and agreed to the published version of the manuscript.
Funding
This study was supported by grants from the Japan Association for Diabetes Education and Care (to Y.S.), grants from Japan Society of Metabolism and Clinical Nutrition (to Y.A.), grants from Manpei Suzuki Diabetes Foundation (to Y.A.), and a research grant from Fujita Health University.:
Institutional Review Board Statement
The study was conducted according to the principles of the Declaration of Helsinki and approved by the Research Ethics Committee of Fujita Health University (approval number HM23-351).
Informed Consent Statement
Written informed consent was obtained from all the subjects involved in the study.
Data Availability Statement
The original contributions presented in the study are included in the article, further inquiries can be directed to the corresponding author.
Acknowledgments
The authors thank Takuya Haraguchi (Fujita Health University) for his valuable assistance with literature search and data collection.
Conflicts of Interest
The authors declare that they have no conflict of interest.
References
- Trierweiler, H.; Kisielewicz, G.; Jonasson, T.H.; Petterle, R.R.; Moreira, C.A.; Borba, V.Z.C. Sarcopenia: A Chronic Complication of Type 2 Diabetes Mellitus. Diabetol. Metab. Syndr. 2018, 10, 25. https://doi.org/10.1186/s13098-018-0326-5. [CrossRef]
- Yabe, D.; Seino, Y.; Fukushima, M.; Seino, S. β Cell Dysfunction versus Insulin Resistance in the Pathogenesis of Type 2 Diabetes in East Asians. Curr. Diab. Rep. 2015, 15, 36. https://doi.org/10.1007/s11892-015-0602-9. [CrossRef]
- Ko, G.J.; Obi, Y.; Tortorici, A.R.; Kalantar-Zadeh, K. Dietary Protein Intake and Chronic Kidney Disease. Curr. Opin. Clin. Nutr. Metab. Care 2017, 20, 77–85. https://doi.org/10.1097/MCO.0000000000000342. [CrossRef]
- Volkert, D.; Beck, A.M.; Cederholm, T.; Cruz-Jentoft, A.; Goisser, S.; Hooper, L.; et al. ESPEN Guideline on Clinical Nutrition and Hydration in Geriatrics. Clin. Nutr. 2019, 38, 10–47. https://doi.org/10.1016/j.clnu.2018.05.024. [CrossRef]
- Mann, G.; Mora, S.; Madu, G.; Adegoke, O.A.J. Branched-Chain Amino Acids: Catabolism in Skeletal Muscle and Implications for Muscle and Whole-Body Metabolism. Front. Physiol. 2021, 12, 702826. https://doi.org/10.3389/fphys.2021.702826. [CrossRef]
- Kamei, Y.; Miura, S. Regulation of Skeletal Muscle Function by Amino Acids. Nutrients 2020, 12, 261. https://doi.org/10.3390/nu12010261. [CrossRef]
- Kondo-Ando, M.; Uchino, H.; Nakamura, K.; Tsujimoto, K.; Ikeda, H.; Kashiwagi, A. Low-Carbohydrate Diet by Staple Change Attenuates Postprandial GIP and CPR Levels in Type 2 Diabetes Patients. J. Diabetes Complicat. 2019, 33, 107415. https://doi.org/10.1016/j.jdiacomp.2019.107415. [CrossRef]
- Ueno, S.; Takahashi, H.; Takeuchi, Y.; Kamei, Y. High-Protein Diet Feeding Aggravates Hyperaminoacidemia in Mice Deficient in Proglucagon-Derived Peptides. Nutrients 2022, 14, 975. https://doi.org/10.3390/nu14050975. [CrossRef]
- Holst, J.J. Glucagon and Amino Acids Are Linked in a Mutual Feedback Cycle: The Liver–α-Cell Axis. Diabetes 2017, 66, 235–240. https://doi.org/10.2337/db16-0994. [CrossRef]
- Hayashi, Y.; Seino, Y. Regulation of Amino Acid Metabolism and α-Cell Proliferation by Glucagon. J. Diabetes Investig. 2018, 9, 464–472. https://doi.org/10.1111/jdi.12797. [CrossRef]
- Seino, Y.; Yabe, D. Carbohydrate-Induced Weight Gain Models for Diabetes Research: Contribution of Incretins and Parasympathetic Signal. J. Diabetes Investig. 2021, 12, 9–11. https://doi.org/10.1111/jdi.13342. [CrossRef]
- Maekawa, R.; Ogawa, Y.; Shimizu, H.; Ushikai, M.; Fujimoto, S.; Tsuchiya, T.; et al. Chronic High-Sucrose Diet Increases Fibroblast Growth Factor 21 Production and Energy Expenditure in Mice. J. Nutr. Biochem. 2017, 49, 71–79. https://doi.org/10.1016/j.jnutbio.2017.07.010. [CrossRef]
- Lin, Z.; Tian, H.; Lam, K.S.L.; Lin, S.; Hoo, R.C.L.; Konishi, M.; Itoh, N.; Wang, Y.; Bornstein, S.R.; Xu, A.; et al. Adiponectin Mediates the Metabolic Effects of FGF21 on Glucose Homeostasis and Insulin Sensitivity in Mice. Cell Metab. 2013, 17, 779–789. https://doi.org/10.1016/j.cmet.2013.04.005. [CrossRef]
- Chen, L.K.; Woo, J.; Assantachai, P.; Auyeung, T.W.; Chou, M.Y.; Iijima, K.; et al. Asian Working Group for Sarcopenia: 2019 Consensus Update on Sarcopenia Diagnosis and Treatment. J. Am. Med. Dir. Assoc. 2020, 21, 300–307.e2. https://doi.org/10.1016/j.jamda.2019.12.012. [CrossRef]
- Kidney Disease: Improving Global Outcomes (KDIGO) CKD Work Group. KDIGO 2012 Clinical Practice Guideline for the Evaluation and Management of Chronic Kidney Disease. Kidney Int. Suppl. 2013, 3, 1–150. https://kdigo.org/wp-content/uploads/2017/02/KDIGO_2012_CKD_GL.pdf.
- Ishihara, J.; Inoue, M.; Kobayashi, M.; Tanaka, S.; Yamamoto, S.; Iso, H.; et al. Validity of a Self-Administered Food-Frequency Questionnaire in the Estimation of Amino Acid Intake. Br. J. Nutr. 2009, 101, 1393–1399. https://doi.org/10.1017/S0007114508079609. [CrossRef]
- Japan Diabetes Society. Food Exchange List: Dietary Therapy for Diabetes, 7th ed.; Bunkodo: Tokyo, Japan, 2013.
- Breen, L.; Phillips, S.M. Skeletal Muscle Protein Metabolism in the Elderly: Interventions to Counteract the ‘Anabolic Resistance’ of Ageing. Nutr. Metab. 2011, 8, 68. https://doi.org/10.1186/1743-7075-8-68. [CrossRef]
- Lu, Y.; Xu, Y.; Shao, Y.; Fang, Y.; et al. Lower Insulin Level Is Associated with Sarcopenia in Community-Dwelling Frail and Non-Frail Older Adults. Front. Med. 2022, 9, 971622. https://doi.org/10.3389/fmed.2022.971622. [CrossRef]
- Liu, Z.; Hou, J.; Chen, X.; Sun, X.; et al. Causal Relationship between Insulin Resistance and Sarcopenia. Diabetol. Metab. Syndr. 2023, 15, 46. https://doi.org/10.1186/s13098-023-01022-z. [CrossRef]
- Celis-Morales, C.A.; et al. Associations of Dietary Protein Intake with Fat-Free Mass and Grip Strength: A Cross-Sectional Study in 146,816 UK Biobank Participants. Am. J. Epidemiol. 2018, 187, 2405–2414. https://doi.org/10.1093/aje/kwy134. [CrossRef]
- Argyropoulou, D.; Michopoulou, E.; Psarra, G.; et al. Exercise and Nutrition Strategies for Combating Sarcopenia and Type 2 Diabetes Mellitus in Older Adults. J. Funct. Morphol. Kinesiol. 2022, 7, 48. https://doi.org/10.3390/jfmk7020048. [CrossRef]
- Moyama, S.; Yamaguchi, T.; et al. Efficacy and Safety of 6-Month High Dietary Protein Intake in Hospitalized Adults Aged 75 or Older at Nutritional Risk: An Exploratory, Randomized, Controlled Study. Nutrients 2023, 15, 2024. https://doi.org/10.3390/nu15092024. [CrossRef]
- Tiedemann, A.; Shimada, H.; Sherrington, C.; Murray, S.; Lord, S. Physiological and Psychological Predictors of Walking Speed in Older Community-Dwelling People. Gerontology 2005, 51, 390–395. https://doi.org/10.1159/000088703. [CrossRef]
- McGregor, R.A.; Cameron-Smith, D.; Poppitt, S.D. It Is Not Just Muscle Mass: A Review of Muscle Quality, Composition and Metabolism during Ageing as Determinants of Muscle Function and Mobility in Later Life. Longev. Healthspan 2014, 3, 9. https://doi.org/10.1186/2046-2395-3-9. [CrossRef]
- Richter, M.M.; et al. The Liver–α-Cell Axis in Health and in Disease. Diabetes 2022, 71, 1852–1861. https://doi.org/10.2337/dbi22-0004. [CrossRef]
- Gelling, R.W.; et al. Lower Blood Glucose, Hyperglucagonemia, and Pancreatic α-Cell Hyperplasia in Glucagon Receptor Knockout Mice. Proc. Natl. Acad. Sci. USA 2003, 100, 1438–1443. https://doi.org/10.1073/pnas.0237106100. [CrossRef]
- Ueno, S.; Takahashi, H.; Kamei, Y. Blockade of Glucagon Increases Muscle Mass and Alters Fiber Type Composition in Mice Deficient in Proglucagon-Derived Peptides. J. Diabetes Investig. 2023, 14, 1045–1055. https://doi.org/10.1111/jdi.14032. [CrossRef]
- Yamada, M.; et al. Plasma Amino Acid Concentrations Are Associated with Muscle Function in Older Japanese Women. J. Nutr. Health Aging 2018, 22, 819–823. https://doi.org/10.1007/s12603-018-1014-8. [CrossRef]
- Park, S.W.; et al. Accelerated Loss of Skeletal Muscle Strength in Older Adults with Type 2 Diabetes. Diabetes Care 2007, 30, 1507–1512. https://doi.org/10.2337/dc06-2537. [CrossRef]
- Galsgaard, K.D.; et al. Alanine, Arginine, Cysteine, and Proline, but Not Glutamine, Are Substrates for, and Acute Mediators of, the Liver–α-Cell Axis in Female Mice. Am. J. Physiol. Endocrinol. Metab. 2020, 318, E920–E929. https://doi.org/10.1152/ajpendo.00459.2019. [CrossRef]
- Porcellati, F.; Rossetti, P.; Pampanelli, S.; et al. Effect of the Amino Acid Alanine on Glucagon Secretion in Non-Diabetic and Type 1 Diabetic Subjects during Hyperinsulinaemic Euglycaemia, Hypoglycaemia and Post-Hypoglycaemic Hyperglycaemia. Diabetologia 2007, 50, 422–430. https://doi.org/10.1007/s00125-006-0519-6. [CrossRef]
- Duan, Y.; et al. Possible Sarcopenic Screening with Disturbed Plasma Amino Acid Profile in the Elderly. BMC Geriatr. 2023, 23, 427. https://doi.org/10.1186/s12877-023-04137-0. [CrossRef]
- Zheng, L.; Wei, H.; He, P.; Zhao, S.; Xiang, Q.; Pang, J.; Peng, J. Effects of Supplementation of Branched-Chain Amino Acids to Reduced-Protein Diet on Skeletal Muscle Protein Synthesis and Degradation in the Fed and Fasted States in a Piglet Model. Nutrients 2017, 9, 17. https://doi.org/10.3390/nu9010017. [CrossRef]
- Koo, B.K.; et al. Difference between Old and Young Adults in Contribution of β-Cell Function and Sarcopenia in Developing Diabetes Mellitus. J. Diabetes Investig. 2016, 7, 233–240. https://doi.org/10.1111/jdi.12392. [CrossRef]
- Hil, C.M.; et al. FGF21 Is Required for Protein Restriction to Extend Lifespan and Improve Metabolic Health in Male Mice. Nat. Commun. 2022, 13, 1897. https://doi.org/10.1038/s41467-022-29499-8. [CrossRef]
- Jung, H.W.; Park, J.H.; Kim, D.A.; Jang, I.Y.; Park, S.J.; Lee, J.Y.; et al. Association between Serum FGF21 Level and Sarcopenia in Older Adults. Bone 2021, 145, 115877. https://doi.org/10.1016/j.bone.2021.115877. [CrossRef]
Figure 1.
Flow of participants through the 18-month nutritional intervention study.
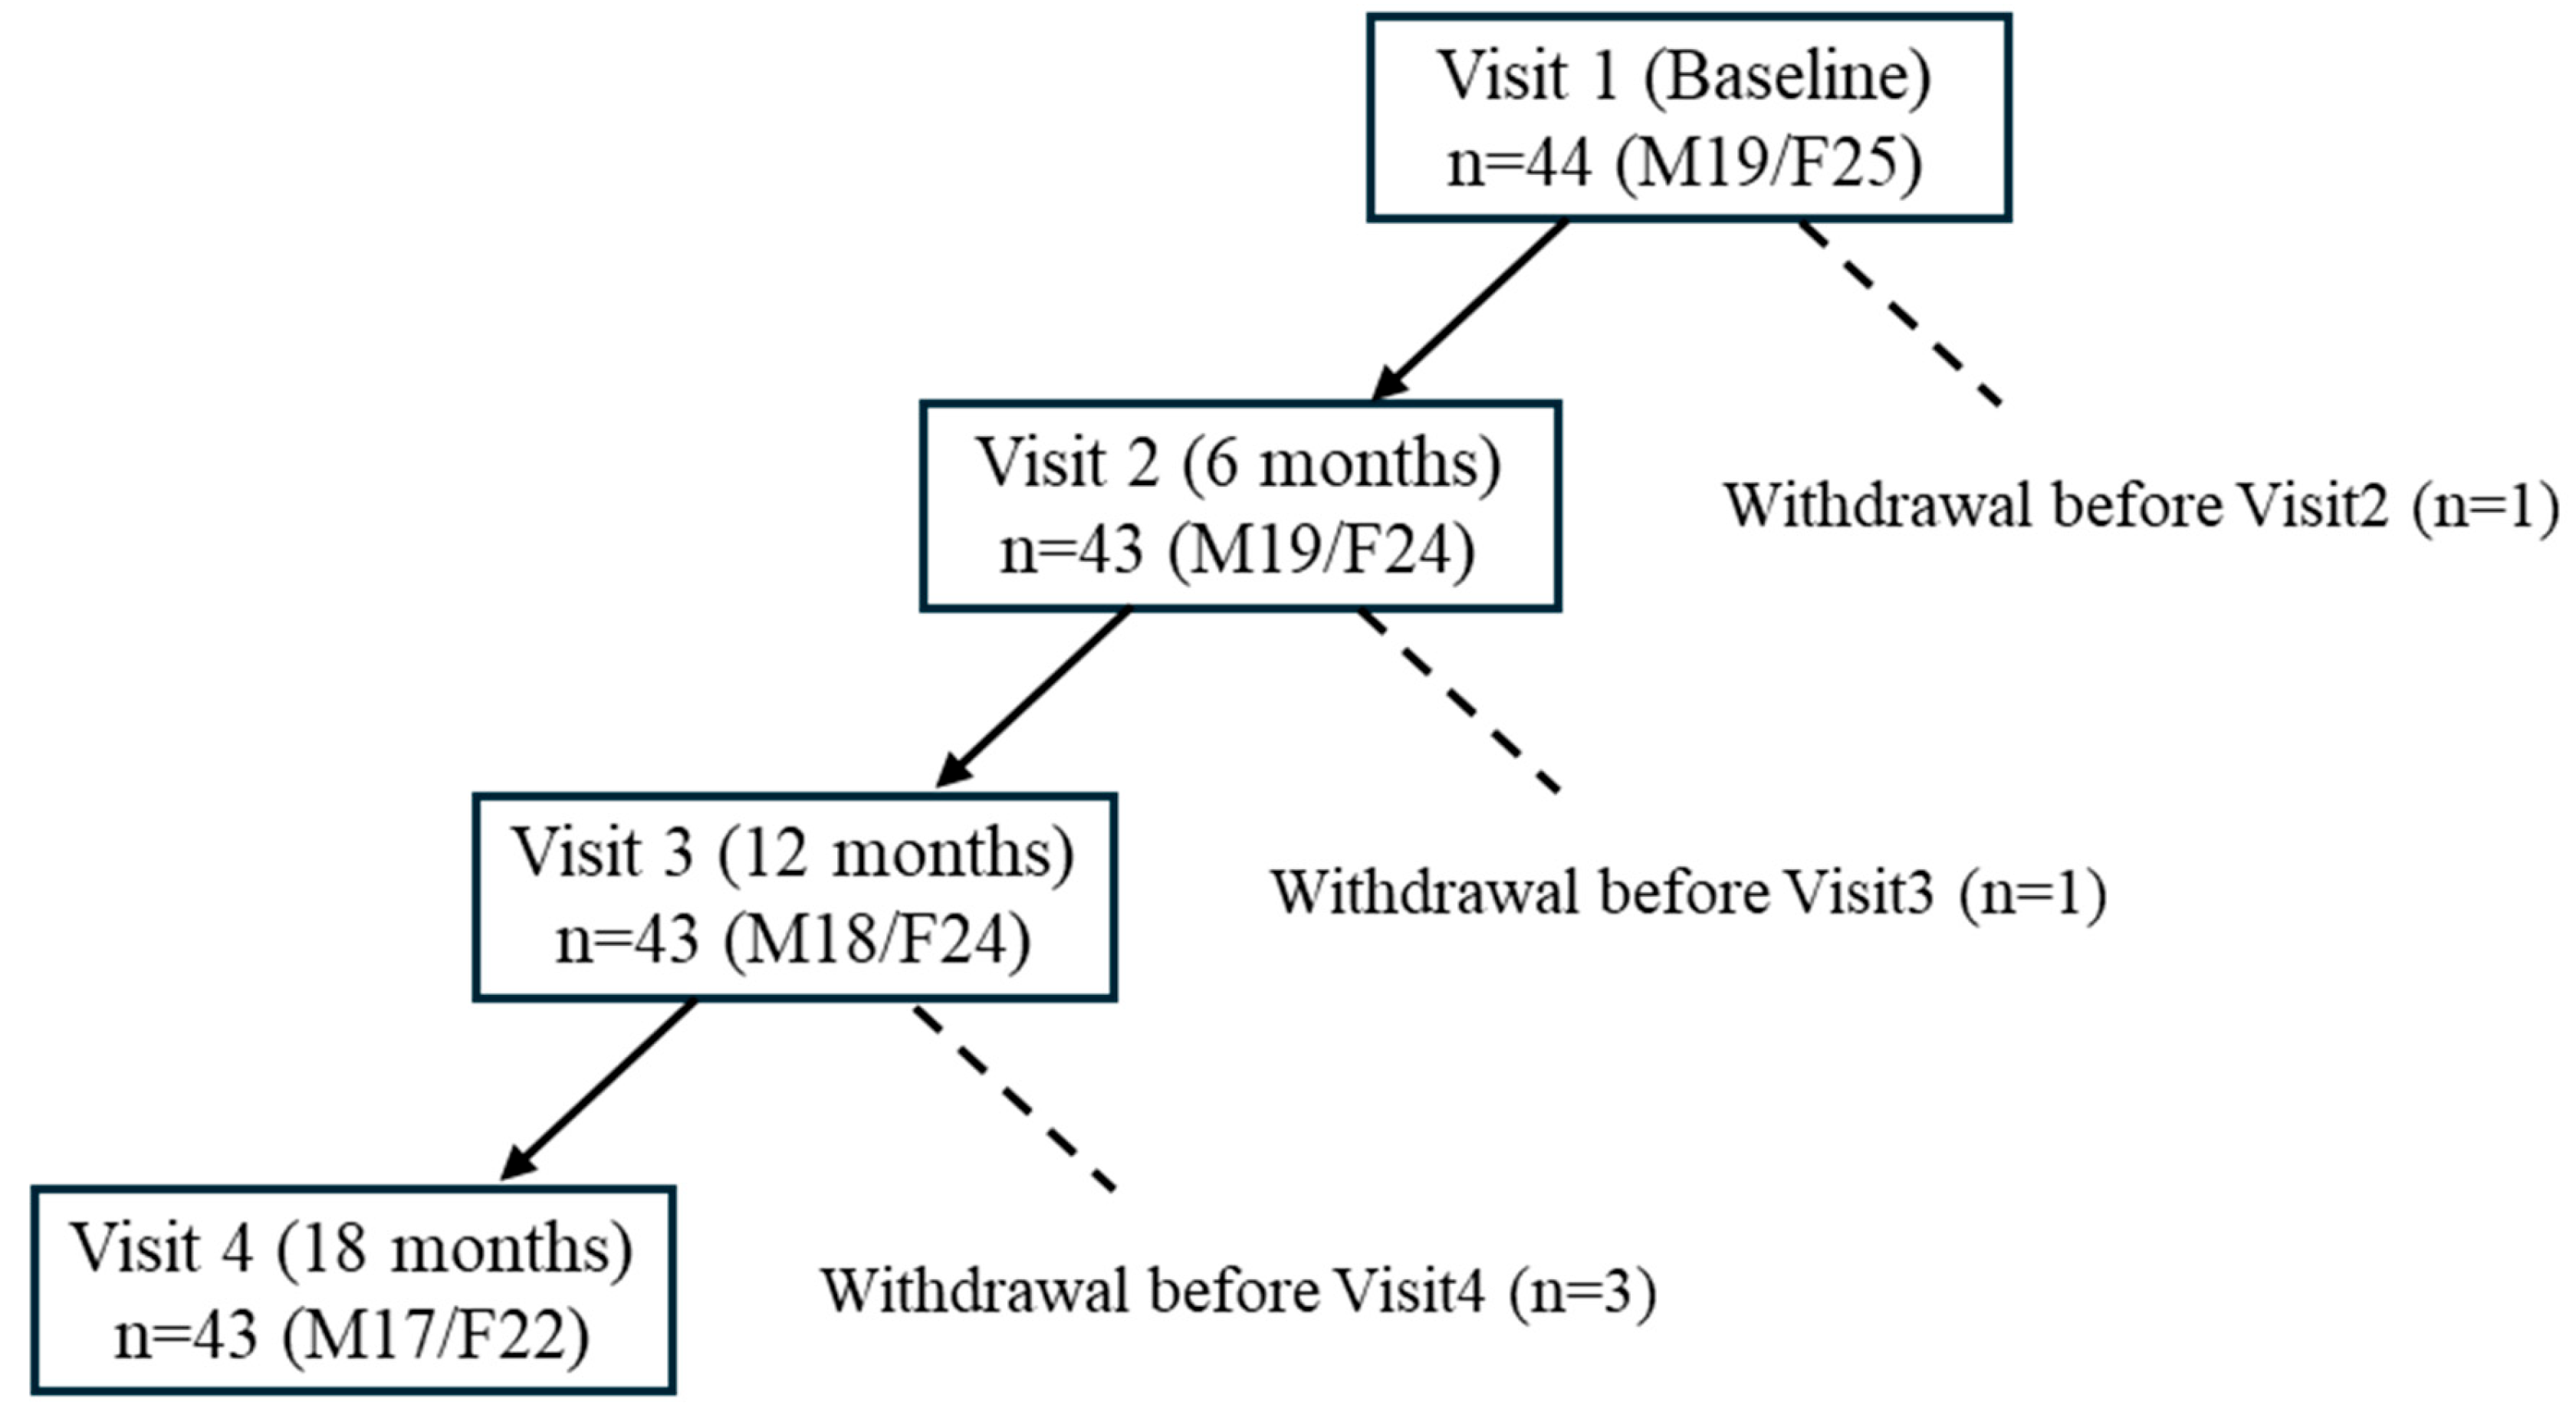
Figure 2.
Changes in sarcopenia-related indicators over time. Longitudinal changes in skeletal mass index (SMI), gait speed, and grip strength are shown for all participants, as males and females. Values represent mean ± SD. Paired t-tests were performed between each post-intervention timepoint and baseline. Asterisks (*) indicate p < 0.05. Missing values were not imputed for analysis. Sample sizes: baseline n = 44 (M19/F25), 6 months n = 43 (M19/F24), 12 months n = 42 (M18/F24), 18 months n = 39 (M17/F22).
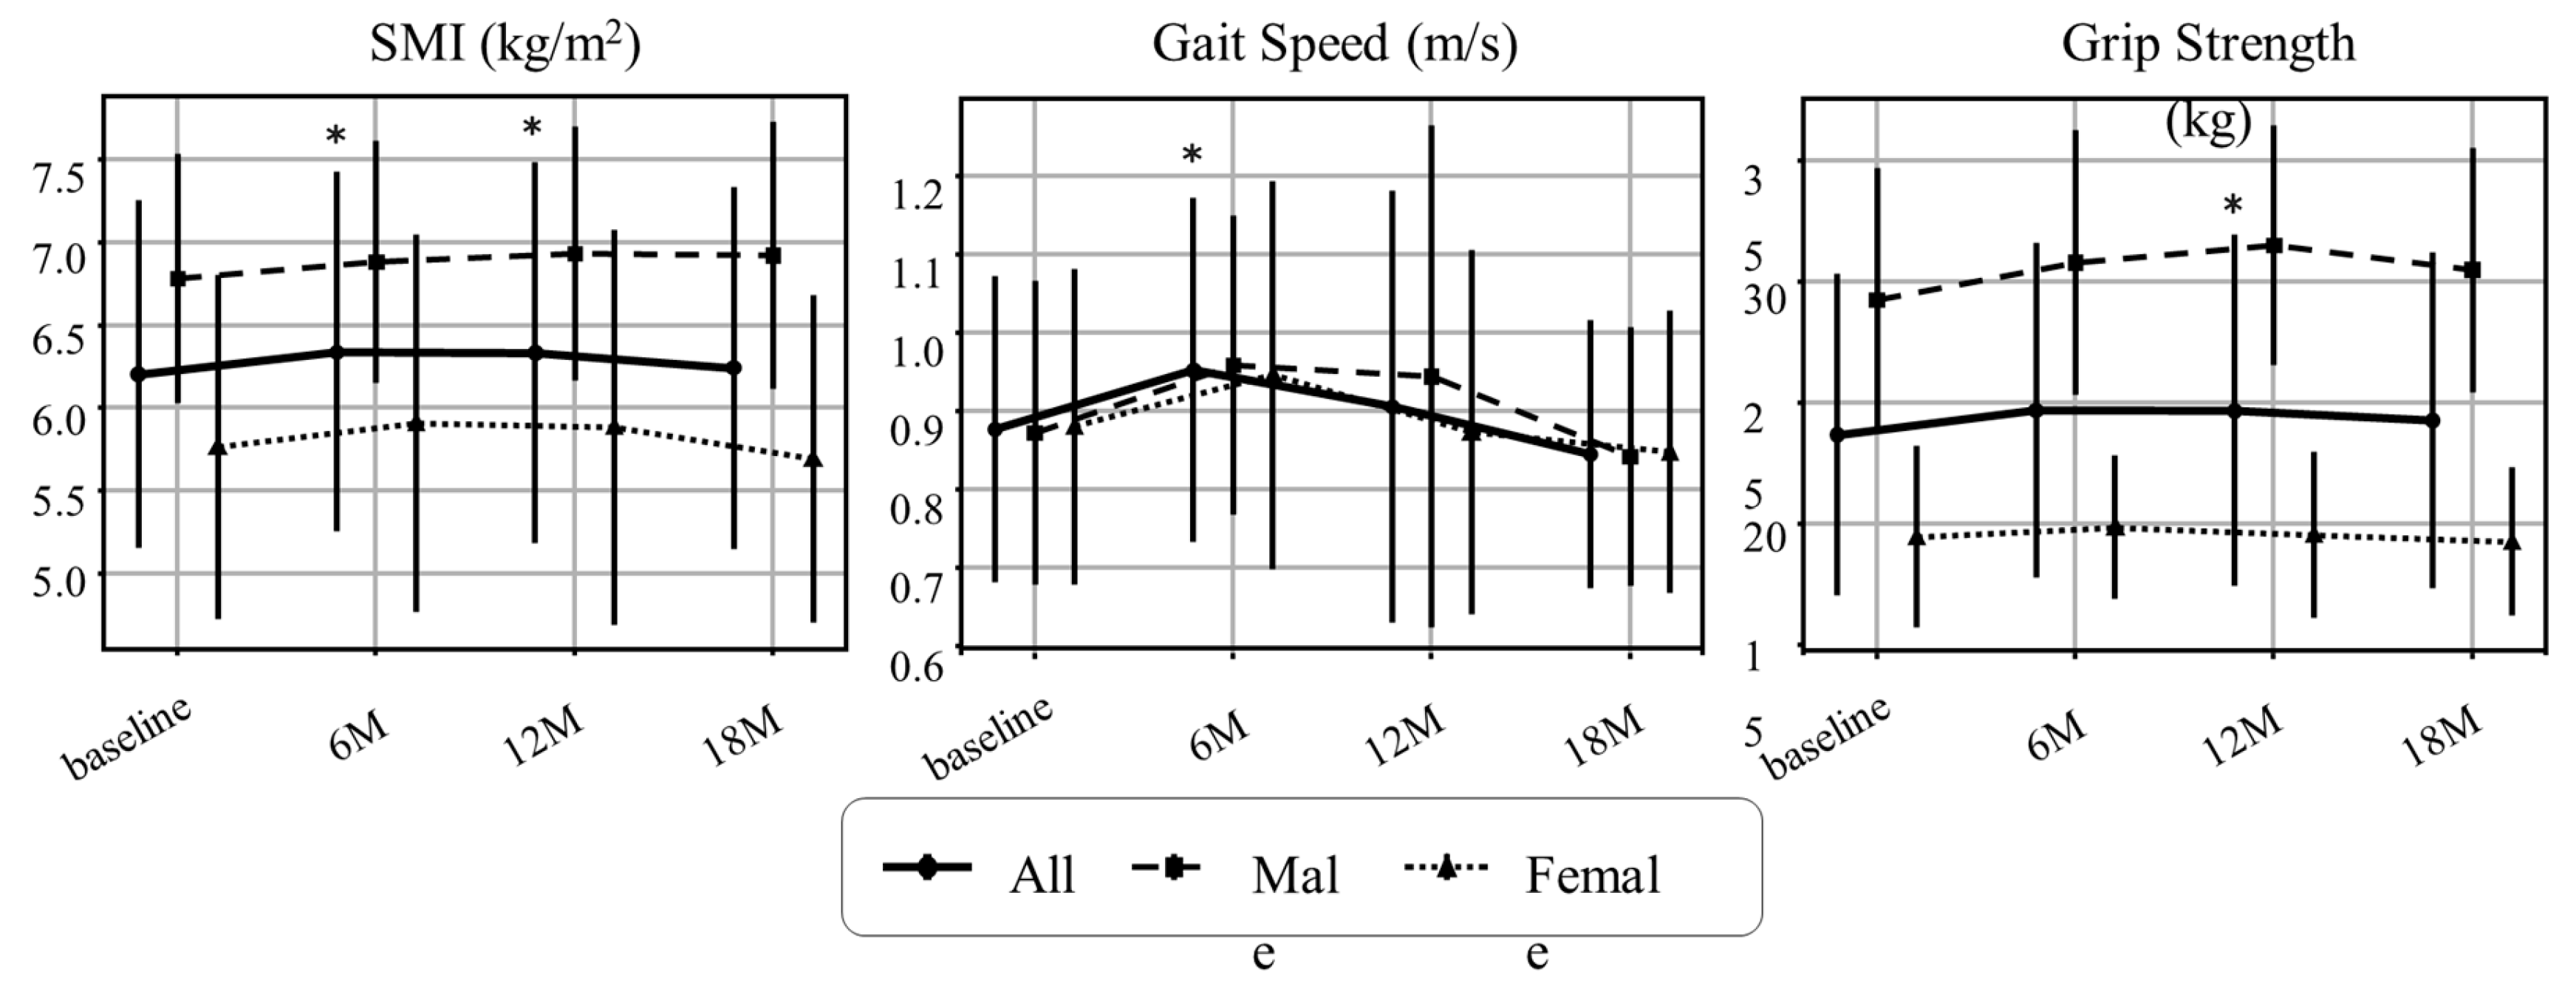
Figure 3.
Longitudinal Changes in Renal and Metabolic Parameters. (a) Estimated glomerular filtration ratio (eGFR) based on creatinine (eGFRcreat) (mL/min/1.73 m²), (b) eGFR based on cystatin C (eGFRcys) (mL/min/1.73 m²), (c) Controlled attenuated parameter (CAP) (dB/m), (d) elastography (kPa), (e) TG/HDL-C ratio, and (f) TyG index. Values represent mean ± SD. Asterisks denote significant differences compared with baseline by paired t-tests (*p < 0.05, **p < 0.01, ***p < 0.001). n.s., not significant. Dashed lines indicate fitted trends estimated by linear mixed-effects models (LMMs). Estimated annual slopes (95% CI) were as follows:(a) eGFRcreat: +0.18/year (−1.96 to +2.32, p = 0.8674);(b) eGFRcys: −2.97/year (−4.62 to −1.31, p = 0.0004);(c) CAP: −3.89/year (−13.46 to +5.67, p = 0.4249);(d) Elastography: +0.13/year (−0.21 to +0.47, p = 0.4559);(e) TG/HDL-C ratio: −0.14/year (−0.34 to +0.06, p = 0.1812);(f) TyG index: +0.05/year (−0.04 to +0.13, p = 0.2606).
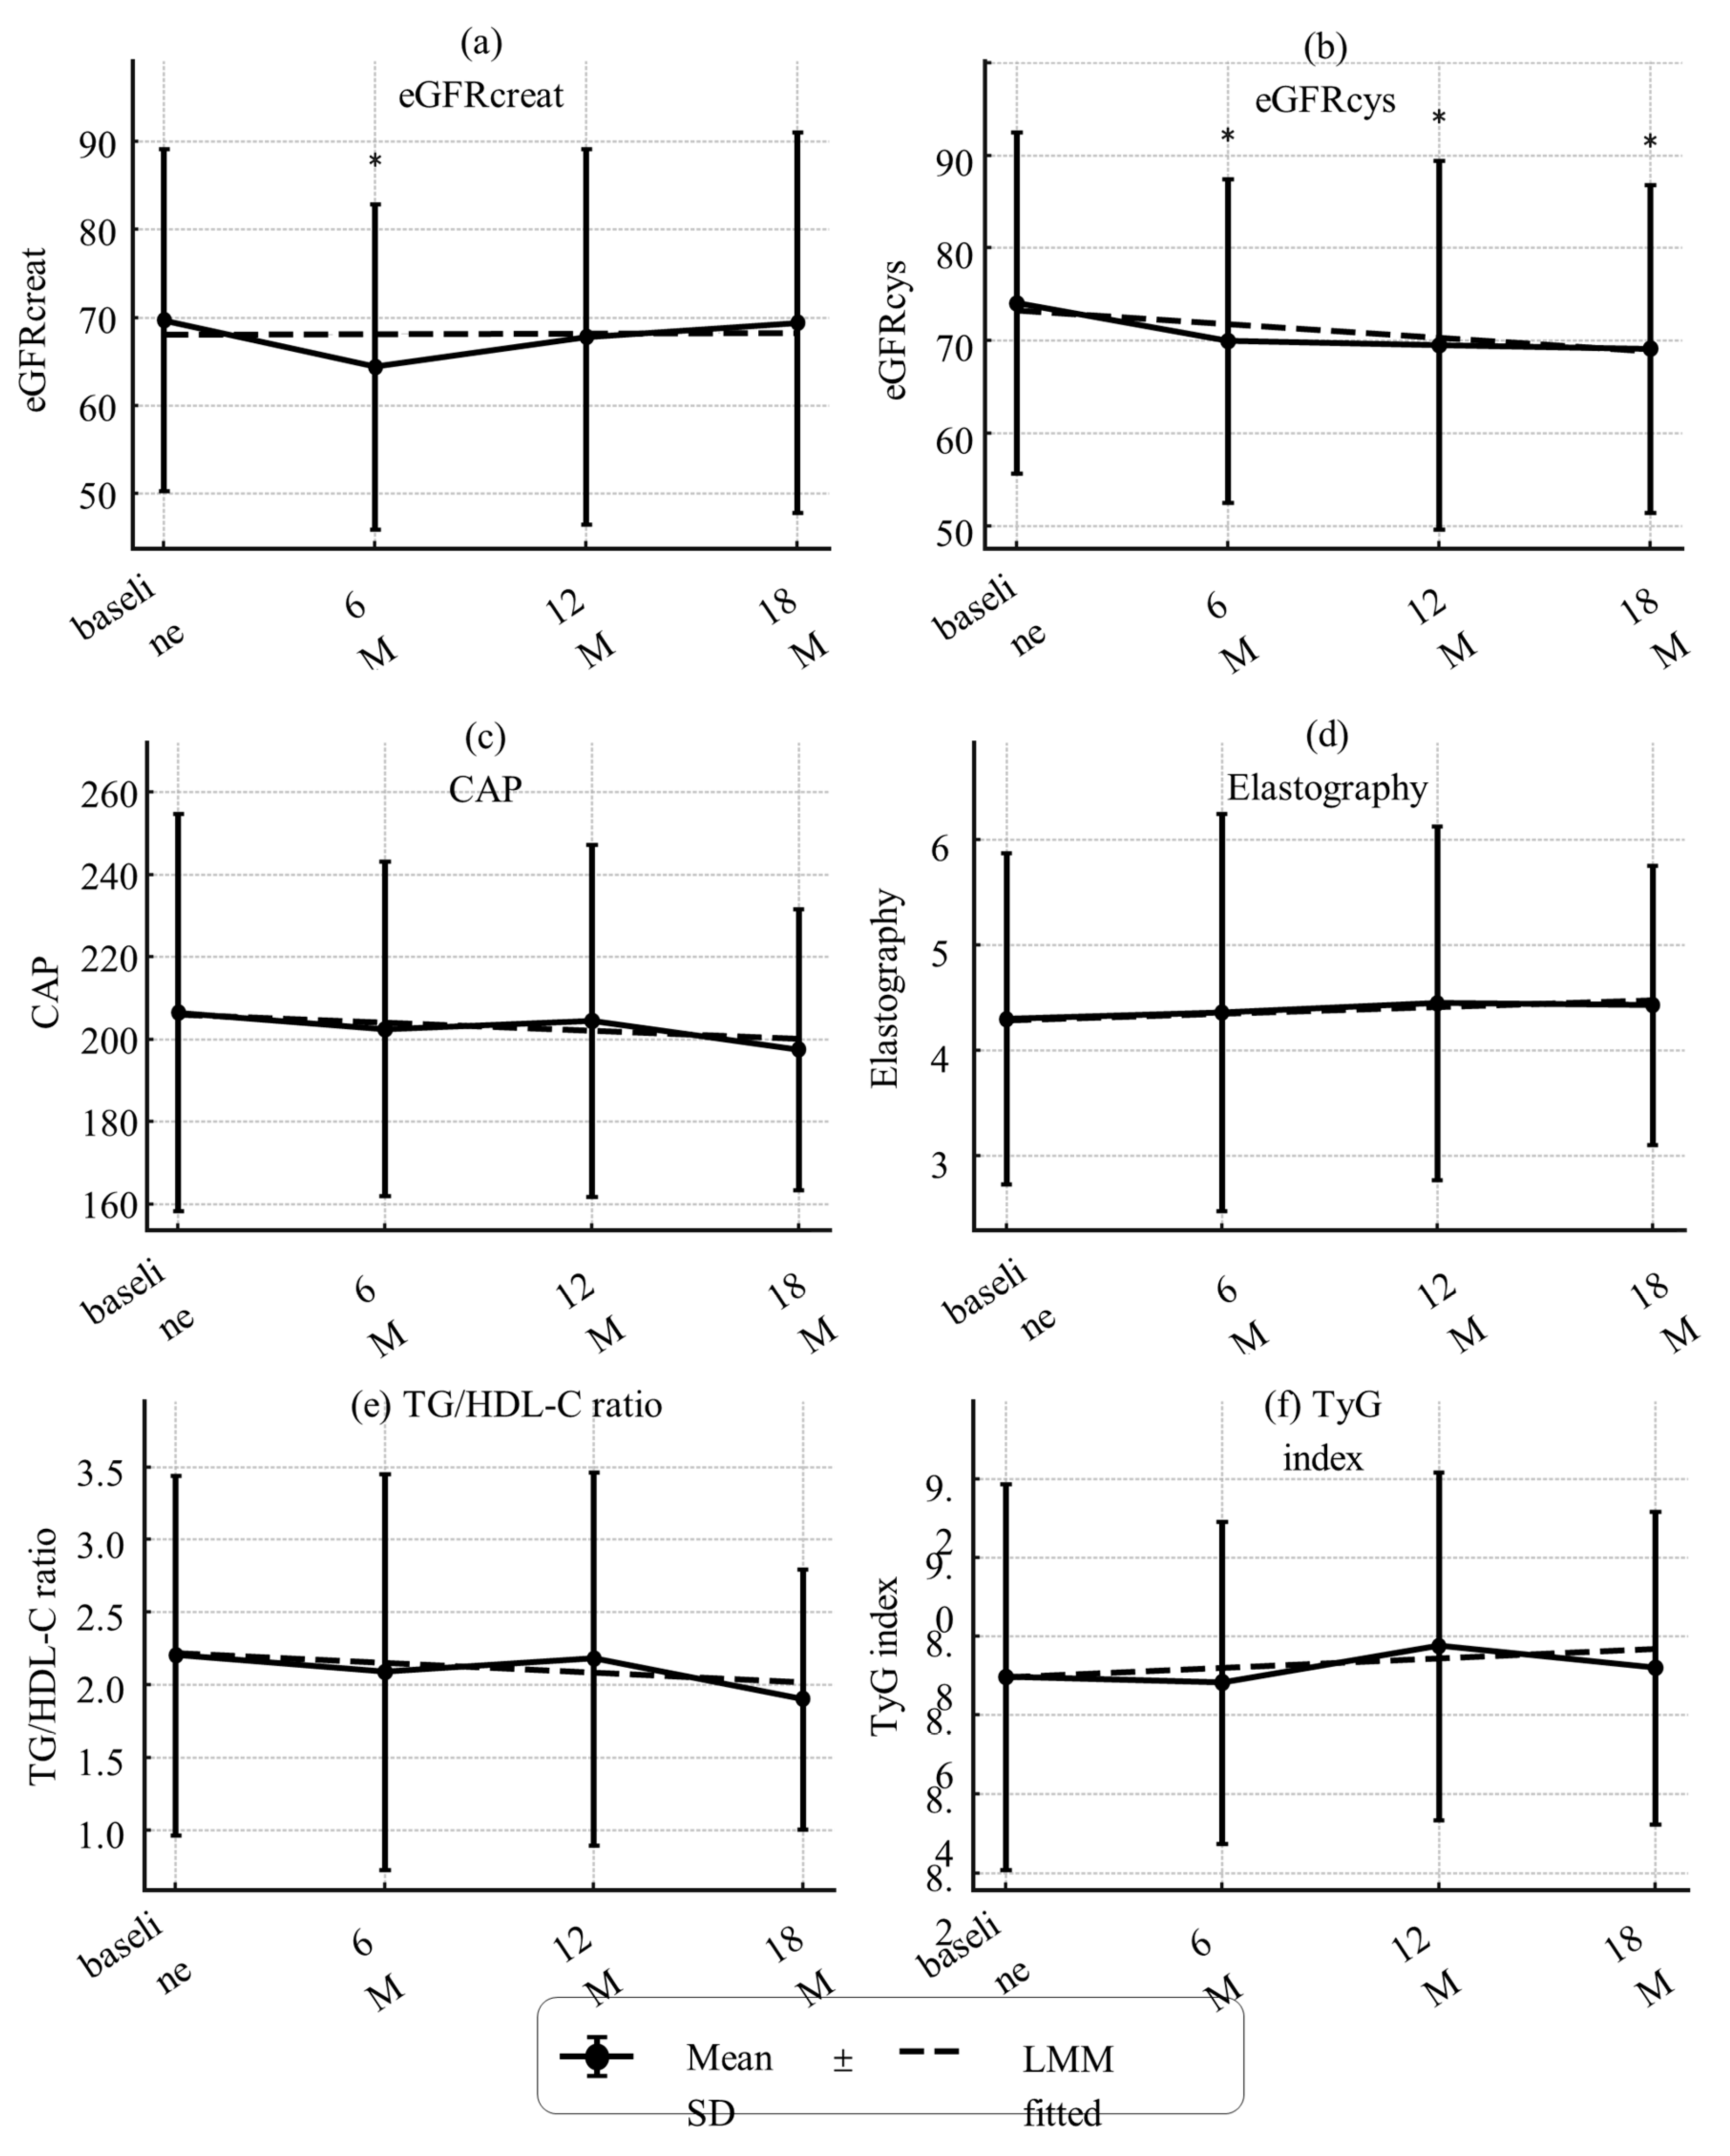
Figure 4.
Longitudinal changes in metabolic hormones. (a) HbA1c (NGSP, %), (b) glucagon (pg/mL), (c) C-peptide (CPR) (ng/mL) and (d) Fibroblast growth factor 21(FGF21) (pg/mL). Values represent mean ± SD. Asterisks indicate statistically significant differences from baseline by paired t-tests (*p < 0.05). n.s., not significant. Dashed lines indicate trends estimated by linear mixed-effects models (LMMs). Estimated annual slopes (95% CI) were:(a) HbA1c: −0.26%/year;(b) Glucagon: +3.49 pg/mL/year;(c) CPR: −0.03 ng/mL/year;(d) FGF21: −72.94 pg/mL/year. Missing values were not imputed.
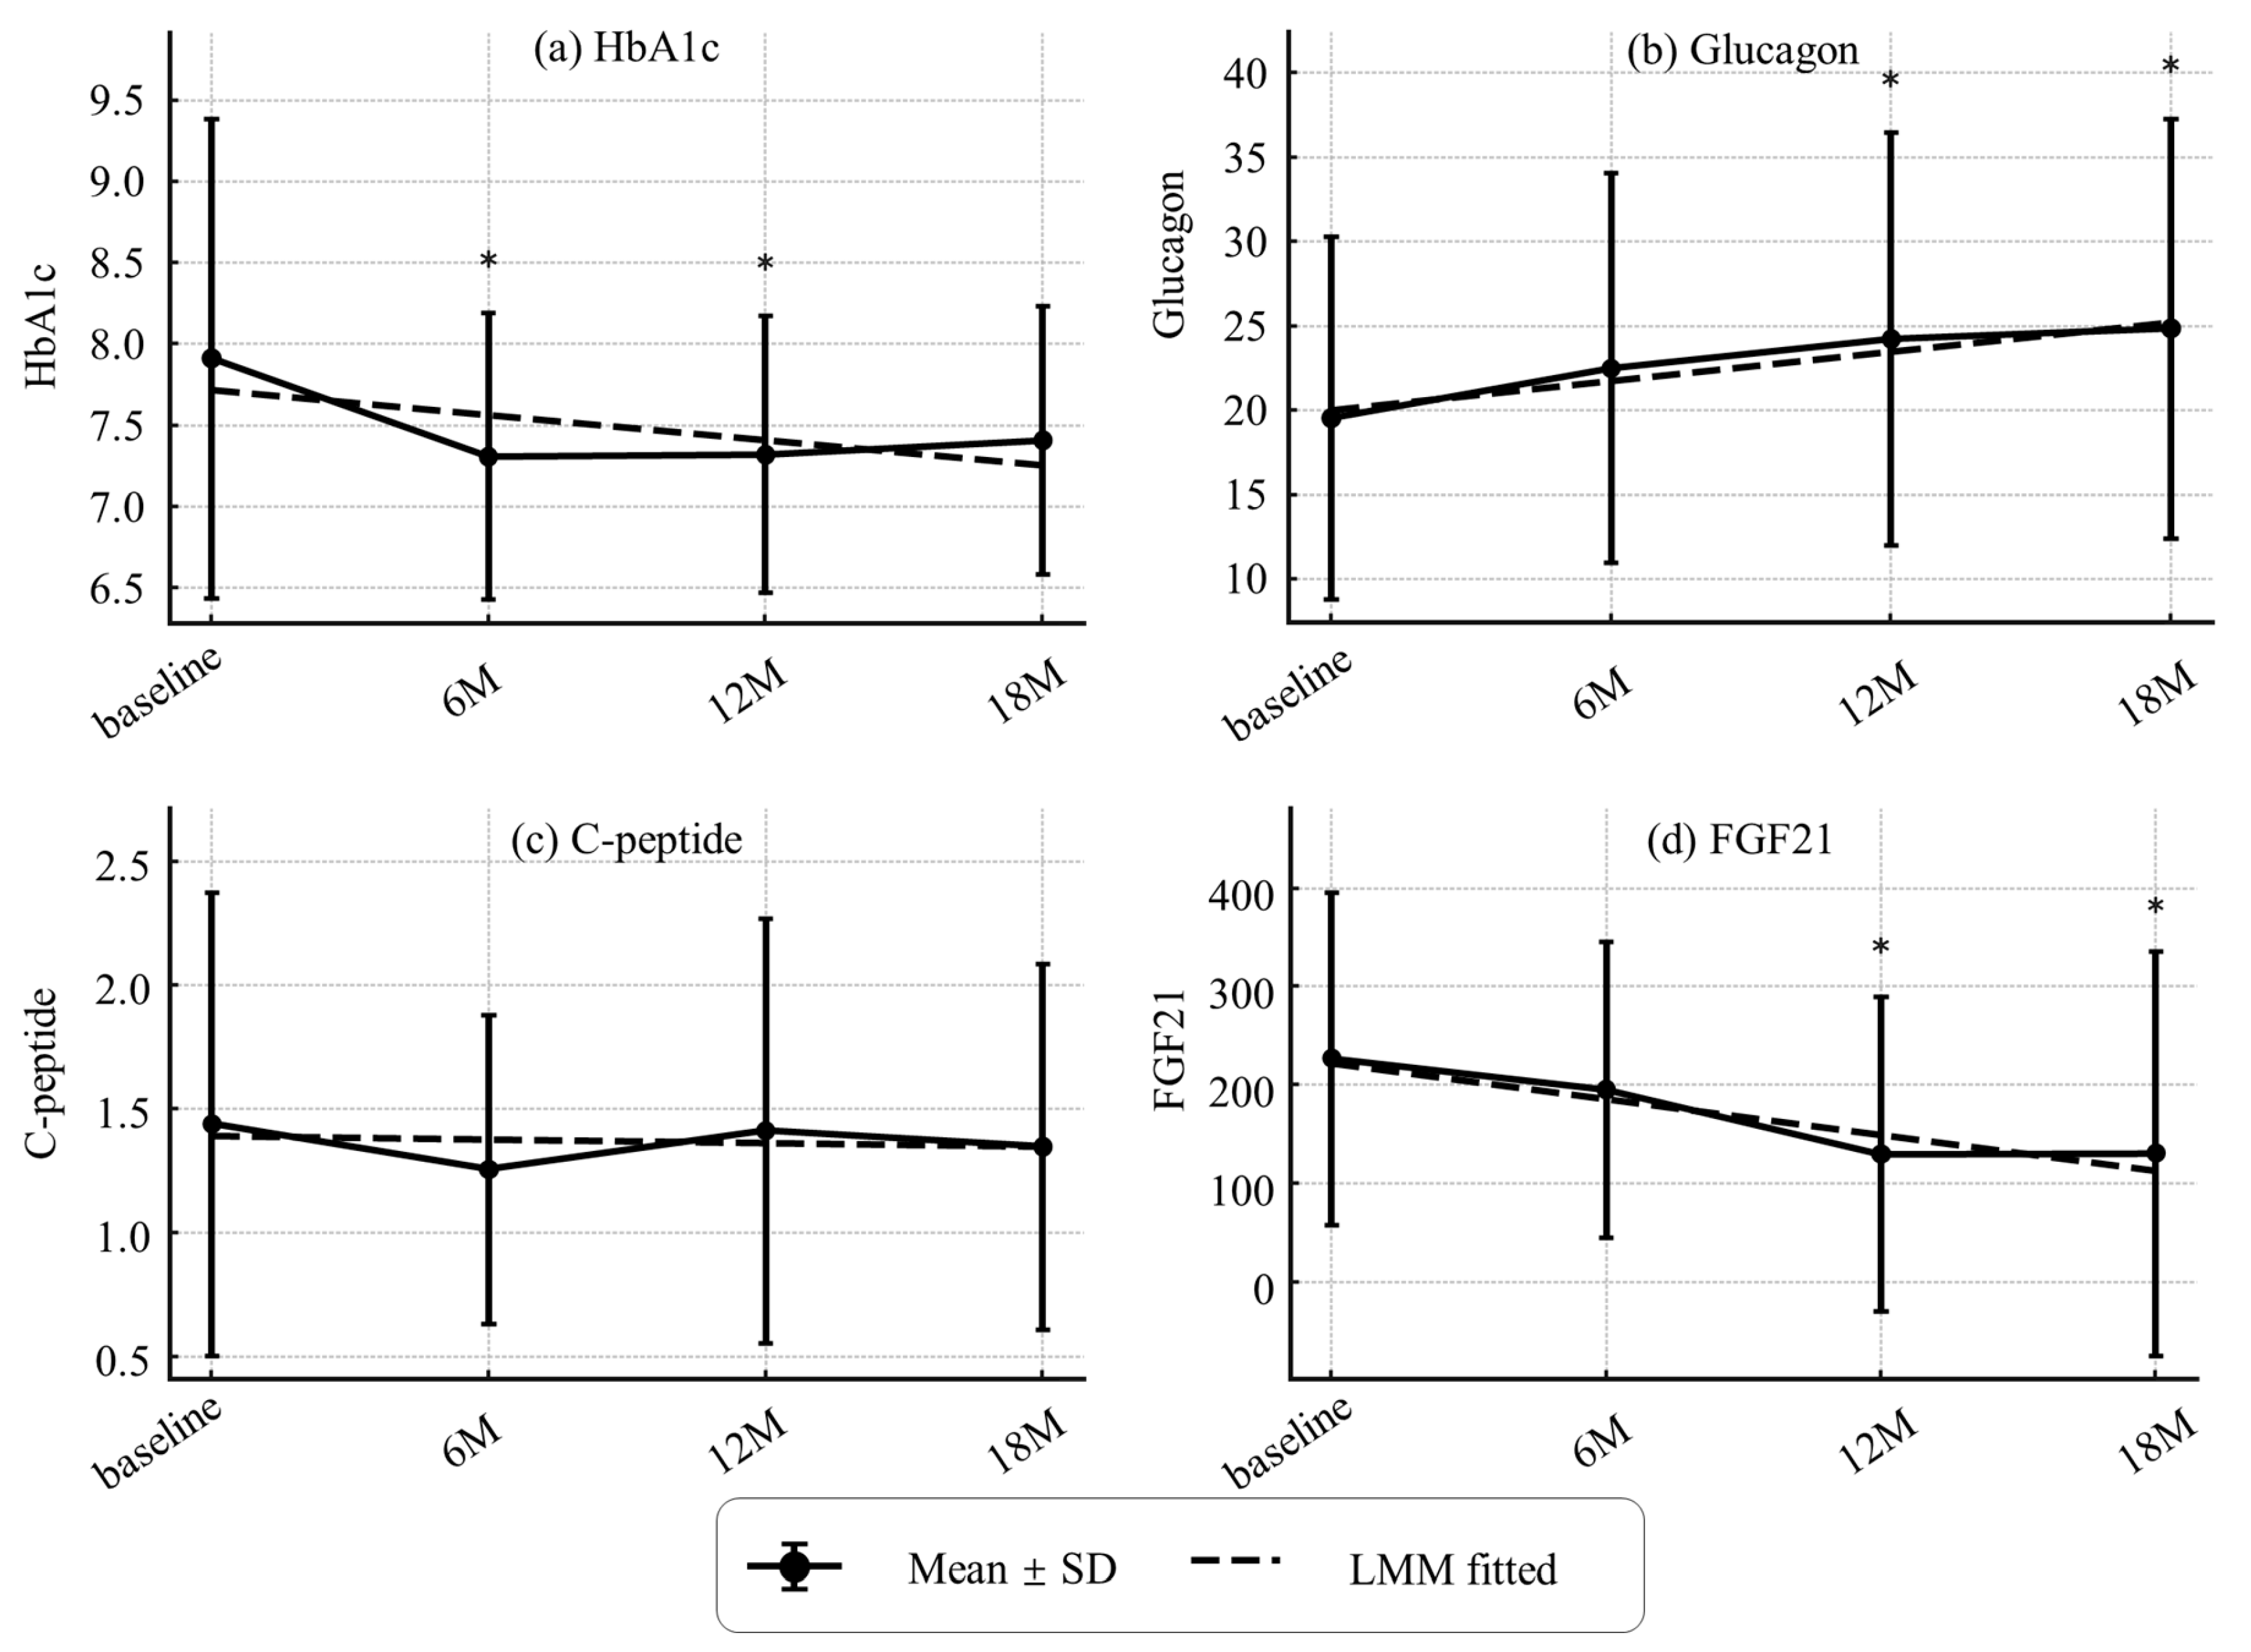
Figure 5.
Longitudinal changes in serum amino acids (AAs) concentrations after intervention. Bar plots of 24 individual AAs, branched chain AAs (BCAAs), and Total AAs at baseline, 6, 12, and 18 months. Values represent mean ± SD. Error bars indicate SD. Asterisks (*) denote significant differences from baseline (p < 0.05, paired t-tests). To improve visualization, y-axis origins are not set to zero. Amino acid concentrations are expressed in nmol/mL. Missing values were not imputed. Sample sizes: baseline n = 44 (M19/F25), 6 months n = 43 (M19/F24), 12 months n = 42 (M18/F24), 18 months n = 39 (M17/F22). Color coding: red = BCAAs (individual panels); blue = glucogenic AAs; orange = aromatic AAs; green = sulfur-containing AAs; yellow = other AAs; purple = BCAAs and Total AAs.
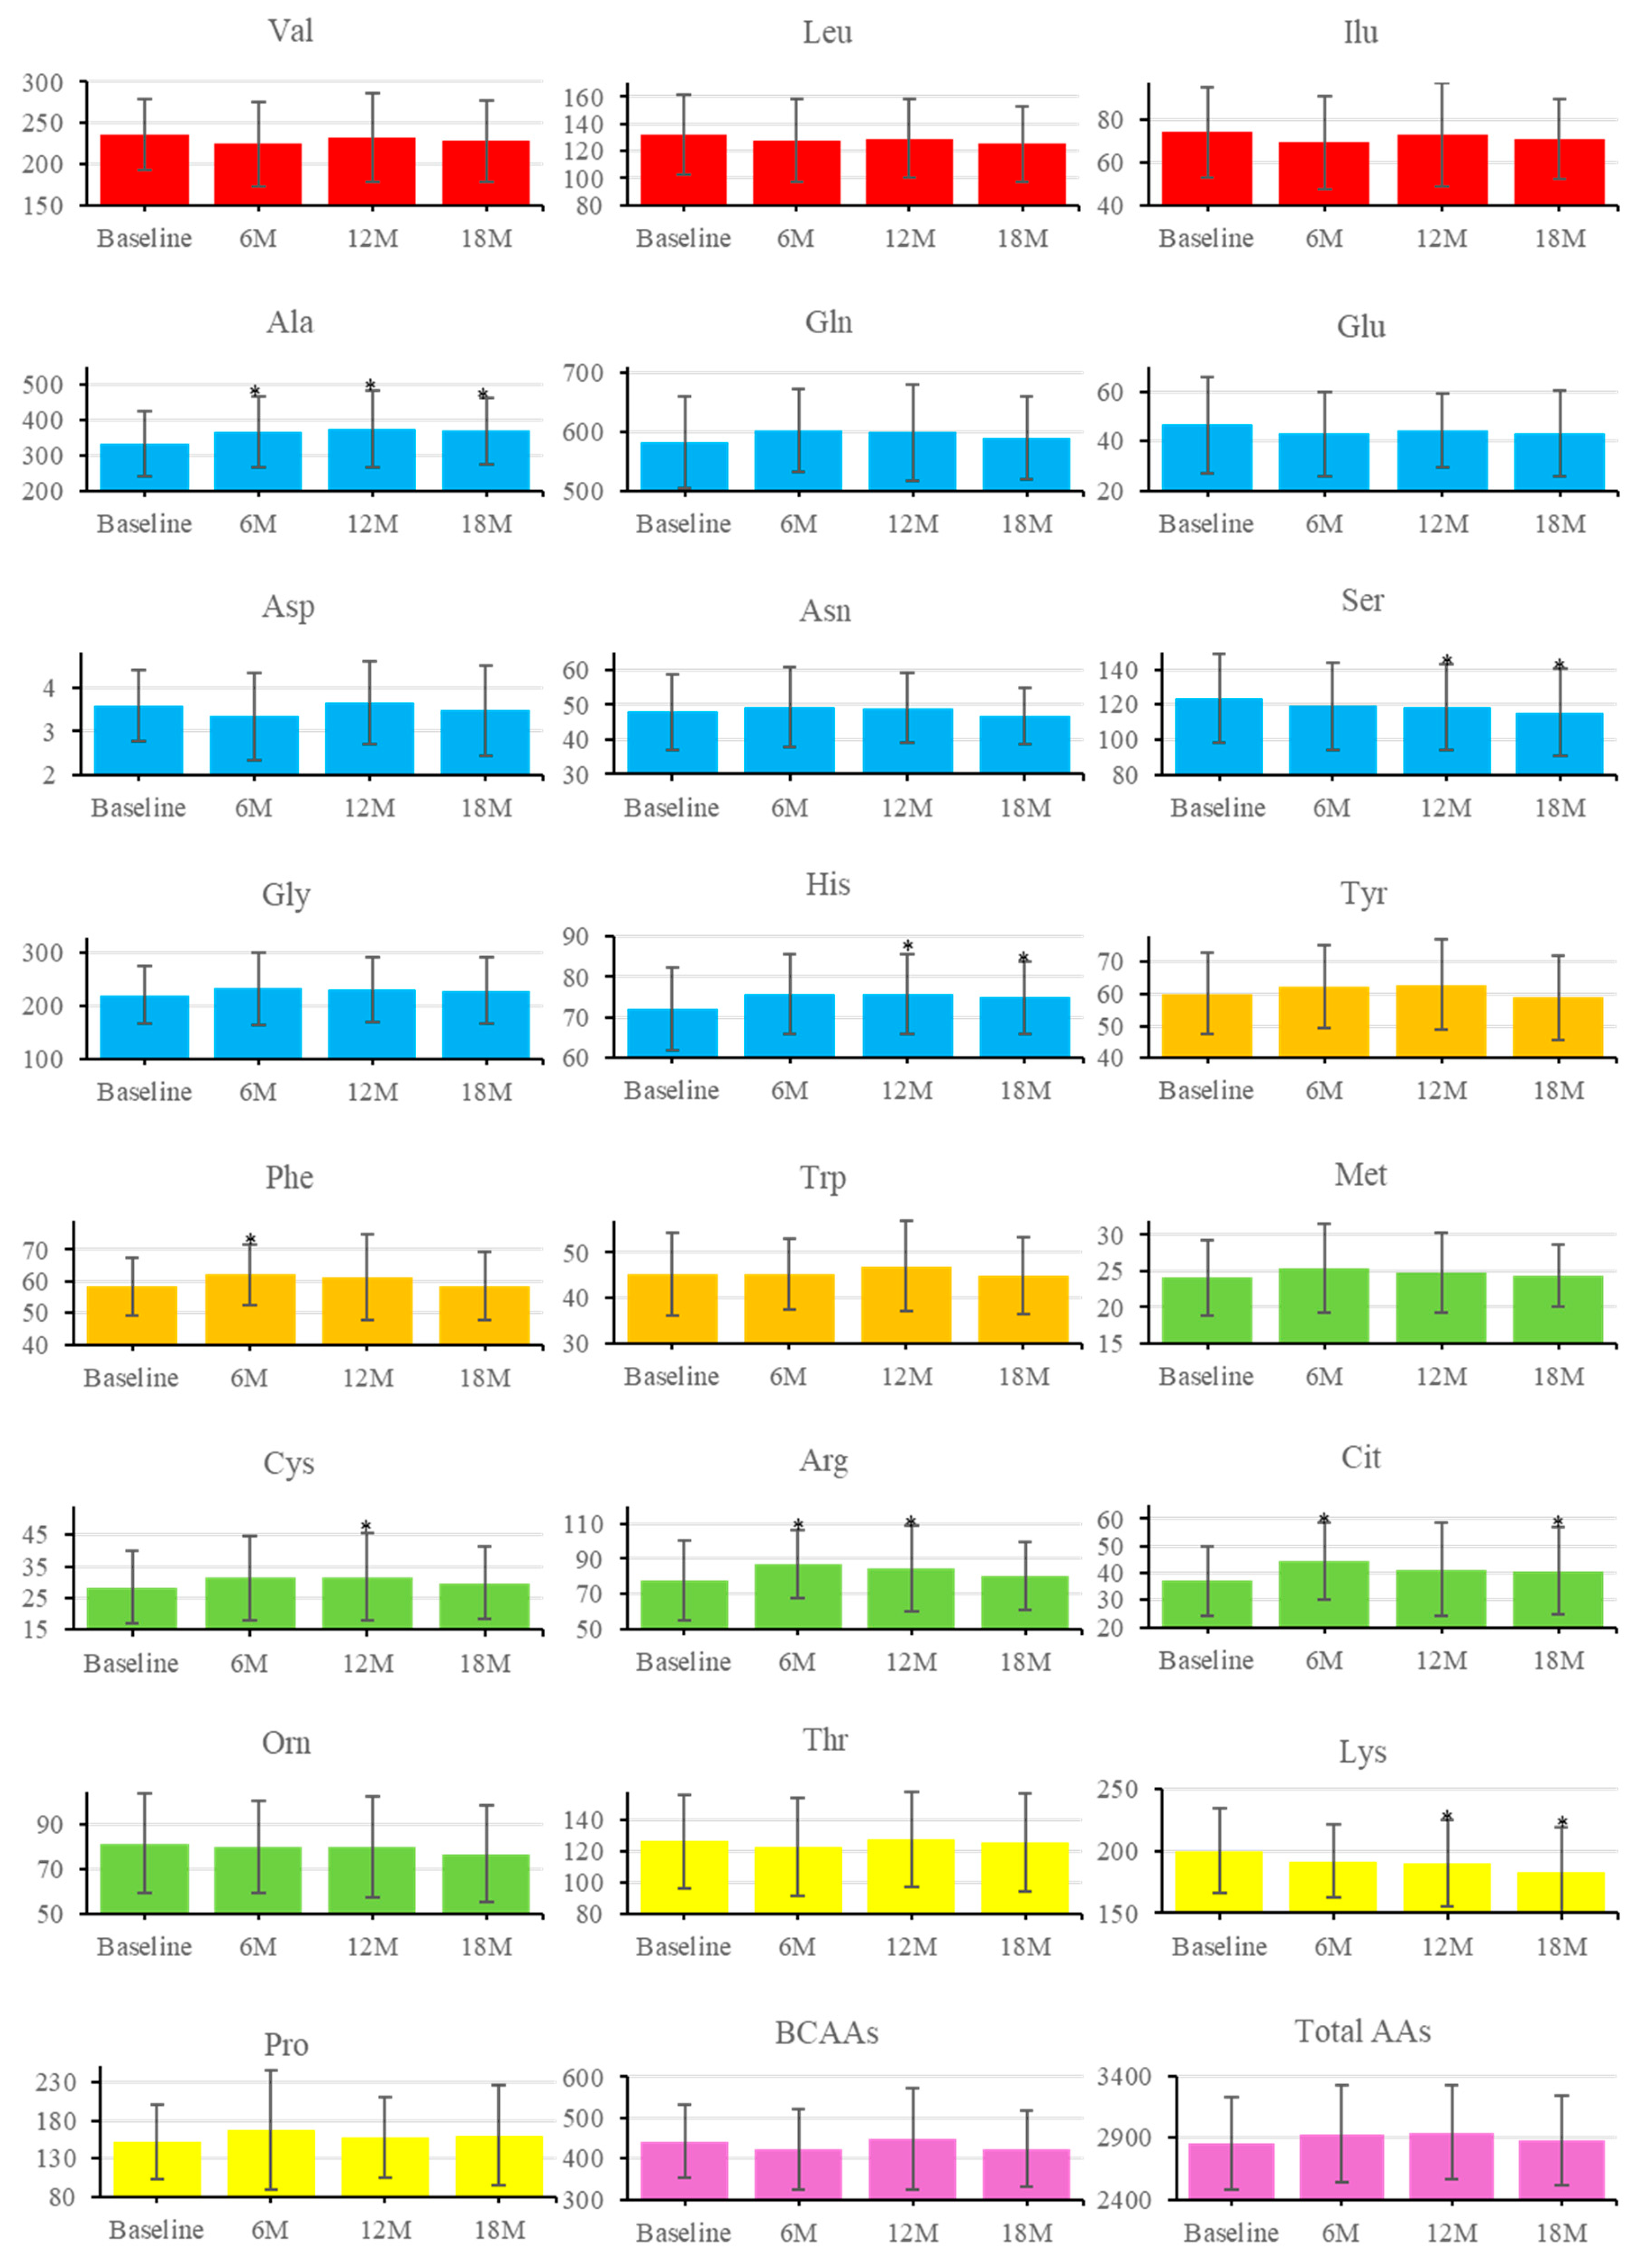
Figure 6.
a)-(c). Principal component analysis (PCA) of changes in serum amino acids (AAs) concentrations (Δ from baseline to 6 months).
Figure 6.
a)-(c). Principal component analysis (PCA) of changes in serum amino acids (AAs) concentrations (Δ from baseline to 6 months).
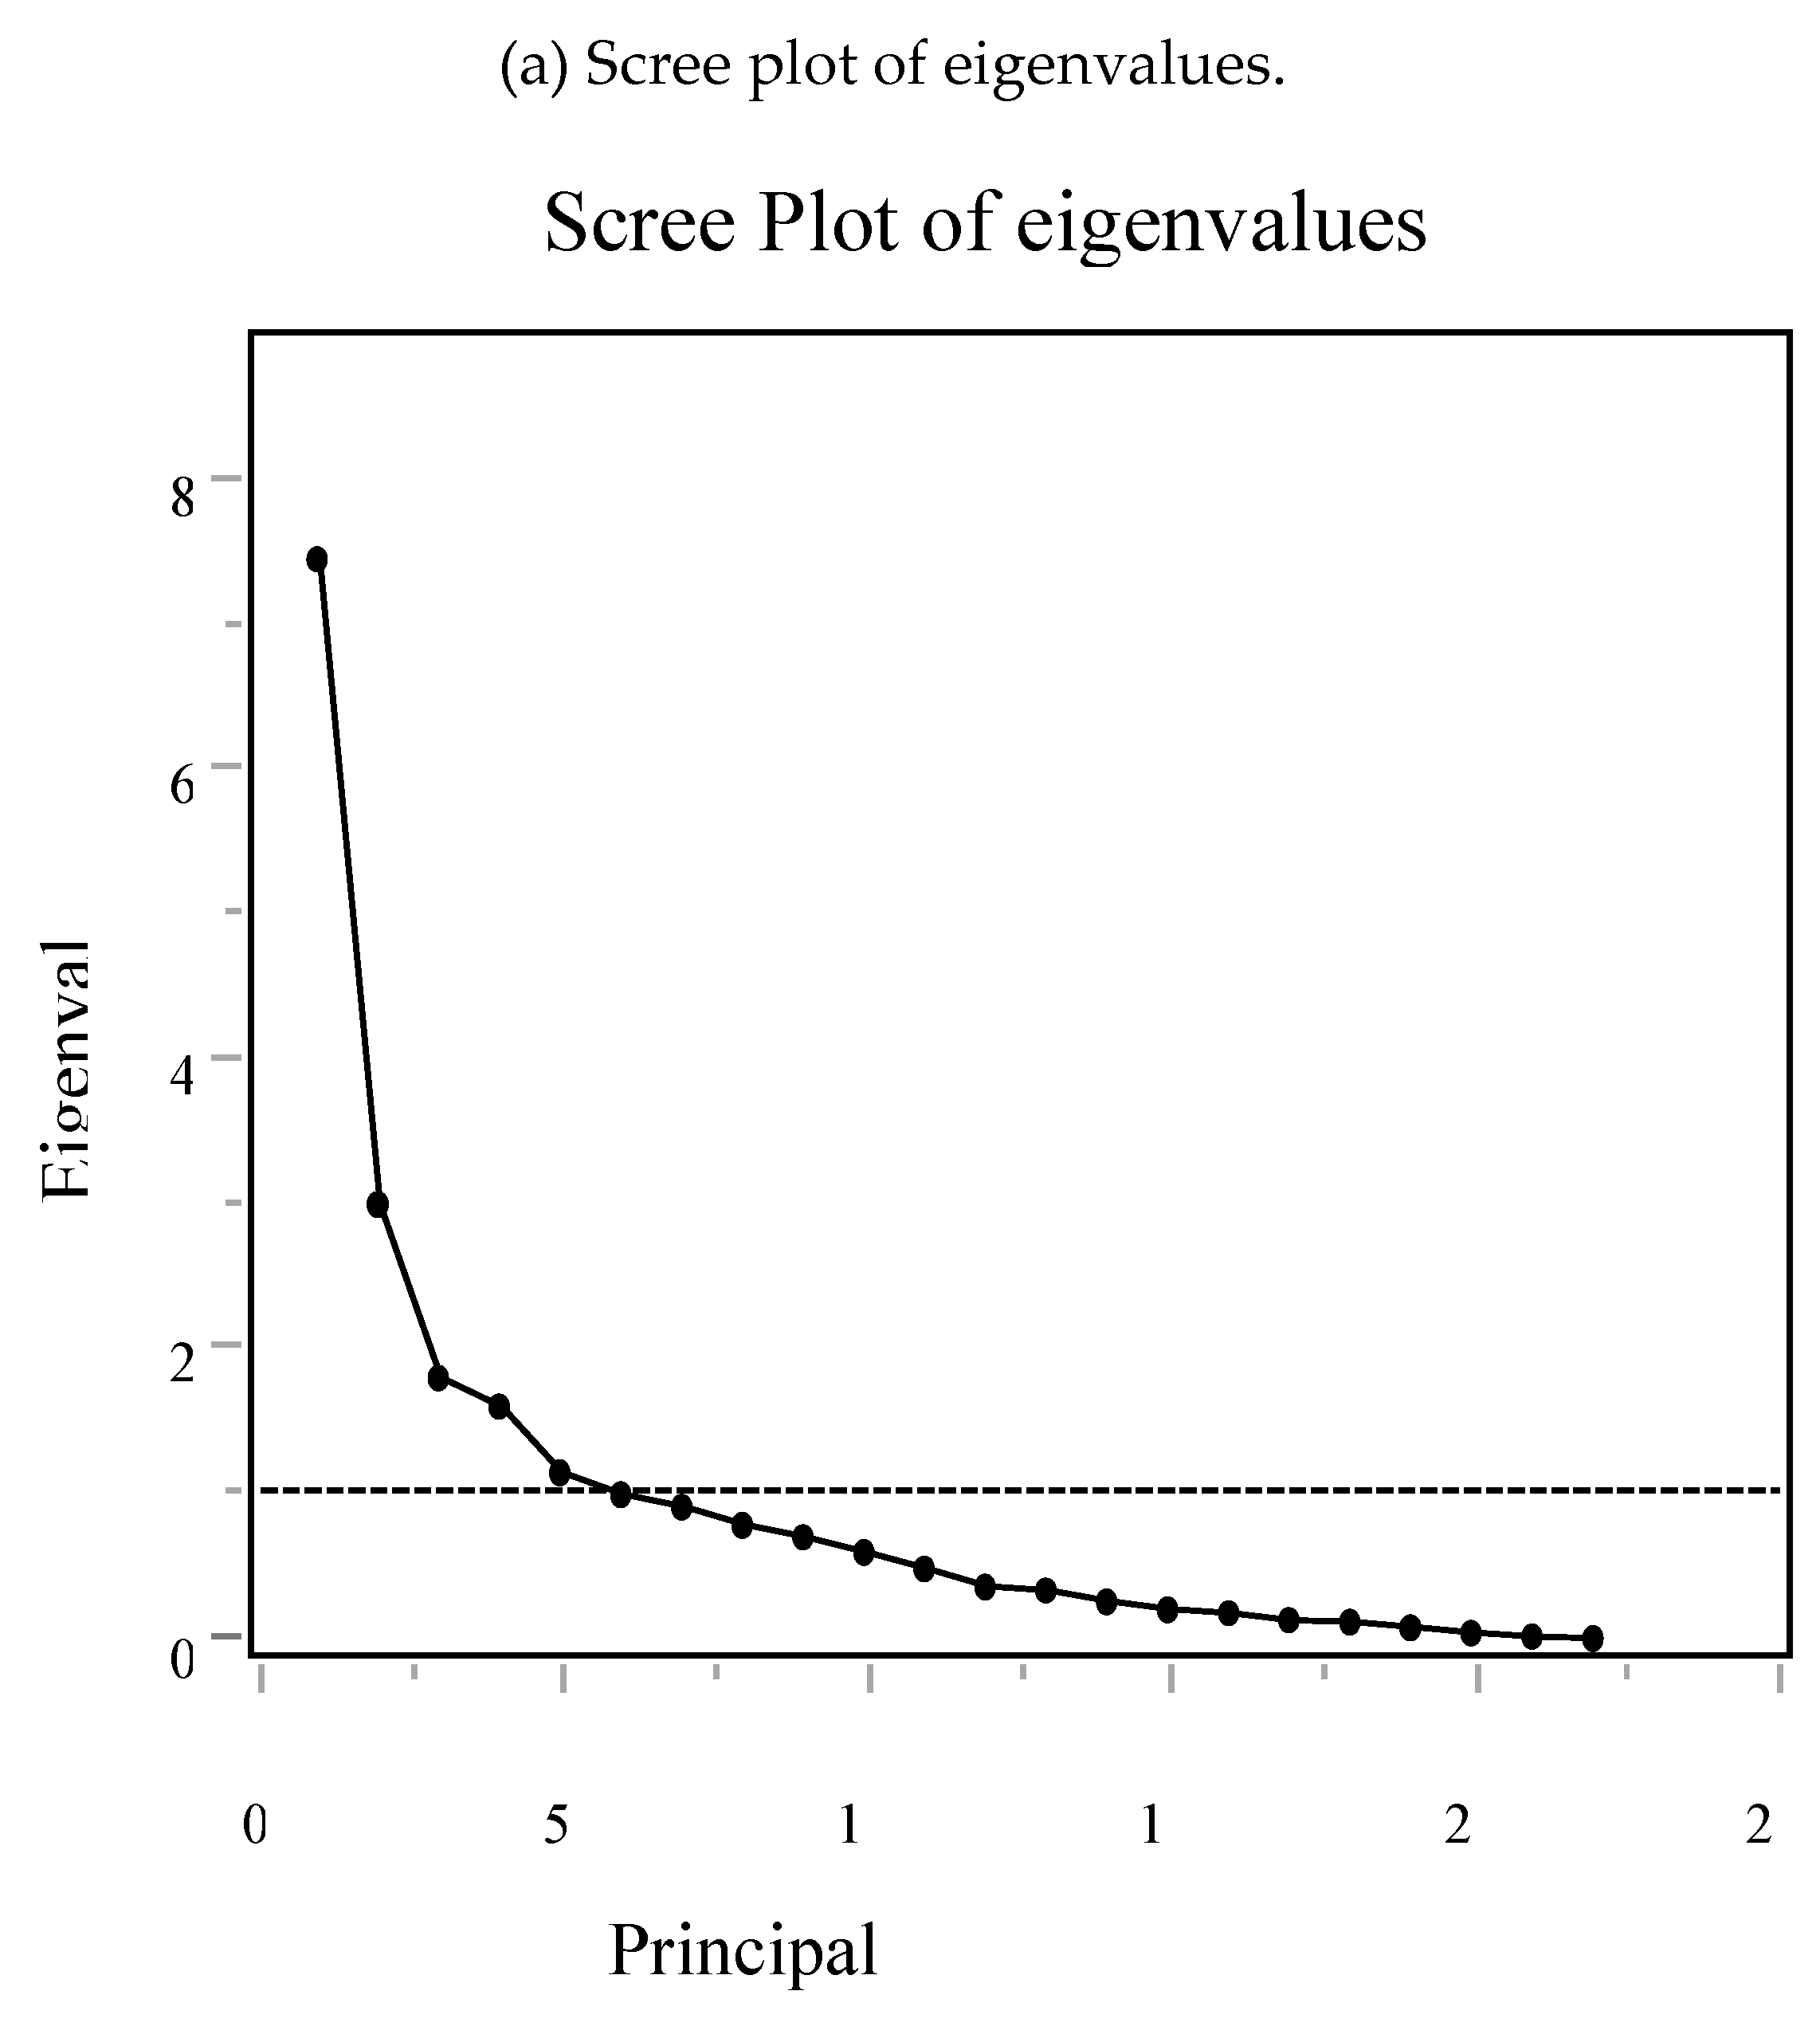
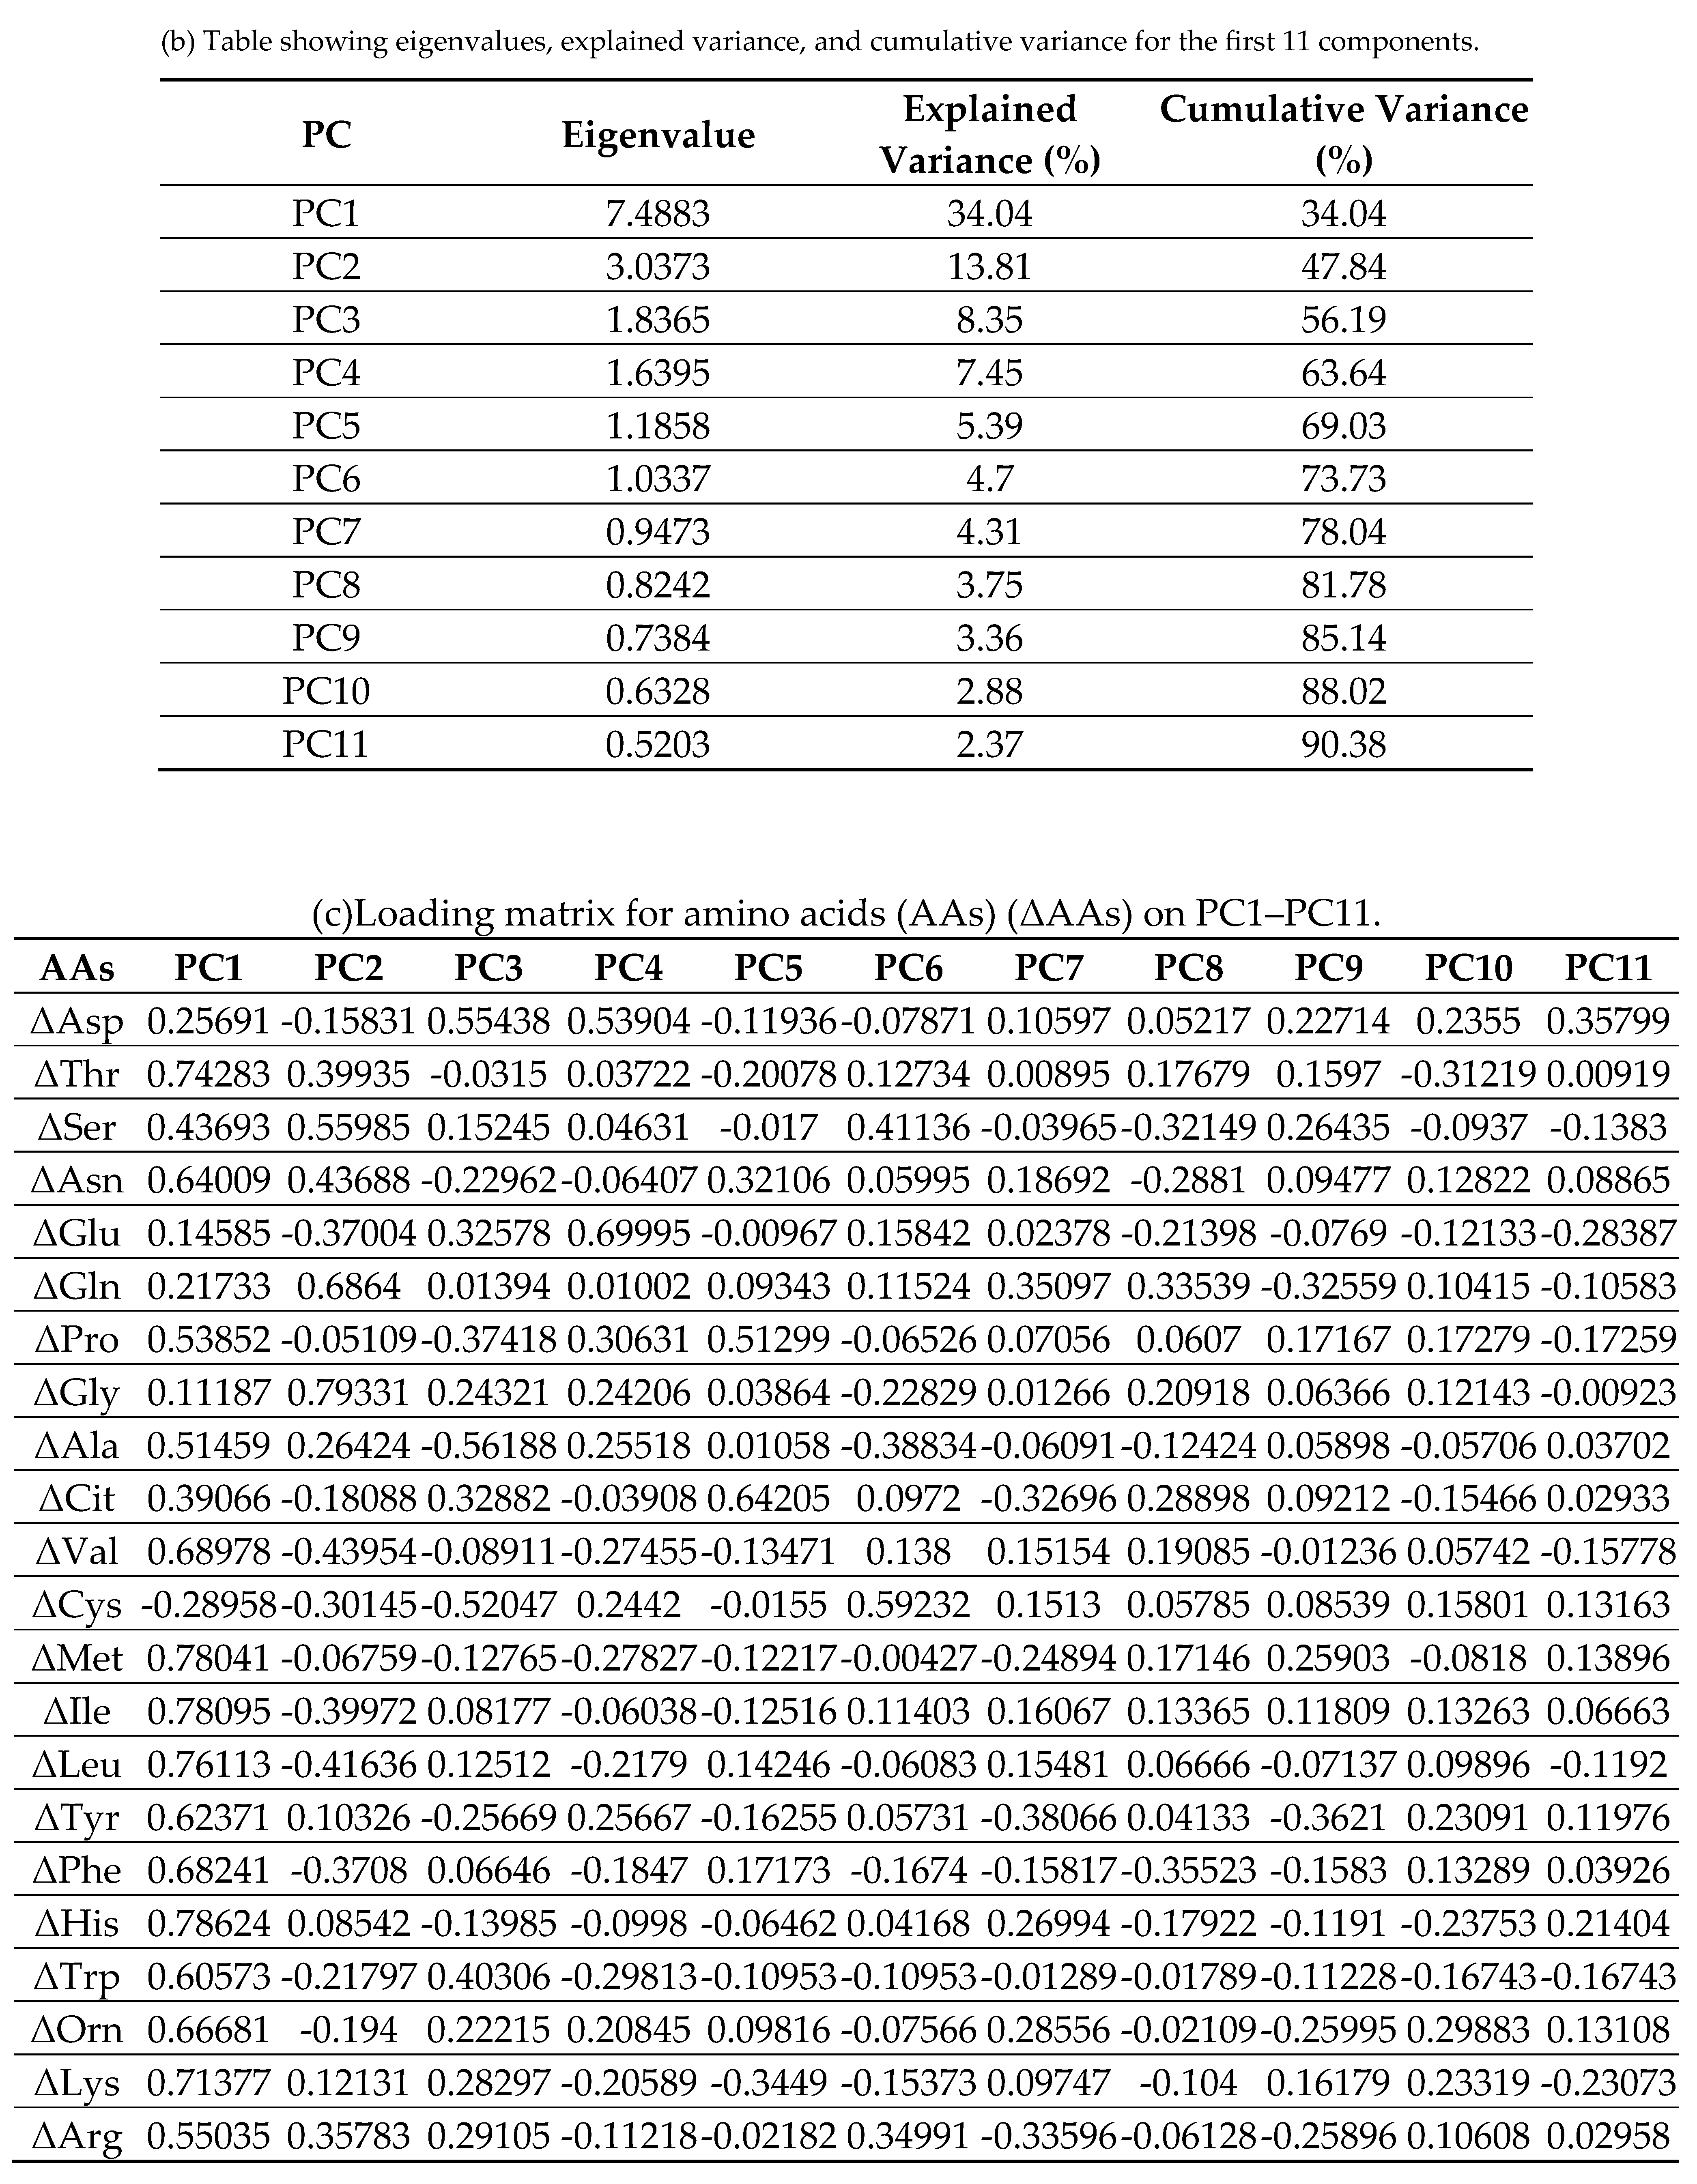
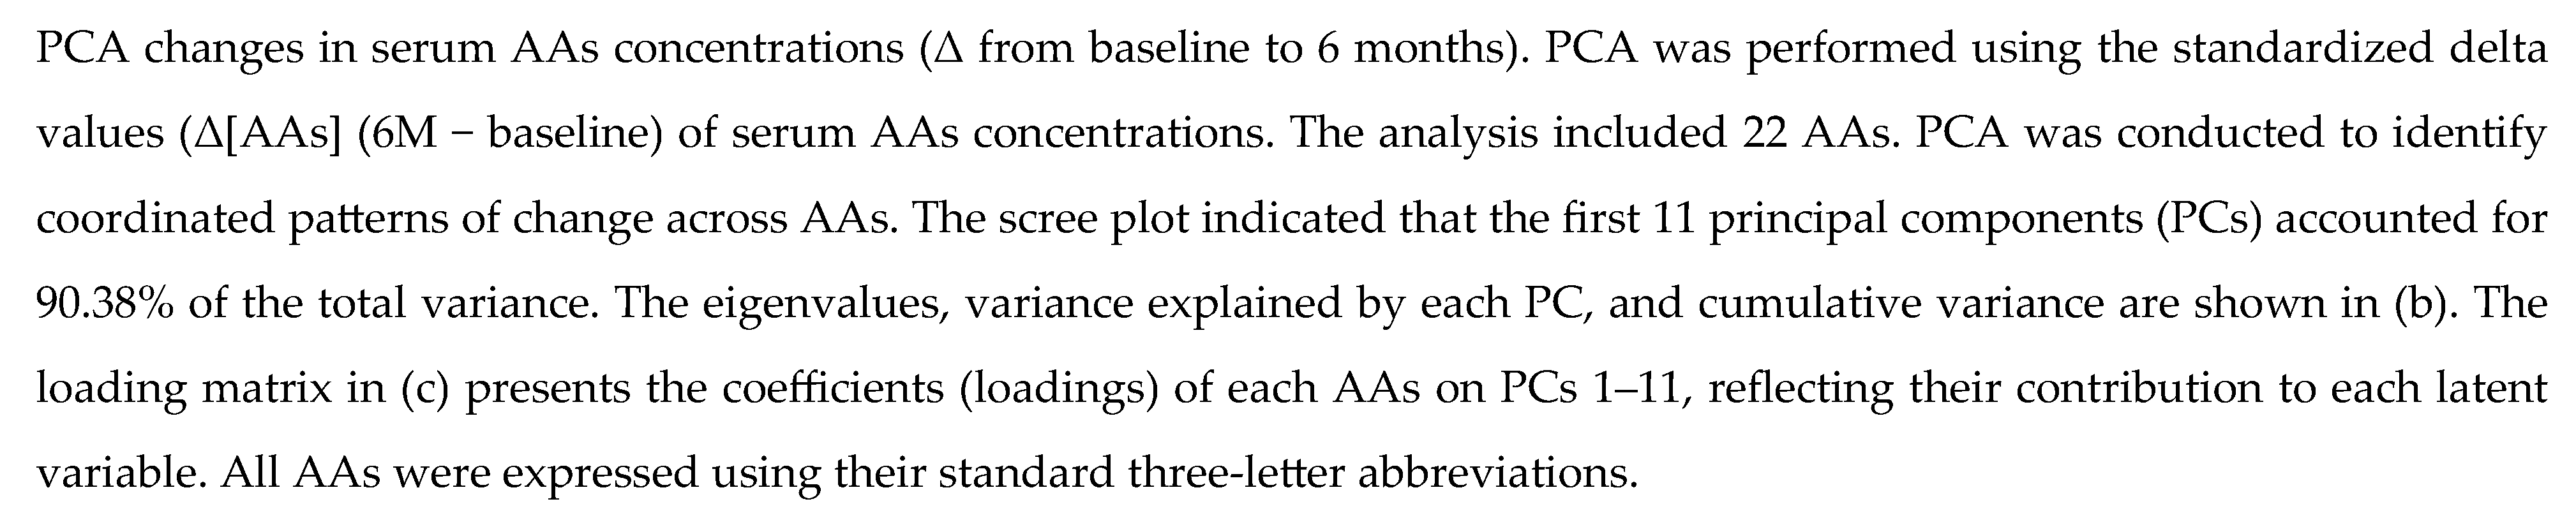

Table 1.
Baseline characteristics of the study participants.
| Variable | All (n=44) | Male (n=19) | Female (n=25) | P-value |
|---|---|---|---|---|
| Age (years) | 80 ± 3.8 | 81 ± 4.2 | 79 ± 3.3 | 0.158 |
| Height (cm) | 156.6 ± 9.5 | 164.3 ± 7.7 | 150.7 ± 5.8 | <0.001* |
| Weight (kg) | 55.3 ± 11.4 | 59.2 ± 11.0 | 52.3 ± 11.0 | 0.047* |
| BMI (kg/m²) | 22.5 ± 4.2 | 21.8 ± 2.8 | 23.0 ± 5.0 | 0.309 |
| Total Body Water (L) | 28.9 ± 5.2 | 33.1 ± 4.2 | 25.7 ± 3.2 | <0.001* |
| Protein Mass (kg) | 7.5 ± 1.4 | 8.6 ± 1.1 | 6.7 ± 0.8 | <0.001* |
| Fat Mass (kg) | 16.1 ± 7.3 | 14.4 ± 6.6 | 17.4 ± 7.7 | 0.167 |
| Muscle Mass (kg) | 36.9 ± 6.7 | 42.3 ± 5.4 | 32.8 ± 4.1 | <0.001* |
| Skeletal Muscle Mass (kg) | 20.7 ± 4.2 | 24.1 ± 3.4 | 18.1 ± 2.5 | <0.001* |
| Basal Metabolic Rate (kcal/day) | 1215 ± 150.6 | 1337 ± 123.8 | 1122 ± 92.2 | <0.001* |
| SMI (kg/m²) | 6.2 ± 1.1 | 6.8 ± 0.8 | 5.8 ± 1.0 | <0.001* |
| Grip Strength (kg) | 23.7 ± 6.7 | 29.3 ± 5.4 | 19.5 ± 3.8 | <0.001* |
| Gait Speed (m/s) | 0.88 ± 0.20 | 0.87 ± 0.19 | 0.88 ± 0.20 | 0.896 |
| Barthel Index (score) | 95 ± 8 | 97 ± 5 | 94 ± 9 | 0.157 |
| Systolic BP (mmHg) | 131 ± 19.1 | 123 ± 12.3 | 138 ± 20.8 | 0.004* |
| Diastolic BP (mmHg) | 72 ± 11.3 | 72 ± 8.8 | 73 ± 13.1 | 0.816 |
| AST (U/L) | 23 ± 9.3 | 23 ± 6.3 | 23 ± 11.2 | 0.954 |
| ALT (U/L) | 19 ± 11.7 | 20 ± 10.7 | 19 ± 12.5 | 0.705 |
| GGT (U/L) | 22 ± 13.7 | 22 ± 14.3 | 22 ± 13.5 | 0.986 |
| FIB4 Index | 2.37 ± 0.79 | 2.43 ± 0.67 | 2.33 ± 0.89 | 0.660 |
| Liver Stiffness (kPa) | 4.3 ± 1.6 | 4.5 ± 2.0 | 4.2 ± 1.2 | 0.602 |
| CAP (dB/m) | 206.5 ± 48.2 | 205.0 ± 62.9 | 207.6 ± 35.8 | 0.878 |
| Urea Nitrogen (mg/dL) | 17.4 ± 6.3 | 18.9 ± 6.2 | 16.3 ± 6.3 | 0.188 |
| Creatinine (mg/dL) | 0.75 ± 0.24 | 0.88 ± 0.23 | 0.65 ± 0.19 | <0.001* |
| eGFRcreat (mL/min/1.73 m²) | 69.7 ± 19.4 | 66.6 ± 15.1 | 72.1 ± 22.1 | 0.337 |
| Cystatin C(mg/L) | 1.07 ± 0.27 | 1.10 ± 0.26 | 1.04 ± 0.28 | 0.453 |
| eGFRcys (mL/min/1.73 m²) | 64.1 ± 18.4 | 63.4 ± 16.1 | 64.6 ± 20.3 | 0.823 |
| Uric Acid (mg/dL) | 4.8 ± 1.2 | 5.3 ± 1.1 | 4.3 ± 1.1 | 0.003* |
| Plasma Glucose (mg/dL) | 141 ± 34.6 | 134 ± 39.6 | 145 ± 30.3 | 0.306 |
| HbA1c (NGSP) (%) | 7.9 ± 1.5 | 7.7 ± 1.2 | 8.1 ± 1.7 | 0.466 |
| CPR (ng/mL) | 1.43 ± 0.93 | 1.54 ± 0.99 | 1.34 ± 0.90 | 0.512 |
| Glucagon (pg/mL) | 19.4 ± 10.6 | 21.9 ± 11.6 | 17.6 ± 9.6 | 0.201 |
| FGF21(pg/mL) | 223.2 ± 168.9 | 219.5 ± 189.6 | 226.1 ± 155.4 | 0.904 |
| Triglycerides (mg/dL) | 92 ± 35.0 | 92 ± 43.7 | 92 ± 27.7 | 0.964 |
| Total Cholesterol (mg/dL) | 174 ± 34.3 | 166 ± 33.0 | 180 ± 34.5 | 0.171 |
| HDL-C (mg/dL) | 49 ± 16.4 | 44 ± 10.1 | 53 ± 19.3 | 0.056 |
| LDL-C (mg/dL) | 99 ± 26.1 | 97 ± 30.6 | 100 ± 22.6 | 0.657 |
| FFA (μEq/L) | 718.4 ± 191.3 | 685.0 ± 229.3 | 743.8 ± 156.8 | 0.344 |
| Total Protein (g/dL) | 6.9 ± 0.5 | 7.0 ± 0.4 | 6.79 ± 0.49 | 0.143 |
Data are presented as mean ± standard deviation (SD). P-values were calculated using independent t-tests comparing male and female participants. Values with P < 0.05 were considered statistically significant and are marked with an asterisk (*). Units are expressed in conventional or SI units according to standard clinical reporting practices. Abbreviations: BMI, body mass index; BP, blood pressure.
Table 2.
Comparison of baseline nutrient intake and recommended nutrient targets.
| Nutrient Type | Baseline Intake (mean ± SD) |
Recommended Intake (mean ± SD) | P-value |
|---|---|---|---|
| Energy (kcal) | 1680 ± 350 | 1640 ± 160 | 0.460 |
| Carbohydrate (g) | 215 ± 46 | 242 ± 23 | 0.001* |
| Protein (g/kgIBW) | 1.26 ± 0.37 | 1.41 ± 0.23 | 0.028* |
| Fat (g) | 57.2 ± 17.6 | 42.9 ± 7.3 | 0.001* |
| Salt (g) | 8.9 ± 3.4 | 6.9 ± 1.0 | 0.001* |
| Calcium (mg) | 553 ± 206 | 643 ± 50 | 0.008* |
| Vitamin D (μg) | 7.7 ± 4.0 | 8.5 ± 0.0 | 0.200 |
All nutrient values represent daily intake. Recommended intake values reflect nutritional counseling targets. Data are presented as mean ±SD. P-values were calculated using paired samples t-tests. Values with P < 0.05 were considered statistically significant and are marked with an asterisk (*). Abbreviations: IBW, ideal body weight.
Table 3.
Correlations between serum amino acids (AAs) levels and sarcopenia indices. (a)Relationship between skeletal mass index (SMI) and amino acids (AAs). (b)Relationship between Grip strength and amino acids (AAs). (c)Relationship between Gait speed and amino acids (AAs)
Table 3.
Correlations between serum amino acids (AAs) levels and sarcopenia indices. (a)Relationship between skeletal mass index (SMI) and amino acids (AAs). (b)Relationship between Grip strength and amino acids (AAs). (c)Relationship between Gait speed and amino acids (AAs)
| (a) | ||||||||||||||
|---|---|---|---|---|---|---|---|---|---|---|---|---|---|---|
|
AAs 的 |
Univariate analysis | Multivariate analysis | ||||||||||||
| Non-Adjusted | Adjusted for age and sex | |||||||||||||
| r | P(r) | partial_r | P (partial_r) | Beta(95%CI) | P (Beta) | |||||||||
| Val | 0.31 | 0.039* | 0.07 | 0.633 | 0.00 (-0.01–0.01) | 0.642 | ||||||||
| Leu | 0.36 | 0.016* | 0.17 | 0.269 | 0.01 (-0.01–0.02) | 0.281 | ||||||||
| Ile | 0.35 | 0.021* | 0.16 | 0.293 | 0.01 (-0.01–0.02) | 0.305 | ||||||||
| Tyr | -0.16 | 0.290 | -0.07 | 0.642 | -0.01 (-0.03–0.02) | 0.650 | ||||||||
| Phe | 0.26 | 0.089 | 0.23 | 0.137 | 0.02 (-0.01–0.05) | 0.146 | ||||||||
| Trp | 0.04 | 0.787 | -0.09 | 0.566 | -0.01 (-0.04–0.02) | 0.576 | ||||||||
| Met | 0.2 | 0.191 | 0.2 | 0.187 | 0.04 (-0.02–0.09) | 0.198 | ||||||||
| Cys | 0.28 | 0.066 | 0.36 | 0.018* | 0.03 (0.00–0.05) | 0.021* | ||||||||
| Arg | -0.12 | 0.454 | 0.0 | 1.000 | 0.00 (-0.01–0.01) | 1.000 | ||||||||
| Orn | 0.41 | 0.005** | 0.36 | 0.015* | 0.02 (0.00–0.03) | 0.018* | ||||||||
| Cit | 0.16 | 0.304 | 0.22 | 0.155 | 0.02 (-0.01–0.04) | 0.166 | ||||||||
| Ala | 0.24 | 0.113 | 0.26 | 0.085 | 0.00 (-0.00–0.01) | 0.093 | ||||||||
| Gln | 0.02 | 0.881 | 0.08 | 0.619 | 0.00 (-0.00–0.00) | 0.628 | ||||||||
| Glu | 0.41 | 0.005** | 0.35 | 0.019* | 0.02 (0.00–0.03) | 0.022* | ||||||||
| Asp | 0.04 | 0.815 | -0.06 | 0.723 | -0.06 (-0.43–0.30) | 0.730 | ||||||||
| Asn | 0.15 | 0.345 | 0.14 | 0.366 | 0.01 (-0.01–0.04) | 0.378 | ||||||||
| Ser | -0.2 | 0.200 | -0.19 | 0.211 | -0.01 (-0.02–0.00) | 0.222 | ||||||||
| Gly | 0.1 | 0.519 | 0.3 | 0.047* | 0.01 (-0.00–0.01) | 0.053 | ||||||||
| His | 0.23 | 0.138 | 0.18 | 0.239 | 0.02 (-0.01–0.04) | 0.251 | ||||||||
| Thr | 0.18 | 0.236 | 0.19 | 0.217 | 0.01 (-0.00–0.02) | 0.228 | ||||||||
| Lys | 0.09 | 0.565 | 0.04 | 0.801 | 0.00 (-0.01–0.01) | 0.806 | ||||||||
| Pro | 0.37 | 0.013* | 0.21 | 0.162 | 0.00 (-0.00–0.01) | 0.172 | ||||||||
| BCAAs | 0.35 | 0.020* | 0.13 | 0.389 | 0.00 (-0.00–0.01) | 0.400 | ||||||||
| Total AAs | 0.3 | 0.049* | 0.26 | 0.085 | 0.00 (-0.00–0.00) | 0.093 | ||||||||
| (b) | ||||||||||||||
|
的 AAs |
Univariate analysis | Multivariate analysis | ||||||||||||
| Non-Adjusted | Adjusted for age and sex | |||||||||||||
| r | P(r) | partial_r | P(partial_r) | Beta(95%CI) | P(Beta) | |||||||||
| Val | 0.41 | 0.005** | 0.06 | 0.710 | 0.01 (-0.03–0.05) | 0.717 | ||||||||
| Leu | 0.38 | 0.012* | 0.06 | 0.707 | 0.01 (-0.04–0.06) | 0.714 | ||||||||
| Ile | 0.27 | 0.078 | -0.1 | 0.514 | -0.02 (-0.10–0.05) | 0.524 | ||||||||
| Tyr | -0.26 | 0.086 | -0.17 | 0.273 | -0.06 (-0.17–0.05) | 0.284 | ||||||||
| Phe | 0.08 | 0.624 | -0.03 | 0.831 | -0.02 (-0.17–0.14) | 0.835 | ||||||||
| Trp | 0.03 | 0.836 | -0.22 | 0.154 | -0.11 (-0.26–0.05) | 0.165 | ||||||||
| Met | -0.01 | 0.964 | -0.07 | 0.639 | -0.06 (-0.33–0.21) | 0.647 | ||||||||
| Cys | -0.07 | 0.667 | -0.06 | 0.706 | -0.02 (-0.14–0.10) | 0.713 | ||||||||
| Arg | -0.27 | 0.072 | -0.16 | 0.300 | -0.03 (-0.09–0.03) | 0.312 | ||||||||
| Orn | 0.09 | 0.543 | -0.12 | 0.428 | -0.02 (-0.09–0.04) | 0.439 | ||||||||
| Cit | -0.08 | 0.601 | -0.1 | 0.519 | -0.04 (-0.15–0.08) | 0.529 | ||||||||
| Ala | 0.0 | 0.997 | -0.04 | 0.819 | -0.00 (-0.02–0.01) | 0.823 | ||||||||
| Gln | -0.14 | 0.354 | -0.12 | 0.449 | -0.01 (-0.02–0.01) | 0.461 | ||||||||
| Glu | 0.23 | 0.135 | 0.07 | 0.637 | 0.02 (-0.06–0.09) | 0.645 | ||||||||
| Asp | 0.03 | 0.854 | -0.16 | 0.309 | -0.87 (-2.64–0.89) | 0.322 | ||||||||
| Asn | 0.01 | 0.958 | -0.04 | 0.778 | -0.02 (-0.15–0.11) | 0.784 | ||||||||
| Ser | -0.12 | 0.447 | -0.07 | 0.660 | -0.01 (-0.07–0.05) | 0.668 | ||||||||
| Gly | -0.24 | 0.112 | -0.03 | 0.840 | -0.00 (-0.03–0.02) | 0.843 | ||||||||
| His | 0.15 | 0.328 | 0.06 | 0.693 | 0.03 (-0.11–0.17) | 0.700 | ||||||||
| Thr | -0.05 | 0.763 | -0.11 | 0.474 | -0.02 (-0.06–0.03) | 0.484 | ||||||||
| Lys | 0.06 | 0.699 | -0.03 | 0.856 | -0.00 (-0.05–0.04) | 0.859 | ||||||||
| Pro | 0.25 | 0.096 | -0.08 | 0.600 | -0.01 (-0.04–0.02) | 0.609 | ||||||||
| BCAAs | 0.39 | 0.010* | 0.02 | 0.887 | 0.00 (-0.02–0.02) | 0.890 | ||||||||
| Total AAs | 0.06 | 0.692 | -0.08 | 0.626 | -0.00 (-0.00–0.00) | 0.634 | ||||||||
| (c) | ||||||||||||||
|
的 AAs |
Univariate analysis | Multivariate analysis | ||||||||||||
| Non-Adjusted | Adjusted for age and sex | |||||||||||||
| r | P(r) | partial_r | P(partial_r) | Beta(95%CI) | P(Beta) | |||||||||
| Val | -0.21 | 0.176 | -0.29 | 0.060 | -0.00 (-0.00–0.00) | 0.067 | ||||||||
| Leu | -0.29 | 0.064 | -0.37 | 0.015* | -0.00 (-0.01–-0.00) | 0.017* | ||||||||
| Ile | -0.33 | 0.032* | -0.4 | 0.009** | -0.00 (-0.01–-0.00) | 0.011* | ||||||||
| Tyr | -0.09 | 0.554 | -0.09 | 0.553 | -0.00 (-0.01–0.00) | 0.564 | ||||||||
| Phe | -0.25 | 0.111 | -0.26 | 0.092 | -0.01 (-0.01–0.00) | 0.100 | ||||||||
| Trp | -0.14 | 0.392 | -0.17 | 0.290 | -0.00 (-0.01–0.00) | 0.303 | ||||||||
| Met | -0.24 | 0.118 | -0.25 | 0.107 | -0.01 (-0.02–0.00) | 0.117 | ||||||||
| Cys | -0.24 | 0.127 | -0.22 | 0.156 | -0.00 (-0.01–0.00) | 0.167 | ||||||||
| Arg | -0.1 | 0.525 | -0.09 | 0.551 | -0.00 (-0.00–0.00) | 0.562 | ||||||||
| Orn | -0.19 | 0.223 | -0.19 | 0.226 | -0.00 (-0.00–0.00) | 0.238 | ||||||||
| Cit | -0.07 | 0.659 | -0.03 | 0.840 | -0.00 (-0.01–0.01) | 0.845 | ||||||||
| Ala | -0.34 | 0.029* | -0.38 | 0.014* | -0.00 (-0.00–-0.00) | 0.017* | ||||||||
| Gln | -0.17 | 0.296 | -0.18 | 0.248 | -0.00 (-0.00–0.00) | 0.260 | ||||||||
| Glu | 0.02 | 0.908 | -0.02 | 0.906 | -0.00 (-0.00–0.00) | 0.909 | ||||||||
| Asp | -0.15 | 0.370 | -0.16 | 0.338 | -0.04 (-0.11–0.04) | 0.351 | ||||||||
| Asn | -0.16 | 0.312 | -0.17 | 0.272 | -0.00 (-0.01–0.00) | 0.285 | ||||||||
| Ser | -0.03 | 0.862 | -0.09 | 0.559 | -0.00 (-0.00–0.00) | 0.569 | ||||||||
| Gly | -0.02 | 0.915 | -0.04 | 0.794 | -0.00 (-0.00–0.00) | 0.799 | ||||||||
| His | -0.12 | 0.447 | -0.11 | 0.472 | -0.00 (-0.01–0.00) | 0.483 | ||||||||
| Thr | -0.19 | 0.224 | -0.22 | 0.156 | -0.00 (-0.00–0.00) | 0.167 | ||||||||
| Lys | -0.21 | 0.175 | -0.26 | 0.094 | -0.00 (-0.00–0.00) | 0.102 | ||||||||
| Pro | -0.19 | 0.217 | -0.24 | 0.125 | -0.00 (-0.00–0.00) | 0.135 | ||||||||
| BCAAs | -0.28 | 0.076 | -0.37 | 0.017* | -0.00 (-0.00–-0.00) | 0.021* | ||||||||
| Total AAs | -0.31 | 0.043* | -0.36 | 0.021* | -0.00 (-0.00–-0.00) | 0.025* | ||||||||
Pearson’s correlation coefficients(r), partial correlation coefficients adjusted for age and sex (partial r), and standardized regression coefficients (β) with 95% confidence intervals (CI) were calculated for each of the AAs. Sex was coded as 0 (male) and 1 (female). *p < 0.05, **p < 0.01, ***p < 0.001.Abbreviations: Arg, arginine; Asn, asparagine; Asp, aspartic acid; BCAAs, branched chain amino adids; Cit, citrulline; Gln, glutamine; Gly, glycine; His, histidine; Lys, lysine; Met, methionine; Phe, phenylalanine; Ser, serine; Thr, threonine; Trp, tryptophan; Tyr, tyrosine.
Table 4.
Correlations between CPR, Glucagon, FGF21 and Clinical Variables. (a) C-peptide (CPR) related variables. (b) Glucagon related variables. (c) Fibroblast growth factor 21 (FGF21) related variables.
Table 4.
Correlations between CPR, Glucagon, FGF21 and Clinical Variables. (a) C-peptide (CPR) related variables. (b) Glucagon related variables. (c) Fibroblast growth factor 21 (FGF21) related variables.
| (a) | ||||||||||||||||
|---|---|---|---|---|---|---|---|---|---|---|---|---|---|---|---|---|
|
Variable |
Univariate analysis | Multivariate analysis | ||||||||||||||
| Non-Adjusted | Adjusted for age and sex | |||||||||||||||
| r | P(r) | partial r | P (partial r) | β (95%CI) | P(β) | |||||||||||
| BMI | 0.59 | 0.0*** | 0.62 | 0.0*** | 0.62(0.35–0.87) | 0.0*** | ||||||||||
| Fat Mass (kg) | 0.71 | 0.0*** | 0.74 | 0.0*** | 0.73(0.51–0.95) | 0.0*** | ||||||||||
| Body fat percentage (%BF) | 0.55 | 0.0*** | 0.64 | 0.0*** | 0.59(0.35–0.82) | 0.0*** | ||||||||||
| SMI (kg/m²) | 0.52 | 0.0*** | 0.53 | 0.0*** | 0.47(0.21–0.71) | 0.0*** | ||||||||||
| Grip Strength (kg) | 0.12 | 0.444 | 0.04 | 0.817 | 0.02(-0.19–0.24) | 0.821 | ||||||||||
| Gait Speed (m/s) | -0.12 | 0.468 | -0.15 | 0.36 | -0.14(-0.47–0.18) | 0.373 | ||||||||||
| AST (U/L) | 0.26 | 0.096 | 0.25 | 0.106 | 0.26(-0.06–0.57) | 0.116 | ||||||||||
| ALT (U/L) | 0.35 | 0.023* | 0.33 | 0.03* | 0.34(0.02–0.64) | 0.035* | ||||||||||
| GGT (U/L) | 0.44 | 0.004** | 0.47 | 0.002** | 0.47(0.18–0.76) | 0.002** | ||||||||||
| FIB4 Index | -0.04 | 0.81 | -0.01 | 0.943 | -0.01(-0.33–0.31) | 0.945 | ||||||||||
| Urea Nitrogen (mg/dL) | 0.24 | 0.128 | 0.25 | 0.106 | 0.25(-0.06–0.56) | 0.115 | ||||||||||
| Creatinine (mg/dL) | 0.53 | 0.0*** | 0.58 | 0.0*** | 0.51(0.27–0.75) | 0.0*** | ||||||||||
| eGFRcreat (mL/min/1.73 m²) | -0.5 | 0.001** | -0.54 | 0.0*** | -0.53(-0.81–-0.25) | 0.0*** | ||||||||||
| Cystatin C(mg/L) | 0.37 | 0.017* | 0.41 | 0.007** | 0.41(0.11–0.69) | 0.008** | ||||||||||
| eGFRcys (mL/min/1.73 m²) | -0.34 | 0.029* | -0.42 | 0.006** | -0.40(-0.68–-0.11) | 0.007** | ||||||||||
| Uric Acid (mg/dL) | 0.27 | 0.09 | 0.28 | 0.078 | 0.25(-0.03–0.53) | 0.086 | ||||||||||
| Plasma Glucose (mg/dL) | 0.26 | 0.097 | 0.27 | 0.088 | 0.27(-0.049–0.58) | 0.096 | ||||||||||
| HbA1c (NGSP) (%) | -0.09 | 0.554 | -0.09 | 0.557 | -0.09(-0.41–0.23) | 0.567 | ||||||||||
| Glucagon (pg/mL) | 0.14 | 0.366 | 0.15 | 0.352 | 0.15(-0.17–0.46) | 0.364 | ||||||||||
| FGF21(pg/mL) | 0.34 | 0.029* | 0.34 | 0.028* | 0.34(0.03–0.65) | 0.032* | ||||||||||
| Triglycerides (mg/dL) | 0.54 | 0.0*** | 0.55 | 0.0*** | 0.56(0.28–0.83) | 0.0*** | ||||||||||
| Total Cholesterol (mg/dL) | -0.25 | 0.11 | -0.23 | 0.146 | -0.23(-0.54–0.09) | 0.156 | ||||||||||
| HDL-C (mg/dL) | -0.4 | 0.008** | -0.39 | 0.012* | -0.38(-0.6–-0.08) | 0.014* | ||||||||||
| LDL-C (mg/dL) | -0.16 | 0.307 | -0.16 | 0.324 | -0.16(-0.48–0.17) | 0.336 | ||||||||||
| FFA (μEq/L) | 0.02 | 0.92 | 0.01 | 0.946 | 0.01(-0.31–0.3) | 0.948 | ||||||||||
| (b) | ||||||||||||||||
|
的 Variable |
Univariate analysis | Multivariate analysis | ||||||||||||||
| Non-Adjusted | Adjusted for age and sex | |||||||||||||||
| r | P(r) | partial r | P (partial r) | β (95%CI) | P(β) | |||||||||||
| BMI | 0.12 | 0.438 | 0.17 | 0.286 | 0.17(-0.15–0.48) | 0.298 | ||||||||||
| Fat Mass (kg) | 0.21 | 0.182 | 0.28 | 0.071 | 0.28(-0.03–0.58) | 0.078 | ||||||||||
| Body fat percentage (%BF) | 0.16 | 0.301 | 0.29 | 0.061 | 0.27(-0.02–0.55) | 0.068 | ||||||||||
| SMI (kg/m²) | 0.17 | 0.284 | 0.1 | 0.517 | 0.09(-0.19–0.37) | 0.528 | ||||||||||
| Grip Strength (kg) | 0.27 | 0.077 | 0.22 | 0.149 | 0.15(-0.06–0.35) | 0.16 | ||||||||||
| Gait Speed (m/s) | 0.08 | 0.613 | 0.09 | 0.562 | 0.09(-0.24–0.42) | 0.573 | ||||||||||
| AST (U/L) | -0.02 | 0.886 | -0.02 | 0.881 | -0.02(-0.35–0.30) | 0.884 | ||||||||||
| ALT (U/L) | -0.05 | 0.771 | -0.05 | 0.754 | -0.05(-0.37–0.27) | 0.76 | ||||||||||
| GGT (U/L) | -0.12 | 0.438 | -0.13 | 0.398 | -0.13(-0.46–0.19) | 0.41 | ||||||||||
| FIB4 Index | 0.07 | 0.659 | 0.03 | 0.835 | 0.03(-0.28–0.35) | 0.839 | ||||||||||
| Urea Nitrogen (mg/dL) | 0.3 | 0.052 | 0.26 | 0.088 | 0.26(-0.04–0.57) | 0.096 | ||||||||||
| Creatinine (mg/dL) | 0.28 | 0.073 | 0.21 | 0.177 | 0.19(-0.09–0.47) | 0.188 | ||||||||||
| eGFRcreat (mL/min/1.73 m²) | -0.19 | 0.222 | -0.16 | 0.306 | -0.16(-0.47–0.15) | 0.318 | ||||||||||
| Cystatin C(mg/L) | 0.16 | 0.3 | 0.13 | 0.405 | 0.13(-0.18–0.44) | 0.417 | ||||||||||
| eGFRcys (mL/min/1.73 m²) | -0.08 | 0.615 | -0.05 | 0.747 | -0.05(-0.36–0.26) | 0.753 | ||||||||||
| Uric Acid (mg/dL) | 0.04 | 0.808 | -0.06 | 0.694 | -0.06(-0.35–0.23) | 0.701 | ||||||||||
| Plasma Glucose (mg/dL) | -0.06 | 0.691 | -0.01 | 0.924 | -0.01(-0.33–0.30) | 0.926 | ||||||||||
| HbA1c (NGSP) (%) | -0.21 | 0.168 | -0.19 | 0.213 | -0.20(-0.51–0.12) | 0.224 | ||||||||||
| CPR (ng/mL) | 0.14 | 00.366 | 0.15 | 0.352 | 0.15(-0.17–0.47) | 0.364 | ||||||||||
| FGF21(pg/mL) | 0.06 | 0.722 | 0.07 | 0.649 | 0.07(-0.25–0.40) | 0.657 | ||||||||||
| Triglycerides (mg/dL) | 0.12 | 0.459 | 0.13 | 0.411 | 0.13(-0.19–0.45) | 0.423 | ||||||||||
| Total Cholesterol (mg/dL) | -0.01 | 0.96 | 0.02 | 0.887 | 0.02(-0.30–0.34) | 0.89 | ||||||||||
| HDL-C (mg/dL) | -0.06 | 0.685 | -0.03 | 0.835 | -0.03(-0.35–0.28) | 0.839 | ||||||||||
| LDL-C (mg/dL) | 0.01 | 0.931 | 0.03 | 0.853 | 0.03(-0.30–0.36) | 0.856 | ||||||||||
| FFA (μEq/L) | 0.18 | 0.253 | 0.24 | 0.116 | 0.24(-0.07–0.55) | 0.125 | ||||||||||
| (c) | ||||||||||||||||
|
的 Variable |
Univariate analysis | Multivariate analysis | ||||||||||||||
| Non-Adjusted | Adjusted for age and sex | |||||||||||||||
| r | P(r) | partial r | P (partial r) | β (95%CI) | P(β) | |||||||||||
| BMI | 0.15 | 0.322 | 0.15 | 0.347 | 0.14(-0.17–0.46) | 0.359 | ||||||||||
| Fat Mass (kg) | 0.31 | 0.041* | 0.31 | 0.045* | 0.30(-0.00–0.59) | 0.051 | ||||||||||
| Body fat percentage (%BF) | 0.23 | 0.134 | 0.23 | 0.135 | 0.21(-0.07–0.49) | 0.145 | ||||||||||
| SMI (kg/m²) | 0.03 | 0.862 | 0.04 | 0.782 | 0.04(-0.24–0.32) | 0.788 | ||||||||||
| Grip Strength (kg) | -0.21 | 0.168 | -0.3 | 0.05 | -0.20(-0.39–0.00) | 0.056 | ||||||||||
| Gait Speed (m/s) | -0.4 | 0.009** | -0.42 | 0.006** | -0.42(-0.71–-0.11) | 0.008** | ||||||||||
| AST (U/L) | 0.11 | 0.486 | 0.11 | 0.497 | 0.11(-0.21–0.42) | 0.508 | ||||||||||
| ALT (U/L) | 0.06 | 0.716 | 0.05 | 0.738 | 0.05(-0.26–0.37) | 0.744 | ||||||||||
| GGT (U/L) | 0.21 | 0.173 | 0.22 | 0.155 | 0.22(-0.09–0.53) | 0.166 | ||||||||||
| FIB4 Index | -0.14 | 0.368 | -0.13 | 0.424 | -0.12(-0.43–0.18) | 0.435 | ||||||||||
| Urea Nitrogen (mg/dL) | -0.01 | 0.946 | 0.0 | 0.977 | 0.00(-0.31–0.32) | 0.977 | ||||||||||
| Creatinine (mg/dL) | 0.18 | 0.235 | 0.24 | 0.124 | 0.21(-0.06–0.48) | 0.134 | ||||||||||
| eGFRcreat (mL/min/1.73 m²) | -0.1 | 0.507 | -0.12 | 0.428 | -0.12(-0.43–0.19) | 0.44 | ||||||||||
| Cystatin C(mg/L) | 0.37 | 0.015* | 0.4 | 0.008** | 0.39(0.10–0.67) | 0.009** | ||||||||||
| eGFRcys (mL/min/1.73 m²) | -0.37 | 0.013* | -0.42 | 0.005** | -0.40(-0.67–-0.12) | 0.006** | ||||||||||
| Uric Acid (mg/dL) | 0.04 | 0.814 | 0.07 | 0.668 | 0.06(-0.22–0.35) | 0.676 | ||||||||||
| Plasma Glucose (mg/dL) | -0.08 | 0.613 | -0.1 | 0.524 | -0.10(-0.41–0.21) | 0.534 | ||||||||||
| HbA1c (NGSP) (%) | -0.25 | 0.102 | -0.26 | 0.09 | -0.26(-0.57–0.05) | 0.099 | ||||||||||
| Glucagon (pg/mL) | 0.06 | 0.722 | 0.07 | 0.649 | 0.07(-0.24–0.38) | 0.657 | ||||||||||
| CPR (ng/mL) | 0.34 | 0.029 | 0.34 | 0.028* | 0.33(0.02–0.63) | 0.032* | ||||||||||
| Triglycerides (mg/dL) | 0.4 | 0.009** | 0.39 | 0.009** | 0.39(0.09–0.69) | 0.011* | ||||||||||
| Total Cholesterol (mg/dL) | 0.19 | 0.231 | 0.19 | 0.227 | 0.19(-0.12–0.49) | 0.239 | ||||||||||
| HDL-C (mg/dL) | -0.05 | 0.773 | -0.05 | 0.767 | -0.04(-0.35–0.26) | 0.772 | ||||||||||
| LDL-C (mg/dL) | 0.18 | 0.251 | 0.18 | 0.258 | 0.18(-0.14–0.49) | 0.27 | ||||||||||
| FFA (μEq/L) | 0.19 | 0.226 | 0.17 | 0.262 | 0.17(-0.13–0.47) | 0.274 | ||||||||||
Pearson’s correlation coefficients (r), partial correlation coefficients adjusted for age and sex (partial r), and standardized regression coefficients (β) with 95% confidence intervals (CI) were calculated for each variable. Sex was coded as 0 (male) and 1 (female). *p < 0.05, **p < 0.01, ***p < 0.001.Abbreviations: AST, aspartate aminotransferase; ALT, alanine aminotransferase; BMI, body mass index; eGFRcreat, estimated glomerular filtration rate based on creatinine; eGFRcys, eGFR based on cystatin C; FFA, free fatty acid; FIB4, fibrosis-4 index; GGT gamma-glutamyl transferase; HDL-C, high density lipoprotein cholesterol; LDL-C, low density lipoprotein cholesterol; SMI, skeletal mass index.
Table 5.
Multiple Linear Regression Analysis of Changes in Sarcopenia Indicators.
| (a) Change in sex-normalized skeletal mass index (SMI) (ΔnSMI) | ||||||
| Predictor Variable | β | SE | Standardized β | t-value | df | P-value |
| Sex | 1.90700 | 1.58800 | 0.18180 | 1.20100 | 30 | 0.23910 |
| Age | -0.06609 | 0.20740 | -0.04800 | -0.31870 | 30 | 0.75210 |
| ΔGlucagon | 0.16140 | 0.06590 | 0.40820 | 2.44900 | 30 | 0.02037* |
| ΔCPR | -2.81200 | 1.16000 | -0.41160 | -2.42000 | 30 | 0.02163* |
| PC8 | -2.46100 | 0.80050 | -0.42390 | -3.07400 | 30 | 0.00446* |
| PC2 | -0.37510 | 0.86230 | -0.06210 | -0.43510 | 30 | 0.66620 |
| PC3 | 0.66020 | 0.53410 | 0.18970 | 1.23600 | 30 | 0.22590 |
| PC9 | -0.97920 | 0.85090 | -0.15960 | -1.15070 | 30 | 0.25860 |
| Model fit: R = 0.6682, R² = 0.4465, Adj. R² = 0.2989, F (8, 30) = 3.0250, P = .0129. | ||||||
| (b) Change in sex-normalized Grip Strength (ΔnGrip) | ||||||
| Predictor Variable | β | SE | Standardized β | t-value | df | P-value |
| Sex | -4.78500 | 4.73300 | -0.15130 | -1.01110 | 30 | 0.32008 |
| Age | 0.20600 | 0.61370 | 0.04960 | 0.33570 | 30 | 0.73947 |
| ΔGlucagon | -0.40420 | 0.42870 | -0.08850 | -0.94280 | 30 | 0.02806* |
| ΔCPR | -0.78230 | 1.34500 | -0.03800 | -0.58170 | 30 | 0.83152 |
| PC1 | -2.09400 | 0.79550 | -0.36070 | -2.63600 | 30 | 0.01326* |
| PC7 | -5.28000 | 2.25400 | -0.39250 | -2.34200 | 30 | 0.02601* |
| PC3 | -3.82200 | 2.04700 | -0.41940 | -1.86700 | 30 | 0.07355 |
| PC2 | -2.05400 | 1.47600 | -0.22530 | -1.39160 | 30 | 0.17427 |
| Model fit: R = 0.6826, R² = 0.4660, Adj. R² = 0.3236, F(8, 30) = 3.2726, P = .0084. | ||||||
* P < 0.05. SE: Standard Error; df: Degrees of Freedom; ΔnSMI: Change in sex-normalized Skeletal Muscle Index; ΔnGrip: Change in sex-normalized grip strength; Sex was coded as Female = 1 and Male = 0; ΔGlucagon: Change in serum glucagon concentration (pg/mL); ΔCPR: Change in serum C-peptide concentration (ng/mL); PC1–PC9: Principal component scores derived from changes in 22 amino acids. Sex-normalized SMI (nSMI) was calculated as SMI divided by the reference cutoff (7.0 for men, 5.7 for women). Sex-normalized grip strength (nGrip) was calculated as grip strength divided by the reference cutoff (28 kg for men, 18 kg for women). A regression model could not be constructed for gait speed.
Disclaimer/Publisher’s Note: The statements, opinions and data contained in all publications are solely those of the individual author(s) and contributor(s) and not of MDPI and/or the editor(s). MDPI and/or the editor(s) disclaim responsibility for any injury to people or property resulting from any ideas, methods, instructions or products referred to in the content. |
© 2025 by the authors. Licensee MDPI, Basel, Switzerland. This article is an open access article distributed under the terms and conditions of the Creative Commons Attribution (CC BY) license (http://creativecommons.org/licenses/by/4.0/).
Copyright: This open access article is published under a Creative Commons CC BY 4.0 license, which permit the free download, distribution, and reuse, provided that the author and preprint are cited in any reuse.


