
Submitted:
02 October 2025
Posted:
03 October 2025
You are already at the latest version
Abstract
Warm rain events are a type of precipitation episode that is common almost everywhere around the world, except in the coldest polar regions. When these episodes occur in an air mass characterized by very moist air and elevated precipitable water, they can produce substantial rainfall amounts with high rainfall rates and sometimes result in flash floods. Catalonia (northeast of the Mediterranean coast of the Iberian Peninsula) is not an exception, and it is affected by these types of episodes, which every year are responsible for local flash floods. About 70% of cases exceeding 10 mm of daily precipitation with fewer than 10 cloud-to-ground flashes are considered warm rain. Even though the synoptic and mesoscale frames, as well as the vertical thermodynamic profile where warm rain occurs, are quite unknown.
Therefore, the purpose of our research was to determine the most favorable meteorological conditions that favor heavy warm rain episodes. During the initial analysis, made be-tween 2006 and 2009, we found out that warm rain events occur mainly at coast of Cata-lonia, during the warmest period of the year, after the pass of a cold front, with local wind convergences, and with a particular vertical thermodynamic profile; moreover, the con-vective cloud where this rain develops isn’t deep and produce no or few lightning flashes. However, after years of studying new episodes with different configurations, we realized that the main occurrence factor coincides with a particular vertical thermodynamic profile. This manuscript presents how our knowledge has changed and improved over the years. Furthermore, the paper explains the circumstances that have led to a change in our viewpoint.
Keywords:
warm rain
; forecast
; Catalonia
; thermodynamics
; floods
; remote sensing
1. Introduction
During summer and autumn, the Mediterranean coast of the Iberian Peninsula is affected by episodes of high rain rate and, moreover, huge amounts of precipitation. Most of these events are produced by very deep convection clouds [1,2,3]. However, some of them have their origin in not deeply convective clouds that are able to produce similar rain rates and amounts of precipitation [4].
The coast of Catalonia and the surrounding area, also north-east of the Mediterranean coast of the Iberian Peninsula, are affected by these two types of heavy rain events too. But the present paper focuses on heavy rain episodes produced not by deep convection. These events are caused by small vertical and horizontal clouds, such as shallow cumulus convection [5] that, despite their size, are characterized by their high rainfall rate [4]. Because of their small size [6], remote sensing tools usually don’t warn of their intensity because they look like simple warm, shallow, and low cloud [7], with no or few lightning, while radar data shows local moderate-heavy reflectivity [8]. On the other hand, meteorological models don’t seem to predict these events with accuracy because the thermodynamic environment only shows low instability [9,10]. Consequently, they become a threat to the population, but also a threat and a challenge for forecasters. This type of heavy rain event is known as warm rain because the clouds that produce it are characterized by the absence of ice phase in them [11]. In warm rain events, the collision-coalescence process (or warm rain process) is the dominant rainfall-producing mechanism. In this way, this type of precipitation is characterized by a rapid conversion of water vapor to rain, resulting in high precipitation efficiency and rainfall rates [12].
As aforementioned, these bouts are produced by small clouds that grow in a warm and very humid low-level airmass [7]. They are not deeply developed because they are capped by a low-mid altitude thermal inversion, as Hawaiian warm rain showers [13]. In addition, a major part of the cloud extends below the freezing level or just over it [14]. Because of it, the main precipitation-producing mechanism is the warm rain process.
From the point of view of remote sensing tools, these events can cause a deceptive image of reality. On one hand, the satellite images don’t look like the typical white and bright top of deep convection clouds. Because of thermal inversion, these clouds can’t develop deeply, so the infrared (IR) satellite images depict them as a low and warm cloud [6,15] without organized convection. On the other hand, the lack or low presence of ice phase in the cloud is the reason for few if any cloud-to-ground lightning [8,16]. And finally, reflectivity radar values show moderate to high reflectivity but always concentrated at the lower part of the cloud [6,8,12,16,17].
Despite all these features, these clouds can produce high rainfall rates and amounts of precipitation [4] because of the highly efficient process of the relationship between the input and output flows inside the clouds [18].
All the previous characteristics made warm rain events go unnoticed by the Forecasting and Surveillance Team (hereafter, EPV, from the Catalan "Equip de Predicció i Vigilància) of the Meteorological Service of Catalonia (hereafter, SMC, from the Catalan "Servei Meteorològic de Catalunya") during both forecasting and monitoring during the early 2000. To solve this issue, EPV needed to know about these episodes to be able to predict and detect them during surveillance tasks. This was the initial point of our study. The present study shows the main characteristics of these warm rain events in Catalonia and, indeed, how knowledge about them has evolved.
2. Area of Study and Data Used
2.1. The Area of Interest
The Area of Interest includes the whole Catalan territory (Figure 1), located in the northeastern part of the Iberian Peninsula. The region is characterized by a complex topography, with mountains reaching 3000 m in the Pyrenees (running from west to east in the northern part of the area), and the 1700 m and 700 m in the Prelitoral and Litoral Ranges, respectively (both going discontinuously from southwest to northeast, nearly parallel to the coast). Therefore, the distribution of the valleys and mountains is a focusing factor on most of the events, because it allows the formation of local wind convergences. In any case, the maritime nature of the air mass that generates these rainfalls means that most of the episodes occur in the blue shaded area in Figure 1 (panel b). This area is known as the combination of the Litoral and Prelitoral sectors.
Going more in deep with the Litoral and Prelitoral, the region is configured by the two previously cited chains: Prelitoral and Litoral ranges. These two chains set a very steep terrain, full of small basins of streams. Because of their short length and the mountain slopes, these streams are characterized by a fast-time hydrological response, making them prone to flash floods. Besides, this area is the most populated zone of Catalonia, with more than 6,8 million inhabitants [19]. So, the combination of all factors (heavy rainfall, complex hydrology, and highly vulnerable territory) can turn the small but intense warm rain events into a hazard for the population.
2.2. Data Used
2.2.1. Surface Observations
The Automatic Weather Stations Network (or XEMA, from the Catalan “Xarxa d’Estacions Meteorològiques Automàtiques”) is managed by the SMC. It is composed of 190 Stations, which transmit information to the SMC quarters via digital radio, GSM (Global System for Mobile communications) technology and satellite. The main variables provided are rainfall at 1 minute time resolution, and wind (direction and speed), humidity, temperature and solar radiation at 30 minutes time resolution [20]. Despite the high density, there are several cases in which none of the stations can report high rainfall values, because the reduced area affected by the precipitation.
2.2.2. Upper-Air Observations
The atmospheric sounding station of Barcelona, operative since 1998 with the World Meteorological Organization (WMO) code 08190 [21], allows knowing the vertical profile of the atmosphere in the central coast twice a day (0 and 12 UTC). The study has been focused on the CAPE values [22] and vertical distribution, the precipitable water mass content (PWM) and distribution along the vertical profile [11], and the equilibrium level (EL) height [23]. These variables can provide relevant information to determine the main relevant features and, furthermore, to identify a common pattern that can help to a better forecast of these events.
2.2.3. Remote Sensing
Three types of remote sensing data have been used. The combination of all sources allows the dispose of a complete scheme of the clouds producing warm rain. The high quality in time and space of all systems plays an important role at the time of analyzing the event, especially during surveillance tasks. The sources are:
- The SMC radar network (XRAD) is composed of four Doppler single-pol radars [24]. Each of them operates on C-band and have a maximum range of 250 km, with only one elevation or Plan Position Indicator (PPI) field at this range. Besides, the short range provides volumetric information from 16 elevations, from 0.6 to 30º. The XRAD has been designed to provide quantitative rainfall estimates and 3D information on the rainfall producing structures. The different products used in this analysis have been reflectivity fields, by means of CAPPI (Constant Altitude Plan Position Indicators) at different heights; echo tops (or the maximum height at which a certain reflectivity threshold has been observed); and the precipitation estimation. There are different types of external factors that affect the quality of the radar imagery. In the case of the XRAD, they can be summarized as: producing reflectivity overestimation (ground-clutter, non-meteorological atmospheric echoes, and electromagnetic interferences) and producing reflectivity underestimation (beam topographic blockage, radar beam elevation with distance, the cone of silence, and high-reflectivity blockage). These anomalies can interfere in the radar fields from different points of view [25]. La Miranda radar (LMI label in Figure 2) was installed in 2008, meanwhile the others were put in operational between 2001 and 2003.
- The Lightning Detection Network (known as XDDE) is integrated by four VHF (Very High Frequency) plus LF (Low Frequency) interferometers detectors, which send individual data of each flash [26]. The complete information of every lightning is processed in a system in the SMC headquarters. The arrangement of the detectors was designed to provide good coverage to all of Catalonia, with precision in pinpointing lightning at 500 meters throughout a large part of Catalonian territory. Radar parameters have been compared with flash counts (cloud-to-ground, CG, and intra-cloud, IC). Amposta sensor (AMP label in Figure 2) was installed in 2006. The rest of sensors started their operative task between 2002 and 2004.
- Satellite imagery [27] proceeds from the Meteosat Second Generation (MSG). The MSG has three channels in the thermal infrared (7, 9 and 10). They allow the measurement of surface and cloud temperature. In the present study, only channel 9 has been used, and it corresponds to the thermal infrared. This channel allows monitoring the cloud dynamics throughout the day. The study of the imagery in the present work has been exclusively qualitative.
2.2.4. Numerical Weather Prediction (NWP) Models
Forecast of warm rain events is made based on two NWP configurations: on one hand, synoptical (or large-scale), and, on the other hand, mesoscalar (or mid-scale). There are clear differences between models running in 2006 and currently. In the first case and for the large scale, the numerical weather models used were the Global Model (GME, [28]) and European Centre for Medium-Range Weather Forecasts (ECMWF, [29]). MM5 (Fifth-Generation Penn State/NCAR Mesoscale Model) model [30] was the operational model used in the first years of the SMC. Over the years the SMC has evolved in the use of the NWP, introducing new models and changing the configurations according to the necessities and the possibilities. The current models are Global Forecast System (GFS) model [31] and ECMWF [32] at large scale, meanwhile for mesoscale the operational models are Weather Research and Forecasting (WRF) model [33] and Arome [34].
The surface, 850 hPa, 500 hPa and 300 hPa fields were analyzed for the large scale to identify the favorable atmospheric environment to warm rain events, which initially was found to be behind a cold front or behind an upper-level trough. On the other hand, mesoscale outputs were used to obtain meteorological features at lower spatial resolution, in particular convergence lines and low-level moisture fields signatures that can help to trigger convective clouds.
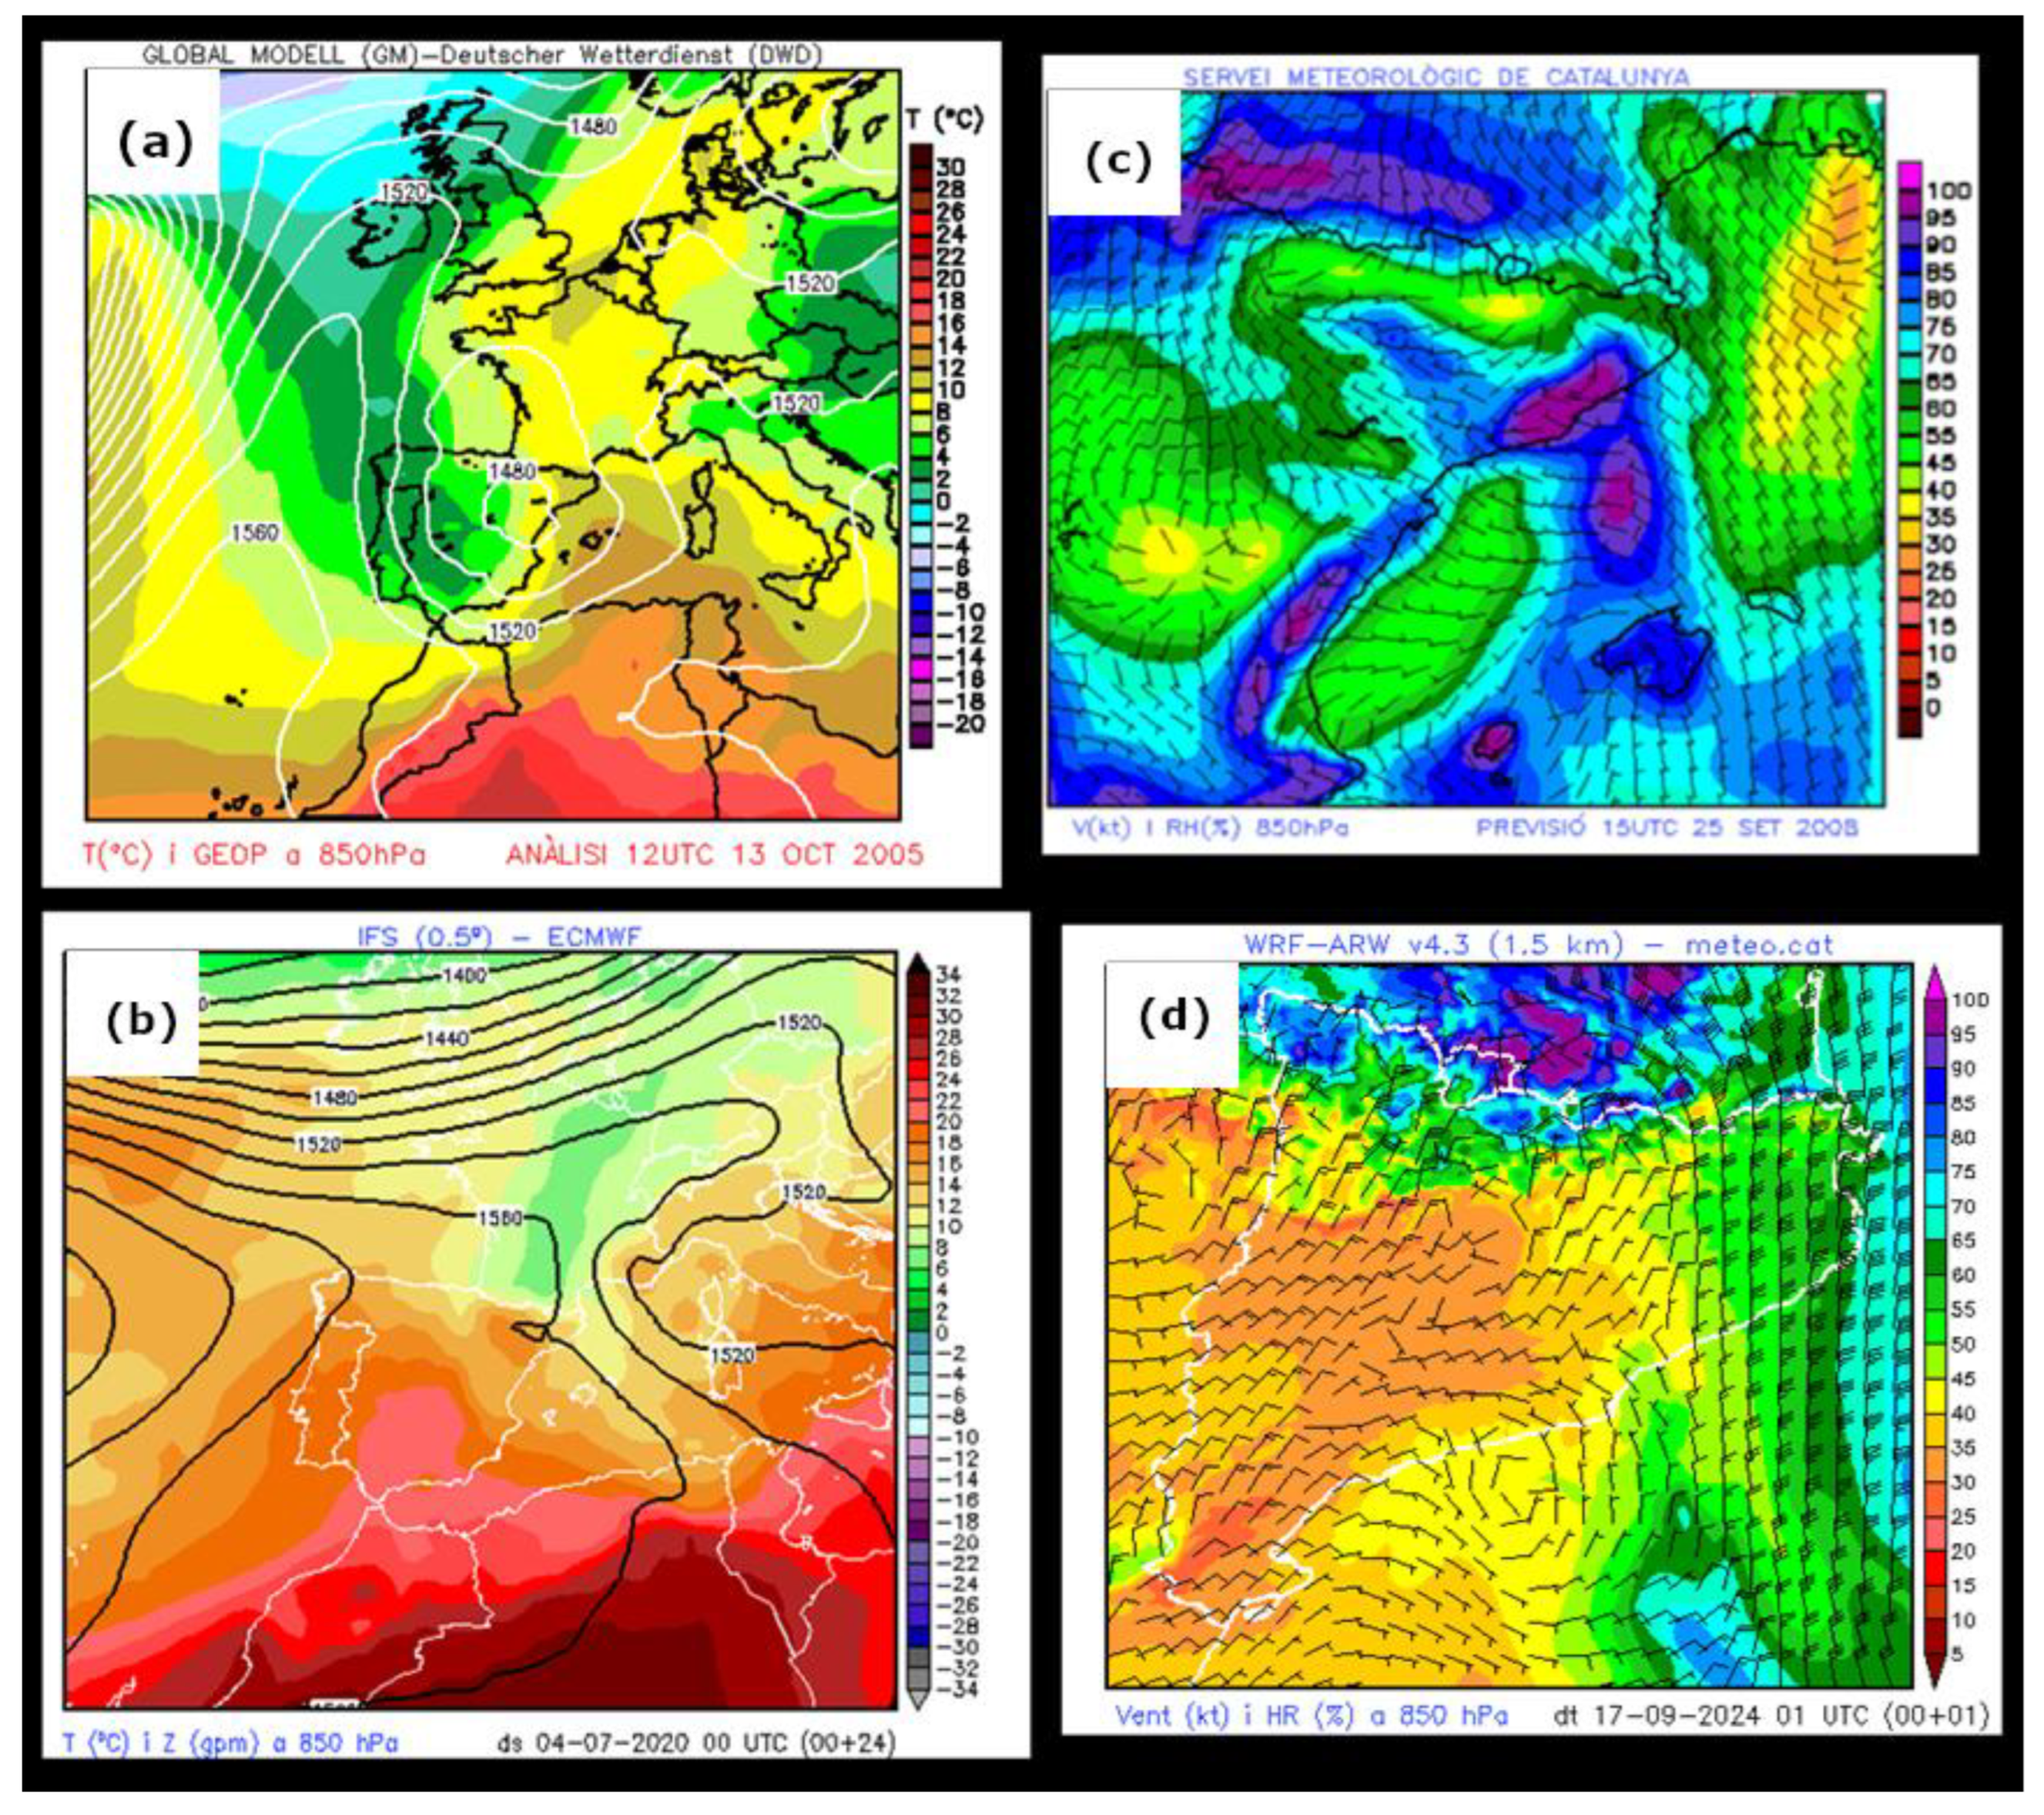
Figure 3.
Meteorological charts at 850 hPa. Maps on the left are synoptic geopotential height (gpm) and temperature (ºC), from Global Model (a) and ECWWF (b); temperatures are shaded, and geopotential height is in white or black solid lines. Maps on the right are mesoscale relative humidity (%) and wind (kt), from MM5 (c) and WRF (d); relative humidity is shaded, and wind is in wind barbs. Maps at the top were used in the early 2000s, and those at the bottom are used today.
3. Type of Events
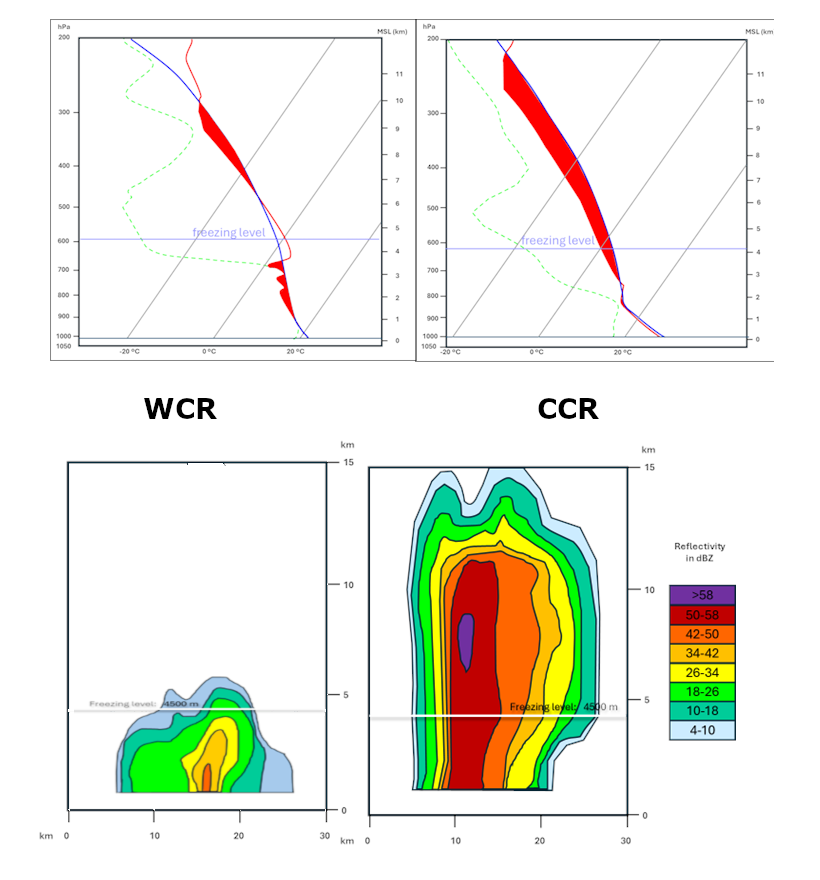
Warm Convective Rain (WCR) has opposite features to Cold Convective Rain (CCR). One discriminator between these types of events is the Rainfall-Lightning-Relationship (hereafter, RLR). The RLR [35] is the mean value of the ratio between the cumulated precipitation and the total flash counts for a group of pixels in a determined period. When RLR presents low values the lightning activity is high, therefore the cloud producing rainfall has large vertical developments that allow the charge separation and, so, the high lightning activity. This is the case with the CCR. On the other hand, high values of RLR are associated with WCR, considering that precipitation values are high while flash counts values are low or even null.
In general, the flash activity is much lower in the WCR than in CCR; furthermore, total accumulated rain values are higher in the case of CCR, but hourly rainfall values are quite similar. Then, the differences between both types of events are observed for the event duration, the flash activity and the size of the precipitation area.
Differences between cloud-producing CCR and WCR are notable. Apart from the lightning activity previously cited, the vertical development of CCR clouds is notably higher than the WCR ones. This can be clearly appreciated by satellite imagery (lower temperatures of the top clouds imply bright echoes, in contrast to the dark ones in WCR) and volumetric radar data (higher reflectivity echoes at mid and high levels in CCR, while only moderate and sometimes high reflectivity echoes are observed at low levels in WCR). These particularities of WCR are not always easily identified in real-time remote sensing tools or AWS networks, because of the complexity of microphysics. Because of this, understanding the atmospheric vertical profile is necessary for forecasting and surveillance tasks.
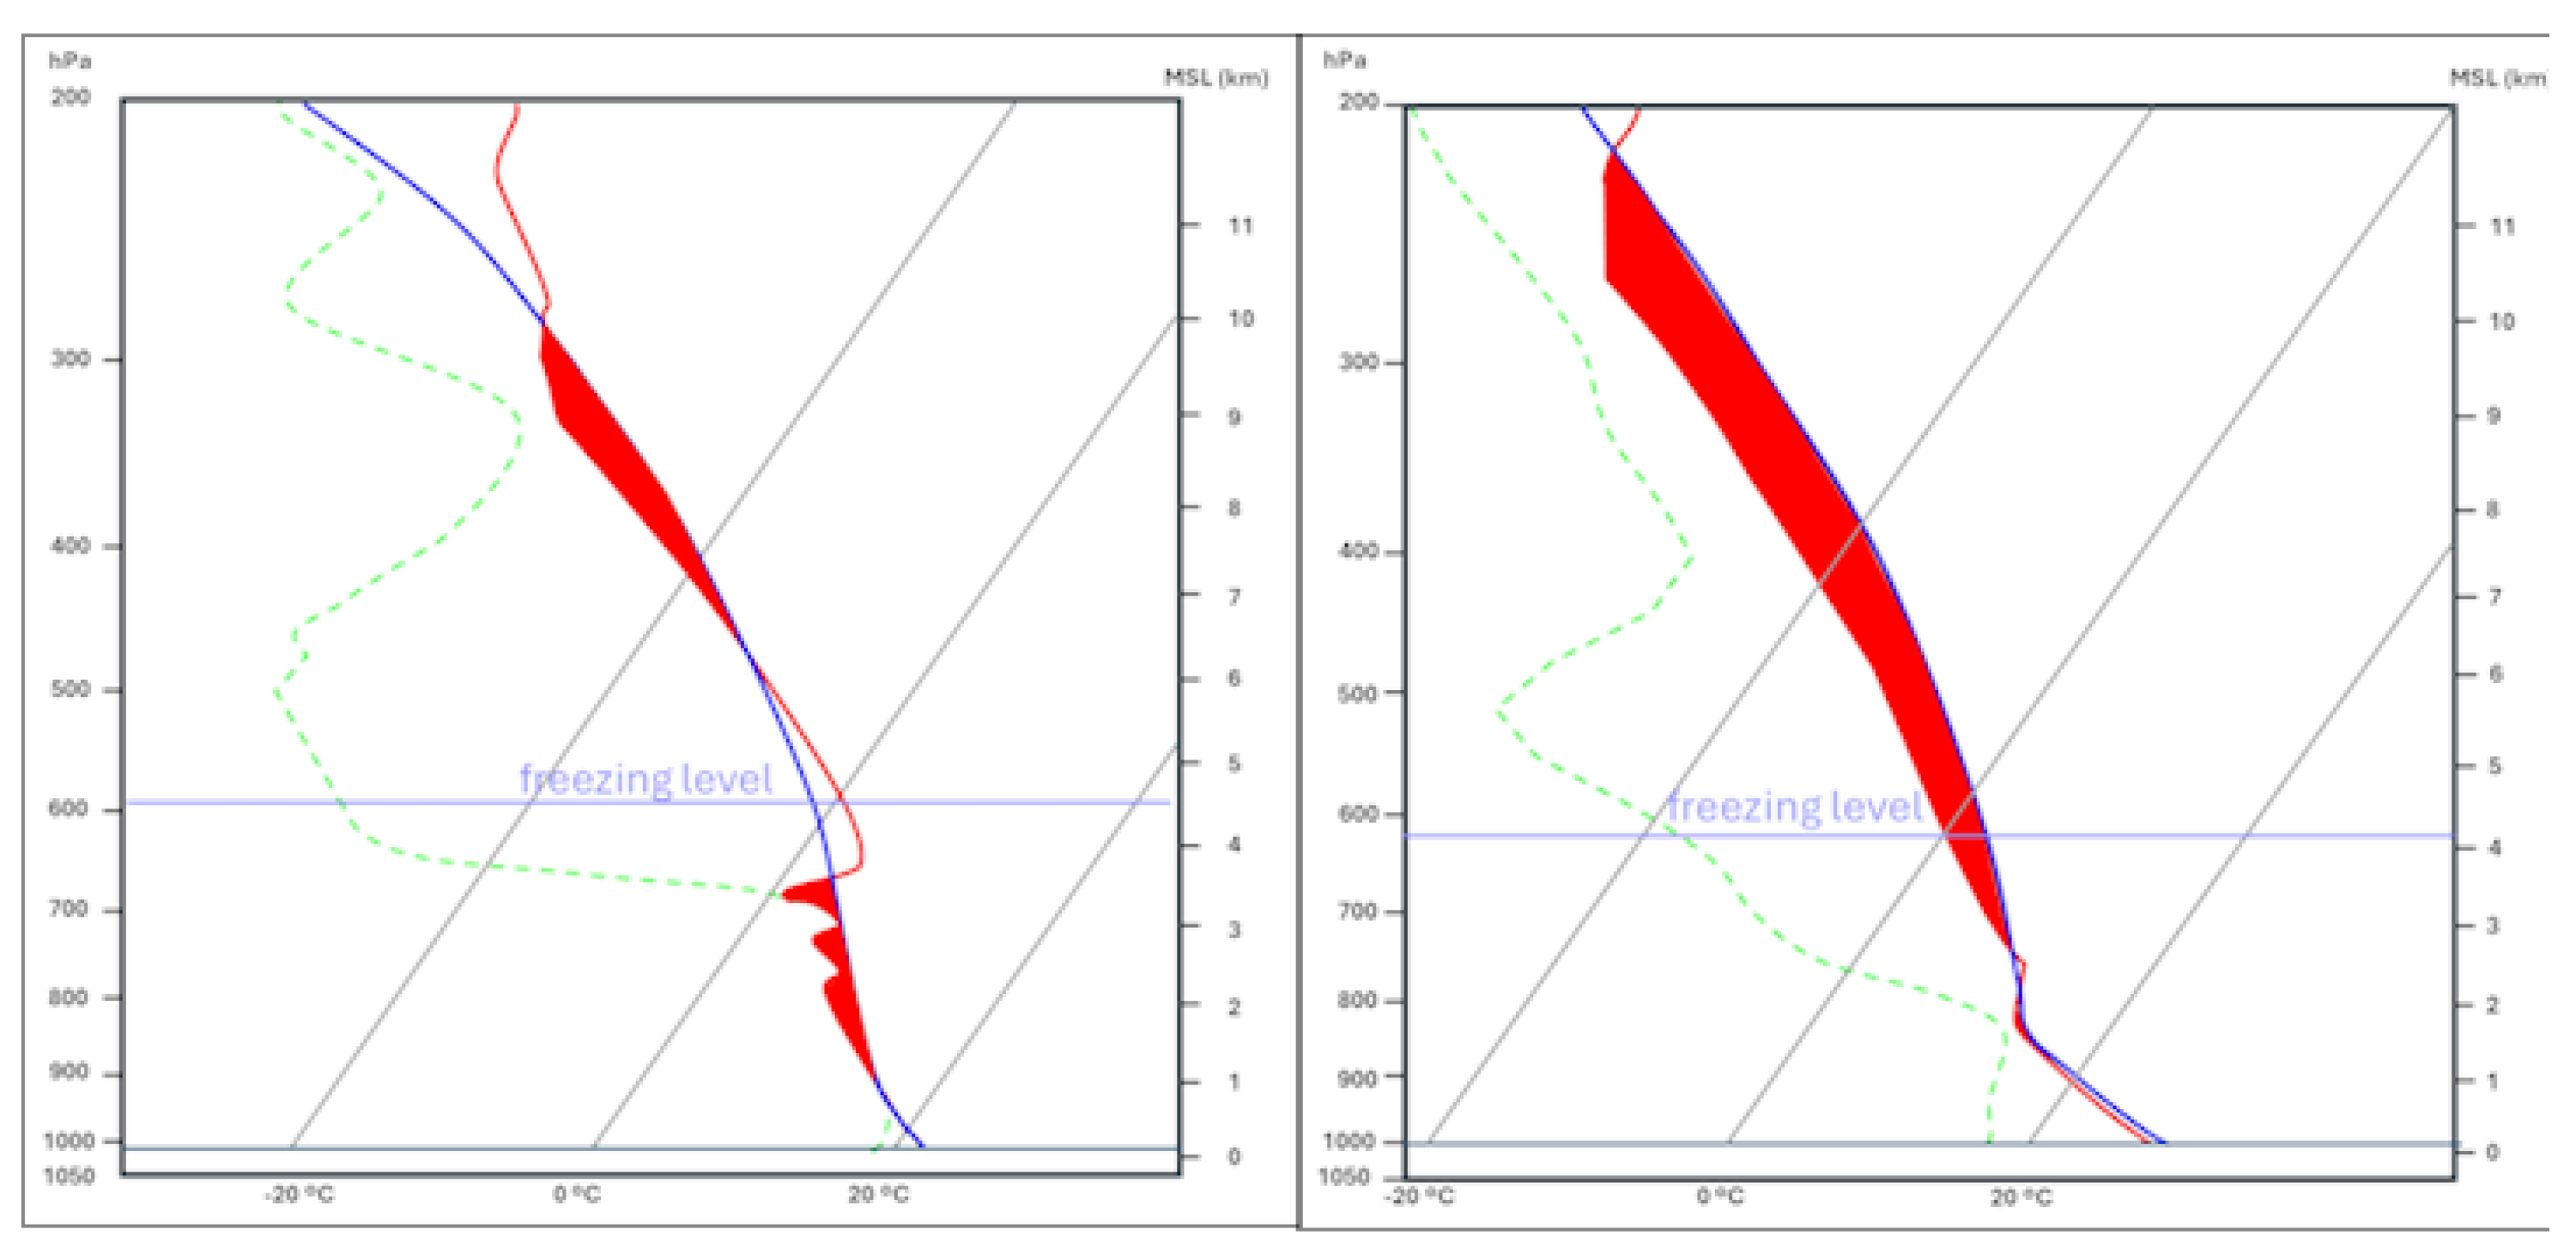
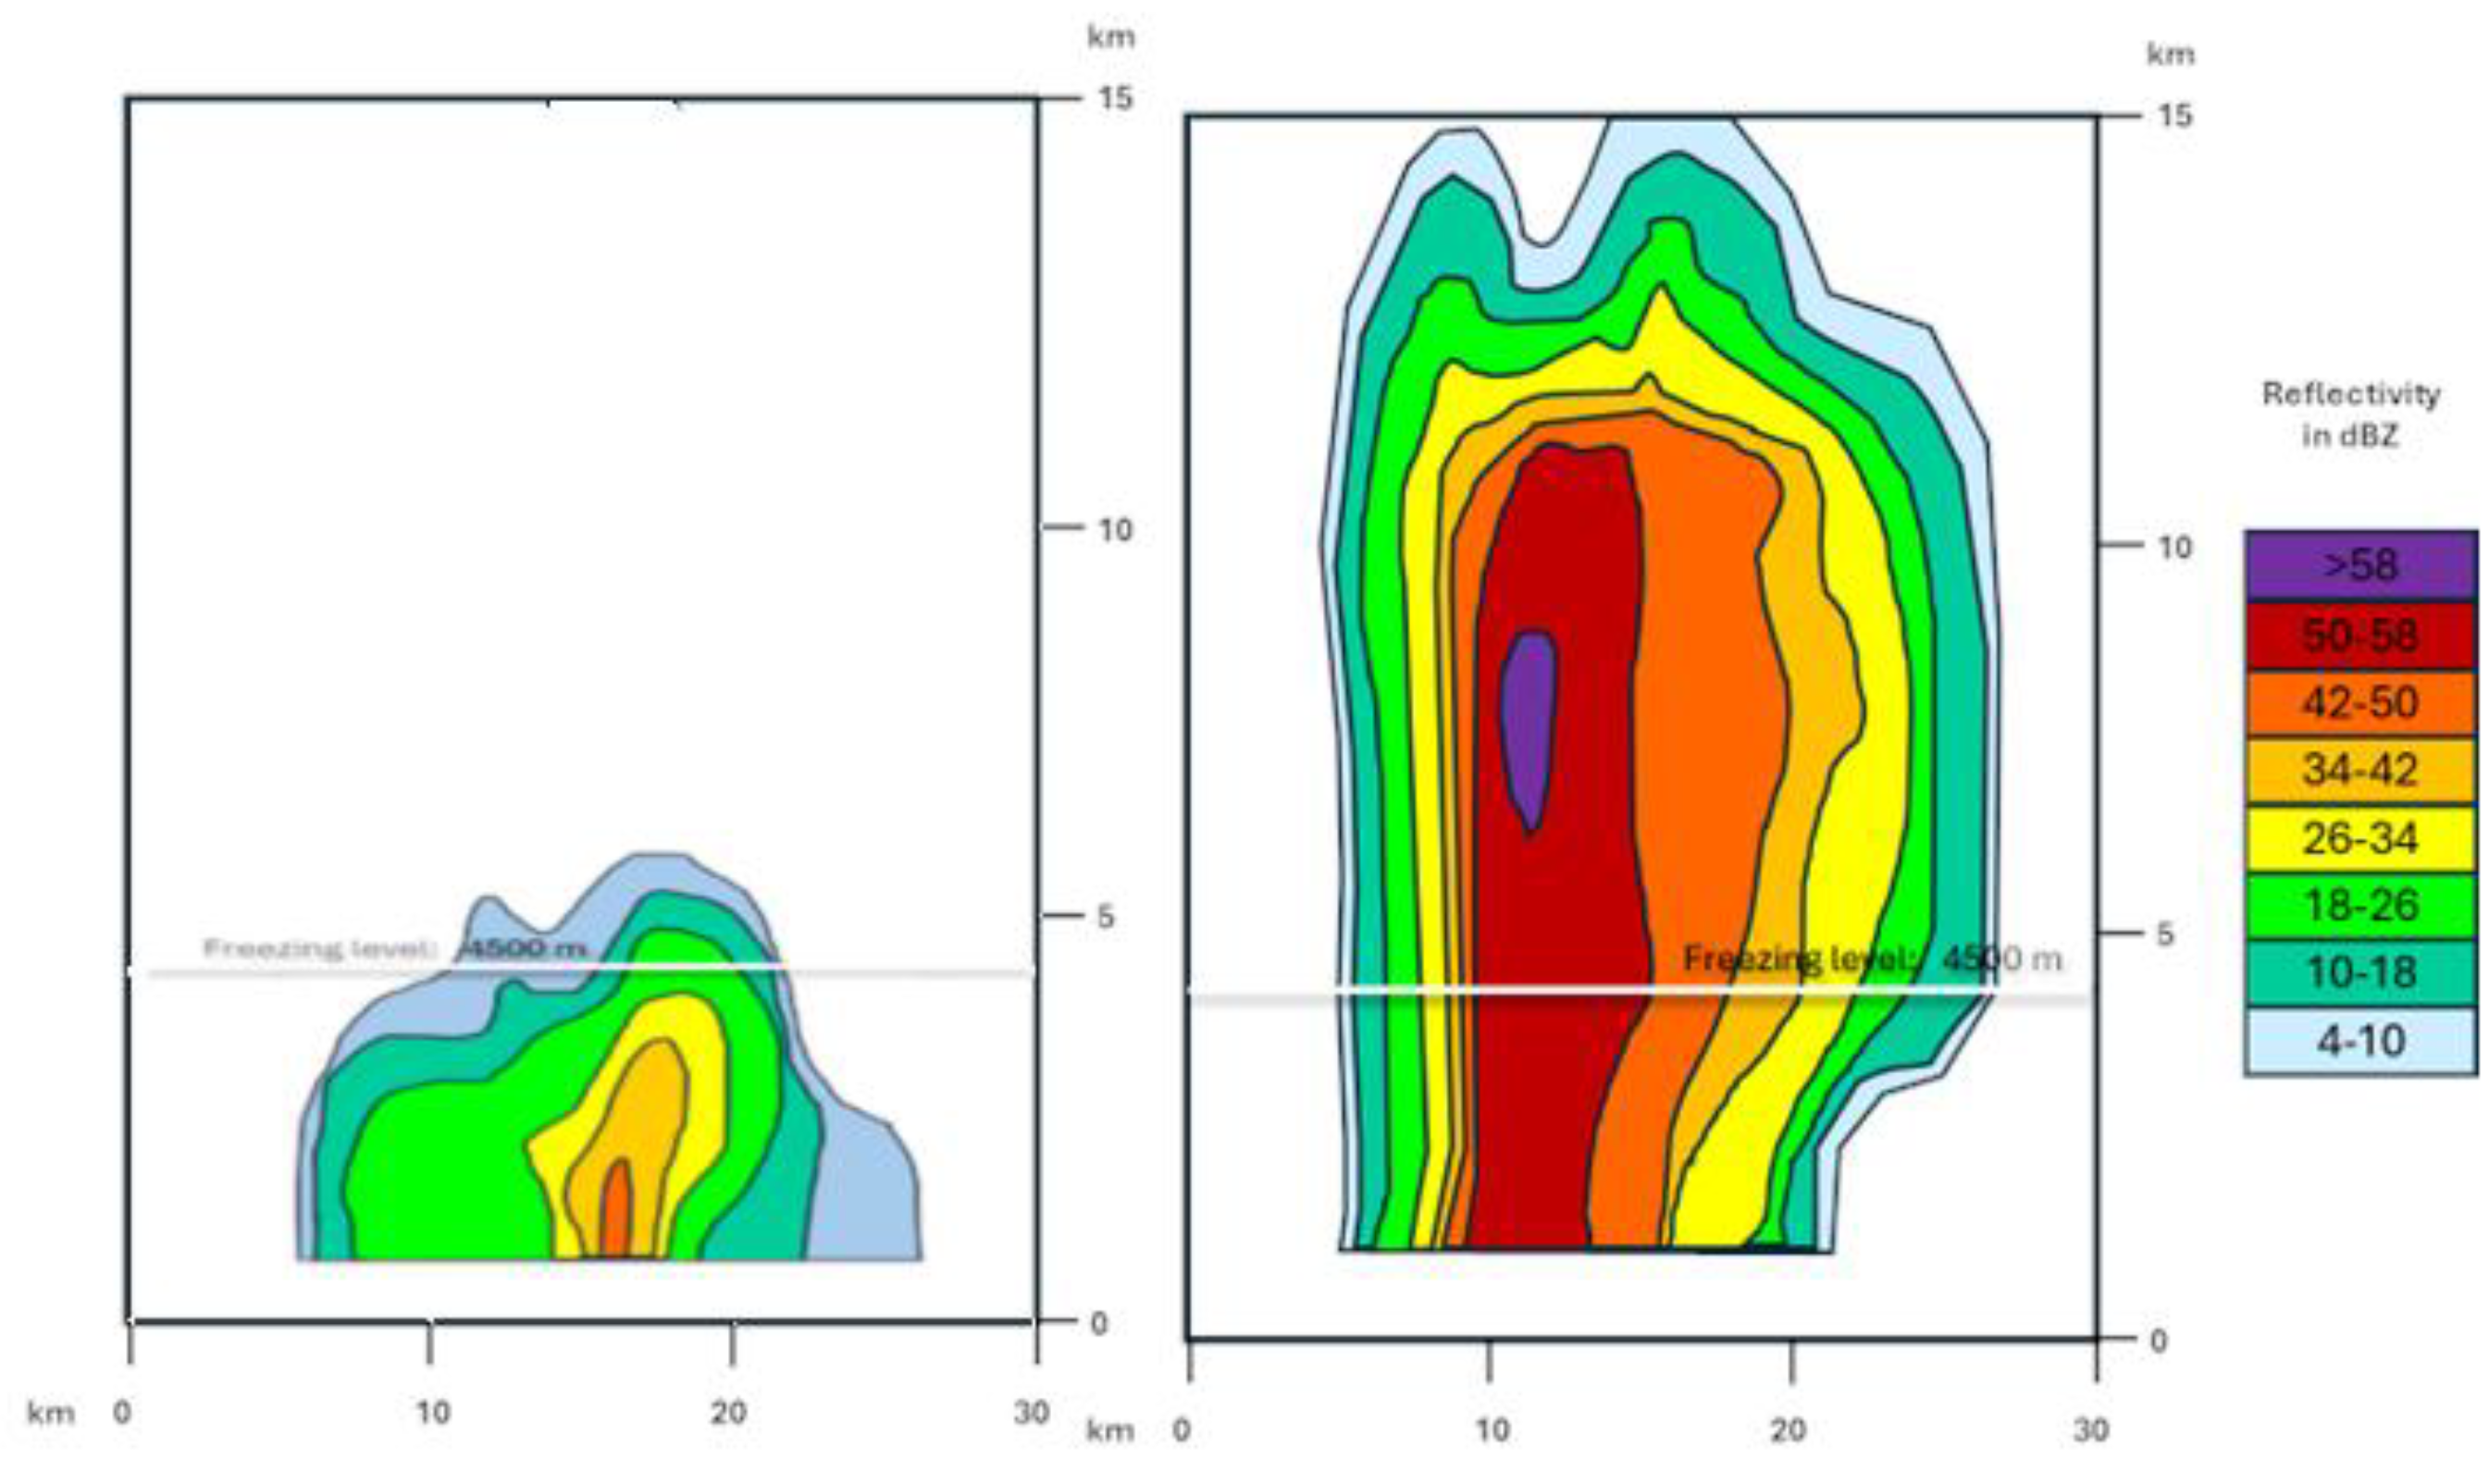
Figure 4.
Idealized Skew-T sounding for WCR (left) and CCR (right). The green dotted line is dewpoint in ºC. Red solid line is temperature in ºC, and red shaded area represents positive CAPE in J/kg. The thick horizontal light blue line indicates freezing level. The vertical scale on the left is in hPa and on the right in km; the horizontal scale is in ºC.
Figure 5.
Idealized vertical radar profile for WCR (left) and CCR (right) during warm season. Vertical and horizontal scales are in km.
Figure 5.
Idealized vertical radar profile for WCR (left) and CCR (right) during warm season. Vertical and horizontal scales are in km.
4. The Evolution of Our Knowledge and Understanding of Warm Rain Throughout the Years
The SMC has been responsible since 2001 for the meteorological warnings in Catalonia, according to the law 2001/15 of the Catalan Parliament. In this way, and to satisfy the necessities of issuing warnings and forecasting concerning all the adverse weather conditions (cold and heat temperature, sea state conditions, heavy rain and high accumulated rainfall, snow accumulation and wind gust) the EPV needs to have accurate conceptual models joined with good forecast model and observational sources.
Since the early stages of the SMC, one of the more complex issues found by the EPV was the forecast and surveillance of unusual meteorological events in Catalonia, such as near-surface snow events. Even infrequently, these events can occur more than once per year, and they produce more management difficulties than other event types in terms of civil protection. In the same way, heavy rain forecasting constituted a challenge, more because of the final consequences and damages, and not because of the low frequency. Among the different types of heavy rain events in Catalonia, one started to highlight because of the reduced dimensions and the difficulties in forecasting and warning in real-time: warm rain events.
These warm rain events had two particularities. Firstly, meteorologic models didn’t predict these events with accuracy, because the quantity of precipitation forecasted was far from reality. In the second place, warm rain producing clouds didn’t show signals of deep convection in surveillance tools. They appeared in IR satellite images as simple warm and low clouds, with no or few lightning. Meanwhile, radar data depicted moderate to high reflectivity values, but far in extension and values from deep cold convection; moreover, automatic weather stations frequently didn’t register precipitation because of the small dimension of the clouds.
On the other hand, forecast and surveillance team had a misconception of that kind of event; they monitored them as if they were harmless low cold convective clouds, instead of a shallow cumulus with like tropical rainfall rates. For all the previous reasons, most of warm rain events went unnoticed by EPV during the earlies 2000; even EPV didn’t send heavy rain warnings related to these warm rain bouts. To solve this question, EPV needed to know about these episodes to be able to firstly predict and later detect them during surveillance tasks. This was the beginning of the study of these events.
4.1. The Knowledge in 2006
The improved knowledge about warm rain episodes EPV consisted in finding out the synoptic and mesoscale framework of when they occur, studying the thermodynamic profile and comparing with related bibliography. And the results obtained were:
- -
- Synoptic framework: warm rain events usually were observed during post-frontal situations, with the subsequent decrease of the 850hPa temperature.
- -
- Mesoscale framework: after the cold front, northerly winds from the northern and southern edge of coast of Catalonia converged in central coastal area, situation known as “Estela Pirinenca” [36]. This creates a maritime advection that drags moist and warm air-mass from the Mediterranean Sea and creates a zone of thick low clouds.
- -
- Thermodynamic profile: the EL lowered and created a thermal inversion at low-mid tropospheric levels that limited cloud growth. Moreover, in the convergence zone, and underneath the inversion, a saturated or subsaturated profile was built with low cloud bases and elevated atmospheric precipitable water. On the other hand, thermodynamic environment revealed low values of instability indices in comparison to CCR. In addition, most of the CAPE and precipitable water was concentrated below the EL.
- -
- Finally, it was found that most of the cases were observed during the second half of the summer and most of autumn.
With all those learning, EPV finally reoriented their point of view about warm rain events during prediction and surveillance tasks and began to watch them as potential heavy rain episodes. It was probably the most important change.
4.2. The Current Knowledge
Since then, forecasting and surveilling tasks have been notably improved, thanks to the improvement of monitoring tools, the understanding of events, and new meteorological models. Therefore, EPV has increased the knowledge about different aspects of the phenomenon:
- -
- The lack of lightning and warm cloud tops is not associated with a low rainfall rate. It’s probably the most important change.
- -
- Sounding is the most important predictor of warm rain events because it’s who characterizes the situation better. Consequently, the synoptic framework isn’t considered as important as before
- -
- The thermodynamic profile of warm rain events has been observed nowadays all throughout the year. Consequently, the perception is that these events are more frequent now than EPV had previously thought. Furthermore, we have more capabilities to detect cases than in the past had been ignored, even though the most intense episodes spread throughout the summer and the autumn. It aligns with Rigo (2023), who affirms that about 70% of cases exceeding 10 mm of daily precipitation throughout the year with fewer than 10 cloud-to-ground flashes are considered warm rain.
- -
- -
- Satellite images have more temporal and spatial resolution, and operational real-time images. They let us determine how CCR develops and have higher cloud tops than WCR, including a better understanding of the top microphysics.
- -
- SMC has more automatic weather stations than two decades before (Figure 2, right); this is a better coverage of the territory. Moreover, there are also affectionate automatic weather station networks that add complementary and valuable information to XEMA. Otherwise, showers usually don’t rain over the rain gauges.
- -
- EPV uses more radar data nowadays for surveillance tasks, mainly vertical reflectivity profiles, and other associated products.
5. Discussion
This study analyses warm rain events, a type of precipitation that affects coastal and pre-coastal regions of Catalonia. This territory is widely inhabited and urbanized, with small and narrow stream basins that have short hydrological responses. These episodes are characterized by high efficiency precipitation that produced high rainfall rates. Furthermore, substantial amounts of precipitation can also be registered in some cases. Therefore, the combination of high population density, high rainfall rate, and flash floods turn warm rain events into a hazard for people and infrastructures.
Warm rain appears throughout the year. However, episodes with higher amounts and rainfall usually occur during the whole summer and autumn. Warm rain appears throughout the year. However, episodes with higher cumulated precipitation amounts usually occur throughout the whole summer and autumn. During this year epoch, elevated sea surface temperature (SST) constitutes a source of high atmospheric precipitation water content.
Synoptic analysis doesn’t show any dynamic forcing at medium and upper tropospheric levels. Despite this, relevant factors are at lower atmospheric levels. The shallow cumulus are triggered by local wind convergences, usually sea-land breeze or by the lifting caused by mountainous terrain. They grow in a deep layer of warm, moist air, usually saturated. But vertical cloud development is restricted by thermal inversion in the low and medium troposphere. Therefore, the convection develops until a height not far from the freezing level. This fact explains the absence of lightning, or a few flashes at least, as well as the lack of hail.
Thermodynamically, air and dew point temperatures are close in the layer below the thermal inversion, even overlapping. Furthermore, cloud base is at very low levels, while precipitable water has high values, mostly concentrated underneath the inversion. Besides, the air mass exhibits low instability indices.
From the point of view of surveillance tools, only radar images are helpful because of the relatively small dimensions of the warm rain-producing clouds. The shallow cumulus appears as a grey low cloud in IR satellite images, not white and bright as deep convection clouds. Lightning occurrence is low or non-existent. Reflectivity radar values show a small nucleus of moderate to high reflectivity, but what is characteristic of radar images is that the highest reflectivity values are always concentrated at the bottom part of the cloud. Precipitation registered from automatic weather stations hardly reflects the reality because the maximum is usually concentrated in small areas.
In comparison to other warm convective rain around the world, the episodes studied in this paper share some characteristics with them. For instance, maximum values of radar reflectivity are concentrated in the bottom part of the cloud within the warm portion of the cloud layer, what is known as Low Echo Centroid (LEC), [16,17,37]. Furthermore, all these events take place directly in a moist and usually warm maritime airmass, whether they develop over the sea, inshore, or far away from sea, in case the maritime airmass has been advected inland previously [13,16,38].
The thermal inversion present in these episodes, which limits the cloud deep, aligns with other documented warm rain events, as in Valentia (Ireland) and San Antonio (EEUU) [39], as well as in the Hawaii islands [13]. Nevertheless, not all heavy warm rain events exhibit this clear inversion, allowing clouds to develop up to the upper troposphere [16,38,40].
In the same way, Catalonia warm rain events show very low values of instability indices in comparison with other well-known warm rain events [16,17,37] or cases of CCR whose instability indices are much higher. Although the low values of instability in Catalonia warm rain cases concentrated in a thin layer of the bottom troposphere are high enough for heavy rain events.
Future research should focus on the analysis of the role of dew point temperature at low altitudes and sea surface temperature. Furthermore, the relationship between SST and temperature at 850 hPa should also be understood more deeply. Also, it is necessary to improve our knowledge of vertical profile reflectivity radar. Finally, from an operational point of view, the end goal should be to establish an automatic detection system of warm rain events that can help in surveillance tasks to anticipate high rainfall rates.
6. Conclusions
This study presents an analysis of a type of common but quite unknown heavy rain episodes in Catalonia, the Warm Rain, to identify its features. The research has focused on the characterization of warm rain events from the point of view of prediction and surveillance tasks, as well as how our knowledge and understanding of these events has improved throughout the years. With this aim, synoptic and mesoscale framework have been searched; and finally, we have analyzed the events with surveillance tools.
These episodes are characterized by high efficiency precipitation that produce high rainfall rates. They appear throughout the year, though events with higher amounts of rainfall usually occur during summer and autumn. There are no dynamic forcing features at upper tropospheric levels. Despite this, relevant factors are found at lower atmospheric levels, such as local wind convergences, a thermal inversion at low-medium troposphere, and a saturated airmass with elevated atmospheric precipitable water below this inversion. The thermodynamic profile is the most important predictor of warm rain events, although the environment reveals only low values of instability concentrated at the bottom of the profile.
Radar data is the most useful remote sensor tool for surveillance tasks. Their moderate to high reflectivity values concentrated at the bottom and warm layer of the cloud reveal the typical warm rain radar signature called LEC.
The main conclusion is that we are not watching over an inoffensive shallow cumulus when we monitor this kind of event, but a low cloud with like tropical rainfall rates. So, forecasters must change their minds; otherwise, these events will be able to deceive them again.
Author Contributions
Conceptualization, F.F. and D.B.; methodology, F.F. and D.B.; formal analysis, F.F. and D.B.; investigation, F.F. and D.B.; resources, M.A.; data curation, T.R.; writing—original draft preparation, F.F.; writing—review and editing, F.F., D.B. and T.T.; visualization, F.F. and T.R.; supervision, M.A.; All authors have read and agreed to the published version of the manuscript.
Funding
This research received no external funding
Institutional Review Board Statement
Not applicable.
Informed Consent Statement
Not applicable.
Data Availability Statement
Data files are available under requirement via e-mail, and they are only considered for research purposes.
Acknowledgments
The authors want to thank the Servei Meteorològic de Catalunya for facilitating the research, and in special to the Equip de Predicció i Vigilància for their useful comments and suggestions.
Conflicts of Interest
The authors declare no conflicts of interest.
Abbreviations
The following abbreviations are used in this manuscript:
| AMP | Amposta sensor |
| CAPE | Convective Available Potential Energy |
| CAPPI | Constant Altitude Plan Position Indicator |
| CG | Cloud-to-ground |
| CCR | Cold Convective Rainfall |
| ECMWF | European Center for Medium-Range Weather Forecasts |
| EL | Equilibrium Level |
| CG | Cloud to ground (flash) |
| EPV | Equip de Predicció i Vigilància (in Catalan, Forecasting and Surveillance Team) |
| GFS | Global Forecast System |
| GME | Global Model |
| GSM | Global System for Mobile communications |
| IC | Intra-cloud (lightning) |
| IR | Infrared |
| LEC | Low Echo Centroid |
| LF | Low Frequency |
| LMI | La Miranda radar |
| MM5 | Fifth-Generation Penn State/NCAR Mesoscale Model |
| MSG | Meteosat Second Generation |
| NWP | Numerical Weather Prediction Models |
| PPI | Plan Position Indicator |
| PWM | Precipitable Water Mass content |
| RLR | Rainfall-Lightning-Relationship |
| SMC | Servei Meteorològic de Catalunya (in Catalan, Meteorological Service of Catalonia) |
| SST | Sea Surface Temperature |
| VHF | Very High Frequency |
| WCR | Warm Convective Rain |
| WMO | World Meteorological Organization |
| WR | Warm Rain |
| WRF | Weather Research and Forecasting |
| XDDE | Xarxa De Descàrregues Elèctriques (in Catalan, Lightning Detection Network |
| XEMA | Xarxa d’Estacions Meteorològiques Automàtiques (in Catalan, Automatic Weather Stations Network) |
| XRAD | Xarxa de Radars Meteorològics (in Catalan, SMC Radar Network) |
References
- Llasat, M. C., Marcos-Matamoros, R., Pascual, R., Rigo, T., Insúa-Costa, D., & Crespo-Otero, A. (2025). Western Mediterranean flash floods through the Lens of Alcanar (NE Iberian Peninsula): Meteorological drivers and trends. Atmospheric Research, 108266. [CrossRef]
- del Moral, A., del Carmen Llasat, M., & Rigo, T. (2020). Connecting flash flood events with radar-derived convective storm characteristics on the northwestern Mediterranean coast: Knowing the present for better future scenarios adaptation. Atmospheric Research, 238, 104863. [CrossRef]
- Miglietta, M. M., & Regano, A. (2008). An observational and numerical study of a flash-flood event over south-eastern Italy. Natural Hazards and Earth System Sciences, 8(6), 1417-1430. [CrossRef]
- Riesco Martín, J., & Alcover Ronda, V. (2001). Algunas consideraciones sobre lluvias intensas en el Mediterráneo Occidental: Revisión de un episodio en la Comunidad Valenciana. In Spanish, Technical Note of the Spanish Institute of Meteorology (INM).
- Nuijens, L., Stevens, B., & Siebesma, A. P. (2009). The environment of precipitating shallow cumulus convection. Journal of the Atmospheric Sciences, 66(7), 1962-1979. [CrossRef]
- Ballart, D., Figuerola, F., Aran, M., & Rigo, T. (2009, September). Analysis of warm convective rain events in Catalonia. Proceedings of the 11th Plinius Conference on Mediterranean Storms.
- Fullerton, C. M., & Wilson, S. K. (1974). Some characteristics of Hawaiian high-intensity rainfall. Technical note, Water Resources Research Center, University of Hawaii.
- Rigo, T. (2023). Warm Rain Analysis from Remote Sensing Data in the Metropolitan Area of Barcelona for 2015–2022. Hydrology, 10(7), 142. [CrossRef]
- Argence, S., Lambert, D., Richard, E., Chaboureau, J. P., & Söhne, N. (2008). Impact of initial condition uncertainties on the predictability of heavy rainfall in the Mediterranean: A case study. Quarterly Journal of the Royal Meteorological Society, 134(636), 1775-1788. [CrossRef]
- Zhang, F., Odins, A. M., & Nielsen-Gammon, J. W. (2006). Mesoscale predictability of an extreme warm-season precipitation event. Weather and forecasting, 21(2), 149-166. [CrossRef]
- Lau, K. M., & Wu, H. T. (2003). Warm rain processes over tropical oceans and climate implications. Geophysical Research Letters, 30(24). [CrossRef]
- Davis, R. S. (2001). Flash flood forecast and detection methods. Severe convective storms, 481-525. Boston, MA: American Meteorological Society.
- Takahashi, T. (1977). A study of Hawaiian warm rain showers based on aircraft observation. Journal of Atmospheric Sciences, 34(11), 1773-1790. [CrossRef]
- Short, D. A., and K. Nakamura, 2000: TRMM radar observations of shallow precipitation over the tropical oceans. J. Climate, 13, 4107–4124. [CrossRef]
- Liu, C., & Zipser, E. J. (2009). “Warm rain” in the tropics: Seasonal and regional distributions based on 9 yr of TRMM data. Journal of Climate, 22(3), 767-779. [CrossRef]
- Petersen, W. A., Carey, L. D., Rutledge, S. A., Knievel, J. C., Doesken, N. J., Johnson, R. H., McKee, T.B., Haar, T.V. & Weaver, J. F. (1999). Mesoscale and radar observations of the Fort Collins flash flood of 28 July 1997. Bulletin of the American Meteorological Society, 80(2), 191-216. [CrossRef]
- Davis, R. S. (2004). The impact of tropical rainfall rates on flash flood detection. In Preprints, 22nd Conf. on Severe Local Storms, Hyannis, MA, Amer. Meteor. Soc. B, 11.
- Doswell III, C. A., Brooks, H. E., & Maddox, R. A. (1996). Flash flood forecasting: An ingredients-based methodology. Weather and forecasting, 11(4), 560-581.
- IDESCAT, Institut d’Estadística de Catalunya (2024). Nombre de municipis i població. Comarques i Aran, In Catalan.
- Peinó, E., Bech, J., & Udina, M. (2022). Performance assessment of GPM IMERG products at different time resolutions, climatic areas and topographic conditions in Catalonia. Remote Sensing, 14(20), 5085. [CrossRef]
- Garcia-Benadí, A., Bech, J., Gonzalez, S., Udina, M., & Codina, B. (2021). A new methodology to characterise the radar bright band using doppler spectral moments from vertically pointing radar observations. Remote Sensing, 13(21), 4323. [CrossRef]
- Seeley, J. T., & Romps, D. M. (2015). Why does tropical convective available potential energy (CAPE) increase with warming?. Geophysical Research Letters, 42(23), 10-429. [CrossRef]
- Raymond, D. J. (2000). Thermodynamic control of tropical rainfall. Quarterly Journal of the Royal Meteorological Society, 126(564), 889-898.
- del Moral, A., Weckwerth, T. M., Rigo, T., Bell, M. M., & Llasat, M. C. (2020). C-Band dual-Doppler retrievals in complex terrain: improving the knowledge of severe storm dynamics in Catalonia. Remote Sensing, 12(18), 2930. [CrossRef]
- Trapero, L., Bech, J., Rigo, T., Pineda, N., & Forcadell, D. (2009). Uncertainty of precipitation estimates in convective events by the Meteorological Service of Catalonia radar network. Atmospheric Research, 93(1-3), 408-418. [CrossRef]
- Pineda, N., Peña, J. C., Soler, X., Aran, M., & Pérez-Zanón, N. (2022). Synoptic weather patterns conducive to lightning-ignited wildfires in Catalonia. Advances in Science and Research, 19, 39-49. [CrossRef]
- Schmetz, J., Pili, P., Tjemkes, S., Just, D., Kerkmann, J., Rota, S., & Ratier, A. (2002). An introduction to Meteosat second generation (MSG). Bulletin of the American Meteorological Society, 83(7), 977-992.
- Frank, H. P., & Majewski, D. (2003). Early warning capabilities of the global model GME of DWD—a case study. Atmospheric research, 67, 215-229. [CrossRef]
- van Oldenborgh, Jan, G., Balmaseda, M. A., Ferranti, L., Stockdale, T. N., & Anderson, D. L. (2005). Evaluation of atmospheric fields from the ECMWF seasonal forecasts over a 15-year period. Journal of Climate, 18(16), 3250-3269. [CrossRef]
- Martín, A., Romero, R., De Luque, A., Alonso, S., Rigo, T., & Llasat, M. C. (2007). Sensitivities of a flash flood event over Catalonia: a numerical analysis. Monthly weather review, 135(2), 651-669. [CrossRef]
- Halperin, D. J., Penny, A. B., & Hart, R. E. (2020). A comparison of tropical cyclone genesis forecast verification from three Global Forecast System (GFS) operational configurations. Weather and Forecasting, 35(5), 1801-1815. [CrossRef]
- Bauer, P., Sandu, I., Magnusson, L., Mladek, R., & Fuentes, M. (2020). ECMWF global coupled atmosphere, ocean and sea-ice dataset for the Year of Polar Prediction 2017–2020. Scientific Data, 7(1), 427. [CrossRef]
- Busquets, E., Udina, M., Bech, J., & Mercader, J. (2025). Sea surface temperature updating impacts on WRF simulations during a heatwave period. Atmospheric Research, 108230. [CrossRef]
- Cortés-Hernández, V. E., Caillaud, C., Bellon, G., Brisson, E., Alias, A., & Lucas-Picher, P. (2024). Evaluation of the convection permitting regional climate model CNRM-AROME on the orographically complex island of Corsica. Climate Dynamics, 62(6), 4673-4696. [CrossRef]
- Pineda, N., & Montanyà, J. (2009). Lightning detection in Spain: the particular case of Catalonia. Lightning: Principles, Instruments and Applications: Review of Modern Lightning Research, 161-185.
- Vilaclara, E. (2002). Situacions del nord-oest sobre Catalunya: l'estela pirinenca. Tethys: revista meteorología y climatología mediterránea, (2), 7.
- Caracena, F., Maddox, R. A., Hoxit, L. R., & Chappell, C. F. (1979). Mesoanalysis of the Big Thompson storm. Monthly Weather Review, 107(1), 1-17. [CrossRef]
- Pontrelli, M. D., Bryan, G., & Fritsch, J. M. (1999). The Madison County, Virginia, flash flood of 27 June 1995. Weather and forecasting, 14(3), 384-404. [CrossRef]
- Ohtake, T. (1963). Hemispheric investigation of warm rain by radiosonde data. Journal of Applied Meteorology (1962-1982), 594-607. [CrossRef]
- Vitale, J. D., & Ryan, T. (2013). Operational Recognition of High Precipitation Efficiency and Low-Echo-Centroid Convection. Journal of Operational Meteorology, 1(12). [CrossRef]
Figure 1.
Top: Map of the western Mediterranean Sea basin. The red rectangle indicates the area of interest (zoomed on the bottom panel). Bottom: Political and orographic map of Catalonia. The red dots show the location of the main cities in the region more prone to be affected by warm rain events. This region is indicated by the cyan shaded polygon.
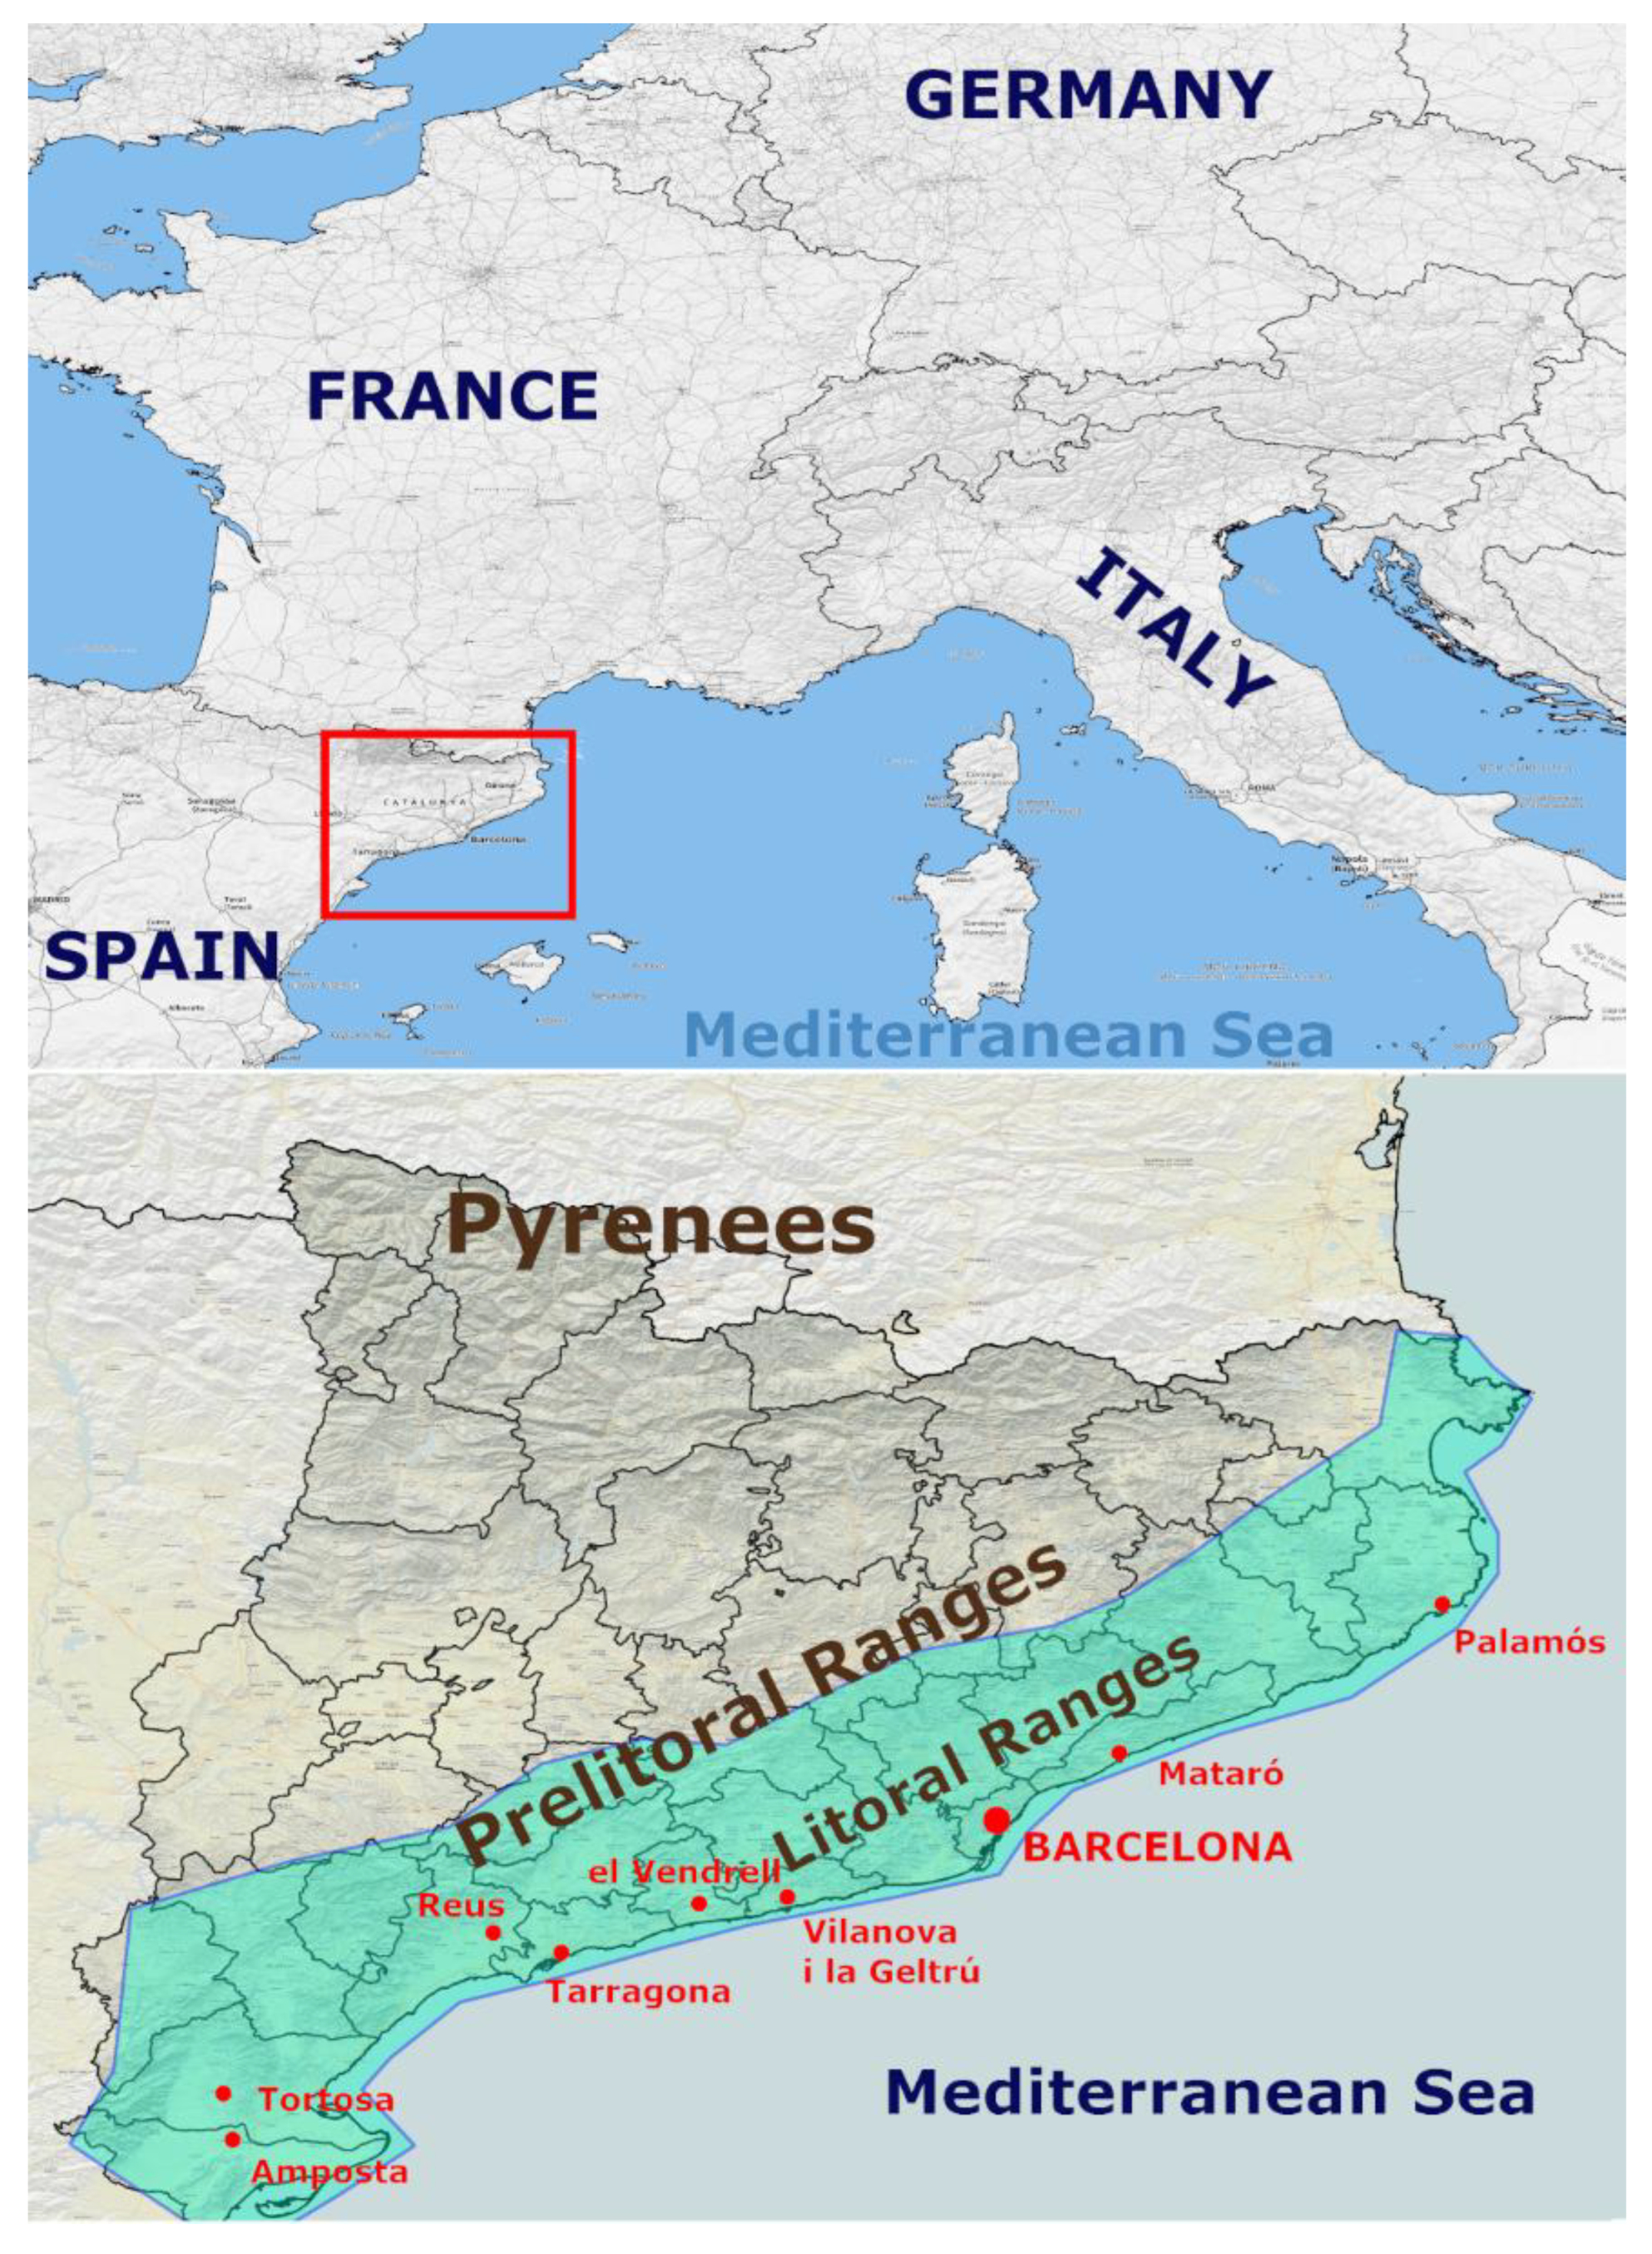
Figure 2.
Left: Location of the sensors of the main SMC remote sensing networks used in the present study: Radar Network (XRAD), in blue, and the Lightning Detection Network (XDDE), in red. Right: Position of the Automatic Weather Stations network (XEMA) in 2006 (orange circles) and added since then, updated to 2025 (purple circles).
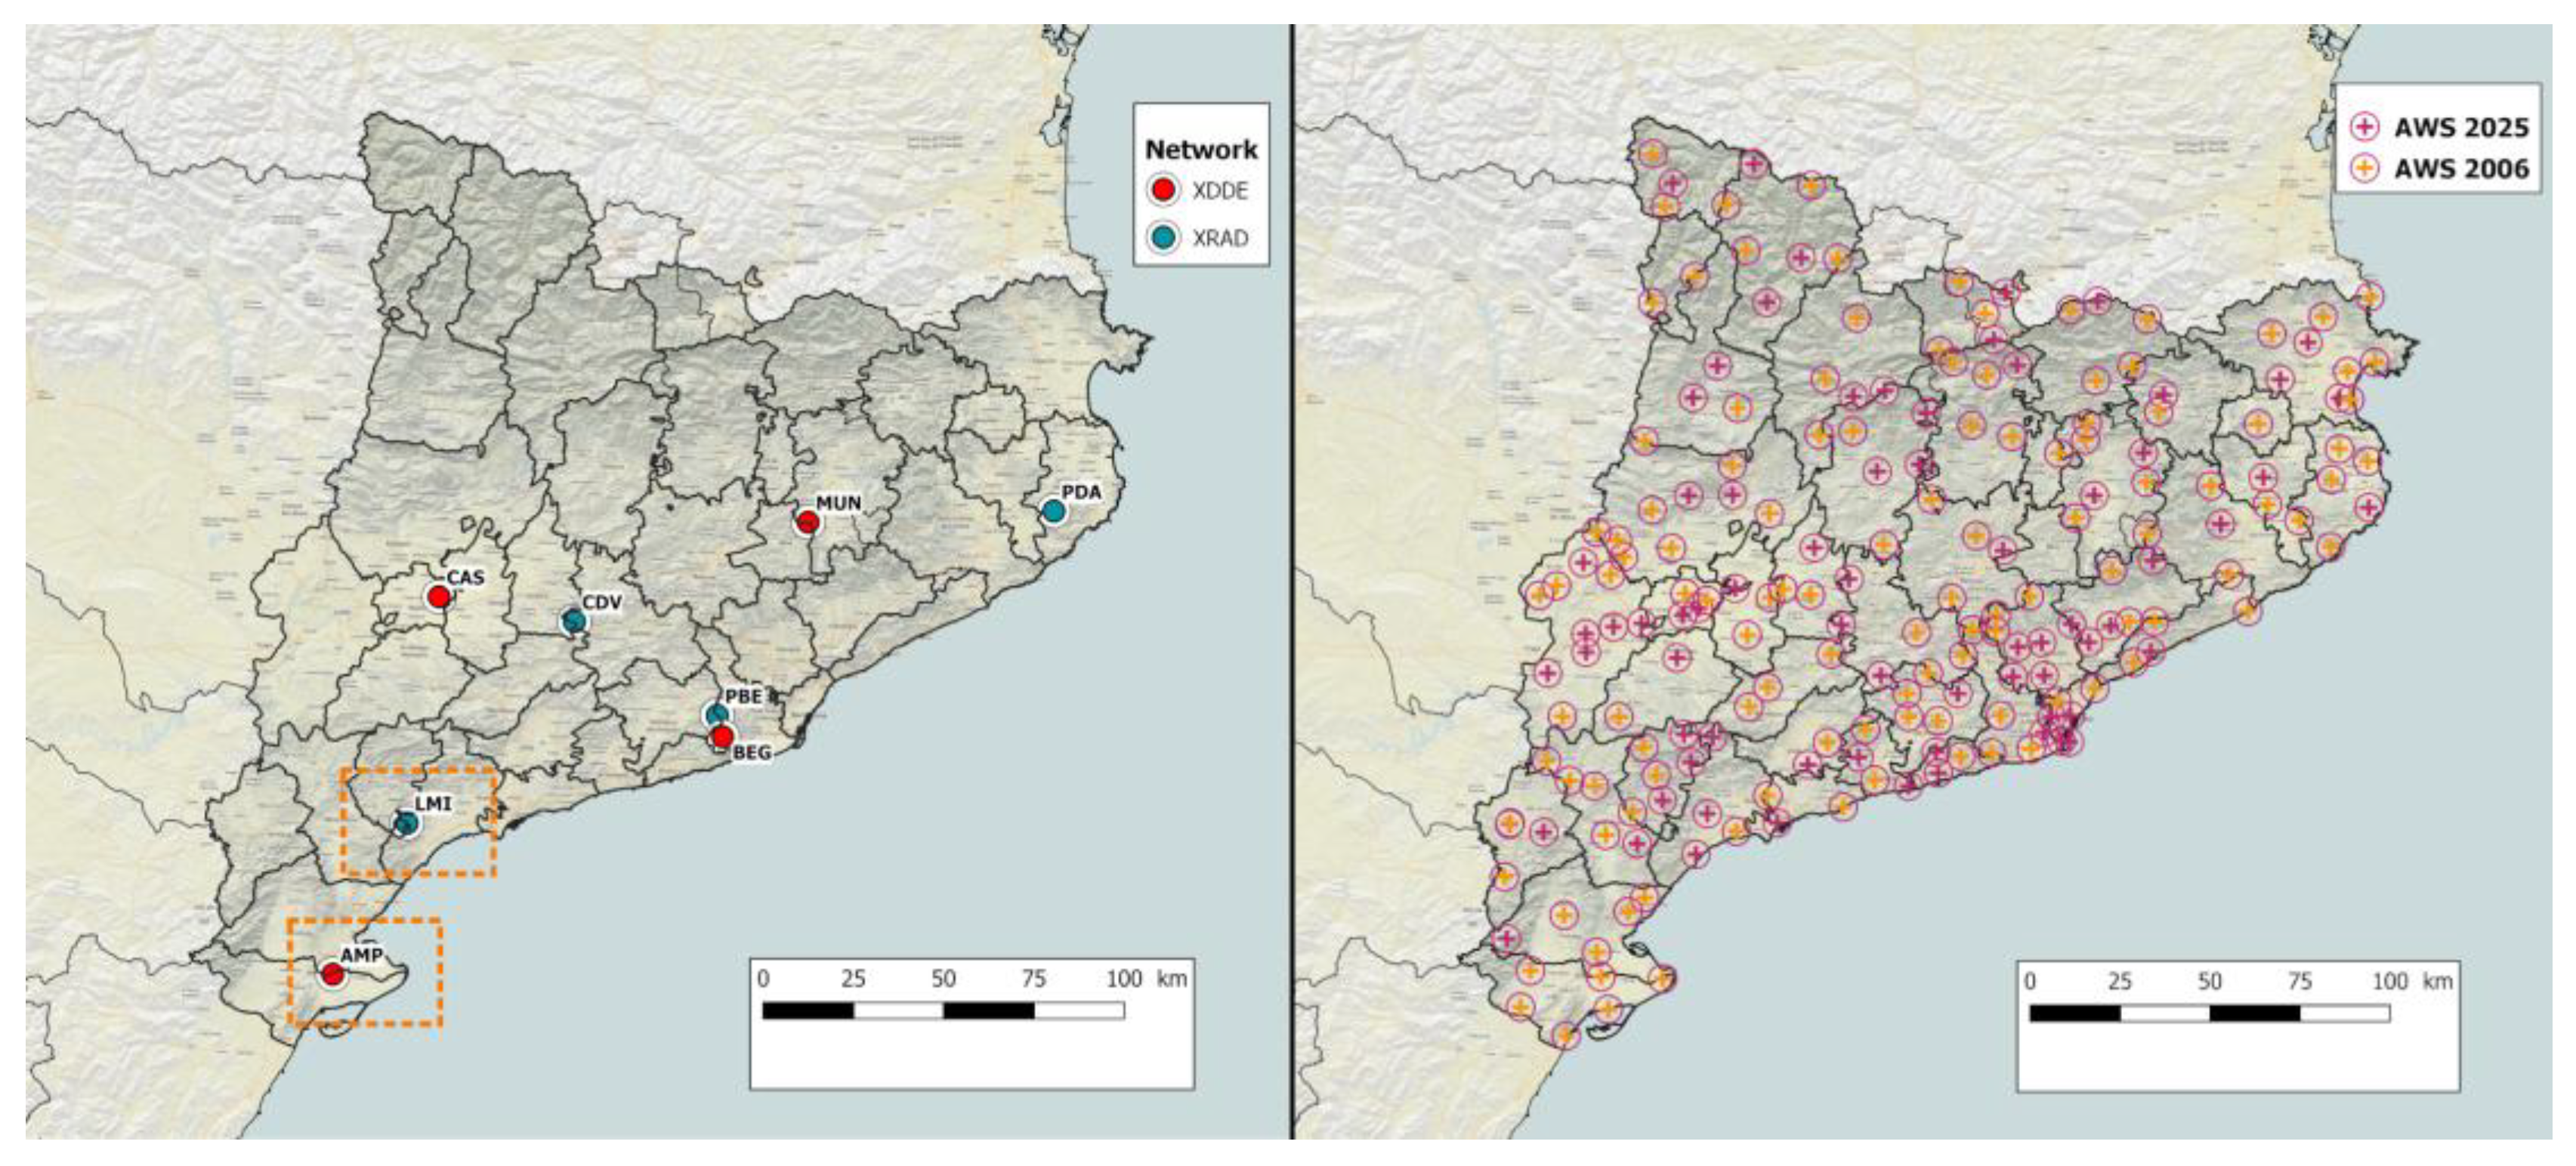

Table 1.
Scheme of the principal synoptic and mesoscale models used in the SMC in 2006 (Past) and in 2025 (Current).
Table 1.
Scheme of the principal synoptic and mesoscale models used in the SMC in 2006 (Past) and in 2025 (Current).
| MODEL | SCALE | USE | CONFIGURATION |
| GME (Global Model) | Synoptic | Past | 55 km grid, 6 hours step, 31 levels, 174 hours horizon |
| ECMWF (European Center Median Weather Forecasting) | Synoptic | Past | 2.5º grid, 6 hours, 60 levels, 144 hours horizon |
| MM5 | Mesoscale | Past | 4/12/36 km grid, 3 hours, 31 levels, 48 hours horizon |
| ECMWF (European Center Median Weather Forecasting) | Synoptic | Current | 0.25º grid, 3 hours, 60 levels, 144 hours horizon |
| GFS (Global Forecast System) |
Synoptic | Current | 0.25º grid, 3 hours, 60 levels, 144 hours horizon |
| WRF | Mesoscale | Current | 3/1.5 km grid, 3/1 hour, 31 levels, 72/48 hours horizon |
| Arome | Mesoscale | Current | 1.1 km grid, 1 hour, 31 levels, 48 hours horizon |
Disclaimer/Publisher’s Note: The statements, opinions and data contained in all publications are solely those of the individual author(s) and contributor(s) and not of MDPI and/or the editor(s). MDPI and/or the editor(s) disclaim responsibility for any injury to people or property resulting from any ideas, methods, instructions or products referred to in the content. |
© 2025 by the authors. Licensee MDPI, Basel, Switzerland. This article is an open access article distributed under the terms and conditions of the Creative Commons Attribution (CC BY) license (http://creativecommons.org/licenses/by/4.0/).
Copyright: This open access article is published under a Creative Commons CC BY 4.0 license, which permit the free download, distribution, and reuse, provided that the author and preprint are cited in any reuse.


