Submitted:
09 September 2024
Posted:
11 September 2024
You are already at the latest version
Abstract
Due to model errors caused by local variations in cloud precipitation processes, there are still significant uncertainties in current predictions and simulations of short-duration heavy rainfall. To tackle this problem, the effects of warming on cloud-precipitation efficiency was analyzed utilizing a weather research and forecasting (WRF) model. The analysis focused on a rainstorm corridor event that took place in July 2020. Rainstorm events from July 4 to 6 formed a narrow rain belt with precipitation exceeded 300 mm in the middle and lower reaches of the Yangtze River. Temperature sensitivity tests revealed that warming intensified the potential temperature gradient between north and south, leading to stronger upward motion on the front. It also strengthened the southwest wind, which also resulting in more pronounced precipitation peaks. Warming led to a stronger accumulation and release of convective instability energy. Convective available potential energy (CAPE) and convective inhibition (CIN) increased correspondingly with the temperature. The precipitation efficiency increased sequentially with 2℃ warming to 27.4%, 31.2% and 33.1%. Warming can affect the cloud precipitation efficiency by both promoting and suppressing convective activity, which may be one of the reasons for the enhancement of extreme precipitation under global warming. The diagnostic relationship between upward moisture flux and lower atmospheric stability during precipitation evolution was also revealed.
Keywords:
Rainstorm corridor
; Precipitation efficiency
; Extreme precipitation
; Convective instability energy
; WRF
1. Introduction
The abundance of evidence from observations and model analyses has underscored the dramatic shifts occurring in the components of the water cycle due to global warming, as documented by an array of studies [1,2,3,4]. Particularly noteworthy is the water cycle’s most dynamic segment—cloud and precipitation processes—whose significant alterations exert direct influences on terrestrial ecosystems and have profound implications for human societies. Thus, understanding the evolutionary dynamics of cloud-precipitation processes is crucial for enhancing climate prediction models [5,6,7]. While the global mean precipitation trend is slight [8,9], regional disparities are pronounced, and there is a notable surge in extreme precipitation events [10,11,12]. This trend exacerbates the existing disparities in precipitation distribution, with significant consequences for the human environment and the sustainability of societal development [13,14,15]. Given the high degree of uncertainty in current models and operational forecasts for local precipitation extremes, it is imperative to enhance our comprehension of the mechanisms by which they respond to climatic warming.
The precipitation efficiency in cloud systems serves as a crucial gauge for exploring the distribution and metamorphosis of atmospheric cloud water resources. Typically, precipitation efficiency is defined as the proportion of precipitation to the volume of condensed water that ascends adiabatically within clouds in a specific region [16,17]. The computation of this cloud-to-precipitation conversion efficiency forms an essential prerequisite for the judicious enactment of artificial weather alteration, along with storm warning and disaster prevention and mitigation [18,19]. The assessment of cloud water resources and their transformation via precipitation remains relatively underexplored [20,21]. In a notable study, Liu et al. [22] utilized the ratio of precipitation to cloud water path to represent cloud precipitation efficiency. Their findings highlighted an increase in the cloud water content in the arid and semi-arid regions of East Asia, counterbalanced by a decrease in cloud precipitation efficiency within recent decades. The influence of global warming on the capacity for cloud-precipitation conversion is increasingly the focus of contemporary research. However, consensus remains elusive regarding the response of cloud precipitation efficiency to climatic shifts. Lutsko and Cronin [23] and Narsey et al. [24] evaluated the impact of warming on precipitation efficiency. while the former implied a statistical increase in precipitation efficiency with warming, the latter identified a decline in precipitation efficiency with warming in the context of small-scale convection.
Precipitation is fundamentally driven by cloud microphysical processes, while its occurrence is also shaped by the dynamic and thermal processes within the surrounding atmosphere [25,26]. Warming-induced changes in convective activity notably influence both the mechanism and effectiveness of precipitation. Studies through model simulations reveal that while convective activity tends to rise with increasing temperatures, leading to enhanced precipitation, there is a threshold beyond which further intensification of convection does not correspond to increased precipitation intensity [27]. The dynamics of convective activity are governed by the interplay of convective available potential energy (CAPE) and convective inhibitory energy (CIN), each exerting both positive and negative influences. Although CAPE escalates with warming, boosting convective occurrences, this does not inherently translate to more intense precipitation. The intricate balance of convection’s facilitating and inhibitory roles plays a pivotal part in the fluctuations of precipitation and its effectiveness, elucidating how precipitation processes react to warming and offering crucial insights into the emergence of extreme precipitation events. Recent trends of stronger precipitation events alongside a decline in weaker ones, in the context of rising convective intensity, hint at an amplifying suppressive effect of CIN in a warming climate.
The arrival of the annual Meiyu season in southern China is often accompanied by days of heavy rain, like the “rainstorm corridor” events previously observed in the plains of the United States [28]. These events are characterized by mesoscale convective systems that repeatedly follow the same west-to-east path over several days, generating heavy to torrential rains and forming narrow, corridor-like rain bands. These rain belts can extend over 1000 km from east to west, while being less than 300 km wide from north to south. Interestingly, these narrow rain belts can concentrate a significant amount of precipitation, while the areas to their north and south receive almost no rainfall. This phenomenon has been termed a “rainstorm corridor” [29]. Each year during the rainy season, several of these heavy rainfall corridor events occur in South China and the Yangtze River basin, resulting in large, concentrated amounts of precipitation that can lead to severe flooding. Historical events demonstrate the impact of these rainstorm corridors. For instance, in June and July of 1998, southern China experienced a rare mega-flood associated with frequent storm corridor events [30]. A statistical analysis by Guan et al. [28] of storm corridor events in eastern China over the past 20 years during the rainy season revealed that they typically occur in the Jianghuai Basin near 30°N and can last for two to three days. Studying these storm events, which regularly and repeatedly generate mesoscale convective systems within a few days, can help us understand the development mechanisms of extreme precipitation events, which is critical for effectively responding to heavy rainfall disasters. Furthermore, modeling serves as an important tool for studying the transformation of water condensate and microphysical processes during cloud precipitation.
Previous studies have extensively used the Weather Research and Forecasting (WRF) model to analyze typical individual cases of heavy rainfall events during the Meiyu period in the Jianghuai region [31,32,33]. These studies have significantly contributed to our understanding of the mechanisms behind extreme precipitation events, which have been on the rise in recent years. The Yangtze River basin experienced particularly long-lasting rains in 2020, resulting in cumulative precipitation that broke records dating back to 1961. This unprecedented rainfall led to severe flooding and extensive damage to property. According to the findings of Liu et al. [34], the main cause of this abnormal Meiyu event was the sequence of cold and warm fronts regulated by the North Atlantic Oscillation. While most studies on storm corridors have focused on their formation mechanisms, there has been a relative lack of research using these regularly occurring extreme precipitation events to study how precipitation efficiency responds to warming. This gap in research indicates a need for further investigation into the relationship between climate change and the intensity and frequency of extreme weather events, such as those observed during the Meiyu period. Understanding this relationship is crucial for developing more accurate forecasting models and implementing effective disaster response strategies.
This study focuses on a specific storm corridor event from 2020, utilizing the Weather Research and Forecasting (WRF) model to simulate and analyze precipitation evolution through the lens of cloud-precipitation conversion efficiency. Warming effects on the rainfall process and precipitation efficiency were investigated via three sets of temperature sensitivity tests. In the context of escalating urban disaster losses due to extreme precipitation, this paper explores diagnostic conditions of precipitation evolution from the perspective of a single rainfall process, aiming to uncover the mechanisms by which warming influences the rainfall process. Ultimately, the goal of this study is to provide insights that could enhance short-term heavy precipitation forecasts and warning capabilities.
2. Materials and Methods
2.1. Datasets
NCEP_FNL (National Centers for Environmental Prediction-Final) 1° x 1° reanalysis data were used to provide the initial conditions and boundary conditions for the WRF model. For the validation of the model simulation results, the 0.1° grid dataset of hourly precipitation merged with CMORPH (NOAA Climate Prediction Center morphing technique) from the China Meteorological Administration (version 1.0) was used. The dataset is based on hourly precipitation from more than 30,000 automated stations nationwide, as well as the real-time satellite inversion CMORPH precipitation product developed by the U.S. Environmental Prediction Center. The spatial resolution of the CMORPH raw data is 8 km and the temporal resolution is 30 min [35]. A probability density matching error revision method combined with an optimal interpolation two-step data merge algorithm was applied to the above two parts of the data to generate hourly precipitation fusion products with 0.1°×0.1° resolution. Its spatial range is 70˗140°E, 15˗59°N, and its time range is from January 1, 2008 to the present. This dataset boasts both high spatial and temporal resolution, effectively merging the precision of station observations with the broad-scale representativeness of reanalysis data, thereby offering significant convenience for the study of localized precipitation events.
2.2. Parameterization Scheme and Sensitivity Experiment
A heavy precipitation event in the middle and lower reaches of the Yangtze River was simulated using the Advanced Research WRF model [36] developed by NCAR in WRF 4.0. The microphysical parameterization uses the Lin scheme [37], which increases the forecast of water condensate in the cloud compared to the WSM3 scheme, and increases the treatment of interconversion between water condensates below the freezing point. The Kain-Frisch scheme [38] was used for the outer cumulus convection parameterization, and the RRTM longwave radiation scheme [39] and the Dudhia shortwave radiation scheme [40] were chosen. The Revised MM5 Monin-Obukhov near-stratigraphic parameterization scheme [41], the YSU boundary layer scheme [42], and the Noah land surface scheme [43] were also chosen.
The distribution of the Meiyu rainfall band is insensitive to cumulus parameterization and spatial resolution [44]. To avoid the failure of many widely used parameterization assumptions for cumulus clouds in the gray zone and realistically represent convection [45], here we use two-way nesting. The outer layer uses 9 km grid points to simulate the distribution of precipitation bands. The inner layer uses medium grid points with a 3 km grid spacing to simulate the variation in precipitation intensity. The simulated outer region includes most of southeast China, as shown in Figure 1. In two-way nesting in the horizontal direction, the outer grid (d01) is 220×200 grid points with a 9 km resolution, and the inner grid (d02) is 210×60 grid points with a 3 km resolution. As illustrated in Figure 1a, the primary concern pertains to d02, which is situated on the plains of the lower Tibetan Plateau, characterized by a flat topography. The vertical direction is the terrain following coordinates of 38 layers, and the model top pressure is 50 hPa.
The cumulative precipitation in the middle and lower reaches of the Yangtze River during the Meiyu season of 2020 broke the records of previous years, in which two consecutive gradual eastward shift processes of rainbands, i.e., rainstorm corridor events, occurred from July 4˗7. Figure 1b shows the accumulated precipitation between July 4 and 7. A narrow rain band was formed in the middle and lower reaches of the Yangtze River, and the accumulated precipitation reached more than 400 mm. In this paper, we uniformly use Coordinated Universal Time (UTC) to describe the time evolution, and the simulation time period is July 4, 2020 06:00 UTC to July 6, 2020 18:00 UTC (local time = UTC+8). The running time is 50 hours, the first 12 hours of each test are used as the spinup time of the model, and the simulation results are output every 3 hours. To analyze the sensitivity of the precipitation process to temperature, we increase and decrease the temperature by 2 K on each nested layer and each grid point of the initial conditions and boundary conditions, respectively. Thus, three comparison test simulations are performed: a control group (CTL), a cooling group (T-2), and a warming group (T+2). The three sets of experiments use the exact same parameterization scheme and other experimental settings except for the change in temperature.
2.3. Validation of Model Results against Observation
Figure 2 shows the cumulative precipitation distribution and the evolution of the meridional-averaged precipitation for the observations (OBS_MERG) and WRF simulations (Wrfout_CTL) from 06:00 July 4 to 18:00 July 6, 2020. The two precipitation processes on July 4˗6 form a clear rain band from west to east in the Jianghuai Basin. The cumulative precipitation within the narrow rainbands can exceed 300 mm, while almost no precipitation occurs on the north and south sides outside the rainbands. The center of high precipitation values occurs near 30°N, 115°E, i.e., within our selected inner simulation domain. The WRF simulation results are consistent with the observations and can reproduce the precipitation distribution situation well. The simulation of the high value center of precipitation slightly deviates, but Figure 2b shows the results of the outermost simulation domain, which only needs to be able to simulate the rainband distribution because the strong precipitation value mainly depends on the results of the inner simulation domain.
Figure 2c,d show the zonal evolution of the observed and WRF-simulated meridional mean precipitation, respectively. From the observation results, there are two main west-to-east move processes of rainfall bands. Starting at 18:00 on July 4, precipitation gradually moves eastward from near 110°E, reaching precipitation extremes between 115˗120°E by 03:00 on July 5. The second process starts after 12:00 on July 5, and then precipitation forms near 110°E and gradually moves eastward until 120°E. WRF can simulate the gradual eastward movement of rainbands during the two precipitation processes at 18:00 on July 4 and 12:00 on July 5. The evolution of the rainband distribution is also consistent with the observation, and the intensity of precipitation simulated by WRF differs from the observation due to the results of outer simulation domains. The rain intensity of the WRF-simulated precipitation high value center is higher than that observed in both processes, and the location of the high value center is also shifted. Therefore, for the comparison of the precipitation intensity, we use the inner simulation domain results to compare with the observations for verification. As shown in Figure 3, the results of the temporal evolution of the average precipitation in the simulated domain of d02, the main concentration zone of heavy precipitation. The evolution of precipitation over time is consistent, and the difference between the three-hours cumulative precipitations is approximately 2 mm. Precipitation began to form after 18:00 on July 4, with peaks at 03:00 on the 5th and 00:00 on the 6th corresponding to the center of two heavy precipitation processes. Additionally, note that the precipitation intensity simulated by WRF decreases rapidly with time after 00:00 on the 6th in the figure, which is not consistent with the observed values. This is most likely due to the long running time of 50 hours in this simulation and the rapid decrease in mode stability. Previous studies have also noted that a running time of about 36 hours is best for the simulation of a precipitation process. This stability error due to the length of the running time can be solved by segmenting the simulation for a single long time case. However, the simulation deviation of precipitation after the 6th here has no effect on the analysis of the two precipitation occurrence processes in this paper. Through the comparison verification in the above two figures, it can be said that the WRF simulation results can well reproduce the eastward shift of the rainband and the evolution of precipitation intensity in this storm corridor event.
3. Results
3.1. Analysis of Weather Field Configuration
Figure 4 illustrates the temporal progression of the 850 hPa meteorological field during two significant precipitation events. In this figure, the brown and blue regions denote areas where the equivalent potential temperatures exceed 355 K and fall below 345 K, respectively. Superimposed are contours representing radar reflectivity, while directional vectors depict the horizontal wind field. The evolution of the initial precipitation event is depicted at three-hour intervals on the left side of the figure, contrasting with the second event displayed on the right. Radar reflectivity, indicative of the reflection signals from hydrometeors within clouds, sheds light on the distribution of the cloud system. During both precipitation events, areas of high radar reflectivity are consistently observed along a narrow rain band at 30°N, marking the primary precipitation source. Over time, these regions of heightened reflectivity expand, regularly exceeding 30 dBZ, and exhibit an eastward movement from the southwest, tracing the Yangtze River basin. At 03:00 on the 5th and 00:00 on the 6th, the peaks in reflectivity values are predominantly concentrated in the d02 simulation domain within the lower Yangtze River region, aligning with the observed precipitation patterns. It is also noteworthy that, despite the similar rain intensities in the two events, the overall radar reflectivity on the 6th, during the second precipitation process, is higher compared to that on the 5th.
The gradient of the atmospheric equivalent temperature in the horizontal direction can be used to indicate the location of the front and its intensity variations. The brown areas contained in the equivalent potential temperature exceeding 355 K in Figure 4 indicate warm and humid air masses, while the light blue areas with equivalent potential temperatures below 345 K indicate dry and cold air masses. Prior to the precipitation event at 21:00 on the 4th, an extensive warm and humid air mass originating from the southwest accumulated south of 30°N. Over time, this warm and humid air mass was gradually lifted northward due to southwesterly winds, crossing the 30°N line to intersect with the dry and cold air mass from the north. The ensuing condensation of water vapor at this junction of warm and cold air masses is mirrored in the corresponding changes in radar reflectivity. The second precipitation process that formed at 18:00 on the 5th was similar, with warm and humid air masses piling up south of 30°N from the start. The distribution at 21:00 on the 5th and 00:00 on the 6th clearly shows the gradual transport path of the warm and humid air mass from the southwest to the east. The dry and cold air mass in the north is more southerly than the first process, and the cold and warm air masses converge throughout the middle and lower Yangtze River to produce more water vapor condensation, reflected in higher radar reflectivity than the first process. The equivalent potential temperature and radar reflectance in Figure 4 clearly reflect the water vapor transport, convergence and condensation processes for both precipitation processes from a horizontal direction.
Figure 5, on the other hand, shows the evolution of cold and warm air masses and vertical velocities during the two precipitation events from a vertical direction. The equivalent potential temperature above 10 km shows a uniform stratification structure with increasing height (Figure omitted). In the lower troposphere, there are two low-value centers with roughly symmetrical 30°N lines at 4 km. Overall, the temperature was higher south of 30°N than north, which can represent the relatively warm and wet air masses and dry and cold air masses, respectively. The cold and warm air masses are separated from the north and south by the 350 K equivalent potential temperature. Before the precipitation occurred at 00:00 on the 5th, the warm and wet air mass 345 K isotherm was near 24°N, and the center of the dry and cold air mass less than 330 K was located near 33°N. At 03:00 on the 5th, as the warm and humid air mass 345 K isotherm lifted northward and the center of the cold air mass moved southward, strong upward motion formed at its tropospheric convergence. After that, the cold and warm air masses continue to converge, with the center of the cold air mass 330 K isotherm moving south and the 350 K isotherm crossing 30°N. The warm air on the front is continuously lifted, generating vertical movement at the top of the troposphere moving southward. The second precipitation process is similar, with an upward movement forming over the 350 K equivalent potential temperature intersection at 18:00 on the 5th. The zonal gradient of dry and cold air mass temperatures north of 30°N is greater during the second process, and the center of low 330 K is near 30°N and gradually moves southward. The warm and humid air coming from the south is lifted continuously, and a wide range of strong upward movement is formed in the upper troposphere at 21:00 on the 5th. Then, the upward movement gradually moves southwest and generates heavy precipitation on the front. Although the difference in rain intensity between the two precipitation processes is small, the larger potential temperature gradient between the cold and warm air masses in the second process creates a stronger vertical upward movement. Overall, the same formation process is reflected horizontally and vertically for both precipitation processes. The cold and warm air masses in the troposphere are bounded by the 350 K equivalent potential temperature and converge near 30°N to form a front system. The warm and humid air masses are continuously lifted and condensed to form precipitation. Cloud water condensed in the middle and lower reaches of the Yangtze River by southwesterly winds carrying a constant stream of warm and humid air serves as a direct source of precipitation.
3.2. Effect of Warming on Convective Activity
The enhanced atmospheric water storage capacity and altered vertical dynamics due to warming have a notable impact on precipitation patterns. Recent decades have witnessed a surge in extreme precipitation events globally, highlighting the critical role of temperature in shaping precipitation dynamics. In this study, we delve into the influence of warming on convective precipitation by adjusting the initial temperature values in the forcing field. The main factors affecting the convective initiation during convective precipitation are convective available potential energy (CAPE), convective inhibition energy (CIN), lifting condensation level (LCL) and level of free convection (LFC). CAPE is defined as the cumulative buoyant energy above the free convection level and represents the net kinetic energy gained by the rising air mass from the environment, thus reflecting the strength of the convective system. CIN describes the limiting factor, which is able to prevent convection even though very high values of CAPE exist. The air parcel needs to overcome a usually stable layer between the surface and LFC. The intensity of this stable layer is defined by CIN.
Figure 6 compares the evolution of precipitation, CAPE, CIN, LCL and LFC during the whole precipitation process in different experimental groups from July 4˗7. Each of the three experiments successfully simulates the progression of two significant precipitation events, demonstrating a sequential increase in peak precipitation amounts with rising temperatures. Notably, the extreme precipitation values can potentially double in experiments with a temperature differential of 2 K. Additionally, we observed that both the onset of precipitation and the occurrence of extreme values tend to precede earlier in response to increasing temperatures during these events. In particular, during the second precipitation event, the extremities of precipitation advanced by approximately three hours in a sequential manner correlating with temperature increments. This suggests that the escalation in convective activity may reach a critical threshold for convective disturbance more promptly following a temperature increase, thereby initiating precipitation. Intriguingly, the peak precipitation value in the second event within the cooling test group surpassed that observed in the first event.
The light green and light blue shading in the figure correspond to the two precipitation processes. Precipitation increases rapidly with time to peak in the two selected periods. In contrast, CAPE decreases with time in both periods, indicating a gradual release of convective instability energy during precipitation. In addition, the peak CAPE of the second precipitation process is much larger than that of the first process. That is, CAPE accumulates before each precipitation event and starts releasing unstable energy when it reaches a certain threshold, forming precipitation. Therefore, the trend of its evolution over time is almost opposite to the change in precipitation, but a higher CAPE peak leads to stronger convective activity. All three sensitivity tests increase CAPE sequentially with increasing temperature, consistent with the change in precipitation. CIN decreases rapidly from high values before the onset of precipitation, favoring convective development. It remained at a low value of approximately 10 J/kg during the first precipitation, and then gradually increased, reaching a peak during the second precipitation. That is, the first precipitation process convection is not suppressed and CAPE is directly released to form precipitation. While the second process has a higher CAPE peak, the CAPE release process is about 3 hours slower. Therefore, although there is a difference between the extreme values of CAPE, the difference in precipitation between the two processes is not significant. The boundary layer height can be approximated by the lifting condensation level when the convective activity is strong, and the higher the LCL the stronger the vertical mixing [46]. That is, higher CAPE and LCL and lower LFC are conducive to the strong convective activity generation. LCL in Figure 6 is approximately 1000 m before precipitation occurs, while LFC decreases rapidly from high values, which is favorable for convection to occur. The LCL decreased during the second precipitation, but the LFC remained at a lower value. Moreover, the differences in LCL and LFC between the three sensitive test groups were not significant. That is, LCL and LFC only need to provide conditions conducive to convective triggering, which does not change much during the occurrence of precipitation. Overall, the combined dynamics of CAPE, CIN, LCL and LFC play a pivotal role in dictating the conditions for convective initiation and development, and has an important influence on convective intensity, development height and subsequent precipitation generation.
Figure 7 gives the temporal variation of CAPE and CIN for the three sets of sensitivity tests in terms of vertical evolution. Three accumulation and release processes of CAPE in the vertical direction are present in all three tests. This center gradually dissipates its energy, paralleling the precipitation process post-15:00. At 03:00 on the 5th, concurrent with the peak and subsequent decline in precipitation, CAPE starts to accumulate again, forming a second peak. This pattern of accumulation and release is consistent across all tests, with CAPE serving as a key driver for precipitation dynamics. When comparing the test groups, we note a sequential increase in the intensity of CAPE maxima with rising temperatures. The initial CAPE peak at 15:00 on the 4th is the weakest and short-lived. In contrast, the subsequent CAPE peaks decrease in altitude, with the control and cooling groups showing peaks near the ground level. Notably, the warming group exhibits the strongest second CAPE maximum, exceeding 2000 J/kg, at an altitude of 1 km. Conversely, the evolution of CIN is temporally staggered relative to CAPE, with two significant peaks positioned between the three CAPE cycles. Similar to CAPE, the intensity of CIN maxima also escalates with rising temperatures. The CIN peaks are predominantly maintained at an altitude of around 1 km, aligning with the LCL. This staggered spatial and temporal configuration of CAPE and CIN appears to be conducive to the development and occurrence of convective precipitation.
3.3. Mechanism of Warming Affecting Cloud Precipitation Efficiency
To analyze in detail the effect of warming on the precipitation process, Figure 8 compares the differences in equivalent potential temperature, vertical velocity and zonal wind speed between the warming and control tests. In the cooling test (figure omitted), the low-value center of the equivalent potential temperature in the dry and cold air mass to the north registers at 324 K. The center in the warm and humid air mass to the south reaches an intensity of 330 K. Relative to the control experiments, the induced upward motions in both precipitation processes at lower temperatures exhibit diminished strength and occur predominantly in the mid-troposphere. This observation aligns with Figure 6, where the cooling experiment portrays the most subdued peak in precipitation.
In Figure 8, we observe the evolution of meridional vertical profiles of equivalent potential temperature and vertical velocity during two distinct intense precipitation events in the warming experiment, compared to the control. With increasing temperatures, the intensity of the low-value center of equivalent potential temperature in both cold and warm air masses is amplified. This is characterized by a rise in the peripheral potential temperature and a decrease at the low-value center, particularly evident during the second precipitation event. Such changes enhance the north-south potential temperature gradient. Over time, the northern and southern air masses converge, with warm air masses gaining in potential temperature and cold air masses experiencing a decrease, culminating in robust upward movements above the frontal surface. Notably, the second event exhibits stronger vertical velocities than the first and gradually shifts southward. Post-warming scenarios suggest a potential weakening of upward motion, and the differences in precipitation outcomes between the two simulated events are not markedly significant. This implies that the increase in precipitation with temperature is not solely attributable to dynamic conditions. Enhanced convective activity, facilitating precipitation formation, and the augmented supply of water vapor due to warming are also crucial factors. Moreover, the strengthening of horizontal zonal wind speed above the low-value center after warming expedites the movement of rain bands and advances the onset of precipitation. It’s also noteworthy that the variations in zonal wind speed closely correspond spatially with those in equivalent potential temperature.
Since warming increases both precipitation and cloud water condensate content, we examined the change in cloud-precipitation efficiency with warming. Precipitation efficiency in this context is quantified by the ratio of regionally integrated precipitation to the aggregate hydrometeor content within the d02 simulation domain. Figure 9 presents boxcharts depicting the temperature sensitivity test’s impact on variations in precipitation, total hydrometeors, and precipitation efficiency during the initial precipitation event. A notable trend emerges with precipitation progressively augmenting alongside temperature, where the average value escalates from under 10 mm to over 20 mm. A parallel trend is observed in hydrometeor content, which also surges in response to rising temperatures. Notably, the average hydrometeor content in the control test doubles compared to the T-2 group. Concurrently, cloud-precipitation efficiencies calculated across the three experimental sets reveal progressive increases at 27.4%, 31.2%, and 33.1%, respectively, with escalating temperatures.”
Previous studies have found that convection can reach higher heights and greater saturation specific humidity at increasing temperatures [47]. Additionally, the daily variation in near-surface flux under warming will significantly affect the CAPE extremes. However, the increase in vertical velocity and CAPE with warming does not necessarily translate to an increase in precipitation intensity [27]. Also considering the year-to-year decrease in weak precipitation and the increase in heavy precipitation, this raises a pivotal question: does the intensification of convection owing to warming correlate with an increased suppression of convection?
In Figure 10, the boxchart meticulously details the variations in convective conditions and meteorological factors arising from temperature sensitivity tests. It reveals a nearly linear increase in the maximum CAPE in the vertical direction with temperature. The average maximum CAPE in the T+2 test surpasses 1000 J/kg, indicating an abundance of moisture static energy available to fuel the vertical ascent of air masses. Concurrently, the maximum CIN energy in the vertical direction also escalates progressively with warming. While CIN does hinder convective development, a higher maximum CIN implies that air masses can accumulate greater moisture hydrostatic energy prior to its release. The peak CIN value essentially acts as a threshold for CAPE; a scenario with minimal CAPE and substantial CIN impedes the breakthrough of energy inhibition, making convective development challenging. Conversely, a small CAPE can overcome a minimal CIN, leading to a swift release of energy without significant accumulation. Hence, a balanced combination of maximum CAPE and CIN values is crucial for fostering robust convective activity and the effective discharge of accumulated moisture static energy, resulting in intense precipitation. Moreover, the post-warming sensitivity test demonstrates an increase in both CAPE and CIN, facilitating the efficient accumulation and release of energy, which sequentially amplifies precipitation and its efficiency. The interplay between the Lifting Condensation Level (LCL) and Level of Free Convection (LFC) mirrors this pattern. The LCL denotes the intensity of vertical mixing in convection, while the LFC imposes a relative boundary that must be overcome. Both incrementally increase with temperature, a configuration imperative for bolstering precipitation and its efficiency. This simultaneous escalation of convection and its suppression may also be a pivotal factor in the marked rise of extreme precipitation events under global warming.
The occurrence of precipitation is influenced by both dynamic and thermal processes in the atmosphere [26]. Here, the upward moisture flux (UMF) and the lower troposphere stability (LTS) are chosen to represent the dynamic and thermal contributions, respectively. The upward moisture flux is the actual mass flux transported vertically upward and can represent the dynamic contribution of vertical transport. The lower troposphere stability defined as the potential temperature differential between two atmospheric layers, substantially impacts the boundary layer height and the radiative cooling of cloud tops, thereby critically determining cloud water content [48].
The LTS distribution across all grid points, as depicted in Figure 10, demonstrates a notable concentration, with its mean value incrementally rising with temperature in each of the three experimental conditions. Contrarily, changes in UMF follow a divergent pattern, showing a gradual decrease with temperature elevation. This trend likely stems from a rapid escalation in moisture relative to precipitation, culminating in a reduced mass exchange rate. Intriguingly, a higher UMF typically signals stronger convection, potentially leading to increased precipitation. However, our previous findings indicate that the relationship between cloud water evolution and UMF is not linear [49]. Specifically, when UMF is below 150 g/m²/h, a positive correlation with precipitation is observed. In contrast, at UMF values exceeding 150 g/m²/h, precipitation tends to stagnate or even diminish with rising UMF. During the analyzed heavy precipitation events, the average UMF across all three sensitivity tests exceeded 200 g/m²/h, inversely correlating with precipitation changes. Furthermore, Guo et al. [49] also noted that precipitation efficiency first decreases and then increases with LTS in scenarios of higher UMF. The average LTS value for all test sets surpassed 12 K, suggesting an increase in precipitation efficiency with rising LTS, a finding aligning with our current results. This supports earlier statistical conclusions on a small to moderate scale, linking changes in precipitation efficiency with the evolution of LTS and UMF distributions.
Ultimately, the aggregate outcomes of the three temperature sensitivity tests within the d02 simulation domain are summarized in Table 1. This includes data on precipitation (P), hydrometeors (CWP), precipitation efficiency (PE), and other relevant convective condition metrics. Aligning with the findings illustrated in the aforementioned figure, each convective parameter, barring UMF, shows a sequential increase with temperature elevation. The collective configuration of CAPE and CIN, alongside LCL and LFC, plays a crucial role in modulating precipitation intensity and efficiency from an unstable energy standpoint. The combined LTS and UMF configuration also significantly influences the precipitation process, considering atmospheric dynamics and thermal conditions, thereby serving as a diagnostic tool for gauging the intensity of precipitation changes to a certain extent.
4. Conslusions
Regularly recurring heavy rainfall corridor events often bring severe flooding to cities, the Yangtze River basin in China suffers from that every summer. The impact of convective activity on cloud-precipitation efficiency during a rainstorm corridor event was analyzed using numerical simulations in the middle and lower reaches of the Yangtze River in 2020. Warming is found to simultaneously promote and suppress convective activity to affect precipitation, explaining the increase in extreme precipitation intensity in a warming context.
On July 4-6, 2020, two significant precipitation events occurred when cold and warm air masses converged near the 350 K equivalent potential temperature isotherm, leading to frontal precipitation. The warming strengthened the considerable north-south temperature gradient and created a stronger upward movement on the fronts. It also strengthened the southwesterly winds to transport more moisture to lift and condense on the fronts, resulting in stronger precipitation peaks. The intensification of convective activity and the acceleration of zonal winds advanced the onset of precipitation processes. The cloud hydrometeor content surged with rising temperatures. The increase in precipitation observed in temperature-sensitive tests was not solely attributed to dynamic conditions; the augmented water vapor supply due to warming played a crucial role as well.
The convective available potential energy (CAPE) can reach 600 and 890 J/kg for the two precipitation events. The intensity of CAPE and convective inhibition energy (CIN) increase with rising temperatures, and convective instability energy accumulation and release processes become more intense after warming. For effective precipitation, a reasonable combination of maximum CAPE and CIN values is necessary, which leads to both strong convective activity and the efficient release of accumulated moisture static energy. Similarly, the combination of the Lifting Condensation Level (LCL) and Level of Free Convection (LFC) plays a role in enhancing precipitation efficiency. The precipitation efficiency of the three groups of tests increased with increasing temperature to 27.4%, 31.2% and 33.1%, respectively. Warming simultaneously alters cloud precipitation efficiency by promoting and suppressing convective activity, which may also be one of the reasons for the enhanced extreme precipitation in the context of global warming.
The average Upward Moisture Flux (UMF) across all three sensitivity test groups exceeded 200 g/m2/h. Moreover, the mean values of Lower Troposphere Stability (LTS) consistently surpassed 12 K. The precipitation efficiency increases with LTS. This interplay between LTS and UMF significantly influences the precipitation process, both dynamically and thermally, and serves as a diagnostic tool for gauging the intensity of precipitation changes to a certain degree. This research contributes to bridging the gap in heavy precipitation forecasting and warning systems, and offers valuable insights for disaster prevention and mitigation strategies.
Author Contributions
Conceptualization, Qi.Guo. and Yupei.Hao.; methodology, Qi.Guo.; resources and data curation, Yixuan.Chen.; writing—original draft preparation, Qi.Guo.; writing—review and editing, Xiongyi.Miao. All authors have read and agreed to the published version of the manuscript.
Funding
This research was funded by the Natural Science Research Project of the Guizhou Provincial Department of Education (Qian Jiao Ji [2024] No. 48), the Academic Talent Plan of Guizhou Normal University (Qian Shi Xin Miao [2022] No. B19), and the project of Key funding Project from Anshun Technical College (Contract No. X202302).
Data Availability Statement
The authors would like to thank the China Meteorological Data Service Center, for providing the 0.1° grid dataset of hourly precipitation merged with CMORPH (version 1.0), which is available at http://data.cma.cn/. Furthermore, NCEP_FNL (National Centers for Environmental Prediction-Final) 1° x 1° reanalysis data used during this study are openly available from the Research Data Archive at the National Center for Atmospheric Research, Computational and Information Systems Laboratory at https://rda.ucar.edu/datasets/.
Conflicts of Interest
The authors declare no conflicts of interest.
References
- Ren, Y.; Yu, H.P.; Huang, J.P.; Peng, M.; Zhou, J. The Projected Response of the Water Cycle to Global Warming Over Drylands in East Asia. Earths Future 2024, 12. [Google Scholar] [CrossRef]
- Tang, Q. Global change hydrology: Terrestrial water cycle and global change. Science China. Earth Sciences 2020, 63, 459–462. [Google Scholar] [CrossRef]
- Yang, D.; Yang, Y.; Xia, J. Hydrological cycle and water resources in a changing world: A review. Geography and Sustainability 2021, 2, 115–122. [Google Scholar] [CrossRef]
- Bowen, G.J. A faster water cycle. Science 2011, 332, 430–431. [Google Scholar] [CrossRef]
- Köcher, G.; Zinner, T.; Knote, C. Influence of cloud microphysics schemes on weather model predictions of heavy precipitation. Atmospheric Chemistry and Physics 2023, 23, 6255–6269. [Google Scholar] [CrossRef]
- Trömel, S.; Simmer, C.; Blahak, U.; Blanke, A.; Doktorowski, S.; Ewald, F.; Frech, M.; Gergely, M.; Hagen, M.; Janjic, T.; et al. Overview: Fusion of radar polarimetry and numerical atmospheric modelling towards an improved understanding of cloud and precipitation processes. Atmospheric Chemistry and Physics 2021, 21, 17291–17314. [Google Scholar] [CrossRef]
- Schneider, T.; Teixeira, J.; Bretherton, C.S.; Brient, F.; Pressel, K.G.; Schär, C.; Siebesma, A.P. COMMENTARY: Climate goals and computing the future of clouds. Nat Clim Change 2017, 7, 3–5. [Google Scholar] [CrossRef]
- Abdelmoaty, H.M.; Papalexiou, S.M.; Rajulapati, C.R.; AghaKouchak, A. Biases Beyond the Mean in CMIP6 Extreme Precipitation: A Global Investigation. Earths Future 2021, 9. [Google Scholar] [CrossRef]
- Adler, R.F.; Gu, G.J.; Sapiano, M.; Wang, J.J.; Huffman, G.J. Global Precipitation: Means, Variations and Trends During the Satellite Era (1979-2014). Surv Geophys 2017, 38, 679–699. [Google Scholar] [CrossRef]
- Li, S.; Chen, Y.N.; Wei, W.; Fang, G.H.; Duan, W.L. The increase in extreme precipitation and its proportion over global land. Journal of Hydrology 2024, 628. [Google Scholar] [CrossRef]
- Sun, W.; Li, J.; Yu, R.C.; Li, N.A.; Zhang, Y. Exploring changes of precipitation extremes under climate change through global variable-resolution modeling. Sci Bull 2024, 69, 237–247. [Google Scholar] [CrossRef] [PubMed]
- Allen, M.R.; Ingram, W.J. Constraints on future changes in climate and the hydrologic cycle. Nature 2002, 419, 224–232. [Google Scholar] [CrossRef] [PubMed]
- Chen, H.P.; Sun, J.Q. Significant Increase of the Global Population Exposure to Increased Precipitation Extremes in the Future. Earths Future 2021, 9. [Google Scholar] [CrossRef]
- Yang, Y.; Zhao, N. Future projections of compound temperature and precipitation extremes and corresponding population exposure over global land. Global Planet Change 2024, 236. [Google Scholar] [CrossRef]
- Ma, S.M.; Zhou, T.J.; Stone, D.A.; Polson, D.; Dai, A.G.; Stott, P.A.; von Storch, H.; Qian, Y.; Burke, C.; Wu, P.L.; et al. Detectable Anthropogenic Shift toward Heavy Precipitation over Eastern China. J. Clim. 2017, 30, 1381–1396. [Google Scholar] [CrossRef]
- Yao, Z.Y.; An, L.; Zhang, P.; Gao, L.S.; Jia, S.; Wang, W.J.; Zhao, W.H. Characteristics of Cloud Water Resource and Precipitation Efficiency of Hydrometeors over Northwest China. Journal of Meteorological Research 2023, 37, 353–369. [Google Scholar] [CrossRef]
- Pfahl, S.; O’Gorman, P.A.; Fischer, E.M. Understanding the regional pattern of projected future changes in extreme precipitation. Nat Clim Change 2017, 7, 423. [Google Scholar] [CrossRef]
- Qi, P.; Guo, X.L.; Chang, Y.; Tang, J.; Li, S.Y. Cloud water path, precipitation amount, and precipitation efficiency derived from multiple datasets on the Qilian Mountains, Northeastern Tibetan Plateau. Atmospheric Research 2022, 274. [Google Scholar] [CrossRef]
- Cai, M. Cloud water resources and precipitation efficiency evaluation over China; Nanjing University of Information Science & Technology: Beijing, China, 2013. [Google Scholar]
- Cheng, J.Y.; You, Q.L.; Zhou, Y.Q.; Cai, M.; Pepin, N.; Chen, D.L.; AghaKouchak, A.; Kang, S.C.; Li, M.C. Increasing cloud water resource in a warming world. Environmental Research Letters 2021, 16. [Google Scholar] [CrossRef]
- Zhao, M.; Golaz, J.C.; Held, I.M.; Ramaswamy, V.; Lin, S.J.; Ming, Y.; Ginoux, P.; Wyman, B.; Donner, L.J.; Paynter, D.; et al. Uncertainty in Model Climate Sensitivity Traced to Representations of Cumulus Precipitation Microphysics. J. Clim. 2016, 29, 543–560. [Google Scholar] [CrossRef]
- Liu, Y.H.; Luo, R.; Zhu, Q.Z.; Hua, S.; Wang, B. Cloud ability to produce precipitation over arid and semiarid regions of Central and East Asia. Int J Climatol 2020, 40, 1824–1837. [Google Scholar] [CrossRef]
- Lutsko, N.J.; Cronin, T.W. Increase in Precipitation Efficiency With Surface Warming in Radiative-Convective Equilibrium. J Adv Model Earth Sy 2018, 10, 2992–3010. [Google Scholar] [CrossRef]
- Narsey, S.; Jakob, C.; Singh, M.S.; Bergemann, M.; Louf, V.; Protat, A.; Williams, C. Convective Precipitation Efficiency Observed in the Tropics. Geophysical Research Letters 2019, 46, 13574–13583. [Google Scholar] [CrossRef]
- Sun, H.; Liu, X.D. Impacts of dynamic and thermal forcing by the Tibetan Plateau on the precipitation distribution in the Asian arid and monsoon regions. Climate Dynamics 2021, 56, 2339–2358. [Google Scholar] [CrossRef]
- Yang, B.; Qian, Y.; Lin, G.; Leung, R.; Zhang, Y. Some issues in uncertainty quantification and parameter tuning: A case study of convective parameterization scheme in the WRF regional climate model. Atmospheric Chemistry and Physics 2012, 12, 2409–2427. [Google Scholar] [CrossRef]
- Singh, M.S.; O’Gorman, P.A. Increases in moist-convective updraught velocities with warming in radiative-convective equilibrium. Quarterly Journal of the Royal Meteorological Society 2015, 141, 2828–2838. [Google Scholar] [CrossRef]
- Guan, P.Y.; Chen, G.X.; Zeng, W.X.; Liu, Q. Corridors of Mei-Yu-Season Rainfall over Eastern China. J. Clim. 2020, 33, 2603–2626. [Google Scholar] [CrossRef]
- Tuttle, J.D.; Davis, C.A. Corridors of warm season precipitation in the central United States. Mon Weather Rev 2006, 134, 2297–2317. [Google Scholar] [CrossRef]
- Chen, G.X.; Sha, W.; Iwasaki, T.; Wen, Z.P. Diurnal Cycle of a Heavy Rainfall Corridor over East Asia. Mon Weather Rev 2017, 145, 3365–3389. [Google Scholar] [CrossRef]
- Gao, Y.Q.; Wang, X.F.; Xie, Y.; Gu, W. Convection Initiation of a Heavy Rainfall Event in the Coastal Metropolitan Region of Shanghai on the South Side of the Meiyu Front. Journal of Meteorological Research 2023, 37, 149–173. [Google Scholar] [CrossRef]
- Sugimoto, S.; Xue, Y.K.; Sato, T.; Takahashi, H.G. Influence of convective processes on weather research and forecasting model precipitation biases over East Asia. Climate Dynamics 2022. [Google Scholar] [CrossRef]
- Zeng, W.X.; Chen, G.X.; Du, Y.; Wen, Z.P. Diurnal Variations of Low-Level Winds and Precipitation Response to Large-Scale Circulations during a Heavy Rainfall Event. Mon Weather Rev 2019, 147, 3981–4004. [Google Scholar] [CrossRef]
- Liu, B.Q.; Yan, Y.H.; Zhu, C.W.; Ma, S.M.; Li, J.Y. Record-Breaking Meiyu Rainfall Around the Yangtze River in 2020 Regulated by the Subseasonal Phase Transition of the North Atlantic Oscillation. Geophysical Research Letters 2020, 47. [Google Scholar] [CrossRef]
- Joyce, R.J.; Janowiak, J.E.; Arkin, P.A.; Xie, P. CMORPH: A method that produces global precipitation estimates from passive microwave and infrared data at high spatial and temporal resolution. Journal of hydrometeorology 2004, 5, 487–503. [Google Scholar] [CrossRef]
- Skamarock, W. A description of the advanced research WRF version 3. NCAR/TN–.-475+ STR NCAR TECHNICAL NOTE 2008, 125. [Google Scholar]
- Lin, Y.-L.; Farley, R.D.; Orville, H.D. Bulk parameterization of the snow field in a cloud model. J Appl Meteorol Clim 1983, 22, 1065–1092. [Google Scholar] [CrossRef]
- Kain, J.S. The Kain–Fritsch convective parameterization: an update. J Appl Meteorol 2004, 43, 170–181. [Google Scholar] [CrossRef]
- Mlawer, E.J.; Taubman, S.J.; Brown, P.D.; Iacono, M.J.; Clough, S.A. Radiative transfer for inhomogeneous atmospheres: RRTM, a validated correlated-k model for the longwave. Journal of Geophysical Research: Atmospheres 1997, 102, 16663–16682. [Google Scholar] [CrossRef]
- Dudhia, J. Numerical study of convection observed during the winter monsoon experiment using a mesoscale two-dimensional model. Journal of Atmospheric Sciences 1989, 46, 3077–3107. [Google Scholar] [CrossRef]
- Hong, S.-Y.; Pan, H.-L. Nonlocal boundary layer vertical diffusion in a medium-range forecast model. Mon Weather Rev 1996, 124, 2322. [Google Scholar] [CrossRef]
- Hong, S.-Y.; Noh, Y.; Dudhia, J. A new vertical diffusion package with an explicit treatment of entrainment processes. Mon Weather Rev 2006, 134, 2318–2341. [Google Scholar] [CrossRef]
- Chen, F.; Dudhia, J. Coupling an advanced land surface–hydrology model with the Penn State–NCAR MM5 modeling system. Part I: Model implementation and sensitivity. Mon Weather Rev 2001, 129, 569–585. [Google Scholar] [CrossRef]
- Zhang, Y.C.; Zhang, F.Q.; Davis, C.A.; Sun, J.H. Diurnal Evolution and Structure of Long-Lived Mesoscale Convective Vortices along the Mei-Yu Front over the East China Plains. J Atmos Sci 2018, 75, 1005–1025. [Google Scholar] [CrossRef]
- Liang, X.Z.; Li, Q.; Mei, H.X.; Zeng, M.J. Multi-Grid Nesting Ability to Represent Convections Across the Gray Zone. J Adv Model Earth Sy 2019, 11, 4352–4376. [Google Scholar] [CrossRef]
- Wisse, J.; Vilà-Guerau de Arellano, J. Analysis of the role of the planetary boundary layer schemes during a severe convective storm. In Proceedings of the Annales Geophysicae; 2004; pp. 1861–1874. [Google Scholar]
- Muller, C.J.; O’Gorman, P.A.; Back, L.E. Intensification of precipitation extremes with warming in a cloud-resolving model. J. Clim. 2011, 24, 2784–2800. [Google Scholar] [CrossRef]
- Andersen, H.; Cermak, J.; Fuchs, J.; Knutti, R.; Lohmann, U. Understanding the drivers of marine liquid-water cloud occurrence and properties with global observations using neural networks. Atmospheric Chemistry and Physics 2017, 17, 9535–9546. [Google Scholar] [CrossRef]
- Guo, Q.; Cao, X.J.; Liang, J.I.; Zhang, Z.D.; Zhang, M.; Zhang, L. The Response of Cloud-Precipitation Recycling in China to Global Warming. Remote Sens-Basel 2021, 13. [Google Scholar] [CrossRef]
Figure 1.
Extent of the model’s inner and outer simulation area, topographic height (in m) distribution (a), and observed cumulative precipitation (in mm) for the July 4˗7, 2020 precipitation process (b). The black boxes d01 and d02 in the figure indicate the first and second layers of the nested grid areas, respectively.
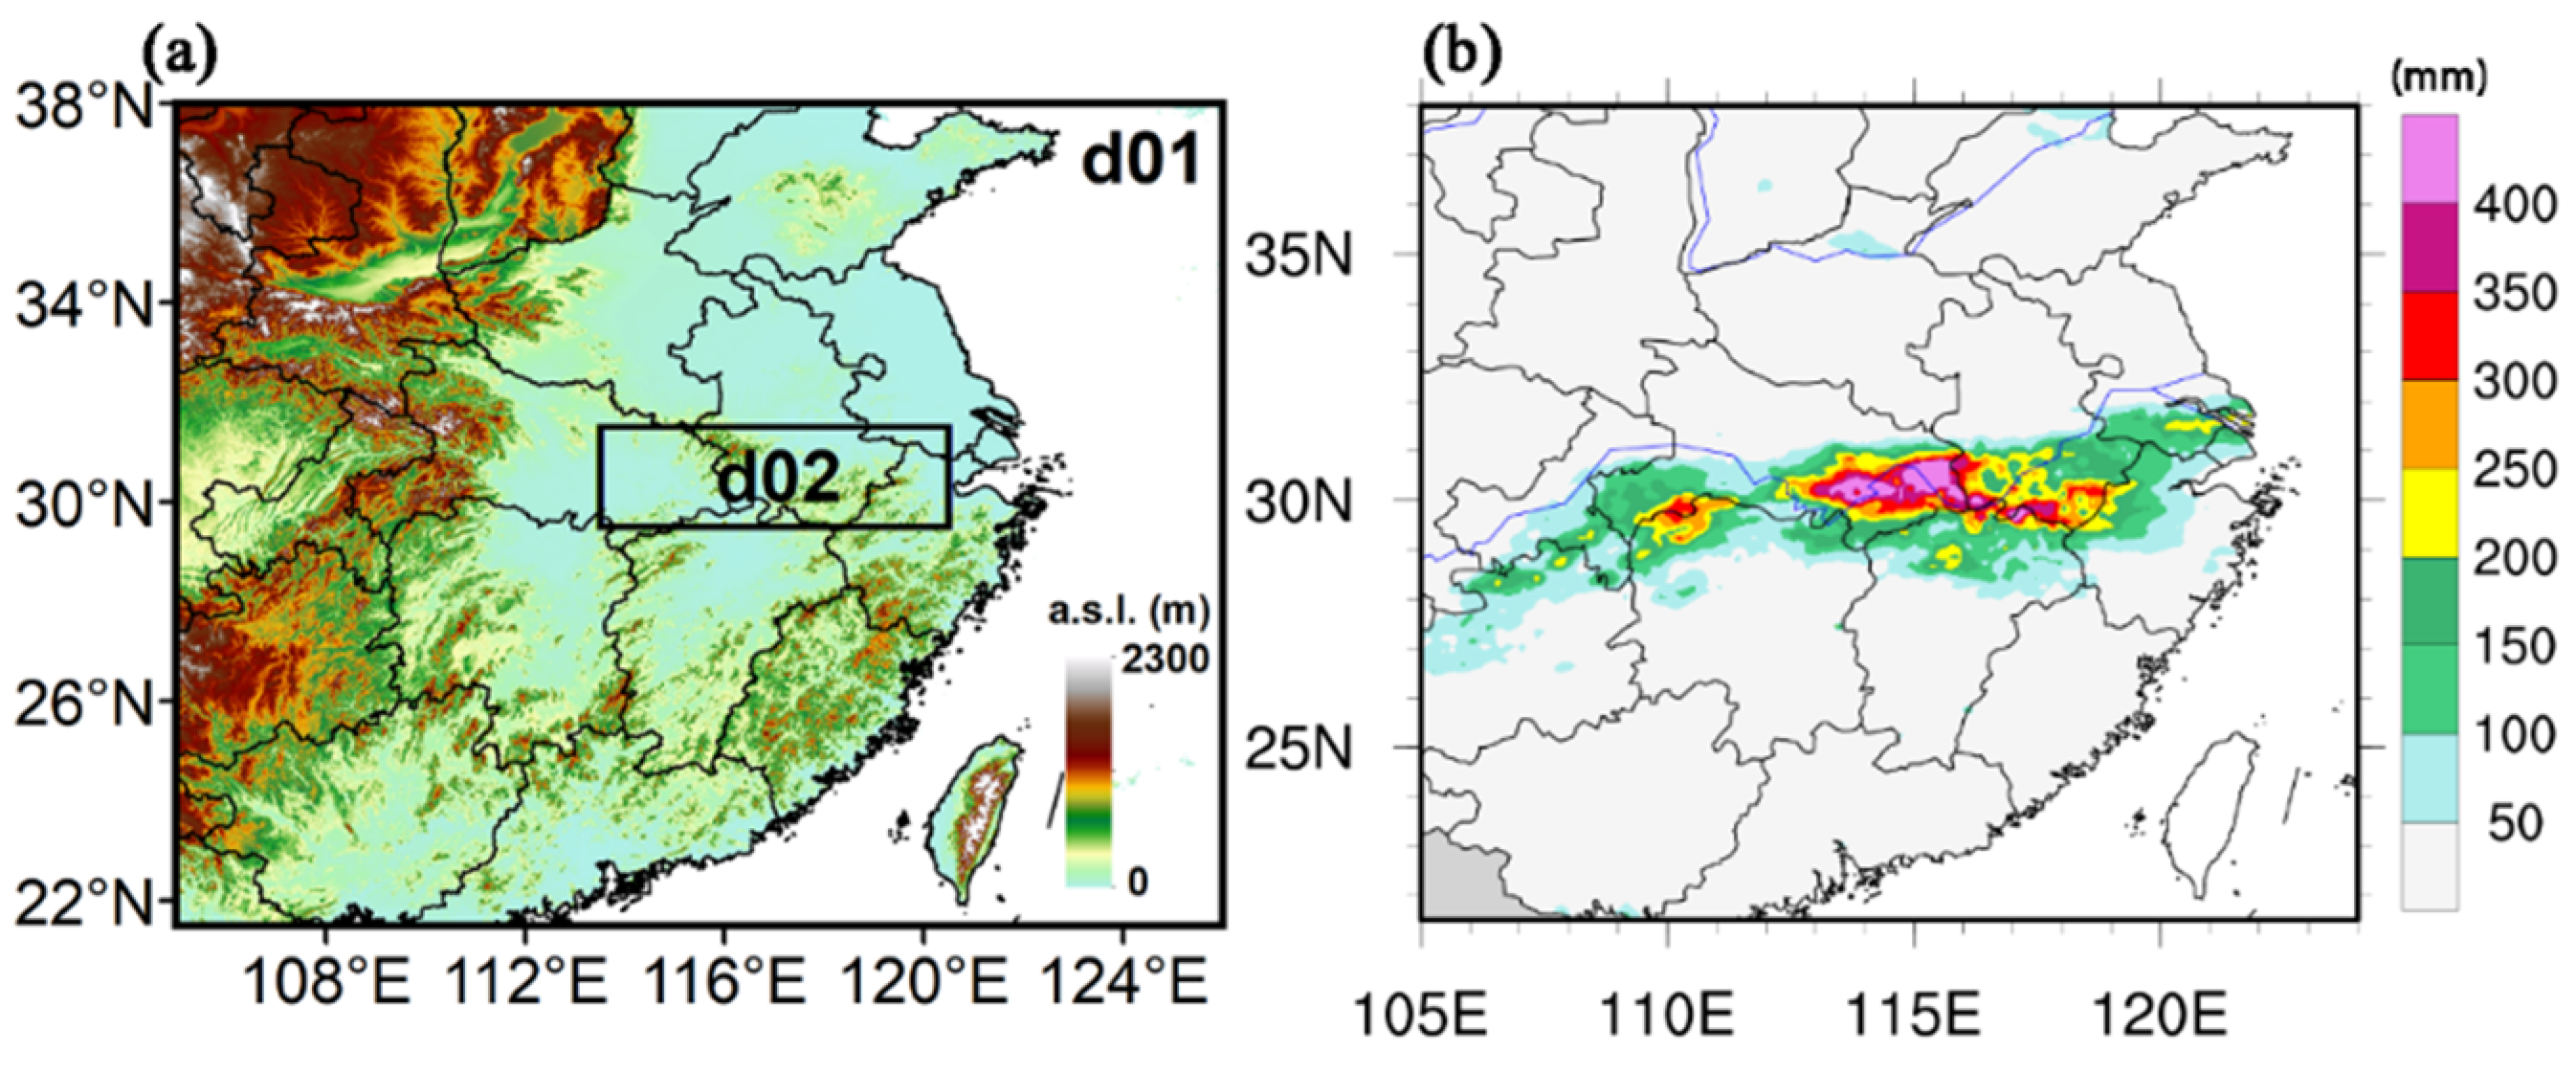
Figure 2.
Cumulative precipitation distribution of the observed (OBS_MERG) and WRF simulations (Wrfout_CTL) from July 4, 2020 06:00 to July 6, 2020 18:00 (UTC) (a)(b) and the zonal evolution of meridional mean precipitation (c)(d), all in mm.
Figure 2.
Cumulative precipitation distribution of the observed (OBS_MERG) and WRF simulations (Wrfout_CTL) from July 4, 2020 06:00 to July 6, 2020 18:00 (UTC) (a)(b) and the zonal evolution of meridional mean precipitation (c)(d), all in mm.
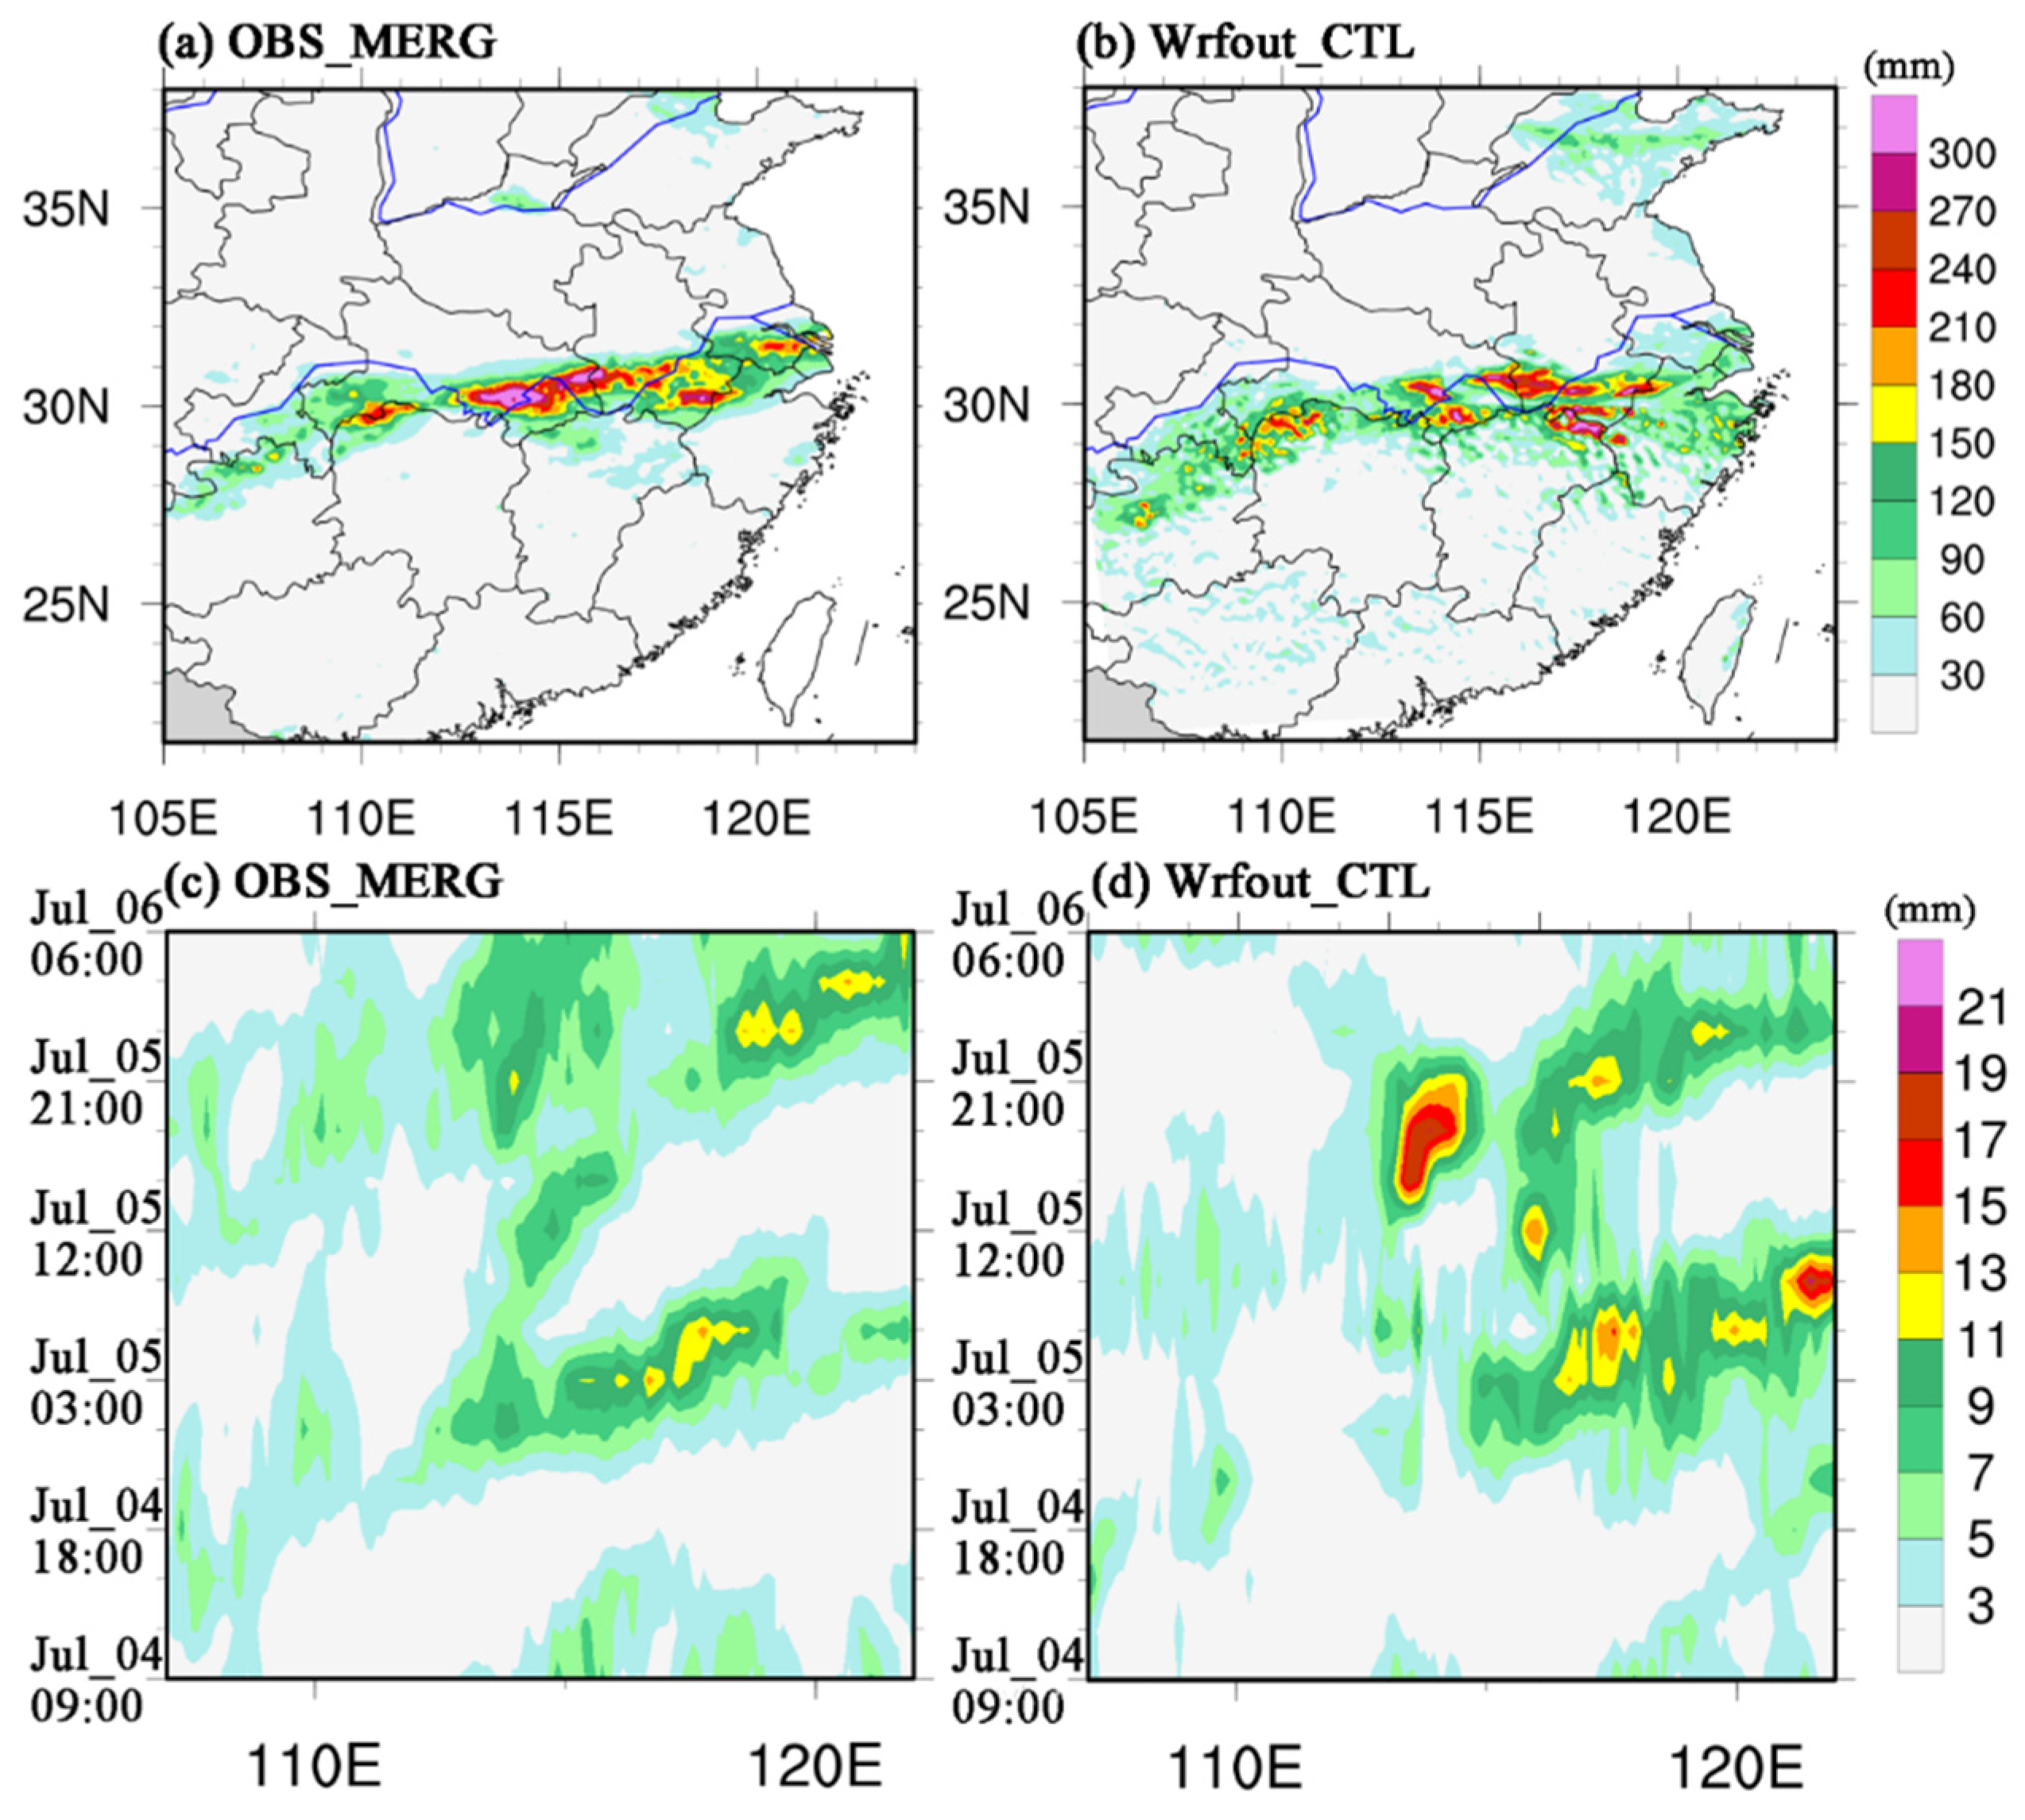
Figure 3.
Temporal evolution of the mean precipitation (in mm) in the simulated domain of the inner grid d02, black lines are observations, and red lines are WRF simulations. The error bars indicate the regional mean standard deviation.
Figure 3.
Temporal evolution of the mean precipitation (in mm) in the simulated domain of the inner grid d02, black lines are observations, and red lines are WRF simulations. The error bars indicate the regional mean standard deviation.
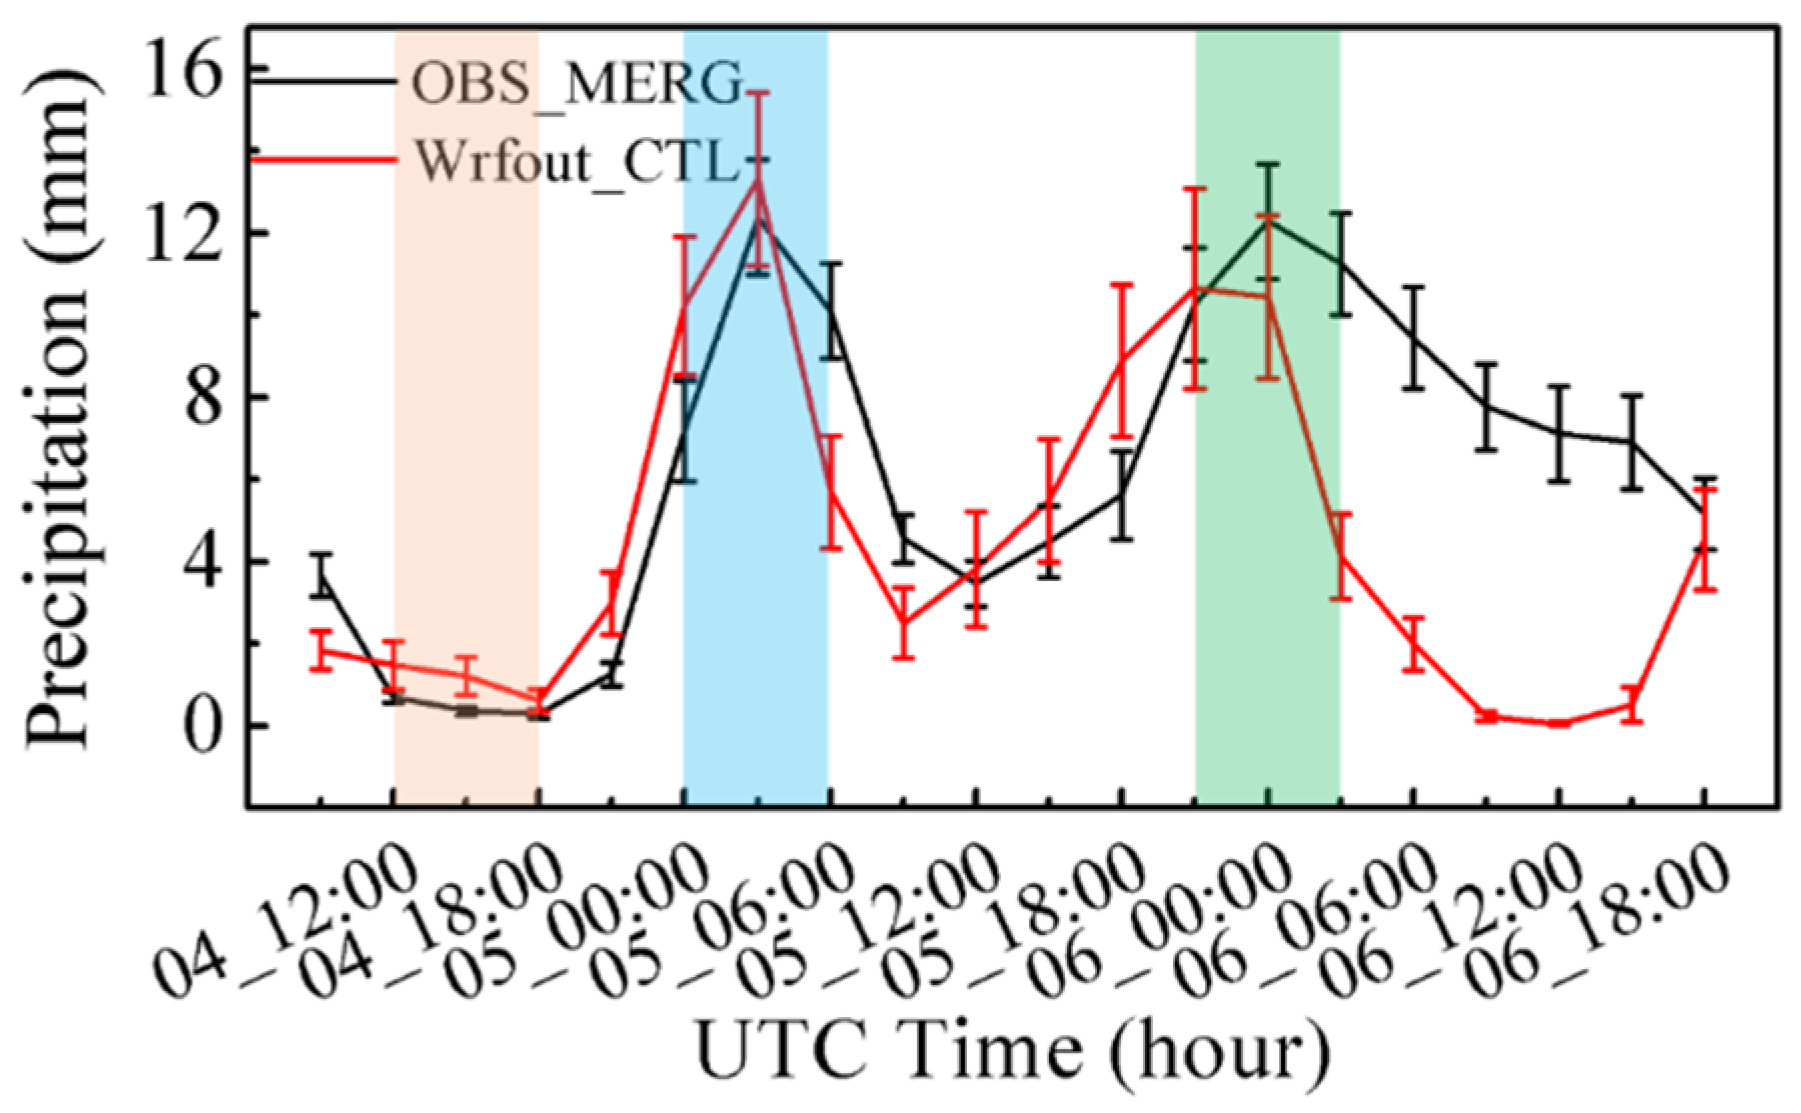
Figure 4.
Temporal evolution of the 850 hPa meteorological field during the two heavy precipitation events, The brown and blue areas are the ranges of equivalent potential temperatures (in K) exceed 355 K and below 345 K, respectively. The contours in the figure are the radar reflectivity (in dBZ), and vectors with arrows indicate the horizontal wind field.
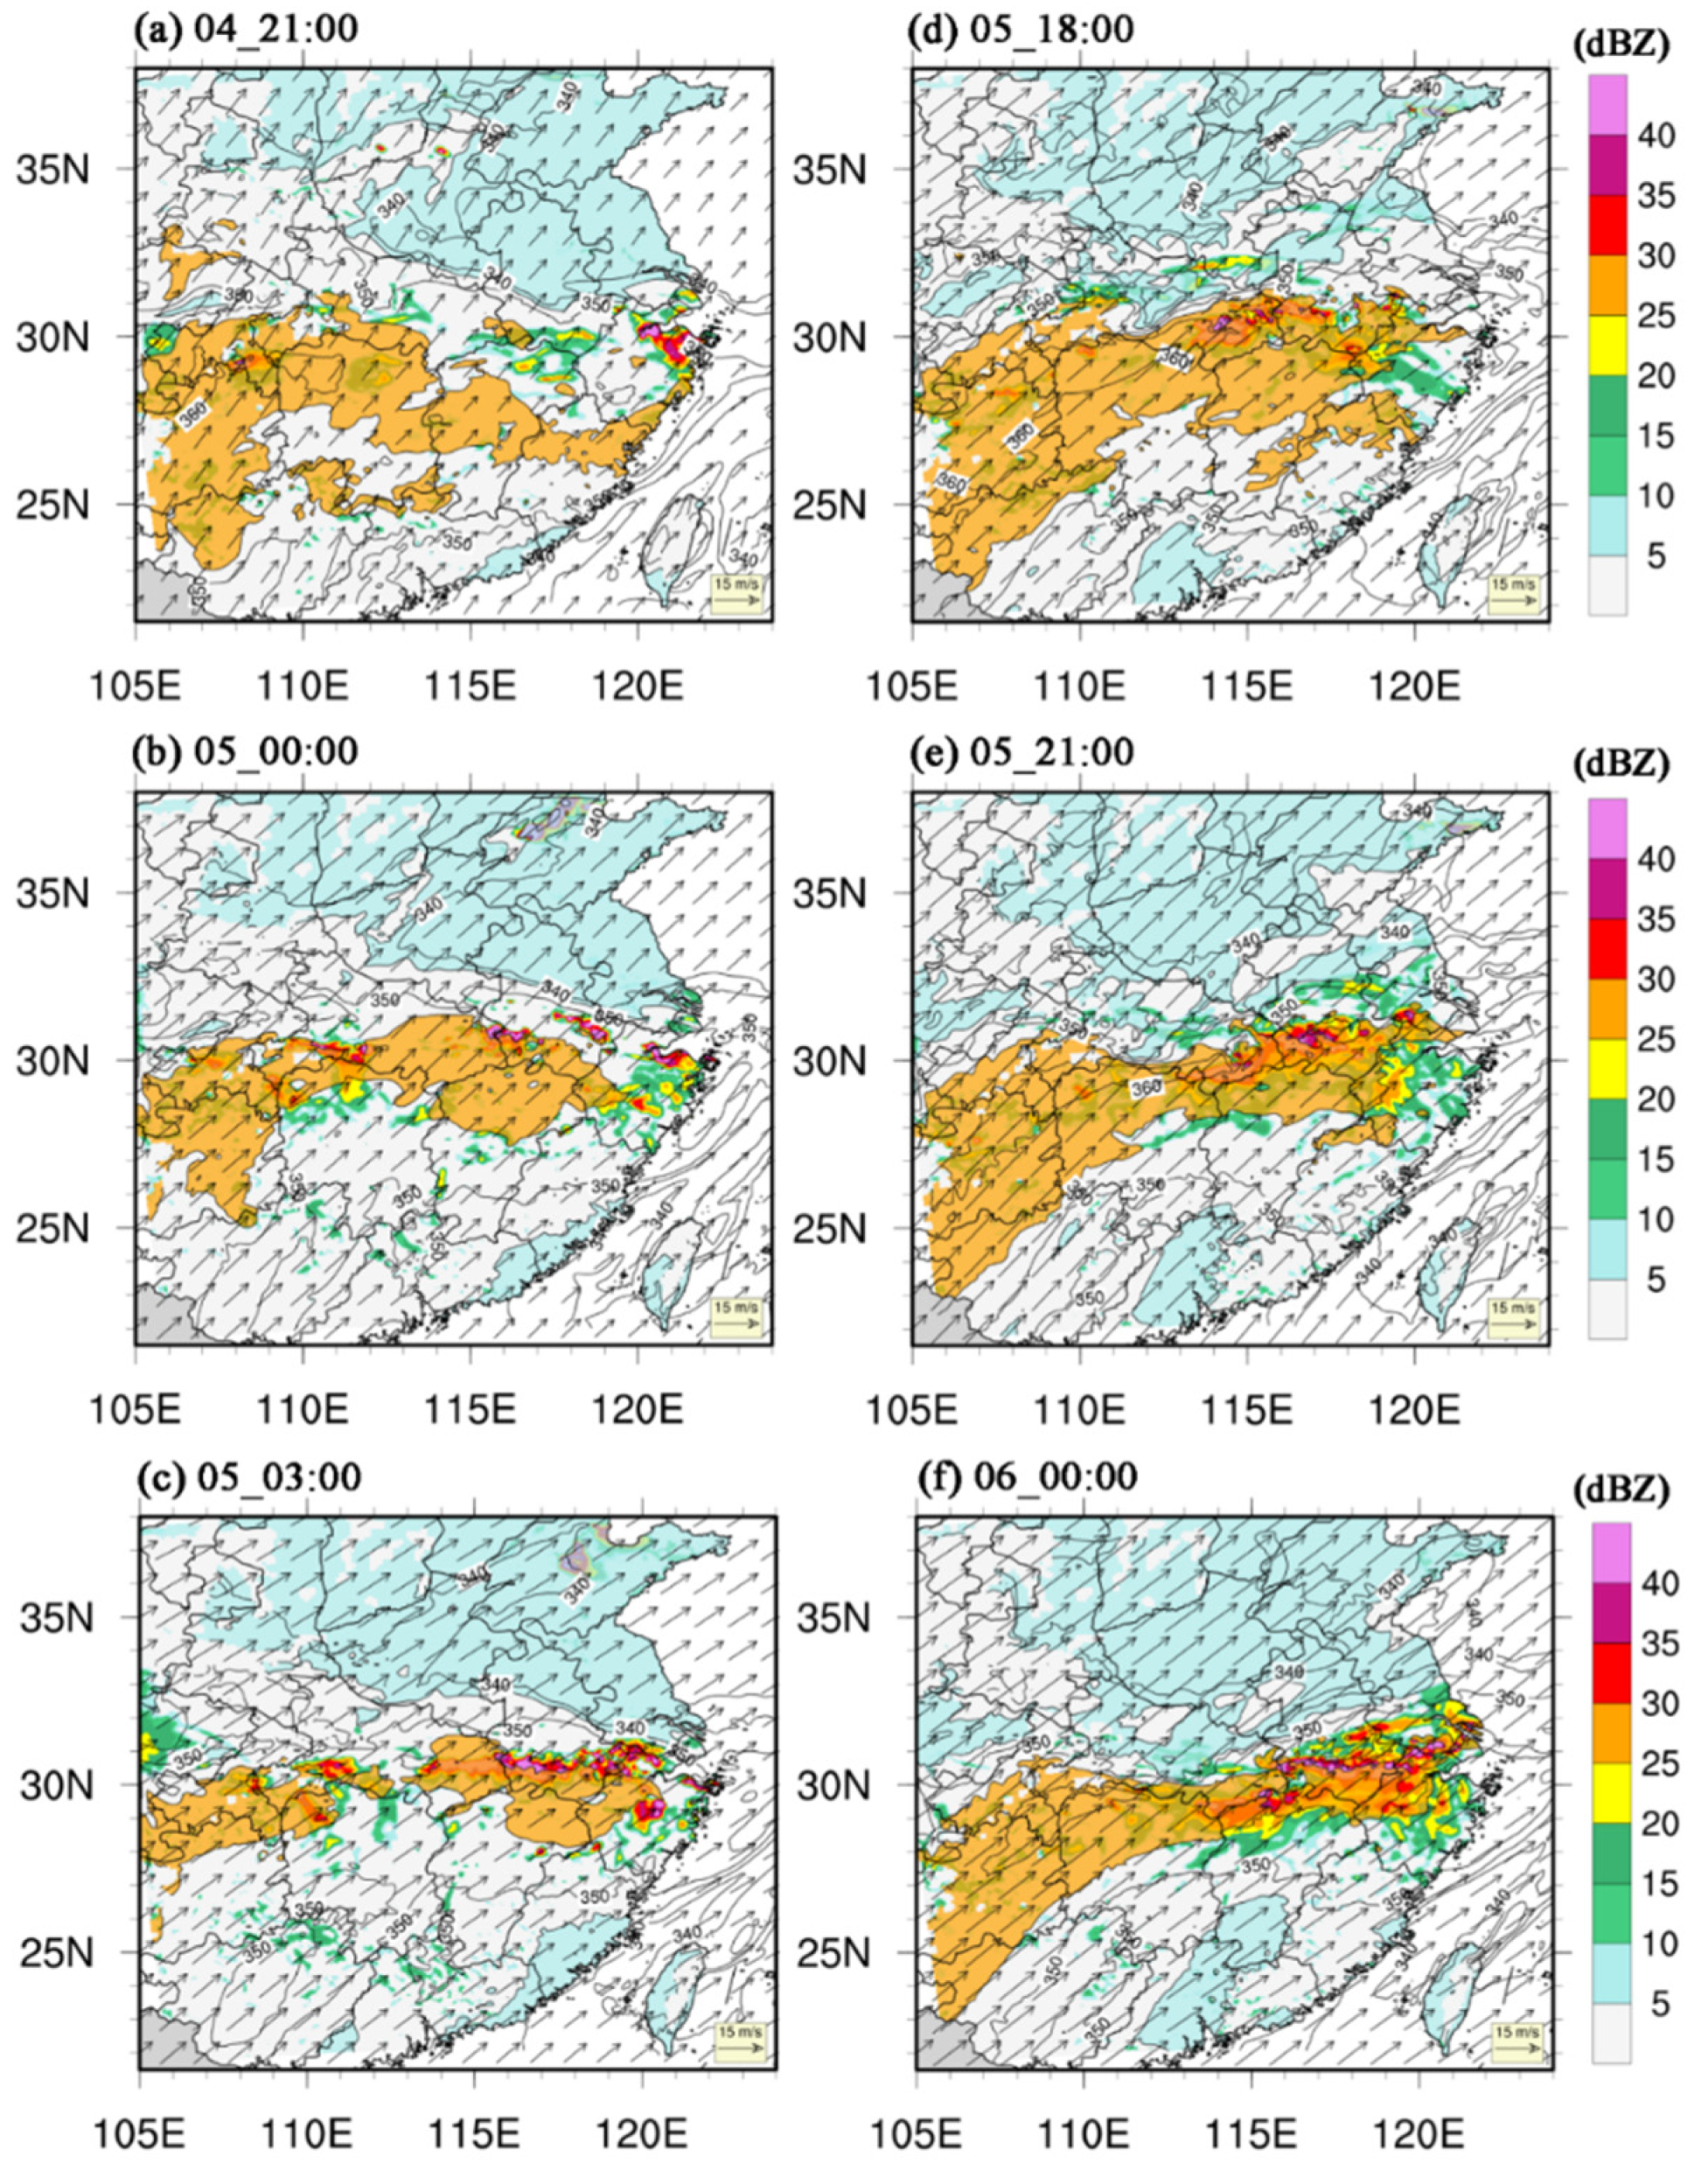
Figure 5.
The evolution of meridional vertical profiles for equivalent potential temperature (in K) depicted by filled colors, and vertical velocity (in m/s) outlined by red contours, along with zonal wind speed (in m/s) indicated by black contours, in relation to the precipitation processes during two distinct precipitation events.
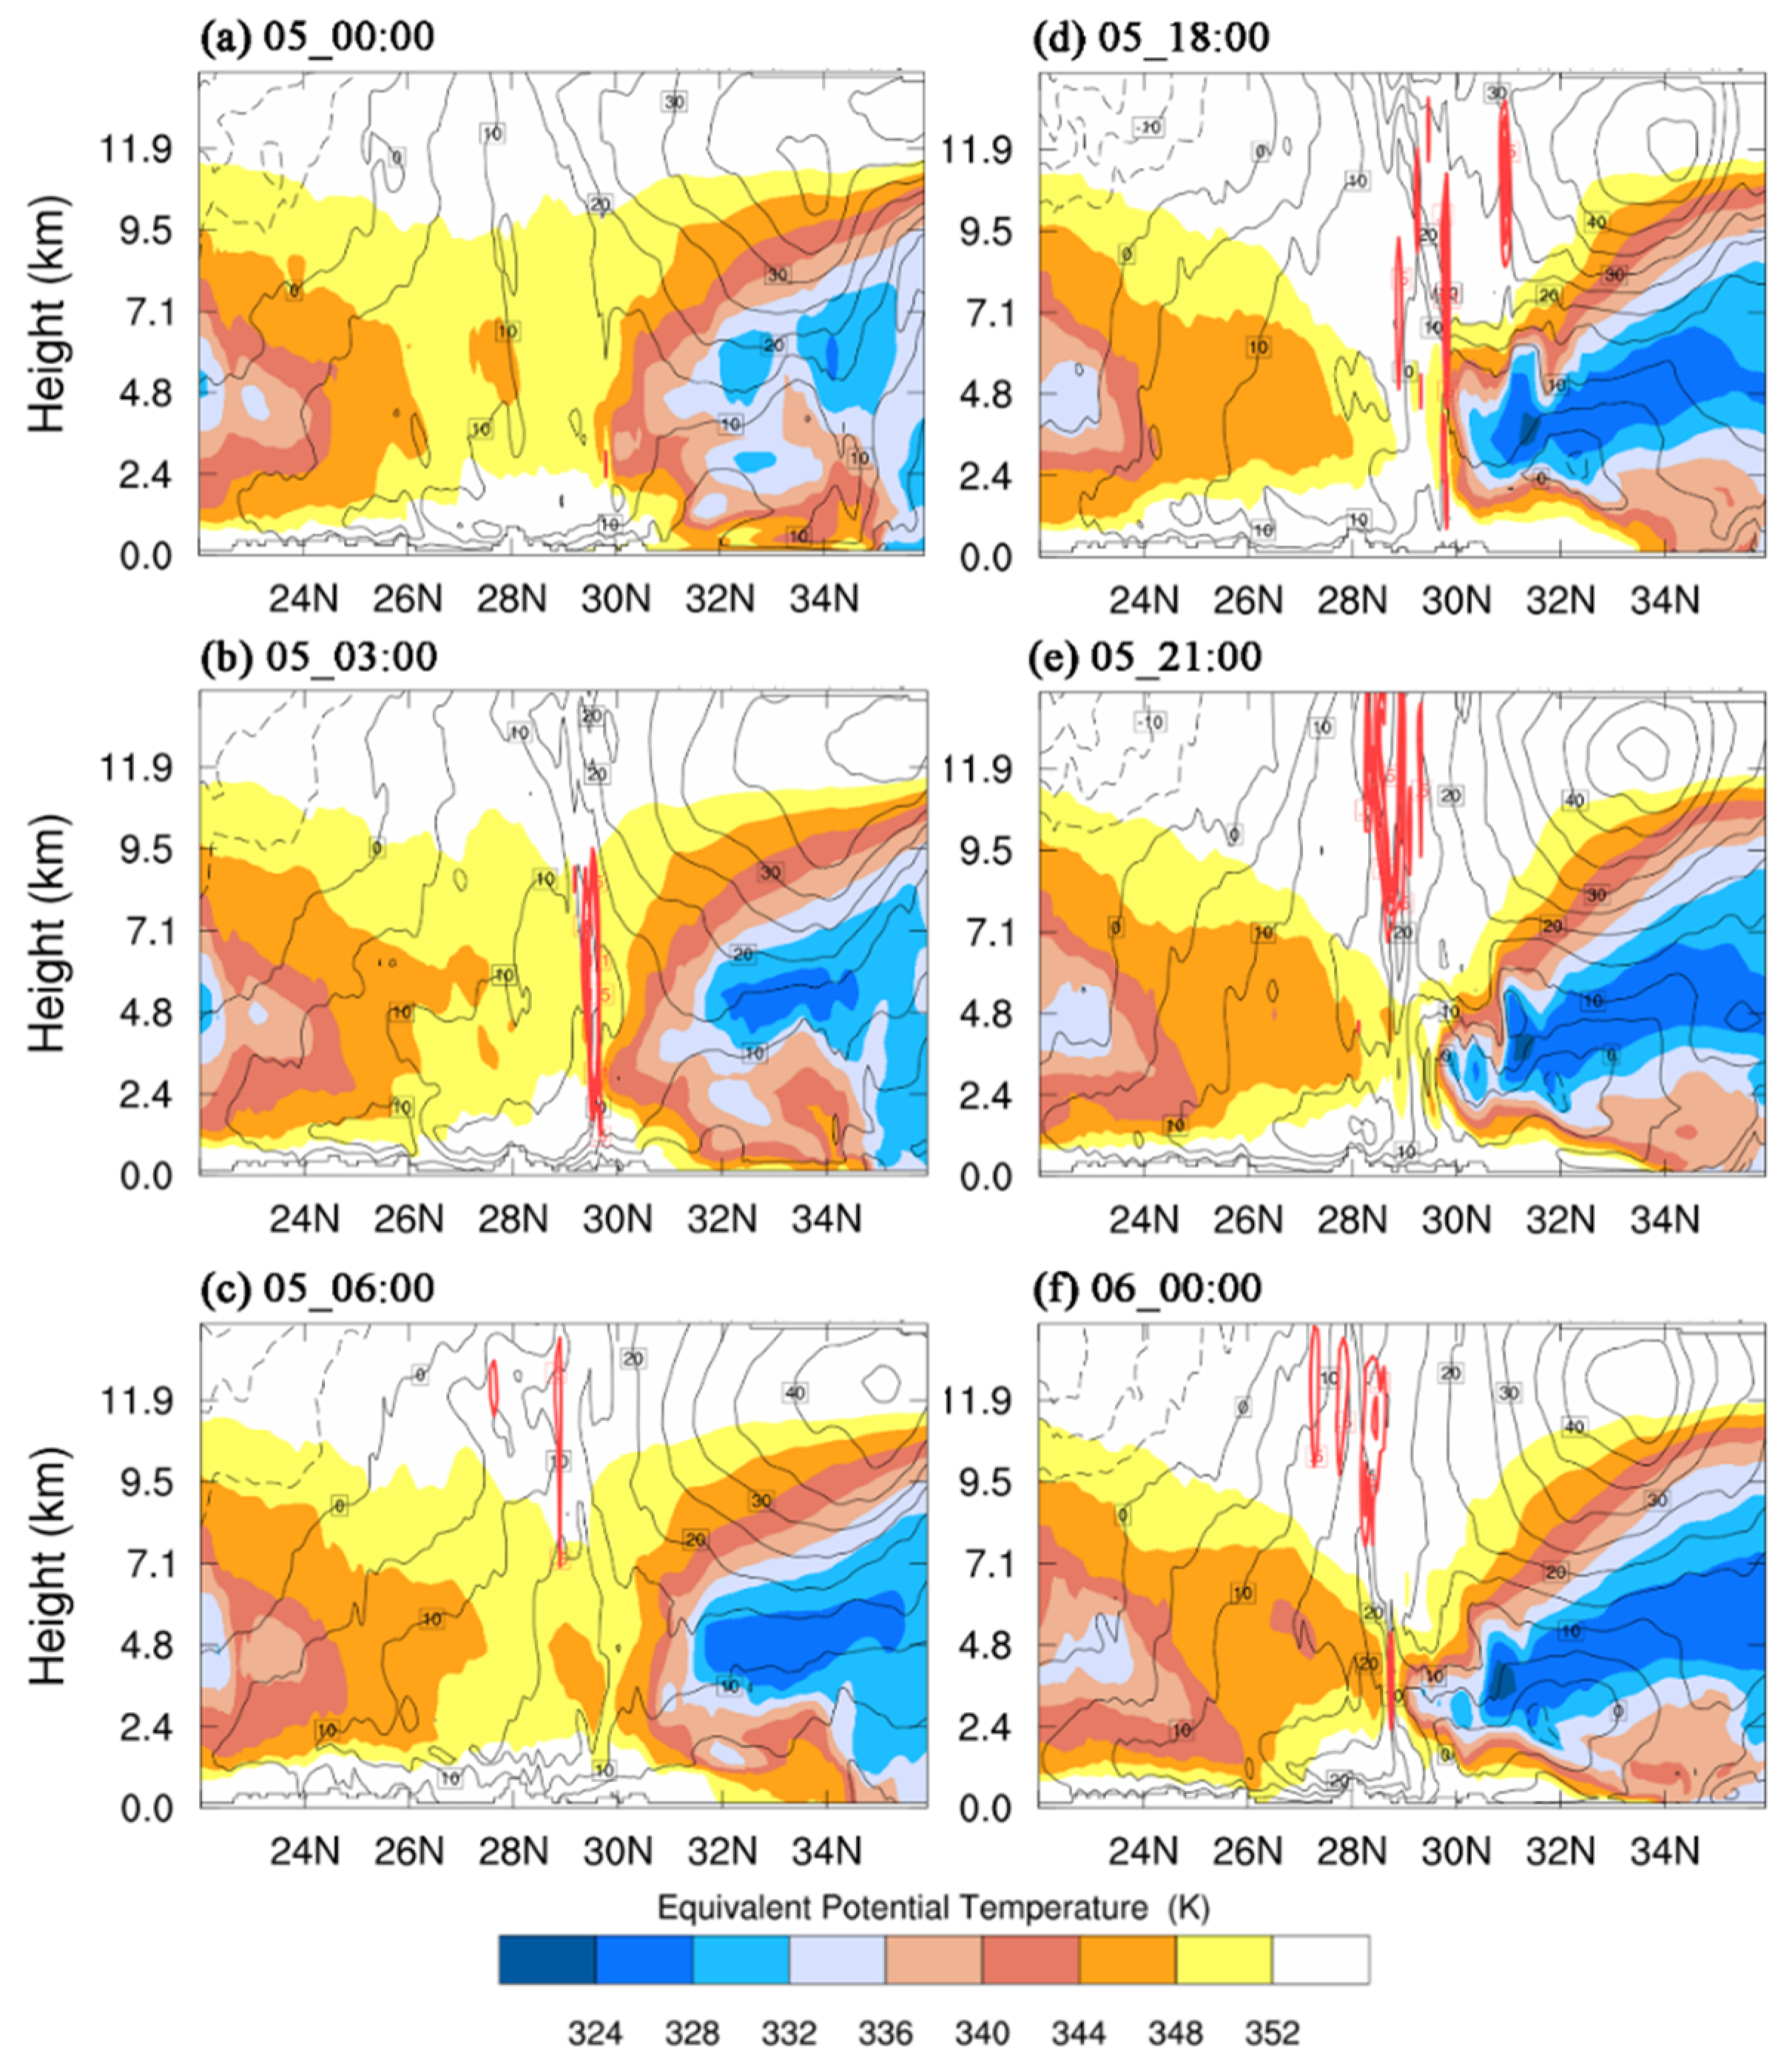
Figure 6.
Temporal evolution of mean precipitation (in mm) (a), CAPE (in J/kg) (b), CIN (in J/kg) (c), LCL (in m) (d) and LFC (in m) (e) in the d02 simulated domain for the three sets of temperature sensitivity tests from July 4˗7.
Figure 6.
Temporal evolution of mean precipitation (in mm) (a), CAPE (in J/kg) (b), CIN (in J/kg) (c), LCL (in m) (d) and LFC (in m) (e) in the d02 simulated domain for the three sets of temperature sensitivity tests from July 4˗7.
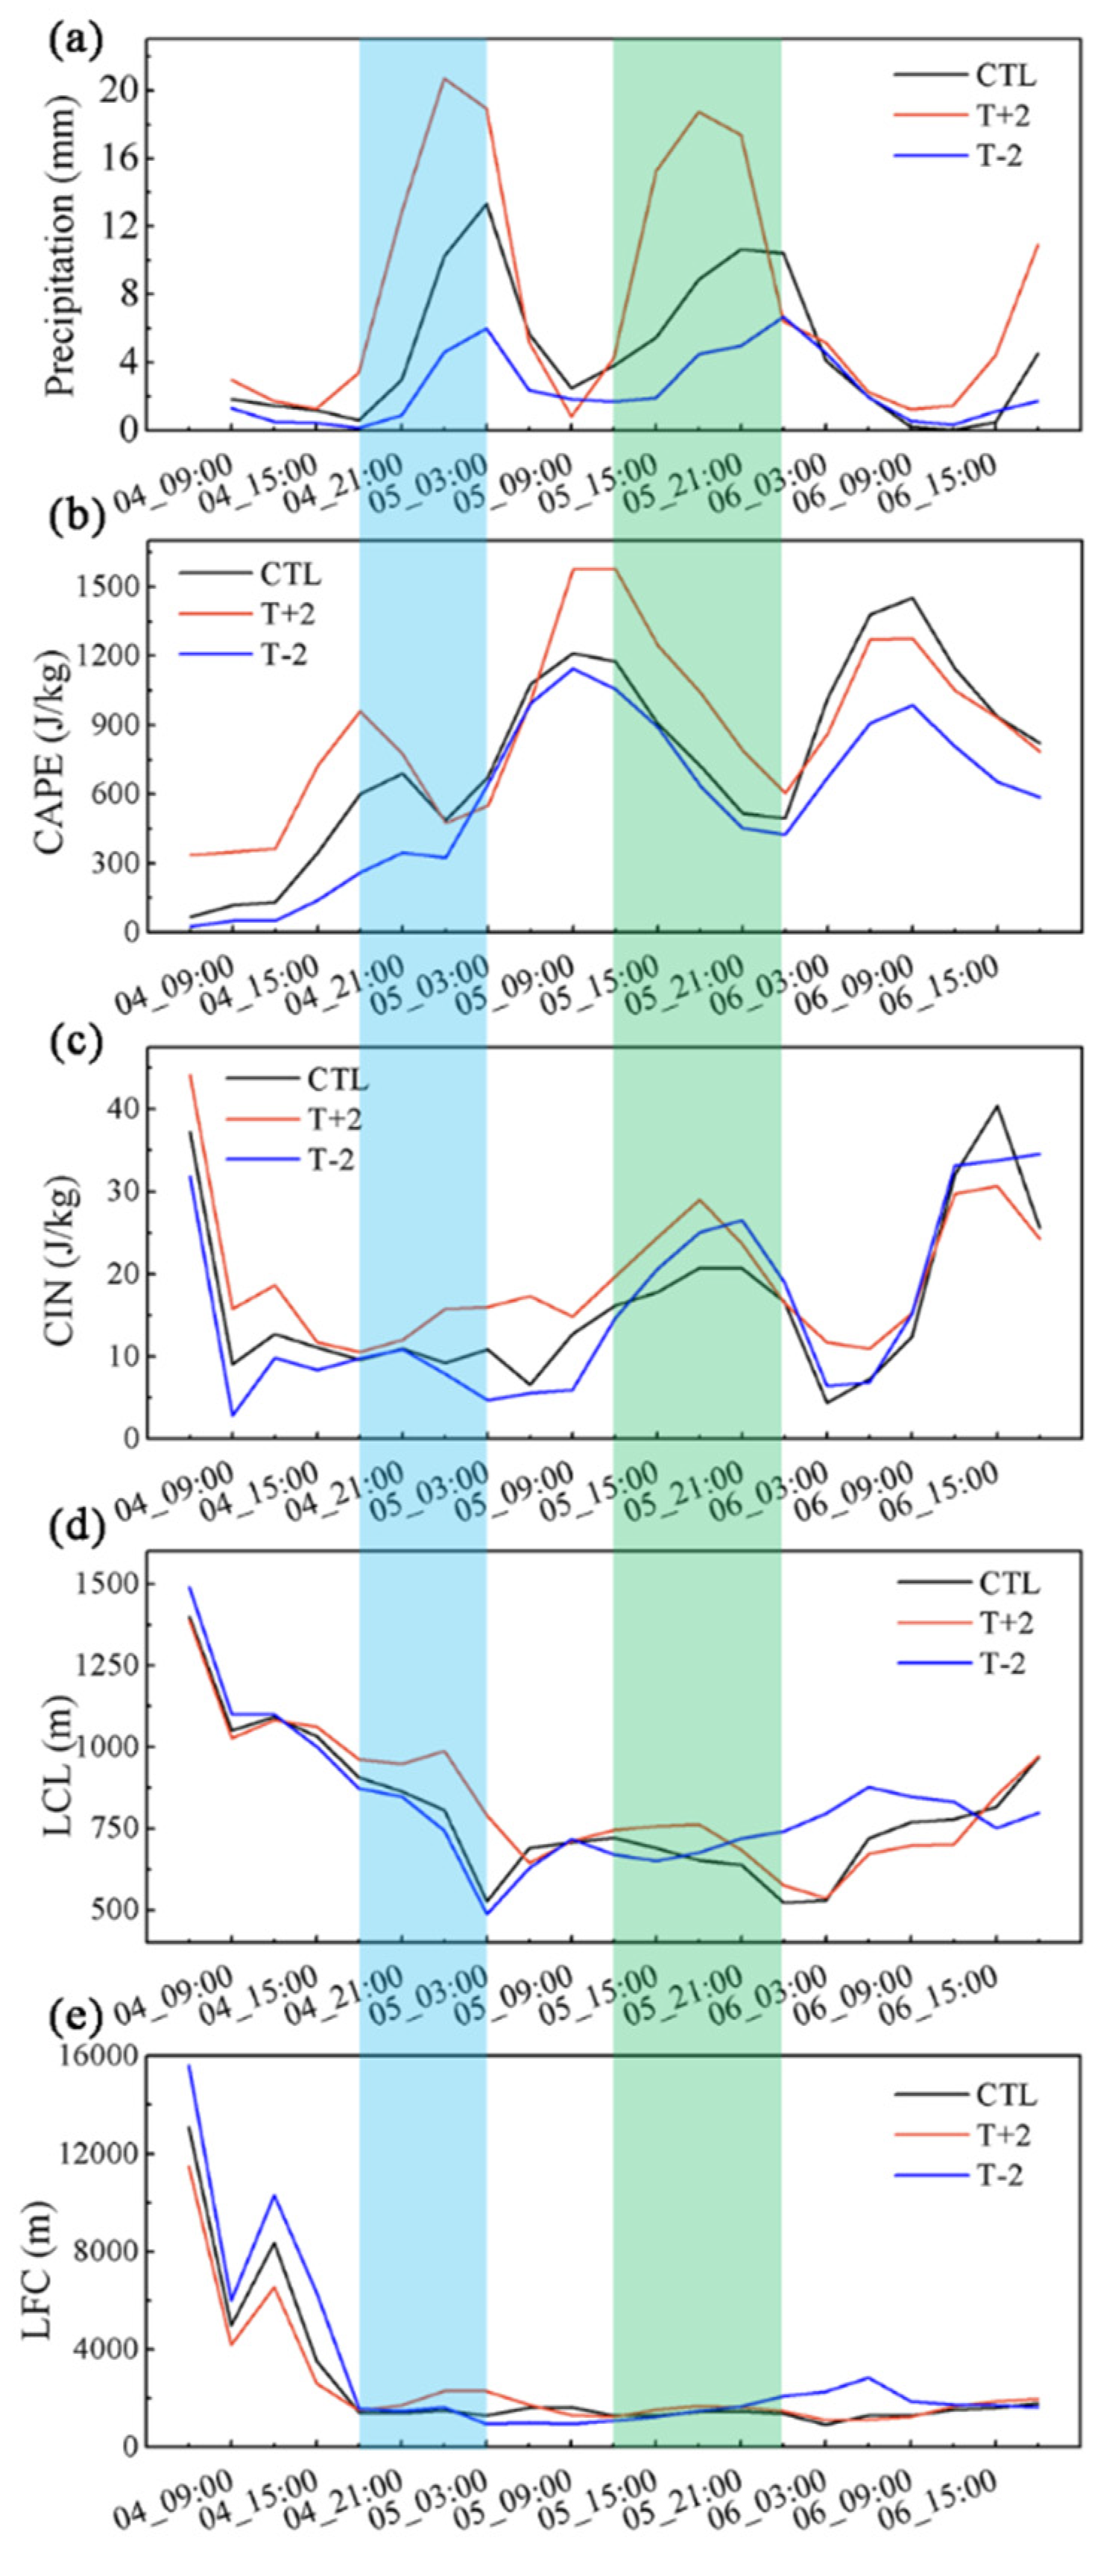
Figure 7.
Temporal evolution of the mean CAPE and CIN vertical profiles in the d02 simulation domain for three sets of temperature sensitivity tests. The filled color represents CAPE, the contour denotes CIN, and the units are all J/kg. The text continues here (Figure 2 and Table 2).
Figure 7.
Temporal evolution of the mean CAPE and CIN vertical profiles in the d02 simulation domain for three sets of temperature sensitivity tests. The filled color represents CAPE, the contour denotes CIN, and the units are all J/kg. The text continues here (Figure 2 and Table 2).
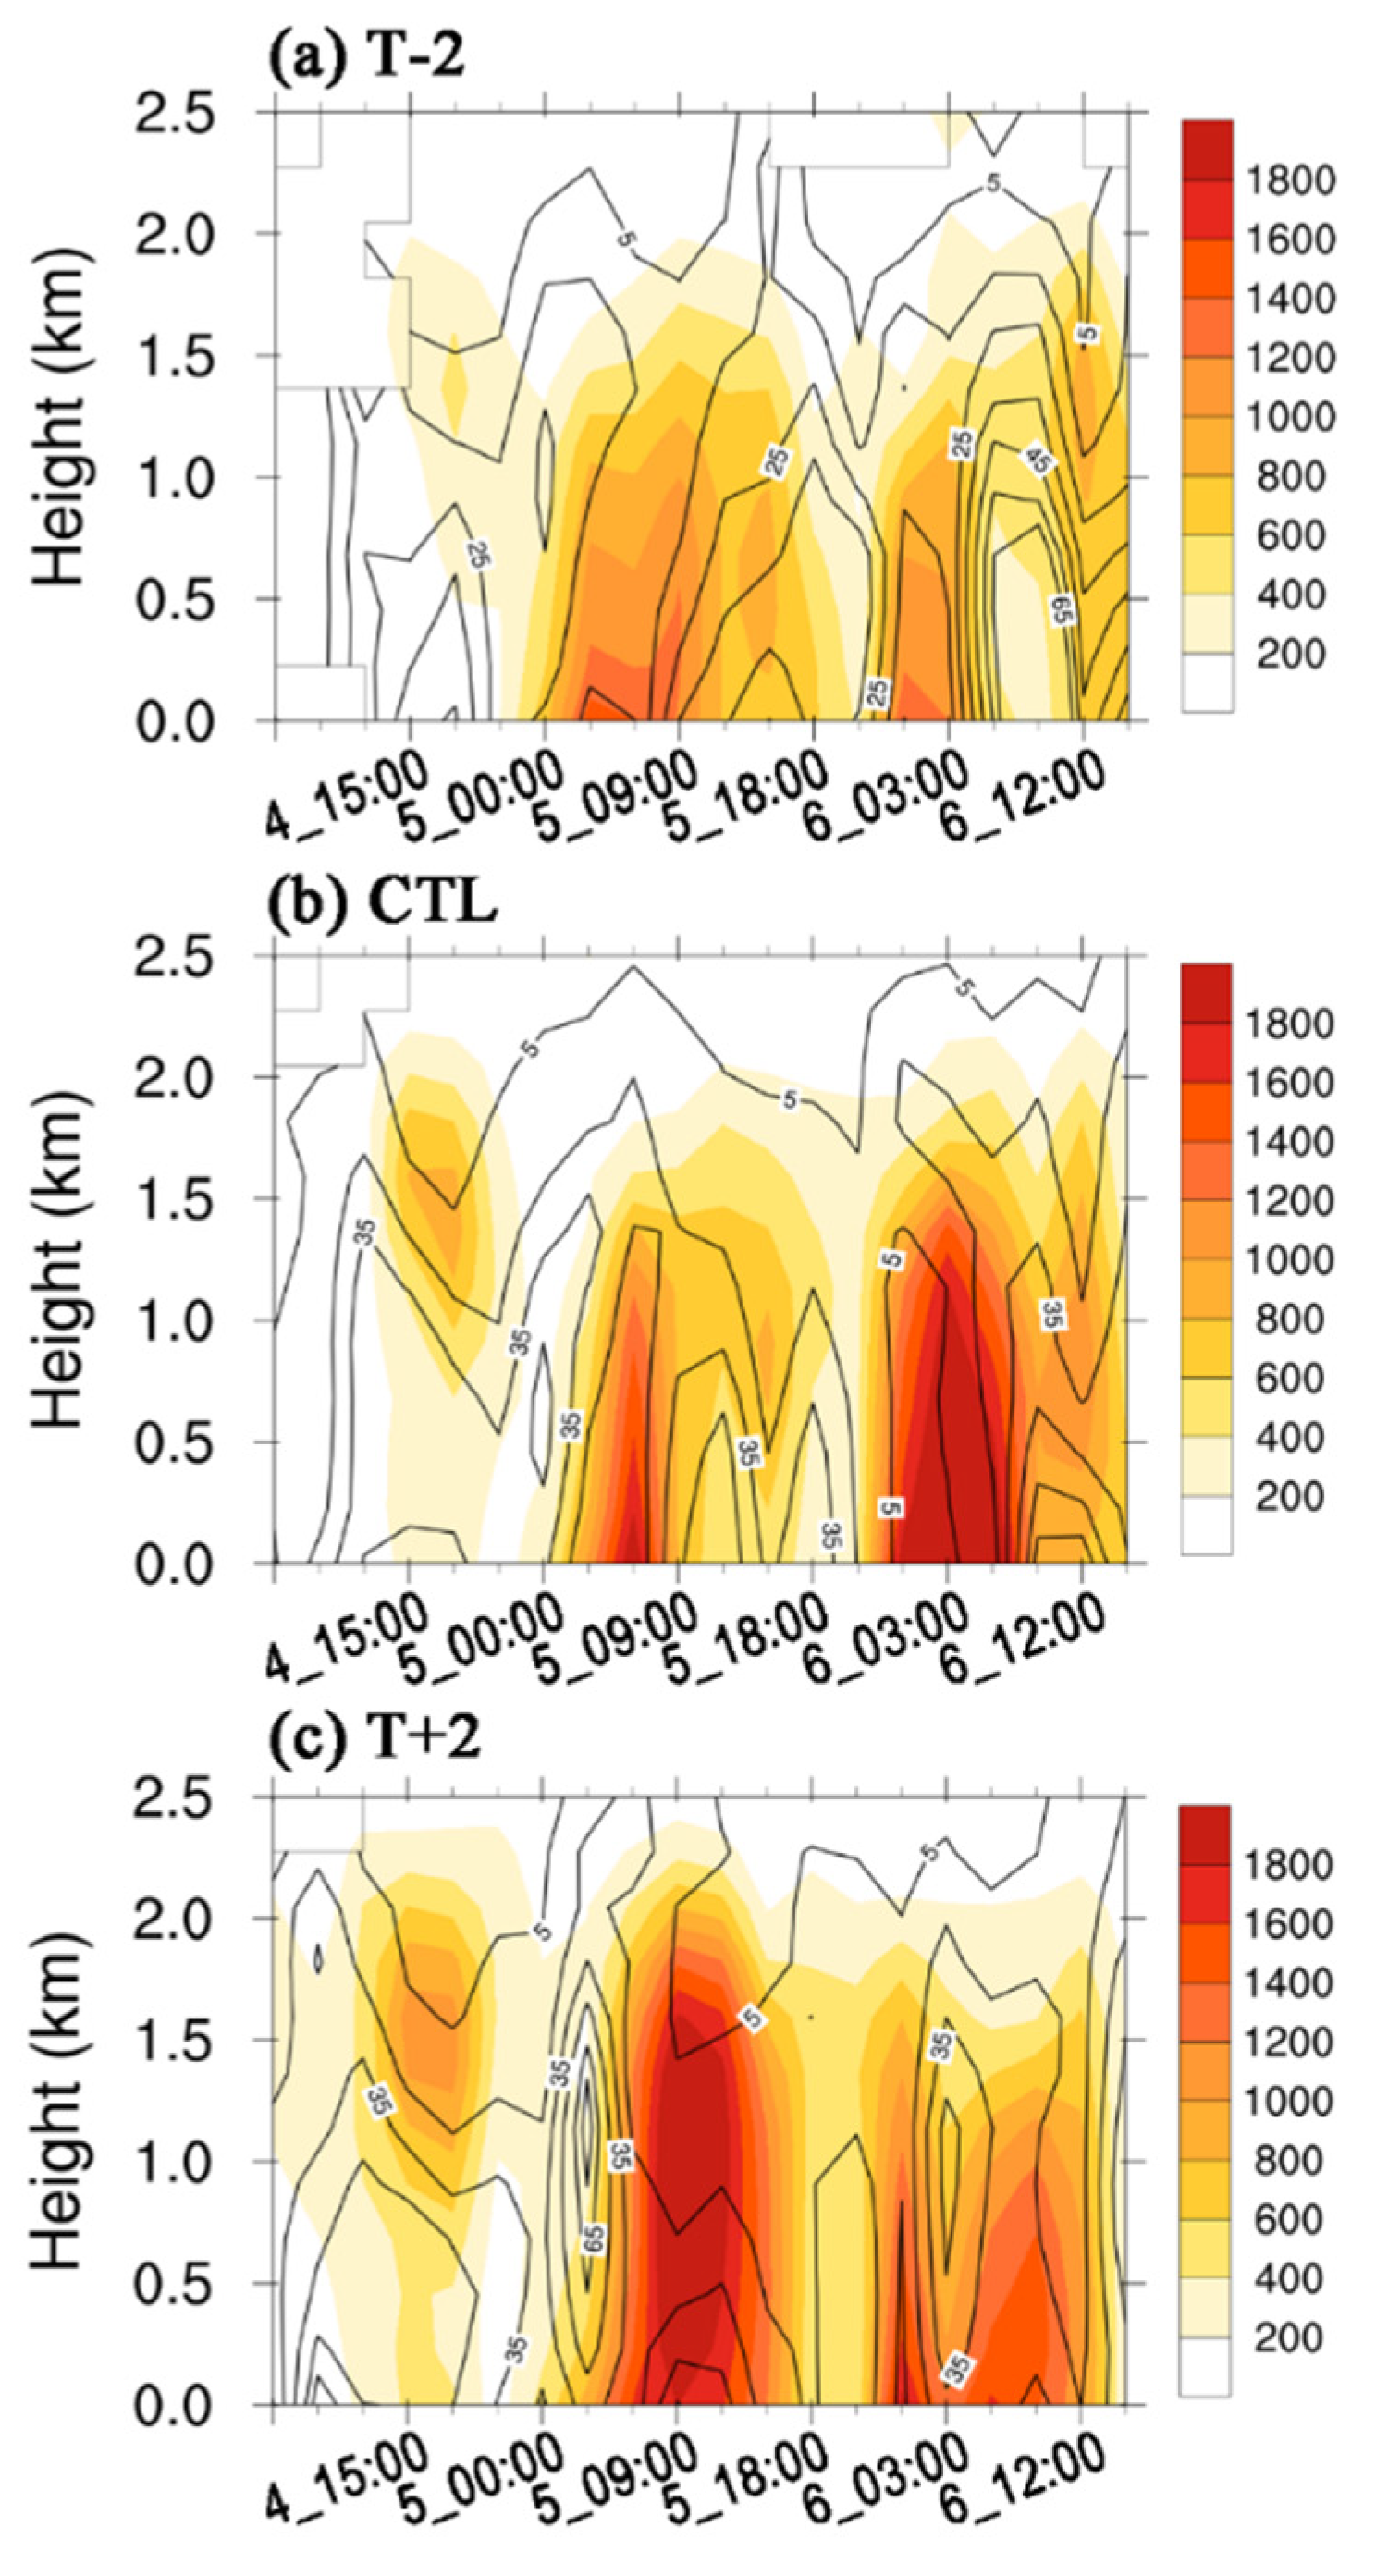
Figure 8.
Same as Figure 5, but for the difference between the warming test and the cooling test (T+2) - (CTL).
Figure 8.
Same as Figure 5, but for the difference between the warming test and the cooling test (T+2) - (CTL).
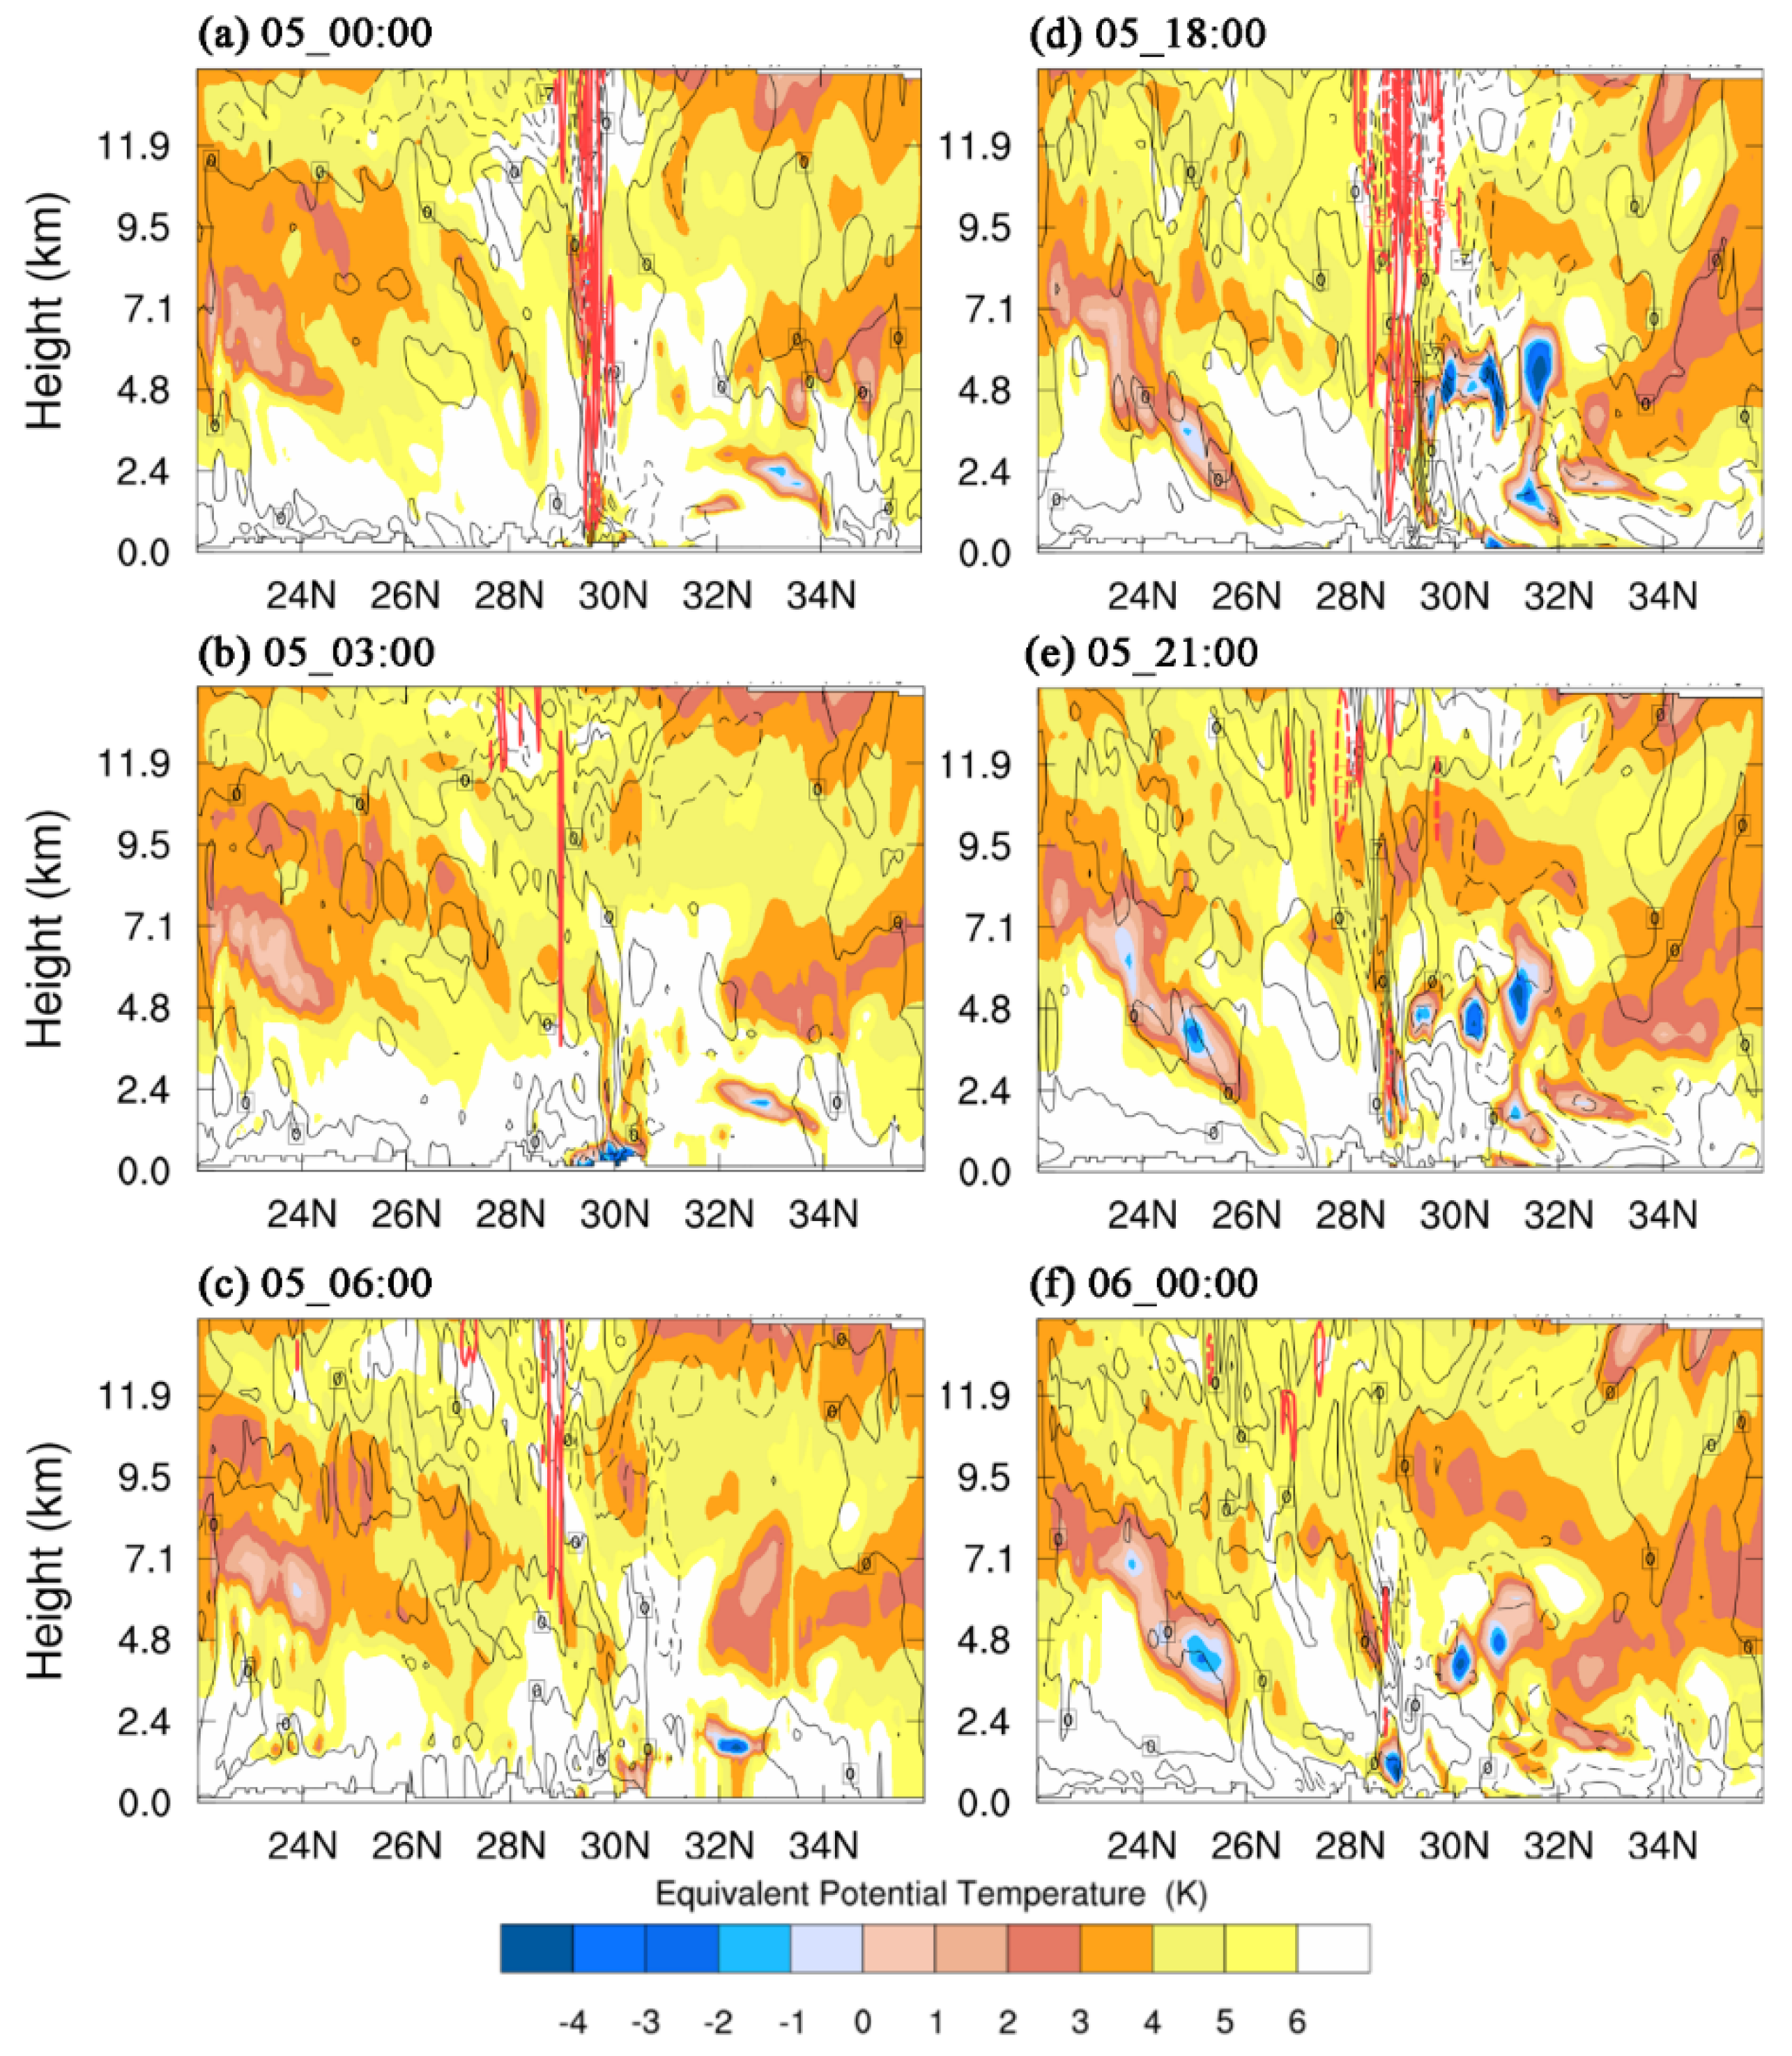
Figure 9.
Boxchart of precipitation (in mm) (a), total water condensate (in g/kg) (b) and precipitation efficiency (in %) (c) with temperature sensitivity tests in the d02 simulation domain during the first precipitation.
Figure 9.
Boxchart of precipitation (in mm) (a), total water condensate (in g/kg) (b) and precipitation efficiency (in %) (c) with temperature sensitivity tests in the d02 simulation domain during the first precipitation.
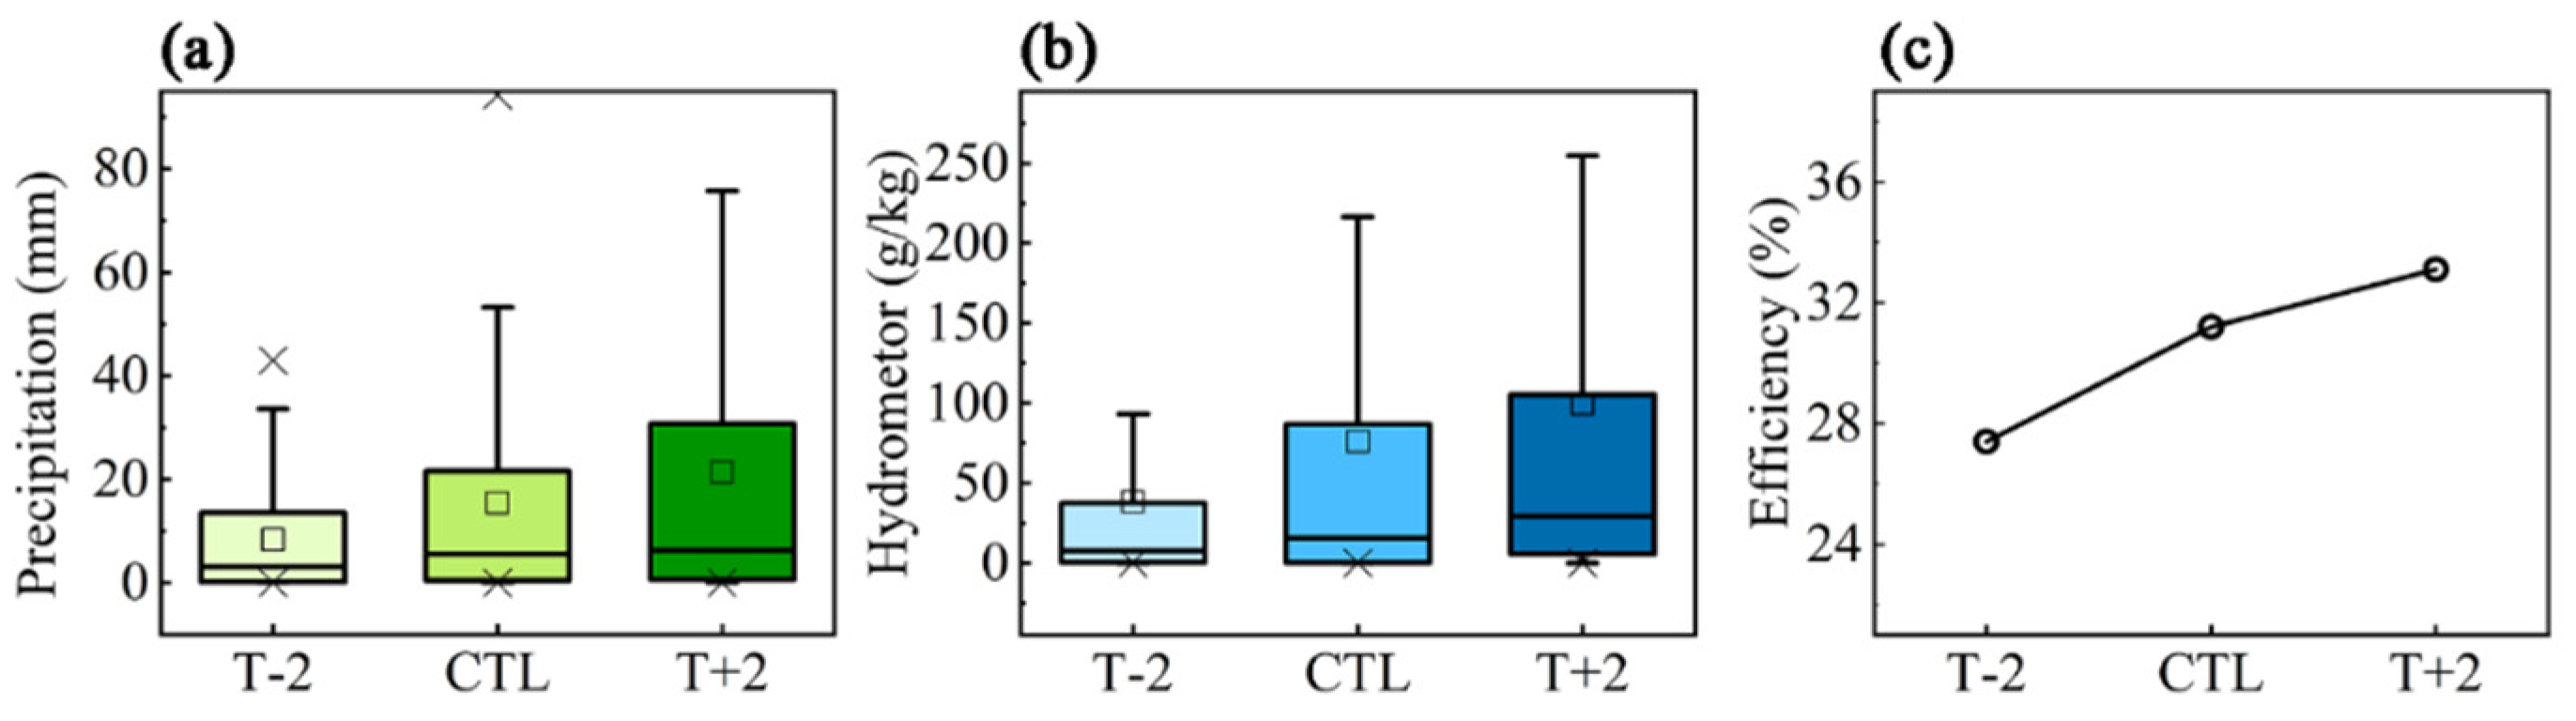
Figure 10.
The boxchart of CAPE (in J/kg) (a), CIN (in J/kg) (b), LTS (in K) (c), UMF (in g/m2/h) (d), LCL (in m) (e) and LFC (in m) (f) with temperature sensitivity test changes in the inner d02 simulation domain.
Figure 10.
The boxchart of CAPE (in J/kg) (a), CIN (in J/kg) (b), LTS (in K) (c), UMF (in g/m2/h) (d), LCL (in m) (e) and LFC (in m) (f) with temperature sensitivity test changes in the inner d02 simulation domain.
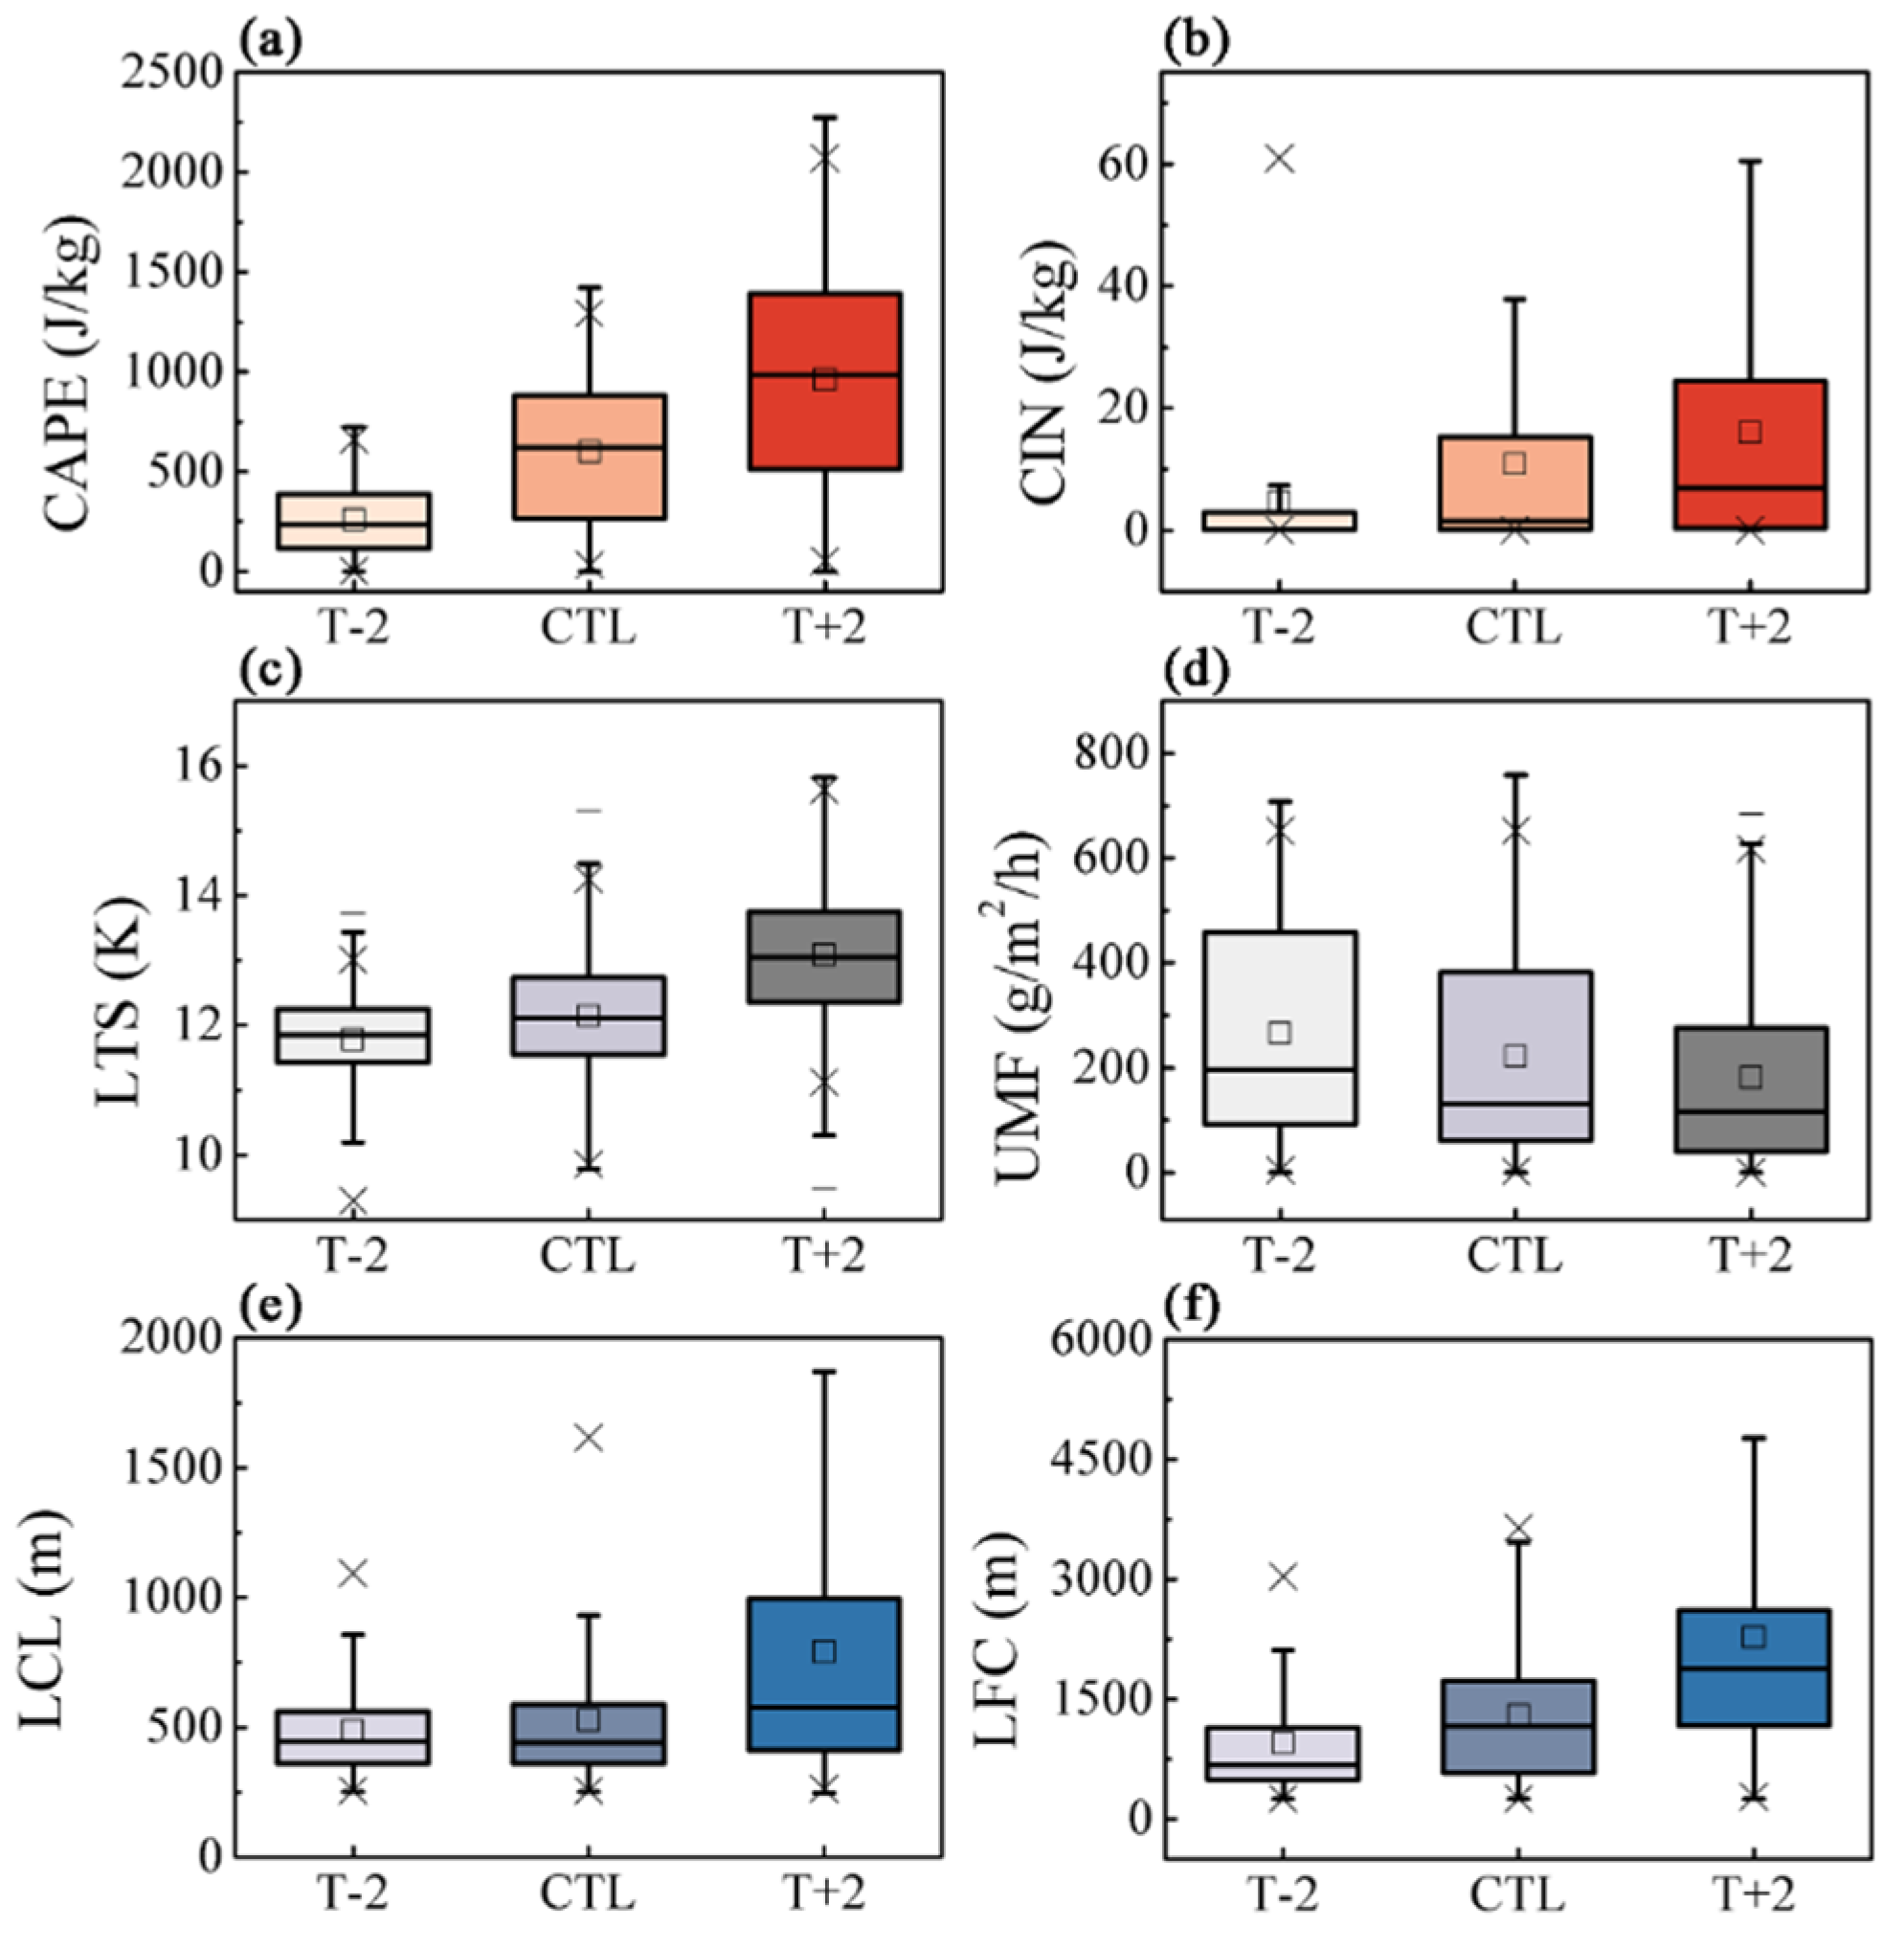

Table 1.
Results of three sets of WRF sensitivity tests.
| P (mm) |
CWP (g/kg) |
PE (%) |
CAPE (J/kg) |
CIN (J/kg) |
LTS (K) |
UMF (g/m2/h) |
LCL (m) |
LFC (m) |
|
|---|---|---|---|---|---|---|---|---|---|
| CTL | 15.46 | 76.01 | 27.43 | 600.40 | 10.86 | 12.15 | 222.05 | 526.76 | 1297.27 |
| T+2 | 21.41 | 99.45 | 31.20 | 960.59 | 16.00 | 13.01 | 181.37 | 790.95 | 2277.22 |
| T-2 | 8.34 | 38.16 | 33.14 | 260.62 | 4.68 | 11.78 | 266.36 | 487.73 | 952.67 |
Disclaimer/Publisher’s Note: The statements, opinions and data contained in all publications are solely those of the individual author(s) and contributor(s) and not of MDPI and/or the editor(s). MDPI and/or the editor(s) disclaim responsibility for any injury to people or property resulting from any ideas, methods, instructions or products referred to in the content. |
© 2024 by the authors. Licensee MDPI, Basel, Switzerland. This article is an open access article distributed under the terms and conditions of the Creative Commons Attribution (CC BY) license (http://creativecommons.org/licenses/by/4.0/).
Copyright: This open access article is published under a Creative Commons CC BY 4.0 license, which permit the free download, distribution, and reuse, provided that the author and preprint are cited in any reuse.


