
Submitted:
02 October 2025
Posted:
03 October 2025
You are already at the latest version
Abstract
Angelman Syndrome (AS) is a neurodevelopmental disorder caused by the deficiency of the UBE3A gene that for a E3 ligase protein part of the ubiquitin-proteasome system (UPS). Autophagy and UPS systems remove abnormal proteins, but any dysfunction in these processes can affect neuronal development and wellbeing. Herein, the involvement of the UPS/autophagy system in the regulation of intracellular signaling pathways related to toxic protein accumulation was investigated in cellular and mice AS models, silenced for UB3A (UB3A-). The main findings are as follows: i)autophagy markers were upregulated in UBE3A- cells respect to control cells; ii)a dysregulation of AKT/mTOR pathway, which is linked to autophagy/synaptic development, was evidenced in cellular and animal models of AS with respect to controls; iii) the ubiquitin ligase MDM2 was downregulated, and the tumor suppressor p53, normally inhibited by MDM2, enhanced its expression and transcriptional activity in UB3A-cells with respect to controls. Finally, UB3A-cells presented a significant alteration in the levels of β-amyloids with respect to control cells, and a reduction of α-synuclein levels, typical of neurodevelopmental disorder. Overall, these data suggest that AS models presented altered signaling pathway related to autophagy/UPS systems, potentially leading to the accumulation of toxic proteins that impact synaptic development.
Keywords:
Angelman Syndrome
; autophagy
; protein accumulation
; ubiquitine-proteasome system
; amyloid proteins
1. Introduction
Angelman Syndrome (AS) is a neurodevelopmental disorders characterized by a set of symptoms such as severe cognitive impairment, epilepsy, sleep disturbances, feeding problems, speech impairments, strabismus, and a particular behavioral phenotype [1]. This phenotype results from different genetic mechanisms involving the chromosomal region 15q11.2–q13, ultimately leading to the loss of function of the maternally inherited ubiquitin-protein ligase E3A (UBE3A). Defects, such as du/triplications, within the maternally-derived AS critical region result in autistic symptomatology, suggesting that the UBE3A gene has a crucial role in brain neurodevelopment [1,2].
The UBE3A gene encodes a ~100 kDa protein that functions as an E3 ligase in the ubiquitin-proteasome system (UPS), and also as a transcriptional regulator, for example as transcriptional co-activator for steroid hormone receptors [3]. The UPS is a large group of proteins responsible for the intracellular degradation in eukaryotic cells [3,4]. Ubiquitin E3 ligases are an important component of UPS, and functions by ligating ubiquitin to its target proteins and thereby regulating their proper (spatially and temporally controlled) localization or degradation [5]. The ubiquitination process is essential for maintaining cellular proteostasis, by regulating proteasomal degradation, selective autophagy, cell signaling, endocytosis, receptor trafficking, DNA damage response, cell cycle control, and programmed cell death [3].
Autophagy maintains cell homeostasis in the nervous system via the degradation of misfolded proteins, elimination of damaged organelles, and regulation of apoptosis and inflammation. Several ubiquitin E3 ligases are involved in autophagy regulation [6]. Studies demonstrate that the loss of UBE3A interferes with pathways involved in the autophagy regulation, such as AMPK-mTOR (mammalian target of rapamycin) and the tumor protein p53 [7]; moreover, between the several UBE3A targets discovered, there are targets related to autophagy, such as Huntingtin-associated protein 1 (HAP), and Ragulator complex subunit p18 [8]. Defective protein metabolism has been recently reported in the brain of AS mice [8], resulting in stalled autophagy and accumulation of proteins [7].Perturbations in the mTOR pathway have been implicated in general in autism spectrum disorders (ASD) and, in particular, UBE3A deficiency has been associated with an increased active p53 levels in the cerebellum of AS mice, finally favoring the induction of autophagy [9].
p53 is a direct UBE3A substrate but needs E6 interaction, so only E6–UBE3A–p53 complex results in ubiquitination and proteasomal degradation of p53 [10], while in the absence of E6, MDM2 is the primary E3 ligase for p53. MDM2 acts by inhibiting the transactivation domains of p53 and targeting p53 toward ubiquitin-mediated degradation [11]. Analyses from a variety of mouse strains demonstrate that inappropriately activating p53 during embryonic and early post-natal development triggers a host of developmental defects. In these mouse strains, p53 hyperactivation has been achieved through mutations in Trp53, the gene encoding p53, or by defects in MDM2 (murine double minute 2), the main negative regulator of p53. In addition, MDM2+/− mice, which have elevated p53 activity due to reduced expression levels of MDM2, die at early postnatal stages and exhibit hematopoietic defects, and cerebellar hypoplasia. Not surprisingly, the MDM2/p53 axis plays a crucial role in several neuronal processes, by modulating neuronal survival, cell cycle (including apoptosis and senescence), and stress responses [12]. Nevertheless, to the best of our knowledge, the deep interaction and functionality of this axis has not been evaluated in AS neuronal models yet.
Under normal circumstances, autophagy and UPS processes collaborate to remove abnormal proteins, but any dysfunction in one of this processes can lead to defects in neuronal development and neuroinflammatory processes [13,14]. In this sense, the accumulation of misfolded proteins has been widely studied in neuronal diseases: proteins that fail to fold properly—likely due to an imbalance in proteostasis—can accumulate both intra- and extracellularly, leading to toxicity, neuroinflammation and neuronal cell death. This phenomenon primarily affects the brain and is a hallmark of several neurological disorders [15,16,17,18]. Interestingly, overexpression of UBE3A promotes degradation of mutant Huntingtin [19] via UPS. UBE3A was also reported to promote the proteasomal degradation of misfolded polyglutamine and Hsp70-bound proteins [20,21]. However, so far, there is no investigation on the misfolded proteins in AS, in the literature.
On this basis, the objective of our study was to dissect the involvement of the ubiquitin-proteasome/autophagy system in the regulation of intracellular signaling pathways related to misfolded protein accumulation in AS neuronal cells. UBE3A-silenced SH-SY5Y neuroblastoma cells represent an optimal in vitro cellular model for AS, already used and demonstrated [22,23]. Here, AS neuronal SH-SY5Y cell and murine models (UBE3A m-/p+) [24] were employed to dissect the autophagy process and the related signaling pathways (i.e., AKT-mTOR, p53), the functionality of the MDM2-p53 axis and the accumulation of misfolded proteins.
2. Results
2.1. Involvement of the Autophagy System in the AS Model
We investigated the autophagy process in wild-type (WT) and UBE3A-silenced (AS model; from now on UBE3A-) SH-SY5Y neuroblastoma cells. A western blot analysis was performed in SH-SY5Y cells to verify the expression of key proteins involved in autophagy (i.e, LC3β and p62) under UBE3A silencing. Both p62 (Figure 1A-B) and LC3β (Figure 1C-D) were upregulated in UBE3A- cells in respect to control cells. Similar results were obtained in lysates from AS adult mice (Supplementary Figure 1.).
Next, the expression of the phosphoinositide 3-kinase (PI3K)/protein kinase B (AKT)/mammalian target of rapamycin (mTOR) pathway was examined by immunoassays, as critical regulators of autophagy. The level of active mTOR (activated mTOR/ total mTOR) resulted significantly augmented in UBE3A- cells (Figure 1E). In contrast, the ratio between activated AKT/total AKT was significantly diminished in AS cells with respect to control cells (Figure 1F). Similar results were obtained by determining AKT/ mTOR) pathway in cortex of mice UBE3A-, when compared to WT animals (Supplementary Fig. 1A and B). Overall, these data suggest the presence of a dysregulation of AKT/mTOR pathway and in the autophagy process in AS neuronal cells.
2.2. Involvement of the UPS in the AS Model
Subsequent, UPS was investigated by assessing expression and functionality of the MDM2-p53 axis. The results showed that the ubiquitin ligase MDM2 was down regulated in UBE3A- SH-SY5Y cells (Figure 2A- B). We next investigated the contribute of the tumor suppressor p53, which is normally inhibited by MDM2 by a direct interaction [25]. As depicted in Figure 2 C, the amount of MDM2 linked to p53 protein was also significantly diminished in UBE3A- cells. Similar results were obtained by measuring the MDM2-p53 complex in the cortex of AS mice (Supplementary Figure 1C).
Moreover, the expression of the total levels of p53 was increased in UBE3A- cells (Figure 3 A- B), and accordingly, the levels of phosphorylated p53 (i.e, the active form of the oncoprotein) was significantly augmented in UBE3A- cells (Figure 3C- D).
Consistent with these data, we found that the transcriptional activity of p53 was augmented in UBE3A- cells; in particular, the mRNA levels of p53-target genes (i.e., p21, MDM2 and PUMA) were significantly enhanced in UBE3A- cells (Figure 3E) in respect to those in control cells. Overall, we found an increase in the total levels and in the activity of p53 and a decrease in the quote of p53 bound to its negative regulator MDM2 in AS neuronal cells. These data suggest the presence of an enhancement in p53 expression and activation in UBE3A- neuronal cells.
2.3. Misfolded Protein Accumulation in the AS Models
Dysfuctions in autophagy and UPS systems can lead to the accumulation of proteins (misfolded and non), mainly related to neuroinflammatory processes.
In our hands, cells deficient for UBE3A presented significantly lower level of the shorter form of Amyloid-β (Aβ) protein (i.e., Aβ 1-40) and higher levels of Aβ 1-42 , with respect to control cells (Figure 4A-B). Similar results were also evidenced in cortexes of adult AS mice with respect to their WT littermates (Supplementary Figure 2A-B). In contrast, oligomeric α-synuclein (α-syn) levels were significantly reduced in both UBE3A- SH-SY5Y cells and murine AS cortex lysates (Figure 4C and Supplementary Figure 2C). Finally, similar tau levels were evidenced in control and UBE3A- samples, both in SH-SY5Y cells (Figure 4D) and murine brain cortex (Supplementary Figure 2D). Overall, these data indicate the presence of different levels and processing of misfolded proteins in UBE3A- neuronal cells.
3. Discussion
In the present study, we showed that the loss of UBE3A in neuronal cells is associated with alterations in autophagy process and in the ubiquitin proteasome system, leading to the accumulation of proteins related to neuroinflammation and neuronal impairment. In particular, the main findings are as follows: i) autophagy markers (p62 and LC3β) are upregulated in UBE3A- cells in respect to control cells; ii) a dysregulation of AKT/mTOR pathway is present in both AS neuronal cell and murine cortex samples; iii) the tumor suppressor protein p53 is significantly enhanced in terms of expression and transcriptional activity in UBE3A- cells, and in parallel the ubiquitin ligase MDM2, which normally degrades it by a direct interaction, is down regulated in UBE3A- cells; iv) AS neuronal cells present a significant alteration in the ratio levels of Amyloid-β (Aβ 1-40/Aβ 1-42) with respect to control cells, as well as a significant reduction of α-syn levels, thus evidencing an accumulation of toxic proteins related to neuroinflammation processes.
Collectively, these data lead us to propose that UBE3A loss in AS neuronal cells induces an alteration in the autophagy and UPS system signaling pathways, thus leading to the accumulation of toxic proteins that in turn could impact neuronal functioning and also synaptic development.
UBE3A is a critical player of UPS, which involved in neuronal morphological maturation, development, and synaptic plasticity[25,26,27], and also in the regulation of autophagy.
We found LC3β and p62upregulated in UBE3A- cells. Consistently, literature has evidenced that UBE3A deficiency is associated to dysregulated autophagy in cerebellar Purkinje cells [7] and in the hippocampus of AS mice [28]. In general, in AS a deregulated, likely increased, autophagy is reported [7], in agreement with our results.
In our hands, an enhancement in mTOR activation and a significant diminishment in the activation of AKT were evidenced in both AS neuronal cells and mouse cortex, thus suggesting a dysregulation of AKT/mTOR pathway, which is in turn a critical regulator of autophagy [29]. Similarly, other studies have revealed that mTOR signaling is abnormal in the hippocampus [30] and in the cerebellum of the AS mouse model [31]; in particular, the authors have shown an intriguing imbalance in the activation of mTOR complexes, with mTORC1 overactivated and mTORC2 underactivated (with the former controlling protein synthesis and cell proliferation, and the latter regulating cytoskeleton remodeling and cell survival) [32]. Consistently, mTORC1 inhibition or mTORC2 activation, with the consequent reactivation of AKT signaling, has been shown to improve hippocampal synaptic plasticity and learning in AS mice [30]. Our results show an increase in mTOR phosphorylation and reduced AKT activation , as in [31]. The increased activated mTOR levels in our results could be involved, at different levels, in mTORC1 or in mTORC2 signalling, thus leading to different effects on autophagy and crosstalking in different ways with AKT, and in line with the reported imbalance between mTORC1 and mTORC2 activity. The involvement of other pathways, upstream of mTORC1-2 or AKT, cannot be excluded. The reduced AKT activation is in agreement with the presence of a dysregulation, likely overactivation, of autophagy [31]. To further increase the complexity of this intracellular landscape, AKT also activates by phosphorylation MDM2, therefore the reduced levels of active AKT can also explain the reduced activity of MD2M on p53 [33]. Moreover, p53 activity itself can exert a negative feedback loop on AKT activation [34].
Both UBE3A and MDM2 has been shown to function as an E3 ligase in the UPS, for example targeting p53,, regulating proteastasis in physiological and pathological conditions [25]. Herein, MDM2 was down regulated in UBE3A- SH-SY5Y cells and we also found a significant decrement in the quote of MDM2 interacting with p53 level. [25]. Consistently, the expression of total and activated p53 was enhanced in AS neuronal cells. Our results demonstrate that UBE3A deficiency is associated with the increase of total p53, as already reported [22,24], and with the decrease in the quote of p53 bound to its negative regulator MDM2. Moreover, the transcriptional activity of p53 was augmented in UBE3A-silenced neuronal cells, overall confirming an enhancement of p53 expression and activation in UBE3A- cells. In supporting our findings, literature has reported that UBE3A deficiency-induced autophagy is associated with activation of p53 pathway [9]. Generally, p53 and can be involved in the impairment of neuronal differentiation/survival and synaptic development that is evidenced in AS [35]. In this sense, the activation of p53-dependent apoptosis has been demonstrated to impede the growth of the embryonic cerebral cortex in an Autism Spectrum Disorder mouse model [36].
Dysregulations in autophagy and UPS processes in proteoastais can lead to defects of neuronal development and neuroinflammatory processes [14,37].In our hands, AS SH-SY5Y cells and murine cortexpresented significantly higher levels of Aβ 1-42, the most toxic and aggregant Aβ form, with respect to the respective control samples; in parallel, AS samples showed lower level of the shorter Aβ 1-40 form. Interestingly, Autism spectrum disorders (ASD) are associated with enhanced processing of amyloid-β precursor protein (APP) by secretase-α, and intraneuronal accumulation of N-terminally truncated Aβ peptides in the brain cortex [38], thus confirming the involvement and the accumulation of amyloidogenic peptides also in neurodevelopmental disorders. Recently, Frackowiak and Mazur-Kolecka have suggested that ASD, epilepsy, and self-injurious behaviors all contribute to the enhanced production and accumulation of Aβ peptides, which in turn cause and further enhance dysfunctions of the neuronal networks (i.e. that manifest as autism clinical symptoms, epilepsy, and self-injurious behaviors) [38].
In contrast, oligomeric α-synuclein (α-syn) levels were significantly reduced in both AS SH-SY5Y cells and AS mice cortex. These data are in accordance with previous studies conducted in ASD subjects. Literature has suggested recently synucleins as biomarkers of severity in ASD: in particular, the fold decrease in levels of α-synuclein as discriminative for the diagnosis and severity with good sensitivity and specificity [39].
Finally, comparable levels of tau, a MAP involved in cytoskeleton regulation, were evidenced in UBE3A-silenced models with respect to controls.
Overall, UBE3A-deficient neuronal cells exhibit deficits in several intracellular pathways involved in or interacting with proteostasis and protein degradation. These results are in line with the view of UBE3A as a “molecular tightrope” in neurons [40], as suggested by the several mechanisms in place to continually adjust neuronal UBE3A activity (genetic imprinting, stimulation by cancer-causing E6 virus [41], phosphorylation via PKA [42] and the range of different neurodevelopmental disorders due to aberrant levels or functioning of UBE3A (AS, autisms, epilepsy, intellectual disabilities).
4. Materials and Methods
4.1. Neuronal Cell Cultures
For in vitro model studies, we employed the SH-SY5Y human neuroblastoma-derived cell line. We used wild-type (WT) and UBE3A-silenced (AS model, UBE3A-)SH-SY5Y cells. ; both cell lines were generously provided by Prof. M. Scheffner [22,23]. Cells were cultured in DMEM/F-12 medium supplemented with 10% fetal bovine serum (FBS) and 1% penicillin/streptomycin. For the UBE3A- cells, 1 µg/mL puromycin (P7130, MERCK, Darmstadt, Germany) was added during each medium change to maintain selective pressure. Culture medium was refreshed three times per week, and cells were passed upon reaching approximately 80% confluence, following previously established protocols [23,43].
4.2. Mouse Model of AS
Mice used in this study were C57BL/6 mice with Ube3a maternal deletion (B6.129S7-Ube3a tm1Alb /J; Stock No. 016590, The Jackson Laboratories [44]); genotyping was performed as in Ube3am+/p– females were crossed with wild-type males (all mice in 129S background), and pups, which were either wild-type (WT) or Ube3am-/p+ (designated as AS) were used for experiments [43]. Animals were housed in standard cages in a room maintained at 22 o +1°C with a 12-hour light-dark cycle. They had ad libitum access to food (standard diet, 4RF25 GLP Certificate, Mucedola) and water. All experiments were conducted in compliance with the directive of the European Communities Council 63/2010 and approved by The Italian Ministry of Health (Authorization n. 582/2021-PR del 23/07/2021).
4.3. Samples Lysate Preparation for Immunoenzymatic Assays
SH-SY5Y cells at subconfluence were washed in ice-cold phosphate-buffered saline (PBS 1x), scrapped and collected by centrifugation, and resuspended in Lysis buffer (20 mM Tris HCl, 137 mM NaCl, 10% glycerol, 1% NONIDET40, 2 mM EDTA, pH 8), containing 1% of the protease inhibitor cocktail (Sigma Aldrich, Milan, Italy). For cortex tissues, the samples were cut to approximately 30 mg of tissues, homogenized in the same lysis buffer as above, and sonicated on ice for 30 seconds, three times. The lysates were then centrifuged at 15,000 × g for 15 minutes at 4 °C. The supernatant was collected, and protein concentration was determined to ensure loading of 30 µg of protein per well, diluted in 1× PBS. Optimal composition of lysis buffer, as well as reaction conditions, were determined in preliminary experiments [45].
4.4. Protein Expression by Western Blot Analysis
Mouse cortexes were cut in ~30mcg of tissue followed by the lysis in RIPA buffer (9.1 mM NaH2PO4, 1.7 mM Na2HPO4, 150 mM NaCl, pH 7.4, 0.5% sodium deoxycholate, 1% Nonidet P-40, 0.1% SDS, and a protease-inhibitor cocktail) with sonication (amplitude 50%, 3 times for 30 seconds each), then the samples were lysed for 2h at 4ºC.
For SH-SY5Y cells, the cell pellet was lysed following the same protocol as for brain tissues, except for the sonication amplitude that was used at 35%. After the protein quantification, equal amounts of protein (~40µg of protein) were diluted in Laemmli solution and loaded in a precast gel of SDS-PAGE (7.5%), then transferred to PVDF membranes (Bio-Rad, Milan, Italy). The membrane was incubated in a blocking solution of 5% milk in TBS-0.1% Tween for 60 min and then the primary antibodies were incubated overnight at 4ºC, diluted in a 5% milk TBS-Tween solution. Then, next day membranes were washed out in TBS-0.1% Tween solution for 3 times of 5 min each, followed by incubation in the corresponding secondary antibody for 2 hours at a room temperature (at a shaker).
The primary antibody detection and the acquisition of the blot images were performed using chemiluminescent substrate (ECL, Bio-Rad). The following primary antibodies were employed, anti-: MDM2 (sc-5304, Santa Cruz Biotechnology, Santa Cruz, California, USA, diluted 1:500); p-62 (SQSTM1/p62, #5114, Cell Signaling Technology, Danvers, Massachusetts, USA, diluted 1:1000); LC3β (sc-271625, Santa Cruz Biotechnology, Santa Cruz, California, USA, diluted 1:500); total p53 (sc-126, Santa Cruz Biotechnology, Santa Cruz, California, USA, diluted 1:500); Phosphorylated p-p53 (sc-101762, Santa Cruz Biotechnology, Santa Cruz, California, USA, diluted 1:500).
The densitometric analysis of the immunoreactive detected bands was done using Image Lab Software (Bio-Rad, Milan, Italy). The data were reported as the percentage compared to the control (WT), set as 100%. All the western blot analysis were performed using the ChemiDoc XRS+Gel Imaging System (Biorad, Milan, Italy), which comprises the use stain-free of total protein normalization. This method of normalization takes into account the intensity of all proteins in the lane, the sample loading variations, variations during electrophoresis and also variations during transfer. Thus, eliminating the use of housekeeping proteins (1), as previously reported [46]. Densitometric analysis of immunoreactive bands was elaborated by ImageJ (NHI, USA). Data are reported in % vs Control samples.
4.5. MDM2-p53 Complex in AS Models
To analyze the formation of the MDM2–p53 complex, we performed an immunoenzymatic assay, as previously described [45], using approximately 30µg of mouse cortex tissue or SH-SY5Y cell lysate samples. Briefly, plates were coated overnight at 4 °C with a rabbit monoclonal antibody for MDM2 (#515415, Cell Signaling, Danvers, Massachusetts, USA), diluted 1:50 in 0.1 mg/mL polyornithine. Following a blocking step for non-specific sites performed for 2 hours at 37 °C using 1% Bovine Serum Albumin (BSA), samples were added to the plate and incubated for 1 hour at room temperature. Primary and secondary antibodies, diluted in a solution of 5% of milk in TBS-tween, were applied and incubated for 1 to 1.5 hours at 37 °C. For the primary antibody, we used a mouse monoclonal antibody for p-53 (#sc-126, Santa Cruz, USA; diluted 1:500) and for the secondary antibody we used an anti-mouse HRP-conjugated antibody (diluted 1:3000). Between each step, plates were washed with PBS containing 0.01% Tween. After the 3,3′,5,5′-Tetramethylbenzidine (TMB) step and color development, the absorbance was read at 450nm. The results were expressed as percentages relative to controls (WT SH-SY5Y cells or WT mice).
4.6. Total and Phosphorylated AKT/mTOR in AS Models
For the study of AKT/mTOR signalling pathway, an in house immunoenzymatic assay was performed using lysates obtained from SH-SY5Y cells and mice cortex. Cells were washed in PBS 1x and fixed with 2% formaldehyde and incubated at room temperature (RT) for 20 min. After, a quenching buffer solution (10% of hydrogen peroxide, 100x Sodium Azide in PBS 1X) was added and incubated at RT for 20 min. Next a blocking step was done for 1 hour (1% BSA and 0.1% Triton X-100 in PBS 1x) at RT in a shaker. Between each step, plate was washed with a wash buffer solution (10% Triton X-100 in PBS 1x) for 5 minutes for three times. The primary antibodies (total AKT, Antibody, sc81434; phospho-AKT (Ser473), sc7985, both Santa Cruz Biotechnology, Santa Cruz, California, USA,; mTOR Antibody #2972; Phospho-mTOR (Ser2448) Antibody #2971, both Cell Signaling Technology, USA) were diluted 1:300 in a 1% BSA-0.03% Triton X-100 solution at 4ºC overnight. After the incubation for 2 hours of the secondary antibody, a last wash step was done twice with wash buffer solution for 5 minutes and twice with PBS 1x for 5 minutes each one. Following TMB addition and color development, the absorbance was read at 450 nm. The data were expressed as percentages relative to control SH-SY5Y cells or control WT mice, each set to 100%.
4.7. RNA Extraction and RealTime PCR Analysis
SH-SY5Y cells (control and UB3A-) cells were collected, and total RNA was extracted using RNeasyH Mini Kit (Qiagen, Hilden, Germany) according to the manufacturer’s instructions. cDNA synthesis was performed with 500 ng of RNA using the i-Script cDNA synthesis kit (BioRad, Hercules, USA). RT-PCR reactions consisted of 25 µl of FluocycleH II SYBRH (Biorad, Milan, Italy), 1.5 µL of both 10 mM forward and reverse primers, 3 µL of cDNA, and 19 µL of H2O [47]. The reactions were performed for 35 cycles. Sequences and annealing temperatures have been reported before [48].
4.8. Misfolded Protein Accumulation in Angelman Syndrome Models
To detect misfolded proteins in SH-SY5Y cells and mouse cortex and, an in-house indirect quantitative immunoenzymatic assay was performed [49,50,51,52]. Details regarding the antibodies and their respective dilutions are provided in Table 1.
Plates were coated overnight at 4 °C with antibodies diluted in 0.1 mg/mL polyornithine. Following a blocking step for non-specific sites performed for 2 hours at 37 °C using 1% Bovine Serum Albumin (BSA), samples and standard curve dilutions were added and incubated for 2 hours at room temperature. Primary and secondary antibodies, diluted in a solution of 0.2% BSA in PBS with Triton X-100, were applied and incubated for 1 to 1.5 hours at 37 °C. Between each step, plates were washed with PBS containing 0.01% Tween. After the TMB step and color development, the absorbance was read at 450nm. The standard curve was constructed using a serial dilution of a commercial human recombinant protein at eight different concentrations.
4.9. Statistical Analysis
All statistical analyses were performed using GraphPad Prism (GraphPad Software, San Diego, CA, USA). Data are expressed as mean ± SEM, from at least n=three independent experiments. Differences between Control and UBE3A⁻ (AS) samples were assessed using an unpaired two-tailed Student’s t-test. A p value < 0.05 was considered statistically significant. Statistical significance is indicated as follows: *p < 0.05, **p < 0.01, ***p < 0.001, ***p < 0.0001 vs Control.
5. Conclusions
In conclusion, in the present paper we show that AS is characterized by a dysregulation in the autophagic process, which involves a disbalance in the AKT/mTOR axis. Moreover, the MDM2 ligase was downregulated in AS neuronal cells as well, linked to an enhancement of p53 expression and activity. As a result, we demonstrated the presence of an accumulation of toxic amyloidogenic proteins in AS neuronal cells and in cortex of AS animals.
Supplementary Materials
The following supporting information can be downloaded at the website of this paper posted on Preprints.org, Figure S1: mTOR/AKT pathway and MDM2-p53 axis in the AS mice model; Figure S2: Misfolded proteins levels in the AS mice model.
Author Contributions
C.M. and C.D.C.; methodology, S.D.; software, S.D.; validation, I.T., S.D. and M.C.; formal analysis, S.D.; investigation, J.F.M.A., I.T.; resources, L.B.; data curation, I.T.; writing—original draft preparation, J.F.M.A, S.D.; writing—review and editing, I.T.; visualization, L.B.; supervision, C.M.; project administration, I.T.; funding acquisition, S.D. and I.T All authors have read and agreed to the published version of the manuscript.
Funding
The study was supported by PRIN2022 2022ZH5M72.
Institutional Review Board Statement
The animal study protocol was approved by with the directive of the European Communities Council 63/2010 and approved by The Italian Ministry of Health (Authorization n. 582/2021-PR del 23/07/2021).
Data Availability Statement
The data presented in this study are available on request from the corresponding author.
Conflicts of Interest
The authors declare no conflicts of interest.
Abbreviations
The following abbreviations are used in this manuscript:
| AS Angelman Syndrome | AS Angelman Syndrome |
|
UBE3A Ubiquitin-Protein ligase E3A UPS The ubiquitin-proteasome system JNK c-Jun-N-terminal Kinase ASD autism spectrum disorder AMPK-mTOR mammalian target of rapamycin MDM2 murine double minute 2 AKT protein kinase B PI3K phosphoinositide 3-kinase Aβ Amyloid-β α-syn α-synuclein |
UBE3A Ubiquitin-Protein ligase E3A UPS The ubiquitin-proteasome system JNK c-Jun-N-terminal Kinase ASD autism spectrum disorder |
References
- de Almeida, J.F.M.; Tonazzini, I.; Daniele, S. Molecular aspects of Angelman Syndrome: Defining the new path forward. Biomol. Biomed. 2025, 25, 1928–1936. [Google Scholar] [CrossRef] [PubMed]
- Biagioni, M.; Baronchelli, F.; Fossati, M. Multiscale spatio-temporal dynamics of UBE3A gene in brain physiology and neurodevelopmental disorders. Neurobiol. Dis. 2024, 201, 106669. [Google Scholar] [CrossRef] [PubMed]
- Damgaard, R.B. The ubiquitin system: from cell signalling to disease biology and new therapeutic opportunities. Cell Death Differ. 2021, 28, 423–426. [Google Scholar] [CrossRef] [PubMed]
- Đukić, A.; Lulić, L.; Thomas, M.; Skelin, J.; Saidu, N.E.B.; Grce, M.; Banks, L.; Tomaić, V. HPV Oncoproteins and the Ubiquitin Proteasome System: A Signature of Malignancy? Pathogens 2020, 9, 133. [Google Scholar] [CrossRef]
- Kawabe, H.; Brose, N. The role of ubiquitylation in nerve cell development. Nat. Rev. Neurosci. 2011, 12, 251–268. [Google Scholar] [CrossRef]
- Kuang, E.; Qi, J.; Ronai, Z. Emerging roles of E3 ubiquitin ligases in autophagy. Trends Biochem. Sci. 2013, 38, 453–460. [Google Scholar] [CrossRef]
- Aria, F.; Pandey, K.; Alberini, C.M. Excessive Protein Accumulation and Impaired Autophagy in the Hippocampus of Angelman Syndrome Modeled in Mice. Biol. Psychiatry 2022, 94, 68–83. [Google Scholar] [CrossRef]
- Sun, J.; Liu, Y.; Jia, Y.; Hao, X.; Lin, W.J.; Tran, J.; Lynch, G.; Baudry, M.; Bi, X. UBE3A-mediated p18/LAMTOR1 ubiquitination and degradation regulate mTORC1 activity and synaptic plasticity. eLife 2018, 7. [Google Scholar] [CrossRef]
- Hao, X.; Sun, J.; Zhong, L.; Baudry, M.; Bi, X. UBE3A deficiency-induced autophagy is associated with activation of AMPK-ULK1 and p53 pathways. Exp. Neurol. 2023, 363, 114358–114358. [Google Scholar] [CrossRef]
- Chaudhary, P.; Proulx, J.; Park, I.-W. Ubiquitin-protein ligase E3A (UBE3A) mediation of viral infection and human diseases. Virus Res. 2023, 335, 199191. [Google Scholar] [CrossRef]
- Perry, M.E. The Regulation of the p53-mediated Stress Response by MDM2 and MDM4. Cold Spring Harb. Perspect. Biol. 2009, 2, a000968–a000968. [Google Scholar] [CrossRef]
- Guo, L.; Chen, W.; Yue, J.; Gao, M.; Zhang, J.; Huang, Y.; Xiong, H.; Li, X.; Wang, Y.; Yuan, Y.; et al. Unlocking the potential of LHPP: Inhibiting glioma growth and cell cycle via the MDM2/p53 pathway. Biochim. et Biophys. Acta (BBA) - Mol. Basis Dis. 2024, 1871, 167509. [Google Scholar] [CrossRef]
- Barmaki, H.; Nourazarian, A.; Khaki-Khatibi, F. Proteostasis and neurodegeneration: a closer look at autophagy in Alzheimer's disease. Front. Aging Neurosci. 2023, 15, 1281338. [Google Scholar] [CrossRef] [PubMed]
- Giacomelli, C.; Daniele, S.; Martini, C. Potential biomarkers and novel pharmacological targets in protein aggregation-related neurodegenerative diseases. Biochem. Pharmacol. 2017, 131, 1–15. [Google Scholar] [CrossRef] [PubMed]
- Ciryam, P.; Tartaglia, G.G.; Morimoto, R.I.; Dobson, C.M.; Vendruscolo, M. Widespread Aggregation and Neurodegenerative Diseases Are Associated with Supersaturated Proteins. Cell Rep. 2013, 5, 781–790. [Google Scholar] [CrossRef] [PubMed]
- Brezic, N.; Gligorevic, S.; Sic, A.; Knezevic, N.N. Protein Misfolding and Aggregation as a Mechanistic Link Between Chronic Pain and Neurodegenerative Diseases. Curr. Issues Mol. Biol. 2025, 47, 259. [Google Scholar] [CrossRef]
- Sweeney, P.; Park, H.; Baumann, M.; Dunlop, J.; Frydman, J.; Kopito, R.; McCampbell, A.; Leblanc, G.; Venkateswaran, A.; Nurmi, A.; et al. Protein misfolding in neurodegenerative diseases: implications and strategies. Transl. Neurodegener. 2017, 6, 6. [Google Scholar] [CrossRef]
- Shukla, M.; Narayan, M. Proteostasis and Its Role in Disease Development. Cell Biochem. Biophys. 2024, 83, 1725–1741. [Google Scholar] [CrossRef]
- Bhat, K.P.; Yan, S.; Wang, C.-E.; Li, S.; Li, X.-J. Differential ubiquitination and degradation of huntingtin fragments modulated by ubiquitin-protein ligase E3A. Proc. Natl. Acad. Sci. 2014, 111, 5706–5711. [Google Scholar] [CrossRef]
- Mishra, A.; Dikshit, P.; Purkayastha, S.; Sharma, J.; Nukina, N.; Jana, N.R. E6-AP Promotes Misfolded Polyglutamine Proteins for Proteasomal Degradation and Suppresses Polyglutamine Protein Aggregation and Toxicity. J. Biol. Chem. 2008, 283, 7648–7656. [Google Scholar] [CrossRef]
- Mishra, A.; Godavarthi, S.K.; Maheshwari, M.; Goswami, A.; Jana, N.R. The Ubiquitin Ligase E6-AP Is Induced and Recruited to Aggresomes in Response to Proteasome Inhibition and May Be Involved in the Ubiquitination of Hsp70-bound Misfolded Proteins. J. Biol. Chem. 2009, 284, 10537–10545. [Google Scholar] [CrossRef]
- Kühnle, S.; Mothes, B.; Matentzoglu, K.; Scheffner, M. Role of the ubiquitin ligase E6AP/UBE3A in controlling levels of the synaptic protein Arc. Proc. Natl. Acad. Sci. 2013, 110, 8888–8893. [Google Scholar] [CrossRef]
- Mezzena, R.; Masciullo, C.; Antonini, S.; Cremisi, F.; Scheffner, M.; Cecchini, M.; Tonazzini, I. Study of adhesion and migration dynamics in ubiquitin E3A ligase (UBE3A)-silenced SYSH5Y neuroblastoma cells by micro-structured surfaces. Nanotechnology 2020, 32, 025708. [Google Scholar] [CrossRef]
- Jiang, Y.-H.; Armstrong, D.; Albrecht, U.; Atkins, C.M.; Noebels, J.L.; Eichele, G.; Sweatt, J.; Beaudet, A.L. Mutation of the Angelman Ubiquitin Ligase in Mice Causes Increased Cytoplasmic p53 and Deficits of Contextual Learning and Long-Term Potentiation. Neuron 1998, 21, 799–811. [Google Scholar] [CrossRef]
- Brooks, C.L.; Li, M.; Gu, W. Mechanistic Studies of MDM2-mediated Ubiquitination in p53 Regulation. J. Biol. Chem. 2007, 282, 22804–22815. [Google Scholar] [CrossRef]
- Chao, C.; Hergenhahn, M.; Kaeser, M.D.; Wu, Z.; Saito, S.; Iggo, R.; Hollstein, M.; Appella, E.; Xu, Y. Cell Type- and Promoter-specific Roles of Ser18 Phosphorylation in Regulating p53 Responses. J. Biol. Chem. 2003, 278, 41028–41033. [Google Scholar] [CrossRef]
- Greenblatt, M.S.; Bennett, W.P.; Hollstein, M.; Harris, C.C. Mutations in the p53 tumor suppressor gene: clues to cancer etiology and molecular pathogenesis. . 1994, 54, 4855–78. [Google Scholar]
- Cummings, K.A. Protein Accumulation and Impaired Autophagy Underlie Cognitive Dysfunction in Angelman Syndrome. Biol. Psychiatry 2023, 94, e1–e3. [Google Scholar] [CrossRef] [PubMed]
- Heras-Sandoval, D.; Pérez-Rojas, J.M.; Hernández-Damián, J.; Pedraza-Chaverri, J. The role of PI3K/AKT/mTOR pathway in the modulation of autophagy and the clearance of protein aggregates in neurodegeneration. Cell. Signal. 2014, 26, 2694–2701. [Google Scholar] [CrossRef] [PubMed]
- Sun, J.; Liu, Y.; Tran, J.; O’nEal, P.; Baudry, M.; Bi, X. mTORC1–S6K1 inhibition or mTORC2 activation improves hippocampal synaptic plasticity and learning in Angelman syndrome mice. Cell. Mol. Life Sci. 2016, 73, 4303–4314. [Google Scholar] [CrossRef]
- Sun, J.; Liu, Y.; Moreno, S.; Baudry, M.; Bi, X. Imbalanced Mechanistic Target of Rapamycin C1 and C2 Activity in the Cerebellum of Angelman Syndrome Mice Impairs Motor Function. J. Neurosci. 2015, 35, 4706–4718. [Google Scholar] [CrossRef]
- Bi, X.; Sun, J.; Baudry, M. Yin-and-Yang of mTORC1/C2 in Angelman syndrome mice. Oncotarget 2015, 6, 13844–13845. [Google Scholar] [CrossRef]
- Chibaya, L.; Karim, B.; Zhang, H.; Jones, S.N. Mdm2 phosphorylation by Akt regulates the p53 response to oxidative stress to promote cell proliferation and tumorigenesis. Proc. Natl. Acad. Sci. USA 2021, 118. [Google Scholar] [CrossRef] [PubMed]
- Harris, S.L.; Levine, A.J. The p53 pathway: positive and negative feedback loops. Oncogene 2005, 24, 2899–2908. [Google Scholar] [CrossRef] [PubMed]
- Mendrysa, S.M.; Ghassemifar, S.; Malek, R. p53 in the CNS: Perspectives on Development, Stem Cells, and Cancer. Genes Cancer 2011, 2, 431–442. [Google Scholar] [CrossRef] [PubMed]
- Li, H.; Zhang, Z.; Li, H.; Pan, X.; Wang, Y. New Insights into the Roles of p53 in Central Nervous System Diseases. Int. J. Neuropsychopharmacol. 2023, 26, 465–473. [Google Scholar] [CrossRef]
- Barmaki, H.; Nourazarian, A.; Khaki-Khatibi, F. Proteostasis and neurodegeneration: a closer look at autophagy in Alzheimer's disease. Front. Aging Neurosci. 2023, 15, 1281338. [Google Scholar] [CrossRef]
- Frackowiak, J.; Mazur-Kolecka, B. Intraneuronal accumulation of amyloid-β peptides as the pathomechanism linking autism and its co-morbidities: epilepsy and self-injurious behavior — the hypothesis. Front. Mol. Neurosci. 2023, 16, 1160967. [Google Scholar] [CrossRef]
- Nair, L.D.V.; Sivanesan, S.K.; Kumar, D.S. Synucleins As Biomarkers of Severity in Autism Spectrum Disorder. Cureus 2024, 16. [Google Scholar] [CrossRef]
- Elgersma, Y. A molecular tightrope. Nature 2015, 526, 50–51. [Google Scholar] [CrossRef]
- Scheffner, M.; Huibregtse, J.M.; Vierstra, R.D.; Howley, P.M. The HPV-16 E6 and E6-AP complex functions as a ubiquitin-protein ligase in the ubiquitination of p53. Cell 1993, 75, 495–505. [Google Scholar] [CrossRef]
- Yi, J.J.; Berrios, J.; Newbern, J.M.; Snider, W.D.; Philpot, B.D.; Hahn, K.M.; Zylka, M.J. An Autism-Linked Mutation Disables Phosphorylation Control of UBE3A. Cell 2015, 162, 795–807. [Google Scholar] [CrossRef]
- Tonazzini, I.; Van Woerden, G.M.; Masciullo, C.; Mientjes, E.J.; Elgersma, Y.; Cecchini, M. The role of ubiquitin ligase E3A in polarized contact guidance and rescue strategies in UBE3A-deficient hippocampal neurons. Mol. Autism 2019, 10, 1–18. [Google Scholar] [CrossRef] [PubMed]
- Copping, N.A.; Silverman, J.L. Abnormal electrophysiological phenotypes and sleep deficits in a mouse model of Angelman Syndrome. Mol. Autism 2021, 12, 1–14. [Google Scholar] [CrossRef] [PubMed]
- Fumagalli, M.; Bonfanti, E.; Daniele, S.; Zappelli, E.; Lecca, D.; Martini, C.; Trincavelli, M.L.; Abbracchio, M.P. The ubiquitin ligase Mdm2 controls oligodendrocyte maturation by intertwining mTOR with G protein-coupled receptor kinase 2 in the regulation of GPR17 receptor desensitization. Glia 2015, 63, 2327–2339. [Google Scholar] [CrossRef] [PubMed]
- Zappelli, E.; Daniele, S.; Vergassola, M.; Ceccarelli, L.; Chelucci, E.; Mangano, G.; Durando, L.; Ragni, L.; Martini, C. A specific combination of nutraceutical Ingredients exerts cytoprotective effects in human cholinergic neurons. PharmaNutrition 2022, 22. [Google Scholar] [CrossRef]
- Daniele, S.; Costa, B.; Zappelli, E.; Da Pozzo, E.; Sestito, S.; Nesi, G.; Campiglia, P.; Marinelli, L.; Novellino, E.; Rapposelli, S.; et al. Combined inhibition of AKT/mTOR and MDM2 enhances Glioblastoma Multiforme cell apoptosis and differentiation of cancer stem cells. Sci. Rep. 2015, 5, 9956. [Google Scholar] [CrossRef]
- Costa, B.; Bendinelli, S.; Gabelloni, P.; Da Pozzo, E.; Daniele, S.; Scatena, F.; Vanacore, R.; Campiglia, P.; Bertamino, A.; Gomez-Monterrey, I.; et al. Human Glioblastoma Multiforme: p53 Reactivation by a Novel MDM2 Inhibitor. PLOS ONE 2013, 8, e72281. [Google Scholar] [CrossRef]
- Baldacci, F.; Daniele, S.; Piccarducci, R.; Giampietri, L.; Pietrobono, D.; Giorgi, F.S.; Nicoletti, V.; Frosini, D.; Libertini, P.; Gerfo, A.L.; et al. Potential Diagnostic Value of Red Blood Cells α-Synuclein Heteroaggregates in Alzheimer’s Disease. Mol. Neurobiol. 2019, 56, 6451–6459. [Google Scholar] [CrossRef]
- Daniele, S.; Pietrobono, D.; Fusi, J.; Iofrida, C.; Chico, L.; Petrozzi, L.; Gerfo, A.L.; Baldacci, F.; Galetta, F.; Siciliano, G.; et al. α-Synuclein Aggregates with β-Amyloid or Tau in Human Red Blood Cells: Correlation with Antioxidant Capability and Physical Exercise in Human Healthy Subjects. Mol. Neurobiol. 2017, 55, 2653–2675. [Google Scholar] [CrossRef]
- El-Agnaf, O.M.A.; Salem, S.A.; Paleologou, K.E.; Curran, M.D.; Gibson, M.J.; Court, J.A.; Schlossmacher, M.G.; Allsop, D. Detection of oligomeric forms of α-synuclein protein in human plasma as a potential biomarker for Parkinson's disease. FASEB J. 2006, 20, 419–425. [Google Scholar] [CrossRef]
- Daniele, S.; Baldacci, F.; Piccarducci, R.; Palermo, G.; Giampietri, L.; Manca, M.L.; Pietrobono, D.; Frosini, D.; Nicoletti, V.; Tognoni, G.; et al. α-Synuclein Heteromers in Red Blood Cells of Alzheimer’s Disease and Lewy Body Dementia Patients. J. Alzheimer's Dis. 2021, 80, 885–893. [Google Scholar] [CrossRef]
Figure 1.
Autophagy and mTOR/AKT pathway in AS neuronal cells’ model. (A-D) Cell lysates from Control and UB3A- SH-SY5Y cells, were used for western blotting analysis using specific antibodies to monitor autophagy activation, i.e., p62 (panel A) and LC3 (panel C). A ‘stain-free protein normalization’ method was used for the normalization of bands to total protein in blots, eliminating the need for housekeeping proteins. The Data are expressed as % vs Control cells and represent the mean ± SEM of at least three independent experiments. Comparisons between Control and UB3A⁻ were performed using an unpaired two-tailed Student’s t-test; ***p < 0.001. (E, F) SH-SY5Y (Control and UBE3A- cells) were fixed and specific antibodies (total mTOR and phospho-mTOR, panel E; total AKT or phospho-AKT, (panel F) were used in specific immunoezymatic assays, as reported in the Methods section. The data are expressed as the ratio between phosphorylated and total protein levels (in % vs Control cells) and represent the mean ± SEM of at least three independent experiments. Comparisons between Control and UB3A⁻ were performed using an unpaired two-tailed Student’s t-test; ***p < 0.001 vs control cells.
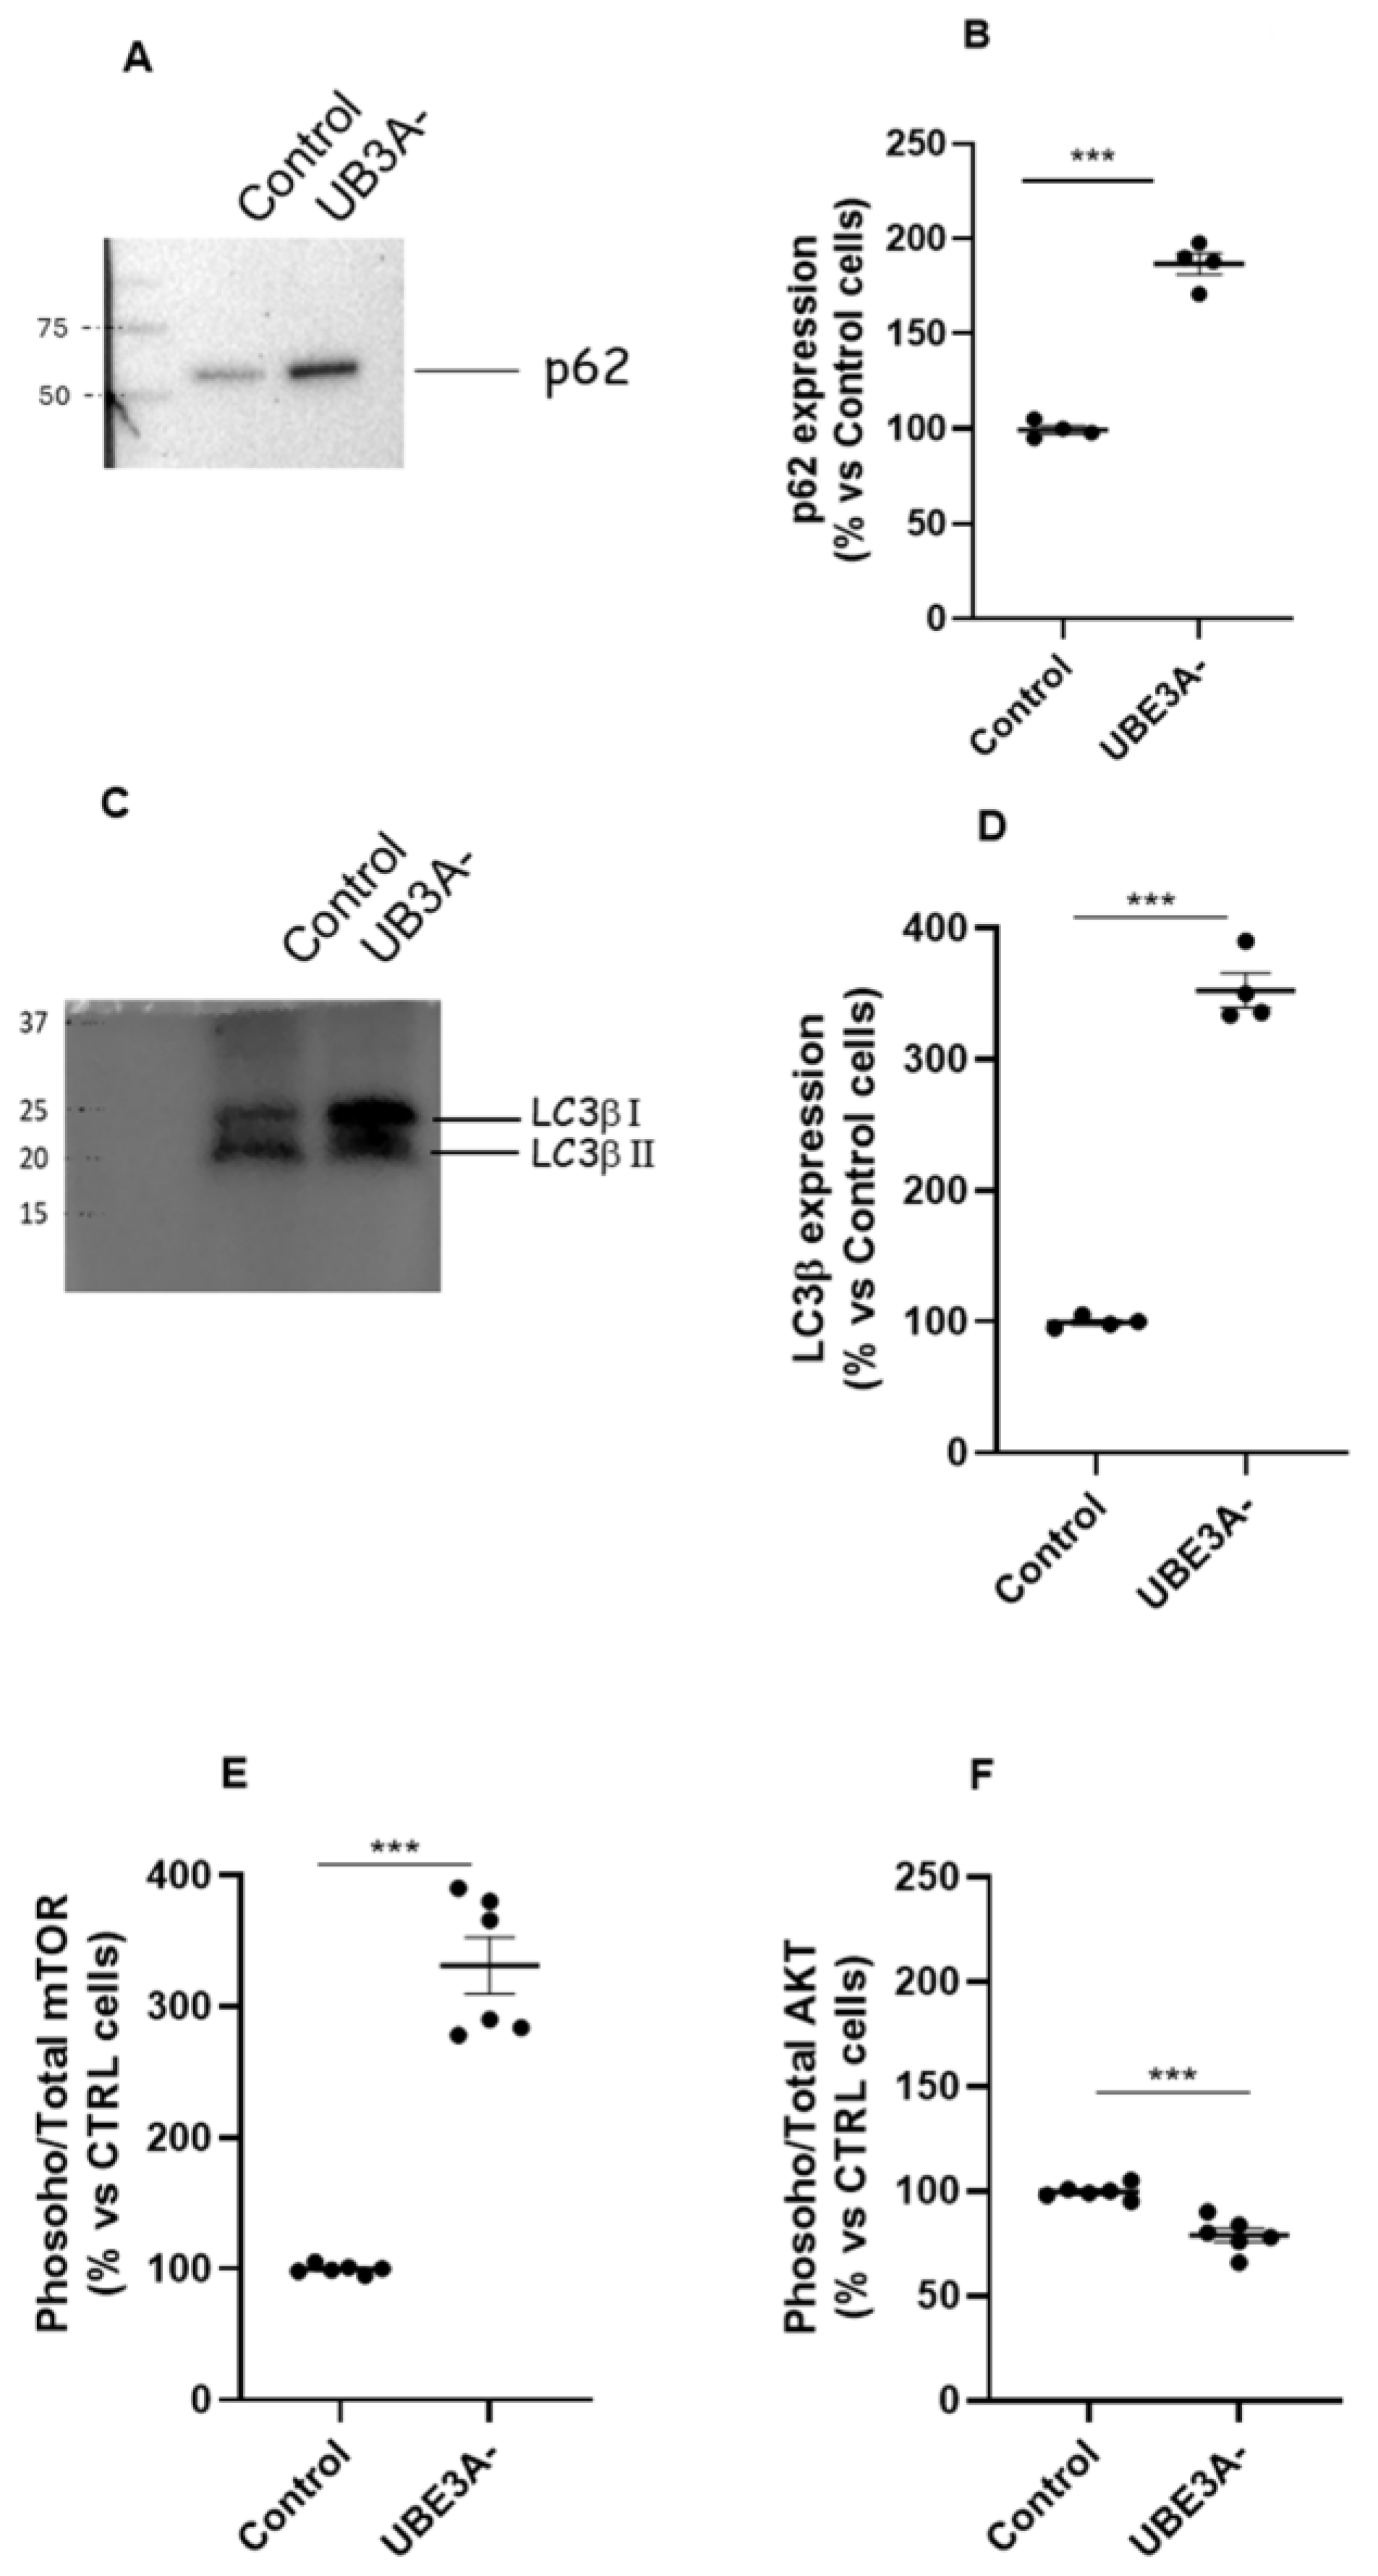
Figure 2.
MDM2-p53 axis in the AS neuronal cell model. (A, B) Cell lysates from Control and UB3A- SH-SY5Y cells were used for western blotting analysis using specific antibodies to MDM2. A ‘stain-free protein normalization’ method was used for the normalization of bands to total protein in blots, eliminating the need for housekeeping proteins. (Data are expressed as percentage versus control cells and are mean ± SEM from at least three independent experiments. Comparisons between Control and UB3A⁻ were performed using an unpaired two-tailed Student’s t-test; ***p < 0.001 Control vs UBE3A-.
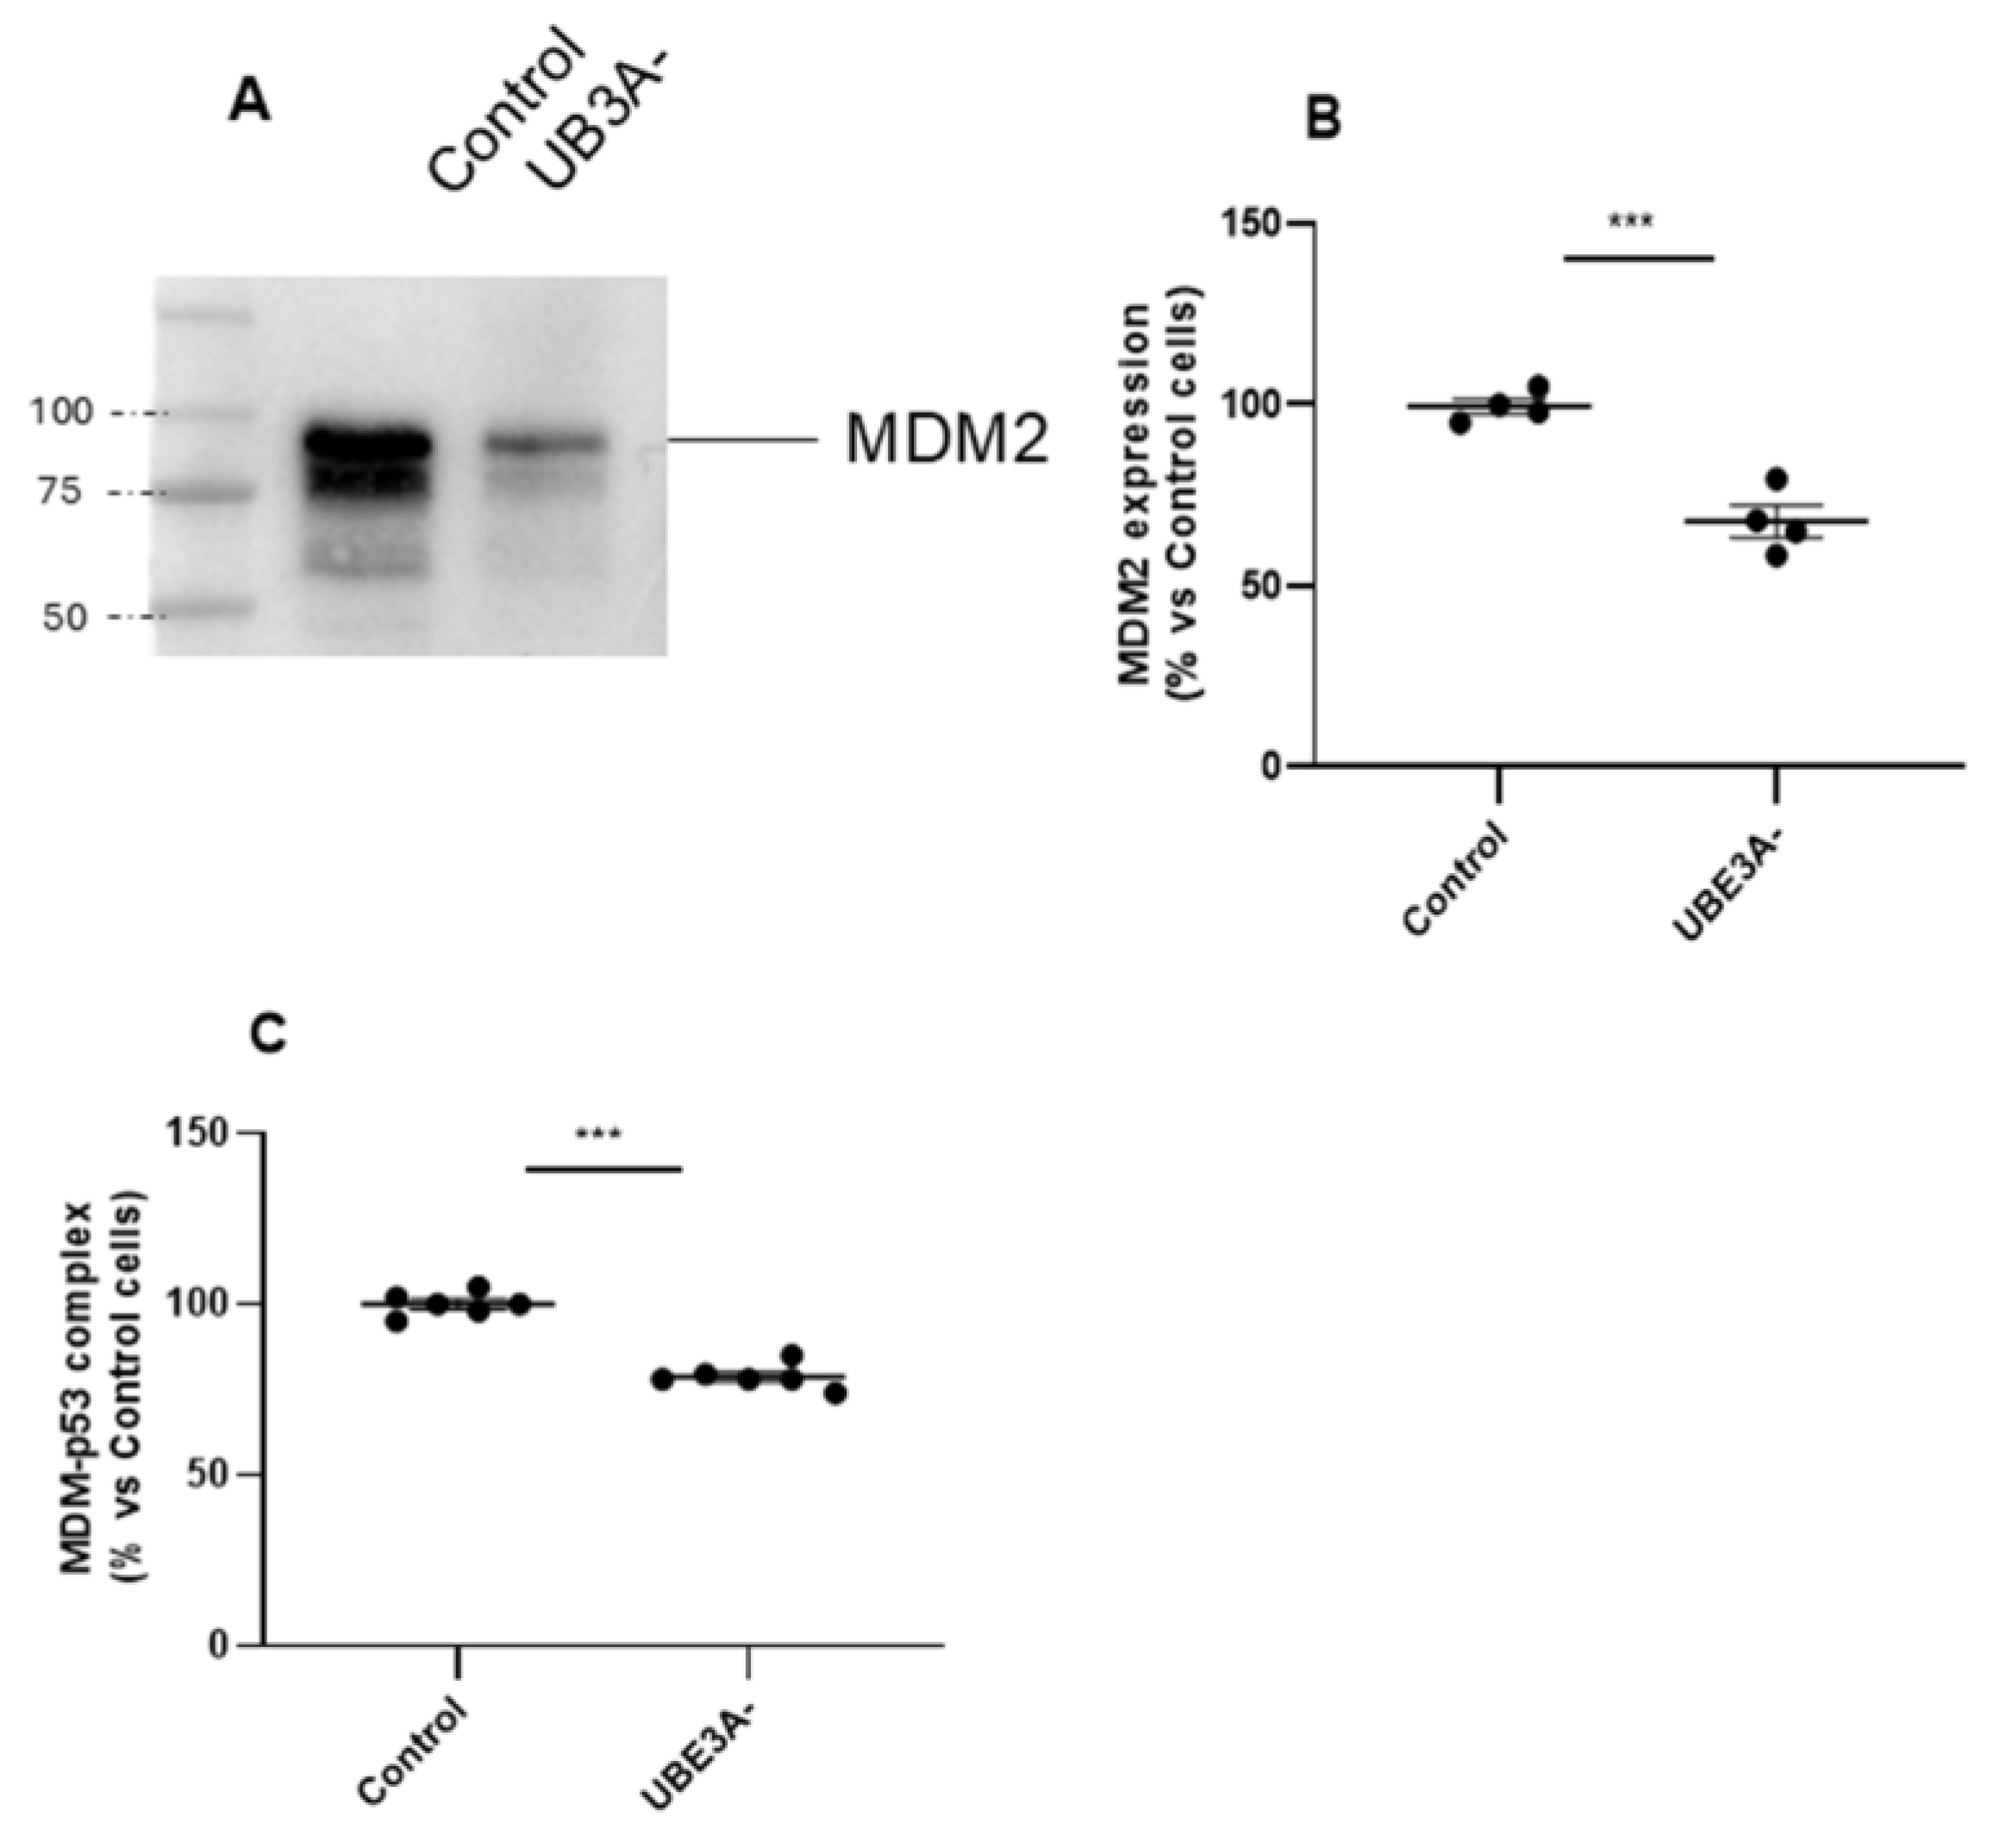
Figure 3.
p53 expression and activity in SH-SY5Y AS cellular model. (A-D) Cell lysates from SH-SY5Y (Control and UBE3A- cells), were used for western blotting analysis using specific antibodies to total p53 (A-B) and phosphorylated p53 (C-D). A ‘stain-free protein normalization’ method was used for the normalization of bands to total protein in blots, eliminating the need for housekeeping proteins. Data are expressed as percentage versus control cells and are mean ± SEM of at least three independent experiments Comparisons between Control and UB3A⁻ were performed using an unpaired two-tailed Student’s t-test; *p < 0.05, **p < 0.01, UBE3A- vs Control. (E) SHSY-5Y (Control and UBE3A-) cells were collected for RNA extraction and retro transcription to cDNA. A real-time PCR analysis was performed to monitor mRNA expression of p53-traget genes (i.e., Bax, P21 and MDM2). Data are expressed as fold change relative to Control cells (set to 1) and represent mean ± SEM of at least three independent experiments. Comparisons between Control and UBE3A⁻ were performed using an unpaired two-tailed Student’s t-test; ***p < 0.001.
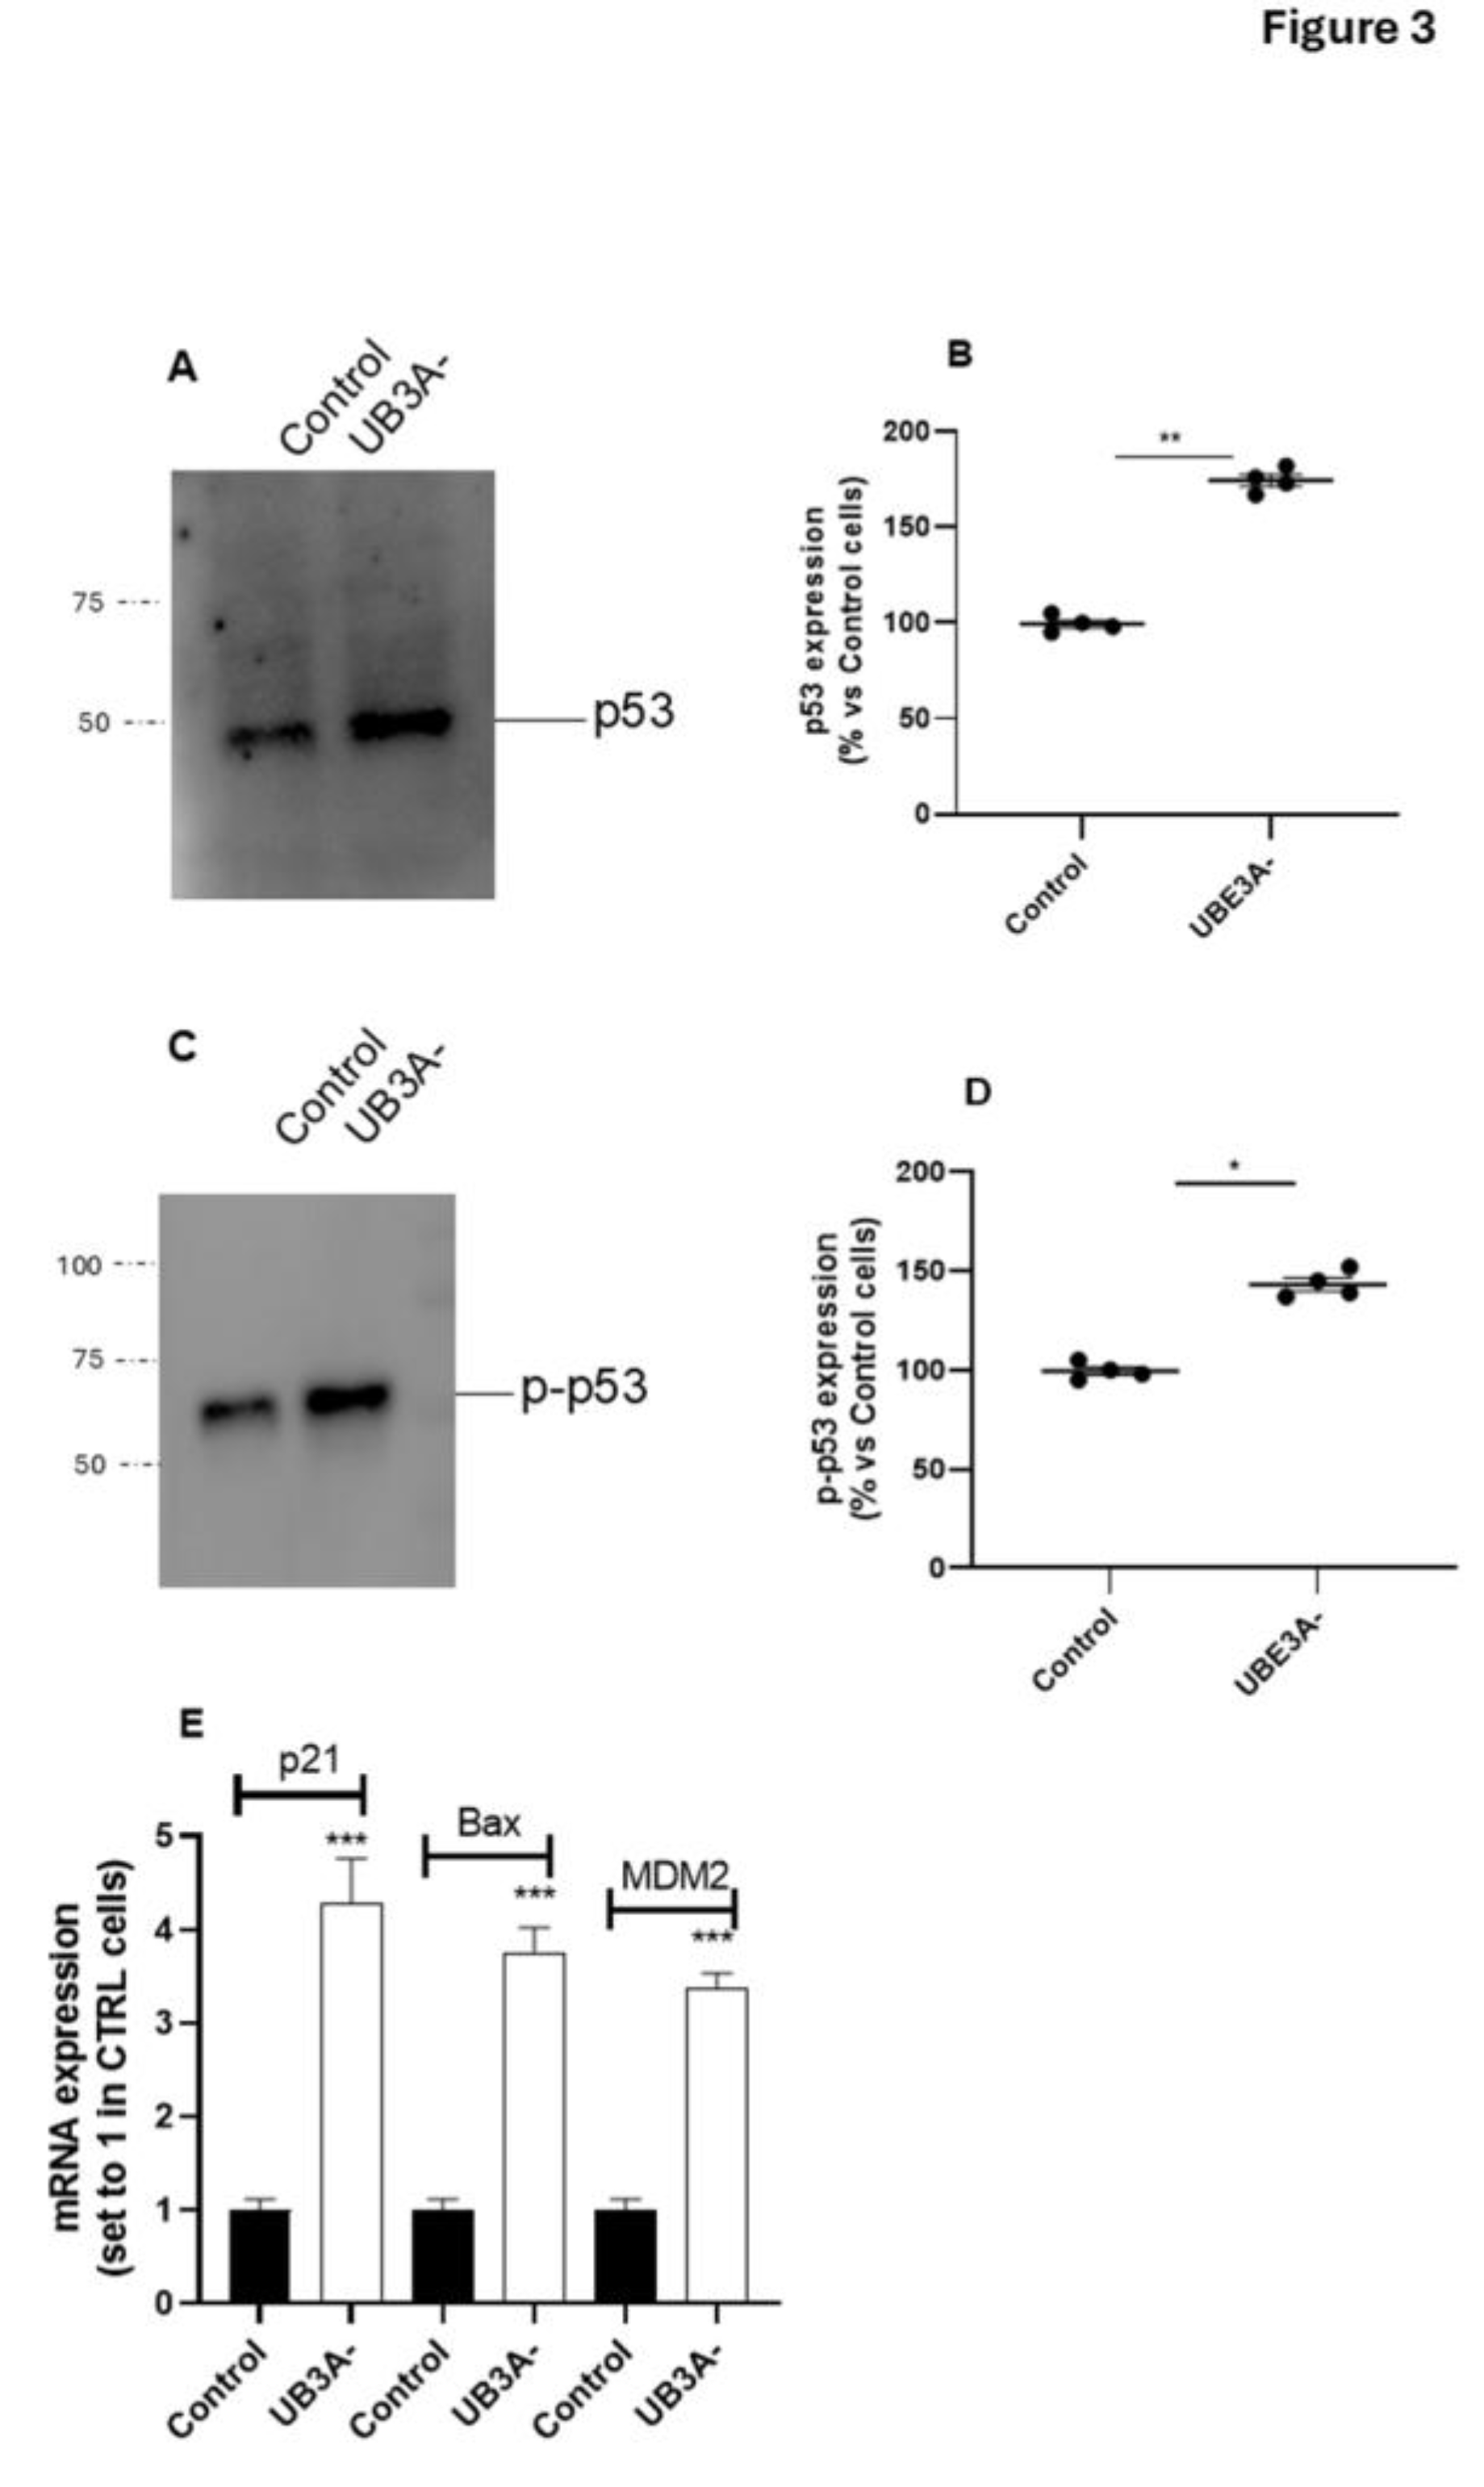
Figure 4.
Misfolded proteins levels in the AS cellular model. Cell lysates obtained from SH-SY5Y (Control and UB3A-) cells were used to detect b-amyloid 1-40 (A), b-amyloid 1-42 (B), a-synuclein (C) and tau (D) by specific immunoezymatic assays, as reported in the Methods section. The data are expressed as pg/µg total proteins (mean ± SEM). Comparisons between Control and UB3A⁻ were performed using an unpaired two-tailed Student’s t-test. Differences were considered statistically significant at p < 0.05.
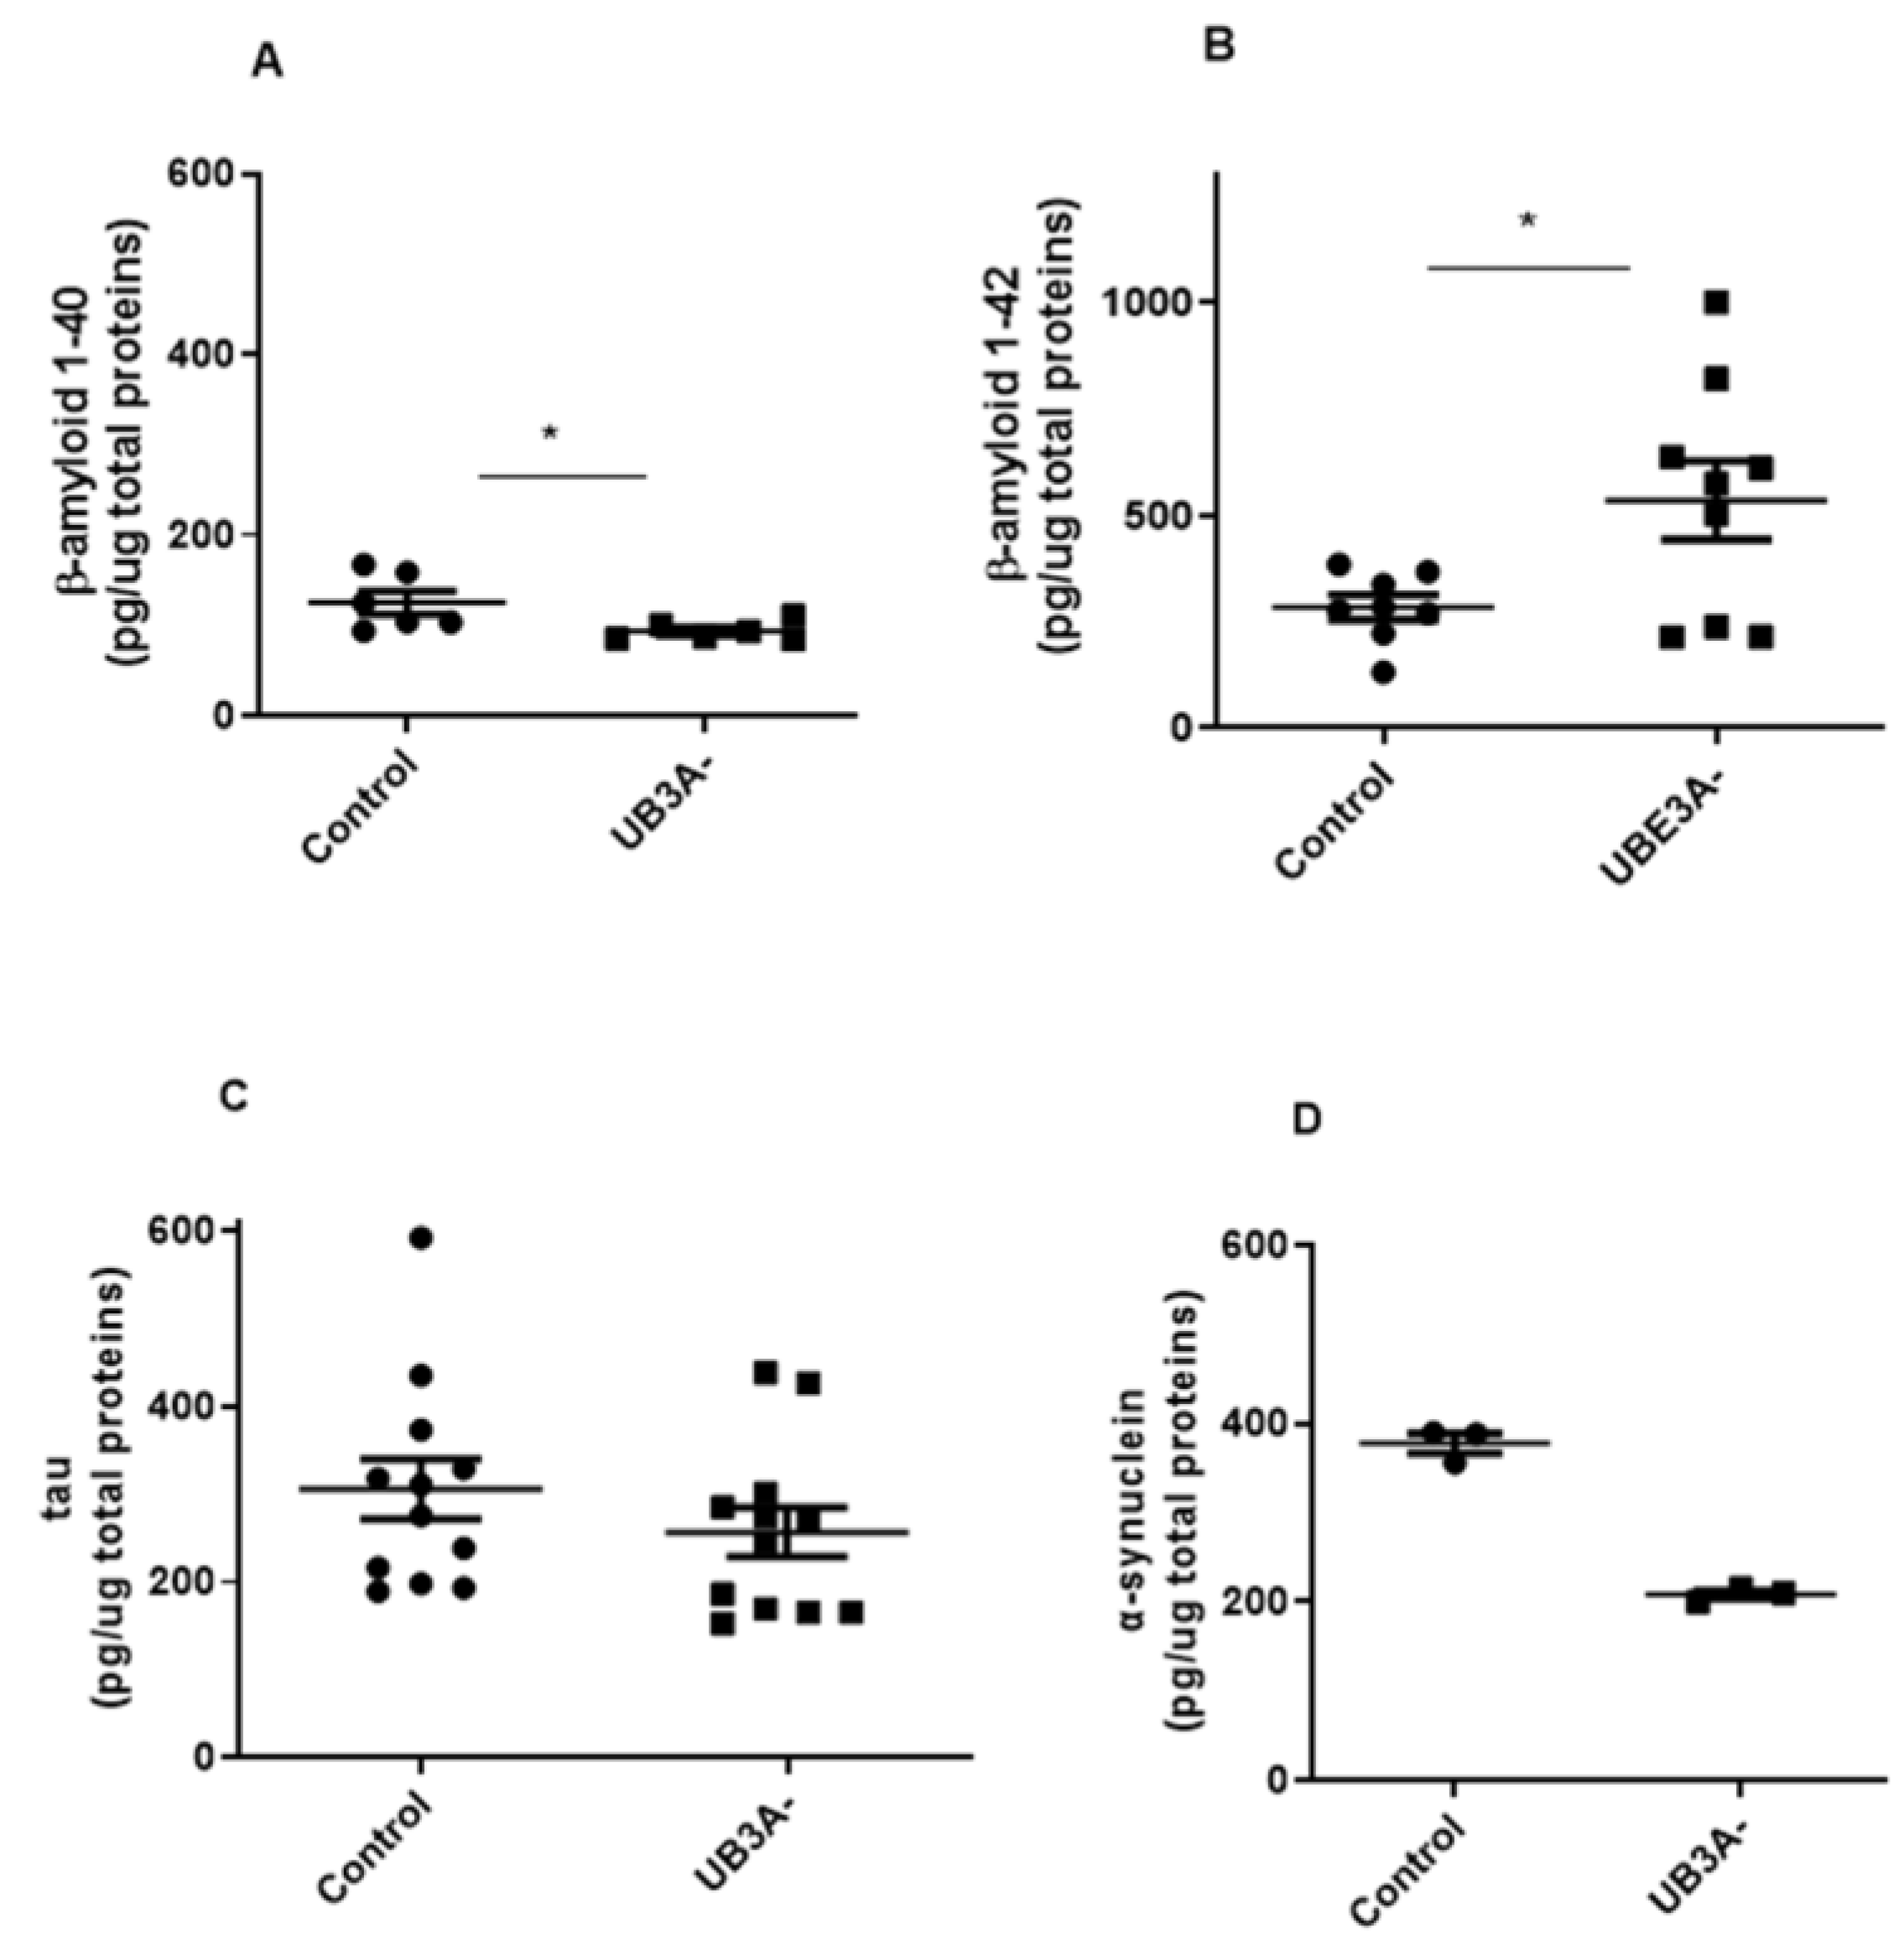

Table 1.
Antibodies and dilutions used for misfolded protein detection on Angelman Syndrome models.
| Protein | Coating antibody | Primary antibody | Secondary antibody |
| Aβ1-42 | #44-344, Invitrogen Rabbit polyclonal antibody Dilution 1:1000 |
#sc-28365, Santa Cruz Biotechnology Inc Mouse monoclonal antibody Dilution 1:200 |
#31430, Invitrogen Goat anti-mouse IgG (HRP) Dilution 1:5000 |
| Aβ1-40 | #sc-53828, Santa Cruz Antibody β-Amyloid AB 1-40 (coating), mouse monoclonal (aa 1-200 APP695) Dilution 1:100 |
# 512700 Invitrogen rabbit monoclonal antibody Dilution 1:1000 |
#A0545, Sigma-Aldrich Goat anti-rabbit IgG (HRP) Dilution 1:5000 |
| t-tau | #sc-32274, Santa Cruz Biotechnology Inc Mouse monoclonal antibody (recognizing C-terminal) Dilution 1:100 |
ab109392, abcam Rabbit polyclonal antibody Dilution 1:1000 |
#A0545, Sigma-Aldrich Goat anti-rabbit IgG (HRP) Dilution 1:5000 |
| α-syn | NBP2-15365, Alpha-Synuclein Antibody Rabbit polyclonal antibody Dilution 1:100 |
# sc-12767, Santa Cruz Mouse monoclonal antibody Dilution 1:200 |
#31430, Invitrogen Goat anti-mouse IgG (HRP) Dilution 1:5000 |
Disclaimer/Publisher’s Note: The statements, opinions and data contained in all publications are solely those of the individual author(s) and contributor(s) and not of MDPI and/or the editor(s). MDPI and/or the editor(s) disclaim responsibility for any injury to people or property resulting from any ideas, methods, instructions or products referred to in the content. |
© 2025 by the authors. Licensee MDPI, Basel, Switzerland. This article is an open access article distributed under the terms and conditions of the Creative Commons Attribution (CC BY) license (http://creativecommons.org/licenses/by/4.0/).
Copyright: This open access article is published under a Creative Commons CC BY 4.0 license, which permit the free download, distribution, and reuse, provided that the author and preprint are cited in any reuse.


