Submitted:
01 October 2025
Posted:
03 October 2025
Read the latest preprint version here
Abstract
Environmental, Social, and Governance (ESG) disclosure has emerged as a central issue for investors, managers, and policymakers, yet evidence on its financial consequences remains mixed and context dependent. This study investigates how ESG disclosure influences firm performance in Europe, with a comparative focus on Nordic versus non-Nordic firms. Using a panel of approximately 24,500 firm-year observations from 2015 to 2024, ESG scores and their environmental, social, and governance pillars are examined against Return on Assets (ROA), Return on Equity (ROE), and Weighted Average Cost of Capital (WACC). Panel regression models are estimated with fixed- and random-effects specifications determined by Hausman tests, controlling for firm size, leverage, and market risk (beta). The findings reveal that, in Nordic firms, higher ESG performance is consistently associated with lower WACC, but shows no significant effect on profitability measures, suggesting that markets in ESG-mature contexts primarily reward sustainability through cheaper financing. In contrast, among non-Nordic European firms, overall ESG scores are negatively related to ROA and marginally to ROE, while only governance reduces WACC, highlighting potential short-term trade-offs of ESG investments in less mature institutional environments. These results advance the literature by demonstrating that the ESG–financial performance link is shaped by regional institutional maturity, and they underscore the importance of governance quality for financing efficiency. The study offers implications for managers considering sustainability strategies, investors evaluating firm risk profiles, and policymakers designing disclosure regulations to balance long-term value creation with near-term performance pressures.
Keywords:
Environment
; Social
; Governance
; ESG
; Financial performance
; sustainability
; ROA
; ROE
; WACC.
1. Introduction
Environmental, Social, and Governance (ESG) factors have gained increasing importance in recent years, as businesses and investors alike recognize their potential to shape corporate sustainability and financial performance. ESG disclosures offer insights into how firms manage sustainability-related issues and their broader impact on society, the environment, and governance. Despite growing attention, research on the relationship between ESG performance and financial outcomes remains diverse, with some studies suggesting a positive correlation, while others report mixed or even negative associations.
The existing literature highlights that the impact of ESG on financial performance is often region-specific and influenced by various industry characteristics. While several studies have focused on the effects of ESG performance in individual regions, particularly in Europe, a comparative analysis between Nordic and non-Nordic European firms remains underexplored. In Nordic countries, where sustainability initiatives are more deeply embedded in corporate practices, firms with strong ESG performance are often associated with lower financing costs and improved investor confidence. Conversely, for firms in broader Europe, the relationship between ESG and financial performance appears more nuanced, with some studies showing that strong ESG initiatives may come at a short-term profitability cost.
This study aims to contribute to this gap by comparing the ESG-performance relationship between Nordic and non-Nordic European firms, analyzing data from 2015 to 2024. By examining key financial performance indicators such as Return on Assets (ROA), Return on Equity (ROE), and Weighted Average Cost of Capital (WACC), this research explores how ESG scores, along with individual environmental, social, and governance pillars, influence firm financial outcomes. The study also incorporates control variables such as leverage and firm size to account for external factors that may impact firm performance.
The findings from this analysis will provide valuable insights into the role of ESG in shaping financial performance across different institutional contexts. Furthermore, this study addresses the broader debate on whether sustainability efforts translate into financial benefits, particularly in terms of risk reduction, cost of capital, and long-term firm value.
This paper is structured as follows. Section 2 reviews the literature and develops hypotheses on the ESG–financial performance nexus. Section 3 describes the research design, including the sample, data, and variables. Section 4 presents the empirical analysis, outlining the econometric framework, descriptive statistics, and correlation tests. Section 5 reports and discusses the regression results for ROA, ROE, and WACC across Nordic and non-Nordic European firms. Finally, Section 6 concludes with key findings, managerial implications, limitations, and recommendations for future research.
2. Literature Review and Development of Hypotheses
Environmental, Social, and Governance (ESG) refers to non-financial information regarding how a firm addresses various sustainability issues, and its significance for firm valuation has grown significantly in recent years [1]. Despite the lack of standardized reporting on ESG metrics, scholars argue that ESG disclosures are crucial for adapting to environmental changes and can serve as an integral component of a company’s competitive strategy [2]. ESG scores, readily accessible through various financial databases, are often used as a proxy for corporate sustainability performance [3]. These scores are typically divided into three components: environmental, social, and governance initiatives. The environmental disclosure score evaluates factors such as CO2 emissions and waste management; the social disclosure score assesses areas like equality, human rights, and labor conditions; and the governance disclosure score includes metrics related to shareholder rights, anti-corruption practices, and board structure. The composite ESG score, which combines these three pillars, is offered by well-known databases like ASSET4, SAM, Bloomberg, and Thomson Reuters EikonTM [4], with the latter being the source used in this study.
The relationship between ESG performance and firm financial outcomes has garnered growing attention in academic research over the past decade. ESG disclosures are increasingly recognized as potential drivers of corporate financial performance, although the findings on this relationship remain diverse across regions, industries, and specific ESG pillars. While many studies have examined the individual effects of each ESG component (environmental, social, and governance) on firm performance, there is still a lack of comparative analyses, particularly regarding the differences between ESG impacts on Nordic and non-Nordic European firms. Existing literature reveals three primary patterns regarding the ESG–financial performance link: positive, negative, and neutral/mixed relationships. The findings vary considerably depending on geographic and industry-specific factors. In some regions, the positive impact of ESG initiatives on financial outcomes is more pronounced, while in others, the relationship remains neutral or even negative. This variation underscores the complexity of the ESG-performance relationship, suggesting that ESG factors influence corporate success differently based on contextual variables such as regional maturity, regulatory frameworks, and industry characteristics.
The relationship between ESG (Environmental, Social, and Governance) factors and financial performance has been a subject of scholarly interest since the early 1970s, with the first study on this topic emerging during that period [5] Over the subsequent decades, academic research on ESG and its impact on firm performance has flourished, with more than 2,200 studies published by 2019 [3]. Although the terminology has evolved over time, with terms such as Socially Responsible Investing (SRI) and Corporate Social Performance (CSP) being used interchangeably with ESG, the core focus of these studies remains largely consistent. All of these frameworks aim to assess how sustainable business practices—whether labeled as ESG, SRI, or CSP—affect a company's financial outcomes. This body of research suggests a growing consensus that integrating ESG principles not only contributes to positive social and environmental outcomes but can also result in financial benefits for firms, highlighting the potential for ESG practices to be a source of competitive advantage.
2.1. Positive Relationship:
The relationship between Environmental, Social, and Governance (ESG) scores and firm performance has been extensively examined in the literature, though the findings remain varied. Some studies have reported a positive connection between sustainability practices and financial outcomes. For instance, a meta-analysis conducted by [6] reviewed over 1,000 articles published between 2015 and 2020 and found that 58% of studies identified a positive relationship between ESG performance and financial performance, though the evidence remains mixed. [7] analyzed a sample of 4,887 firms from 2014 to 2018 and concluded that strong performance across the environmental, governance, and social pillars correlates with higher market value. Similarly, [8], examining 1,038 firms across Europe, found a positive association between ESG factors and profitability, specifically Return on Equity (ROE) and Return on Assets (ROA), with governance having a particularly strong effect, especially among German firms.
Several multi-country studies have also supported the positive link between ESG performance and firm financial outcomes. [9] found that most ESG initiatives are positively associated with financial performance, though some results were mixed. [10] examined the financial success of 65 Indian firms between 2015 and 2017 and observed a positive impact of ESG scores on firm performance. Likewise, [11] found a positive relationship between ESG disclosure and firm performance in large Italian firms, noting that the environmental and social pillars had a more significant impact, while governance showed no measurable effect. [12] argued that Corporate Social Responsibility (CSR) governance alone does not directly enhance financial performance, but when combined with environmental and social outcomes, it leads to improved performance metrics such as ROA and Tobin’s Q.
However, not all studies report a positive association. [13] found that in poorly governed environments, particularly in the MENA region, ESG disclosure had a negative impact on firm value, suggesting that effective governance is essential for realizing the financial benefits of ESG engagement. [14] also reported a positive correlation between a firm’s ESG rating and its financial performance, as measured by ROA and Tobin’s Q, and noted that a one-year time lag between ESG performance and financial outcomes was significant. These mixed findings underscore the complexity of the ESG–performance relationship, suggesting that its impact is contingent on regional, industry, and governance contexts.
2.2. Negative Relationship:
While a positive relationship between ESG performance and financial outcomes is widely documented, some studies report a negative connection. [5] conducted a meta-analysis and found a weakly negative relationship between ESG performance and financial performance, suggesting that the benefits of ESG engagement are not universally experienced. Similarly, [15] reported mixed results, with certain ESG factors showing a negative correlation with financial performance. [16], in their analysis of European firms, found that corporate controversies had a negative impact on financial performance (specifically ROE and ROA), with ESG practices alone insufficient to mitigate these financial damages. [17] analyzed 510 firms across 17 countries and concluded that ESG performance generally had a negative and statistically significant effect on financial metrics like ROA, ROE, and Tobin’s Q, particularly due to the negative impact of the environmental and social components. Likewise, studies by [18] and [19] observed negative correlations between ESG scores and both ROA and Tobin’s Q. Additionally, [20] found a negative relationship between WACC and ESG performance, further suggesting that, in certain contexts, ESG initiatives may increase the cost of capital rather than reduce it. These findings highlight the complexity and variability of the ESG–performance relationship, indicating that the impact of ESG factors on financial outcomes may not always be positive and can depend on factors such as corporate governance, industry, and the nature of ESG initiatives.
2.3. Neutral and Mixed Relationships:
In addition to the positive and negative findings, several studies have reported neutral or mixed results regarding the relationship between ESG performance and financial outcomes. [21], in their review of 11 studies, found a mix of positive and negative correlations between ESG scores and firm performance. [22] examined Norwegian companies and observed a positive link between ESG scores and firm value (Tobin’s Q), but a negative correlation with profitability (ROA). Similarly, [23] analyzed the energy sector in India and found mixed outcomes, with the impact of ESG reporting varying by pillar. For example, environmental reporting had a negative effect on financial performance, while social and governance aspects had a positive influence. [24] explored the Turkish market and discovered that environmental reporting negatively impacted financial performance, while the social and governance dimensions showed a positive effect. These findings highlight that the results depend significantly on the ESG index used and the specific context in which ESG data is reported. This variability underscores the need for further research to better understand the nuanced impact of ESG across different regions and industries. Additionally, [25]examined the effect of ESG scores on profitability, firm value, and cost of capital for publicly listed companies in Malaysia, finding no significant relationship between ESG scores and either firm value or profitability, further contributing to the mixed nature of the ESG–financial performance relationship.

Table 1.
Literature on the positive, negative, and mixed and neutral association between ESG and performance.
Table 1.
Literature on the positive, negative, and mixed and neutral association between ESG and performance.
| Firm performance variable measures used | The direction of the relationship with ESG performance | |||
| Positive | Negative | Mixed and Neutral | ||
| Financial performance | ROA | De Lucia et al. (2020) | Nirino et al.,( 2021) | Bhaskaran et al., (2020) |
| Velte (2017) | Shaikh(2022) | Friede et al. (2015) | ||
| Xie et al (2019) | P. & Busru,( 2021) | Buallay (2019) | ||
| Dalal & Thaker (2019) | Sharma et al., (2019) | Saygili et al., (2022) | ||
| Carnini Pulino et al. (2022) | Atan et al (2018) | |||
| Wang & Sarkis (2017) | Giannopoulos et al. (2022) | |||
| Thomas et al., (2021) | Halid et al., (2023) | |||
| ROE | De Lucia et al. (2020) | Shaikh(2022) | Bhaskaran et al.(2020) | |
| Thomas et al.(2021) | Nirino et al., (2021) | Friede et al. (2015) | ||
| Buallay (2019) | ||||
| Halid et al.,( 2023) | ||||
| WACC | Priem & Gabellone, (2022) | Atan et al (2018) | ||
| Source: Prepared by the authors. | ||||
2.4. Hypotheses
Drawing from the literature, the following hypotheses are proposed to explore the relationship between ESG pillar scores and firm performance, specifically focusing on Nordic countries in comparison to non-Nordic European countries.
In light of the literature review above, considering the increased interest from investors and public image of the firm, we expect high performance on ESG scores to have a positive impact on firm value and profitability. The following hypotheses are tested:
2.4.1. Main Hypothesis (H1):
There exists a significant relationship between ESG disclosure scores and firm performance measures in Nordic countries, and this relationship can be compared with that of firms in non-Nordic European countries.
2.4.2. Sub-Hypotheses:
- H1a (Environmental Pillar): The environmental disclosure score (E) has a significant impact on firm performance measures.
Rationale: Based on the literature, environmental performance can lead to reduced operational costs and improved reputation, thereby boosting financial outcomes. Given the strong environmental policies and practices in Nordic countries, we expect this effect to be particularly significant in Nordic firms compared to non-Nordic European countries.
- H1b (Social Pillar): The social disclosure score (S) has a significant impact on firm performance measures.
Rationale: Strong social performance is linked to better customer relations, employee satisfaction, and long-term profitability. This relationship is expected to be more pronounced in Nordic countries, where social responsibility is more heavily emphasized in business culture.
- H1c (Governance Pillar): The governance disclosure score (G) has a significant impact on firm performance measures.
Rationale: Well-governed firms tend to have better risk management and lower capital costs, which in turn enhance profitability and firm value. In Nordic countries, with their strong governance standards, the governance pillar is likely to have a stronger positive effect on financial performance compared to non-Nordic European countries.
Many academic studies and observations from market practice suggest a positive relationship between ESG and firm value and profitability. However, there are also quite a number of negative and mixed results in previous research. Using the hypotheses, the paper will attempt to contribute to this debate with a large, recent, and comprehensive dataset.
3. Research Methodology
This section outlines the methodology employed to explore the relationship between Environmental, Social, and Governance (ESG) performance and firm financial outcomes. The analysis focuses on three key dependent variables: Return on Assets (ROA), Return on Equity (ROE), and Weighted Average Cost of Capital (WACC).
The independent variables in this study include overall ESG performance as well as the individual pillars of ESG: Environmental (E), Social (S), and Governance (G). To account for additional factors that may affect firm performance, control variables such as leverage, beta, and firm size are incorporated into the models.
For each dependent variable, three panel data models are applied, while four models are estimated for each independent variable to assess the impact of ESG disclosures on financial performance.
Most of the existing literature reviewed in this study employs a quantitative research methodology, with a few exceptions utilizing case study approaches. For example, [26] incorporate a survey for part of their data collection, focusing on corporate social responsibility and firm reputation. However, reputation is inherently qualitative, and thus, a qualitative methodology is required. Since it is not feasible to analyze financial data through surveys or other qualitative methods, this approach does not align with the research objectives of the current study.
In contrast, quantitative research is often employed to examine the correlation between variables that can be expressed numerically [27]. Given that this study seeks to explore the relationship between numerically defined variables, a quantitative approach is deemed the most suitable for addressing the research objectives. Therefore, this methodology has been selected for the present investigation.
3.1. Sample Data
The sample consists of publicly listed European firms collected from the Refinitiv database over the period 2015–2024. We restrict the dataset to companies with available ESG scores, resulting in approximately 2,450 firm-year observations annually, or 24,500 observations in total. Of these, 530 firm-year observations (around 22% of the sample) correspond to Nordic companies, while the remaining 1,920 observations per year are drawn from the non-Nordic European countries. To construct the final sample, ESG scores were combined with financial data to form a complete dataset. The sample for this study was restricted to publicly listed and de-listed (inactive) companies across the Nordic and non-Nordic European countries' exchanges, as recommended by [28] and [29]. This approach helps mitigate survivorship bias, ensuring more robust and generalizable inferences about the relationship between ESG and financial performance. This is especially important for the return analysis. Companies without an ESG score for the period from 2015 to 2024 were excluded, although companies with limited annual ESG score data were included. This filtering criterion ensures that the dataset remains representative and relevant.
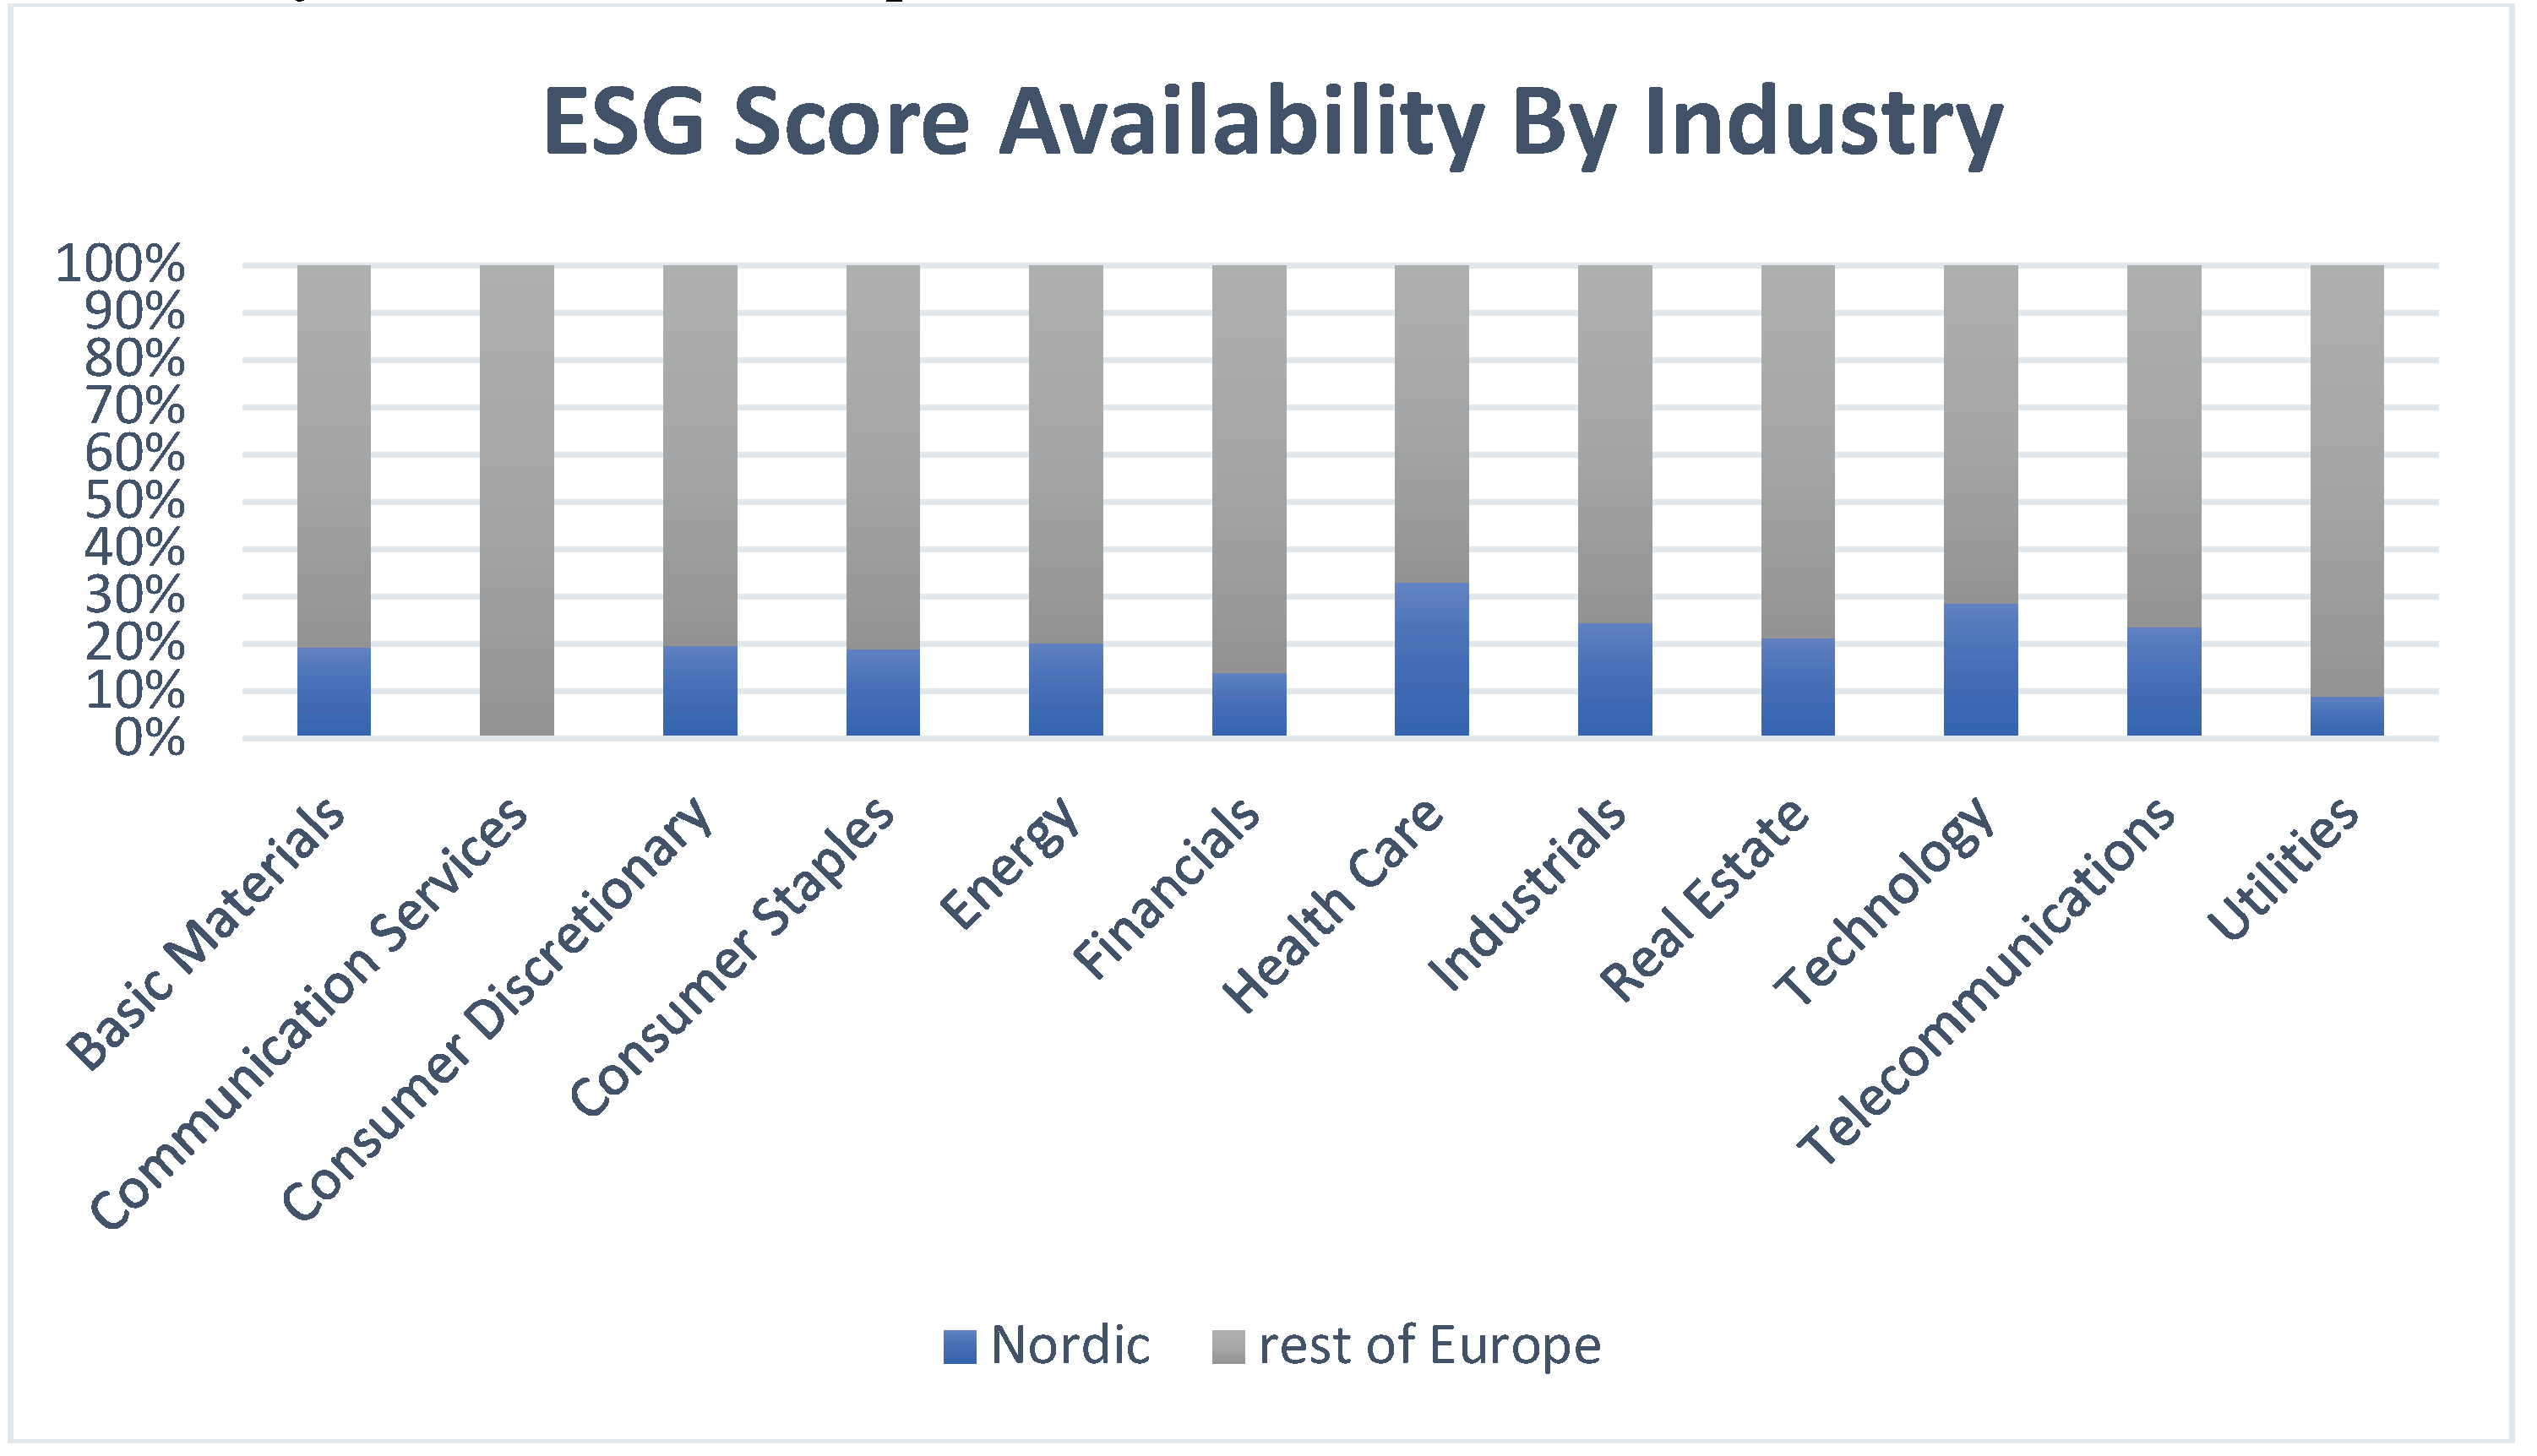
To further enhance the robustness of the analysis, the sample was limited to the period from 2015 to 2024, ensuring the data is both current and reliable. Extreme outliers in key variables, such as ROA, ROE, and WACC, were winsorized to minimize the effect of anomalous values. Specifically, values at the fifth and 95th percentiles were ranked. This method, commonly used in academic research, reduces the influence of extreme values that could otherwise distort the results, ensuring the reliability of the statistical analysis and preventing misleading conclusions. The 2450 sample firms belong to 12 different sectors, as reported below in Fig.1.
The data collected for this study are annual firm-level panel observations combining ESG disclosure scores from Refinitiv (LSEG) with financial statement and market variables. Focusing on 2015–2024 ensures reliable and consistent ESG coverage, as prior to 2015 reporting was sparse and uneven across countries. This period also captures important developments in European ESG regulation and reporting standards, which makes the findings more relevant to current debates. Using both active and delisted firms reduces survivorship bias, and the inclusion of 12 industries ensures broad sectoral representation. By restricting the sample to publicly listed companies, the study aligns with the availability of standardized ESG data but may not reflect private firms’ practices. Future research could extend the analysis to post-2024 data to examine whether the relationships documented here persist as ESG regulations continue to evolve, and could also include alternative data sources or higher-frequency disclosures (e.g., quarterly or event-driven) to capture shorter-term dynamics in the ESG-performance link.
Figure 1.
ESG Score Availability By Industry. Source: Prepared by the authors.
4. Empirical Analysis
4.1. Measurement of Variables
4.1.1. Dependent variables
There are three financial performance indicators in the present analysis, which are defined as the dependent variables. Following prior literature ([15,22,24] the first two measures considered in the study are ROA (return on assets) and ROE (return on equity). While ROA is measured as the proportion of net income to total assets, ROE is the ratio between net income to shareholders’ equity [14,25]. The Weighted-Average Cost of Capital (WACC) is the third dependent variable. The cost of capital is the rate of return a company requires to finance its investments, representing the weighted average cost of equity and debt[20].
4.1.2. Control variables
4.1.3. Independent
The paper uses four independent variables, namely ESG combined score, Environment score, Social score, and Governance score. All ESG scores are from Refinitiv. Many researchers prefer to use Refinitiv ESG scores in their papers[22,30]. In this study, the LSEG database ESG score is updated continuously with weekly recalculations; however, the ESG scores are only reported annually, so that each firm’s official ESG score is only finalised and published once a year. This may put limitations on the transparency of their actual ESG performance because it can fluctuate throughout the year.
Three pillars and their themes are as follows: Environment (emissions, innovation, and resource usage), Social (human rights, workforce, product responsibility, and community), and Governance (shareholders, management, and CSR Strategy). Refinitiv gathers most of the data from public sources such as business websites, annual reports, and other company reports. They also obtain some of the data directly from the company. They audit and standardize this data and prepare ESG scores.
4.2. Empirical Framework
To investigate the research objectives of this study, panel data regression is employed. The dataset consists of panel data from 2450 companies over a period of 10 years. The analysis uses three primary dependent variables: Return on Assets (ROA), Return on Equity (ROE), and Weighted Average Cost of Capital (WACC), to measure financial performance.
4.3. Hausman test:
To decide whether to use a fixed effect or a random effect model when conducting the regression, the Hausman test is used. The aim is to test the null hypothesis; therefore, the random effects model should be used. The results from this test, using the dependent variables ROA, ROE, and WACC, are presented in Table 3 and Table 4 below. The test shows that the p-value is significant at a 5% level for the dependent variables in the rest of Europe and insignificant at 5% in Nordic countries. The null hypothesis is thus rejected for the latter. Furthermore, this implies that a fixed effects test should be used for all dependent variables in the rest of Europe, and a random effects test should be used for all dependent variables in Nordic countries.
So the final model for Nordic and non-Nordic countries are estimated as follows:
4.4. Descriptive Statistics:
The descriptive statistics reveal notable variations in both ESG scores and financial performance metrics across the sample. The mean ESG score is 51.80, with substantial variability, as indicated by a standard deviation of 20.91, and the median score of 53.08 suggests a slightly skewed distribution toward higher values. Among the ESG pillars, the social pillar (SESG) shows the highest mean (55.25) and the greatest variability (27.73), while the governance pillar (GESG) has a mean of 50.62, indicating a more balanced distribution compared to environmental or social scores. Financial performance indicators show moderate profitability, with the mean ROA at 0.0421 and ROE at 0.1067, both with low variability. The WACC reflects considerable variation across firms, suggesting differences in firms' financing conditions. The leverage ratio is 0.5909, indicating moderate debt usage across firms, while beta suggests a diverse range of systematic risk levels. The mean log of market capitalization is 20.91, with significant variation, as evidenced by a maximum value of 26.76, highlighting the presence of both small and large firms in the sample. Overall, the sample presents considerable heterogeneity, which is crucial for understanding the ESG-performance relationship in the context of firm-level differences.
Table 5.
Descriptive statistics.
| mean | sd | median | mad | min | max | |
|---|---|---|---|---|---|---|
| ESG_Score | 51.8034 | 20.9069 | 53.0784 | 23.6352 | 0.6856 | 95.6782 |
| EESG_Score | 47.4218 | 27.3601 | 48.1523 | 33.7489 | 0 | 99.0634 |
| SESG_Score | 55.2456 | 23.7315 | 57.3183 | 27.3202 | 0.2774 | 98.2021 |
| GESG_Score | 50.6151 | 23.3312 | 51.5280 | 28.2071 | 0.3234 | 98.8877 |
| ROA | 0.0421 | 0.0600 | 0.0405 | 0.0451 | -0.1074 | 0.1618 |
| ROE | 0.1067 | 0.1422 | 0.1088 | 0.0961 | -0.2582 | 0.3873 |
| WACC | 1.6954 | 1.0811 | 1.2619 | 0.5091 | 0.7504 | 4.8703 |
| Leverage | 0.5909 | 2.1842 | 0.5664 | 0.2375 | 0 | 309.8930 |
| Beta | 0.9452 | 0.5519 | 0.9011 | 0.4930 | -3.2237 | 8.5386 |
| log_Market_cap | 20.9103 | 1.9592 | 20.8732 | 1.9023 | 5.0519 | 26.7567 |
| Source: Prepared by the authors. | ||||||
4.5. Correlation Matrix:
The table provides the Pearson correlation matrix for each variable. As the table shows, there is no significant correlation between ESG scores and ROA; however, ESG scores are highly correlated among themselves. This is not surprising because Refinitiv uses the individual Environmental (E), Social (S), and Governance (G) scores to calculate the overall ESG score. To mitigate this correlation issue, we run different models for each individual ESG score.
We also see from the table that there is a relatively strong positive correlation between ROA and ROE, which is expected as both ratios reflect the company’s financial performance. In addition, there is a moderate correlation between all ESG scores (particularly the overall ESG score) and firm size (log of Market Cap), indicating that larger companies tend to have higher ESG scores.
With regard to WACC, the results show a small but consistent negative correlation with ESG scores, as well as with ROA. This suggests that firms with higher ESG scores or better operating performance may benefit from a slightly lower cost of capital.
The multicollinearity among independent variables has to be examined before conducting regression analysis. For each regression equation, the variance inflation factor (VIF) is also used to test for collinearity. There is no problem with multicollinearity since the VIF of all the variables across all of the equations is less than 10.
Table 6.
Correlation matrix.
| (1) | (2) | (3) | (4) | (5) | (6) | (7) | (8) | (9) | (10) | |
| ESG_Score(1) | 1 | |||||||||
| EESG_Score(2) | 0.85160 | 1 | ||||||||
| SESG_Score(3) | 0.89935 | 0.73128 | 1 | |||||||
| GESG_Score(4) | 0.72388 | 0.42731 | 0.45580 | 1 | ||||||
| ROA(5) | 0.06849 | 0.06044 | 0.07043 | 0.03622 | 1 | |||||
| ROE(6) | 0.12162 | 0.11092 | 0.11446 | 0.07775 | 0.76114 | 1 | ||||
| WACC(7) | -0.10214 | -0.15713 | -0.06396 | -0.06214 | 0.38341 | 0.28889 | 1 | |||
| Leverage(8) | 0.16597 | 0.17393 | 0.14126 | 0.12024 | -0.25741 | 0.07656 | -0.11494 | 1 | ||
| Beta(9) | 0.05490 | 0.04573 | 0.01527 | 0.10660 | -0.16326 | -0.10241 | -0.10581 | 0.13294 | 1 | |
| log_Market_cap(10) | 0.59829 | 0.56728 | 0.55656 | 0.37769 | 0.27415 | 0.28028 | 0.13883 | 0.03695 | -0.10396 | 1 |
| Source: Prepared by the authors. | ||||||||||
5. Results and Discussion
In line with prior studies, the results highlight important regional differences in the ESG–performance nexus. Consistent with [15] and [22], Nordic firms appear to benefit from stronger ESG practices primarily through lower financing costs, supporting the view of ESG as a mechanism to reduce firm-specific risk. However, similar to findings in [24] on Turkish firms and [16]on corporate controversies, the results for the broader European sample show that higher ESG scores are often associated with weaker short-term profitability (ROA and ROE). This suggests that the upfront costs of sustainability investments may outweigh immediate benefits in less mature ESG environments. At the same time, governance quality consistently demonstrates a positive role in reducing WACC across both samples, confirming evidence from [10]and [8]that effective governance mechanisms enhance investor confidence and financing efficiency. Taken together, these results reinforce [5]meta-analysis, which reported that while the majority of ESG–performance studies find neutral or positive outcomes, the effect is highly sensitive to context, measurement, and time horizon.
5.1. Return on Equity (ROA)
Table 7, Table 8, and Table 9 present the results of the regression models. Table 7 presents four different models to show the panel regression results of the relationship between ROA as a dependent variable and the independent factors—ESG Score, Environmental Score, Social Score, and Governance Score. The regressions are run on a sample of 530 companies and 2886 observations for Nordic companies, and also 1920 companies and 11717 observations in the rest of Europe. The association between ESG scores and ROA differs substantially between Nordic and European firms. For the Nordic sample, none of the ESG variables (total score or pillars) show significant coefficients. The effects are close to zero, indicating that ESG practices do not measurably impact asset-based profitability in this region. This finding may reflect the fact that many Nordic companies have already integrated sustainability into their business models for years, meaning additional ESG improvements do not generate immediate, observable changes in ROA. As highlighted in the descriptive analysis, commitments to ESG in this region may be long-term oriented, with financial benefits materializing only after significant time lags.
In contrast, for the European sample, the relationship is significant and negative for the overall ESG score (p<0.01). The coefficient indicates that ROA decreases as ESG scores increase, suggesting that firms that invest more heavily in ESG initiatives may initially face reduced profitability. This can be explained by the upfront costs of implementing ESG strategies, such as new technologies or compliance requirements, without immediate corresponding gains in revenues or efficiency. The negative relationship observed between ESG and ROA is consistent with prior studies, such as[17,19,22,31].
Regarding control variables, in both samples, leverage is negatively and significantly associated with ROA, confirming that higher debt levels reduce profitability. Firm size, measured by the log of market capitalization, is positively and significantly related to ROA in both regions, suggesting that larger firms benefit from economies of scale or stronger operational capacities. Market beta does not show a significant impact in either case.
the findings reveal a divergence: in the Nordic region, ESG appears to be neutral for ROA in the short term, while in Europe, higher ESG scores are significantly linked to lower ROA, reflecting the costs of sustainability investments that have yet to translate into higher returns.
5.2. Return on Equity (ROE)
Table 8 presents four different models to show the panel regression results of the relationship between ROE as a dependent variable and the independent factors—ESG Score, Environmental Score, Social Score, and Governance Score. The regressions are run on a sample of 530 companies and 2886 observations for Nordic companies, and also 1920 companies and 11716 observations in the rest of Europe. The association between ESG scores and ROE differs substantially between Nordic and European firms.
For the Nordic sample, the results show that neither the aggregate ESG score nor the three ESG pillars (E, S, G) have any statistically significant association with ROE. The coefficients are very small and close to zero, implying that improvements in ESG practices do not directly influence shareholder profitability in the short term. This may reflect that Nordic companies, already advanced in ESG integration, face diminishing marginal returns from incremental improvements in sustainability. The absence of significance suggests that any long-term advantages from ESG initiatives (such as reputational gains or efficiency improvements) may not yet be reflected in immediate equity returns.
In contrast, the European sample shows a weak but significant negative association between ESG and ROE. The coefficient on the total ESG score is negative and significant at the 10% level (p<0.1), while the Environmental score also appears with a small but statistically significant negative coefficient (p<0.1). This indicates that, for European firms, higher ESG scores are associated with slightly lower ROE. One interpretation is that investments in environmental initiatives, although necessary, impose short-term costs that reduce returns to shareholders. The social and governance dimensions are not statistically significant, suggesting their influence on ROE is either weaker or takes longer to materialize. The negative relationship observed between ESG and ROE is consistent with prior studies, such as [16,17].
Control variables behave consistently across both regions. Leverage has a strong and positive impact on ROE in both Nordic and European firms, reflecting the classical financial principle that debt amplifies returns on equity when firms are profitable. Likewise, firm size (log market cap) is positively and significantly associated with ROE, indicating that larger firms achieve higher returns for shareholders, likely due to scale advantages and stronger market positions. On the other hand, beta carries a negative sign in both samples, but the effect is statistically insignificant, implying that market risk does not play a decisive role in explaining ROE in this dataset.
the findings suggest that ESG has a neutral impact on ROE in Nordic firms, while in European firms, ESG—particularly environmental initiatives—is weakly but significantly linked to lower shareholder returns. This points to a potential trade-off in the short term, where sustainability investments may constrain immediate profitability, though the long-term benefits may not yet be fully realized.
5.3. Weighted Average Cost of Capital (WACC)
Table 9 presents four different models to show the panel regression results of the relationship between WACC as a dependent variable and the independent factors—ESG Score, Environmental Score, Social Score, and Governance Score. The regressions are run on a sample of 530 companies and 3180 observations for Nordic companies, and also 1920 companies and 12972 observations in the rest of Europe. The association between ESG scores and WACC differs substantially between Nordic and European firms.
For the Nordic sample, the association between ESG scores and WACC is negative and highly significant (p<0.01). The coefficient for the total ESG score (–0.0001) indicates that an improvement in ESG disclosure is consistently associated with a reduction in financing costs. When disaggregated, all three pillars — Environmental, Social, and Governance — are also negative and statistically significant at the 1% level. This suggests that across all dimensions, firms with stronger ESG performance are rewarded with lower costs of capital. The rationale is consistent with theory: Nordic companies with robust ESG practices are perceived as less risky by investors and creditors, resulting in lower required returns. This result aligns with prior studies that argue ESG can mitigate risk exposures and thus reduce financing costs in developed markets.
In contrast, for the European sample, the relationship is weaker. The total ESG score does not show a statistically significant effect on WACC. Among the pillars, only Governance exhibits a significant negative association (p<0.01). The coefficient (–0.00004) is small but noteworthy, indicating that better governance practices reduce WACC, while the Environmental and Social pillars remain insignificant. This result suggests that, within Europe as a whole, markets primarily reward governance quality rather than environmental or social factors in determining financing costs. One possible explanation is that governance mechanisms are more directly tied to investor protection, transparency, and managerial oversight, which investors in European markets may prioritize when assessing risk. The negative relationship observed between ESG and WACC is consistent with prior studies, such as[20,32]
Control variables reinforce expected financial theory in both samples. Market beta is positive and highly significant, showing that firms with higher systematic risk face a higher WACC, consistent with CAPM predictions. In the Nordic case, leverage is negative and significant, suggesting that debt is comparatively cheaper and reduces the weighted cost of capital, possibly due to favorable credit conditions or tax shields. By contrast, leverage has no significant impact on the European sample, where the larger dataset and stricter financial environments may neutralize this effect. Finally, firm size (log of market capitalization) is positively and significantly associated with WACC in both regions, indicating that larger firms face slightly higher financing costs — perhaps due to greater reliance on equity financing or stricter investor expectations.
the results indicate that for Nordic firms, ESG performance across all three pillars robustly lowers WACC, while for European firms, only governance contributes significantly to reducing financing costs. These findings highlight a regional distinction: Nordic markets broadly reward sustainability efforts with cheaper capital, whereas European markets remain more cautious, valuing governance above other ESG dimensions in shaping firms’ cost of capital.
6. Conclusions
This paper compared how ESG disclosure relates to firm performance across Nordic and non-Nordic European firms over 2015–2024, using ROA, ROE, and WACC as outcomes. Three findings stand out. First, in the Nordic subsample, higher overall ESG and each E/S/G pillar are consistently associated with lower WACC, while ROA and ROE remain statistically unchanged—evidence that markets in ESG-mature contexts primarily reward sustainability through cheaper financing rather than through immediate accounting returns. Second, outside the Nordics, higher ESG is linked to lower ROA and marginally lower ROE, whereas only the governance pillar materially reduces WACC—consistent with short-run investment and compliance costs as well as investor emphasis on shareholder protections. Third, control variables behave as predicted by finance theory, supporting the internal validity of the estimates.
Beyond the empirical findings, the study contributes to both theory and practice. The results from Nordic firms indicate that ESG engagement is primarily rewarded through reduced financing costs, which supports the view of ESG as a risk-mitigation mechanism. By contrast, the negative association between ESG and profitability in the broader European context highlights the short-term trade-offs that firms may face when allocating resources to sustainability initiatives. These contrasting outcomes enrich the ongoing debate on whether ESG creates or erodes value and emphasize the importance of considering institutional maturity when evaluating ESG impacts.
From a managerial perspective, the evidence suggests that firms operating in ESG-mature environments should continue to invest in sustainability reporting and practices, as such initiatives translate into tangible financial advantages in the form of lower capital costs. In less mature markets, however, managers may need to adopt a more selective strategy—prioritizing governance reforms and cost-efficient environmental and social initiatives that can deliver visible returns in both performance and credibility.
For policymakers and regulators, the results highlight the need to tailor ESG frameworks to regional contexts. Stronger institutional support, harmonized disclosure standards, and incentives for long-term investment can reduce the apparent performance trade-offs observed outside the Nordics. In particular, aligning reporting frameworks across Europe would help reduce information asymmetry and enable investors to better price sustainability practices into firm valuation and financing conditions.
Finally, the study opens several avenues for future research. Extending the analysis beyond 2024 will allow scholars to observe whether the negative short-term ESG-profitability link transitions into positive long-term value creation. Incorporating additional outcomes—such as stock returns, valuation multiples, or credit spreads—could provide a more comprehensive picture of how capital markets reward sustainability. Moreover, disaggregating ESG pillars into finer components (e.g., emissions, workforce training, board diversity) may reveal which practices are most effective in improving performance. By addressing these areas, future research can build on this study’s insights and further clarify the complex relationship between ESG and firm performance across institutional contexts.
Abbreviations
The following abbreviations are used in this manuscript:
| ESG | Environmental, Social and Governance |
| E | Environmental |
| S | Social |
| G | Governance |
| ROE | Return on Equity |
| ROA | Return on Assets |
| WACC | Weighted Average Cost of Capital |
| β | Beta |
| OLS | Ordinary Least Squares |
| FE | Fixed Effects |
| RE | Random Effects |
References
- Bassen and A., M. Kovács, “Environmental, Social and Governance Key Performance Indicators from a Capital Market Perspective,” zfwu Zeitschrift für Wirtschafts- und Unternehmensethik, vol. 9, no. 2, pp. 182–192, Aug. 2008. [CrossRef]
- J. Galbreath, “ESG in Focus: The Australian Evidence,” J Bus Ethics, vol. 118, no. 3, pp. 529–541, Dec. 2013. [CrossRef]
- S. Drempetic, C. Klein, and B. Zwergel, “The Influence of Firm Size on the ESG Score: Corporate Sustainability Ratings Under Review,” J Bus Ethics, vol. 167, no. 2, pp. 333–360, Nov. 2020. [CrossRef]
- G. Dorfleitner, G. Halbritter, and M. Nguyen, “Measuring the level and risk of corporate responsibility – An empirical comparison of different ESG rating approaches,” J Asset Manag, vol. 16, no. 7, pp. 450–466, Dec. 2015. [CrossRef]
- G. Friede, T. Busch, and A. Bassen, “ESG and financial performance: aggregated evidence from more than 2000 empirical studies,” Journal of Sustainable Finance & Investment, vol. 5, no. 4, pp. 210–233, Oct. 2015. [CrossRef]
- T. Whelan, U. Atz, and C. Clark, “ESG AND FINANCIAL PERFORMANCE:,” 2020.
- R. K. Bhaskaran, I. W. K. Ting, S. K. Sukumaran, and S. D. Sumod, “Environmental, social and governance initiatives and wealth creation for firms: An empirical examination,” Managerial and Decision Economics, 2020. [CrossRef]
- De Lucia, P. Pazienza, and M. Bartlett, “Does Good ESG Lead to Better Financial Performances by Firms? Machine Learning and Logistic Regression Models of Public Enterprises in Europe,” Sustainability, vol. 12, no. 13, p. 5317, Jan. 2020. [CrossRef]
- J. Xie, W. J. Xie, W. Nozawa, M. Yagi, H. Fujii, and S. Managi, “Do environmental, social, and governance activities improve corporate financial performance?,” Business Strategy and the Environment, vol. 28, no. 2, pp. 286–300, 2019. [CrossRef]
- K. K. Dalal and N. Thaker, “ESG and Corporate Financial Performance: A Panel Study of Indian Companies,” IUP Journal of Corporate Governance, vol. 18, no. 1, pp. 44–59, Jan. 2019.
- S. Carnini Pulino, M. Ciaburri, B. S. Magnanelli, and L. Nasta, “Does ESG Disclosure Influence Firm Performance?,” Sustainability, vol. 14, no. 13, p. 7595, Jan. 2022. [CrossRef]
- Z. Wang and J. Sarkis, “Corporate social responsibility governance, outcomes, and financial performance,” Journal of Cleaner Production, vol. 162, pp. 1607–1616, Sept. 2017. [CrossRef]
- J. Thomas, “The impact of sustainability practices on firm financial performance: evidence from Malaysia / Christopher Jerry Thomas...[et al.],” 2021.
- P. Velte, “Does ESG Performance Have an Impact on Financial Performance? Evidence from Germany,” Feb. 14, 2017, Social Science Research Network, Rochester, NY: 2916741. Accessed: Apr. 24, 2025. [Online]. Available: https://papers.ssrn.com/abstract=2916741.
- Buallay, “Sustainability reporting and firm’s performance: Comparative study between manufacturing and banking sectors,” International Journal of Productivity and Performance Management, vol. 69, no. 3, pp. 431–445, Dec. 2019. [CrossRef]
- N. Nirino, G. Santoro, N. Miglietta, and R. Quaglia, “Corporate controversies and company’s financial performance: Exploring the moderating role of ESG practices,” Technological Forecasting and Social Change, vol. 162, p. 120341, Jan. 2021. [CrossRef]
- Shaikh, “ENVIRONMENTAL, SOCIAL, AND GOVERNANCE (ESG) PRACTICE AND FIRM PERFORMANCE: AN INTERNATIONAL EVIDENCE,” Journal of Business Economics and Management, vol. 23, no. 1, pp. 218–237, Jan. 2022. [CrossRef]
- F. P. and S. A. Busru, “CSR disclosure and firm performance: evidence from an emerging market,” Corporate Governance, vol. 21, no. 4, pp. 553–568, Jan. 2021. [CrossRef]
- Sharma, S. Bhattacharya, and S. Thukral, “Resource-based view on corporate sustainable financial reporting and firm performance: evidences from emerging Indian economy,” International Journal of Business Governance and Ethics, vol. 13, no. 4, pp. 323–344, 2019.
- R. Priem and A. Gabellone, “The Impact of a Firm’s ESG Score on Its Cost of Capital: Can a High ESG Score Serve as a Substitute for a Weaker Legal Environment?,” Nov. 25, 2022, Social Science Research Network, Rochester, NY: 4286057. [CrossRef]
- S. Halid, R. A. Rahman, R. Mahmud, N. Mansor, and R. A. Wahab, “A Literature Review on ESG Score and Its Impact on Firm Performance,” International Journal of Academic Research in Accounting, Finance and Management Sciences, vol. 13, no. 1, pp. 272–282, Jan. 2023.
- G. Giannopoulos, R. V. Kihle Fagernes, M. Elmarzouky, and K. A. B. M. Afzal Hossain, “The ESG Disclosure and the Financial Performance of Norwegian Listed Firms,” Journal of Risk and Financial Management, vol. 15, no. 6, p. 237, 22. 20 June. [CrossRef]
- Kumari, H. Makhija, and D. Sharma, “Exploring the relationship of ESG score and firm value using cross-lagged panel analyses: case of the Indian energy sector,” Ann Oper Res, vol. 313, no. 1, pp. 231–256, 22. 20 June. [CrossRef]
- Arslan, and A. O. Birkan, “ESG practices and corporate financial performance: Evidence from Borsa Istanbul,” Borsa Istanbul Review, vol. 22, no. 3, pp. 525–533, 22. 20 May. [CrossRef]
- R. Atan, M. M. Alam, J. Said, and M. Zamri, “The Impacts of Environmental, Social, and Governance Factors on Firm Performance: Panel Study of Malaysian Companies.” Accessed: Apr. 24, 2025. [Online]. Available: https://www.sciencegate.app/document/10.31235/osf.
- K. Nyborg and T. Zhang, “Is Corporate Social Responsibility Associated with Lower Wages?,” Environ Resource Econ, vol. 55, no. 1, pp. 107–117, May 2013. [CrossRef]
- M. Elmarzouky, K. Hussainey, T. Abdelfattah, and A. E. Karim, “Corporate risk disclosure and key audit matters: the egocentric theory,” IJAIM, vol. 30, no. 2, pp. 230–251, Apr. 2022. [CrossRef]
- Halbritter and, G. Dorfleitner, “The wages of social responsibility — where are they? A critical review of ESG investing,” Review of Financial Economics, vol. 26, pp. 25–35, Sept. 2015. [CrossRef]
- Landi and, M. Sciarelli, “The impact of ESG rating on corporate financial performance,” ResearchGate, 2018. [CrossRef]
- E. Duque-Grisales and J. Aguilera-Caracuel, “Environmental, Social and Governance (ESG) Scores and Financial Performance of Multilatinas: Moderating Effects of Geographic International Diversification and Financial Slack,” J Bus Ethics, vol. 168, no. 2, pp. 315–334, Jan. 2021. [CrossRef]
- P. Fahad and S. A. Busru, “CSR disclosure and firm performance: evidence from an emerging market,” Corporate Governance, vol. 21, no. 4, pp. 553–568, 2021. [CrossRef]
- R. Atan, M. M. Alam, J. Said, and M. Zamri, “The impacts of environmental, social, and governance factors on firm performance: Panel study of Malaysian companies,” Management of Environmental Quality: An International Journal, vol. 29, no. 2, pp. 182–194, Mar. 2018. [CrossRef]
Table 2.
Variables of the Study.
| Variables | Labels | Formula | Description |
| Dependent variables | |||
| ROA | Net Income/Total Assets | Return on assets is the calculation of the profitability as a percentage of the net Income in proportion to all the assets owned by the company. | |
| ROE | Net income/shareholders’ equity | Return on equity determines the benefit as a proportion of the net income to the shareholder equity. | |
| WACC | [D/ (D + E)].RE +[E/ (D + E)]. RD .(1 -T) | The cost of capital is the rate of return a company requires to finance its investments, representing the weighted average cost of equity and debt. | |
| Independent variables | |||
| ESG score | ESG | The scores range from 1 to 100 | Total combined score |
| Environment score | E_score | The scores range from 1 to 100 | Environment score of the sample companies |
| Social score | S_score | The scores range from 1 to 100 | Social score of the sample companies |
| Governance score | G_score | The scores range from 1 to 100 | Governance score of the sample companies |
| Control variables | |||
| BETA | beta factor | Systematic risk of a company's stock | |
| LEVERAGE | Total debt / total assets | Leverage is using third-party capital to finance part of a company’s investments, increasing the potential return for shareholders and financial risk | |
| SIZE | ln(market capitalization) | Natural logarithm of market capitalization. | |
Source: Prepared by the authors.
Table 3.
Hausman Test Results for Nordic countries.
| Dependent variables | Test result | Chi-square | p-value |
| ROA | Fixed effects | 183.67 | 2.2e-16 |
| ROE | Fixed effects | 125.51 | 2.2e-16 |
| WACC | Fixed effects | 216.93 | 2.2e-16 |
Table 4.
Hausman Test Results for non-Nordic countries.
| Dependent variables | Test result | Chi-square | p-value |
| ROA | Random effects | 6.19 | 0.939 |
| ROE | Random effects | 18.828 | 0.1285 |
| WACC | Random effects | 11.305 | 0.5853 |
Source: Prepared by the authors.
Table 7.
Dependent Variable: ROA.
| Dependent variable: ROE |
Nordic (Random effects) | non-Nordic (Fixed effects) | |||||||||
| Model 1 | Model 2 | Model 3 | Model 4 | Model 1 | Model 2 | Model 3 | Model 4 | ||||
| Independent variables: | |||||||||||
| ESG | -0.0003 0.0003 |
-0.0003* 0.0001 |
|||||||||
| E_score | -0.0004 0.0002 |
-0.0002* 0.0001 |
|||||||||
| S_score | 0.0001 0.0002 |
0.0000 0.0001 |
|||||||||
| G_score | -0.0002 0.0002 |
-0.0004 0.0001 |
|||||||||
| Control variables: | |||||||||||
| Beta | -0.0072 0.0074 |
-0.0069 0.0074 |
-0.0079 0.0074 |
-0.0073 0.0074 |
-0.0028 0.0027 |
-0.0028 0.0027 |
-0.0028 0.0027 |
-0.0024 0.0027 |
|||
| Leverage | 0.1369*** 0.0159 |
0.1391*** 0.0160 |
0.1339*** 0.0159 |
0.1350*** 0.0158 |
0.0370*** 0.0062 |
0.0373*** 0.0063 |
0.0371*** 0.0063 |
0.0368 0.0063 |
|||
| log_Market_cap | 0.0501*** 0.0031 |
0.0508*** 0.0030 |
0.0479*** 0.0030 |
0.0492*** 0.0028 |
0.0443*** 0.0020 |
0.0444*** 0.0020 |
0.0441*** 0.0020 |
0.0442 0.0020 |
|||
| Constant | -0.9949 *** 0.0720 |
-1.0053*** 0.0716 |
-0.9654*** 0.0718 |
-0.9826*** 0.0700 |
- |
- | - | - | |||
| R2 | 0.14485 | 0.14546 | 0.14435 | 0.14512 | 0.075373 | 0.074817 | 0.074817 | 0.076724 | |||
| Observations(N) | 2886 | 2886 | 2886 | 2886 | 11716 | 11715 | 11715 | 11716 | |||
.Source: Prepared by the authors.
Table 8.
Dependent Variable: ROE.
| Dependent variable: ROA |
Nordic (Random effects) | non-Nordic (Fixed effects) | ||||||||
| Model 1 | Model 2 | Model 3 | Model 4 | Model 1 | Model 2 | Model 3 | Model 4 | |||
| Independent variables: | ||||||||||
| ESG | -0.00004 0.00013 |
-0.00014*** 0.00004 |
||||||||
| E_score | -0.00007 0.00009 |
-0.00010*** 0.00003 |
||||||||
| S_score | 0.0001 0.0001 |
-0.0001 0.0000 |
||||||||
| G_score | -0.0001 0.0001 |
-0.0001 0.0000 |
||||||||
| Control variables: | ||||||||||
| Beta | -0.0009 0.00348 |
-0.00084 0.00348 |
-0.0011 0.0035 |
-0.0009 0.0035 |
-0.00674*** 0.00093 |
-0.00674*** 0.00093 |
-0.0068*** 0.0009 |
-0.0066 0.0009 |
||
| Leverage | -0.0379*** 0.00768 |
-0.03730*** 0.00771 |
-0.0385*** 0.0077 |
-0.0381*** 0.0076 |
-0.02420*** 0.00215 |
-0.02404*** 0.00215 |
-0.0242*** 0.0022 |
-0.0242 0.0022 |
||
| log_Market_cap | 0.0305*** 0.00154 |
0.03069*** 0.00151 |
0.0299*** 0.0015 |
0.0304*** 0.0014 |
0.01925*** 0.00069 |
0.01926*** 0.00069 |
0.0192*** 0.0007 |
0.0191 0.0007 |
||
| Constant | -0.5706*** 0.03725 |
-0.57359*** 0.0372 |
-0.5643*** 0.0372 |
-0.5699*** 0.0367 |
- | - | - | - | ||
| R2 | 0.19264 | 0.19282 | 0.19287 | 0.19295 | 0.13739 | 0.13748 | 0.13669 | 0.13698 | ||
| Observations(N) | 2886 | 2886 | 2886 | 2886 | 11717 | 11717 | 11717 | 11717 | ||
| Source: Prepared by the authors. | ||||||||||
Table 9.
Dependent Variable: WACC.
| Dependent variable: WACC |
Nordic (Random effects) | non-Nordic (Fixed effects) | ||||||||
| Model 1 | Model 2 | Model 3 | Model 4 | Model 1 | Model 2 | Model 3 | Model 4 | |||
| Independent variables: | ||||||||||
| ESG | -0.0001*** 0.0001 |
-0.00002 0.00002 |
||||||||
| E_score | -0.0001*** 0.0001 | -0.00002 0.00001 |
||||||||
| S_score | -0.0001*** 0.0001 |
0.00001 0.00001 |
||||||||
| G_score | -0.0001*** 0.0001 |
-0.00004*** 0.00001 |
||||||||
| Control variables: | ||||||||||
| Beta | 0.0344*** 0.0006 |
0.0343*** 0.0006 |
0.0344*** 0.0006 |
0.0343*** 0.0006 |
0.03024*** 0.00038 |
0.03024*** 0.00038 |
0.03023*** 0.00038 |
0.03028*** 0.00038 |
||
| Leverage | -0.0107*** 0.0011 |
-0.0108*** 0.0011 |
-0.0109*** 0.0011 |
-0.0115*** 0.0011 |
0.00001 0.00005 |
0.00001 0.00005 |
0.00001 0.00005 |
0.00001 0.00005 |
||
| log_Market_cap | 0.0012*** 0.0002 |
0.0010*** 0.0002 |
0.0010*** 0.0002 |
0.0008*** 0.0002 |
0.00478 0.00027 |
0.00478 0.00027 |
0.00476 0.00027 |
0.00477 0.00027 |
||
| Constant | 0.0142** 0.0050 |
0.0175*** 0.0050 |
0.0171*** 0.0050 |
0.0210*** 0.0048 |
- | - | - | - | ||
| R2 | 0.70233 | 0.70039 | 0.70048 | 0.69922 | 0.62423 | 0.62421 | 0.62416 | 0.62457 | ||
| Observations(N) | 3180 | 3180 | 3180 | 3180 | 12972 | 12971 | 12971 | 12972 | ||
Source: Prepared by the authors. NOTE: The significance levels are indicated as *** 1% significance level,**5% significance level, and* 10% significance level. Source: Own calculation based on the data collected from the LSEG database.
Disclaimer/Publisher’s Note: The statements, opinions and data contained in all publications are solely those of the individual author(s) and contributor(s) and not of MDPI and/or the editor(s). MDPI and/or the editor(s) disclaim responsibility for any injury to people or property resulting from any ideas, methods, instructions or products referred to in the content. |
© 2025 by the authors. Licensee MDPI, Basel, Switzerland. This article is an open access article distributed under the terms and conditions of the Creative Commons Attribution (CC BY) license (http://creativecommons.org/licenses/by/4.0/).
Copyright: This open access article is published under a Creative Commons CC BY 4.0 license, which permit the free download, distribution, and reuse, provided that the author and preprint are cited in any reuse.


