
Submitted:
02 October 2025
Posted:
02 October 2025
You are already at the latest version
Abstract
Treatment-induced ovarian function loss is a significant concern for many young patients with breast cancer. Accurately predicting this risk is crucial for counselling young patients and informing their fertility-related decision-making. However, current risk-prediction models for treatment-related ovarian function loss have limitations. To provide a broader representation of patient cohorts and improve feature selection, we combined retrospective data from six datasets within the FoRECAsT (Infertility after Cancer Predictor) databank, including 2,679 pre-menopausal women diagnosed with breast cancer. This combined dataset presented notable missingness, prompting us to employ cross imputation using the k-nearest neighbours (KNN) machine learning (ML) algorithm. Employing Lasso regression, we developed an ML model to forecast the risk of treatment-related amenorrhea as a surrogate marker of ovarian function loss at 12 months after starting chemotherapy. Our model identified 20 variables significantly associated with risk of developing amenorrhea. Internal validation resulted in an area under the receiver operating characteristic curve (AUC) of 0.820 (95% CI: 0.817-0.823), while external validation with another dataset demonstrated an AUC of 0.743 (95% CI: 0.666-0.818). A cutoff of 0.20 was chosen to achieve higher sensitivity in validation, as false negatives—patients incorrectly classified as likely to regain menses—could miss timely opportunities for fertility preservation if desired. At this threshold, internal validation yielded sensitivity and precision rates of 91.3% and 61.7%, respectively, while external validation showed 92.9% and 60.0%. Leveraging ML methodologies, we not only devised a model for personalised risk prediction of amenorrhea, demonstrating substantial enhancements over existing models but also showcased a robust framework for maximally harnessing available data sources.
Keywords:
breast cancer
; treatment-related amenorrhea
; machine learning
; cross imputation
; risk prediction model
1. Introduction
Breast cancer is one of the most frequently diagnosed cancers among women worldwide, accounting for 1 in 4 cancer cases and totalling 2.3 million instances in 2022 [1]. Globally, more than 100,000 women under the age of 40 are diagnosed with breast cancer each year [2]. While premenopausal patients with breast cancer receiving modern curative-intent treatment regimens, often including chemotherapy, have excellent long-term outcomes [3,4]. However, chemotherapy poses a risk of a loss of ovarian function and may result in early menopause or premature ovarian insufficiency (POI) [5-8]. This commonly presents as hypergonadotropic hypogonadism, resulting in amenorrhea (the cessation of menstrual cycles) [9]. The risk of treatment-related amenorrhea (termed “amenorrhea” hereafter) varies widely depending on factors such as age, chemotherapy regimen, and pretreatment ovarian reserve [10]. For example, most women aged 35–39 are at intermediate risk (31–58%) of treatment-related amenorrhea, with the risk increasing sharply with age—rising to approximately 77% in women over 40—depending on the chemotherapy regimen [11]. Many modern chemotherapy regimens are less damaging to ovarian function than older treatments, but they can still result in short- and long-term ovarian dysfunction [12,13]. Women who remain amenorrhoeic for 12 months following cytotoxic treatment are likely to experience permanent cessation of menstruation and a loss of reproductive capacity (i.e. infertility) [14,15]. The use of gonadotropin-releasing hormone agonists (GnRHa) during chemotherapy has been shown to reduce the risk of POI by temporarily suppressing ovarian function and thereby protecting ovarian reserve [16,17]. However, the evidence is not consistent [18,19].
The impact of ovarian function loss and infertility can be profound. Nearly 70% of young women diagnosed with early breast cancer express a desire to have children in the future [20,21]. Infertility often leads to substantial psychological distress, with levels of depression double that of the general population and diminished quality of life observed in areas such as emotional well-being, sexuality, and relationships [22]. The prospect of infertility can be a distressing outcome of such treatments [23]. Even for individuals without immediate plans for children, the threat of infertility can evoke feelings of anger and a sense of loss [22,24]. Concerns about infertility and the inability to conceive in the future may influence treatment decisions, leading some patients to opt for less effective cancer treatments or not adhering to recommended endocrine therapy to preserve their fertility [25-27]. Providing accurate, personalised risk predictions can help patients better manage expectations, and lead to greater satisfaction with their treatment-related decisions and reduced regret [28]. This may contribute to improved long-term psychosocial outcomes and an enhanced quality of life, even for women who remain childless [29-32]. Consequently, predicting the risk of developing amenorrhea after breast cancer treatment, prior to initiating gonadotoxic treatment has emerged as an important area in current breast cancer research.
With the rapid proliferation of medical data and the advancement of modern statistical techniques and information technology, the utilisation of data science in constructing risk prediction models is a prominent area of research. Traditional risk prediction models, typically based on prior hypothesised knowledge, often consider the relationships between dependent variables. In contrast, machine learning (ML) methods have the potential to learn data models spontaneously, without requiring any implicit assumptions, and are capable of handling interdependence and complicated relationships between variables [33]. ML techniques excel in addressing the vast number of complex higher-order interactions present in medical data. Therefore, risk prediction models developed using ML methods have a high potential for application in clinical practice. An increasing number of clinical studies have leveraged ML methods to develop prediction models, which have found applications in diagnosis [34-36], disease risk prediction [37], and disease recurrence forecasting [38]. Despite increasing interest in predicting the risk of amenorrhea in young women diagnosed with breast cancer [39], existing studies often face significant limitations. This includes small datasets [40-48], exclusion of cases with missing data [40-51], reliance on a limited number of selected features [40-51], a focus on associations rather than predictions [52-55], incomplete reporting [40-51], and the absence of external validation [40-48,50]. To address these gaps, this study establishes a framework for applying machine learning methods in oncofertility research for amenorrhoea risk prediction. Specifically, we developed a predictive model combining multiple datasets to estimate the risk of amenorrhea 12 months after starting the gonadotoxic treatment in women with breast cancer, achieving improved discrimination and calibration.
2. Materials & Methods
Cohort Design, Outcome Definition, Features, and Variables
The FoRECAsT (Infertility after Cancer Predictor) databank [56] comprises multiple datasets sourced from various national and international studies, including those from Australia, the UK, USA, Hong Kong, France, Denmark, Italy, Belgium, and International Trial Groups. In this research, menstrual status was collected at the beginning of chemotherapy. The outcome of amenorrhea was defined as the absence of menses for at least three consecutive months or more after starting the treatment, irrespective of any subsequent resumption of menses. Patients were considered premenopausal if they had their last menstrual period within the previous 12 months of treatment initiation/diagnosis.
From the FoRECAsT databank, seven datasets were selected and combined for analysis because they included the outcome variable amenorrhoea at 12 months from the initiation of treatment. Amenorrhoea at 12 months was a binary indicator, where 1 denoted the presence of amenorrhea and 0 indicated its absence. Among the seven selected datasets, six (‘A’, ‘D’, ‘E’, ‘F’, ‘G’, and ‘N’) were combined for model building and internal validation. The remaining dataset (‘M’), which was collected separately in a different research setting, was designated for external validation, as this configuration—using ‘M’ as the external validation set—resulted in the best model performance compared to other possible dataset divisions.
In this study, a feature referred to a non-outcome column in a dataset. Notably, a categorical feature could generate multiple variables, whereas a numerical or binary feature yielded only one variable. For numerical or binary features, the two terms ‘feature’ and ‘variable’ could be used interchangeably. In the selected datasets, not all features were utilized since some of them were not relevant. Only relevant features, selected based on domain knowledge, were incorporated in the data analysis.
Data Cleaning, Missing Values, and Cross Imputation
In the combined dataset, some features contained invalid values, necessitating data cleaning. Through careful examination and manual verification, all invalid values were either corrected to valid values or replaced as missing values to ensure data integrity for subsequent analysis.
Additionally, missing values in the combined dataset arose from missing data at the time of collection, and variations in research settings across different datasets, leading to misalignment of certain features when combined and significant missingness. This misalignment meant that certain features existing in one dataset may be entirely missing in another.
To address these missing values, we employed cross imputation [57], a technique whereby missing values in one dataset are imputed using values from other datasets. This was accomplished using the k-nearest neighbours (KNN) algorithm and set the value of k to 10, meaning missing values were estimated based on the 10 closest neighbours in a multi-dimensional space. This approach is found to be effective in handling large missingness [58]. Remarkably, even in cases of very high missingness (> 80%), it could still yield predictive models comparable to those trained with complete datasets [57,59]. The imputation process was facilitated using ‘recipes’ package in R [60], ensuring that as many records as possible were utilised to develop the predictive model.
Model building, Internal Validation, and Calibration
Lasso regression, utilizing a binomial family, was pivotal in constructing the model. It maximized the log-likelihood while minimizing the sum of the absolute values of regression coefficients and automatically removing unnecessary variables [61]. The R package glmnet [62] was utilized for model construction.
Model building and internal validation involved two phases: i) feature selection and ii) final model building. In the feature selection phase, the combined dataset was randomly split into training data and test data in 1:1 ratio. A predictive model was built from the imputed training data and was applied to the imputed test data to get the internal validation results (Figure 1A). To mitigate randomness, this process was repeated 100 times, with unnecessary variables automatically pruned in each iteration. Features were selected if at least one of their corresponding variables demonstrated significant relevance (P-value < 0.05) and appeared at least 50 times across the 100-round repetition.
In the final model building step, following feature selection, the process was further repeated 100 times. The final model’s coefficients were calculated from the mean values obtained across the 100 repetitions in this step. All internal validation results from the 100 repetitions were combined to yield the final internal validation results. Model performance was evaluated using the area under the receiver operating characteristic curve (AUC). For calculating sensitivity and precision, the cutoff was derived by maximising the F score with β = 1.5.
Calibration of predicted risks was performed as follows. The predicted risks of internal validation were divided into 20 percentage ranges (5% each) based on their values from smallest to largest. The calibrated predicted risk for each range was calculated as the percentage of cases falling within that range.
External Validation and Model Comparison
The external validation framework is illustrated in Figure 1B. Initially, cross imputation was carried out on the combined dataset. Subsequently, features unique to dataset 'M' that were absent from the combined dataset were excluded, as these features were not utilized during cross imputation or validation. Following this, cross imputation was applied to the dataset ‘M’ using the imputed combined dataset. Finally, our model was validated using the imputed dataset ‘M’.
To further assess our model’s performance, we compared it to five existing studies [40,46,49,52,55] that provided sufficient model details—specifically, the coefficients of associated variables—enabling direct application to our data. For each study, we applied the reported coefficients of associated variables to the imputed dataset ‘M’ and compared the results with our model’s external validation. However, since each study was conducted using its own dataset, the performance may be compromised when their coefficients are applied to the imputed dataset ‘M’. Additionally, we conducted a comparison between our model and a model constructed using the imputed combined dataset, utilizing the same associated variables and methods employed in each study. Some other studies [53,54] were excluded from such comparisons because their use of different associated variables made direct evaluation infeasible, as these variables were not all present in the imputed dataset ‘M’.
3. Results
Study Participants and Missing Values
The seven selected datasets (‘A’, ‘D’, ‘E’, ‘F’, ‘G’, ‘M’, and ‘N’) from the FoRECAsT databank comprised 3,795 individual patient records. Of these, 962 records (25.3%) were excluded due to missing outcome data. The remaining 2,833 individual patient records were used for model development and validation. Following data cleaning and preparation, these records were subjected to feature selection and modelling to construct the amenorrhoea risk prediction model. Detailed summary statistics for the selected datasets can be found in Table 1.
The model construction and validation dataset comprised of 6 datasets (‘A’, ‘D’, ‘E’, ‘F’, ‘G’, and ‘N’) containing 2,679 individual patient records with 53 features, reflecting an amenorrhea prevalence rate of 48.3%. The combined dataset exhibited 61.4% missingness, with 91,464 missing cells out of 149,024 total cells (Table 1). The missing rate for each feature is detailed in Supplementary File 1, while the explanations of these features can be found in Supplementary File 2.
Model Development and Associated Variables
Sixty-two variables from 53 features are summarized in Supplementary File 3. During feature selection, twenty-two variables from 20 features had significant relevance (P-value < 0.05) and appeared at least 50 times in the 100 rounds of repetition. Consequently, these 20 features were selected for the final model building phase, which underwent another 100 rounds of repetition. In this phase, two features, namely “Contraception” and “Radiotherapy treatment”, were further excluded due to their corresponding variables appearing less than 50 times. In the final model, 20 variables from 18 features, along with the intercept value, were utilized to predict amenorrhea at 12 months after chemotherapy initiation (Table 2). The average coefficients from the 100-round repeats were used for the final model. Utilizing the coefficient values of the final model, we can predict a patient’s risk of amenorrhea and calculate the odds using the following formulas:
Our model identified 20 variables associated with amenorrhea (Table 2). According to our findings, the BRCA pathogenic variants emerged as the leading predictor of amenorrhea. BRCA2 carriers exhibited 356% higher odds compared to BRCA non-carriers, while BRCA1 carriers showed 74% higher odds compared to BRCA non-carriers. Another significant variable was the number of treatment cycles involving a combination of adriamycin, cyclophosphamide, and methotrexate, fluorouracil (AC+CMF cycles), with each additional cycle associated with 68% higher odds. Furthermore, each additional year of age was associated with a 6% increase in odds. For a comprehensive overview of our findings, please refer to Table 2.
Model Evaluation
During internal validation, the AUC was 0.820 (95% CI: 0.817-0.823) (Figure 2A). Given the objective of prioritizing sensitivity over precision in predicting amenorrhea, the F score with β = 1.5 was maximized to derive a cutoff value of 0.20. As a result, the sensitivity reached 91.3% while precision stood at 61.7%. Figure 2B provides a clear visualization, indicating that most patients experiencing amenorrhea at 12 months after treatment initiation fell to the right of the cutoff threshold. Details of the calibrated predicted risks can be found in Table 3.
For external validation, the independent dataset ‘M’ was employed, comprising 154 patients and 13 features, with the prevalence of amenorrhea being 54.5% and 27.1% missingness (Table 1). All features present in the dataset ‘M’ were also included in the combined dataset (Supplementary File 4). Notably, age was the only feature available in dataset ‘M’ that overlapped with the 18 features required by the final model (Table 2 and Supplementary File 4). However, the remaining 17 required features were cross imputed using the existing 13 features available in ‘M’. Following the external validation procedure (Figure 1B), we obtained an AUC of 0.743 and calculated a 95% CI of 0.666-0.818 using bootstrapping. Employing a cutoff of 0.20, the sensitivity and precision were determined as 92.9% and 60.0%, respectively. A lower cutoff of 0.20 was selected to achieve higher sensitivity, as false negatives—patients incorrectly classified as likely to regain menses— potentially have more profound impact than false positives due to missed opportunity for timely fertility preservation for those who wish to pursue it.
Our model’s performance underwent further assessment through comparison with the five existing studies [40,46,49,52,55]. Applying these studies to the imputed dataset ‘M’ yielded AUC values of 0.459, 0.506, 0.54, 0.6 and 0.61, respectively. Additionally, comparisons were made with models built using the imputed combined dataset, utilising the same associated variables and methods employed in the studies. These comparisons resulted in AUC values of 0.459, 0.506, 0.582, 0.588 and 0.612, respectively (Figure 3). Notably, both sets of comparisons underscored the superior performance of our model.
4. Discussion
We developed and externally validated a machine learning model to accurately predict treatment-related amenorrhea in young women with breast cancer 12 months after chemotherapy initiation. The model achieved strong discrimination in both internal and external validation and was optimised for high sensitivity to minimise missed opportunities for fertility preservation, a priority in clinical decision-making for this population. This is the largest and most diverse dataset used for this outcome to date, with the integration of six international datasets from the FoRECAsT databank combined with robust methods to handle substantial missingness and select relevant features, produced a model that outperformed five existing prediction models when applied to an independent dataset.
A key strength of this work is the integration of multiple datasets from diverse clinical settings, encompassing wide variation in patient characteristics, treatment regimens, and follow-up patterns. This diversity created a more representative and comprehensive feature space than in previous studies. Previous studies focused on identifying a limited number of variables associated with amenorrhea or building predictive models with a handful of features. However, constructing a precise amenorrhea risk prediction model demands careful consideration of all potentially relevant features. Our study was the first to screen many potentially relevant features to build a predictive model. In contrast to conventional logistic regression approaches, our study leveraged Lasso regression to construct the model. This choice allowed for the automatic selection of pertinent predictors, and effective mitigation of overfitting while preserving the model’s interpretability. Importantly, we deliberately avoided black-box approaches, as model interpretability is essential in healthcare settings to ensure transparency, trust, and reduced bias [63]. The robustness of our approach is evident from the superior performance of our model during external validation compared to prior five existing studies [40,46,49,52,55]. This study is a part of the broader FoRECAsT research project, with the goal of developing a web-based clinical predictive tool for amenorrhea risk, similar to predicting the survival rates after surgery with different treatment combinations for young women with breast cancer [64].
The findings from this study should be interpreted with caution, as the 12-month amenorrhoea outcome from the chemotherapy initiation does not necessarily reflect long-term implications. Some women may regain menses later if sufficient primordial follicles remain in the resting pool. In contrast, others may experience delayed amenorrhoea beyond this point as ovarian reserve continues to decline over time. Our aim in this study was to demonstrate how different clinical datasets can be compiled and utilised—with imputation—within this modelling framework for future risk prediction. Our subsequent publications will provide further insight by reporting long-term amenorrhoea outcomes over a 12–60-month period.
In modelling, different studies may employ various ML algorithms and feature selections, making direct comparisons of coefficient values for shared variables challenging. Instead, the focus should be on evaluating the relevance of features and their impact on risk. Liem et al. (2015) [55] identified only older age as a risk factor for amenorrhea, with BMI, smoking, chemotherapy, and trastuzumab showing no significant relevance. Zhang et al. (2018) [49] found that older age, lower E2, and higher FSH were associated with increased risk, while BMI was not relevant. Ruddy et al. (2021) [52] suggested that older age, lower BMI, and lower AMH increased risk, with chemotherapy and tamoxifen showing no relevance. Poorvu et al. (2021) [54] indicated that older age, lower BMI, tamoxifen, and chemotherapy were linked to increased risk, with smoking showing no significant relevance. Kabirian et al. (2023) [53] identified older age, hot flashes at diagnosis, endocrine therapy, and trastuzumab as factors increasing risk, with BMI and smoking showing no significant relevance. These findings indicate that the associated variable sets found in previous studies do not always match. In our study, we examined 53 potential features and identified factors such as BRCA mutations, a higher number of AC+CMF cycles, older age, lower E2, lower AMH, and higher FSH as contributors to increased amenorrhea risk (Table 2). In contrast, factors such as lower BMI, smoking, trastuzumab, and tamoxifen were considered during feature selection but were excluded from the final model due to their limited importance (Supplementary File 3). Overall, our study’s findings regarding features associated with amenorrhea align with most of those reported in previous studies, providing consistency and further insight into the predictors of amenorrhea.
Cross imputation played a pivotal role in the development and application of our model. Previous studies have taken varied approaches to handling missing values. Some studies did not explicitly address missing values [55], while others treated them as a separate category [49] or removed records with missing values entirely [52]. Another study predicting primary ovarian insufficiency after chemotherapy used multiple imputations by chained equations (MICE) to handle missing values, assuming data were missing at random [65]. However, given the nature of our combined dataset, treating missing values in the same manner as these studies was not feasible. Instead, we employed cross imputation, which allowed us to generate a fully imputed dataset comprising 2,679 samples with 53 features for constructing our model. These 53 features include 18 modelling features utilized by our model and 35 non-modelling features. When applying our model to an external dataset, it is plausible that the external dataset may lack some modelling features while containing some non-modelling features. Although the non-modelling features do not contribute to prediction directly, they are utilized for imputing modelling features in the external dataset during cross imputation (Figure 1B). This approach enables our model to be applied to external datasets collected in diverse research settings. The external validation conducted with the dataset ‘M’ underscored the robustness of our approach and demonstrated the strength of our study. Furthermore, this cross-imputation approach holds promise for adaptation by other medical researchers seeking to build predictive models in similar contexts.
Limitations
This study has several limitations. First, despite being the largest dataset assembled to date for this outcome, some contributing datasets were small (e.g. 96 to 154 records) and showed marked variation in amenorrhea prevalence (10.8 to 78.1%), which may introduce bias. Secondly, the model was externally validated on a single independent dataset; broader validation across multiple independent and prospective cohorts where there are primary data on the selected features is needed to confirm generalisability. Thirdly, two chemotherapy-related variables (CMF dose and CMF treatment) showed an inverse association with amenorrhea, contrary to clinical expectations, likely reflecting multicollinearity with other chemotherapy measures or dataset heterogeneity; these should be interpreted within the context of the full model. Fourthly, while the model was reduced to 18 features to balance accuracy and feasibility, some settings may still require fewer inputs, future work could explore a panel of models with varying complexity to suit different contexts. Finally, our outcome—amenorrhea at 12 months after chemotherapy initiation, does not fully capture long-term ovarian function; some women may recover menses later, while others may develop delayed amenorrhea. Extending the prediction horizon to 12–60 months is a priority for future research.
5. Conclusions
We presented a robust, interpretable, and externally validated machine learning model for predicting treatment-related amenorrhea in young women with breast cancer. By integrating diverse datasets and applying rigorous imputation and feature selection methods, our model incorporating 20 established and novel variables achieved superior predictive performance compared with five existing models. The framework is adaptable to other clinical contexts where heterogeneous datasets with substantial missingness must be combined to develop reliable prediction models, offering a scalable approach to precision oncofertility and broader precision oncology applications.
Supplementary Materials
The following supporting information can be downloaded at the website of this paper posted on Preprints.org Supplementary File 1: Summary of missingness in the combined dataset.; Supplementary File 2: The explanation of all features used in this study.; Supplementary File 3: All features derived in the first step of model development.; Supplementary File 4: Summary of missingness in the dataset ‘M’.
Funding
ZE was recipient of a University of Melbourne’s Research Training Scholarship, Graeme Clark Institute top-up scholarship and Rowden White Trust Graduate Research Support at the time of this study. YJ is funded by MRFF MRFAR 000308 and Dame Kate Campbell Fellowship. TLN is funded by Cancer Council Victoria. MP was supported by a National Breast Cancer Foundation Fellowship (ECF-15-005) at the time of this study.
Conflicts of Interest
None.
References
- Sung, H.; Ferlay, J.; Siegel, R.L.; Laversanne, M.; Soerjomataram, I.; Jemal, A.; Bray, F. Global Cancer Statistics 2020: GLOBOCAN Estimates of Incidence and Mortality Worldwide for 36 Cancers in 185 Countries. CA Cancer J Clin 2021, 71, 209–249. [Google Scholar] [CrossRef]
- International Agency for Research on Cancer. Cancer Today. Availabe online: https://gco.iarc.fr/en (accessed on 2024/12/17).
- Partridge, A.H.; Hughes, M.E.; Warner, E.T.; Ottesen, R.A.; Wong, Y.N.; Edge, S.B.; Theriault, R.L.; Blayney, D.W.; Niland, J.C.; Winer, E.P.; et al. Subtype-Dependent Relationship Between Young Age at Diagnosis and Breast Cancer Survival. J Clin Oncol 2016, 34, 3308–3314. [Google Scholar] [CrossRef]
- Francis, P.A.; Pagani, O.; Fleming, G.F.; Walley, B.A.; Colleoni, M.; Láng, I.; Gómez, H.L.; Tondini, C.; Ciruelos, E.; Burstein, H.J.; et al. Tailoring Adjuvant Endocrine Therapy for Premenopausal Breast Cancer. N Engl J Med 2018, 379, 122–137. [Google Scholar] [CrossRef] [PubMed]
- Codacci-Pisanelli, G.; Del Pup, L.; Del Grande, M.; Peccatori, F.A. Mechanisms of chemotherapy-induced ovarian damage in breast cancer patients. Critical reviews in oncology/hematology 2017, 113, 90–96. [Google Scholar] [CrossRef] [PubMed]
- Nguyen, Q.N.; Zerafa, N.; Liew, S.H.; Morgan, F.H.; Strasser, A.; Scott, C.L.; Findlay, J.K.; Hickey, M.; Hutt, K.J. Loss of PUMA protects the ovarian reserve during DNA-damaging chemotherapy and preserves fertility. Cell Death & Disease 2018, 9, 618. [Google Scholar] [CrossRef]
- Findlay, J.K.; Hutt, K.J.; Hickey, M.; Anderson, R.A. What is the "ovarian reserve"? Fertility and Sterility 2015, 103, 628–630. [Google Scholar] [CrossRef]
- Letourneau, J.M.; Ebbel, E.E.; Katz, P.P.; Oktay, K.H.; McCulloch, C.E.; Ai, W.Z.; Chien, A.J.; Melisko, M.E.; Cedars, M.I.; Rosen, M.P. Acute ovarian failure underestimates age-specific reproductive impairment for young women undergoing chemotherapy for cancer. Cancer 2012, 118, 1933–1939. [Google Scholar] [CrossRef]
- Jayasinghe, Y.L.; Wallace, W.H.B.; Anderson, R.A. Ovarian function, fertility and reproductive lifespan in cancer patients. Expert review of endocrinology & metabolism 2018, 13, 125–136. [Google Scholar]
- Preservation, E.G.G.o.F.F.; Anderson, R.A.; Amant, F.; Braat, D.; D'Angelo, A.; Chuva de Sousa Lopes, S.M.; Demeestere, I.; Dwek, S.; Frith, L.; Lambertini, M. ESHRE guideline: female fertility preservation. Human reproduction open 2020, 2020, hoaa052. [Google Scholar]
- Zavos, A.; Valachis, A. Risk of chemotherapy-induced amenorrhea in patients with breast cancer: a systematic review and meta-analysis. Acta Oncol 2016, 55, 664–670. [Google Scholar] [CrossRef]
- Partridge, A.H.; Gelber, S.; Peppercorn, J.; Ginsburg, E.; Sampson, E.; Rosenberg, R.; Przypyszny, M.; Winer, E.P. Fertility and menopausal outcomes in young breast cancer survivors. Clin Breast Cancer 2008, 8, 65–69. [Google Scholar] [CrossRef] [PubMed]
- Partridge, A.H.; Ruddy, K.J.; Gelber, S.; Schapira, L.; Abusief, M.; Meyer, M.; Ginsburg, E. Ovarian reserve in women who remain premenopausal after chemotherapy for early stage breast cancer. Fertil Steril 2010, 94, 638–644. [Google Scholar] [CrossRef] [PubMed]
- Petrek, J.A.; Naughton, M.J.; Case, L.D.; Paskett, E.D.; Naftalis, E.Z.; Singletary, S.E.; Sukumvanich, P. Incidence, time course, and determinants of menstrual bleeding after breast cancer treatment: a prospective study. Journal of Clinical Oncology 2006, 24, 1045–1051. [Google Scholar] [CrossRef]
- Jung, M.; Shin, H.J.; Rha, S.Y.; Jeung, H.C.; Hong, S.; Moon, Y.W.; Kim, H.S.; Oh, K.J.; Yang, W.I.; Roh, J.K.; et al. The Clinical Outcome of Chemotherapy-Induced Amenorrhea in Premenopausal Young Patients with Breast Cancer with Long-Term Follow-up. Annals of Surgical Oncology 2010, 17, 3259–3268. [Google Scholar] [CrossRef]
- Loibl, S.; André, F.; Bachelot, T.; Barrios, C.; Bergh, J.; Burstein, H.; Cardoso, M.; Carey, L.; Dawood, S.; Del Mastro, L. Early breast cancer: ESMO Clinical Practice Guideline for diagnosis, treatment and follow-up☆. Annals of Oncology 2024, 35, 159–182. [Google Scholar] [CrossRef] [PubMed]
- Lambertini, M.; Moore, H.C.; Leonard, R.C.; Loibl, S.; Munster, P.; Bruzzone, M.; Boni, L.; Unger, J.M.; Anderson, R.A.; Mehta, K. Gonadotropin-releasing hormone agonists during chemotherapy for preservation of ovarian function and fertility in premenopausal patients with early breast cancer: a systematic review and meta-analysis of individual patient–level data. Journal of clinical oncology 2018, 36, 1981–1990. [Google Scholar] [CrossRef]
- Oktay, K.; Harvey, B.E.; Partridge, A.H.; Quinn, G.P.; Reinecke, J.; Taylor, H.S.; Wallace, W.H.; Wang, E.T.; Loren, A.W. Fertility preservation in patients with cancer: ASCO clinical practice guideline update. Journal of Clinical Oncology 2018, 36, 1994–2001. [Google Scholar] [CrossRef]
- Medicine, P.C.o.t.A.S.f.R. Fertility preservation in patients undergoing gonadotoxic therapy or gonadectomy: a committee opinion. Fertility and Sterility 2019, 112, 1022–1033. [Google Scholar] [CrossRef]
- Senkus, E. ,.; Gomez, H.; Dirix, L.; Jerusalem, G.; Murray, E.; Van Tienhoven, G.; Westenberg, A.H.; Bottomley, A.; Rapion, J.; Bogaerts, J.; et al. Attitudes of young patients with breast cancer toward fertility loss related to adjuvant systemic therapies. EORTC study 10002 BIG 3-98. Psychooncology 2014, 23, 173–182. [Google Scholar]
- Peate, M.; Meiser, B.; Friedlander, M.; Zorbas, H.; Rovelli, S.; Sansom-Daly, U.; Sangster, J.; Hadzi-Pavlovic, D.; Hickey, M. It's now or never: fertility-related knowledge, decision-making preferences, and treatment intentions in young women with breast cancer--an Australian fertility decision aid collaborative group study. JCO 2011, 29, 1670–1677. [Google Scholar] [CrossRef]
- Duffy, C.; Allen, S. Medical and Psychosocial Aspects of Fertility After Cancer. Cancer journal (Sudbury, Mass.) 2009, 15, 27–33. [Google Scholar] [CrossRef] [PubMed]
- Wright, J.; Duchesne, C.; Sabourin, S.; Bissonnette, F.; Benoit, J.; Girard, Y. Psychosocial distress and infertility: men and women respond differently. Fertil Steril 1991, 55, 100–108. [Google Scholar] [CrossRef] [PubMed]
- Avis, N.E.; Crawford, S.; Manuel, J. Psychosocial problems among younger women with breast cancer. Psychooncology 2004, 13, 295–308. [Google Scholar] [CrossRef]
- Partridge, A.H.; Gelber, S.; Peppercorn, J.; Sampson, E.; Knudsen, K.; Laufer, M.; Rosenberg, R.; Przypyszny, M.; Rein, A.; Winer, E.P. Web-based survey of fertility issues in young women with breast cancer. J Clin Oncol 2004, 22, 4174–4183. [Google Scholar] [CrossRef]
- Ruddy, K.J.; Greaney, M.L.; Sprunck-Harrild, K.; Meyer, M.E.; Emmons, K.M.; Partridge, A.H. Young Women with Breast Cancer: A Focus Group Study of Unmet Needs. J Adolesc Young Adult Oncol 2013, 2, 153–160. [Google Scholar] [CrossRef]
- Ruddy, K.J.; Gelber, S.I.; Tamimi, R.M.; Ginsburg, E.S.; Schapira, L.; Come, S.E.; Borges, V.F.; Meyer, M.E.; Partridge, A.H. Prospective study of fertility concerns and preservation strategies in young women with breast cancer. J Clin Oncol 2014, 32, 1151–1156. [Google Scholar] [CrossRef]
- Chan, S.W.; Cipres, D.; Katz, A.; Niemasik, E.E.; Kao, C.N.; Rosen, M.P. Patient satisfaction is best predicted by low decisional regret among women with cancer seeking fertility preservation counseling (FPC). Fertility and Sterility 2014, 102, e162. [Google Scholar] [CrossRef]
- Benedict, C.; Thom, B.; D, N.F.; Diotallevi, D.; E, M.P.; N, J.R.; Kelvin, J.F. Young adult female cancer survivors' unmet information needs and reproductive concerns contribute to decisional conflict regarding posttreatment fertility preservation. Cancer 2016, 122, 2101–2109. [Google Scholar] [CrossRef] [PubMed]
- Bastings, L.; Baysal, O.; Beerendonk, C.C.; IntHout, J.; Traas, M.A.; Verhaak, C.M.; Braat, D.D.; Nelen, W.L. Deciding about fertility preservation after specialist counselling. Hum Reprod 2014, 29, 1721–1729. [Google Scholar] [CrossRef]
- Peate, M.; Meiser, B.; Hickey, M.; Friedlander, M. The fertility-related concerns, needs and preferences of younger women with breast cancer: a systematic review. Breast Cancer Res Treat 2009, 116, 215–223. [Google Scholar] [CrossRef]
- Baysal, O.; Bastings, L.; Beerendonk, C.C.; Postma, S.A.; IntHout, J.; Verhaak, C.M.; Braat, D.D.; Nelen, W.L. Decision-making in female fertility preservation is balancing the expected burden of fertility preservation treatment and the wish to conceive. Hum Reprod 2015, 30, 1625–1634. [Google Scholar] [CrossRef]
- Obermeyer, Z.; Emanuel, E.J.J.T.N.E.j.o.m. Predicting the future—big data, machine learning, and clinical medicine. 2016, 375, 1216.
- Yassin, N.I.; Omran, S.; El Houby, E.M.; Allam, H.J.C.m.; biomedicine, p.i. Machine learning techniques for breast cancer computer aided diagnosis using different image modalities: A systematic review. 2018, 156, 25-45.
- Crowley, R.J.; Tan, Y.J.; Ioannidis, J.P.J.J.o.t.A.M.I.A. Empirical assessment of bias in machine learning diagnostic test accuracy studies. 2020, 27, 1092-1101.
- Gardezi, S.J.S.; Elazab, A.; Lei, B.; Wang, T.J.J.o.m.I.r. Breast cancer detection and diagnosis using mammographic data: systematic review. 2019, 21, e14464.
- Richter, A.N.; Khoshgoftaar, T.M.J.A.i.i.m. A review of statistical and machine learning methods for modeling cancer risk using structured clinical data. 2018, 90, 1-14.
- Izci, H.; Tambuyzer, T.; Tuand, K.; Depoorter, V.; Laenen, A.; Wildiers, H.; Vergote, I.; Van Eycken, L.; De Schutter, H.; Verdoodt, F.J.J.J.o.t.N.C.I. A systematic review of estimating breast cancer recurrence at the population level with administrative data. 2020, 112, 979-988.
- Edib, Z.; Jayasinghe, Y.; Hickey, M.; Gorelik, A.; Peate, M. Prognostic models for predicting ovarian function in young breast cancer patients after chemotherapy: A systematic review and meta-analysis. Proceedings of ASIA-PACIFIC JOURNAL OF CLINICAL ONCOLOGY; pp. 197–198.
- Barnabei, A.; Strigari, L.; Marchetti, P.; Sini, V.; De Vecchis, L.; Corsello, S.M.; Torino, F. Predicting Ovarian Activity in Women Affected by Early Breast Cancer: A Meta-Analysis-Based Nomogram. Oncologist 2015, 20, 1111–1118. [Google Scholar] [CrossRef]
- Anderson, R.A.; Rosendahl, M.; Kelsey, T.W.; Cameron, D.A. Pretreatment anti-Müllerian hormone predicts for loss of ovarian function after chemotherapy for early breast cancer. Eur J Cancer 2013, 49, 3404–3411. [Google Scholar] [CrossRef]
- Anderson, R.A.; Mansi, J.; Coleman, R.E.; Adamson, D.J.A.; Leonard, R.C.F. The utility of anti-Müllerian hormone in the diagnosis and prediction of loss of ovarian function following chemotherapy for early breast cancer. Eur J Cancer 2017, 87, 58–64. [Google Scholar] [CrossRef] [PubMed]
- Anderson, R.A.; Kelsey, T.W.; Perdrix, A.; Olympios, N.; Duhamel, O.; Lambertini, M.; Clatot, F. Diagnostic and predictive accuracy of anti-mullerian hormone for ovarian function after chemotherapy in premenopausal women with early breast cancer. Breast Cancer Res Treat 2022, 192, 273–282. [Google Scholar] [CrossRef]
- Su, H.C.; Haunschild, C.; Chung, K.; Komrokian, S.; Boles, S.; Sammel, M.D.; DeMichele, A. Prechemotherapy antimullerian hormone, age, and body size predict timing of return of ovarian function in young breast cancer patients. Cancer 2014, 120, 3691–3698. [Google Scholar] [CrossRef] [PubMed]
- D'Avila Â, M.; Biolchi, V.; Capp, E.; Corleta, H. Age, anti-müllerian hormone, antral follicles count to predict amenorrhea or oligomenorrhea after chemotherapy with cyclophosphamide. J Ovarian Res 2015, 8, 82. [Google Scholar] [CrossRef]
- Lee, D.Y.; Park, Y.H.; Lee, J.E.; Choi, D. Prediction of ovarian function recovery in young breast cancer patients after protection with gonadotropin-releasing hormone agonist during chemotherapy. Breast Cancer Res Treat 2018, 171, 649–656. [Google Scholar] [CrossRef]
- Xue, C.; Wei, W.; Sun, P.; Zheng, W.; Diao, X.; Xu, F.; Huang, J.; An, X.; Xia, W.; Hong, R.; et al. Pretreatment anti-Mullerian hormone-based nomogram predicts menstruation status after chemotherapy for premenopausal women with hormone receptor-positive early breast cancer. Breast Cancer Res Treat 2019, 173, 619–628. [Google Scholar] [CrossRef]
- Omranipour, R.; Ahmadi-Harchegani, F.; Saberi, A.; Moini, A.; Shiri, M.; Jalaeefar, A.; Arian, A.; Seifollahi, A.; Madani, M.; Eslami, B.; et al. A New Model Including AMH Cut-off Levels to Predict Post-treatment Ovarian Function in Early Breast Cancer: A Prospective Cohort Study. Arch Iran Med 2024, 27, 96–104. [Google Scholar] [CrossRef]
- Zhang, B.; Wu, J.; Zheng, R.; Zhang, Q.; Wang, M.Z.; Qi, J.; Liu, H.; Wang, Y.; Guo, Y.; Chen, F.; et al. Evaluation of menopausal status among breast cancer patients with chemotherapy-induced amenorrhea. Chin J Cancer Res 2018, 30, 468–476. [Google Scholar] [CrossRef]
- Pistilli, B.; Mazouni, C.; Zingarello, A.; Faron, M.; Saghatchian, M.; Grynberg, M.; Spielmann, M.; Kerbrat, P.; Roché, H.; Lorgis, V.; et al. Individualized Prediction of Menses Recovery After Chemotherapy for Early-stage Breast Cancer: A Nomogram Developed From UNICANCER PACS04 and PACS05 Trials. Clin Breast Cancer 2019, 19, 63–70. [Google Scholar] [CrossRef]
- Lee, Y.J.; Noh, W.C.; Gwark, S.; Kim, H.A.; Ryu, J.M.; Kim, S.I.; Lee, E.G.; Im, S.A.; Jung, Y.; Park, M.H.; et al. Prediction of menstrual recovery patterns in premenopausal women with breast cancer taking tamoxifen after chemotherapy: an ASTRRA Substudy. Breast Cancer Res 2024, 26, 152. [Google Scholar] [CrossRef] [PubMed]
- Ruddy, K.J.; Schaid, D.J.; Batzler, A.; Cecchini, R.S.; Partridge, A.H.; Norman, A.; Fehrenbacher, L.; Stewart, E.A.; Trabuco, E.; Ginsburg, E.; et al. Antimullerian Hormone as a Serum Biomarker for Risk of Chemotherapy-Induced Amenorrhea. J Natl Cancer Inst 2021, 113, 1105–1108. [Google Scholar] [CrossRef]
- Kabirian, R.; Franzoi, M.A.; Havas, J.; Coutant, C.; Tredan, O.; Levy, C.; Cottu, P.; Dhaini Mérimèche, A.; Guillermet, S.; Ferrero, J.M.; et al. Chemotherapy-Related Amenorrhea and Quality of Life Among Premenopausal Women With Breast Cancer. JAMA Netw Open 2023, 6, e2343910. [Google Scholar] [CrossRef]
- Poorvu, P.D.; Hu, J.; Zheng, Y.; Gelber, S.I.; Ruddy, K.J.; Tamimi, R.M.; Peppercorn, J.M.; Schapira, L.; Borges, V.F.; Come, S.E.; et al. Treatment-related amenorrhea in a modern, prospective cohort study of young women with breast cancer. NPJ Breast Cancer 2021, 7, 99. [Google Scholar] [CrossRef]
- Liem, G.S.; Mo, F.K.; Pang, E.; Suen, J.J.; Tang, N.L.; Lee, K.M.; Yip, C.H.; Tam, W.H.; Ng, R.; Koh, J.; et al. Chemotherapy-Related Amenorrhea and Menopause in Young Chinese Breast Cancer Patients: Analysis on Incidence, Risk Factors and Serum Hormone Profiles. PLoS One 2015, 10, e0140842. [Google Scholar] [CrossRef] [PubMed]
- Edib, Z.; Jayasinghe, Y.; Hickey, M.; Stafford, L.; Anderson, R.A.; Su, H.I.; Stern, K.; Saunders, C.; Anazodo, A.; Macheras-Magias, M.; et al. Exploring the facilitators and barriers to using an online infertility risk prediction tool (FoRECAsT) for young women with breast cancer: a qualitative study protocol. BMJ Open 2020, 10, e033669. [Google Scholar] [CrossRef] [PubMed]
- Wu, X.; Akbarzadeh Khorshidi, H.; Aickelin, U.; Edib, Z.; Peate, M. Imputation techniques on missing values in breast cancer treatment and fertility data. Health Inf Sci Syst 2019, 7, 19. [Google Scholar] [CrossRef]
- Batista, G.E.; Monard, M.C. A study of K-nearest neighbour as an imputation method. His 2002, 87, 48. [Google Scholar]
- Barakat, M.S.; Field, M.; Ghose, A.; Stirling, D.; Holloway, L.; Vinod, S.; Dekker, A.; Thwaites, D. The effect of imputing missing clinical attribute values on training lung cancer survival prediction model performance. Health Inf Sci Syst 2017, 5, 16. [Google Scholar] [CrossRef]
- Kuhn, M.; Wickham, H.; Hvitfeldt, E. recipes: Preprocessing and Feature Engineering Steps for Modeling. R package version 1.1.1. Availabe online: https://recipes.tidymodels.org/ (accessed on 2025/03/05).
- Tibshirani, R. Regression Shrinkage and Selection Via the Lasso. Journal of the Royal Statistical Society: Series B (Methodological) 1996, 58, 267–288. [Google Scholar] [CrossRef]
- Friedman, J.; Hastie, T.; Tibshirani, R. Regularization Paths for Generalized Linear Models via Coordinate Descent. J Stat Softw 2010, 33, 1–22. [Google Scholar] [CrossRef] [PubMed]
- Rudin, C. Stop Explaining Black Box Machine Learning Models for High Stakes Decisions and Use Interpretable Models Instead. Nat Mach Intell 2019, 1, 206–215. [Google Scholar] [CrossRef] [PubMed]
- Wishart, G.C.; Azzato, E.M.; Greenberg, D.C.; Rashbass, J.; Kearins, O.; Lawrence, G.; Caldas, C.; Pharoah, P.D. PREDICT: a new UK prognostic model that predicts survival following surgery for invasive breast cancer. Breast Cancer Res 2010, 12, R1. [Google Scholar] [CrossRef]
- Chung, E.H.; Acharya, C.R.; Harris, B.S.; Acharya, K.S. Development of a fertility risk calculator to predict individualized chance of ovarian failure after chemotherapy. J Assist Reprod Genet 2021, 38, 3047–3055. [Google Scholar] [CrossRef]
Figure 1.
Data analysis workflow. (A) Workflow for model building and internal validation. First, the combined dataset was randomly split into training and test datasets. Cross-imputation was then conducted on the training data. Next, a predictive model was built using Lasso regression. Subsequently, cross-imputation was applied to the test data utilizing the imputed training data. Finally, the model’s performance was evaluated. (B) Workflow for external validation. Initially, cross-imputation was performed on the combined dataset. Features exclusive to sub-dataset ‘M’ were omitted. Subsequently, cross-imputation was applied to the filtered sub-dataset ‘M’ using the imputed combined dataset. Finally, the predictive model's performance was evaluated.
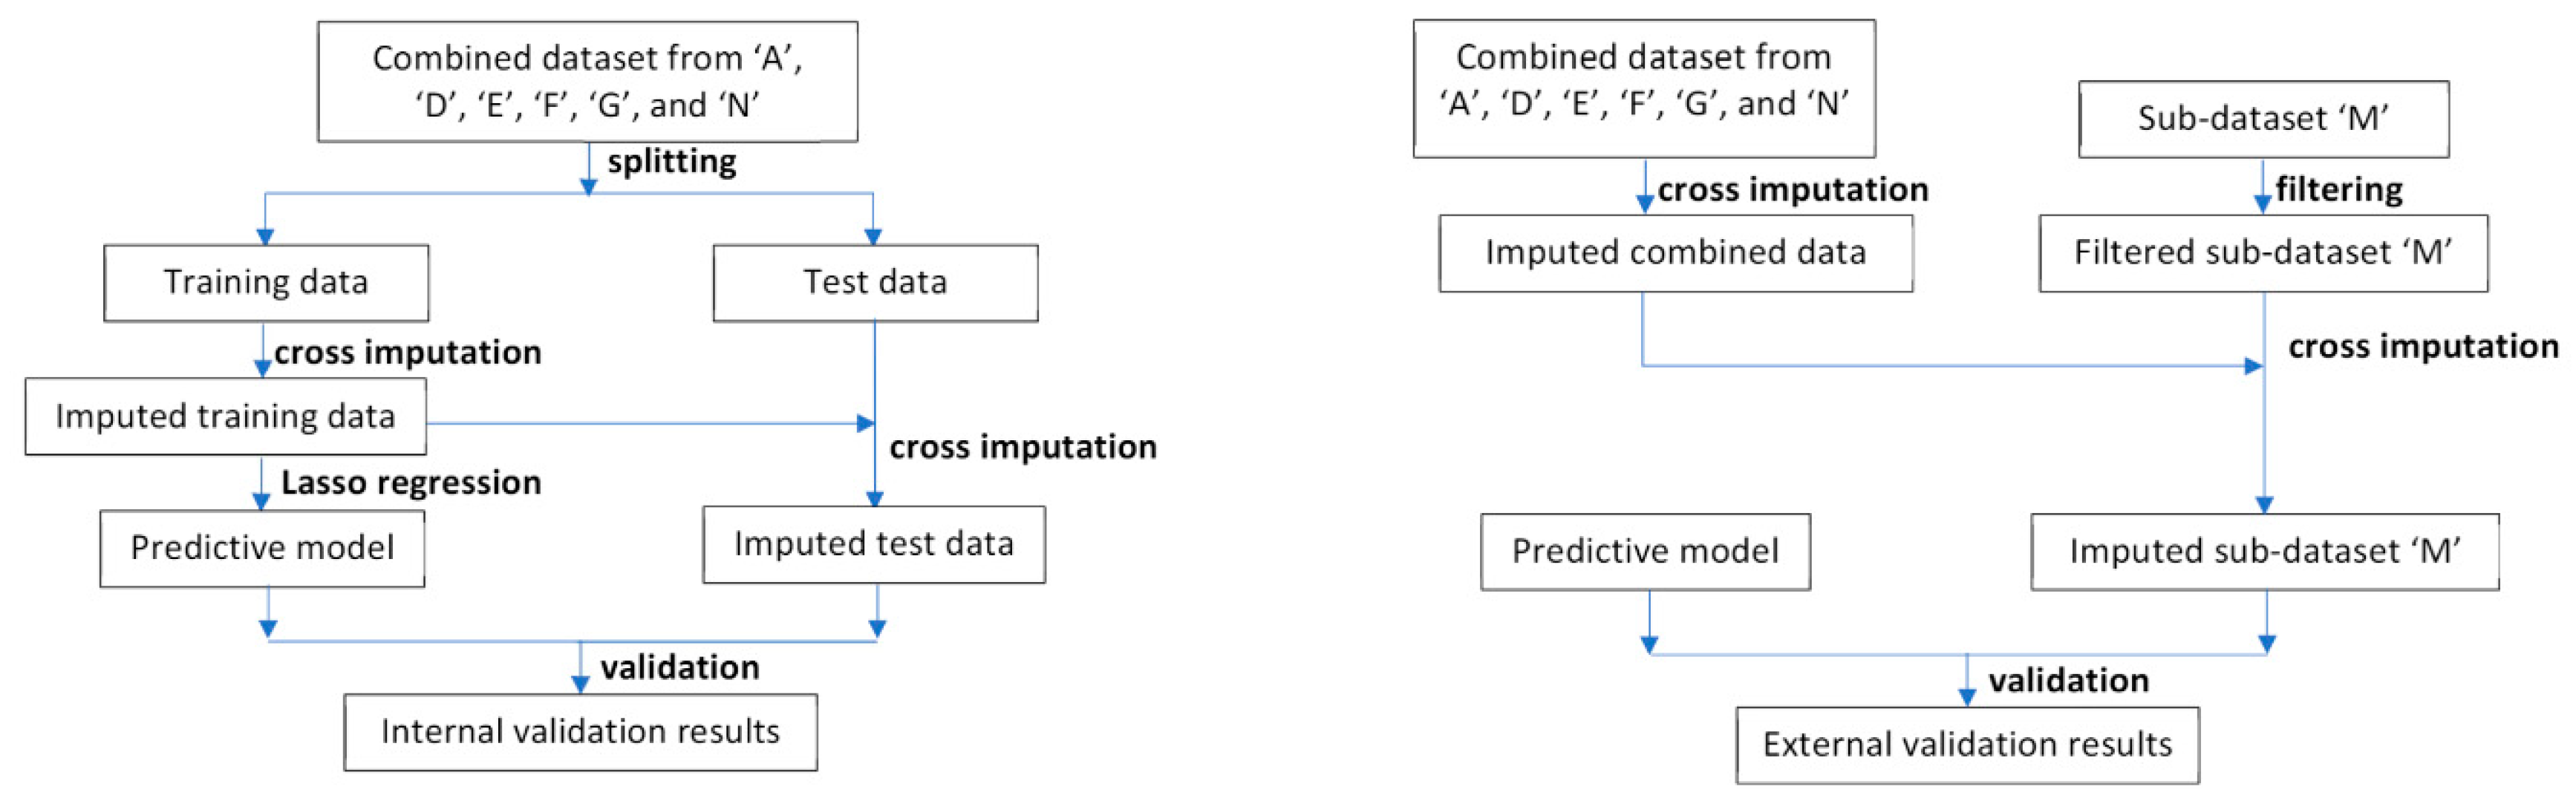
Figure 2.
Internal validation results. (A) Receiver operating characteristic curve and area under curve (AUC) plot; (B) Predicted probability density count plot. The OR (cutoff) was the odds ratio between the two patient groups on two sides of the cutoff line.
Figure 2.
Internal validation results. (A) Receiver operating characteristic curve and area under curve (AUC) plot; (B) Predicted probability density count plot. The OR (cutoff) was the odds ratio between the two patient groups on two sides of the cutoff line.
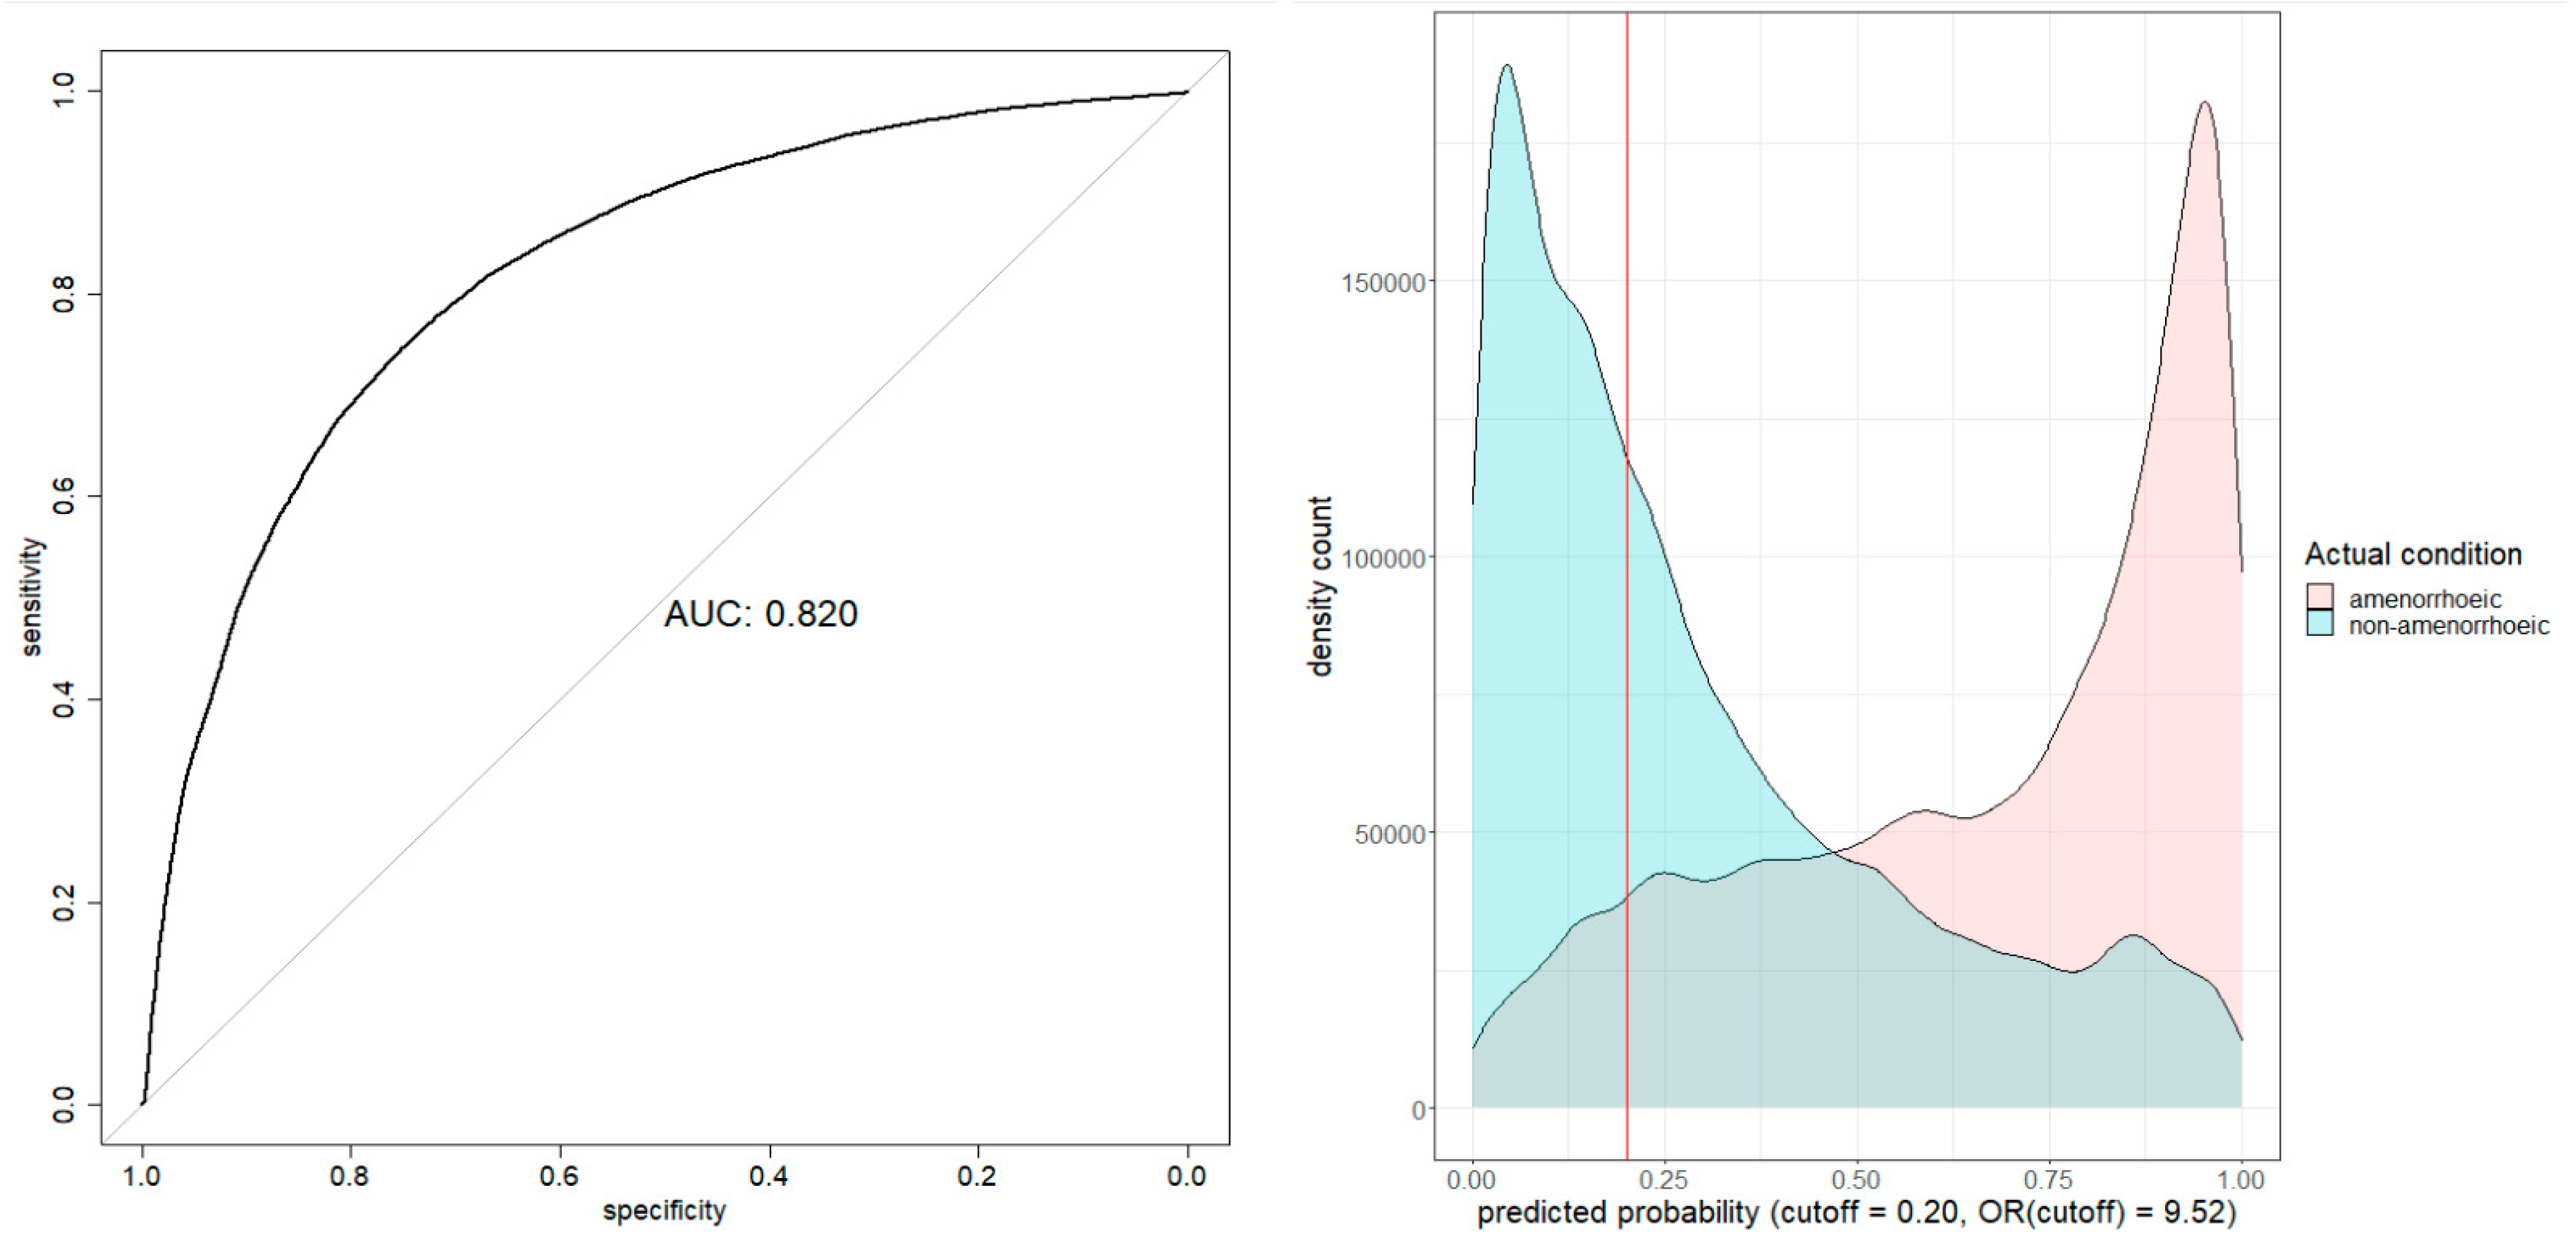
Figure 3.
AUC performance comparison for six models. The imputed external dataset was used for validation. The red curve was for our model. The other curves were for models built using the imputed combined dataset on the same associated variables and methods of the sutdies.
Figure 3.
AUC performance comparison for six models. The imputed external dataset was used for validation. The red curve was for our model. The other curves were for models built using the imputed combined dataset on the same associated variables and methods of the sutdies.
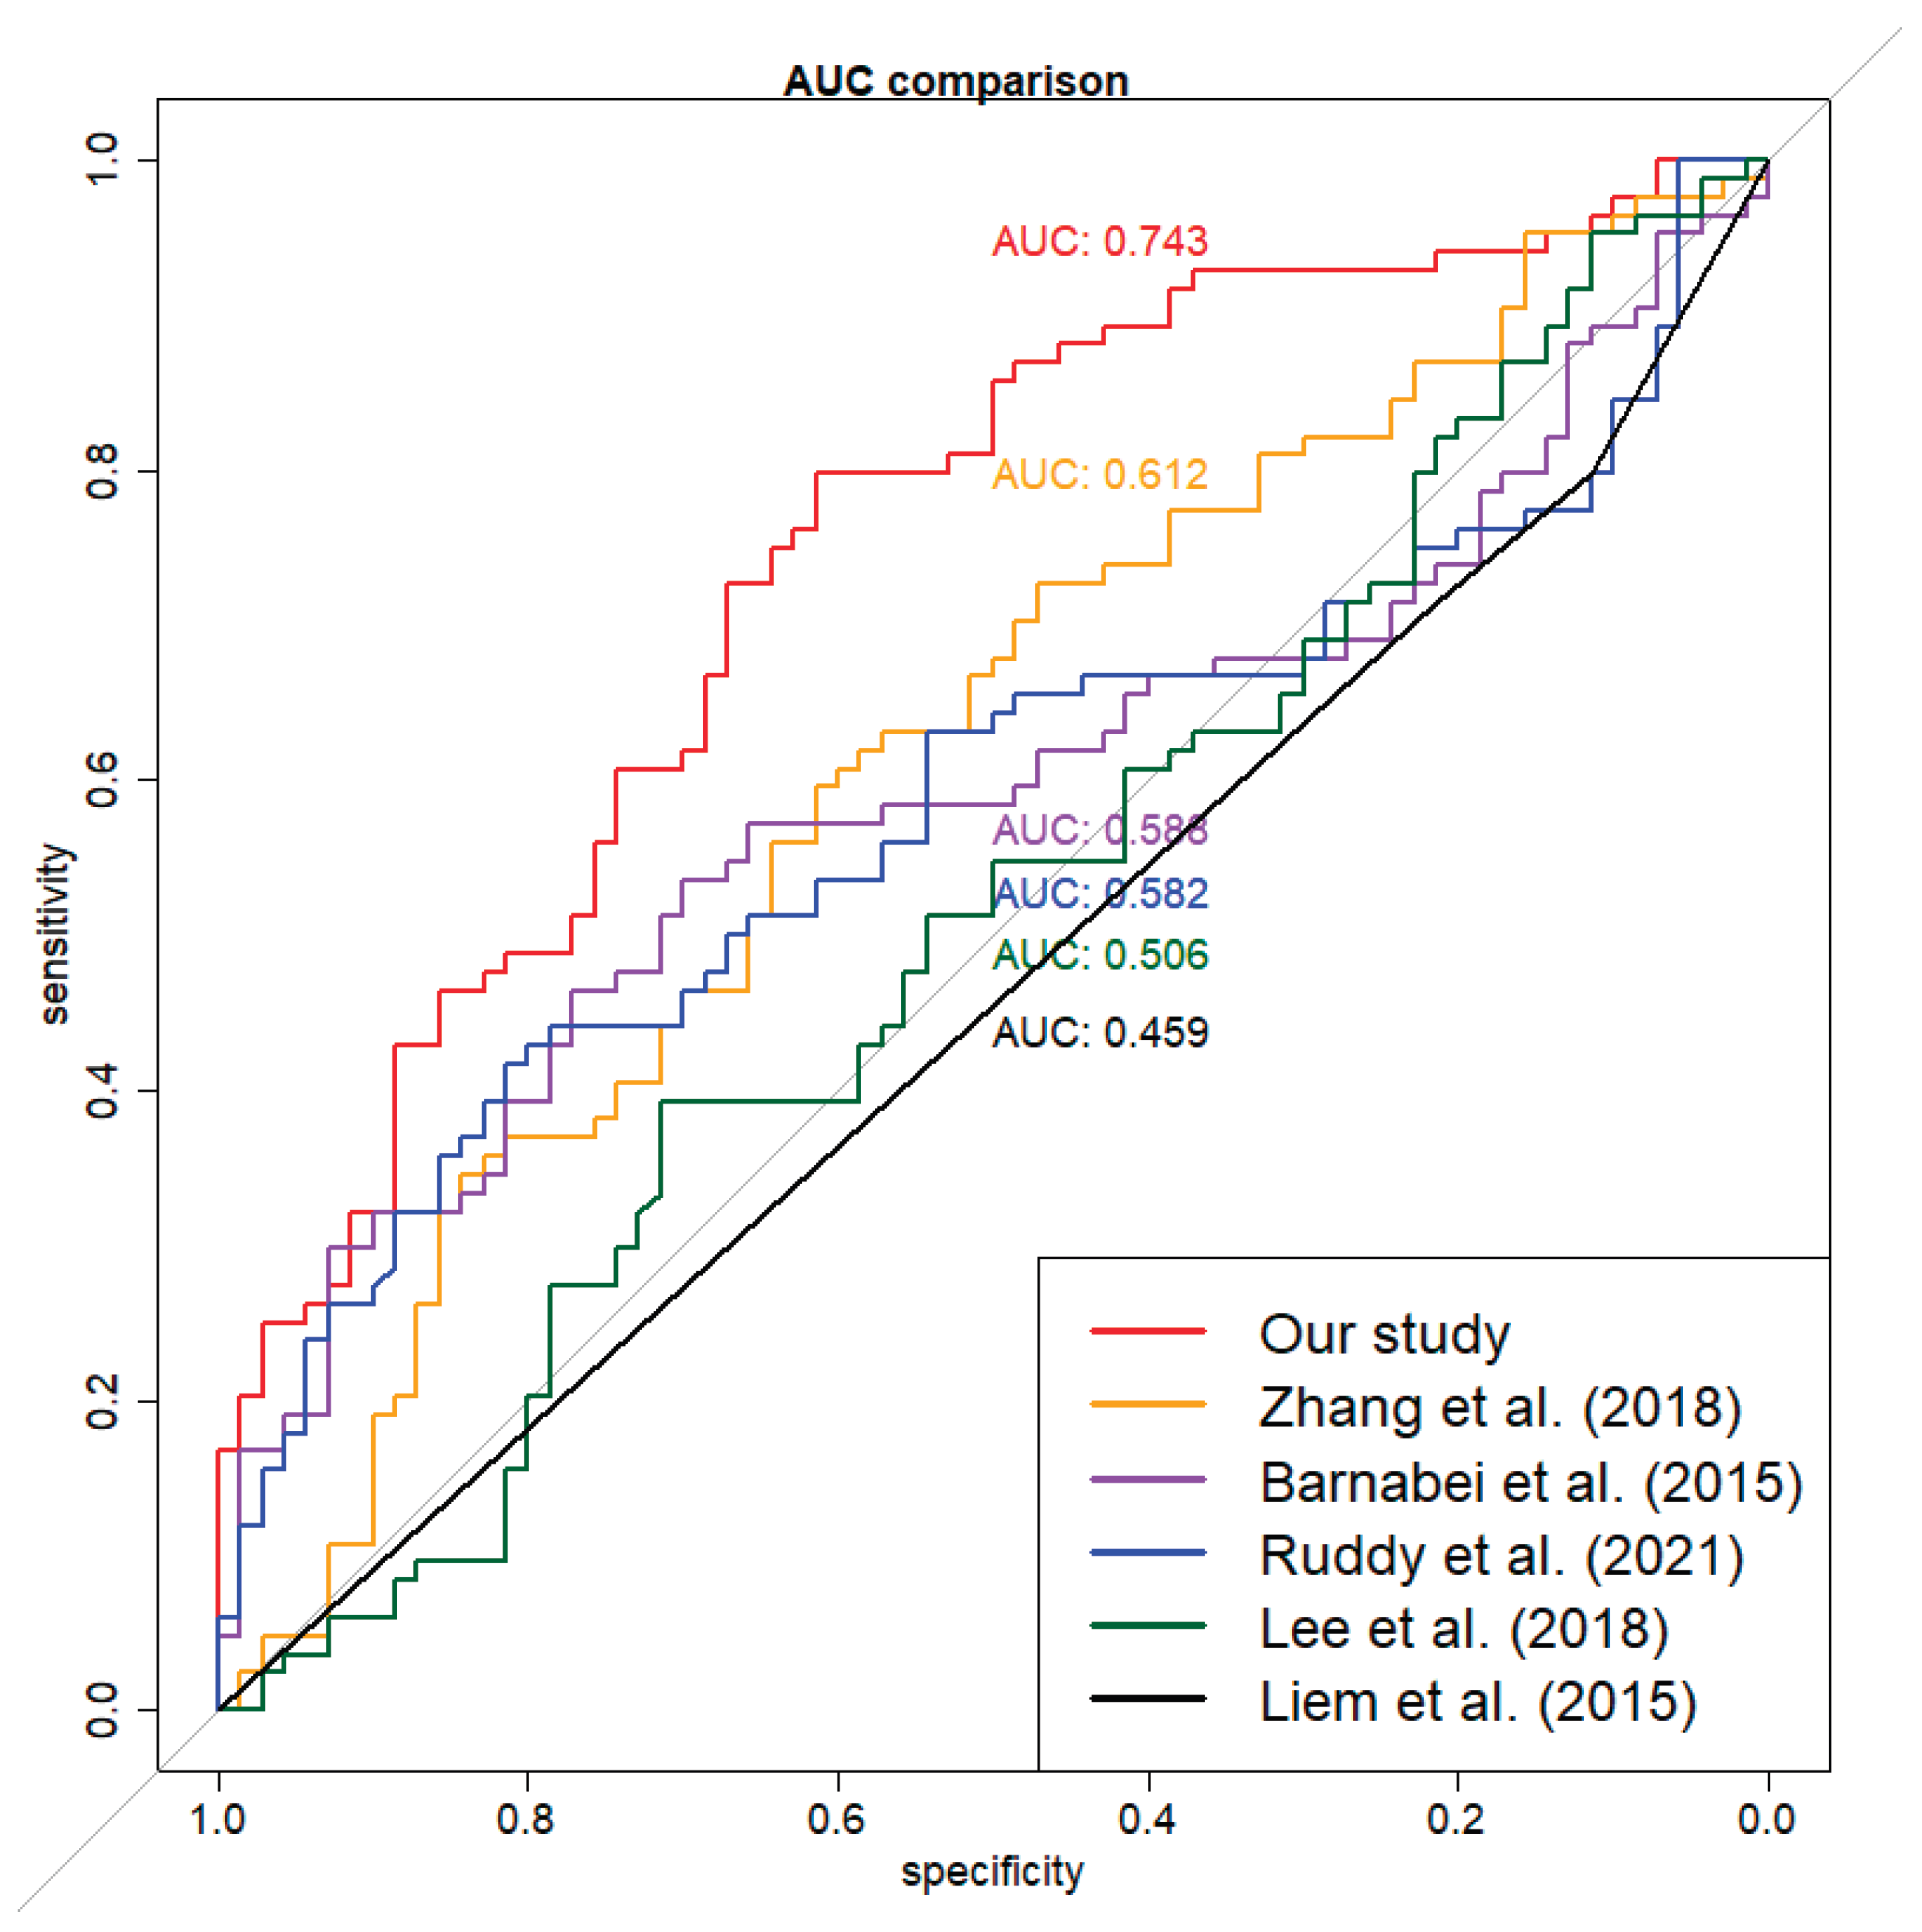

Table 1.
Summary of the selected sub-datasets, after excluding records with missing outcome values.
| Observations n |
Total feature n |
Numerical features n |
Binary features n |
Categorical feature n |
Prevalence of amenorrhea at 12 months % |
Data missingness % |
|
|---|---|---|---|---|---|---|---|
| A | 280 | 26 | 7 | 16 | 3 | 48.9 | 6.6 |
| D | 725 | 11 | 3 | 8 | 0 | 10.8 | 10.2 |
| E | 209 | 22 | 10 | 9 | 3 | 21.1 | 11.8 |
| F | 96 | 28 | 10 | 16 | 2 | 78.1 | 15.7 |
| G | 101 | 19 | 6 | 9 | 4 | 40.6 | 10.9 |
| M | 154 | 13 | 4 | 7 | 2 | 54.5 | 27.1 |
| N | 1268 | 27 | 10 | 12 | 5 | 72.5 | 13.9 |
| Total | 2833 | 53 | 23 | 22 | 8 | 48.6 | 62.0 |
| ADEFGN combined | 2679 | 53 | 23 | 22 | 8 | 48.3 | 61.4 |
Table 2.
Summary of the model's coefficients. The adjusted coefficient for numeric variables was calculated by multiplying the coefficient by one standard deviation (SD) of the variable; for categorical variables, it remains the same as the coefficient. The odds ratio (OR) and adjusted OR represent the change in the predicted probability of Amen_ST12 for a one-unit and one-SD change in the variable, respectively. The table is sorted by the absolute value of the adjusted coefficients, from largest to smallest.
| Order | Variable | Coefficient | OR | Adjusted coefficient | Adjusted OR [95% CI] |
|---|---|---|---|---|---|
| Intercept | 5.193 | ||||
| 1 | BRCA2 | 1.516 | 4.56 | 1.516 | 4.56 [4.024, 5.158] |
| 2 | BRCA1 | 0.554 | 1.74 | 0.554 | 1.74 [1.657, 1.829] |
| 3 | AC+CMF cycles | 0.519 | 1.68 | 0.553 | 1.74 [1.589, 1.903] |
| 4 | CMF dose | -7.329E-04 | 1.00 | -0.483 | 0.62 [0.586, 0.650] |
| 5 | Number of Chemotherapy doses | -0.443 | 0.64 | -0.443 | 0.64 [0.615, 0.670] |
| 6 | Taxanes dose | 0.004 | 1.00 | 0.403 | 1.50 [1.406, 1.592] |
| 7 | CMF treatment | -0.385 | 0.68 | -0.385 | 0.68 [0.649, 0.714] |
| 8 | Age | 0.060 | 1.06 | 0.384 | 1.47 [1.432, 1.506] |
| 9 | CMF cycles | 0.204 | 1.23 | 0.335 | 1.40 [1.342, 1.456] |
| 10 | Inhibin B | -0.017 | 0.98 | -0.321 | 0.73 [0.685, 0.769] |
| 11 | Cycles of other chemotherapy | -0.676 | 0.51 | -0.301 | 0.74 [0.721, 0.759] |
| 12 | AFC | -0.052 | 0.95 | -0.276 | 0.76 [0.688, 0.837] |
| 13 | Chemo dose per 3 weeks | 0.228 | 1.26 | 0.228 | 1.26 [1.192, 1.325] |
| 14 | AMH | -0.036 | 0.96 | -0.204 | 0.82 [0.783, 0.850] |
| 15 | Estradiol | -7.582E-05 | 1.00 | -0.195 | 0.82 [0.804, 0.841] |
| 16 | Neoadjuvant Chemotherapy | 0.173 | 1.19 | 0.173 | 1.19 [1.159, 1.219] |
| 17 | Total doses per mg | 6.522E-05 | 1.00 | 0.116 | 1.12 [1.107, 1.138] |
| 18 | FSH | 0.007 | 1.01 | 0.115 | 1.12 [1.097, 1.148] |
| 19 | LH | 0.010 | 1.01 | 0.102 | 1.11 [1.094, 1.121] |
| 20 | Locoregional radiotherapy | 0.100 | 1.11 | 0.100 | 1.11 [1.058, 1.155] |
BRCA: Breast Cancer gene, A: Adriamycin, C: Cyclophosphamide, M: Methotrexate, F: 5-Fluorouracil, AMH: Anti-Müllerian Hormone, AFC: Antral Follicle Count, FSH: Follicle-Stimulating Hormone, LH: Luteinising Hormone. Note: The effect for BRCA2 and BRCA1 were compared to BRCA non-carriers; the effect for “Number of Chemotherapy doses” and “Chemotherapy dose per 3 weeks” were compared to “Chemotherapy dose per 2 weeks”.
Table 3.
The list of predicted probability, percentage range, and calibrated predicted probability.
| Predicted probability % | Percentage range % | Calibrated predicted probability % |
|---|---|---|
| [0.00, 2.75) | [0.0, 5.0) | 8.9 |
| [2.75, 5.73) | [5.0, 10.0) | 8.6 |
| [5.73, 9.18) | [10.0, 15.0) | 12.7 |
| [9.18, 13.07) | [15.0, 20.0) | 16.6 |
| [13.07, 16.73) | [20.0, 25.0) | 20.4 |
| [16.73, 21.09) | [25.0, 30.0) | 22.5 |
| [21.09, 25.42) | [30.0, 35.0) | 28.8 |
| [25.42, 30.71) | [35.0, 40.0) | 32.6 |
| [30.71, 36.67) | [40.0, 45.0) | 38.0 |
| [36.67, 43.31) | [45.0, 50.0) | 44.5 |
| [43.31, 50.54) | [50.0, 55.0) | 49.7 |
| [50.54, 57.79) | [55.0, 60.0) | 55.9 |
| [57.79, 65.60) | [60.0, 65.0) | 61.8 |
| [65.60, 73.57) | [65.0, 70.0) | 66.7 |
| [73.57, 80.54) | [70.0, 75.0) | 74.3 |
| [80.54, 86.06) | [75.0, 80.0) | 75.6 |
| [86.06, 90.44) | [80.0, 85.0) | 80.2 |
| [90.44, 94.03) | [85.0, 90.0) | 86.6 |
| [94.03, 96.99) | [90.0, 95.0) | 89.1 |
| [96.99, 100.00] | [95.0, 100.0] | 89.1 |
Disclaimer/Publisher’s Note: The statements, opinions and data contained in all publications are solely those of the individual author(s) and contributor(s) and not of MDPI and/or the editor(s). MDPI and/or the editor(s) disclaim responsibility for any injury to people or property resulting from any ideas, methods, instructions or products referred to in the content. |
© 2025 by the authors. Licensee MDPI, Basel, Switzerland. This article is an open access article distributed under the terms and conditions of the Creative Commons Attribution (CC BY) license (http://creativecommons.org/licenses/by/4.0/).
Copyright: This open access article is published under a Creative Commons CC BY 4.0 license, which permit the free download, distribution, and reuse, provided that the author and preprint are cited in any reuse.


