Submitted:
01 October 2025
Posted:
02 October 2025
You are already at the latest version
Abstract
Background: Early memory and executive function (EF) in young children are widely regarded as behavioral proxies of hippocampal and prefrontal maturation, which in turn scaffold the emergence of language networks. We test whether early cognitive proxies predict later language outcomes in a nationally representative cohort.
Methods: Data were drawn from the Kids in Taiwan (KIT) longitudinal database (n = 6,652 at 36 months). Hierarchical regression models examined whether 12-month memory and EF predicted 24-month language comprehension and expression, and whether 24-month cognition predicted 36-month outcomes, controlling for parental education, involvement, responsiveness, child gender, and child temperament.
Results: At 12 months, both memory and executive function (EF) significantly predicted language comprehension and expression at 24 months, with incremental ΔR² of approximately .06 for comprehension and .04 for expression. For comprehension, memory (β ≈ 0.26, p < .001) and EF (β ≈ 0.04, p = .006) were significant predictors. For expression, memory (β ≈ 0.21, p < 0.001) and EF (β ≈ 0.06, p < 0.001) were also significant predictors. In contrast, cognitive predictors at 24 months showed negligible associations with 36-month outcomes. For both comprehension and expression, adding memory and EF at Step 3 resulted in minimal increases in explained variance (ΔR² ≈ .001; ns), and coefficients did not reach significance. Conclusions: Memory and EF serve as behavioral indicators of early neu-rocognitive development, demonstrating predictive power for subsequent language outcomes. Although predictive links from 24 to 36 months were weaker, measures of memory and EF at 12 months showed robust associations with 24-month language comprehension and expression. These findings underscore the value of identifying cognitive markers of early brain development for informing early screening and intervention.
Keywords:
memory
; executive function
; language development
; neurocognitive development
; behavioral proxies
; longitudinal study
1. Introduction
Early language development during infancy and toddlerhood forms the foundation for later literacy and academic achievement (NICHD Early Childcare Research Network, 2002; Hoff, 2006). Family and childcare environments play a central role in shaping children’s language outcomes, particularly through parental responsiveness, involvement, and caregiver–child interactions (Levickis et al., 2023; Rivero et al., 2023). For instance, sustained parental responsiveness across early childhood predicts stronger language skills in middle childhood (Levickis et al., 2023). Meanwhile, positive parental engagement and high-quality caregiver–child interactions promote vocabulary and comprehension, even in high-risk contexts (Rivero et al., 2023; Vernon-Feagans et al., 2013).
Temperament, defined as biologically based differences in reactivity and self-regulation (Rothbart & Bates, 2006), also contributes to variation in children’s language development. Higher effortful control has been associated with better expressive vocabulary and bidirectional links with self-regulation (Bohlmann et al., 2015), while surgency—reflecting sociability and positive affectivity—facilitates conversational engagement and vocabulary growth (Ishikawa-Omori et al., 2022; Kucker et al., 2021). Conversely, heightened negative emotionality may constrain vocabulary acquisition, as shown in longitudinal studies differentiating early and late talkers (Kubicek & Emde, 2012) and predicting weaker outcomes in later childhood (Cioffi et al., 2021). Because temperament may confound associations between cognition and language, the present study controls for these dimensions when testing predictive models.
While temperament helps explain dispositional differences in children’s engagement with language, emerging evidence suggests that cognitive capacities—such as memory and executive function (EF)—may serve as behavioral proxies of early brain maturation. Neuroimaging studies demonstrate that the hippocampus is functionally active in infants as young as three months, supporting statistical learning and sequence binding (Ellis et al., 2020). Additionally, hippocampal–prefrontal growth is shown to jointly contribute to improvements in relational and episodic memory across childhood (Selmeczy & Ghetti, 2019). In parallel, rapid structural and functional changes in the prefrontal cortex during the first year of life provide the neural substrate for the emergence of EF (Hodel, 2018). These converging findings support the interpretation of memory and EF behaviors as early indicators of hippocampal- and prefrontal-supported processes that scaffold the emergence of language networks.
In addition to gray matter maturation in the hippocampus and prefrontal cortex, the rapid development of white matter pathways provides critical infrastructure for language acquisition. Diffusion tensor imaging (DTI) studies have demonstrated that infants with more advanced organization of tracts, such as the arcuate fasciculus and corpus callosum, show superior receptive and expressive language skills years later (Zuk et al., 2021; Sket et al., 2019). Longitudinal evidence further reveals that neonatal white matter microstructure predicts comprehension at 12 months (Sket et al., 2019) and that greater coherence in pathways, such as the inferior fronto-occipital fasciculus, during the preschool years is associated with better phonological processing and vocabulary growth (Walton et al., 2018). Findings from at-risk populations converge on this pattern: among preterm infants, variability in neonatal white matter integrity significantly predicts language outcomes at age two (Dubner et al., 2020). Taken together, these results underscore that the neural groundwork for language is established well before children begin producing complex speech.
Moreover, early experience interacts with neurodevelopment to shape these emerging networks. For example, the frequency of parent–infant conversational turns between 6 and 24 months uniquely predicts myelination in the arcuate and superior longitudinal fasciculus by age two (Huber et al., 2023), highlighting how rich language environments strengthen neural “highways” that support comprehension and expression. At the same time, the maturation of executive control networks in the prefrontal cortex allows children to adapt their language use to dynamic communicative demands flexibly. Studies of bilingual development illustrate this interplay vividly: children exposed to two languages from infancy exhibit stronger functional connectivity in frontoparietal control circuits, enabling them to toggle between linguistic systems and adjust to different social contexts with ease (Mohades et al., 2015; Filipe et al., 2023). These converging findings demonstrate that both structural connectivity and developing executive control systems jointly scaffold language acquisition, providing a neural bridge between early cognition and the dynamic use of language in everyday contexts.
A particularly important tract is the arcuate fasciculus, a curved bundle of fibers connecting Broca’s area in the frontal lobe with Wernicke’s area in the temporal lobe. This pathway serves as a “highway” linking language comprehension with production, allowing children to transform what they hear into what they can say. Damage to this tract in adults results in conduction aphasia, highlighting its central role in speech repetition and phonological processing (Catani & Mesulam, 2008). Developmentally, greater integrity of the arcuate fasciculus in infancy and early childhood has been shown to predict stronger vocabulary, phonological awareness, and later language outcomes (Zuk et al., 2021; Sket et al., 2019). Thus, the arcuate fasciculus provides a structural bridge that underpins the coordination of language understanding and expression from the earliest years of life.
Taken together, these studies highlight how structural connectivity and EF jointly scaffold language development. However, most existing evidence comes from relatively small-scale neuroimaging studies or cross-sectional designs, which limit the ability to generalize findings to population-level development. To advance the field, it is essential to examine whether early behavioral proxies of brain maturation—such as memory and EF—predict later language outcomes in large, representative cohorts.
However, few large-scale longitudinal studies have examined how cognition predicts later language development while explicitly linking behavioral measures—typically used in large cohort studies—to underlying neural mechanisms. Although such behavioral measures may lack the directness of neuroimaging, they can be theoretically interpreted as proxies of early neurocognitive maturation, providing a valuable bridge between population-level data and neural processes.
Addressing this gap, the present study uses data from the nationally representative Kids in Taiwan (KIT) cohort to investigate early cognition–language links. Specifically, we test whether memory and EF at 12 months predict language comprehension and expression at 24 months, and whether memory and EF at 24 months predict language outcomes at 36 months, controlling for family background and child temperament.
By framing memory and EF as behavioral proxies of early neurocognitive maturation, this study extends prior work by combining population-level data with theoretically grounded neural interpretations to clarify how early cognition contributes to language development.
2. Literature Review
2.1. Early Language Development and Environmental Predictors
Language development in the first three years of life lays the foundation for later literacy, social competence, and academic achievement (NICHD Early Child Care Research Network, 2002; Hoff, 2006). A substantial body of research has documented the importance of environmental influences, including both family and childcare settings, in shaping children’s language outcomes. Parental responsiveness, involvement, and education levels consistently predict vocabulary and comprehension growth, while caregiver–child interactions in childcare contexts provide additional scaffolding for language learning (Levickis et al., 2023; Rivero et al., 2023; Vernon-Feagans et al., 2013). For example, Longitudinal studies demonstrate that sustained parental responsiveness is associated with stronger language skills (Levickis et al., 2023), and high-quality verbal exchanges with caregivers can buffer children in high-risk contexts from poorer language outcomes (Rivero et al., 2023; Vernon-Feagans et al., 2013). Together, these findings underscore family background and parental engagement as foundational contextual factors in children’s language development.
2.2. Child Temperament and Language Development
Building on the role of environmental influences, children’s own characteristics also shape early language trajectories. Temperament, defined as biologically based individual differences in reactivity and self-regulation (Rothbart & Bates, 2006), has also been linked to language development. Children who score higher in effortful control are more likely to sustain attention and regulate impulses, thereby facilitating participation in language-rich interactions and predicting stronger language outcomes (Bohlmann et al., 2015; Dixon & Smith, 2000). Surgency, reflecting sociability and positive affect, with greater engagement in conversational exchanges and more advanced expressive skills (Ishikawa-Omori et al., 2022; Kucker et al., 2021).
Conversely, high negative affectivity has been linked to constraints in children’s language growth, as heightened negative expression in infancy differentiated earlier and later talkers (Kubicek & Emde, 2012) and lower negative emotionality predicted stronger language outcomes in longitudinal adoption studies (Cioffi et al., 2021). Because temperament may confound associations between cognition and language, the present study includes these dimensions as covariates.
A growing body of research demonstrates that self-regulatory skills, particularly effortful control, are closely tied to language development. Bohlmann et al. (2015) reported bidirectional associations between effortful control and expressive vocabulary in preschoolers, suggesting that attentional and inhibitory processes support language growth while language itself can scaffold self-regulation. Similarly, longitudinal adoption studies show that lower negative emotionality in toddlerhood predicts stronger executive function and language abilities through early school years (Cioffi et al., 2021). Evidence from preschool classrooms further indicates that self-regulation and expressive language develop in tandem, especially in children from low-income backgrounds (Alamos et al., 2025). Together, these findings underscore that early regulatory capacities play a central role in shaping both comprehension and expression.
Sociability and positive affectivity, captured by the construct of surgency, also appear to promote language development. Children high in surgency are more inclined to initiate and sustain interactions, thereby gaining broader opportunities to practice and expand vocabulary. Kucker et al. (2021) found that positive affect and child temperament characteristics were associated with more advanced expressive vocabulary, even after accounting for parent personality traits. Likewise, Ishikawa-Omori et al. (2022) demonstrated that early surgency predicted stronger language skills at 40 months, highlighting the role of positive temperament dispositions in fostering conversational engagement and linguistic growth.
In contrast, negative emotionality has been implicated as a risk factor for language development, though findings are mixed. Kubicek and Emde (2012) showed that trajectories of emotional expression between 15 and 30 months differentiated early and later talkers, indicating that heightened negative affect may constrain vocabulary growth. More recently, Cioffi et al. (2021) reported that lower negative emotionality in toddlerhood was associated with stronger language and executive function outcomes through early grade school, highlighting the relevance of affective regulation. Environmental contexts, such as quality of maternal support or input, appear to moderate how negative emotionality relates to language growth (Spinelli et al., 2018). Overall, negative emotionality does not uniformly impede language growth but may selectively undermine productive linguistic engagement, particularly in expressive domains. In sum, converging evidence suggests that effortful control and surgency generally facilitate language acquisition, whereas negative affectivity may constrain development, particularly for expressive skills. The influence of temperament may also depend on contextual factors such as parental input. Building on these findings, the present study includes surgency, effortful control, and negative affectivity as covariates to clarify their contributions to language comprehension and expression during the second and third years of life.
2.3. Cognitive Foundations: Memory and Executive Function
Early language development is grounded not only in contextual and temperamental factors but also in children’s emerging cognitive capacities. Two processes—memory and executive function (EF)—form the core cognitive foundation that supports language growth.
Early memory development is closely tied to the emergence of vocabulary and comprehension skills. Longitudinal research has further shown that verbal comprehension and processing speed predict improvements in fact memory among 5- and 6-year-olds (Riggins, 2014). Neurocognitive studies provide converging evidence. The hippocampus is functionally active within the first year of life, supporting recognition memory and statistical learning—the ability to detect recurring patterns in speech and environmental input (Ellis et al., 2020). These processes help children extract and store linguistic regularities, thereby scaffolding vocabulary acquisition (Selmeczy & Ghetti, 2019).
Everyday behavior also illustrates the role of memory in language. Young children recall storybooks, name caregivers, and create short imaginative narratives. Research has consistently shown that stronger memory skills predict richer narrative abilities. For example, Kulkofsky and Klemfuss (2008) found that children with stronger memory traces produced more coherent language and showed better long-term language outcomes. Similarly, Together, these findings highlight recognition, recall, and representational flexibility as key memory processes that scaffold language development.
While memory supports storage and retrieval, EF provides the regulatory skills necessary to use language effectively. During infancy and toddlerhood, the prefrontal cortex undergoes rapid development, enabling EF processes such as attentional regulation, inhibitory control, and working memory (Diamond, 2013; Hodel, 2018). Sensitive caregiving also fosters EF by regulating stress physiology and promoting prefrontal growth (Blair & Raver, 2015).
In everyday life, EF skills are reflected in children’s ability to follow requests, suppress prohibited behaviors, and sustain attention. These skills allow children to filter distractions, integrate linguistic input, and sustain conversation. Empirical evidence supports this role. Adams, Bourke, and Willis (1999), drawing on Baddeley’s (1986) working memory model, studied 4- to 5-year-old children and found that both listening span and phonological memory were significantly related to vocabulary knowledge and spoken language comprehension. Among these predictors, phonological memory accounted for the greatest variance in vocabulary outcomes. Strasser and del Río (2014) examined preschoolers’ story comprehension. They reported that when comprehension was measured through building a coherent representation, vocabulary, monitoring, inference, working memory, inhibitory control, and attention all contributed significantly. In contrast, when comprehension was assessed through recall of isolated story elements, only working memory and vocabulary explained variance. Alfonso and Lonigan (2021) further found that, after controlling for early literacy skills, EF in 4-year-old Spanish-speaking preschoolers uniquely predicted their kindergarten English proficiency.
In sum, memory allows children to encode and recall information, while EF enables them to regulate attention and apply language flexibly. Both capacities emerge through neurobiological maturation and caregiving contexts. Together, they provide critical cognitive resources that support receptive and expressive language development. Building on this evidence, the present study examines the unique predictive power of memory and EF after accounting for family background and child temperament.
2.4. Neural Mechanisms of Early Speech and Language
Behavioral studies highlight the importance of memory and EF for language development. Yet, examining how the infant brain processes speech provides critical complementary evidence.
Neuroimaging research shows that the infant brain is specialized for speech from the very beginning. Dehaene-Lambertz (2006) demonstrated that young infants recruit cortical networks to discriminate speech sounds. Later work confirmed stronger activation in the left temporal and parietal regions for speech compared with music, with especially robust responses to the mother’s voice (Dehaene-Lambertz et al., 2010). Building on this evidence, Dehaene-Lambertz (2017) emphasized that the infant brain engages in both parallel and hierarchical processing. Parallel processing allows infants to analyze phonemes and intonation simultaneously. Hierarchical processing enables them to construct higher-level linguistic units such as syllables, words, and sentences. Together, these mechanisms establish a neural architecture optimized for language acquisition.
Complementary findings come from ERP research. Choi et al. (2021) reported that even before babbling, three-month-old infants show sensorimotor mapping: auditory speech sounds activate motor areas controlling the corresponding articulators. This early auditory–motor integration suggests that perception and production are linked from the start, forming neural loops that scaffold language learning.
Taken together, neuroimaging evidence demonstrates that the infant brain is biologically prepared for speech. These neural mechanisms—speech specialization, parallel and hierarchical processing, and auditory–motor integration—provide the biological foundation for later language development. Moreover, they underscore that early cognitive behaviors such as memory and EF can be understood as behavioral proxies of underlying hippocampal and prefrontal functioning.
2.5. Conceptual Framework and Hypotheses
The present study is guided by a conceptual framework in which young children’s cognitive abilities are conceptualized as behavioral proxies of early brain neurobiological maturation. Specifically, memory is conceptualized as reflecting hippocampal-supported processes of encoding, binding, and retrieval, whereas executive function (EF) is conceptualized as reflecting prefrontal-supported processes of attentional control, inhibition regulation, and working memory. Prior studies suggest that both systems provide critical scaffolding for the emergence of early language networks, supporting comprehension and expression during the toddler years.
Based on this framework, we formulated two hypotheses:
- H1: Memory and executive function (EF) at 12 months will independently predict children’s language comprehension and expression at 24 months.
- H2: Memory and executive function (EF) at 24 months will independently predict children’s language comprehension and expression at 36 months.
In line with developmental neuroscience, these hypotheses are interpreted as reflecting the contributions of hippocampal- and prefrontal-supported processes to early language acquisition, while acknowledging that the present measures serve as behavioral proxies rather than direct neural indicators.
2.6. The Present Study
In summary, prior research highlights three domains of influence on children’s early language development: environmental inputs, child temperament, and cognitive foundations such as memory and executive function. Neuroimaging studies further demonstrate that these cognitive capacities can be interpreted as behavioral proxies of hippocampal and prefrontal maturation, and that white matter pathways such as the arcuate fasciculus provide critical structural support for language networks. However, most existing evidence is derived from small-scale or cross-sectional studies, limiting generalizability and leaving unanswered how these early cognitive skills contribute to later language outcomes at the population level.
The present study addresses this gap by drawing on data from the nationally representative Kids in Taiwan (KIT) cohort. Specifically, we investigate whether memory and executive function at 12 months predict language comprehension and expression at 24 months, and whether these cognitive skills at 24 months predict language outcomes at 36 months, while controlling for family background and child temperament. By framing memory and executive function as behavioral proxies of early brain development, this study extends previous work by combining population-level data with theoretically grounded neurocognitive interpretations, thereby clarifying the developmental pathways linking early cognition to language acquisition (Figure 1).
3. Methods
3.1. Participants and Dataset
This study used data from the Kids in Taiwan: National Longitudinal Study of Child Development and Care (KIT) project, a government-supported cohort designed to examine children’s development, family environments, and childcare contexts in Taiwan (Chang, 2024). KIT employed a two-stage stratified random sampling method, first selecting districts and townships proportional to population size and then randomly selecting children from household registration records, thereby ensuring that the sample represents Taiwan’s demographic diversity. Approximately 6,800 children were recruited and have been followed longitudinally through parent interviews and developmental assessments.
The present analysis focused on the KIT M3 cohort at 12, 24, and 36 months. A total of 6,874 and 6,775 children had valid data on language outcomes at 12 and 24 months, respectively, and 6,652 children had valid data at 36 months. Parental questionnaires provided information on family background and parenting variables, while primary caregivers completed child developmental items.
The KIT project was reviewed and approved by the National Chunghua University of Education Research Ethics Committee (NCUEREC; approval number NCUEREC-110-031). Written informed consent was obtained from parents or legal guardians before each wave of data collection. The consent forms detailed the purpose of the study, the procedures involved, potential risks, and confidentiality assurances. Participation was voluntary, and families were informed that they could withdraw at any time without penalty. These procedures ensured strict adherence to ethical guidelines and safeguarded the rights and well-being of participants.
The KIT data are publicly archived at the Survey Research Data Archive (SRDA), Academia Sinica, Taiwan. The present study used the KIT-M3 cohort, which was recruited at 3 months of age and followed longitudinally. Specifically, data from waves 3 to 5 (children aged 12, 24, and 36 months) were analyzed. The KIT-M3 dataset is available under accession number D00180 (Chang, 2024) from the SRDA (https://doi.org/10.6141/TW-SRDA-D00180-2). Access is restricted to institutional affiliates of Taiwanese universities or research institutes and requires an approved application.
Sample Attrition and Missing Data Handling
Attrition across the KIT waves was modest. Attrition across the KIT waves was modest. The number of valid cases decreased from 6,874 at 12 months to 6,775 at 24 months (≈1.4% attrition), and further to 6,652 at 36 months (≈1.8% attrition from 24 to 36 months). Overall, only about 3.2% of cases were lost between 12 and 36 months. Given this small proportion and the absence of systematic differences on child-level variables, listwise deletion was applied to handle missing data. Multiple imputation was considered but not implemented because attrition was modest and selective only with respect to parental characteristics.
3.2. Measures
All measures were derived from the KIT survey and developmental assessments. in the Supplementary Materials summarizes the constructs, item examples, score ranges, and reliability indices (Appendix A).
- Language outcomes. At 12, 24, and 36 months, children’s receptive and expressive language abilities were assessed with caregiver-reported developmental items. Separate indicators were created for comprehension and expression at each age.
- Memory. At 12 and 24 months, memory was assessed through caregiver reports of recognition, recall, and representational flexibility items (e.g., recalling familiar stories, naming familiar people). Although brief, these items capture early memory-related behaviors shown to predict subsequent cognitive and language outcomes.
- Executive function (EF). EF was measured at 12 and 24 months using items reflecting inhibitory control, attention shifting, and working memory (e.g., stopping a prohibited action when asked, sustaining focus on a task). These measures align with validated EF frameworks in early development (Diamond, 2013).
- Family background. Parental (paternal and maternal) education levels were reported in years of schooling. Parental (paternal and maternal) involvement and Parental responsiveness were measured with validated questionnaire items. Parental education level was coded on a 6-point ordinal scale (1 = Elementary school or below, 6 = Master’s degree or above). For the purposes of statistical analyses, it was treated as a continuous variable, and descriptive statistics are reported as means and standard deviations.
- Temperament. Surgency, effortful control, and negative affectivity were measured with caregiver-reported items adapted from Rothbart’s Infant Behavior Questionnaire. Internal consistency for multi-item measures ranged from acceptable to good (Cronbach’s α = .71–.83). These dimensions were included as covariates given their known associations with both cognition and language (Rothbart & Bates, 2006).
3.3. Analytic Strategy
Analyses proceeded in two stages. First, descriptive statistics and correlations were computed for all variables. Second, a series of hierarchical regression models tested whether memory and EF at 12 months predicted language comprehension and expression at 24 months, and whether memory and EF at 24 months predicted language outcomes at 36 months. All models controlled for fathers and mothers’ education, fathers' and mother’s involvement, parental responsiveness, and child temperament (effortful control, surgency, negative affectivity). Child gender was entered as a dummy variable (male = 1, female = 0). Model assumptions were checked: variance inflation factors (VIFs) were < 2 for all predictors, indicating no multicollinearity; residuals were inspected for normality and homoscedasticity. Standardized regression coefficients (β) were reported, along with 95% confidence intervals and effect size estimates (Cohen’s f²). Sensitivity analyses excluding cases with missing paternal data were also conducted; results were substantively unchanged (available upon request).
4. Results
4.1. Descriptive Statistics and Correlations of Study Variables
Table 1 displays the means and standard deviations of each of memory, executive function, language comprehension, and language expression at 36 months, indicating that children’s average language scores are higher than their cognitive scores.
Table 2 presents that the gender distribution of participants at 36 months is relatively balanced, with a nearly 1:1 ratio of male to female; the distributions of paternal and maternal education levels are also similar.
Table 3 shows correlations among memory, executive function, language comprehension, and language expression at 12, 24, and 36 months in this study. As expected, many correlations are moderate and significant. Notably, the associations between language and cognition are strongest at 24 months, whereas these associations are relatively weaker at 36 months.
4.2. Predicting 24-Month Outcomes from 12-Month Cognition
4.2.1. Language Comprehension
The results of the hierarchical regression are displayed in Table 4. The analyses were conducted to examine predictors of children’s language comprehension at 24 months. In Step 1, the set of five control variables accounted for a significant proportion of variance, R² = 0.053, F(5, 5549) = 61.91, p < .001, and all five variables were significant predictors. In Step 2, the addition of child characteristics (gender, surgency, effortful control, and negative affectivity) explained an additional 4.9% of variance, ΔR² = 0.049, F(4, 5545) = 75.91, p < .001, raising the total explained variance to 10.2%, F(9, 5545) = 69.99, p < .001. Significant predictors at this stage included Paternal education, maternal education, paternal involvement, parental responsiveness, child gender, surgency and effortful control. In Step 3, memory and executive function were entered, explaining an additional 5.6% of variance, ΔR² = 0.056, F(2, 5543) = 185.21, p < .001 and increasing the total explained variance to 15.8%, F(11, 5543) = 94.74, p < .001. Memory (β = 0.255, p < .001) and executive function (β = 0.044, p = .006) were both significant predictors, over and above demographic, parental, and temperament variables. Among the predictors in this final model, memory emerged as the strongest predictor. Taken together, these findings emphasize that children’s memory and executive function provide unique and substantial predictive power for early language comprehension.
4.2.2. Language Expression
Table 5 presents the results of the hierarchical regression analyses, were conducted to examine predictors of children’s language expression at 24. The analyses were conducted to examine predictors of children’s language comprehension at 24 months. Step 1, the set of five control variables accounted for a significant proportion of variance, R² = 0.082, F(5, 5545) = 99.12, p < .001, and all five variables were significant predictors. Of these, only maternal involvement was not significant, whereas all other predictors showed significant effects. In Step 2, the addition of child characteristics (gender, surgency, effortful control, and negative affectivity) explained an additional 7.3% of variance, ΔR² = 0.073, F(4, 5541) = 120.32, p < .001, raising the total explained variance to 15.5%, F(9, 5541) = 113.28, p < .001. Among these, negative affectivity was not significant, while the other predictors contributed significantly. In Step 3, the addition of memory and executive function explained an additional 4.2% of the variance, ΔR² =.042, F(2, 5539) = 144.12, p < .001, raising the total explained variance to 19.7%, F(11, 5539) = 123.67, p < .001. Of all predictors in the final model, memory showed the strongest effect (β = .21, p < .001).
4.3.2. Language Expression
In Step 1, the five family-related control variables were entered, but they accounted for virtually none of the variance in 36-month language expression, F (5, 6166) = 0.47, p = .803. In Step 2, child characteristics (gender, surgency, effortful control, and negative affectivity) were added, but these factors also accounted for a significant proportion of variance, R² = 0.001, F (9, 6162) = .39 , p = .941. In Step 3, memory and executive function were included to test whether early cognitive skills predicted later expression. These variables explained an additional 0.1% of the variance, but the effect did not reach significance, ΔR² =.001, F (2, 6160) = 2.26, p = .104. Overall, the analyses suggest that neither family background, child temperament, nor 24-month memory and EF provided meaningful prediction of 36-month language expression.
Across both outcomes, the hierarchical regression analyses yielded a consistent pattern. Family-related control variables (Step 1) explained virtually no variance in children’s 36-month language comprehension or expression. Adding child characteristics (Step 2) likewise contributed negligibly, with less than 0.1% of additional variance explained. Finally, the inclusion of 24-month memory and executive function (Step 3) accounted for only 0.1% of additional variance, and none of the effects reached statistical significance. Taken together, these results suggest that early family background, child temperament, and 24-month cognitive predictors (memory and EF) did not provide meaningful prediction of either receptive or expressive language outcomes at 36 months.
5. Discussion
5.1. Main Findings
This study examined whether young children’s memory and executive function (EF), as behavioral proxies of early neurocognitive development, predicted subsequent language outcomes in a large, nationally representative cohort. Results indicated that both memory and EF at 12 months significantly and independently predicted language comprehension and expression at 24 months, with memory emerging as the stronger predictor. These associations remained robust even after controlling for parental education, involvement, responsiveness, and child temperament, highlighting the unique contribution of early cognitive processes to language acquisition. By contrast, memory and EF at 24 months did not significantly predict comprehension or expression at 36 months, suggesting that predictive associations may be limited to earlier developmental windows.
5.2. Neural Interpretation
The strong predictive power of 12-month cognition for 24-month language outcomes aligns with developmental neuroscience accounts. Memory behaviors, such as recognition and recall, likely reflect hippocampal-supported processes of binding and retrieval, which are already functional in the first year of life (Ellis et al., 2020). Similarly, EF behaviors, including inhibitory control and sustained attention, map onto rapid prefrontal maturation during infancy (Hodel, 2018). Neuroimaging evidence using near-infrared spectroscopy further supports this interpretation, showing that visuospatial working memory tasks elicit prefrontal cortex activation in young children, with developmental changes in lateralization across ages (Moriguchi & Hiraki, 2013). These early hippocampal- and prefrontal-supported processes provide the neural scaffolding for forming, consolidating, and using linguistic representations, thereby facilitating comprehension and expression in toddlerhood (Selmeczy & Ghetti, 2025; Diamond, 2013). Consistent with this view, Moriguchi and Hiraki (2013) demonstrated that preschoolers show prefrontal activation while performing visuospatial working memory tasks. Because working memory is a core component of EF, these findings reinforce the interpretation of EF behaviors as valid proxies of prefrontal development, in parallel to hippocampal-dependent recognition and recall tasks serving as proxies of memory system maturation.
The lack of robust associations from 24 to 36 months may reflect several factors. First, developmental timing could play a role, as the first two years represent a sensitive window in which hippocampal binding and prefrontal-supported EF most directly support language acquisition. By the third year, accumulated environmental input—including parental responsiveness, conversational turns, and broader socialization—may play a more prominent role than early cognition (Hoff, 2006, Rowe, 2012). Second, task characteristics may have contributed; the language measures at 36 months demonstrated high internal consistency but may have approached ceiling effects, limiting sensitivity to individual differences. Finally, the accumulation of contextual influences, such as preschool enrollment and peer interactions, may overshadow earlier cognitive predictors during this later period.
This pattern is consistent with developmental accounts suggesting that hippocampal and prefrontal contributions are most salient during infancy and toddlerhood (Hodel, 2018; Selmeczy & Ghetti, 2019). By the preschool years, environmental inputs such as parental responsiveness and conversational turns (Rowe, 2012; Levickis et al., 2023) and enriched childcare contexts (Vernon-Feagans et al., 2013) may exert stronger influence, potentially overshadowing earlier cognitive predictors. Moreover, as language measures approach ceiling levels by 36 months (Walton et al., 2018), the reduced variance further attenuates detectable associations.
5.3. Temperament Findings
Analyses revealed that temperament dimensions at 12 months showed meaningful associations with children’s language skills at 24 months. Specifically, higher surgency and effortful control significantly predicted both comprehension and expression, even after accounting for parental education, involvement, and responsiveness. These findings are consistent with prior work indicating that sociability and positive affectivity facilitate conversational engagement and expressive vocabulary growth (Ishikawa-Omori et al., 2022; Kucker et al., 2021), while self-regulation enables children to sustain attention and capitalize on linguistic input (Bohlmann et al., 2015; Balázs et al., 2024). In contrast, negative affectivity was not associated with language outcomes, diverging from some studies documenting detrimental effects (Davison et al., 2019). One possibility is that cultural caregiving practices in Taiwanese families, which often emphasize soothing and responsiveness, may buffer the impact of negative affectivity on language opportunities. Another explanation is developmental: affective traits at 12 months may not yet have consolidated into stable patterns that substantially interfere with linguistic engagement.
Strikingly, temperament measured at 24 months failed to predict comprehension or expression at 36 months. This null finding may reflect developmental timing. The transition from infancy to toddlerhood represents a sensitive window in which dispositions such as sociability and attentional control can strongly influence the frequency and quality of language-rich interactions. By the preschool years, however, language growth is increasingly driven by cumulative exposure and contextual supports, reducing the relative contribution of temperament. Measurement considerations may also play a role. Mean scores on the 36-month language scales were relatively high, suggesting possible ceiling effects that restricted variance and attenuated associations with predictors. Finally, contextual factors specific to the Taiwanese setting may have contributed: many children begin participating in structured childcare or preschool around age three, where enriched language environments could mitigate temperament-related differences observed earlier.
Taken together, these results suggest that temperament functions as an early catalyst for language acquisition, particularly in the transition from infancy to toddlerhood. Positive dispositions such as surgency and effortful control appear to facilitate children’s entry into language-rich exchanges, but these effects may not persist once core linguistic skills are established and external environments become more uniformly stimulating. Future research could investigate whether temperament exerts more sustained effects on higher-level language or literacy outcomes beyond the preschool years, and whether cultural or contextual differences moderate these developmental trajectories.
5.4. Contribution
Despite these nuances, the findings provide population-level evidence that early memory and EF can serve as behavioral markers of neurocognitive maturation, with predictive utility for language outcomes during a critical window of development. By bridging small-sample neuroimaging findings with large-scale longitudinal data, the study supports the use of behavioral proxies to infer underlying neural processes and underscores the value of identifying early cognitive markers for developmental screening and intervention. Importantly, this study employed parent-reported ratings of children’s observable everyday behaviors, providing a low-cost, widely applicable, and ecologically valid indicator of children’s real-world cognitive functioning.
For early childhood education and intervention practice, these findings highlight the importance of attending to behaviors that reflect memory and EF—such as a child’s ability to recall familiar routines, sustain attention during play, or inhibit a prohibited action—as early indicators of language trajectories. Such behaviors can often be observed in naturalistic classroom and home settings, making them accessible markers for teachers and caregivers without the need for specialized testing. Identifying children who show early difficulties in memory or EF may help practitioners anticipate later language delays and tailor support at an earlier stage.
These observable behaviors may also inform the design of play-based learning activities that simultaneously foster cognitive and language skills. In addition, observable memory and EF behaviors provide a concrete framework for communicating with parents about the broader cognitive underpinnings of language growth.
Moreover, incorporating cognitive markers into developmental screening protocols could enhance current practices, which often emphasize language milestones alone. For example, assessing both EF and memory in infancy and toddlerhood may allow educators and clinicians to design more holistic intervention strategies that strengthen foundational cognitive processes alongside language input. This integrated approach has the potential to improve outcomes for children at risk of language delays, particularly in contexts where resources for direct neural assessment are not available. Embedding such cognitive markers into early education and intervention systems may also promote greater alignment between educational and clinical practices, ensuring that children’s developmental needs are addressed in a more comprehensive and coordinated manner.
5.4. Limitations
Several limitations should be noted. First, the measures of memory, EF, and language were based on brief caregiver-reported items. Although reliability was acceptable, more fine-grained and performance-based tasks could provide greater sensitivity to individual differences. Second, the study did not incorporate direct neural indicators such as neuroimaging, which limits the ability to confirm the proposed hippocampal and prefrontal contributions. Third, although the analytic models included key covariates, other unmeasured environmental influences (e.g., preschool quality, peer interactions) may also shape language trajectories.
Limitations Related to Attrition
Although attrition across the KIT waves was modest (<4%), analyses indicated that families who discontinued participation differed systematically from those who remained in the study, particularly on parental background factors such as responsiveness, father involvement, and parental education (see Appendix B; full results in Supplementary Attrition Analysis Results). In contrast, no differences were observed on child-level variables, including temperament, cognition, and language. This pattern suggests that selective attrition may have introduced bias with respect to family-level influences, potentially underestimating or overestimating the role of parental characteristics in children’s development. While the large sample size and consistency of results across analytic models mitigate some of these concerns, caution is warranted when generalizing findings to populations with different distributions of parental resources. Future studies may benefit from applying weighting strategies, multiple imputation, or sensitivity analyses to further address the possibility of attrition-related bias.
5.5. Future Directions
Future investigations could extend this work in several ways. First, integrating large-scale longitudinal datasets with targeted neuroimaging subsamples would enable researchers to connect population-level behavioral patterns with neural mechanisms identified in smaller-scale studies. This approach can help clarify how hippocampal- and prefrontal-supported processes, well established in developmental neuroscience, manifest across diverse populations. Second, refining behavioral assessments with age-appropriate and performance-based tasks would increase sensitivity to developmental change. Third, future studies may explore potential mediators and moderators—such as caregiver responsiveness, bilingual exposure, and child temperament—to illuminate pathways through which early cognition shapes language. Finally, extending longitudinal follow-up into the preschool and school years would clarify whether early cognitive proxies exert long-term effects on language development or whether environmental influences increasingly dominate as children grow older.
Acknowledgments
During the preparation of this manuscript, the authors used ChatGPT-5 and Grammarly for the purpose of assisting with sentence suggestions, grammar correction, language editing, and text revision. The authors have reviewed and edited the output and take full responsibility for the final content of this publication.
Abbreviations
The following abbreviations are used in the present study:
| KIT | Kids in Taiwan: National Longitudinal Study of Child Development & Care |
| EF | Executive Function |
| ME | memory |
| LC | language comprehension |
| LE | language expression |
| 12m | 12 months of age |
| 24m | 24 months of age |
| 36m | 36 months of age |
Appendix A. Summary of Study Variables and Measures
Appendix A.1
| Construct | Example Item(s) | Reliability (Cronbach’s α) |
| Maternal/Paternal Involvement |
|
α = .81 |
| Parental Responsiveness |
|
α = 0.52~0.58 |
| Surgency |
|
α = 0.60~0.63 |
| Effortful Control |
|
α = 0.63~0.85 |
| Negative Affectivity |
|
α = 0.60~0.68 |
| Memory |
|
α = 0.95 |
| Executive Function |
|
α = 0.95 |
| Language Comprehension |
|
α = 0.61~0.73 |
| Language Expression |
|
α = 0.75~0.82 |
Note.
1. Language and cognitive abilities were rated on a 4-point Likert-type scale (Response Scale: 1 = Not at all able; 2 = Occasionally able; 3 = Fairly proficient; 4 = Highly proficient). To ensure developmental appropriateness, different items were used at 12–24 months and 36 months. Criterion-related validity was examined in relation to the Comprehensive Developmental Inventory for Infants and Toddlers (CDIIT; Wang, 2004).
(1) For language development:
- 12–24 months: Language comprehension (r = .73); Language expression (r = .82).
- 36 months: Language comprehension (r = .61); Language expression (r = .75).
(2) For cognitive development, criterion-related validity was examined in relation to the CDIIT Cognitive Concept scale (Wang, 2004). The total cognitive score at 36 months was significantly correlated with the CDIIT Cognitive Concept score (r = .63), and the total cognitive score at 12–24 months showed a significant correlation of r = .41.
- Wang, T.-M. (2004). Comprehensive Developmental Inventory for Infants and Toddlers: Manual (Revised ed.) [嬰幼兒綜合發展測驗指導手冊(修訂版), Department of Special Education, National Taiwan Normal University.
2. Temperament variables were assessed with parent ratings of surgency, effortful control, and negative affectivity, rated on a 5-point Likert-type scale based on parents’ observations of their child’s typical behaviors, ranging from 1 (Never – the child has never shown the behavior) to 5 (Always – the child consistently shows the behavior). 1 = Never – The child has never exhibited the behavior. 2 = Rarely – The child shows the behavior only once or twice on rare occasions. 3 = Sometimes – The child shows the behavior inconsistently; sometimes yes, sometimes no. = Often – The child shows the behavior frequently. 5 = Always – The child consistently shows the behavior.
Cronbach’s α coefficients for temperament subscales were as follows:
12–24 months: Surgency/Extraversion (α = .60), Effortful Control (α = .85), Negative Affectivity (α = .68); 36 months: Surgency/Extraversion (α = .66), Effortful Control (α = .63), Negative Affectivity (α = .60).
3. Parental background variables included education level, involvement in child-rearing, and parental responsiveness.
- (1) Parental education level was coded on a 6-point ordinal scale: 1 = Elementary school or below, 2 = Junior high school, 3 = Senior high school or vocational school, 4 = Junior college, 5 = University or technical college, 6 = Master’s degree or above. For analysis, the variable was treated as continuous, and descriptive statistics are reported as means and standard deviations.
- (2) Family-related caregiving variables included Parental Involvement and Parental Responsiveness, both assessed over the past three months using a 4-point Likert-type frequency scale. Parental Involvement was rated separately for fathers and mothers, based on their participation in children’s daily caregiving activities. Parental Responsiveness was rated as a combined measure of parents’ verbal and emotional responses to the child, with items such as “I respond verbally when my child makes sounds or speaks,” “I kiss or hug my child,” and “I talk with my child while doing chores.” Response options for both constructs were: 1 = Rarely (never or less than once per week on average), 2 = Sometimes (1–2 times per week), 3 = Often (3–4 times per week), 4 = Very often (5–7 times per week). For Parental Involvement and Responsiveness, if the child did not have a father or mother, respondents selected “Not applicable” for the related items.
Appendix B. Supplementary Attrition Analysis Results
Appendix B.1
Comparison of retained and attrited participants on family background, child temperament, and cognition/language variables. Values are presented as means (standard deviations) for continuous variables and percentages for categorical variables.

Table A1.
Comparison of Retained and Attrited Participants from 12 to 24 months.
| Variable | Retained M (SD)/% | Attrited M (SD)/% |
t(df) / χ²(df) | p-value | Effect size |
|---|---|---|---|---|---|
| Paternal education (years) | 4.45 (1.18) | 4.23 (1.33) | t(304) = 2.72 | < .001 | d = 0.17 |
| Maternal education (years) | 4.47 (1.08) | 4.18 (1.28) | t(309) = 3.73 | < .001 | d = 0.24 |
| Paternal involvement | 3.09 (0.82) | 2.95 (0.82) | t(6725) = 1.88 | .060 | d = 0.17 |
| Maternal involvement | 3.79 (0.44) | 3.75 (0.50) | t(364) = 1.51 | .133 | d = 0.08 |
| Parental responsiveness | 3.70 (0.48) | 3.59 (0.57) | t(373) = 3.47 | .001 | d = 0.21 |
| Child sex (male, %) | 51.20 % | 51.10% | χ²(1) = 0.003 | .960 | φ = 0.02 |
| Surgency | 3.27 (0.92) | 3.10 (0.95) | t(6866) = 3.37 | .001 | d = 0.18 |
| Effortful control | 2.73 (0.74) | 2.67 (0.75) | t(6871) = 1.41 | .160 | d = 0.08 |
| Negative affectivity | 3.58 (0.82 | 3.52 (0.82) | t(6872) = 1.32 | .186 | d = -0.07 |
| Memory | 2.44 (0.31) | 2.44 (0.34) | t(6870) = 0.13 | .897 | d = 0.00 |
| Executive function | 2.40 (0.42) | 2.45 (0.49) | t(374) = 2.30 | .021 | d = -0.11 |
| Language comprehension | 2.53 (0.77) | 2.62 (0.81) | t(379) = 1.96 | .050 | d = -0.11 |
| Language expression | 1.05 (0.16) | 1.07 (0.17) | t(379) = 1.77 | .077 | d = -0.12 |
- Note. Values are presented as means (standard deviations) for continuous variables and as percentages for categorical variables (e.g., child sex). Independent-samples t-tests were used for continuous variables; when Levene’s test indicated unequal variances, Welch’s adjusted degrees of freedom are reported. Effect sizes for continuous variables are expressed as Cohen’s d (0.2 = small, 0.5 = medium, 0.8 = large). For categorical variables, chi-square tests were used, with Cramer’s V reported as the effect size (0.1 = small, 0.3 = medium, 0.5 = large). Positive d values indicate higher means in the retained group.
- The effect sizes of the differences between the retained and attrited groups were generally small. Across all variables, Cohen’s d values ranged from –0.12 to 0.24, with the majority falling below 0.20. According to conventional benchmarks (Cohen, 1988), values of d ≈ 0.20 represent small effects, d ≈ 0.50 represent medium effects, and d ≈ 0.80 represent large effects. In the present analyses, most effects were negligible to small, indicating that attrition was unlikely to bias the results in a meaningful way. For the categorical variable, the effect size was φ = 0.02, which also falls within the small range (Cohen, 1988).
- Cohen, J. (1988). Statistical power analysis for the behavioral sciences (2nd ed.). Hillsdale, NJ: Lawrence Erlbaum Associates.
Table A2.
Comparison of Retained and Attrited Participants from 24 to 36 Months.
| Variable | Retained M (SD) | Attrited M (SD) | t(df) / χ²(df) | p | Effect size |
|---|---|---|---|---|---|
| Paternal education (years) | 4.46 (1.17) | 4.28 (1.30) | t(296) = 3.41 | 0.001 | d = 0.15 |
| Maternal education (years) | 4.48 (1.10) | 4.31 (1.26) | t(303) = 3.68 | < .001 | d = 0.15 |
| Paternal involvement | 3.12 (0.81) | 3.07 (0.84) | t(292) = 3.42 | 0.001 | d = 0.06 |
| Maternal involvement | 3.81 (0.43) | 3.80 (0.49) | t(300) = 1.49 | 0.137 | d = 0.04 |
| Parental responsiveness | 3.71 (0.48) | 3.70 (0.49) | t(305) = 3.47 | 0.001 | d = 0.08 |
| Child sex (male %) | 51.10% | 51.20% | χ²(1) = 0.003 | .960 | φ = 0.02 |
| Surgency | 3.88 (0.71) | 3.85 (0.69) | t(6769) = 0.69 | 0.487 | d = 0.04 |
| Effortful control | 3.67 (0.70) | 3.65 (0.70) | t(6770) = 0.55 | 0.582 | d = 0.03 |
| Negative affectivity | 3.51 (0.86) | 3.60 (0.75) | t(316) = -1.97 | 0.050 | d = -0.11 |
| Cognitive memory | 3.21 (0.35) | 3.18 (0.39) | t(304) = 1.30 | 0.194 | d = 0.09 |
| Cognitive EF | 3.38 (0.44) | 3.38 (0.47) | t(305) = -0.74 | 0.459 | d = 0.05 |
| Language comprehension | 3.72 (0.45) | 3.72 (0.46) | t(6771) = -0.20 | 0.839 | d = -0.01 |
| Language expression | 2.70 (0.86) | 2.72 (0.95) | t(303) = -0.42 | 0.672 | d = -0.03 |
Note. Values are presented as means (standard deviations) for continuous variables and as percentages for categorical variables (e.g., child sex). Independent-samples t-tests were used for continuous variables; when Levene’s test indicated unequal variances, Welch’s adjusted degrees of freedom are reported. Effect sizes for continuous variables are expressed as Cohen’s d (0.2 = small, 0.5 = medium, 0.8 = large). For categorical variables, chi-square tests were used, with Cramer’s V reported as the effect size (0.1 = small, 0.3 = medium, 0.5 = large). Positive d values indicate higher means in the retained group. The effect sizes of the differences between the retained and attrited groups were generally small. Across all variables, Cohen’s d values ranged from –0.11 to 0.15, with the majority falling below 0.20. According to conventional benchmarks (Cohen, 1988), values of d ≈ 0.20 represent small effects, d ≈ 0.50 represent medium effects, and d ≈ 0.80 represent large effects. In the present analyses, most effects were negligible to small, indicating that attrition was unlikely to bias the results in a meaningful way. For the categorical variable, the effect size was φ =0.02, which also falls within the small range (Cohen, 1988). Cohen, J. (1988). Statistical power analysis for the behavioral sciences (2nd ed.). Hillsdale, NJ: Lawrence Erlbaum Associates.
References
- Adams, A. M., Bourke, L., & Willis, C. (1999). Working memory and spoken language comprehension in young children. International Journal of Psychology, 34, 364-373. [CrossRef]
- Alamos, P., Turnbull, K. L. P., Williford, A. P., & Downer, J. T. (2025). The joint development of self-regulation and expressive language in preschool classrooms: Preliminary evidence from a low-income sample. Journal of Applied Developmental Psychology, 97, 101763. [CrossRef]
- Alfonso, S. V., & Lonigan, C. J. (2021). Executive function, language dominance, and literacy skills in Spanish-speaking language-minority children: A longitudinal study. Early Childhood Research Quarterly. 57, 228-238. [CrossRef]
- Balázs, A., Lakatos, K., Harmati-Pap, V., Tóth, I., & Kas, B. (2024). The influence of temperament and perinatal factors on language development: A longitudinal study. Frontiers in psychology, 15, 1375353. [CrossRef]
- Bohlmann, N. L., Maier, M. F., & Palacios, N. (2015). Bidirectionality in self-regulation and expressive vocabulary: Comparisons between monolingual and dual language learners in preschool. Child Development, 86(4), 1094-1111. [CrossRef]
- Chang, C.-J. (2024). Kids in Taiwan: National Longitudinal Study of Child Development and Care (KIT): KIT-M3 at 3 months old (D00180) [Data file]. Survey Research Data Archive, Academia Sinica. [CrossRef]
- Catani, M., & Mesulam, M. (2008). The arcuate fasciculus and the disconnection theme in language and aphasia: History and current state. Cortex, 44(8), 953-961. [CrossRef]
- Cioffi, C. C., Griffin, A. M., Natsuaki, M. N., Shaw, D. S., Reiss, D., Ganiban, J. M., Neiderhiser, J. M., & Leve, L. D. (2021). The role of negative emotionality in the development of child executive function and language abilities from toddlerhood to first grade: An adoption study. Developmental psychology, 57(3), 347-360. [CrossRef]
- Diamond, A. (2013). Executive functions. Annual review of psychology, 64, 135-168. [CrossRef]
- Dixon, W. E., Jr., & Smith, P. H. (2000). Links between early temperament and language acquisition. Merrill-Palmer Quarterly, 46(3), 417-440.
- Dubner, S. E., Rose, J., Bruckert, L., Feldman, H. M., & Travis, K. E. (2020). Neonatal white matter tract microstructure and 2-year language outcomes after preterm birth. Neuroimage Clinical, 28, 102446. [CrossRef]
- Ellis, C. T., Skalaban, L. J., Yates, T. S., Bejjanki, R., Córdova, N. I., Turk-Browne, N. B. (2020). Re-imagining fMRI for awake behaving infants. Nat Commun, 11, 4523. [CrossRef]
- Filipe, M. G., Veloso, A. S., & Frota, S. (2023). Executive functions and language skills in preschool children: The unique contribution of verbal working memory and cognitive flexibility. Brain Sci, 13(3), 470. [CrossRef]
- Hodel, A. S. (2018). Rapid infant prefrontal cortex development and sensitivity to early environmental experience. Developmental Review, 48, 113-144. [CrossRef]
- Hoff, E. (2006). How social contexts support and shape language development. Developmental Review, 26(1), 55-88. [CrossRef]
- Huber, E., Corrigan, N. M., Yarnykh, V. L., Ferjan Ramírez, N., & Kuhl, P. K. (2023). Language experience during infancy predicts white matter myelination at age 2 years. The Journal of Neuroscience, 43(9), 1590-1599. [CrossRef]
- Ishikawa-Omori, Y., Nishimura, T., Nakagawa, A., Okumura, A., Harada, T., Nakayasu, C., Iwabuchi, T., Amma, Y., Suzuki, H., Rahman, M. S., Nakahara, R., Takahashi, N., Nomura, Y., & Tsuchiya, K. J. (2022). Early temperament as a predictor of language skills at 40 months. BMC pediatrics, 22(1), 56. [CrossRef]
- Kubicek, L. F., & Emde, R. N. (2012). Emotional expression and language: A longitudinal study of typically developing earlier and later talkers from 15 to 30 months. Infant mental health journal, 33(6), 553-584. [CrossRef]
- Kucker, S. C., Zimmerman, C., & Chmielewski, M. (2021). Taking parent personality and child temperament into account in child language development. British journal of developmental psychology, 39(4), 540-565. [CrossRef]
- Kulkofsky, S., & Klemfuss, J. Z. (2008). What the stories children tell can tell about their memory: Narrative skill and young children's suggestibility. Developmental Psychology, 44(5), 1442-1456. [CrossRef]
- Levickis, P., Eadie, P., Mensah, F., McKean, C., Bavin, E. L., & Reilly, S. (2023). Associations between responsive parental behaviours in infancy and toddlerhood, and language outcomes at age 7 years in a population-based sample. International journal of language & communication disorders, 58(4), 1098-1112. [CrossRef]
- Mohades, S. G., Van Schuerbeek, P., Rosseel, Y., Van De Craen, P., Luypaert, R., & Baeken, C. (2015). White-matter development is different in bilingual and monolingual children: A longitudinal DTI study. PLoS One, 10(2), e0117968. [CrossRef]
- NICHD Early Child Care Research Network. (2002). Child-care structure-->process-->outcome: Direct and indirect effects of child-care quality on young children's development. (2002). Psychological Science, 13(3), 199-206. [CrossRef]
- Riggins, T. (2014). Longitudinal investigation of source memory reveals different developmental trajectories for item memory and binding. Developmental Psychology, 50(2), 449-459. [CrossRef]
- Rothbart, M. K., & Bates, J. E. (2006). Temperament. In N. Eisenberg, W. Damon, & R. M. Lerner (Eds.), Handbook of child psychology: Vol. 3. Social, emotional, and personality development (6th ed., pp. 99–166). John Wiley & Sons.
- Rowe, M. L. (2012). A longitudinal investigation of the role of quantity and quality of child-directed speech in vocabulary development. Child development, 83(5), 1762-1774. [CrossRef]
- Selmeczy, D., Fandakova, Y., Grimm, K. J., Bunge, S. A., & Ghetti, S. (2019). Longitudinal trajectories of hippocampal and prefrontal contributions to episodic retrieval: Effects of age and puberty. Developmental cognitive neuroscience, 36, 100599. [CrossRef]
- Selmeczy, D., & Ghetti, S. (2025). Development of episodic memory. In Encyclopedia of the human brain (2nd ed., pp. 236–249). Reference Module in Neuroscience and Biobehavioral Psychology.
- Strasser, K., & Río, F. D. (2014). The role of comprehension monitoring, theory of mind, and vocabulary depth in predicting story comprehension and recall of kindergarten children. Reading Research Quarterly, 49(2), 169-187. [CrossRef]
- Vernon-Feagans, L., Bratsch-Hines, M. E., & The family life project key investigators. (2013). Caregiver-Child Verbal Interactions in Child Care: A Buffer against Poor Language Outcomes when Maternal Language Input is Less. Early childhood research quarterly, 28(4), 858-873. [CrossRef]
- Walton, M., Dewey, D., & Lebel, C. (2018). Brain white matter structure and language ability in preschool-aged children. Brain and Language, 176, 19-25. [CrossRef]
- Zuk, J., Yu, X., Sanfilippo, J., Figuccio, M. J., Dunstan, J., Carruthers, C., ... & Gaab, N. (2021). White matter in infancy is prospectively associated with language outcomes in kindergarten. Developmental Cognitive Neuroscience, 50, 100973. [CrossRef]
Figure 1.
Conceptual framework illustrating infant memory (hippocampal proxy) and executive function (prefrontal proxy) as predictors of language comprehension and expression.
Figure 1.
Conceptual framework illustrating infant memory (hippocampal proxy) and executive function (prefrontal proxy) as predictors of language comprehension and expression.
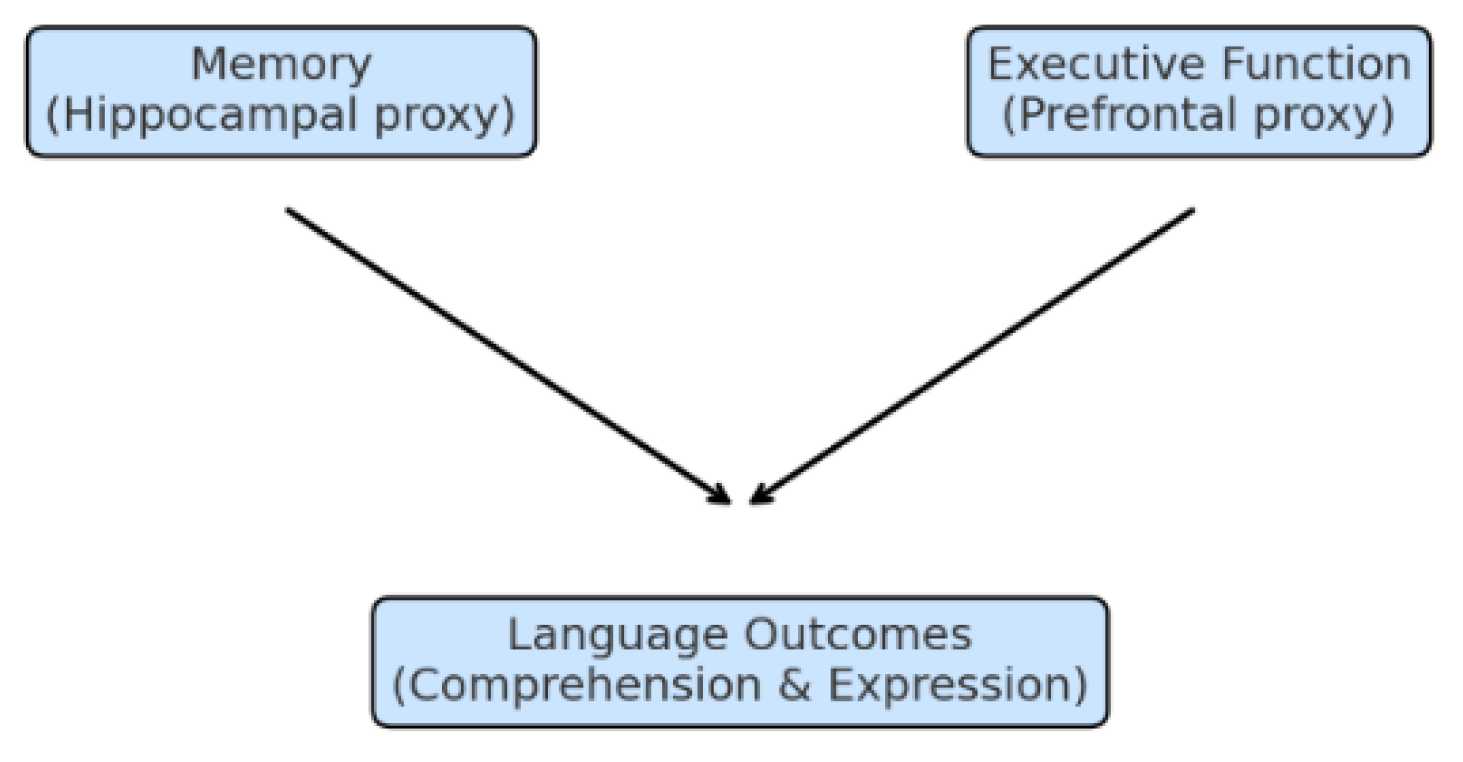
Table 1.
Sample characteristics for children at 24 and 36 months from the Kids in Taiwan (KIT) cohort.
Table 1.
Sample characteristics for children at 24 and 36 months from the Kids in Taiwan (KIT) cohort.
| Variable | N | M | SD |
|---|---|---|---|
| 36m Memory | 6409 | 2.66 | .53 |
| 36m Executive Function | 6409 | 2.87 | .64 |
| 36m Language Comprehension | 6408 | 3.28 | .47 |
| 36m Language Expression | 6408 | 3.39 | .64 |
| Note. Values are percentages unless otherwise noted. Means (M) and standard deviations (SD) are reported for continuous variables (parental involvement, parental responsiveness, and child. | |||
Table 2.
Demographic characteristics of participants at 36 months.
| Variable | Label | Frequency | Percentage (%) |
|---|---|---|---|
| Gender | Male | 3411 | 51.30 |
| Female | 3241 | 48.70 | |
| Paternal education level | Senior high school or below | 1821 | 28.40 |
| Junior college | 682 | 10.60 | |
| College/University | 2679 | 41.80 | |
| Master's degree or above | 1228 | 19.20 | |
| Maternal education level | Senior high school or below | 1595 | 24.70 |
| Junior college | 711 | 11.00 | |
| College/University | 3360 | 51.90 | |
| Master's degree or above | 809 | 12.50 | |
| Note. N = 6,652. |
Table 3.
Means, Standard Deviations, Ranges, and Correlations of Study Variables.
| Construct | Range | M | SD | ME12 | EF12 | LC12 | LE 12 | ME24 | EF24 | LC24 | LE 24 | ME36 | EF36 | LC36 | |
|---|---|---|---|---|---|---|---|---|---|---|---|---|---|---|---|
| ME12 | 1 - 4 | 2.44 | 0.31 | ||||||||||||
| EF12 | 1 - 4 | 2.40 | 0.42 | .531*** | |||||||||||
| LC12 | 1 - 4 | 2.53 | 0.76 | .547*** | .432*** | ||||||||||
| LE12 | 1 - 4 | 1.05 | 0.16 | .210*** | .233*** | .241** | |||||||||
| ME24 | 1 - 4 | 3.21 | 0.35 | .405*** | .305*** | .322*** | .154*** | ||||||||
| EF24 | 1 - 4 | 3.36 | 0.44 | .337*** | .343*** | .273*** | .103*** | .512*** | |||||||
| LC24 | 1 - 4 | 3.72 | 0.45 | .357*** | .260*** | .331*** | .105*** | .507*** | .445*** | ||||||
| LE 24 | 1 - 4 | 2.70 | 0.86 | .343*** | .263*** | .315*** | .154*** | .690*** | .410*** | .517*** | |||||
| ME36 | 1 - 4 | 3.28 | 0.47 | .025* | .001 | -.002 | -.003 | -.008 | -.004 | -.037* | -.028* | ||||
| EF36 | 1 - 4 | 3.40 | 0.64 | .256*** | .249*** | .200*** | .112*** | .339*** | .447*** | .266*** | .288*** | .012 | |||
| LC36 | 1 - 4 | 2.66 | 0.53 | -.008 | .021 | .018 | -.005 | -.014 | -.010 | .011 | -.013 | .054*** | .000 | ||
| LE 36 | 1 - 4 | 2.87 | 0.64 | -.002 | .025* | .023 | .012 | -.016 | -.003 | .011 | -.009 | -.001 | .006 | .757** | |
| Note. N = 6,652. ME = memory; EF = executive function; LC = language comprehension; LE = language expression. *p < .05. ***p < .001. | |||||||||||||||
Table 4.
Hierarchical regression results for predicting language comprehension at 24 months.
| Variable | B | 95% CI for B LL UL |
SE B | β | R² | ΔR² |
| Step 1 | .053 | .053*** | ||||
| Constant | 2.748 | 2.623 2.873 | .064 | |||
| Paternal education (12m) | .014 | .002 .026 | .006 | .038* | ||
| Maternal education (12m) | .024 | .010 .038 | .007 | .058*** | ||
| Paternal involvement (12m) | .034 | .018 .050 | .008 | .061*** | ||
| Maternal involvement (12m) | .033 | .004 .062 | .015 | .031* | ||
| Parental responsiveness (12m) | .155 | .130 .180 | .013 | .164*** | ||
| Step 2 | .102 | .049*** | ||||
| Constant | 2.491 | 2.358 2.624 | .068 | |||
| Paternal education (12m) | .013 | .001 .025 | .006 | .033* | ||
| Maternal education (12m) | .022 | .010 .034 | .006 | .053** | ||
| Paternal involvement (12m) | .022 | .008 .036 | .007 | .041** | ||
| Maternal involvement (12m) | .023 | -.004 .050 | .014 | .022 | ||
| Parental responsiveness (12m) | .104 | .079 .129 | .013 | .110*** | ||
| Child gender | .147 | .125 .169 | .011 | .053*** | ||
| Surgency (12m) | .051 | .037 .065 | .007 | .105*** | ||
| Effortful control (12m) | .092 | .074 .110 | .009 | .152*** | ||
| Negative affectivity (12m) | .013 | -.001 .027 | .007 | .024 | ||
| Step 3 | .158 | .056*** | ||||
| Constant | 1.947 | 1.808 2.086 | .071 | |||
| Paternal education (12m) | .012 | -.000 .024 | .006 | .032* | ||
| Maternal education (12m) | .020 | .008 .032 | .006 | .047** | ||
| Paternal involvement (12m) | .016 | .002 .030 | .007 | .030* | ||
| Maternal involvement (12m) | .014 | -.013 .041 | .014 | .013 | ||
| Parental responsiveness (12m) | .066 | .041 .091 | .013 | .069*** | ||
| Child gender | .031 | .009 .053 | .011 | .035** | ||
| Surgency (12m) | .022 | .008 .036 | .007 | .044** | ||
| Effortful control (12m) | .040 | .020 .060 | .010 | .066*** | ||
| Negative affectivity (12m) | .008 | -.006 .022 | .007 | .014 | ||
| Memory (12m) | .375 | .330 .420 | .023 | .255*** | ||
| Executive function (12m) | .047 | .014 .080 | .017 | .044** |
Note. CI = confidence interval; LL = lower limit; UL = upper limit. *p < .05. **p < .01. ***p < .001.
Table 5.
Hierarchical regression analyses predicting expressive language at 24 months.
| Variable | B | 95% CI for B | SE B | β | R² | ΔR² |
|---|---|---|---|---|---|---|
| LL UL | ||||||
| Step 1 | .082 | .082*** | ||||
| Constant | .558 | .319 .797 | .122 | |||
| Paternal education (12m) | .074 | .050 .098 | .012 | .101*** | ||
| Maternal education (12m) | .076 | .051 .101 | .013 | .095*** | ||
| Paternal involvement (12m) | .107 | .080 .134 | .014 | .101*** | ||
| Maternal involvement (12m) | .045 | -.010 .100 | .028 | .022 | ||
| Parental responsiveness (12m) | .262 | .213 .311 | .025 | .144*** | ||
| Step 2 | .155 | .073*** | ||||
| Constant | -.178 | -.427 .071 | .127 | |||
| Paternal education (12m) | .069 | .047 .091 | .011 | .094*** | ||
| Maternal education (12m) | .071 | .047 .095 | .012 | .089*** | ||
| Paternal involvement (12m) | .086 | .059 .113 | .014 | .081*** | ||
| Maternal involvement (12m) | .028 | -.025 .081 | .027 | .014 | ||
| Parental responsiveness (12m) | .163 | .114 .212 | .025 | .089*** | ||
| Child gender | .292 | .251 .333 | .021 | .169*** | ||
| Surgency (12m) | .106 | .081 .131 | .013 | .112*** | ||
| Effortful control (12m) | .164 | .133 .195 | .016 | .140*** | ||
| Negative affectivity (12m) | .012 | -.013 .037 | .013 | .012 | ||
| Step 3 | .197 | .042*** | ||||
| Constant | -1.093 | -1.35 -.828 | .135 | |||
| Paternal education (12m) | .069 | .047 .091 | .011 | .094*** | ||
| Maternal education (12m) | .067 | .043 .091 | .012 | .084*** | ||
| Paternal involvement (12m) | .076 | .049 .103 | .014 | .072*** | ||
| Maternal involvement (12m) | .014 | -.037 .065 | .026 | .007 | ||
| Parental responsiveness (12m) | .098 | .049 .147 | .025 | .054*** | ||
| Child gender | .266 | .225 .307 | .021 | .154*** | ||
| Surgency (12m) | .058 | .033 .083 | .013 | .061*** | ||
| Effortful control (12m) | .070 | .035 .105 | .018 | .060*** | ||
| Negative affectivity (12m) | .004 | -.021 .029 | .013 | .004 | ||
| Memory (12m) | .597 | .513 .681 | .043 | .210*** | ||
| Executive function (12m) | .117 | .054 .180 | .032 | .057*** |
Note. CI = confidence interval; LL = lower limit; UL = upper limit. *p < .05. **p < .01. ***p < .001.
Disclaimer/Publisher’s Note: The statements, opinions and data contained in all publications are solely those of the individual author(s) and contributor(s) and not of MDPI and/or the editor(s). MDPI and/or the editor(s) disclaim responsibility for any injury to people or property resulting from any ideas, methods, instructions or products referred to in the content. |
© 2025 by the authors. Licensee MDPI, Basel, Switzerland. This article is an open access article distributed under the terms and conditions of the Creative Commons Attribution (CC BY) license (http://creativecommons.org/licenses/by/4.0/).
Copyright: This open access article is published under a Creative Commons CC BY 4.0 license, which permit the free download, distribution, and reuse, provided that the author and preprint are cited in any reuse.


