
Submitted:
01 October 2025
Posted:
02 October 2025
You are already at the latest version
Abstract
During the southern hemisphere summer-season, Mozambique faces an array of agroclimatic hazards, the most prominent being the precipitation pattern highly variable. With ongoing climate change, the pattern of precipitation around the world is projected to be affect but, there are few studies about how this changes will impact the sub-regional and/or local scale. Throughout Mozambique, little more than 70% of the households has agricultural as its main income to livelihood, being rainfed the prevailing water management among the farming fields. Early warning about the onset dates of the rainy season is very useful for planning the timely preparation of farmlands and for reducing the risks involved in planting too early or too late. The present study aims to investigate the changes in onset and end of the rainy season, under two Representative Concentrations Pathways, RCP4.5 and RCP8.5, relatively to current climate over Mozambique. To reach this goal and establish the possible forward or backward shift, the pentad method was applied for daily mean precipitation dataset simulated by regional climate model RegCM4 for maize growing-season over Mozambique. The findings indicate that, the entrance and withdrawal of the rainy season are in phase of climatology and with the results founded by Mozambique National Institute of Meteorology. The central-northern rainy season begins slightly later of the start in southern region of Mozambique, where the onset occurs in earlier October and, between October mid-half and early November gradually moves to central-northern regions. Under both climate scenarios however, there is a trend to shift, foreward and backward the onset and end of the rainy season, respectively. Meaning that, climate change could delay the onset and anticipate the end of the rainy season in Mozambique.
Keywords:
rainy season
; onset
; summer-season
; climate change
; regional model
Introduction
The purpose of this study is investigate the relevant changes of climate precipitation pattern during austral wet and dry season over Mozambique. This issue seems to have been overlooked in the studies about climate change impact-related throughout southern Africa region in general, which tend to concentrate on how well the global and regional models can reproduce the climate without regarding to rainy season timing. Meanwhile the onset of rainy season in Mozambique has not been examined as response to climate change, although it is recognized as important issue to several activities, especially for agricultural. From a general perspective, the rainy season is commonly understood as the period of “greatest” occurrence of precipitation events. But, the technical concepts applied in the scientific community to define the onset, end and length of the rainy season are more specific. For instance, Stern et al. (1981) define the onset of the rains as the first occurrence of a specified amount of rain within two successive days. Meanwhile, from a meteorological perspective the onset and end represent a sudden change in a tropical atmospheric heat source, the addition or subtraction of which is known to alter both the large-scale (Simmons 1982 and Silva Dias et al., 1983, quoted by Liebmann et al., 2007) and regional circulation (Horel et al. 1989; Figueroa et al. 1995; Lennters and Cook, 1997 quoted by Liebmann et al. 2007). There are many possible definitions for the onset of the rainy season.
Rainfed agriculture is the dominant source of food production in Mozambique, where more than half of staple cropland areas are used during rainy season. Although more than 70% of Mozambican households have their livelihoods stemming from the income of agricultural activity, the onset, length and end of the rainy season has no long been a subject of interest in the scientific community, which is reflected in gaps of information in literature. Moreover, under present and even for projected future climate changes there is no many studies focusing in update of possible changes of precipitation pattern concerning in onset, length and end rainy season throughout Mozambique. As far as we know, there is no update studies with the same scope that have been carried out a research for sub regional scale within Mozambique boundaries. The empirical concept of growing season used to make a choice of planting or sowing dates is usually based on climatological rainy season which is closely related to meteorological summer season in the country. Usually, the rainy season fitted with the planting windows of major cereal crops (such as maize and rice) in Mozambique, starts in October and extends to March, and sometimes goes on up to April. However, as a natural consequence of climate dynamics and changes, the beginning and end of the rainy season are susceptible to inter annual and intraseasonal variability. Thus, through an accurate prediction of the onset of the rainy season for Mozambique, the benefit will be an added value. Moreover, the knowledge of the onset of the rainy season have an important application in cropping systems in order to prevent crop failure and ensure a better choice of crop variety according to favorable agrometeorological climate zone under present and future climate environment being experienced across Mozambique. Otherwise, for successful cultivated crops it is important to know whether (i) the precipitation are continuous and enough to ensure adequate soil moisture during planting time and (ii) if the amount of precipitation would be maintained or even increased during the growing period to avoid crop failure (Akinseye et al., 2016). Hence, reliable estimates of the onset and the end dates of the rainy season strongly will determine the level of the risk of annual crops and the better sowing dates of these agricultural crops in Mozambique. On the basis of reliable scientific methods it therefore become imperative that the onset of the rainy season, which coincides with the start of the growing season, must be predicted ahead.
For different purposes, the spatial and temporal variability of onset and end of the rainy-season has been the subject of some sub-Saharan African (SSA) countries. For example, Ati et al. (2002) made a comparative analysis among five methods to determine the onset of the growing season in Nigeria, to finding the best method that can also be used for predictions in that country. Important result from this study is that, if there is no dry spell window to consider, all the methods presents a significant degree of “false starts”. In addition to determine the onset and end of the rainy season in Zambia, Hachigonta et al. (2008) correlated these events with El Niño Southern Oscillation (ENSO) and regional circulation anomalies. Mupangwa et al. (2011) defined the onset, end and length of the growing season for south of Zimbabwe through the definition from Stern et al. (2006). One important issue highlighted in this study is concerned about the absent of any dry spell of more than 10 days after start of growing season to eliminate the possibility of a “false starts” of the rainy season. The period of one month after start of the rainy season considered in the same definition, represent the mean length for the initial growth stage and well-established development of most agricultural crops. Besides to proposed hybrid method to solve this problem, similar researches came up to avoid the noise of false start. For instance, Amekudzi et al. (2015), Akinseye et al. (2016) and Traore et al. (2013) determined the onset and end dates of the rainy season using long-term daily precipitation records from meteorological weather stations spread across agroecological zones in Ghana and Mali, respectively. This latter one showed that, there is a significant relationship between the start of precipitations and the length of the rainy season, thus, earlier onset most often leads to longer rainy season. From different methodology based on empirical evapotranspiration models, Edoga (2007) determine the onset, length and end dates of rainy season in Guinea. This methodology was developed and firstly applied for the same purpose in Nigeria by Benoit (1977).
Besides to aforementioned concepts (local assessment) applied in order to fit the requirements of a given crop and to account for local-scale climatic conditions, there is a different perspective (non-local assessment) based on Principal Component Analysis (PCA) and Multivariate Analysis. A study worth highlighted following the research methodology based in PCA was made by Camberlin and Diop (2003) for Senegal, West Africa. This research was explored to identify a regional index for the onset and the end of the rains. Through the PCA applied to statistical downscaling processes Laux et al. (2008, 2010) investigate the onset dates in the Volta basin of West Africa. In the same research line Boyard-Micheau et al. (2013), proposed a new approach that considers multiple combinations of rainfall thresholds in PCA to define onset and end dates of the rainy season in Kenya and northern Tanzania. The researcher’s of this paper stated that using high thresholds in dry areas leads to a large proportion of undefined onsets, while too low thresholds in wet areas make any wet spell a candidate onset, and results in a very small inter annual variability of the onset. The application of the former methods is unworkable for extrapolation years ahead.
From the perspective of potential impacts of global warming and climate change on the onset and end of precipitation, Kumi and Abiodun (2018) examined it for West Africa. An important note highlighted in this paper is that, the precipitation onset controls the best planting dates while the cessation and length of rainy season determine the type of crops to be grown. More recently, Batungwanayo et al. (2020) investigated the response of seasonal vegetation dynamics to current and projected climate in Burundi. In this study the inter annual variability of the onset of the rainy season was assessed, and the researchers stated that, high standard deviations of onset date of seasons lead to a misunderstanding of climate dynamics and, as a result, decisions about planting/sowing and related activities will be made at high risk.
Before the “true onset” of the rainy season, it is likely to occur spontaneous wet spells (referred as “false starts”) which make local farmers think that the rainy season is settling. Thus, the earlier or later planting is feasible, if the estimates of onset and end dates of rainy season represents one of the tools of local knowledge that farmer have to make better decisions of sowing dates. Likewise, these rainy season characteristics (onset and end dates) are often more relevance than seasonal rainfall totals mainly for agricultural activity and water resource management. Although the importance of this climate information, there are relatively few efforts devoted to understanding the onset and end of rainy season on current climate in Mozambique. So far and concerning to this issue, besides to “Atlas de Precipitação de Moçambique” (2007) and, Macie and Freitas (2016), there are no studies for the present study domain that are known in the literature. Nevertheless, there are no known studies on how future climate forcing scenarios may impact precipitation onset and end dates over Mozambique for near or late future. The present study is possibly the first one that addresses this issue from the point of view of the impact of climate change on onset and end of precipitation under climate scenarios at local scale in Mozambique. The findings presented here may become important to fill the knowledge gap among the agricultural stakeholders and decision-makers, relative to climate impact-related on the onset and end of the growing season in Mozambique.
The purpose of this study is to investigate the intraseasonal variability and the possible shift in the onset and end dates of the rainy season under two future climate scenarios (RCP4.5 and RCP8.5) relative to present climate in Mozambique. This aim will be reached through the simulated outputs from regional model-RegCM4, as the strong alternatives to fill the problem of lack of large observed weather stations datasets. Through the output dataset, it became possible compute and apply appropriate scientific methodology (pentad methodology) to determine the onset and end of rainy season at local scale throughout the study domain. The criteria used here to define the onset and end dates consider the maize growing season, the staple food in the study domain.
Data and Methodology
Study Domain and Climatology
The study domain is Mozambique, a country located in eastern Southern Africa and to east lies the Indian Ocean. The country is divided into 3 regions, namely, northern region, central region and southern region. Administratively, there are 10 provinces in the country and, the corresponding weather stations (ws) existing in each province are used as reference of the observed dataset in this study. These ws are used as a reference because of the consistency of the recorded dataset, and good historical observations of 30 or more years (Figure 1). The analyses made in this research take into account the air temperature and precipitation climatology from the ws throughout the study domain. Although the higher density of ws is desirable, the smoothed gradient of air temperature over the country combined with the smaller zonal and meridional extent of the territory, allow a reasonable extrapolation of the climate trends at sub-regional to local scale. Mozambique, National Institute of Meteorology (INAM, IP) uses the World Meteorological Organization (WMO) standards to label and identify each of the ws through the name of its respective capital province. Here is used the same attribution for the ws and by the way, the black dots close to the symbols represent the geographical location of each ws in the study domain, namely: Pemba (PB), Nampula (NP), Lichinga (LC), Quelimane (QL), Tete (TT), Beira (BR), Chimoio (CH), Inhambane (IN), Xai-Xai (XX) e Maputo (MP). Although there are several other ws in Mozambique, in the present study were considered six ws, divided equally for northern and southern regions, in addition to another four ws in central region of the country. It is important to highlight that regarding to topography the country has a west-east slope gradient, configuring plain regions throughout the nationwide coast and increasing altitude for the inland plateau areas in the central and northern regions. This topographic uplift contributes significantly to the noticeable spatial gradient of precipitation in the country (Figure 1, left panel).
The climate of Mozambique is characterized by tropical monsoon with two remarkably distinct seasons, dry and wet. Hence, the trend line of mean monthly precipitation (air temperature) ranges from wetter (hotter) with up to 200 mm (between ± 25 and ± 27ºC) to drier (colder) with lower than 50 mm of monthly mean precipitation (between ± 20 and ± 25ºC). The rainy (drier) season in Mozambique is overlaid to extended summer (colder) season which lasts from October to March (April to September) (Figure 1, right panel). The wettest months within the extended summer season are December and January, but January is the wettest month across the whole country (Atlas de Precipitação de Moçambique, 2007; Macie and Freitas, 2016; Programme, 2017). High temporal variability of precipitation, reflected by dry and wet season throughout the year, are the most important weather and climate factors affecting agricultural activity in Mozambique.
According to Ministry of Agriculture of Mozambique, the onset of rainy season under current climate is defined as the first occasion with accumulated precipitation within 10 days equal to or greater than 25 mm. But this definition may lead to a fake onset. So, to avoid the false warning, INAM,IP use the definition of Stern and Garbutt (1981), Stern et al. (1982) and Stern et al. (2006) manual of “Instat” quoted in Atlas de Precipitação em Moçambique (2016). According to this definition, the onset of rainy season in Mozambique is the first day of September with accumulated precipitation in 1 or 2 days equal to or greater than 20 mm, followed by a period of not more than 10 consecutive dry days in the following 30 days. However, Akinseye et al. (2016) recomended that prior to apply this definition, it is important to adapt the criteria because the strong influence of the local weather conditions, the evaporative demands of crops, cropping practices, etc. Similar definition to the former one was used by Mupangwa et al. (2011) when they were analyzed the onset and end of rainy season in Zimbabwe. The remarkable aspect in this definition is that, there is a condition of no dry period which not exceeding 10 days eliminates the possibility of false start of the rainy season. Moreover, thirty days is the mean time required for the initial stage of growth and development of most agricultural crops (Allen et al., 1998).
The range from October to March occurs the overlap of the extended summer season and the rainy season, and therefore, the rainfed crops grow overlapping in both period along the country. Results from Atlas de Precipitação em Moçambique (2016) produced by INAM,IP indicate that the onset of rainy season starts earlier (October mid-half) in the southernmost region of Mozambique, particularly surrounding MP and XX ws. In most of the central region the onset of rainy season starts between earlier to mid-half November. However, around TT, LC and PB weather stations, the onset occurs between late November and early December (29 November - 04 December). The same scenario is also observed in the coastal strip of the NP and IN weather stations.
Observed and Simulated Climate Data
Observed precipitation dataset of the ws over Mozambique are obtained from INAM,IP. The range of the present climate data considered here is 1971-2000 for both, observed dataset at the ws, as well as climate model simulations.
The runs of the regional model RegCM4 nested by Global Circulation Model HadGEM2, at 50 km of horizontal resolution, were made under two Representative Concentration Pathways (RCPs), moderate and strong radiative forcing, RCP4.5 and RCP8.5 respectively, for present and future (2070-2099) climate. The RCPs are defined on the basis of radiative forcing pathways on 21st century. Radiative forcing is a measure of the Earth’s energy balance. It is affected by Greenhouse gases (GHG) and aerosol concentrations, changes in land cover, and solar energy (Moss et al. 2010). Concepts and physical processes under build of RCPs scenarios can be found in Riahi et al. (2007), Moss et al. (2010), Clarke et al. (2011), Van Vuuren et al. (2011), Jubb et al. (2013) and Fujino et al. (2016). Meanwhile, the physical parameterization and model setup applied for RegCM4 runs were described in Sumila et al. 2023. On the other hand, general and additional information about RegCM is available in Coppola et al. (2012); Diffenbaugh et al. (2005); Elguindi et al. (2011); Giorgi et al. (2012); Giorgi and Anyah (2012); Giorgi and Mearns (1999); Giorgi, Solmon and Giuliani (2016). Among several output climate variables, two of these variables (precipitation and air temperature) are defined as the most important to define the spatial-temporal pattern in the summer-season. However, to reach the scope of the present study through the pentad method, only daily precipitation data will be used.
Identification of the Onset and End of the Rainy Season
As stated previously the rainy season in Mozambique comprises the months of October through March, and the dry period, May through September (INAM- National Institute of Meteorology). To encompass the last month of the dry and rainy season, the computation to define the beginning and end of the rainy season in the present study, were made considering the months of September and April, respectively. The analysis were done under three experiments, the first one for present climate and the other two for the future climate scenarios, as stated in latter section.
There are many definitions and several methods that have been used to determine the onset and end of the rainy season (Amekudzi et al., 2015; Boyard-Micheau et al., 2013; (Dos Santos et al., 2020; Hachigonta et al., 2008; Kousky, 1988; Kumi and Abiodun, 2018; Leite-Filho et al., 2019; Liebmann et al., 2007; Liebmann and Marengo, 2001; Marengo et al., 2017, 2001; Ngongondo et al., 2014; Ojo and Ilunga, 2018; Omotosho et al., 2000; Shongwe et al., 2009; Stern, 1981; Tadross et al., 2011; Tadross et al., 2005). But the definition used by Stern and Garbutt (1981) and Stern et al. (1982) is somehow as a stepping-stone to the several other definition available in the literature (Dorward et al., 2015 cited by Batungwanayo et al., 2020; Kasei and Afuakwa, 1991 cited by Akinseye et al., 2016; Omotosho et al., 2000). The concept used in the present study, unlike to find the onset and end, it was used to estimate the length of the dry-season under future scenarios relative to reference period or present climate. For this purpose a quantity anomalous accumulation, A (j), is defined at each grid point of the study domain over time according to the equation below:
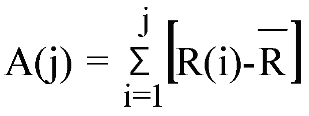 where R(i) is the daily climatological precipitation and
  is the annual mean of the daily precipitation, both in mm/day. Note that, R (i) and are both referred to reference period and both future scenarios simulated by RegCM4. The calculation can be started at any time, but commonly it is started 10 days prior to the beginning of the driest month and is summed for a year. Here, day one is taken to be June 22. The conceptual aspects of this definition are local because it depends on the climatology of the ws used here. Additionally, the threshold considered here is 5 millimeters accumulated over 5 days (pentad precipitation).
is the annual mean of the daily precipitation, both in mm/day. Note that, R (i) and are both referred to reference period and both future scenarios simulated by RegCM4. The calculation can be started at any time, but commonly it is started 10 days prior to the beginning of the driest month and is summed for a year. Here, day one is taken to be June 22. The conceptual aspects of this definition are local because it depends on the climatology of the ws used here. Additionally, the threshold considered here is 5 millimeters accumulated over 5 days (pentad precipitation).The pentad concept is based in accumulated daily mean precipitation dataset to determine the onset and end rainy season in the study domain. The onset and end dates are determined as five-day averages precipitation (pentads), computed as the daily mean of 30 years. The computations were made for three RegCM4 experiments: present (1971-2000) and future periods (2070-2099). This latter one simulated under RCP4.5 and RCP8.5 climate scenarios. The composite of pentad series were buildup for the study domain and extracted datasets of each ws. It is important to worth highlight that, these extracted datasets were made applying the bilinear grid remapping method through climate data operator (CDO) for each corresponding latitude and longitude of each ws throughout the study domain. The application of bilinear grid remapping method allows the representation of each ws for the regions around. The geographical coordinates of the datasets extracted are those considered as the first class ws by INAM,IP (as illustrated in Figure 1).
For Marengo et al. (2001) cited by Liebmann and Marengo (2001), the onset and end are defined as the first pentad with a daily average of more (less) than 4 mm day−1, provided that 6 of the 8 preceding (subsequent) pentads had daily averages of less than 3.5 mm day−1, and 6 of the 8 subsequent (preceding) pentads had daily averages of more than 4.5 mm day−1. The criteria for the preceding and subsequent pentads are included because, precipitation is a fairly noisy quantity and it is necessary to ensure that the pentad computation is capturing the true transition. The results used for the pentad concept are quite sensitive to the choice of the threshold. Than, due to the lowest daily precipitation occurring in the southern region of Mozambique, the thresholds used here will be one and half millimeters below those used in the previous definition. Unlike to other methods, the pentad precipitation method has the advantage of directly using the observed rainfall data from ws, rather than inferring the rainfall amount from other related parameters, making it appropriate for the present study.
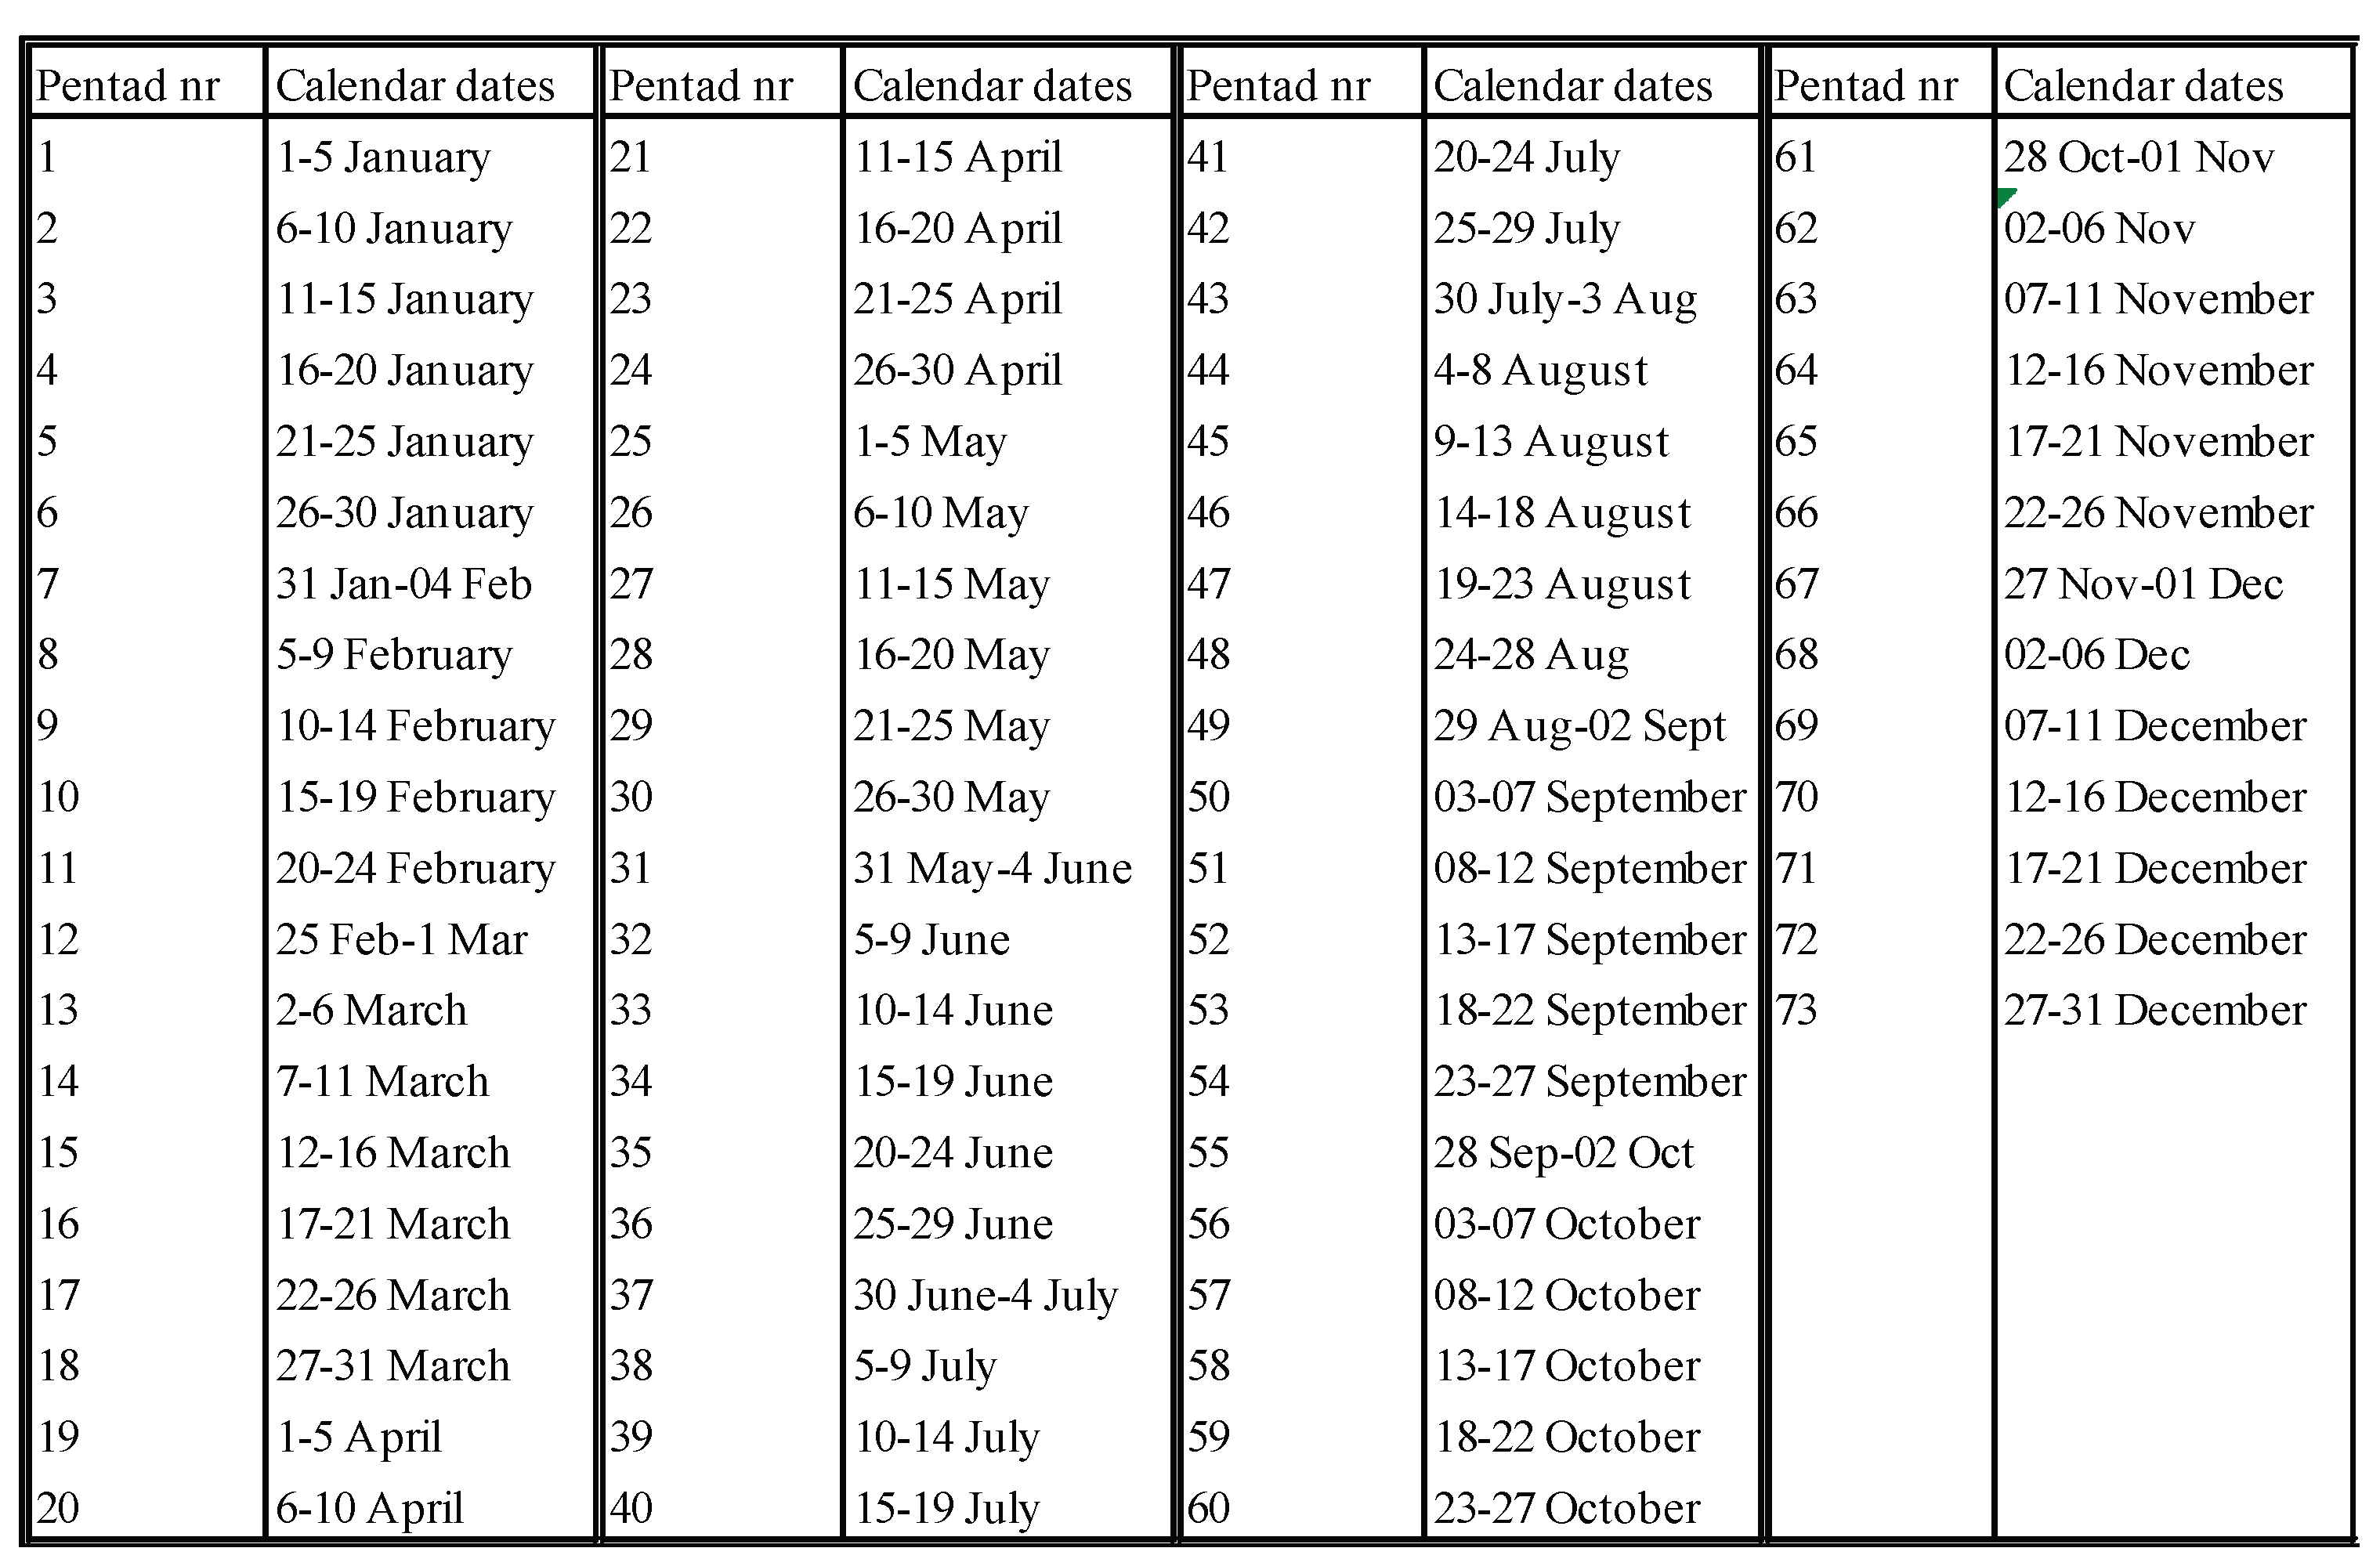
To assess the annual and seasonal variability of precipitation in Mozambique, the climatology of the pentad precipitation according to the calendar days and corresponding pentad number were computed. The precipitation pentad was computed through a daily mean precipitation for thirty years, corresponding to present and both RCPs scenarios. These calculations come from 360 values of mean daily precipitation throughout the study domain and, hence, 73 pentad of accumulated precipitation (Table 1). Additionally, to assess plant exposure to acute water deficit during grain development, the dry spells and precipitation rate throughout the rainy season under RCP4.5 and RCP8.5 relative to present climate period was calculated.
Results
Annual Precipitation
As discussed before and illustrated in Figure 1, there is a great variability in annual cycle of precipitation over Mozambique with the largest amounts being recorded during austral summer season. Figure 2 shows the climatology of mean annual precipitation for reference period and both representative climate scenarios, RCP4.5 and RCP8.4, simulated by regional model RegCM4. For reference period, the maximum precipitation of more than 1500 mm .yr−1 occur over central and northern regions of the country, and the minimum in southward of 21 ºS of latitude and along Zambezi river basin. There is observed some extreme “hotspot” of more than 2000 mm .yr−1 in northernmost of LC and coastal region of NP and PB ws (Figure 2a). Concerned to the total amounts, there is a little overestimation and outliers relative to the highest record. On the whole however, the model captures fairly well the noticeable amount of precipitation over the central-northward regions. These regions are strongly influenced by monsoon precipitation linked to Intertropical Convergence Zone (ITCZ) and the deep convection, common weather events during summer season in Mozambique. The description of the seasonal distribution of precipitation and synoptic-scale features have been discussed extensively in previous studies (Creese and Washington, 2016; Dyer et al., 2017; Favre et al., 2013; Fučkar et al., 2020; Howard and Washington, 2019; Lazenby et al., 2016; Macron et al., 2014; Nicholson and Klotter, 2021; Quagraine et al., 2019).
The precipitation spatial features described previously is discussed here for each representative climate scenarios relative to baseline period (Figure 2b and c). As can be seen for RCP4.5, it is observed an overwhelming driest response over the study domain, but the drier response occur in the regions where is observed the higher precipitation in the baseline period (Figure 2b). Meanwhile, the less negative response is observed over most of the southern region and elsewhere areas of the study domain. Similar pattern occur under RCP8.5 scenario but the driest response is more pronounced, and the “bipolarization” between southern-central and northern regions become noticeable (Figure 2c). It is important to worth highlighted that, under both climate scenarios, there is a northwest-southeast gradient throughout Gaza province and Zambezi river basin, being slightly positive upstream and decreasing negatively downstream (Figure 2b and c). Once again the drier response is overwhelmingly more significant for RCP8.5 than RCP4.5 scenarios (Figure 2c). The differences associated with overestimating are quite small than those associated to underestimating, probably due to the influence of local topography gradient from the coastal regions towards to inland plateaus, similar to zonal gradient of precipitation observed in the region. Although the small differences, the results corroborate with the findings of previous studies (e.g., Mavume et al., 2021; Programme, 2017; Queface, 2009; and “Atlas de Precipitação de Moçambique-INAM”, 2007).
The Onset of Rainy Season
Before the discussion about the onset and end of the rainy season, it is addressed the composite of precipitation pentad for each ws and for present and RCP’s scenarios. For a better understanding of annual precipitation variability on pentad timescale in Mozambique, the pentad climatology is showed in Figure 3. From Eq. (1) applied to climatological data simulated by the regional model RegCM4 in the study domain, the composites of pentad precipitation is illustrated as the anomalous accumulation curves (Figure 3). The pentad ranges from just over 0.2 to about 24 mm day−1 for present and both future scenarios. Additionally, the year-round trend-line of pentad precipitation can be seen to be quite similar as that present in Figure 1, the anomalous accumulation still lowest during the dry season, centered between June and July, and then increasing in the wet season up to the core period, between December and January. For present climate, values below 5 mm day−1 ranges from pentad 30 (26-30 May) to 60 (3-7 Oct) (Figure 3a), meanwhile it is observed a shift from pentad 30 to 16 (17-21 Mar) under RCP4.5 and from 30 to 12 (25-Feb to 01-Mar) under RCP8.5 scenarios (Figure 3b and c). This means that there is a shift of pentad equal to or greater than 5 mm day−1 from May to March and from May to February under RCP4.5 and RCP8.5 relative to reference period, respectively. As the pentad range below 5 mm day−1 extends, the immediate consequence is the reduction of the period whose precipitation at this threshold is compressed.
The abovementioned annual variability in pentad time scale is adjusted only for central (blue lines) and northern (red lines) regions of the country, because the southern region records are below 5mm day−1 in almost the entire trend-line, except for pentads 60 or more for reference period and 65 (17-21 Nov) under future scenarios, respectively (Figure 3). Likely for this reason, there will be some difficulty in applying the criterion to define the onset of the rainy season in the southernmost regions of the study domain. Important observation from this result is that, the global mean of precipitation pentad tends to reduce as the radiative forcing become stronger. The opposite trend is observed for standard deviations. Since that there is observed trend to extend the pentad below 5 mm day−1, the expected response is obviously, the shrinks of opposite condition (pentad above 5 mm day−1). This finding may be the foreshadowing of the possible impacts of climate change, from the point of view of climatic scenarios, at the onset, end and length of the rainy season. It may means that, the late onsets and early ends are likely to be more usual under climate scenarios relative to current climate. Additionally, the estimation of the steady rainfall during the wet season and almost complete lack of precipitation during the dry season illustrated in the present results, are evidence of variability of the precipitation trend line year-round. For this reason the response of the beginning and end of rainy season to the RCP’s scenarios, estimated through Eq. 1, becomes reliable and robustness for the study domain.
However, in spite of the thirty years that were averaged over study domain, the method used here (Eq. 1) is still noisy concerning to the beginning and the end of the pentad precipitation above and below 5 mm, anticipating coarsely this threshold. This method was used by Sparacino et al. (2021) to determine the onset and end of rainy season over Amazon region, but here is observed failure of this method to reach a good approximation for onset dates. Remembering that, according to “Atlas de Precipitação Moçambique (2007)”, the pentad precipitation above 5 mm in Mozambique ranges from October to March.
The findings presented in the last section must be strongly supported through the estimation of the onset of rainy season as a response to simulated future precipitation under RCP’s climate scenarios over Mozambique. The dates of onset and end of the rainy season for present climate and under both RCP’s scenarios, based on the pentad climatology are shown in Figure 4. As example, the trend line represents the ws of each climatological region considered in this study. The results indicate that, the climatological annual trend of precipitation is tied to summer and growing season. For present climate, the onset of the rainy season progresses from southern toward to central and north regions. The earliest onset dates are the pentad precipitation centered in the beginning of September for three ws (Figure 4g, h and i). It is important to highlight that, the criteria of pentad thresholds for the weather stations of southern region was lower (2 mm) than those used to central and north regions (5 mm). The pentad of onset dates in the central region of the study domain are centered in early October (Figure 4d, e and f). Meanwhile the onset in the northern region occurs in late September for LC, mid-half October for NP and late November for LC ws, respectively (Figure 4a, b and c). The later end of the rainy season occurs in the northern region, ranging from mid-January in LC and NP, to the beginning of February around PB, and part of the central region (mid-January in QL). There is a noticeable timings of growing season indicating that among the central and northern ws, TT and CH are those that represent the shortest growing season length, mostly arising from a combination of latter onset and earlier end. Note that, the criteria used here does not met with the end of rainy season in southern region of the study domain where it is almost never defined. A possible explanation may be the occurrence of very low pentad precipitation in this region, since the criterion used is very sensitive to the applied threshold. Meanwhile, in the “Atlas de Precipitação de Moçambique” (2007) and Programme (2017) was observed a fairly early onset and late end of the growing season over southernmost region, leading to longest growing season of the country. The remarkable aspect observed is that the withdrawal of the rainy season progresses in the same direction of the onset (Figure 4). The direction of withdrawal in the current climate is copiously consistent with the mean precipitation climatology, progressing northward. This lag is caused by northward latter ITCZ movement, while the cold fronts and baroclinic waves are moved southward following the subtropical high pressure of the Indian Ocean. For present climate, these results are consistent with the findings of INAM, IP and Macie and Freitas (2016). Unfortunately, besides to these two, there is no more studies focusing this issue for Mozambique.
When the future climate scenarios are analyzed, there is observed a trend to shift the onset and end of rainy season, starting later and withdrawing earliest respectively. It means that there is a trend to shrink the rainy season under future climate scenarios relative to present climate over Mozambique (Figure 4). Under both climate scenarios, the onset (end) of rainy season is expected to move forward (backward) relative to the reference period, with emphasis on PB and LC ws, where differences reach 15 days (Figure 4a, b and c).
Regarding to the onset among these ws, PB is the one with the most significant shift with a delay of almost 30 days, followed by LC with about 10 days. In the central region the most significant delay in the onset and advance in the end are observed in CH and QL ws. The onset (end) in QL ws is estimated to occur around early November (late December) (Figure 4d). In the same time, the onset and end of the rainy season over CH is expected to occur around November mid-half and early December respectively (Figure 4f). On the other hand, the most significant shift in the onset of the rainy season across the country seems to occur over southern region. For example, there are observed delay of around 25 days relative to reference period in MP and IN ws (Figure 4g and i). Nevertheless, significant changes at the end of the rainy season do not appear clearly in southernmost region.
As can be observed throughout all ws analyzed here, there are no clear displacement concerning to the end of the rainy season, under RCP4.5 scenario relative to current climate. Such as underlined by Liebmann and Marengo (2001), the composite signal is one of a sharp increase (decrease) in precipitation at onset (end), suggesting that the onset and end of the rainy season are abrupt phenomena, rather than a slow buildup that eventually crosses some arbitrary threshold. Likewise findings from Kumi and Abiodun (2018), relative to present climate, the response under the strongest climate scenario indicate the higher delay of the onset and more pronounced advance in the end of the rainy season.
The findings discussed previously indicate that, when compared to those of the present climate, there is a generalized trend to shortening the rainy season. The most pronounced response, more than 25 days, in the delay (advance) of the onset (end) of the rainy season is observed in the ws over the central and southern regions, under RCP8.5. In the northern region this response does not exceed 20 days. It is important to worth highlighted that, this climate response pattern is not clearly observed over the southern region of Mozambique. One possible reason for this results may be the local-scale onset definition be rigid so far as each threshold may not be transposable to other climate environment. However, the shift of the onset and end of the rainy season suggests that its length will be shorter, mainly in the central region of the study domain and under the worst representative scenario (RCP8.5) of climate change. Once again, similar results but addressed for present climate in Zambia, was found by Hachigonta et al. (2008). In this study was claimed that, the length of the rainfall season tends to decline and the implication of this result is that the growing season of agriculture crops may become shorter, leading to additional strains already stretched agricultural resources. Another research with similar results but for West Africa (Kumi and Abiodun, 2018), found a delay in precipitation onset but unlike to the response of cessation dates that is weaker than onset under future climate scenarios. Thus, a decrease in the length of rainy season was projected over most areas in Mozambique.
In order to assess the spatial response, the present findings can be seen as monthly mean spatial distribution of pentad precipitation over the study domain (Figure 5). Throughout the reference period it is observed that in October, the pentad of precipitation is less than 5 mm in almost all regions of the study domain, except over southern far region where the pentad precipitation begins to hover this thresholds (Figure 5a). During the month of November, the onset of the rainy season (pentad precipitation more than 5 mm/month) is clearly highlighted over the southernmost region of the country, but in the rest of the country the signal is still weak (Figure 5b). The signal of the onset over the central and northern regions begins to get stronger in December, peaking in January and February, and weakening again in March. At the same time, there is a reverse trend signals with the beginning of the end of the rainy season in the southern-central direction. It should be noted that the strongest signal observed in January in the northern region begins to weaken as early as March, indicating the end of the rainy season in this region (Figure 5c, d, e and f). This pentad of precipitation pattern underline the results discussed in the previous section, according to which, the onset and end of the rainy season occurs earlier on the southern region, and moves progressively to central-north regions of the country.
For future climate there is observed a similar spatial pattern of pentad precipitation relative to reference period, but a different timescale response occurs in both climate scenarios (Figure 6). In October the pentad precipitation is well bellow 5 mm/month, but the signal above this thresholds came up in November over southern region, for both climate scenarios (Figure 6a, b and g, h). Despite the progression of the onset of the rainy season signal to the central and northern regions, it is still weak in December, relative to reference period (Figure 6c and i). Over the central and northern regions the signal become stronger in January and February. Meanwhile, the pentad precipitation begins to decrease to levels below 5 mm/month over southern region of the country (Figure 6d, e, j and k). However, the signal for end of rainy season on southern-central direction is stronger in March under both scenarios (Figure 6f and l). This last result seems to be conflicting to that one discussed in the previous section, but it is not, because in the last statement is presented the spatial pattern of pentad precipitation, while in the previous section was analyzed the annual trend at the grid point level.
The results about the rainy season (the onset and end) becomes more important if it is combined with the spatio-temporal distribution of the precipitation and the trend of heat waves. Climatologically, the occurrence of dry and heat periods is often spontaneous and when lasts long enough may compromise the agricultural crops development. As stated by Ati et al. (2002), the plants growth may suffer significantly with either a late onset or early end of the growing season, as well as with a high frequency of dry spells combined or not with heat wave within the season. As stated by Laux et al. (2008, 2010) quoted by Akinseye et al. (2016), prolonged dry spells of two or more weeks soon after sowing are usually disastrous for plant development, leading to poor germination, uneven plant spacing resulting in yield reductions or total crop failure. The crop damage can be more severe if the dry spells and heat waves occur during the most sensitive stages throughout the crop phenology, such as flowering and maize grain filling for example. On the other hand, for sowing, it is important to know whether the precipitation is continuous and sufficient to ensure enough soil moisture during sowing-emergence and whether this level will be maintained or even increased during the growing period to avoid total crop failure (Walter, 1967 quoted in Laux et al., 2010). In this line of though, Batungwanayo et al. (2020) recommended that if a crop could withstand 10 day of dry spell (but no longer) then the sowing date must be done delayed, meanwhile, if the crop could not withstand to the dry spell of more than 7 days, then the earliest sowing dates should be about 10 days after the highest occurrence of consecutive dry days. Besides to the flattening of the rainy season, it is clear that these two index (dry spells and heat waves) are very important for crops management, especially maize, one of the most important staple crops in Mozambique.
Over the years, the intraseasonal variability of the precipitation and the occurrence of heat wave in Mozambique, has become increasingly more usual, as reported in “Estado do clima de Moçambique (2021, 2022)”. Under climate change, the dry spells and heat waves may become more regular and lasting over the most of tropical regions (IPCC, 2021), placing the growing season under a possible new agroclimatic environment in Mozambique. Besides to the empirical observations and ws datasets, this statement is supported by the results found through the regional model RegCM4 run for the present and late future, under climate pathways over Mozambique (details in Sumila et al.2023).
In the agrometeorological context, a dry day is defined as any day with an amount of precipitation below a specific thresholds. Note that, the plant demand for water is somehow defined according to each particular crop needs and hence, there are different thresholds used to define dry days. For instance, Stern et al. (2006) cited by Mupangwa et al. (2011), suggest that for other purposes the threshold of 4.95 mm can be used to define a dry day. In the present study is defined dry day as any day that accumulates less than 5 mm of precipitation. Thus, consecutive dry days (cdd) is the greatest number of consecutive days per time period with daily precipitation amount below 5 mm. Five consecutive days was the the largest number of cdd of time series of daily precipitation amounts considered here. Meanwhile, for the purpose of the present study, heat wave was defined as the consecutive five days with the maximum daily air temperature equal or above 40 ºC.
During the austral summer season most of cdd occur over northwest areas of XX and IN, along Zambezi river basin, around QL and southeast of LC ws (Figure 7a). Relative to reference period, there are predominantly positive response under both RCP’s scenarios, with a more significant response occurring along Zambezi river basin, around QL and IN ws. A slightly negative response is observed in small areas over southernmost (Figure 7b and c). Likewise to the cdd, the most significant occurrence of heat wave is observed throughout Zambezi river basin, north of BR and west of QL ws (Figure 7d). The spatial pattern remain the same for the future climate, but under both scenarios the observed positive response spreads further north and south of the study domain, but stronger under RCP8.5 than RCP4.5 (Figure 7e and f).
Increase in dry spell lengths and heat waves frequency have been reported in some Southern African countries such as Malawi, Zambia and Zimbabwe (Mupangwa, Walker and Twomlow, 2011; Tadross et al., 2011). In these studies was stated that, the variability of the onset and end of the rainy season exacerbates the risk on agricultural crops, mainly when associated with the occurrence of dry spells and heat waves. Additionally, the same researchers claimed that in most of Southern African it is common for long dry spells and heat waves to occur during the growing season.
Conclusions
The assessment and prediction of onset and end dates of the rainy season is a key issue in Mozambique, because the agriculture activity in the country rely on rainfed. The onset and end of the rainy season in Mozambique must be affected by the precipitation variability and climate change. For the agricultural purpose, this possible impact must be taking account considering the overlap between the growing-season and the extended rainy summer-season in Mozambique. To face the climate change effects and reduce crop failures and climate risks in Mozambique, the farmers may need to modify their crop management and adapting the planting and/or sowing dates to adjust the projected changes at the onset and end of the rainy season. This statement was made by Kumi and Abiodun (2018) for West Africa and is also valid for Mozambique.
From a pentad time-scale point of view, the phasing of the precipitation annual cycle of Mozambique is in excellent agreement with that showed in present climatology, where the dry season range is similar to wet season under current climate. However, the pentad of precipitation under climatic scenarios indicates the extent of ranges with precipitation less than 5 mm. This reduction is more significant in central and northern region and stronger under RCP8.5 than RCP4.5. Additionally, the trend to increase the pentad less than 5 mm is sharper before May (from pentad 30 to 16 and 12, for RCP4.5 and RCP8.5, respectively) than after October (from pentad 60 to around 65, for both RCP’s scenarios). For most of the pentad, except after pentad 60, the southern region record is bellow 5 mm, but the trend is similar to those described previously. Neither onset nor end of the rainy season is clearly defined for southern region of Mozambique, because pentad precipitation is almost always below the threshold considered in the present study.
The climatological onsets concerned to the scale of weather stations are in phase with those findings by Mozambique, National Institute of Meteorology. The earliest onset of rainy season occurs in October mid-half in southern far region and progresses toward central-northern regions. From late October to early November the onset of rainy season span to most of central region, arriving near the end of the year (December) in northern region of Mozambique. The central and northern regions of Mozambique experience significant variations in the onset and end date of the rainy season, the dates are out of phase with that of the southern far. Under future climate scenarios the progress toward the central-northern regions remain, however, the onset tends to lag in relation to the reference period. In the southernmost, the onset and end are less significant even considering the lower threshold.
Throughout the study domain, there are weather stations in which the methodology used seems to perform quite well to determine the onset and end of the rainy season under present climate. However, although the present methodology presents robust results, there are some areas, such as around PB weather station and over most of southern region provinces where estimates consistently appear with significant discrepancies.
Acknowledgments
Telmo Cosme A. Sumila was supported a grant from “Conselho Nacional de Desenvolvimento Cientifico e Tecnologico (CNPq)”, Brazil. The authors wish to thank the “Universidade Federal de Santa Maria” for providing partial funding for this research.
References
- AKINSEYE, F.M.; et al. Evaluation of the onset and length of growing season to define planting date—‘a case study for Mali (West Africa)’. Theoretical and Applied Climatology 2016, 124, 973–983. [Google Scholar] [CrossRef]
- ALLEN, R.G.; et al. FAO Irrigation and Drainage Paper No. 56 - Crop Evapotranspiration. n. January 1998, 1998.
- AMEKUDZI, L.K.; et al. Variabilities in rainfall onset, cessation and length of rainy season for the various agro-ecological zones of Ghana. Climate 2015, 3, 416–434. [Google Scholar] [CrossRef]
- ATI, O.F.; STIGTER, C.J.; OLADIPO, E.O. A comparison of methods to determine the onset of the growing season in Northern Nigeria. International Journal of Climatology 2002, 22, 731–742. [Google Scholar] [CrossRef]
- Atlas de Preci pitação Moçambique Atlas de Precipitação Moçambique. [s.d.].
- BATUNGWANAYO, P.; VANCLOOSTER, M.; KOROPITAN, A.F. Response of Seasonal Vegetation Dynamics to Climatic Constraints in Northeastern Burundi. Journal of Geoscience and Environment Protection 2020, 08, 151–181. [Google Scholar] [CrossRef]
- BENOIT, P. The start of the growing season in Northern Nigeria. Agricultural Meteorology 1977, 18, 91–99. [Google Scholar] [CrossRef]
- BOYARD-MICHEAU, J.; et al. Regional-scale rainy season onset detection: A new approach based on multivariate analysis. Journal of Climate 2013, 26, 8916–8928. [Google Scholar] [CrossRef]
- CAMBERLIN, P.; DIOP, M. Application of daily rainfall principal component analysis to the assessment of the rainy season characteristics in Senegal. Climate Research 2003, 23, 159–169. [Google Scholar] [CrossRef]
- CHANGE, U.S.C.; PROGRAM, S. Scenarios of greenhouse gas emissions and atmospheric concentrations. Greenhouse Gas Emission Scenarios for Use in Climate Based Response, n. July, p. 1–173, 2011.
- COPPOLA, E.; et al. RegT-Band: A tropical band version of RegCM4. Climate Research 2012, 52, 115–133. [Google Scholar] [CrossRef]
- CREESE, A.; WASHINGTON, R. Using qflux to constrain modeled Congo Basin rainfall in the CMIP5 ensemble. Journal of Geophysical Research 2016, 121, 13,415–13,442. [Google Scholar] [CrossRef]
- DIFFENBAUGH, N.S.; et al. Fine-scale processes regulate the response of extreme events to global climate change. Proceedings of the National Academy of Sciences of the United States of America 2005, 102, 15774–15778. [Google Scholar] [CrossRef]
- DYER, E.L.E.; et al. Congo Basin precipitation: Assessing seasonality, regional interactions, and sources ofmoisture. Journal of Geophysical Research 2017, 122, 6882–6898. [Google Scholar] [CrossRef]
- EDOGA, R.N. Determination of Length of Growing Season in Samaru Using Different Potential Evapotranspiration Models. AU joutnal of Technology 2007, 11, 28–35. [Google Scholar]
- ELGUINDI, N.; et al. Regional Climatic Model RegCM User Manual. Earth System Physics Section 2011, 6, 1833–1857. [Google Scholar]
- Estado do clima de Moçambique em 2021. 2022.
- FAVRE, A.; et al. Cut-off Lows in the South Africa region and their contribution to precipitation. Climate Dynamics 2013, 41, 2331–2351. [Google Scholar] [CrossRef]
- FUČKAR, N.S.; et al. On high precipitation in Mozambique, Zimbabwe, and Zambia in February 2018. Bulletin of the American Meteorological Society 2020, 101, S47–S52. [Google Scholar] [CrossRef]
- FUJINO J, NAIR R, KAINUMA M, ET AL. Multi-gas Mitigation Analysis on Stabilization Scenarios Using Aim Global Model Author (s): Junichi Fujino, Rajesh Nair, Mikiko Kainuma, Toshihiko Masui and Yuzuru Matsuoka Source: The Energy Journal, Vol. 27, Special Issue: Multi-Greenhouse Gas. v. 27, n. 2006, p. 343–353, 2016.
- GIORGI, F.; et al. RegCM4: Model description and preliminary tests over multiple CORDEX domains. Climate Research 2012, 52, 7–29. [Google Scholar] [CrossRef]
- GIORGI, F.; ANYAH, R.O. The road towards RegCM4. Climate Research 2012, 52, 3–6. [Google Scholar] [CrossRef]
- GIORGI, F.; MEARNS, L.O. Introduction to special section: Regional climate modeling revisited. Journal of Geophysical Research: Atmospheres 1999, 104, 6335–6352. [Google Scholar] [CrossRef]
- GIORGI, F.; SOLMON, F.; GIULIANI, G. Regional Climatic Model RegCM User ’ s Guide. International Centre for Theoretical Physics, n. May, 2016.
- HACHIGONTA, S.; REASON, C.J.C.; TADROSS, M. An analysis of onset date and rainy season duration over Zambia. Theoretical and Applied Climatology 2008, 91, 229–243. [Google Scholar] [CrossRef]
- HOWARD, E.; WASHINGTON, R. Drylines in southern Africa: Rediscovering the Congo air boundary. Journal of Climate 2019, 32, 8223–8242. [Google Scholar] [CrossRef]
- INTERGOVERNMENTAL PANEL ON CLIMATE CHANGE. Climate Change 2021 - The Physical Science Basis - Summary for Policymakers. [s.l: s.n.].
- JUBB, I.; CANADELL, P.; DIX, M. Representative Concentration Pathways.Australian Government, Department of the Environment. p. 1–19, 2013.
- KOUSKY, V.E. Pentad Outgoing Longwave Radiation Climatology for the South American Sector. Analysis 1988, 3, 217–231. [Google Scholar]
- KUMI, N.; ABIODUN, B.J. Erratum: Potential impacts of 1.5 °C and 2 °C global warming on rainfall onset, cessation and length of rainy season in West Africa (Environ. Res. Lett. (2018) 13 (055009) DOI: 10.1088/1748-9326/aab89e). Environmental Research Letters, v. 13, n. 8, 2018.
- LAUX, P.; et al. Impact of climate change on agricultural productivity under rainfed conditions in Cameroon-A method to improve attainable crop yields by planting date adaptations. Agricultural and Forest Meteorology 2010, 150, 1258–1271. [Google Scholar] [CrossRef]
- LAZENBY, M.J.; TODD, M.C.; WANG, Y. Climate model simulation of the South Indian Ocean Convergence Zone: Mean state and variability. Climate Research 2016, 68, 59–71. [Google Scholar] [CrossRef]
- LIEBMANN, B.; et al. Onset and end of the rainy season in South America in observations and the ECHAM 4. 5 atmospheric general circulation model. Journal of Climate 2007, 20, 2037–2050. [Google Scholar]
- LIEBMANN, B.; MARENGO, J.A. Interannual variability of the rainy season and rainfall in the Brazilian Amazon Basin. Journal of Climate 2001, 14, 4308–4318. [Google Scholar] [CrossRef]
- MACIE, O.A. DE A.; FREITAS, E.D. Características Da Estação Chuvosa Em Moçambique E Probabilidade De Ocorrência De Períodos Secos Characteristics of the Rainy Season in Mozambique and Probability of Dry Spells Occurrence. Ciência e Natura 2016, 38, 232.
- MACRON, C.; et al. How do tropical temperate troughs form and develop over Southern Africa? Journal of Climate 2014, 27, 1633–1647. [Google Scholar] [CrossRef]
- MARENGO, J.A.; et al. Onset and End of the Rainy Season in the Brazilian Amazon Basin, Journal of Climate 14, 833-852. Journal of Climate 2001, 14, 833–852. [Google Scholar] [CrossRef]
- MAVUME, A.F.; et al. Analysis of climate change projections for mozambique under the representative concentration pathways. Atmosphere, v. 12, n. 5, 2021.
- MOSS, R.H.; et al. The next generation of scenarios for climate change research and assessment. Nature 2010, 463, 747–756. [Google Scholar] [CrossRef] [PubMed]
- MUPANGWA, W.; WALKER, S.; TWOMLOW, S. Start, end and dry spells of the growing season in semi-arid southern Zimbabwe. Journal of Arid Environments 2011, 75, 1097–1104. [Google Scholar] [CrossRef]
- NICHOLSON, S.E.; KLOTTER, D. The Tropical Easterly Jet over Africa, its representation in six reanalysis products, and its association with Sahel rainfall. International Journal of Climatology 2021, 41, 328–347. [Google Scholar] [CrossRef]
- OF, T.H.E.S.; AFRICA, W. The in. v. 1, p. 59–68, 1981.
- OJO, O.I.; ILUNGA, M.F. Application of Nonparametric Trend Technique for Estimation of Onset and Cessation of Rainfall. Air, Soil and Water Research 2018, 11, 0–3. [Google Scholar] [CrossRef]
- OMOTOSHO, J.B.; BALOGUN, A.A.; OGUNJOBI, K. Predicting monthly and seasonal rainfall, onset and cessation of the rainy season in West Africa using only surface data. International Journal of Climatology 2000, 20, 865–880. [Google Scholar] [CrossRef]
- PROGRAMME, W.F. MOZAMBIQUE: A Climate Analysis. 2017.
- QUAGRAINE, K.A.; et al. A methodological approach to assess the co-behavior of climate processes over Southern Africa. Journal of Climate 2019, 32, 2483–2495. [Google Scholar] [CrossRef]
- QUEFACE, A. Historical overview of natural disasters. Main report: INGC Climate Change Report: Study on the Impact of Climate Change on Disaster Risk in Mozambique [Asante, K., Brundrit, G., Epstein, P., Fernandes, A., Marques, M.R., Mavume, A, Metzger, M., Patt, A., Queface, A., Sanchez del Valle, R., Tad], n. June, 2009.
- RIAHI, K.; GRÜBLER, A.; NAKICENOVIC, N. Scenarios of long-term socio-economic and environmental development under climate stabilization. Technological Forecasting and Social Change 2007, 74, 887–935. [Google Scholar] [CrossRef]
- ROGER STERN, DERK RIJKS, IAN DALE, J.K. Instant Climatic Guide. n. January, p. 1–330, 2006.
- SHONGWE, M.E.; et al. Projected changes in mean and extreme precipitation in Africa under global warming. Part I: Southern Africa. Journal of Climate 2009, 22, 3819–3837. [Google Scholar]
- SPARACINO, J.; ARGIBAY, D.S.; ESPINDOLA, G. Long-term (35 years) rainy and dry season characterization in semiarid northeastern Brazil. Revista Brasileira de Meteorologia 2021, 36, 377–391. [Google Scholar] [CrossRef]
- STERN, R.D.; DENNETT, M.D.; DALE, I.C. Analysing daily rainfall measurements to give agronomically useful results. I. Direct methods. Experimental Agriculture 1982, 18, 223–236. [Google Scholar] [CrossRef]
- TADROSS, M.; et al. Changes in growing-season rainfall characteristics and downscaled scenarios of change over southern Africa: implications for growing maize. IPCC regional Expert Meeting on Regional Impacts, Adaptation, Vulnerability, and Mitigation, Nadi, Fiji, n. January, p. 193–204, 2011.
- TADROSS, M.; JACK, C.; HEWITSON, B. On RCM-based projections of change in southern African summer climate. Geophysical Research Letters 2005, 32, 1–4. [Google Scholar] [CrossRef]
- TRAORE, B.; et al. Effects of climate variability and climate change on crop production in southern Mali. European Journal of Agronomy 2013, 49, 115–125. [Google Scholar] [CrossRef]
- VAN VUUREN, D.P.; et al. The representative concentration pathways: An overview. Climatic Change 2011, 109, 5–31. [Google Scholar] [CrossRef]
Figure 1.
Topography of Mozambique and the three climatological sub-regions used in this study shown in the right 3 panels, while the black mark means the geographic locations of each weather stations: Pemba (PB), Lichinga (LC), Nampula (NP), Quelimane (QL), Tete (TT), Beira (BR), Chimoio (CH), Inhambane (IN), Xai-xai (XX) e Maputo (MP). The rightmost panel shows the mean annual trend of precipitation and air temperature over abovementioned weather stations. Source: Sumila et al. 2023.
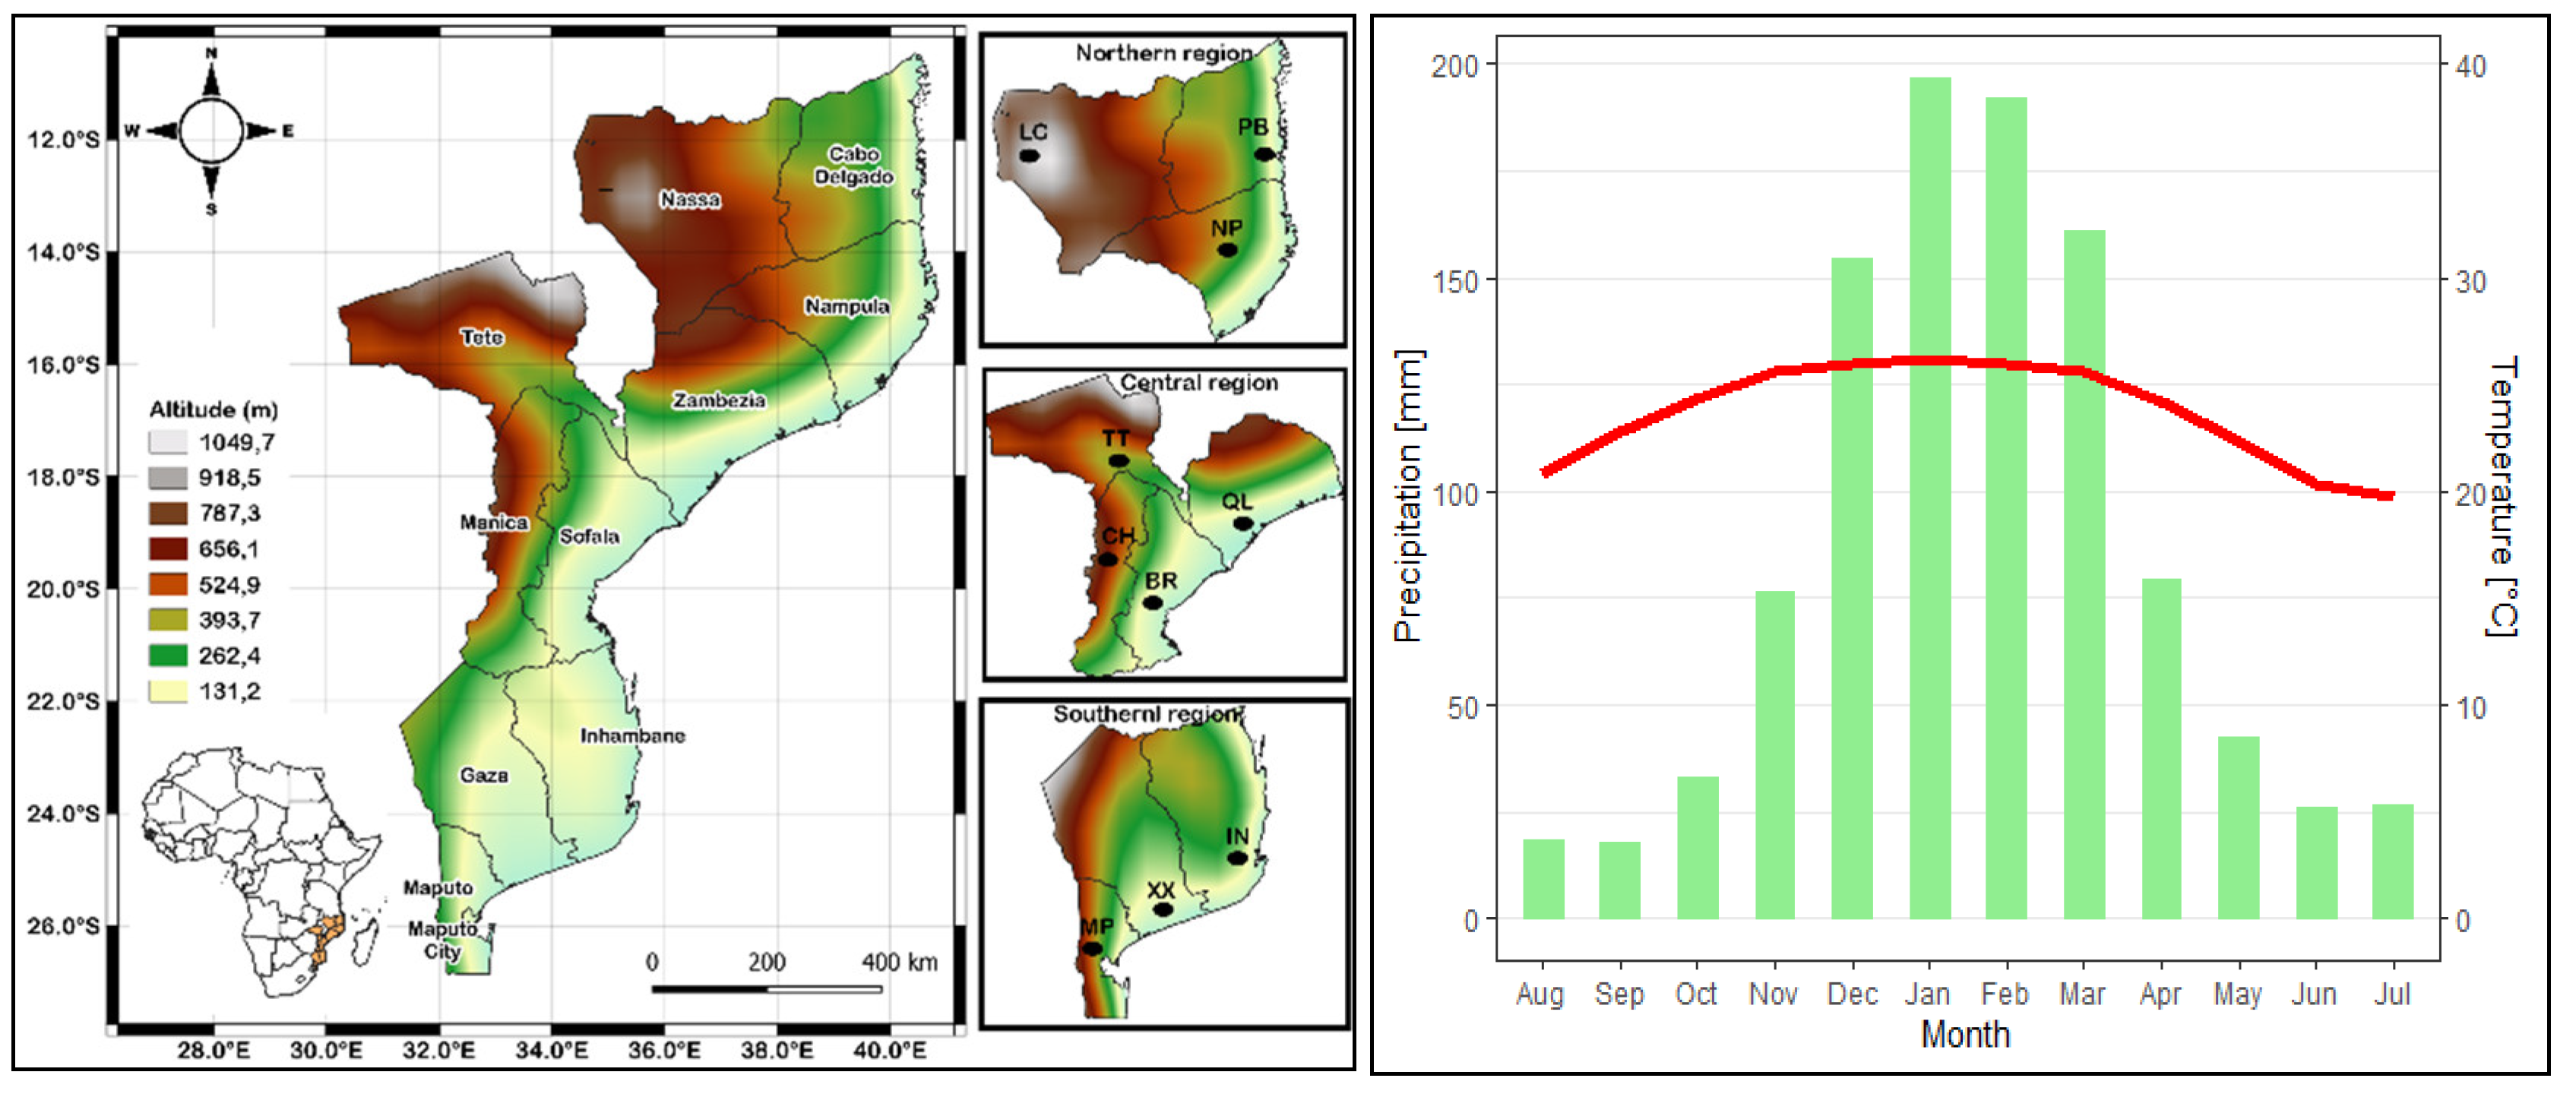
Figure 2.
Mean annual total precipitation for reference period (panel a) and, the difference (panels b and c) between both climate scenarios (RCP45 and RCP85) relative to reference period (1971-2000).
Figure 2.
Mean annual total precipitation for reference period (panel a) and, the difference (panels b and c) between both climate scenarios (RCP45 and RCP85) relative to reference period (1971-2000).
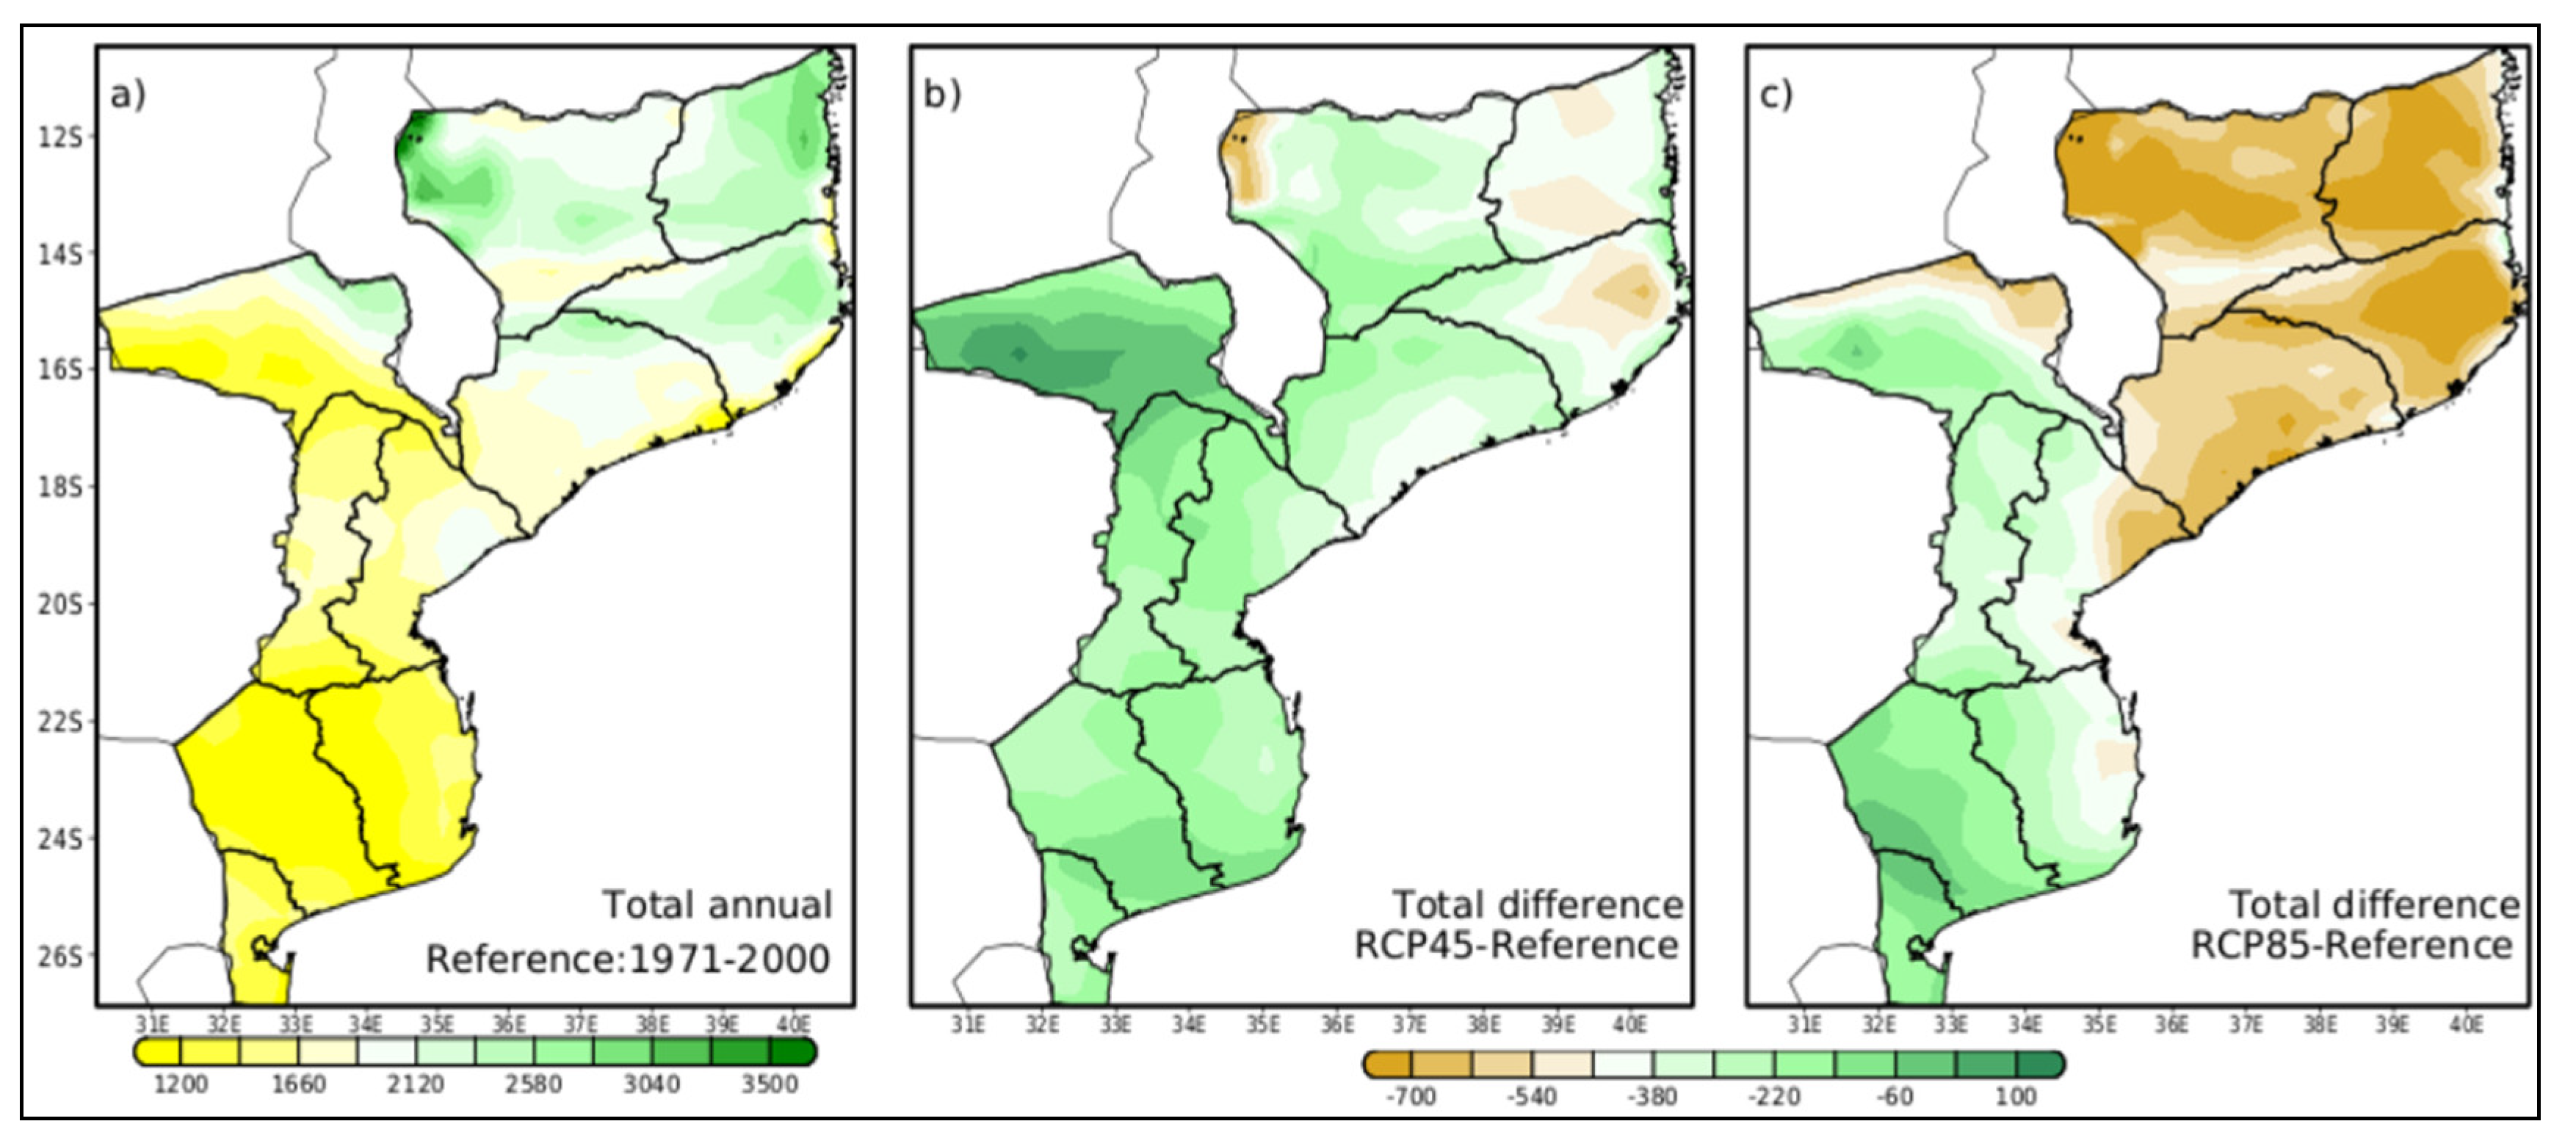
Figure 3.
The trend-line of precipitation pentad for reference period (a), RCP4.5 (b) and RCP8.5. The north, central and southern regions are represented by red, blue and black line colors respectively.
Figure 3.
The trend-line of precipitation pentad for reference period (a), RCP4.5 (b) and RCP8.5. The north, central and southern regions are represented by red, blue and black line colors respectively.
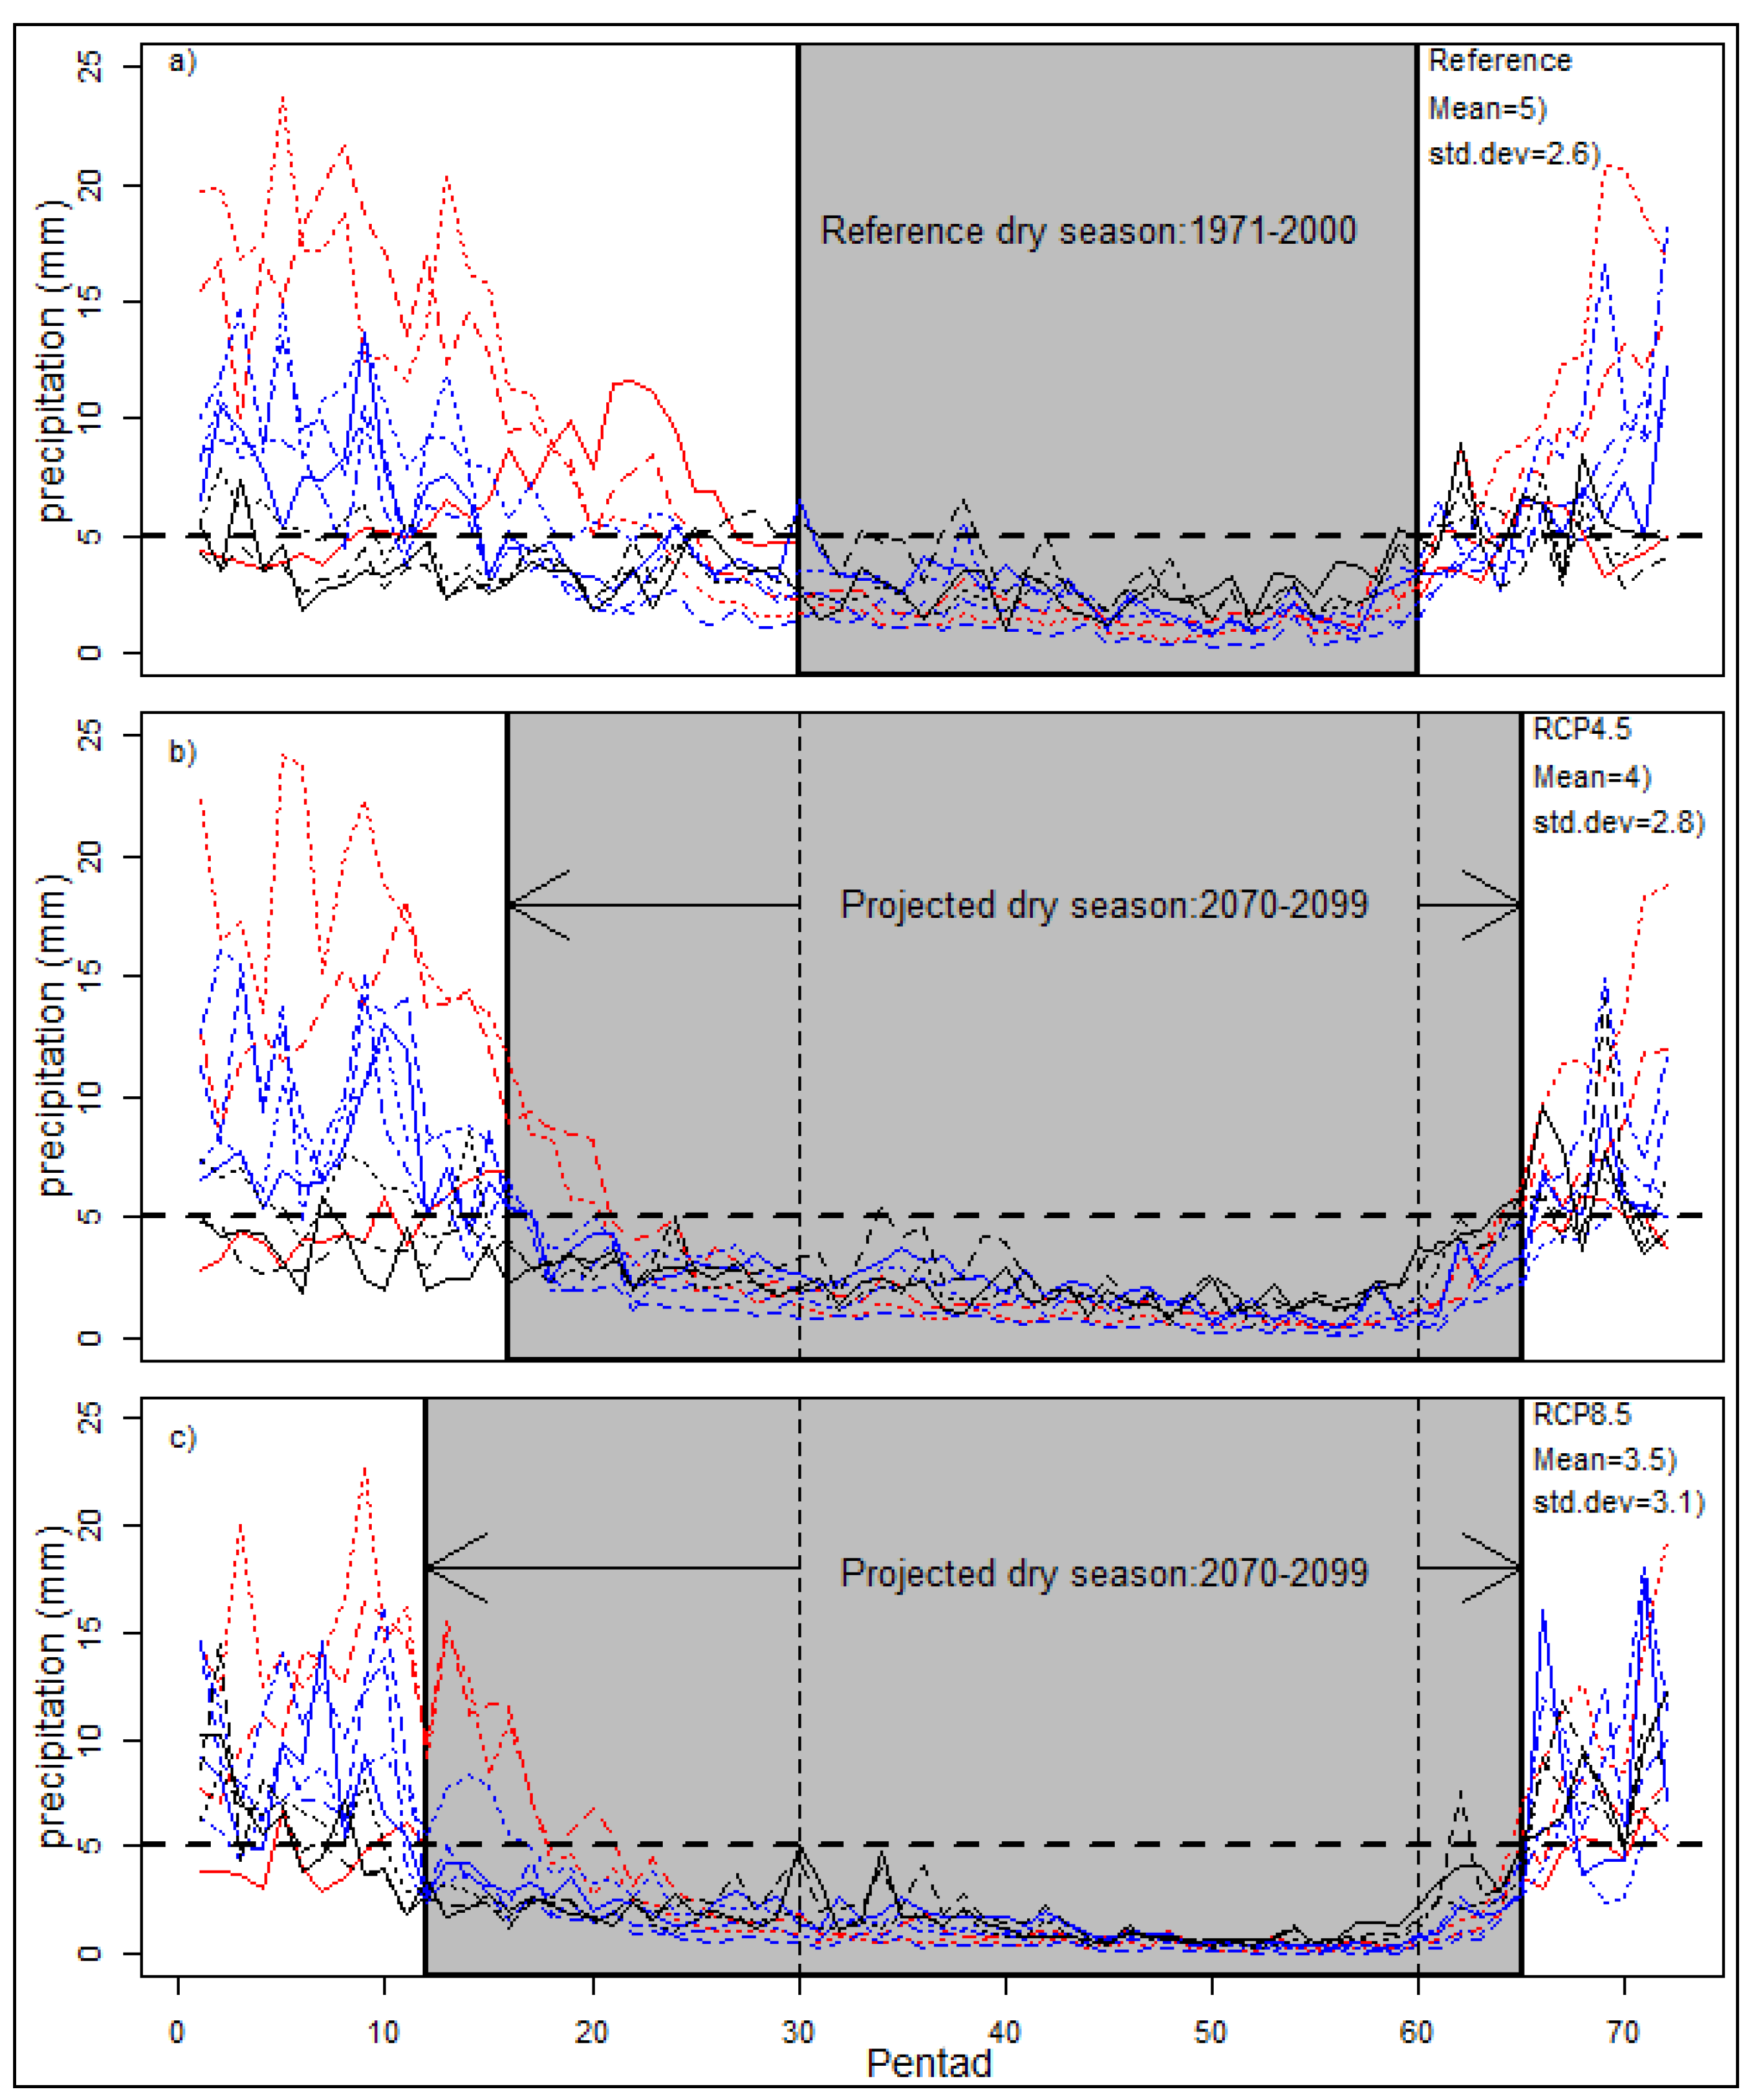
Figure 4.
The mean estimated onset and end dates of the rainy season in Mozambique, for present (1971-200) and under RCP4.5 and RCP8.5 scenarios, based on pentad climatology of precipitation. Vertical dashed arrows indicate the start and end dates of rainy season.
Figure 4.
The mean estimated onset and end dates of the rainy season in Mozambique, for present (1971-200) and under RCP4.5 and RCP8.5 scenarios, based on pentad climatology of precipitation. Vertical dashed arrows indicate the start and end dates of rainy season.
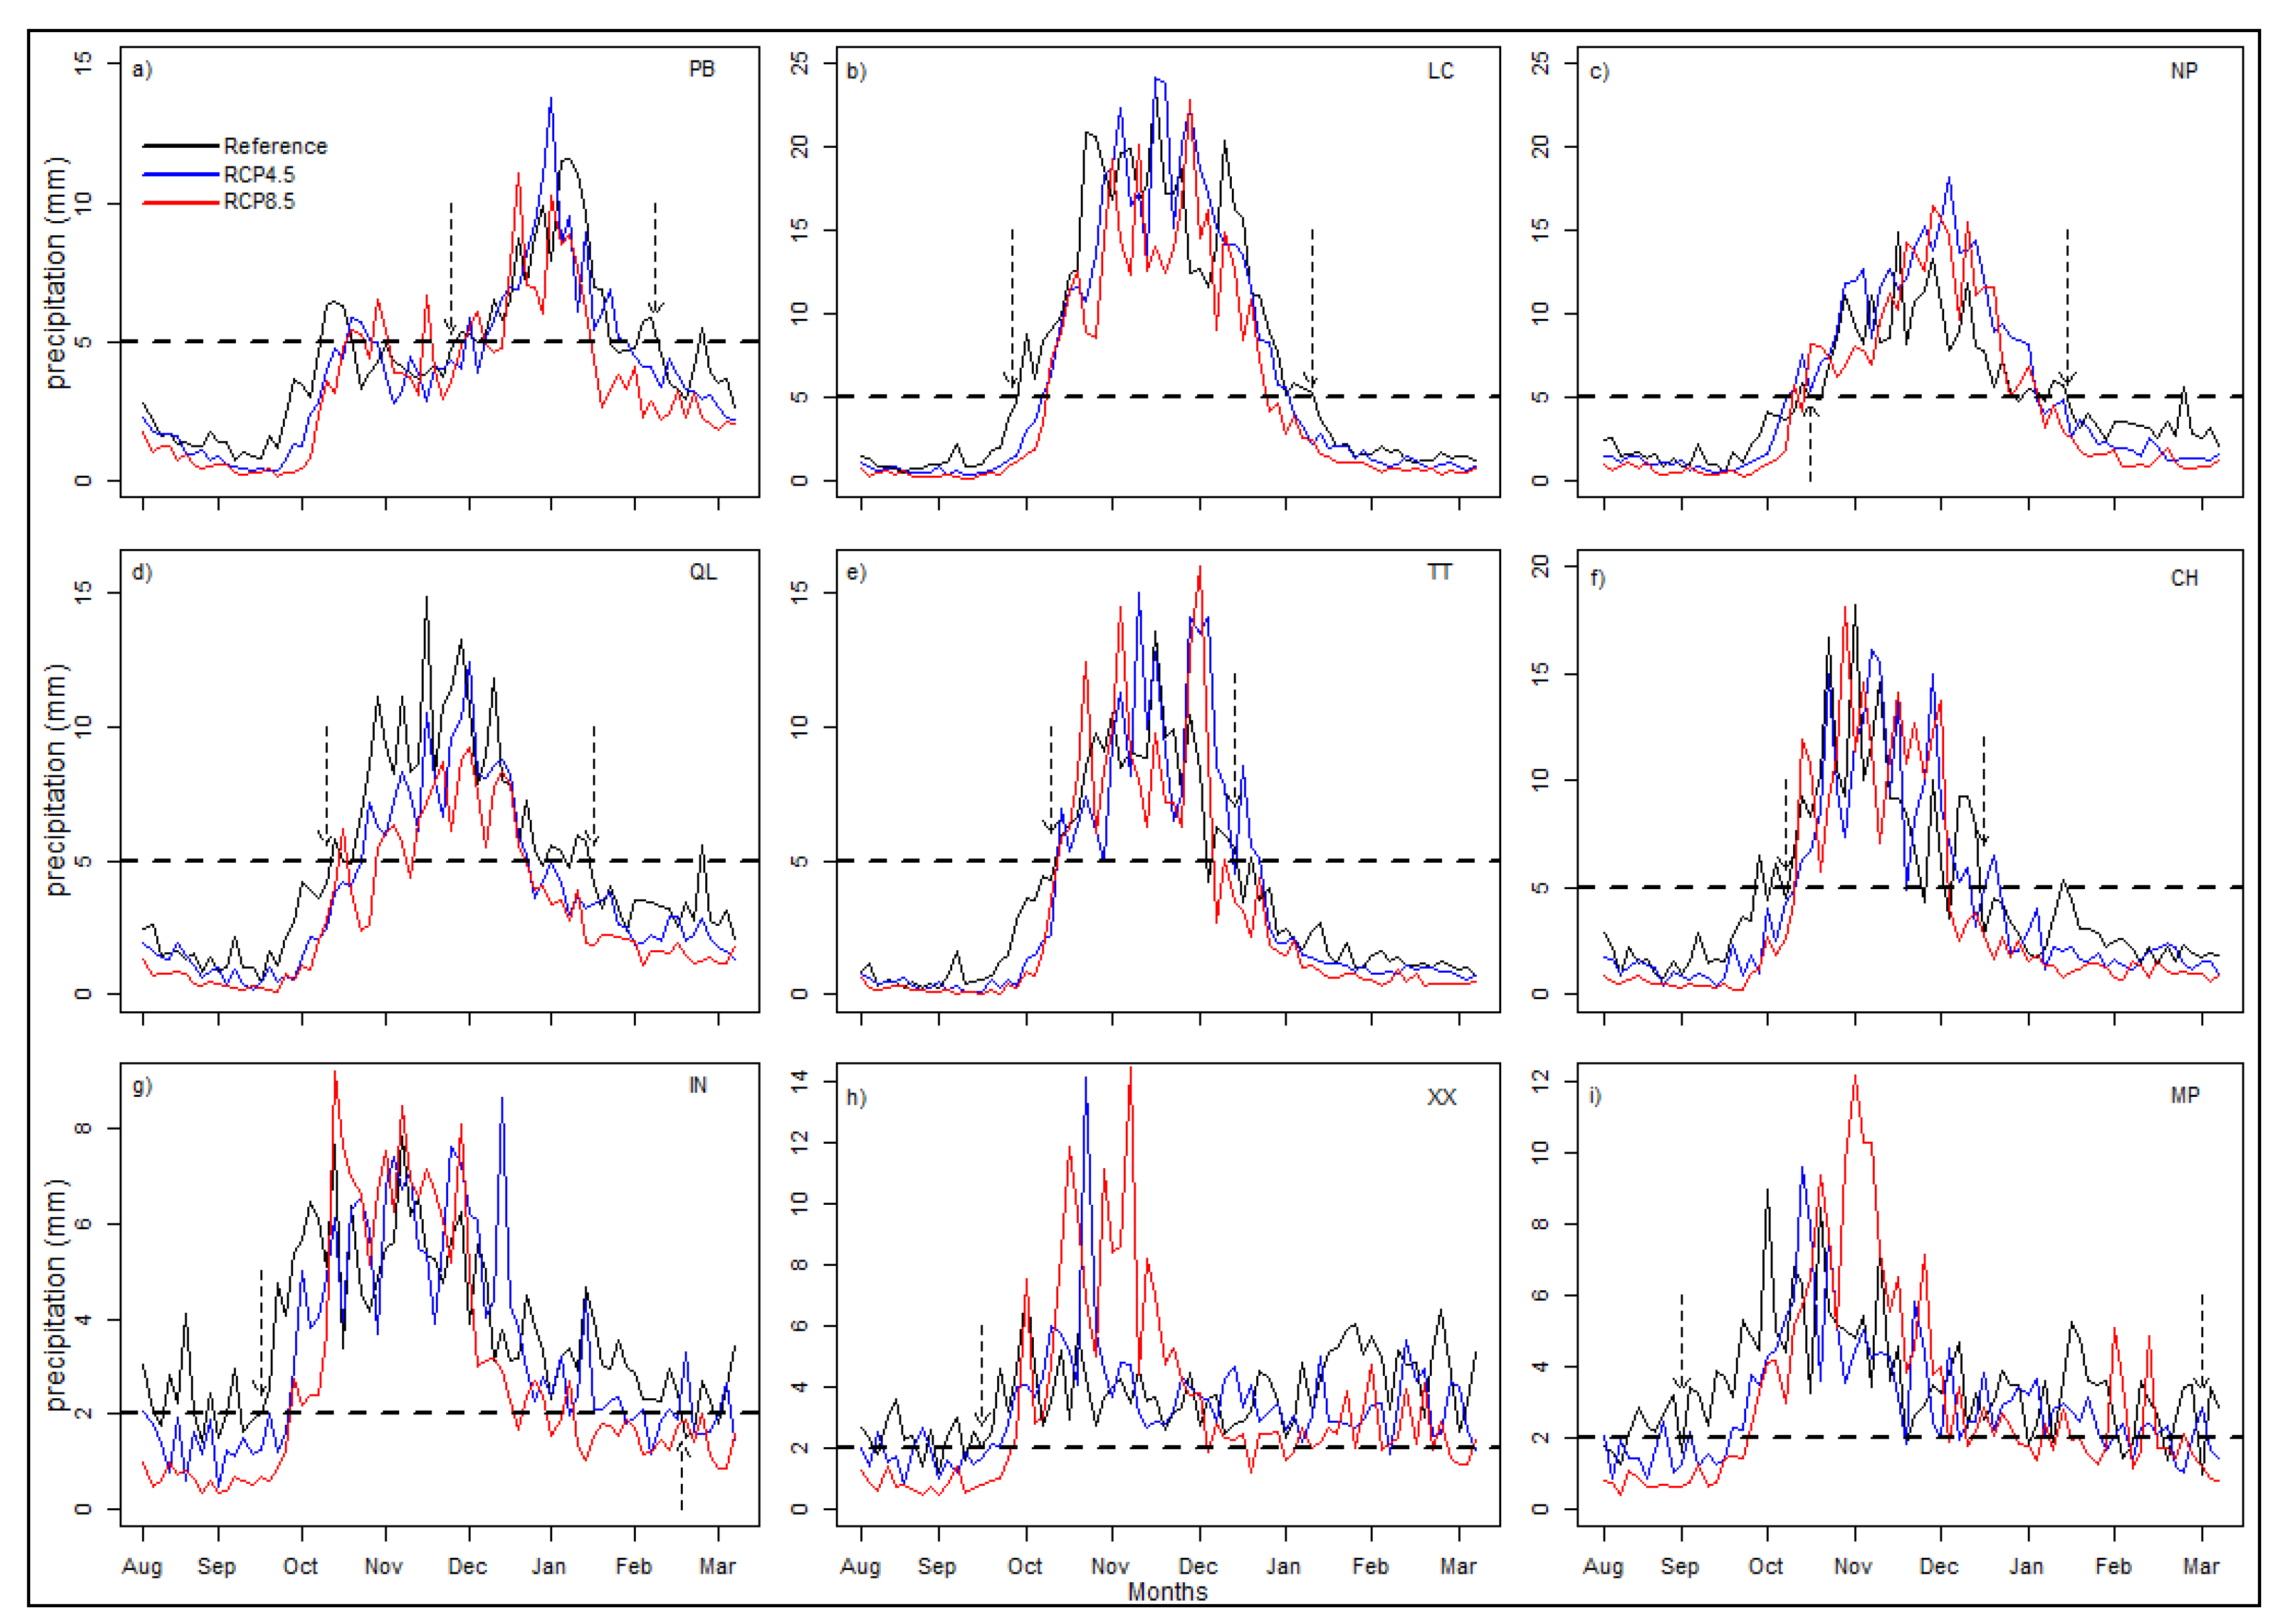
Figure 5.
Mean pentad precipitation during extended summer season (ONDJFM) for reference period (1971-2000).
Figure 5.
Mean pentad precipitation during extended summer season (ONDJFM) for reference period (1971-2000).
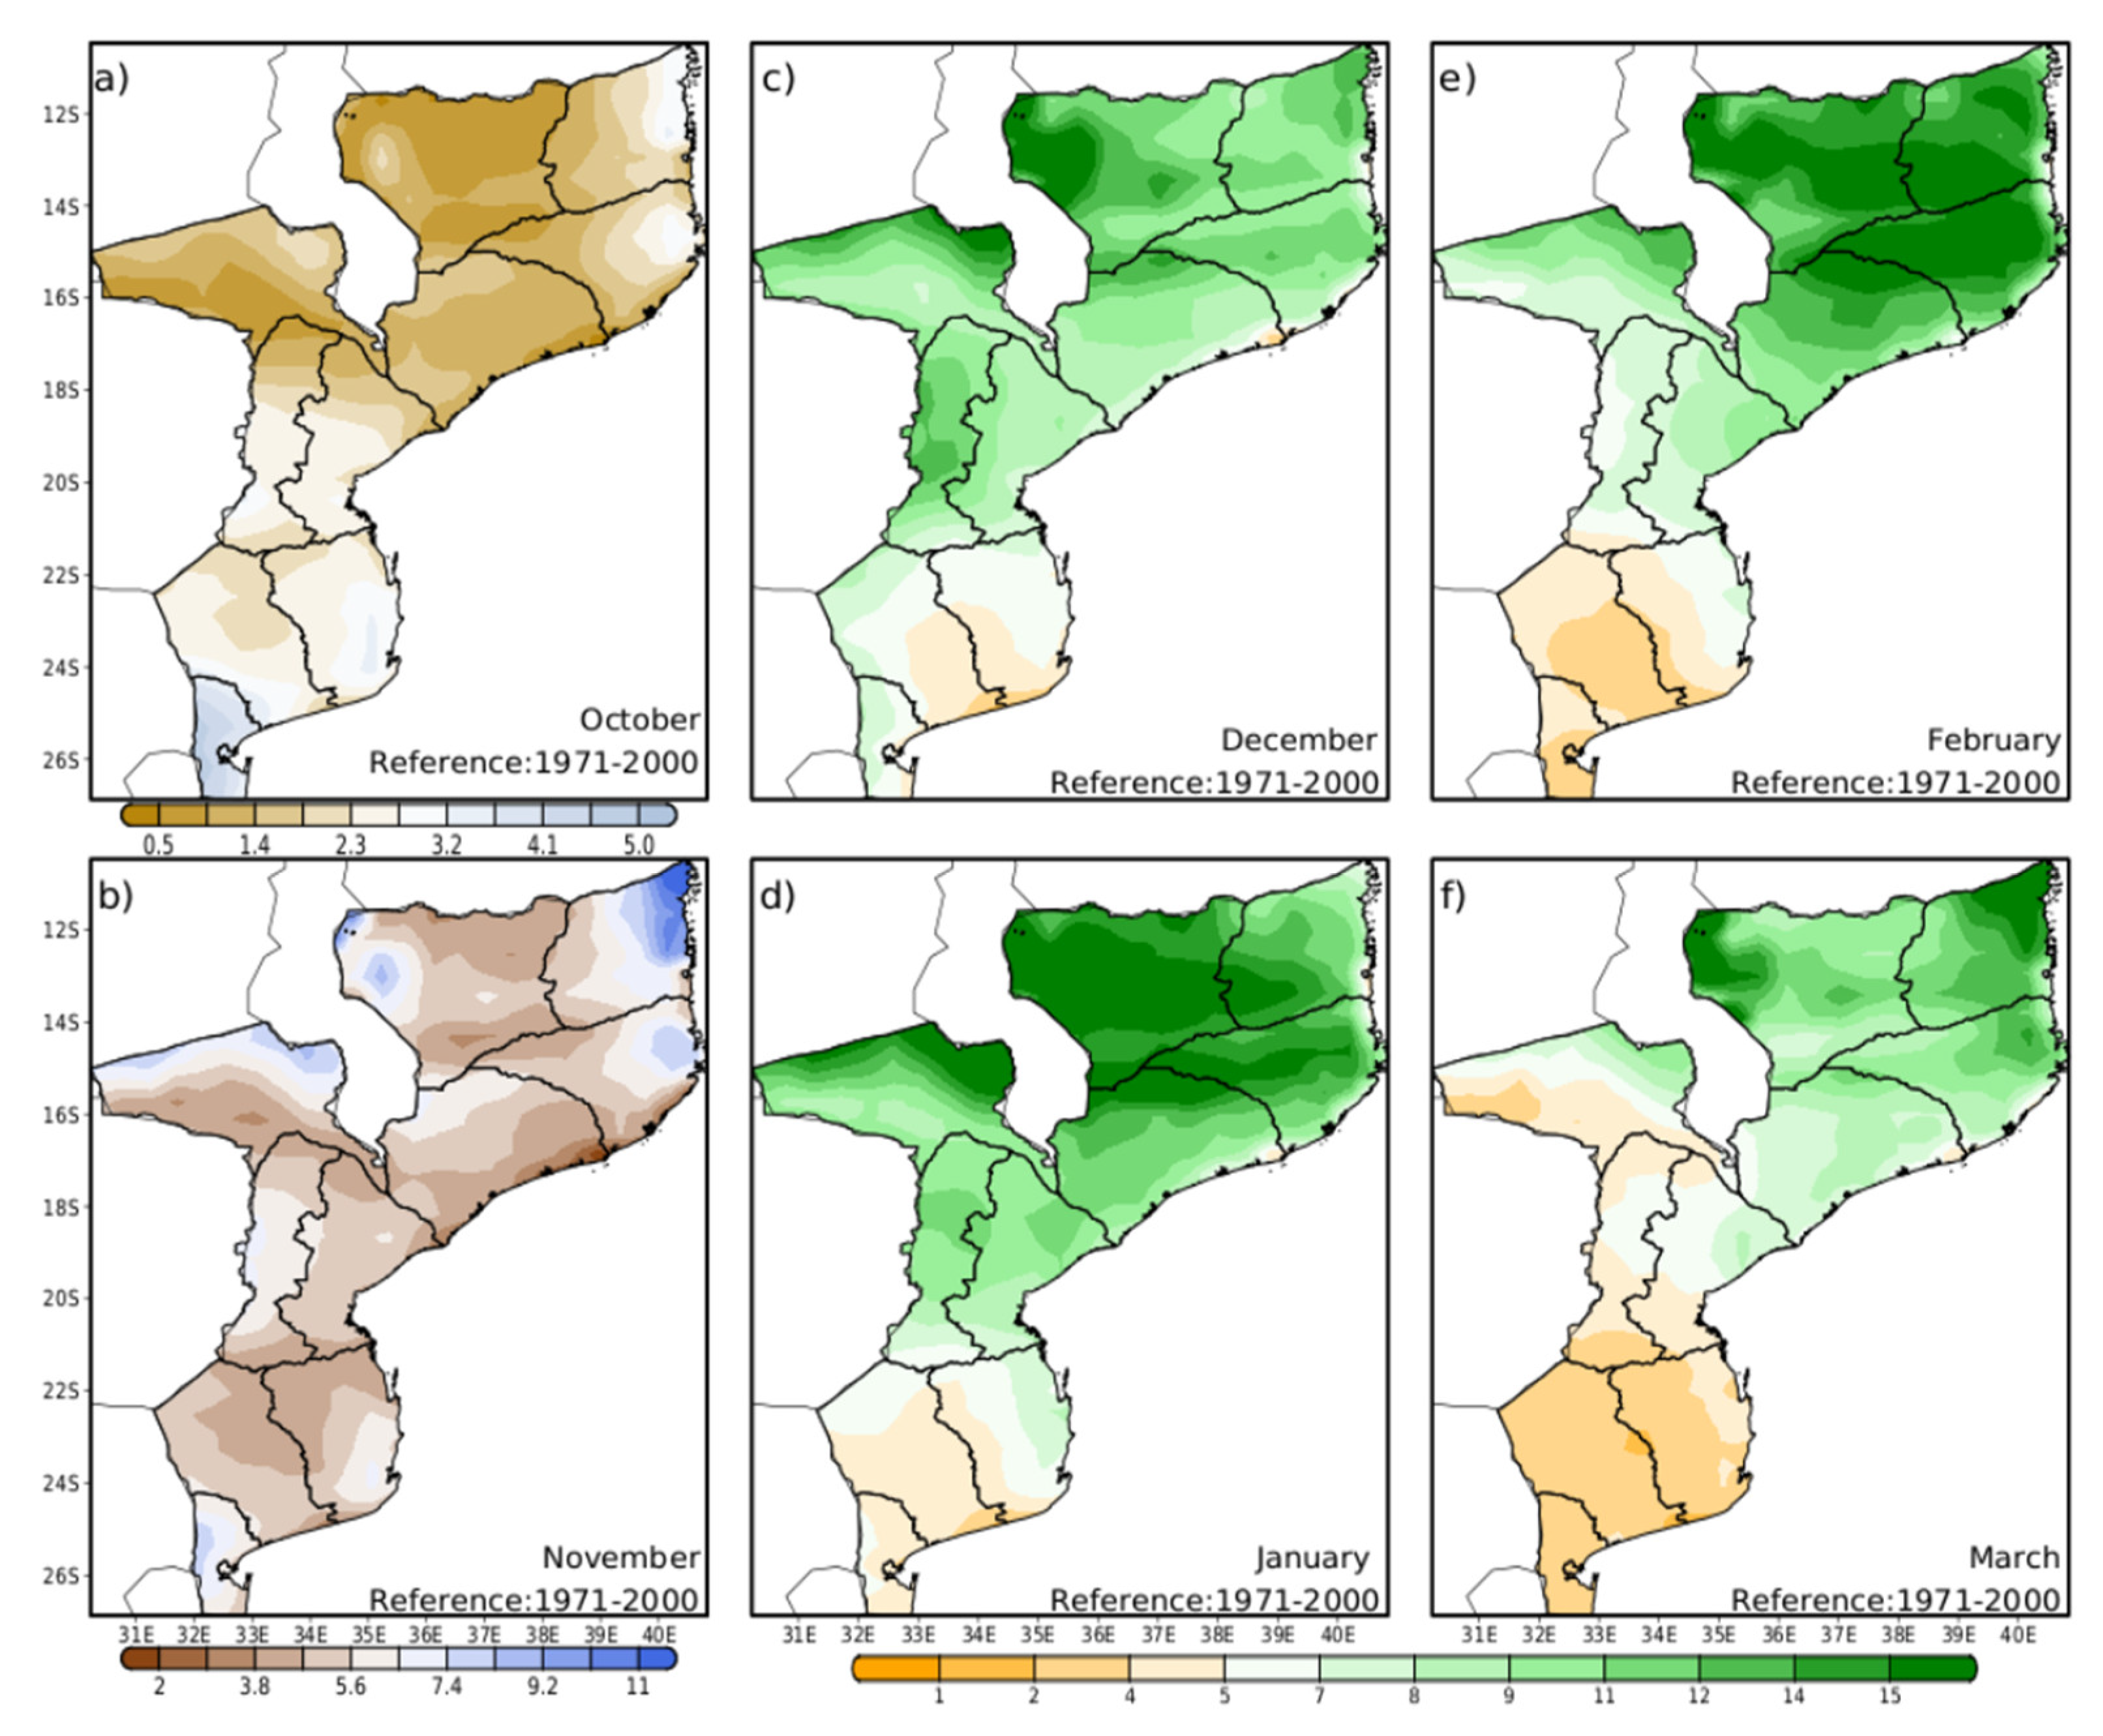
Figure 6.
Same as in Figure 5 but for Representative Concentration Pathways (RCP4.5 and RCP8.5).
Figure 6.
Same as in Figure 5 but for Representative Concentration Pathways (RCP4.5 and RCP8.5).
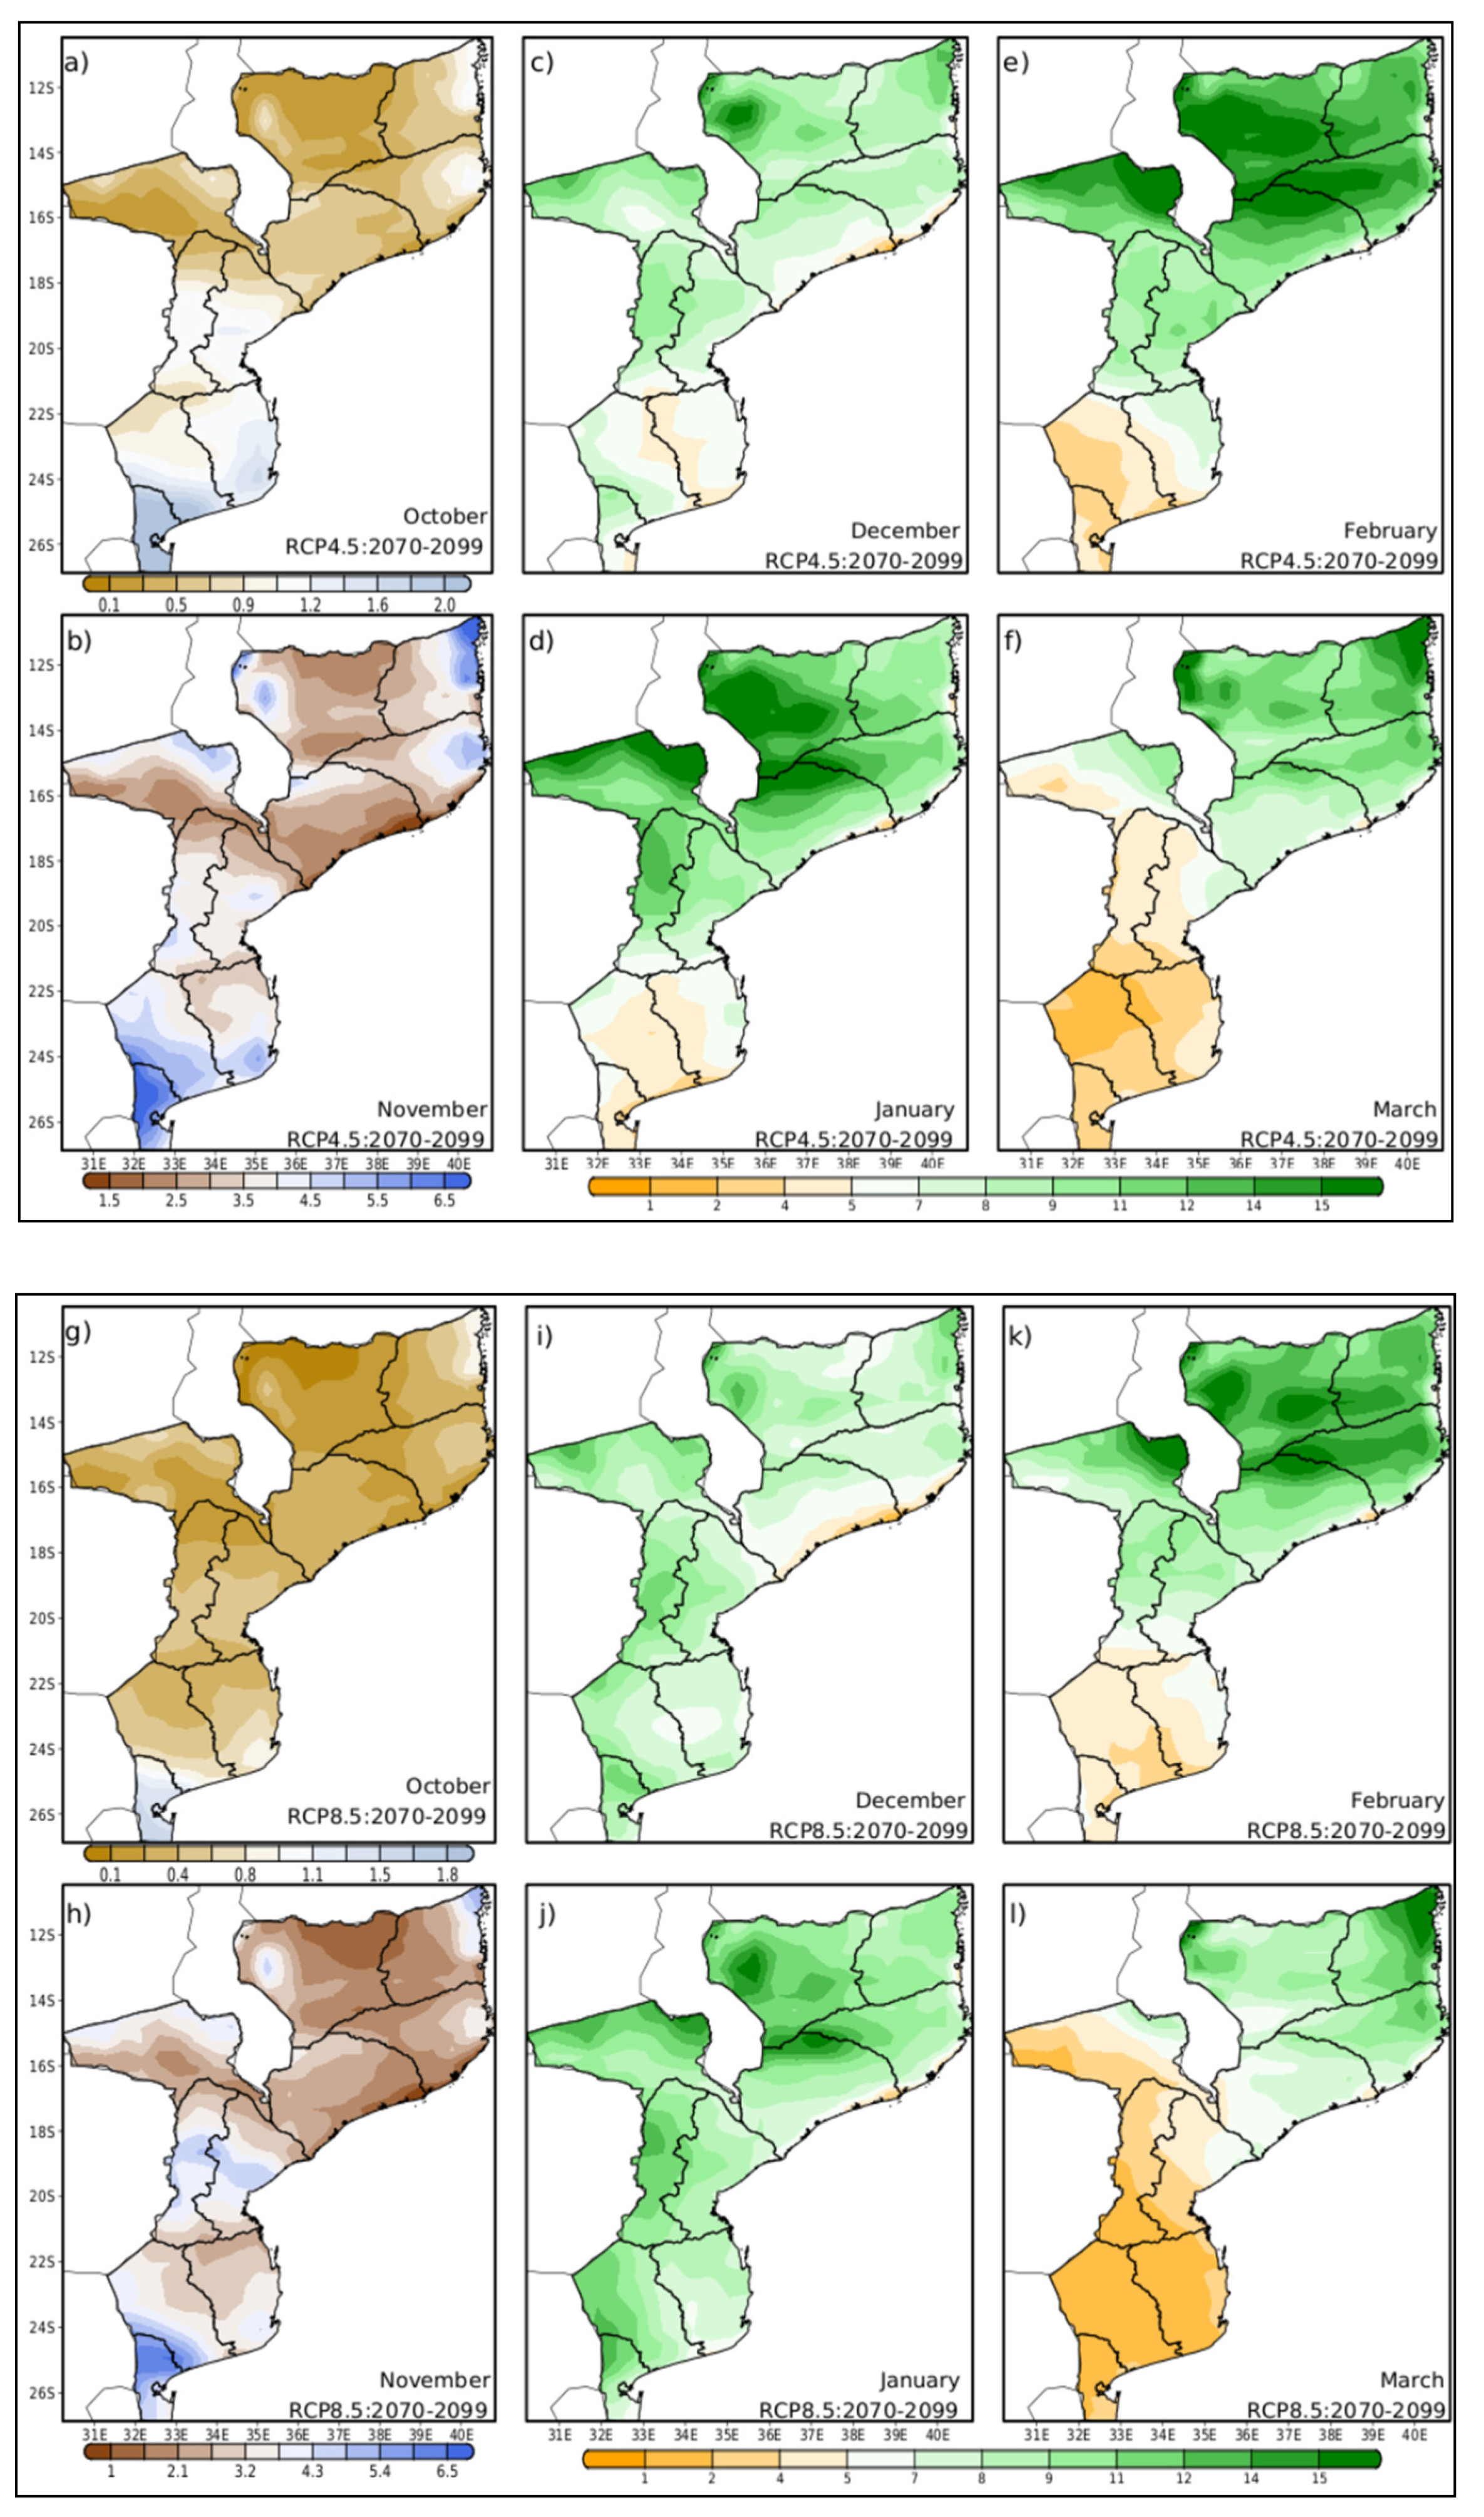
Figure 7.
The consecutive dry days (cdd) and consecutive warm days (cwd) are presented. The cdd and cwd indexes were made for extended austral summer season (from October to March, represented as OND and JFM). The largest number of cdd and cwd of a daily time series were divide by 100.
Figure 7.
The consecutive dry days (cdd) and consecutive warm days (cwd) are presented. The cdd and cwd indexes were made for extended austral summer season (from October to March, represented as OND and JFM). The largest number of cdd and cwd of a daily time series were divide by 100.
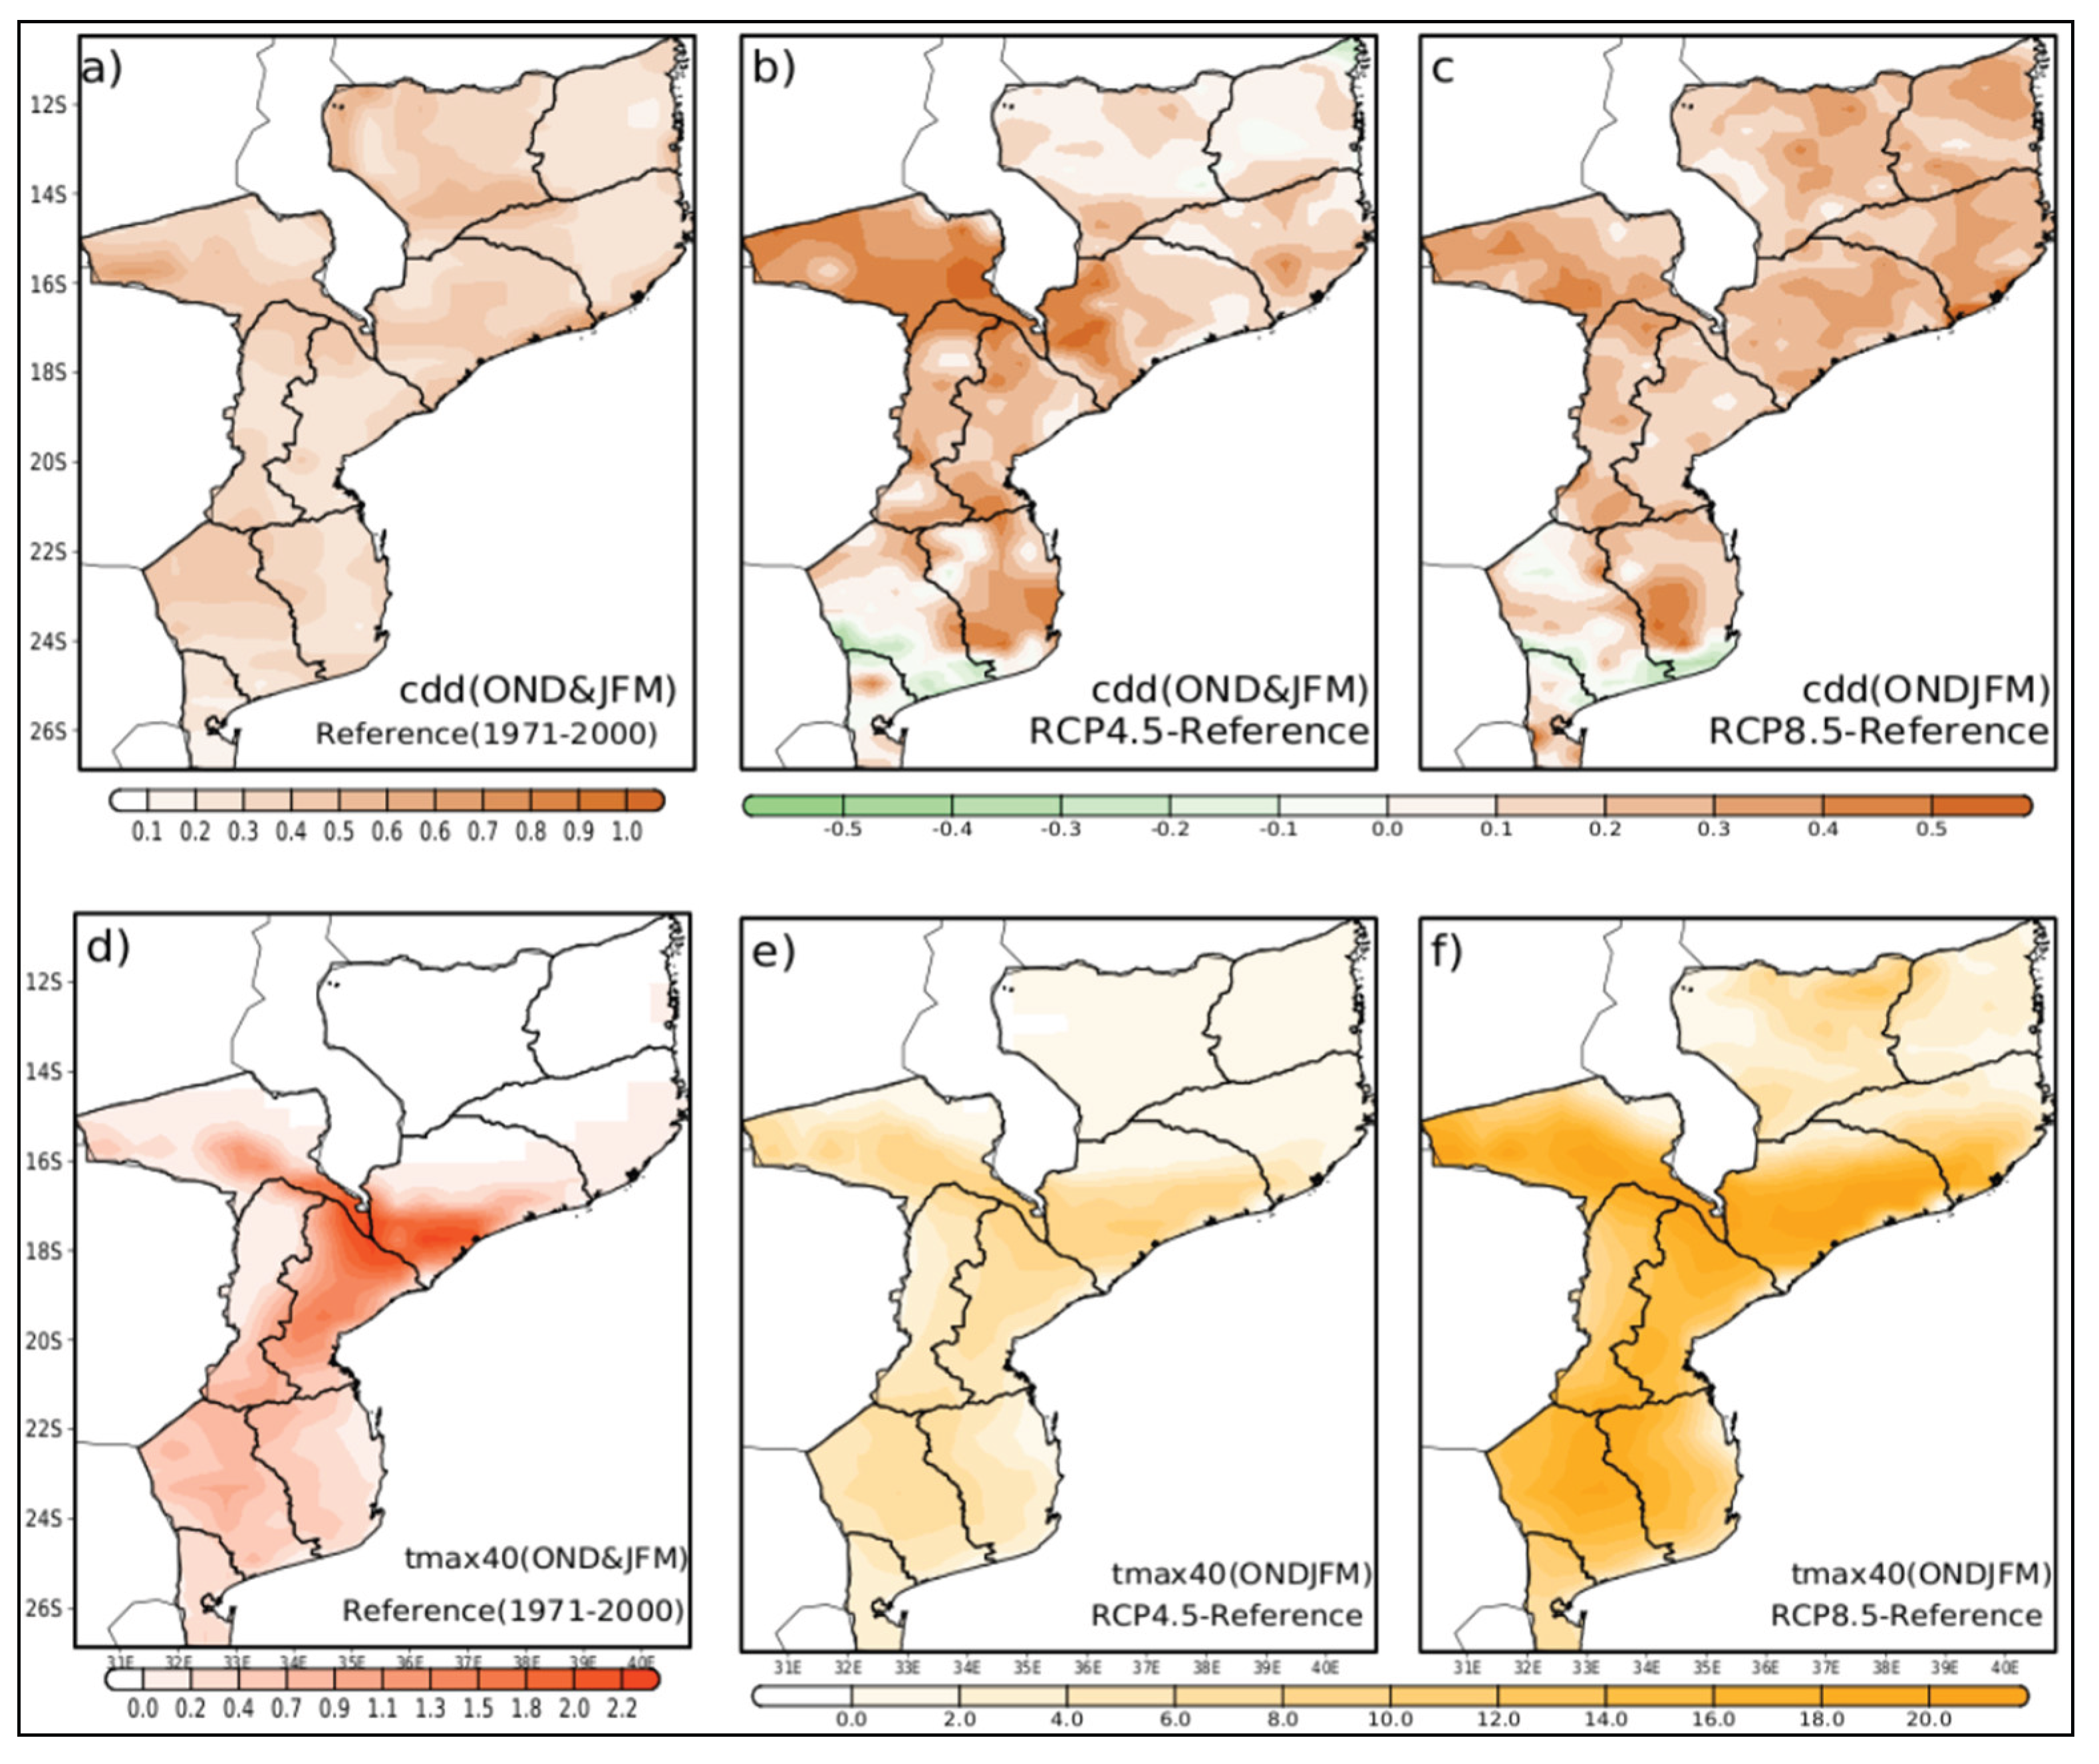

Table 1.
List of the pentad number and corresponding calendar days, used to analyze the annual and seasonal spatio-temporal variability of precipitation in study domain.
Table 1.
List of the pentad number and corresponding calendar days, used to analyze the annual and seasonal spatio-temporal variability of precipitation in study domain.
 |
Disclaimer/Publisher’s Note: The statements, opinions and data contained in all publications are solely those of the individual author(s) and contributor(s) and not of MDPI and/or the editor(s). MDPI and/or the editor(s) disclaim responsibility for any injury to people or property resulting from any ideas, methods, instructions or products referred to in the content. |
© 2025 by the authors. Licensee MDPI, Basel, Switzerland. This article is an open access article distributed under the terms and conditions of the Creative Commons Attribution (CC BY) license (http://creativecommons.org/licenses/by/4.0/).
Copyright: This open access article is published under a Creative Commons CC BY 4.0 license, which permit the free download, distribution, and reuse, provided that the author and preprint are cited in any reuse.


