Submitted:
30 September 2025
Posted:
01 October 2025
You are already at the latest version
Abstract
Factor V (FV) Leiden and F2 G20210A are inherited genetic risk factors that are in the first line of laboratory tests for thromboembolic diseases. Their detection relies on PCR assays that are subject to contamination as well as pipetting error when manually performed and require individual assays for each gene. In this article, we report an im-proved PCR and restriction endonuclease assay for the simultaneous detection of the FV Leiden and F2 G20210A variants, based on multiplex amplification with fluores-cent primers, digestion control, identity monitoring, and contamination tracking.
Keywords:
molecular diagnosis
; venous thromboembolism
; genetic risk factors
; FV Leiden
; F2 G20210A
; restriction fragment length polymorphism
; contamination detection
1. Introduction
Factor V (FV) Leiden (F5:c.1601G>A, p.Arg534Gln) and F2 G20210A (F2:c.*97G>A) are inherited genetic risk factors that are in the first line of laboratory tests for thromboembolic diseases [1,2,3,4].
The initial methods for FV Leiden and F2 G20210A testing relied on restriction endonuclease digestion assays [5,6]. The FV Leiden variant suppresses an MnlI cleavage site whereas the F2 G20210A variant creates a HindIII site, provided that mutagenic primers are used. As there is no second HindIII site in the vicinity, digestion control can be added to the polymerase chain reaction (PCR) [7].
In this article, we report an improved PCR and restriction endonuclease assay for the simultaneous detection of FV Leiden and F2 G20210A variants, based on multiplex amplification with fluorescent primers of F5 exon 10, F2 3’UTR, fibrinogen alpha gene (FGA) intron 1 for HindIII digestion control, and two short tandem repeats ([STRs] (SE33 and FGA), for identity monitoring and contamination tracking.
2. Results
2.1. Primer Design, Initial Set up and Validation
The F5 exon 10 segment was amplified with the primers described in Table 1. The PCR fragment also carries a mandatory additional MnlI site used as an internal digestion control.
Table 1 footer: The mutagenic base in the lower F2 primer is presented with underlined bold characters. As primers were chosen to generate fragments with markedly different sizes, many fluorochrome combinations are possible. The one reported in this article uses a combination of PET, VIC FAM, and NED, but ATTO 565, Yakima Yellow, FAM and ATTO 550 (respectively red, green, blue and black with the Applied G5 filter) would be an equivalent combination.
The HindIII site specific to the F2 G20210A variant was created by a mutagenic primer as previously described [6,7]. The upper primer was repositioned to avoid amplification of an MnlI site. Because the putative HindIII restriction site is unique in the F2 amplified fragment, undigested fragments might result from accidentally undigested fragments rather than from the absence of restriction sites.
For HindIII control fragment amplification, the primers described in [7] could not be used because of the presence of an MnlI site in the PCR product. An FGA intron 1 fragment carrying a mandatory HindIII site and no MnlI site was added to the multiplex PCR as a HindIII digestion control.
The FGA and SE33 STRs (GenBank accession M64982 and V00481) are complex tetranucleotide repeats initially described in DNA fingerprinting applications. Primers were as described in https://strbase-archive.nist.gov/str_SE33.htm and https://strbase-archive.nist.gov/str_fga.htm, last accessed on October 18, 2024. With the chosen primers, MnlI cuts the STR of FGA. To overcome this difficulty, the fluorescent labeling was located on the upper primer, still allowing fluorescent STR analysis after MnlI digestion.
Amplifications (MasterMix PCR AmpliTaq Gold360 from Thermofisher Scientific, Waltham, MA) were performed in a final volume of 10µL. Each primer pair was tested in individual reactions on control DNAs before being mixed in multiplex reactions. After testing the initial mix, we concluded that it was necessary to adjust individual primer pair concentrations to limit unbalanced amplification (see Table 1). Co-digestions were performed with MnlI and HindIII (1 and 3UI/µL final, respectively) from 2 hours to overnight at 37°C in the universal buffer provided by the manufacturer.
2.2. Accuracy
No discrepancy was observed on a sample series analyzed by dideoxy sequencing or next-generation sequencing, and the improved RFLP method described in this article (heterozygous F2 G20210A n=14 cases, none of the variants n=31 cases, homozygous FV Leiden n=1 case, and heterozygous FV Leiden n=16 cases).
2.3. Sensitivity
DNA concentration was determined photometrically. DNA from two individuals were diluted stepwise in sterile water, to concentrations corresponding to 2, 4, 8, 16, 32, 64, 128, and 256ng in the 10µL PCR. Under these conditions, with as low as 2ng of input DNA, all peaks were in the 250-32,000 relative fluorescent units (RFU) range, 32,000 RFU being the saturation limit and 250 RFU the arbitrary detection threshold. When DNAs were in the 15-70ng range per 10µL reaction, which is what is usually achieved with 2µL of DNA extracted using fast extraction protocols, such as the QuickGene Blood DNA extraction kit from Qiagen, Hilden, Germany (expected value in the 25ng/µL range), or the Maxwell RSC whole Blood DNA kit (expected values in the 30-70ng/µL range), satisfactory signal height and peak balance were obtained for 28 cycle amplifications (see Table 1 for amplification conditions). Thus, after initial set up experiments, DNA concentration was no longer measured and DNA input was set to 2µL, regardless of the actual concentration. A representative electrophoresis is presented in Figure 1.
2.4. Additional Validation Steps
Incomplete digestion tracking was performed by checking the absence of 288 and 339 bp fragments for undigested MnlI and HindIII PCR fragments (Figures 1A and B).
Inter-assay reproducibility was controlled by adding the same control DNAs to each assay (one individual carrying both heterozygous variants and one individual homozygous with the FV Leiden variant).
As required by the ISO 15189 certification, other validation steps were performed as recommended https://tools.cofrac.fr/documentation/SH-REF-02-2022.
2.5. Contamination Detection and Stutter Peaks
FGA and SE33 STRs were chosen because of their high heterozygosity percentage and high allelic heterogeneity rate. For FGA, there are over 28 known alleles ranging from 12.2 to 51.2 repeats and over 76 known alleles ranging from 7 to 39.2 repeats for SE33. The random match probability for the combination of the most frequent genotypes is in the 0.0005 range with these two STRs. Inclusion of such STRs in the multiplex mix enabled quality control and identity verifications. Moreover, duplicate distribution of a given sample instead of two different samples would be detected. STR co-amplification allowed contamination detection by highlighting any additional STR peak (Figure 1C and ID), regardless of the mechanism involved, whereas traditional methods would only detect reagent contaminations through signal presence in the blank control reaction.
This method amplifies STR-generated artifact stutter peaks in strict repetitive patterns to a size equivalent to alleles one repeat shorter than the respective allelic types. They result from polymerase slippage during template amplification [8]. In a series of 30 individuals randomly selected in six different assays, stutter heights were 7.6±1.8% and 7.6±1.6% of the allele height for FGA and SE33, respectively (mean ± standard deviation [SD]). Thus, in ongoing assays, any stutter peak above the mean +2SD (i.e., 11%) values will be considered as resulting from contamination.
To assess the potential for contamination detection, two DNA samples were mixed (1:4; 1:10, and 1:20) and analyzed. Amplifications were performed with 25ng of DNA mix. Mixed DNAs at 1:20 ratio allowed contamination identification either by additional STR alleles (Figure 1C and 1D) or by a stutter size above the expected value. Further dilutions generate peaks below the interpretation limit (250 RFU).
2.2. Figure 1 Undigested sample, double heterozygous sample, and contaminated sample.
Figure 1.
Undigested sample, double heterozygous sample, and contaminated sample.
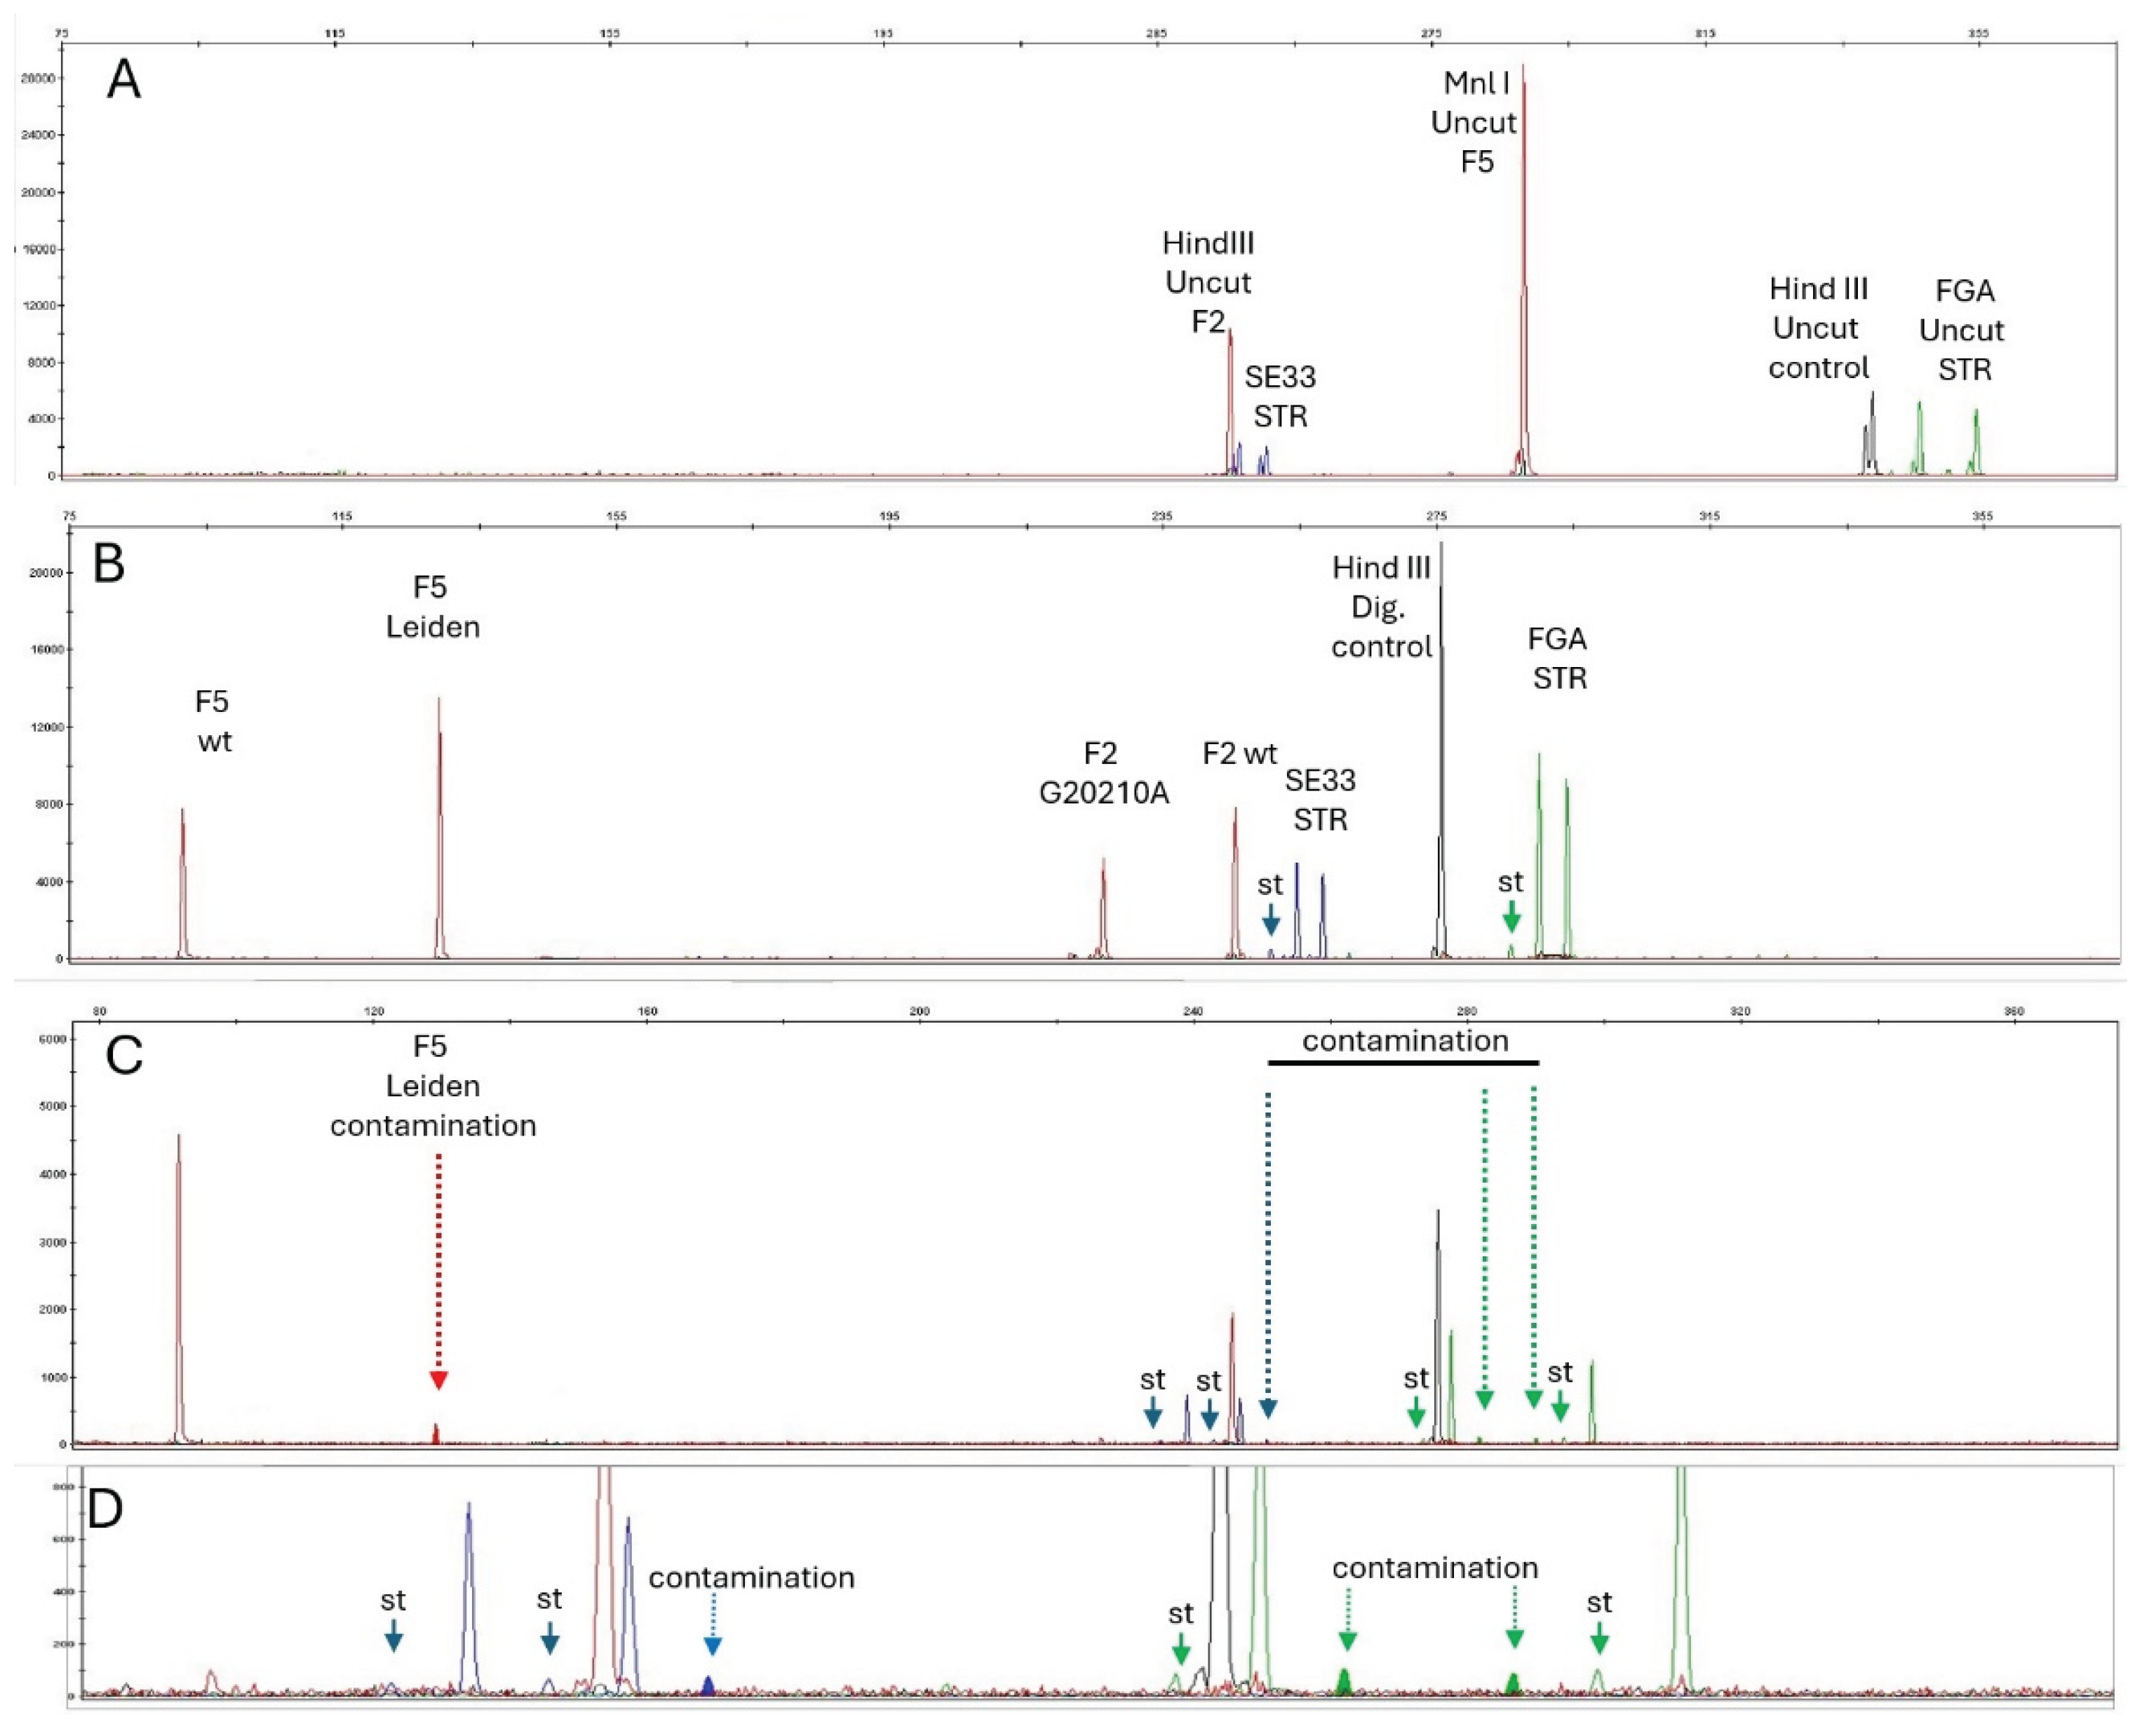
One mL of polymerase chain reaction (PCR) product was added to 9μL Hi-Di formamide (Applied Biosystems) and 0.5μL size standard (GS™-LIZ® 600, Applied Biosystems), and then loaded onto a capillary electrophoresis apparatus (Applied Biosystems 3500 xL Dx).
Panel A. Undigested PCR sample: the undigested HindIII NED-labeled control fragment is present (Hind III Uncut control, in black), as well as the MnlI undigested FV fragment (MnlI Uncut F5, in red).
Panel B. Electropherogram of a double heterozygous sample (FV Leiden +/- and F2 G20210A +/-). A: PET-labeled F2 and F5 fragments (red) digested with Mnl I and Hind III, respectively, and NED-labeled FGA intron I (green) for Hind III digestion control (expected size 275 bp for digested PCR fragment). Uncut FGA intron 1 fragment would be 339 pb and uncut FV fragment would be 288 pb, they are both absent. The different size for VIC-labeled PCR products (FGA STR alleles, green) and 6-FAM-labeled PCR products (SE33 STR alleles, blue) in panels A to C reflects the different sample genotypes. Stutters (st) are indicated by plain arrows.
Panel C: Experimental dilution 1:20 of a heterozygous FV Leiden individual's DNA into a wild-type DNA. The DNA sample used for experimental contamination was deliberately chosen to carry the FV-Leiden variant. The FV Leiden+/- and F2 G20210A -/- was mixed (1:20 ratio) in a FV-Leiden-/- and F2 G20210A -/- DNA sample. Stutters are indicated by plain arrows. Dotted arrows show peaks resulting from contamination.
Panel D: Zoom in on contamination and stutter peaks. Definitive contamination proof is provided by panel D analysis: contamination is detected by the presence of extra FGA and SE33 peaks (plain line arrows). Extra STR alleles are present (long arrow) and correspond to the FGA and SE33 alleles from the contaminating DNA. Of note, any contaminating allele the size of the stutter (in base pair) would be superimposed on the stutter peak. It would be detected because of the size above the expected stutter size (11% of main peak).
3. Discussion
This method is affordable, easy to set up in any laboratory, specific, and sensitive. In essence, the modifications involved the detection in a single PCR of F2 G20210A and FV Leiden genotypes in multiplex amplification with modified primers to overcome cross digestions. This method reduces the mistyping risk, either by contamination or interference with other SNPs. Addition of internal control for digestion and STR co-amplification enables contamination detection and possible sample mix-ups. These advantages overcome the disadvantage of the method being a three-step assay (amplification, digestion, and electrophoresis) compared to single-step TaqMan-based assays. This method has another limitation as it requires a very high PCR product detection sensitivity and sizing accuracy. One of the major advantages of capillary electrophoresis is its precision in distinguishing fragment sizes differing by as few as a single base pair. This is mandatory when dealing with STRs. Moreover, contamination, whose detection is an important improvement of the present method, may be undetected if agarose gel electrophoresis is used instead. Although methods must always be adjusted to each laboratory, the process reported in this article may be useful for other laboratories wishing to adapt this assay.
In conclusion, FV Leiden and F2 G20210A are inherited genetic risk factors that are in the first line of laboratory tests for thromboembolic diseases. Detection of FV Leiden and F2 G20210A relies on PCR assays that are subject to contamination and pipetting errors. The present report describes a multiplex assay for co-amplification of FV Leiden and F2 G20210A. Additional co-amplified controls detect digestion failure. Microsatellites in the PCR enables detection of contamination and identity errors.
4. Materials and Methods
DNA Samples were from patients that were referred for FV Leiden and F2 G20210A detection by the standard procedure in the lab [5,7]. All patients signed an informed consent allowing using their DNA for method setup and research.
All genotypes were confirmed by dideoxy-sequencing. Primers for amplification and Sanger sequencing were 5’aca tgg tta agg cct gtt gc and 5’gcc aca tct ggc ttg aaa tt for F5 exon 10, and 5’tgg caa ggg taa aca gat cc and 5’ctc agg cac tcc tct caa cc for F2 3’UTR. Amplifications were performed with AmpliTaq Gold 360 mastermix (Applied Biosystems). Sequencing was performed with the BigDye Terminator reagents (v.1.1 cycle sequencing RR-100) according to manufacturer protocols and loaded onto a capillary electrophoresis apparatus (Applied Biosystems 3500 xL Dx).
Design of the PCR restriction fragment length polymorphism (RFLP)-based method: Primers were designed with the primer3 software (http://biotools.umassmed.edu/bioapps/primer3_www.cgi, last accessed on May 20, 2020) and carefully chosen among the proposed sets, based on the absence (or very low frequency) of single nucleotide polymorphisms (SNPs) in the hybridization sequences at the 3’ end of the primers. Primers were chosen to hybridize with SNP-free sequences or in the 0.0005 frequency range (dbSNP 2.0 Build 153 v2 in https://www.ncbi.nlm.nih.gov/gene/2153 and https://www.ncbi.nlm.nih.gov/gene/2147, last accessed on May 20, 2020).
PCR conditions and digestion were as follows: Amplifications (MasterMix PCR AmpliTaq Gold360 from Thermofisher Scientific, Waltham, MA) were performed in a 10µL final volume with 15-50ng DNA per tube. Primer sequences and concentrations were as indicated in the table. Initial denaturation at 95°C for 10 minutes was followed by 28 annealing cycles at 60°C for 30 seconds, extension at 72°C for 60 seconds, and denaturation at 95°C for 30 seconds with a final round at 72°C for 7 minutes. Digestion was carried out overnight with MnlI and HindIII (1 and 3UI/µL final, respectively).
Co-digestion was optimized by choosing a manufacturer carrying both enzymes and a universal digestion buffer (New England Biolabs, Evry, France). The enzymes and buffer were premixed prior to distribution to lower the pipetting error risk. Allele calling was performed with GeneMapper® Software version 5.0 (Applied Biosystems).
Author Contributions
P. de Mazancourt participated in study conception and design. JP. Rabes did the biological validation and participated in study conception. S. Grey, E. Alabre, and M. Keita performed the analysis and interpretated the data. All authors contributed to the drafting of the paper and gave their final approval on the version to be published. All authors agree to be accountable for all aspects of the work.
Funding
This research was funded by APHP, UVSQ, UMR1179 and Adenosine.
Institutional Review Board Statement
The study did not require ethical approval as it is a non-interventional study performed on samples that were taken for this specific analysis with another method. The study was conducted in accordance with the Declaration of Helsinki.
Informed Consent Statement
Informed consent was obtained from all subjects involved in the study The present analysis was performed on DNA samples from patients that signed an informed consent allowing using their DNA for method setup and research.
Conflicts of Interest
The authors declare no conflicts of interest. The funders had no role in the design of the study, in the collection, analyses, or interpretation of data; in the writing of the manuscript; or in the decision to publish the results.
References
- T. Baglin, E. Gray, M. Greaves, B.J. Hunt, D. Keeling, S. Machin, I. Mackie, M. Makris, T. Nokes, D. Perry, R.C. Tait, I. Walker, H. Watson, British Committee for Standards in Haematology, Clinical guidelines for testing for heritable thrombophilia, Br. J. Haematol. (2010) 149, 209–220. [CrossRef]
- J.M. Connors, Thrombophilia Testing and Venous Thrombosis, N. Engl. J. Med. (2017) 377, 1177–1187. [CrossRef]
- G. Colucci, D.A. Tsakiris, Thrombophilia screening revisited: an issue of personalized medicine, J Thromb Thrombolysis (2020) 49, 618–629. [CrossRef]
- N. Gendron, D.M. Smadja, L. Mauge, Quand et quel bilan de thrombophilie réaliser ?, Archives Des Maladies Du Coeur et Des Vaisseaux - Pratique (2020) 2020, 15–18. [CrossRef]
- R.M. Bertina, B.P. Koeleman, T. Koster, F.R. Rosendaal, R.J. Dirven, H. de Ronde, P.A. van der Velden, P.H. Reitsma, Mutation in blood coagulation factor V associated with resistance to activated protein C, Nature (1994) 369, 64–67. [CrossRef]
- S.R. Poort, F.R. Rosendaal, P.H. Reitsma, R.M. Bertina, A common genetic variation in the 3’-untranslated region of the prothrombin gene is associated with elevated plasma prothrombin levels and an increase in venous thrombosis, Blood (1996) 88, 3698–3703.
- M. Raoul, F. Mathonnet, J.Y. Peltier, C. Collet, C. Boucly, G. Van Amerongen, B. Mathieu, E. Jaouen, P. de Mazancourt, An improved method for the detection of the G20210A transition in the prothrombin gene, Thromb. Res. (1997) 88, 441–443. [CrossRef]
- P.S. Walsh, N.J. Fildes, R. Reynolds, Sequence Analysis and Characterization of Stutter Products at the Tetranucleotide Repeat Locus VWA, Nucleic Acids Research (1996) 24, 2807–2812. [CrossRef]

Table 1.
Primers and polymerase chain reaction (PCR) conditions.
| PCR primers | 5’ label | Sequence (5’ -> 3’) | Final (µM) |
|---|---|---|---|
| F5 Exon 10 Upper | - | GGAACAACACCATGATCAGAGCA | 1 |
| F5 Exon 10 Lower | PET | TAGCCAGGAGACCTAACATGTTC | 1 |
| F2 3'UTR Upper | PET | GGTATCAAATGGGCATCGTC | 1 |
| F2 3'UTR Lower | - | ATAGCACTGGGAGCATTGAAGC | 1 |
| STR SE33 Upper | 6-FAM | AATCTGGGCGACAAGAGTGA | 2 |
| STR SE33 Lower | - | ACATCTCCCCTACCGCTATA | 2 |
| STR FGA Upper | VIC | GGCTGCAGGGCATAACATTA | 1 |
| STR FGA Lower | - | ATTCTATGACTTTGCGCTTCAGGA | 1 |
| FGA intron 1 Upper | NED | ACTGAAGCAGCAATTACAGGAG | 2 |
| FGA intron 1 Lower | - | AAGTCCCCAGGAAGAGATGG | 2 |
Disclaimer/Publisher’s Note: The statements, opinions and data contained in all publications are solely those of the individual author(s) and contributor(s) and not of MDPI and/or the editor(s). MDPI and/or the editor(s) disclaim responsibility for any injury to people or property resulting from any ideas, methods, instructions or products referred to in the content. |
© 2025 by the authors. Licensee MDPI, Basel, Switzerland. This article is an open access article distributed under the terms and conditions of the Creative Commons Attribution (CC BY) license (http://creativecommons.org/licenses/by/4.0/).
Copyright: This open access article is published under a Creative Commons CC BY 4.0 license, which permit the free download, distribution, and reuse, provided that the author and preprint are cited in any reuse.


