
Submitted:
30 September 2025
Posted:
01 October 2025
You are already at the latest version
Abstract
The tiny movements of parts of the polymer chains in polydimethylsiloxane (PDMS) affect how the material behaves. When zeolite particles are added, they change these movements. This change is important because it affects the overall performance of the final composite material, which can be useful in many industrial applications. The aim of this study was to investigate the influence of the addition of zeolites on the local dynamic behaviour of PDMS chain segments in PDMS-zeolite composites. Three types of zeolites were used: Zeolite A with cubic morphology, Zeolite A with spherical morphology, and Zeolite X, each incorporated into the PDMS matrix at 20, 30, and 40 wt%. Local segmental dynamics was investigated using the powerful electron spin resonance (ESR) - spin probe method, while the thermal behaviour was analysed using differential scanning calorimetry (DSC). ESR results showed that the presence of zeolites increases the isothermal crystallisation rate, which significantly affects the segmental mobility in the amorphous phase below the crystallisation temperature. This effect was found to depend more strongly on zeolite morphology than on filler content. DSC measurements showed no change in glass transition temperature with the addition of zeolite but shifts in cold crystallisation and melting behaviour were observed, indicating changes in crystal structure and its perfection. These results indicate that zeolites act as heterogeneous nucleation agents and that their structural properties critically influence the crystallisation behaviour of PDMS.
Keywords:
polydimethylsiloxane
; zeolite
; segmental dynamics
; electron spin resonance - ESR
; spin probe
; crystallisation
; DSC
1. Introduction
Polydimethylsiloxane (PDMS), due to its highly flexible chains, exhibits a low glass transition temperature and the ability to crystallise. For decades, it has attracted considerable scientific attention and remains a subject of ongoing research. The first evidence of PDMS crystallisation, reported by G. Damaschun, dates back to 1962 [1]. Despite numerous studies conducted over more than six decades [2,3,4,5,6,7,8,9,10,11], the complex structure of its crystalline phase has not been fully elucidated, and many questions remain open [12]. While the crystalline phase has been extensively studied, the behaviour of the amorphous phase, which coexists with the crystalline phase, especially the dynamics of the amorphous chain segments, has been much less explored. C.A. Massa et al. studied the dynamic behaviour in a semicrystalline PDMS matrices by high-field ESR spectroscopy [13,14,15]. They confirmed the presence of two distinct amorphous phases in the interfacial region: the rigid amorphous fraction (RAF), a constrained environment located near the crystalline domains, and the mobile amorphous fraction (MAF), situated between the crystalline regions and exhibiting properties similar to fully amorphous bulk polymer.
A simplified overview of the effects of cooling rate, polymer molecular weight, filler addition and crosslinking on the low temperature behaviour of PDMS, with particular emphasis on melting behaviour, is available in the literature [6]. It is known that the pure long-chain sample crystallises more rapidly than the short-chain sample. However, adding a certain amount of short chains to a long-chain matrix can increase the crystallisation rate [5]. Differential scanning calorimetry (DSC) measurements with various additives indicate that the presence of nanometric solid particles also increases the crystallisation rate compared to pristine PDMS melts. This effect is attributed to entropic interactions in the boundary layer [7]. Results for PDMS-silica composite show that silica particles do not affect the size of the crystalline growth but reduce the extent of crystallisation and have two opposing effects on crystallisation rate: nucleation dominates at low silica volume fractions, promoting faster crystal growth, while topological constraints dominate at high silica fractions, hindering crystal growth [8]. Another study reports that silica nanoclusters promote crystallisation, evidenced by higher crystallisation temperatures upon cooling and lower crystallisation temperatures upon heating [10]. Both melt and glass crystallisations are significantly promoted in the presence of silica nanoclusters, with more pronounced secondary crystallisation and higher crystal perfection due to the structuring effect of silica nanoclusters [10]. D. Fragiadakis et al. investigated the effects of nanoparticles on chain dynamics using thermally stimulated depolarization current, broadband dielectric relaxation spectroscopy and differential scanning calorimetry [16]. They observed a slower relaxation of polymer chain segments near the polymer-filler interface, where mobility is restricted due to interactions with the filler surface. In contrast to the findings of other authors, their DSC analysis showed a change in the shape of the glass transition and a decrease in both the degree of crystallinity and the rate of crystallisation upon the addition of silica.
Zeolites are often used as fillers in various types of PDMS-based membranes [9,17,18,19]. They are known to interact strongly with polymer matrices, potentially forming physical crosslinks via van der Waals forces or chemical crosslinks through reactions of surface hydroxyl groups with polymer chains. In the case of PDMS, physical interactions, mainly the penetration of PDMS chains into zeolite pores, dominate. An investigation of PDMS-NaA zeolite composites reveal that zeolite addition alters the equilibrium swelling degree, hardness and thermal stability, indicating that this type of zeolite acts as a reinforcing filler [17]. Significant changes in degree of swelling and hardness were observed for the zeolite concentration lower than 20 %, with less pronounced effect at higher concentrations. A new bonding mechanism of zeolite within the composite was also proposed. A study of PDMS–NaY zeolite composite films showed that zeolite addition significantly improves mechanical and thermal properties [18]. H. Yang et al. reported that the incorporation of zeolites into PDMS membranes induces a crosslinking effect, leading to slightly enhanced selectivity and reduced flux in comparison to pristine PDMS membranes [19].
Using electron spin resonance (ESR), to investigate segmental dynamics in polymer-filler composites is a well-established approach in polymer science and materials chemistry. ESR is highly sensitive to molecular motion on the timescale from pico- to microsecond and can provide detailed insights into the local segmental mobility, matrix (in)homogeneity and interaction at interfaces between the polymer and the filler [20,21,22,23]. Knowledge on segmental dynamics is important because it is directly linked to the mechanical (flexibility, strength, elasticity), transport (gas permeability and separation) and interfacial properties (adhesion, stress transfer, compatibility) between PDMS and zeolite surfaces of the composites. Understanding and controlling segmental dynamics is critical for optimizing the performance of PDMS-fillers composites in applications such as gas separation membranes, flexible electronics, sensors, catalytic systems, biomedicine etc [24,25,26,27].
In this study, the electron spin resonance (ESR) - spin probe method, as a powerful tool in studying local molecular motions, was applied to investigate segmental dynamics in PDMS-zeolite composites. Three types of zeolites with different morphologies and loadings were incorporated into a model PDMS melt matrix composed of uncrosslinked chains.
2. Materials and Methods
2.1. Sample Preparation
Methyl terminated polydimethylsiloxane (PDMS), Mw = 28000, density 0.971 kg/L, was purchased from ThermoFisher (Kandel) GmbH, and the free nitroxide radical, used as spin probe for ESR measurements, 4-oxo-2,2,6,6-tetramethyl-1-piperidinyloxy (4-oxo-TEMPO or TEMPONE) from Sigma-Aldrich. Zeolite A with cubic and spherical morphology were synthesized, while the Zeolite X was purchased from Silkem d.o.o. For the synthesis of cubic Zeolite A the aluminosilicate hydrogel with a molar oxide composition: 4.72 Na2O × Al2O3 × 1.93 SiO2 × 254.86 H2O was prepared by mixing a sodium silicate solution of appropriate concentration with a sodium aluminate solution of appropriate concentration in terms of Na2O and Al2O3 under stirring with a magnetic stirrer. The sodium aluminate solution was prepared by dissolving anhydrous NaAlO2 (Riedel de Haen; 41 wt% Na2O, 54 wt% Al2O3 and 5 wt% H2O), and the sodium silicate solution by dissolving Na2SiO3 (Aldrich; 51 wt% Na2O, 48 wt% SiO2 and 1 wt% H2O) in demineralized water, respectively. The solutions were held at 25 °C before mixing. The prepared hydrogel was mixed for 10 min, then transferred to a stainless-steel reaction vessel preheated to the crystallisation temperature (80 °C) and continued to be heated for 4 hours until the end of the crystallisation process, i.e., until the entire amorphous phase had transformed into the crystalline phase. The reaction vessel was equipped with a thermostatic jacket with circulated water. The resulting product, Zeolite A, was washed to a pH of about 9 and dried at 105 °C for 24 hours. A detailed procedure for the synthesis of spherical zeolite A particles is described in the patent [28] and in the literature [29,30], while the synthesis of cubic particles is described in reference [31].
The desired amounts of zeolites were incorporated into the PDMS matrix by directly mixing a zeolite with PDMS on a magnetic stirrer for 10 min at room temperature. The samples were then placed in an ultrasonic bath and treated for 15 min to achieve a homogeneous dispersion of zeolite particles within the PDMS matrix. The zeolites used in this study, as mentioned above, were Zeolite A with cubic (AC) and spherical (AS) morphologies and Zeolite X (X) with pyramidal morphology. All composite samples were prepared using three loadings for each type of zeolite. The loadings expressed as mass percentages were 20 %, 30 % and 40 %. The spin probe was also incorporated into PDMS-zeolite composites by directly mixing the nitroxide with samples on a magnetic stirrer for 10 min. The final probe concentration was approximately 0.05 wt%. The composition and labels of investigated samples are presented in Table 1.
2.2. ESR Measurements
ESR measurements were performed on a Bruker EMX spectrometer operating at 9.3 GHz, equipped with a Bruker ER 041 XG microwave bridge and a Bruker ER 4111 VT temperature control unit with an uncertainty of ±1 °C. The initial measurements in a pristine PDMS were performed in the temperature range from −107 °C to 25 °C in steps of 5 °C and 10 °C, depending on the sensitivity to the changes in spectral line shape in a particular temperature range. The samples were quenched and held 5 min at −107 °C before the first spectrum was recorded. All subsequent spectra were measured by increasing the temperature. Samples were held at the measurement temperature for 2 min before the accumulation began.
The temperature of −85 °C, at which composite ESR spectra consisting of two components were observed, was chosen as the optimal temperature for characterizing the local motional behaviour of PDMS chain segments. All samples were then measured isothermally at this temperature as a function of time. It should be noted that the samples were cooled directly from room temperature to −85 °C in the ESR cavity. The spectra were recorded every minute from the first minute until no change in spectral shape and line intensity was observed. The spectral parameters were: frequency 9.30 GHz, sweep width 100 G, sweep time 30.72 s, power 2.00 mW, modulation frequency 100 kHz, modulation amplitude 1.00 G, time constant 1.28 ms and receiver gain 1·102. WinEPR acquisition software, version 4.55, was used for spectrum acquisition and analysis. The ESR spectra were simulated using the spectral fitting programme NLSL, which is based on the stochastic Liouville equation [32]. The spin probe motion was modelled according to the Brownian diffusion model. The simulations were performed with one or two components. The fits were obtained by varying the parameters for the isotropic Gaussian line broadening and the rotational diffusion rate for each component. The quality of the fits was assessed using the correlation coefficient r, which was above 0.98 in most cases.
2.3. DSC Measurements
DSC measurements were performed on a Mettler Toledo 822e DSC analyser in the temperature range from –150 °C to 25 °C. The samples were cooled from room temperature to –150 °C with the maximum cooling rate corresponding to the uncontrolled cooling mode of the calorimeter, approximately −40 °C/min. Before starting the measurements, the samples were kept at –150 °C for 5 min, and then the temperature was increased at a rate of 10 °C/min. All measurements were performed in a nitrogen atmosphere with a flow rate of 20 mL/min. Data analysis was performed on a PC with STARe Software (v16.20). The degree of crystallinity was calculated using the theoretical enthalpy value ΔHth = 37.4 J/g as given in reference [6]. The measured enthalpy values were corrected to account for the zeolite content in each sample.
3. Results and Discussion
3.1. ESR Analysis
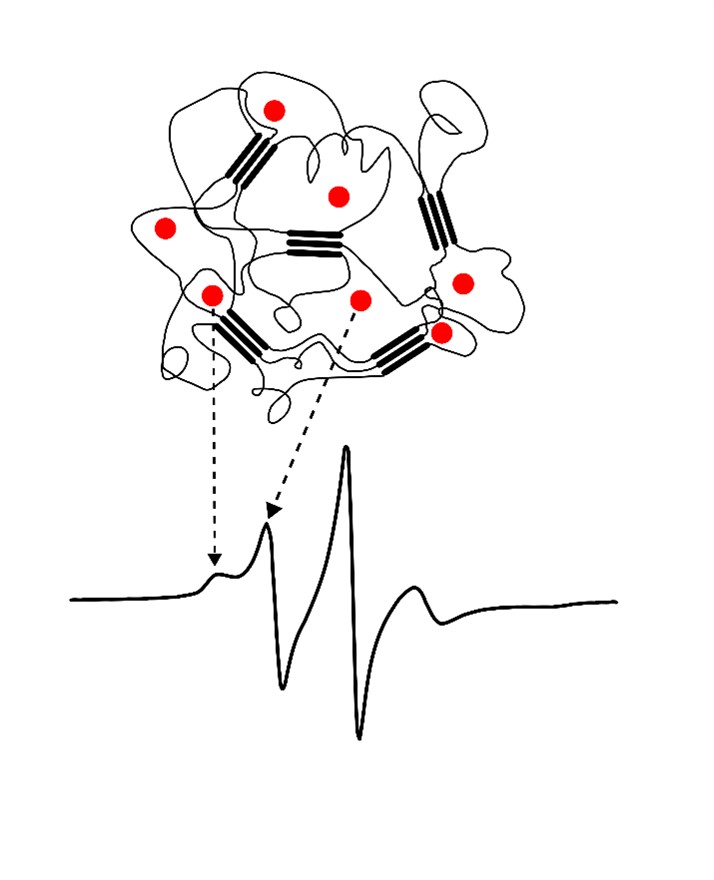
ESR spectra of spin probe in pristine PDMS measured as a function of temperature are shown in Figure 1 and Figure 2. Figure 1 shows the spectra recorded at low temperatures between the glass transition (Tg) and the melting point. At low temperatures, the spectra consist of three overlapping hyperfine lines, with a pronounced dominance of broad lines characteristic of the slow motions of the spin probe [21,22]. The probe dynamics in a polymer matrix is generally influenced by the size of the pores in which the probe molecules are located, but also by the local movements of the chain segments. As long as the matrix is frozen (i.e., below Tg), the motion of the spin probe is determined by the size of the pores, along with the motions of the end and side chain groups (if present). Above this temperature, the influence of the local motions of the chain segments dominates, and the probe molecules follow the segmental movements. Since the Tg of PDMS is around –125 °C, the probe dynamics in the temperature range of the measurement reflects the dynamics of the chain segments in the amorphous phase of a semicrystalline sample. According to the results of DSC measurements reported below, but also based on data from the literature [2,3,10,33], a part of the PDMS chains forms the crystalline phase, while the other part is amorphous. Our previous study [34]) has shown that the probe molecules are ejected from the crystalline phase and diffuse only through the amorphous phase [34], Figure 3.
Spectra observed at temperatures between –107 °C and –80 °C show a slight change in the spectral lineshape, indicating the appearance of a narrow component with increasing temperature, which becomes more noticeable for T > –75 °C. An increase in the narrow component due to fast motion is observed at the expense of the broad component due to slow probe motion. Such composite spectra, typically observed in dynamically inhomogeneous systems, indicate a coexistence of well-resolved slow and fast local segmental motions [21,22,23]. Based on the results of previous studies on semicrystalline PDMS [14,15], probe molecules with fast and intermediate mobility are located in the disordered fraction far from the crystallites (MAF), while those with extremely low mobility are trapped close to the crystallites in a glassy environment (RAF) persisting up to the PDMS melting. The increase in fast molecular motions with increasing temperature is therefore due to the growth of the MAF fraction at the expense of the RAF. In other words, segments located in the middle of the amorphous phase move faster and contribute to the narrow component in the ESR spectrum, while segments emerging from the crystalline phase and those in its vicinity, move slower and contribute to the broad component.
At –50 °C, the fast component becomes very pronounced. As the temperature increases further, the slow component disappears, so that the spectrum at –30 °C consists of three well-resolved narrow lines, Figure 2. This change can be associated with the melting of the crystalline phase and its transition to the amorphous phase (see thermal analysis results below). At temperatures above –30 °C, an increase in line width with increasing temperature is observed. It is known that at short correlation times, as long as τR < 0.02 ns, the contribution of spin rotation to the transverse relaxation rate (T2−1) dominates, while at longer τR values this contribution becomes less important and the contribution of rotational modulation of 14N hyperfine and g tensors anisotropies begins to dominate [35]. This effect becomes increasingly pronounced with rising temperature up to 20 °C, Figure 2.
To compare the dynamic behaviour of the composite samples with each other and with pristine PDMS, a temperature of –85 °C was chosen as the most suitable to observe how the shapes of the spectra and the fraction of slow and fast components change as a function of time passed after the sample was quenched to the selected temperature. Spectra of the spin probe in pristine PDMS, measured on the sample held at –85 °C for 2 min and 15 min are shown in Figure 4a and 4b, respectively. Table 2 shows the intensity ratio of the broad (Ib) and narrow (In) components of the low-field lines, the fractions of the slow (ϕs) and fast (ϕf) components, the corresponding correlation times for the slow (τRs) and fast (τRf) components and the time required to reach the steady state (t). A strong difference in the shape of these two spectra could be related to the isothermal crystallisation kinetics. After 2 min, a relatively small number of crystals are formed, Figure 3a, and the dynamics of the segments remains mainly fast, characterized by an averaged τR value of 2.59 ns, Table 2a. The spectrum recorded after 15 min does not change with increasing time, suggesting that the crystallisation process is complete. This broad spectrum indicates that the segmental slow motions in the amorphous phase have been overcome due to the restrictions imposed by the formation of the crystalline phase. In other words, almost the entire MAF region has transformed into RAF, and the sample exhibits motion specific to polymer matrices at temperatures below Tg. Such motional behaviour in a semicrystalline PDMS was previously observed with high-field ESR [14,15]. Figure 3b schematically shows the structure of the semicrystalline matrix and the distribution of the spin probe within the amorphous phase at –85 °C upon reaching the steady state.
To investigate the influence of the zeolite on the isothermal crystallisation process and molecular dynamics, the same measurements were performed with composite samples. Figure 5 shows the spectra of composite samples held at a temperature of –85 °C for 2 min. It is easy to see the difference between the spectrum of pristine PDMS, Figure 4a, and the composite samples. The spectrum of PDMS does not directly indicate the presence of two separate types of motion, so it can be assumed that PDMS is still predominantly in an amorphous phase after 2 min at –85 °C, characterized by a broad distribution of correlation times. However, compared to the spectrum observed at 20 °C, an increase in the intensity of the central line and a slight line broadening are observed indicating the beginning of a modest restriction in the local motions of the segments due to the formation of a crystalline phase and the gradual appearance of RAF.
In contrast, the spectra of the composites clearly show two well-resolved components due to the dynamic inhomogeneity of the system, which is related to the existence of two types of motion. One of the simplest measures that provides information about the motional behaviour of the system is the intensity ratio between the broad and narrow component, Ib/In, Table 2a. Depending on the type and loading of the zeolite, it ranges from 0.110 for samples 30X and 40X, to 1.059 for sample 20X. These values are in good agreement with those obtained from computer simulations of the spectra, with the slow component fraction being the lowest for samples 30X and 40X at 36.5 % and 43.3 %, respectively. Samples 40AC and 40AS contain the highest fraction of the slow component, 84.0 % and 83.7 %, respectively. A very similar value is observed for sample 20X, which shows a fraction of 83.2 % for the broad component. However, the fraction of the broad component decreases significantly with increasing Zeolite X content, Table 2a.
The correlation times of the broad component are comparable for all composites and are on average 11 ns, while the correlation times of the narrow component vary slightly and range from 1.42 ns to 1.87 ns. In contrast to Zeolite X, Zeolite A in both its cubic and spherical forms show a slight increase in the fraction of the slow component at higher loadings, from 62.2 % to 84.0 % and from 81.2 % to 83.7 % for cubic and spherical form, respectively. This indicates an increased crystallisation rate at higher loadings. However, for the spherical form of Zeolite A, the influence of loading is much less pronounced.
These results clearly show that the addition of zeolite to the PDMS matrix strongly promotes the crystallisation process, significantly increasing its rate. Similar effects on PDMS crystallisation have previously been reported in the presence of silica [6,7,36,37]. It has also been shown that the complexity of stress-induced crystallisation in PDMS is influenced not only by temperature and strain, but also by filler content [36]. In unfilled copolymer systems, crystallisation is initiated more slowly, which is probably due to the absence of heterogeneous nucleation sites provided by the filler surfaces [37]. Our results are consistent with these findings. However, at higher Zeolite X loadings (samples 30X and 40X), this effect is significantly reduced, resulting in a much lower fraction of the slow component compared to sample 20X, Figure 5 and Table 2a. This observation suggests that crystallisation proceeds more slowly during the initial stage. A similar trend at higher filler concentrations has also been observed by R.H. Ebengou and J.P. Cohen-Addad for PDMS-silica composites [8]. They showed that nucleation effects dominate at low silica contents and accelerate the crystallisation kinetics. In contrast, at high silica concentrations, the filler particles impose spatial constraints on crystal growth, leading to a slowdown in crystallisation kinetics. It was also found that composite samples with very high silica volume fractions (> 45 %) do not exhibit a cold crystallisation phenomenon. Studies on Zeolite X-based polymer composites show that particle agglomeration may occur at higher zeolite concentrations, when the filler reacts more favourably with itself rather than with the polymer [36]. It can therefore be assumed that another possible cause for this deviation in the Zeolite X composites, compared to the other samples, could be the agglomeration of the particles and a resulting reduction in the interactive surface area, parts of which serve as heterogeneous nucleation sites. As a result, the time required for the system to reach a steady state (t) is longer for samples 30X and 40X; 7 and 13 min, respectively, Table 2b. It is clear that the time t for sample 40X is very close to the time t for pristine PDMS (15 min), while it is reduced to 3-5 min for the other samples. For the AC composites, the zeolite content reduces the time t from 5 min for sample 20AC to 3 min for sample 40AC, indicating a slight increase in the crystallisation rate with increasing the zeolite content. In the case of AS composites, t varies only slightly from 4 min for samples 20AS and 30AS to 3 min for sample 40AS. The lower t value for sample 20AS compared to 20AC may be attributed to its larger specific surface area, which is caused by surface roughness [28]. This difference in specific surface area may also account for the significantly higher proportion of the slow component in sample 20AS, observed after 2 min at –85 °C, compared to sample 20AC, as previously indicated.
From the point of view of the ESR - spin probe method, the time t can be related to the completion of crystallisation, although literature data obtained by different methods for silica filled PDMS show much higher values, even longer than 2 hours [37]. This fact supports the hypothesis that zeolites may serve as more effective fillers for PDMS than silica. Taking into account the above discussed t values it can be assumed that higher contents of Zeolite X cause mechanical hindrance during crystal formation, resulting in a moderate to low influence on the crystallisation rate. In contrast, the maximum loadings of the Zeolites AC and AS strongly increase the crystallisation rate.
Once the steady state is reached, the spectra of all investigated samples are very similar, Figure 6. Computer simulations show marginal differences in the correlation times and the proportions of slow and fast motions, as well as in the intensity ratios of the broad and narrow components, Table 2b. The fractions of the slow component are approximately the same, varying from 88.7 % (30AS) to 91.6 % (40AS). These values are very close to those of the pristine PDMS (88.2 %), Table 2b. The same applies to the ratios of the broad and narrow components, with minor deviations. The τRf values are somewhat higher than those calculated based on the spectra recorded after 2 min, ranging from 1.85 ns for 20AS to 3.26 ns and 3.28 ns for 40AC and 30AC, respectively. In contrast, τRs values remain almost unchanged compared to the spectra measured after 2 min and fluctuate slightly around 10-11 ns. A small increase in τRf could indicate a stronger interaction of the matrix chain segments with the filler particles for the cubic form of the Zeolite A. However, as indicated above, there are significant differences in the time t required to reach steady state. This result strongly confirms the previously discussed influence of the zeolites on the rate of isothermal crystallisation.
Considering the very similar fractions of the slow and fast components and especially the very similar τRs values, no difference in the dynamic behaviour within the RAF is observed for all studied samples once the steady state is reached, regardless of the differences in the degree of crystallinity determined by DSC. Nevertheless, a slight increase in the value of τRf for higher loadings, which is most pronounced for samples 30AC and 40AC, indicates a slowdown of the dynamics in the MAF. Since this effect is less pronounced for Zeolite AS, and especially for the Zeolite X composites regardless of the loadings, it can be concluded that zeolite morphology has a greater influence on the molecular motion in the MAF region than the zeolite content itself.
3.2. DSC Analysis
The results of the thermal analysis performed using DSC are shown in Figure 7 and Table 3, Table 4 and Table 5. All samples analysed show a glass transition at almost the same temperature of approximately −126 °C, regardless of the type and content of zeolite. This confirms that the addition of zeolites to PDMS does not affect the Tg. Some studies have shown that the glass transition temperature remained unchanged despite variations in molecular weights, prior cooling rate, addition of fillers and crosslinking [6,10,16]. An exothermic peak appears in the range from −101.3 °C to −86.15 °C, indicating cold crystallisation of the samples [3,6,7,37]. Its position on the temperature scale, Tc, intensity and width depend on the type and content of the zeolite. In pristine PDMS, it appears at the highest temperature −86.15 °C, while in all composite samples it is shifted towards lower temperatures, Table 3. This finding is consistent with the previously observed temperature shift in the presence of silica [6,10]. Furthermore, it was shown that the cold crystallisation temperature, as well as the area of the exothermic peak are dependent not only on the filler addition, but also on other parameters related to the facility of the chains to crystallise during cooling.
An analysis of the Tc values shows that the Tc decreases most significantly with Zeolite AC, followed by AS, while the effect is least pronounced with Zeolite X, Table 3. A similar trend can be seen in the thermograms in Figure 7. For example, as shown in Figure 7c, the exothermic peak of sample 30X exhibits a smaller shift towards lower temperatures compared to samples 30AC and 30AS. Narrower and sharper peaks in the composites indicate a higher crystallisation rate compared to pristine PDMS. These results are consistent with the ESR results and suggest that zeolite morphology plays a more important role in controlling the kinetics of isothermal crystallisation than zeolite content alone.
It is known from the literature that the large cold crystallisation peak is due to the further crystallisation of the imperfect crystals formed during the previous cooling [6]. This peak is reduced at lower cooling rates due to the formation of more perfect crystals. However, in our case, the cooling rate was kept constant for all samples. Therefore, the observed decrease in peak intensity can be attributed to the presence of zeolites, which can improve the structural regularity of the resulting crystalline phase. A comparison of the enthalpy values ΔHc from Table 4 shows that the composites have lower values than pristine PDMS. Furthermore, ΔHc decreases with increasing zeolite content for AC and AS composites. In contrast, an increase in ΔHc is observed for Zeolite X at higher concentrations.
In the temperature range between −50 °C and −36 °C, two endothermic peaks consistently occur, at temperatures Tm1 and Tm2. In some samples, a small additional exothermic peak is observed between these two, at a temperature Tc*, Figure 7 and Table 3. It is assumed that Tm1 and Tm2 correspond to the melting of less perfect and more perfect crystals, respectively, that form during the cooling and recrystallisation of metastable phases [3,6]. The peak at Tc* is due to the recrystallisation of some part of the crystals melted at Tm1. As shown in Table 3, the values of Tm2 are approximately the same for all samples, around −36 °C, while Tm1 varies slightly from −47.66 °C for PDMS to −50.06 °C for 30AS. A slight shift to a lower value could indicate that the crystal structures are slightly less perfect, which could be related to the roughness of the zeolite surface. An opposite shift in Tm1 was previously observed for PDMS due to the more perfect crystals formed by decreasing the cooling rate [6]. At this point, it should be noted that the high roughness of the outer surface of the AS zeolite leads to a specific surface area that is 2.7 times larger than that of the AC zeolite [28].
A clear decrease in the intensity of the endothermic peak at Tm1, accompanied by significantly lower ΔHm1 values, is observed when zeolite is added to PDMS. At the same time, an increase in the second endothermic peak at Tm2 together with the corresponding enthalpy values is evident in the composite samples. This is somewhat less pronounced in the Zeolite X composites, where an additional small exothermic peak also occurs at Tc*. A similar peak is observed in the 20AS sample, although it is almost negligible, while this peak does not occur in the other composites. These results support the assumption that the presence of zeolite affects not only the crystallisation rate detected by ESR but also the crystalline structure, especially its degree of perfection. Additional structural analysis is planned to confirm this assumption.
Table 5 presents the degree of crystallinity values calculated from the measured enthalpies for each of the phase transitions observed during heating. These values provide valuable insight into the thermal behaviour of the samples and the extent of crystalline phase formation. Comparing these data for different composites allows a better understanding of how the degree of crystallinity depends not only on the zeolite content but also on the morphology of the zeolite particles. The overall degree of crystallinity (χ) was calculated using the following equation:
where χm1 and χm2 are fractions of the crystals melted at Tm1 and Tm2, respectively. The fraction of crystals formed during heating (χ’) was estimated as follows:
χ = χ m1+ χ m2
χ’ = χc + χc*.
χc and χ c* represent the degree of crystallinity due to cold crystallisation and recrystallisation, respectively. The amount of crystals formed during rapid cooling (Δχ) that did not recrystallise at Tc during heating was determined as follows:
Δχ = χ - χ’.
Sample 40AS is characterized by the lowest ΔHc value, Table 4, and consequently the highest degree of crystallinity during cooling (Δχ = 43.42 %), as shown in Table 5. This can also be attributed to the high roughness of its outer surface [28], as discussed earlier. It is worth noting that only 16.56 % of more perfect crystals are formed during rapid cooling of pristine PDMS.
4. Conclusions
The present observations underline the sensitivity of the ESR - spin probe method to study the motional behaviour in the amorphous phase of semicrystalline PDMS and PDMS-zeolite composites. Such information is essential for a better physical understanding of the properties of semicrystalline polymer systems. The results of this study show that the incorporation of zeolites into the PDMS matrix significantly affects both the kinetics and mechanisms of crystallisation as well as the segmental dynamics of polymer chains. ESR spectroscopy revealed that the addition of zeolites increases the isothermal crystallisation rate. This effect strongly depends on both the type and morphology of the zeolite. Higher concentrations (30 wt% and 40 wt%) of Zeolite X might lead to agglomeration of the particles, a reduced interface area, and consequently, slower crystallisation.
DSC analysis confirmed that the glass transition temperature remains unaffected by the addition of zeolites, while clear changes can be observed in cold crystallisation and melting behaviour. Zeolite-containing composites exhibit a lower enthalpy of cold crystallisation (ΔHc ≈ 13-21 J/g) and a shift in crystallisation and melting peaks, indicating an increased structural regularity of the formed crystalline phase. These results are consistent with the ESR results and support the conclusion that zeolites act as heterogeneous nucleating agents and enhance crystallisation, but also influence the perfection of the resulting crystals.
Among all composites, the samples containing 30 wt% and 40 wt% of spherical Zeolite A exhibited the highest amounts of crystallites formed during rapid cooling, reaching 40.94% and 43.42%, respectively. This effect can be attributed to the higher external surface roughness and larger specific surface area of the spherical Zeolite A particles. Overall, the study highlights that the morphology of the zeolite plays a more important role than its content for both molecular mobility and crystallisation behaviour in PDMS composites. Future work should include detailed structural studies to further elucidate the relationship between the properties of the filler and the crystalline architecture of the polymer matrix.
Acknowledgments
This work was supported by the Croatian Science Foundation, project IP-2022-10-9292 and partially by the University of Rijeka projects uniri-iskusni-tehnic-23-217 and uniri-iskusni-prirod-23-207. The corresponding authors dedicate this work to Dr Zlatka Grubišić Gallot, a distinguished Franco-Croatian polymer scientist.
References
- Damaschun, G. Röntgenographische Untersuchung der Struktur von Silikongummi. Kolloid-Z.u.Z.Polymere 1962, 180, 65–67. [Google Scholar] [CrossRef]
- Klonos, P.A. Crystallization, Glass Transition, and Molecular Dynamics in PDMS of Low Molecular Weights: A Calorimetric and Dielectric Study. Polymer 2018, 159, 169–180. [Google Scholar] [CrossRef]
- Dollase, T.; Spiess, H.W.; Gottlieb, M.; Yerushalmi-Rozen, R. Crystallization of PDMS: The Effect of Physical and Chemical Crosslinks. Europhys. Lett. 2002, 60, 390–396. [Google Scholar] [CrossRef]
- Albouy, P.-A.; Vieyres, A.; Pérez-Aparicio, R.; Sanséau, O.; Sotta, P. The Impact of Strain-Induced Crystallization on Strain during Mechanical Cycling of Cross-Linked Natural Rubber. Polymer 2014, 55, 4022–4031. [Google Scholar] [CrossRef]
- Maus, A.; Saalwächter, K. Crystallization Kinetics of Poly(Dimethylsiloxane) Molecular-Weight Blends—Correlation with Local Chain Order in the Melt? Macromolecular Chemistry and Physics 2007, 208, 2066–2075. [Google Scholar] [CrossRef]
- Aranguren, M.I. Crystallization of Polydimethylsiloxane: Effect of Silica Filler and Curing. Polymer 1998, 39, 4897–4903. [Google Scholar] [CrossRef]
- Dollase, T.; Wilhelm, M.; Spiess, H.W.; Yagen, Y.; Yerushalmi-Rozen, R.; Gottlieb, M. Effect of Interfaces on the Crystallization Behavior of PDMS. Interface Science 2003, 11, 199–209. [Google Scholar] [CrossRef]
- Ebengou, R.H.; Cohen-Addad, J.P. Silica-Poly(Dimethylsiloxane) Mixtures: N.m.r. Approach to the Crystallization of Adsorbed Chains. Polymer 1994, 35, 2962–2969. [Google Scholar] [CrossRef]
- Vankelecom, I.F.J.; Scheppers, E.; Heus, R.; Uytterhoeven, J.B. Parameters Influencing Zeolite Incorporation in PDMS Membranes. J. Phys. Chem. 1994, 98, 12390–12396. [Google Scholar] [CrossRef]
- Bosq, N.; Guigo, N.; Persello, J.; Sbirrazzuoli, N. Melt and Glass Crystallization of PDMS and PDMS Silica Nanocomposites. Phys. Chem. Chem. Phys. 2014, 16, 7830–7840. [Google Scholar] [CrossRef]
- Clarson, S.J.; Dodgson, K.; Semlyen, J.A. Studies of Cyclic and Linear Poly(Dimethylsiloxanes): 19. Glass Transition Temperatures and Crystallization Behaviour. Polymer 1985, 26, 930–934. [Google Scholar] [CrossRef]
- Shi, X.; Albouy, P.-A.; Launois, P. Strain-Induced Changes of the X-Ray Diffraction Patterns of Cross-Linked Poly(Dimethylsiloxane): The Texture Hypothesis. Polymer 2022, 247, 124760. [Google Scholar] [CrossRef]
- Massa, C.A.; Pizzanelli, S.; Bercu, V.; Pardi, L.; Bertoldo, M.; Leporini, D. A High-Field EPR Study of the Accelerated Dynamics of the Amorphous Fraction of Semicrystalline Poly(Dimethylsiloxane) at the Melting Point. Appl Magn Reson 2014, 45, 693–706. [Google Scholar] [CrossRef]
- Massa, C.A.; Pizzanelli, S.; Bercu, V.; Pardi, L.; Leporini, D. Constrained and Heterogeneous Dynamics in the Mobile and the Rigid Amorphous Fractions of Poly(Dimethylsiloxane): A Multifrequency High-Field Electron Paramagnetic Resonance Study. Macromolecules 2014, 47, 6748–6756. [Google Scholar] [CrossRef]
- Massa, C.A.; Pizzanelli, S.; Bercu, V.; Pardi, L.; Leporini, D. Local Reversible Melting in Semicrystalline Poly(Dimethylsiloxane): A High-Field Electron Paramagnetic Resonance Study. Macromolecules 2017, 50, 5061–5073. [Google Scholar] [CrossRef]
- Fragiadakis, D.; Pissis, P.; Bokobza, L. Glass Transition and Molecular Dynamics in Poly(Dimethylsiloxane)/Silica Nanocomposites. Polymer 2005, 46, 6001–6008. [Google Scholar] [CrossRef]
- Adnadjevic, B.; Jovanovic, J. Investigation of the Effects of NAA-Type Zeolite on PDMS Composites. Journal of Applied Polymer Science 2000, 77, 1171–1176. [Google Scholar] [CrossRef]
- Denktaş, C. Mechanical and Film Formation Behavior from PDMS/NaY Zeolite Composite Membranes. Journal of Applied Polymer Science 2020, 137, 48549. [Google Scholar] [CrossRef]
- Yang, H.; Nguyen, Q.T.; Ping, Z.; Long, Y.; Hirata, Y. Desorption and Pervaporation Properties of Zeolite-Filled Poly(Dimethylsiloxane) Membranes. Mat Res Innovat 2001, 5, 101–106. [Google Scholar] [CrossRef]
- Hinderberger, D. EPR Spectroscopy in Polymer Science. In EPR Spectroscopy: Applications in Chemistry and Biology; Drescher, M., Jeschke, G., Eds.; Springer: Berlin, Heidelberg, 2012; ISBN 978-3-642-28347-5. [Google Scholar]
- Veksli, Z.; Andreis, M.; Rakvin, B. ESR Spectroscopy for the Study of Polymer Heterogeneity. Progress in Polymer Science 2000, 25, 949–986. [Google Scholar] [CrossRef]
- Electron Spin Resonance in Studying Nanocomposite Rubber Materials - Valić - 2010 - Wiley Online Books - Wiley Online Library Available online:. Available online: https://novel-coronavirus.onlinelibrary.wiley.com/doi/abs/10.1002/9780470823477.ch15 (accessed on 15 July 2025).
- Dubrović, I.; Klepac, D.; Valić, S.; Žauhar, G. Study of Natural Rubber Crosslinked in the State of Uniaxial Deformation. Radiation Physics and Chemistry 2008, 77, 811–817. [Google Scholar] [CrossRef]
- Rezakazemi, M.; Shahidi, K.; Mohammadi, T. Hydrogen Separation and Purification Using Crosslinkable PDMS/Zeolite A Nanoparticles Mixed Matrix Membranes. International Journal of Hydrogen Energy 2012, 37, 14576–14589. [Google Scholar] [CrossRef]
- Lima, R.A. The Impact of Polydimethylsiloxane (PDMS) in Engineering: Recent Advances and Applications. Fluids 2025, 10, 41. [Google Scholar] [CrossRef]
- Ha, H.; Park, J.; Ando, S.; Kim, C.B.; Nagai, K.; Freeman, B.D.; Ellison, C.J. Gas Permeation and Selectivity of Poly(Dimethylsiloxane)/Graphene Oxide Composite Elastomer Membranes. Journal of Membrane Science 2016, 518, 131–140. [Google Scholar] [CrossRef]
- Miranda, I.; Souza, A.; Sousa, P.; Ribeiro, J.; Castanheira, E.M.S.; Lima, R.; Minas, G. Properties and Applications of PDMS for Biomedical Engineering: A Review. Journal of Functional Biomaterials 2022, 13, 2. [Google Scholar] [CrossRef]
- Subotic, B.; Kosanovic, C.; Bosnar, S.; Jelic, T.A.; Bronic, J. Zeolite 4a with New Morphological Properties, Its Synthesis and Use 2010.
- Kosanović, C.; Jelić, T.A.; Bronić, J.; Kralj, D.; Subotić, B. Chemically Controlled Particulate Properties of Zeolites: Towards the Face-Less Particles of Zeolite A. Part 1. Influence of the Batch Molar Ratio [SiO2/Al2O3]b on the Size and Shape of Zeolite A Crystals. Microporous and Mesoporous Materials 2011, 137, 72–82. [Google Scholar] [CrossRef]
- Subotić, B.; Bronić, J.; Antonić Jelić, T. Chapter 6 - Theoretical and Practical Aspects of Zeolite Nucleation. In Ordered Porous Solids; Valtchev, V., Mintova, S., Tsapatsis, M., Eds.; Elsevier: Amsterdam, 2009; ISBN 978-0-444-53189-6. [Google Scholar]
- Antonić Jelić, T.; Bronić, J.; Hadžija, M.; Subotić, B.; Marić, I. Influence of the Freeze-Drying of Hydrogel on the Critical Processes Occurring during Crystallization of Zeolite A – A New Evidence of the Gel “Memory” Effect. Microporous and Mesoporous Materials 2007, 105, 65–74. [Google Scholar] [CrossRef]
- Budil, D.E.; Sanghyuk, L.; Saxena, S.; Freed, J.H. Nonlinear-Least-Squares Analysis of Slow-Motion EPR Spectra in One and Two Dimensions Using a Modified Levenberg-Marquardt Algorithm. Journal of Magnetic Resonance - Series A 1996, 120, 155–189. [Google Scholar] [CrossRef]
- Xiong, Y.-Q.; Li, C.-L.; Lu, A.; Li, L.-B.; Chen, W. Conformational Disorder Within the Crystalline Region of Silica-Filled Polydimethylsiloxane: A Solid-State NMR Study. Chin J Polym Sci 2024, 42, 1780–1792. [Google Scholar] [CrossRef]
- Valic, S.; Deloche, B.; Gallot, Y. Uniaxial Dynamics in a Semicrystalline Diblock Copolymer. Macromolecules 1997, 30, 5976–5978. [Google Scholar] [CrossRef]
- Marsh, D. Spin-Label Electron Paramagnetic Resonance Spectroscopy; CRC Press: Boca Raton, 2019; ISBN 978-0-429-19463-4. [Google Scholar]
- Zhao, J.; Chen, P.; Lin, Y.; Chen, W.; Lu, A.; Meng, L.; Wang, D.; Li, L. Stretch-Induced Intermediate Structures and Crystallization of Poly(Dimethylsiloxane): The Effect of Filler Content. Macromolecules 2020, 53, 719–730. [Google Scholar] [CrossRef]
- Chien, A.; Maxwell, R.S.; DeTeresa, S.; Thompson, L.; Cohenour, R.; Balazs, B. Effects of Filler–Polymer Interactions on Cold-Crystallization Kinetics in Crosslinked, Silica-Filled Polydimethylsiloxane/Polydiphenylsiloxane Copolymer Melts. Journal of Polymer Science Part B: Polymer Physics 2006, 44, 1898–1906. [Google Scholar] [CrossRef]
Figure 1.
ESR spectra of the spin the probe in PDMS measured at low temperature i.e., between glass transition temperature and melting temperature.
Figure 1.
ESR spectra of the spin the probe in PDMS measured at low temperature i.e., between glass transition temperature and melting temperature.
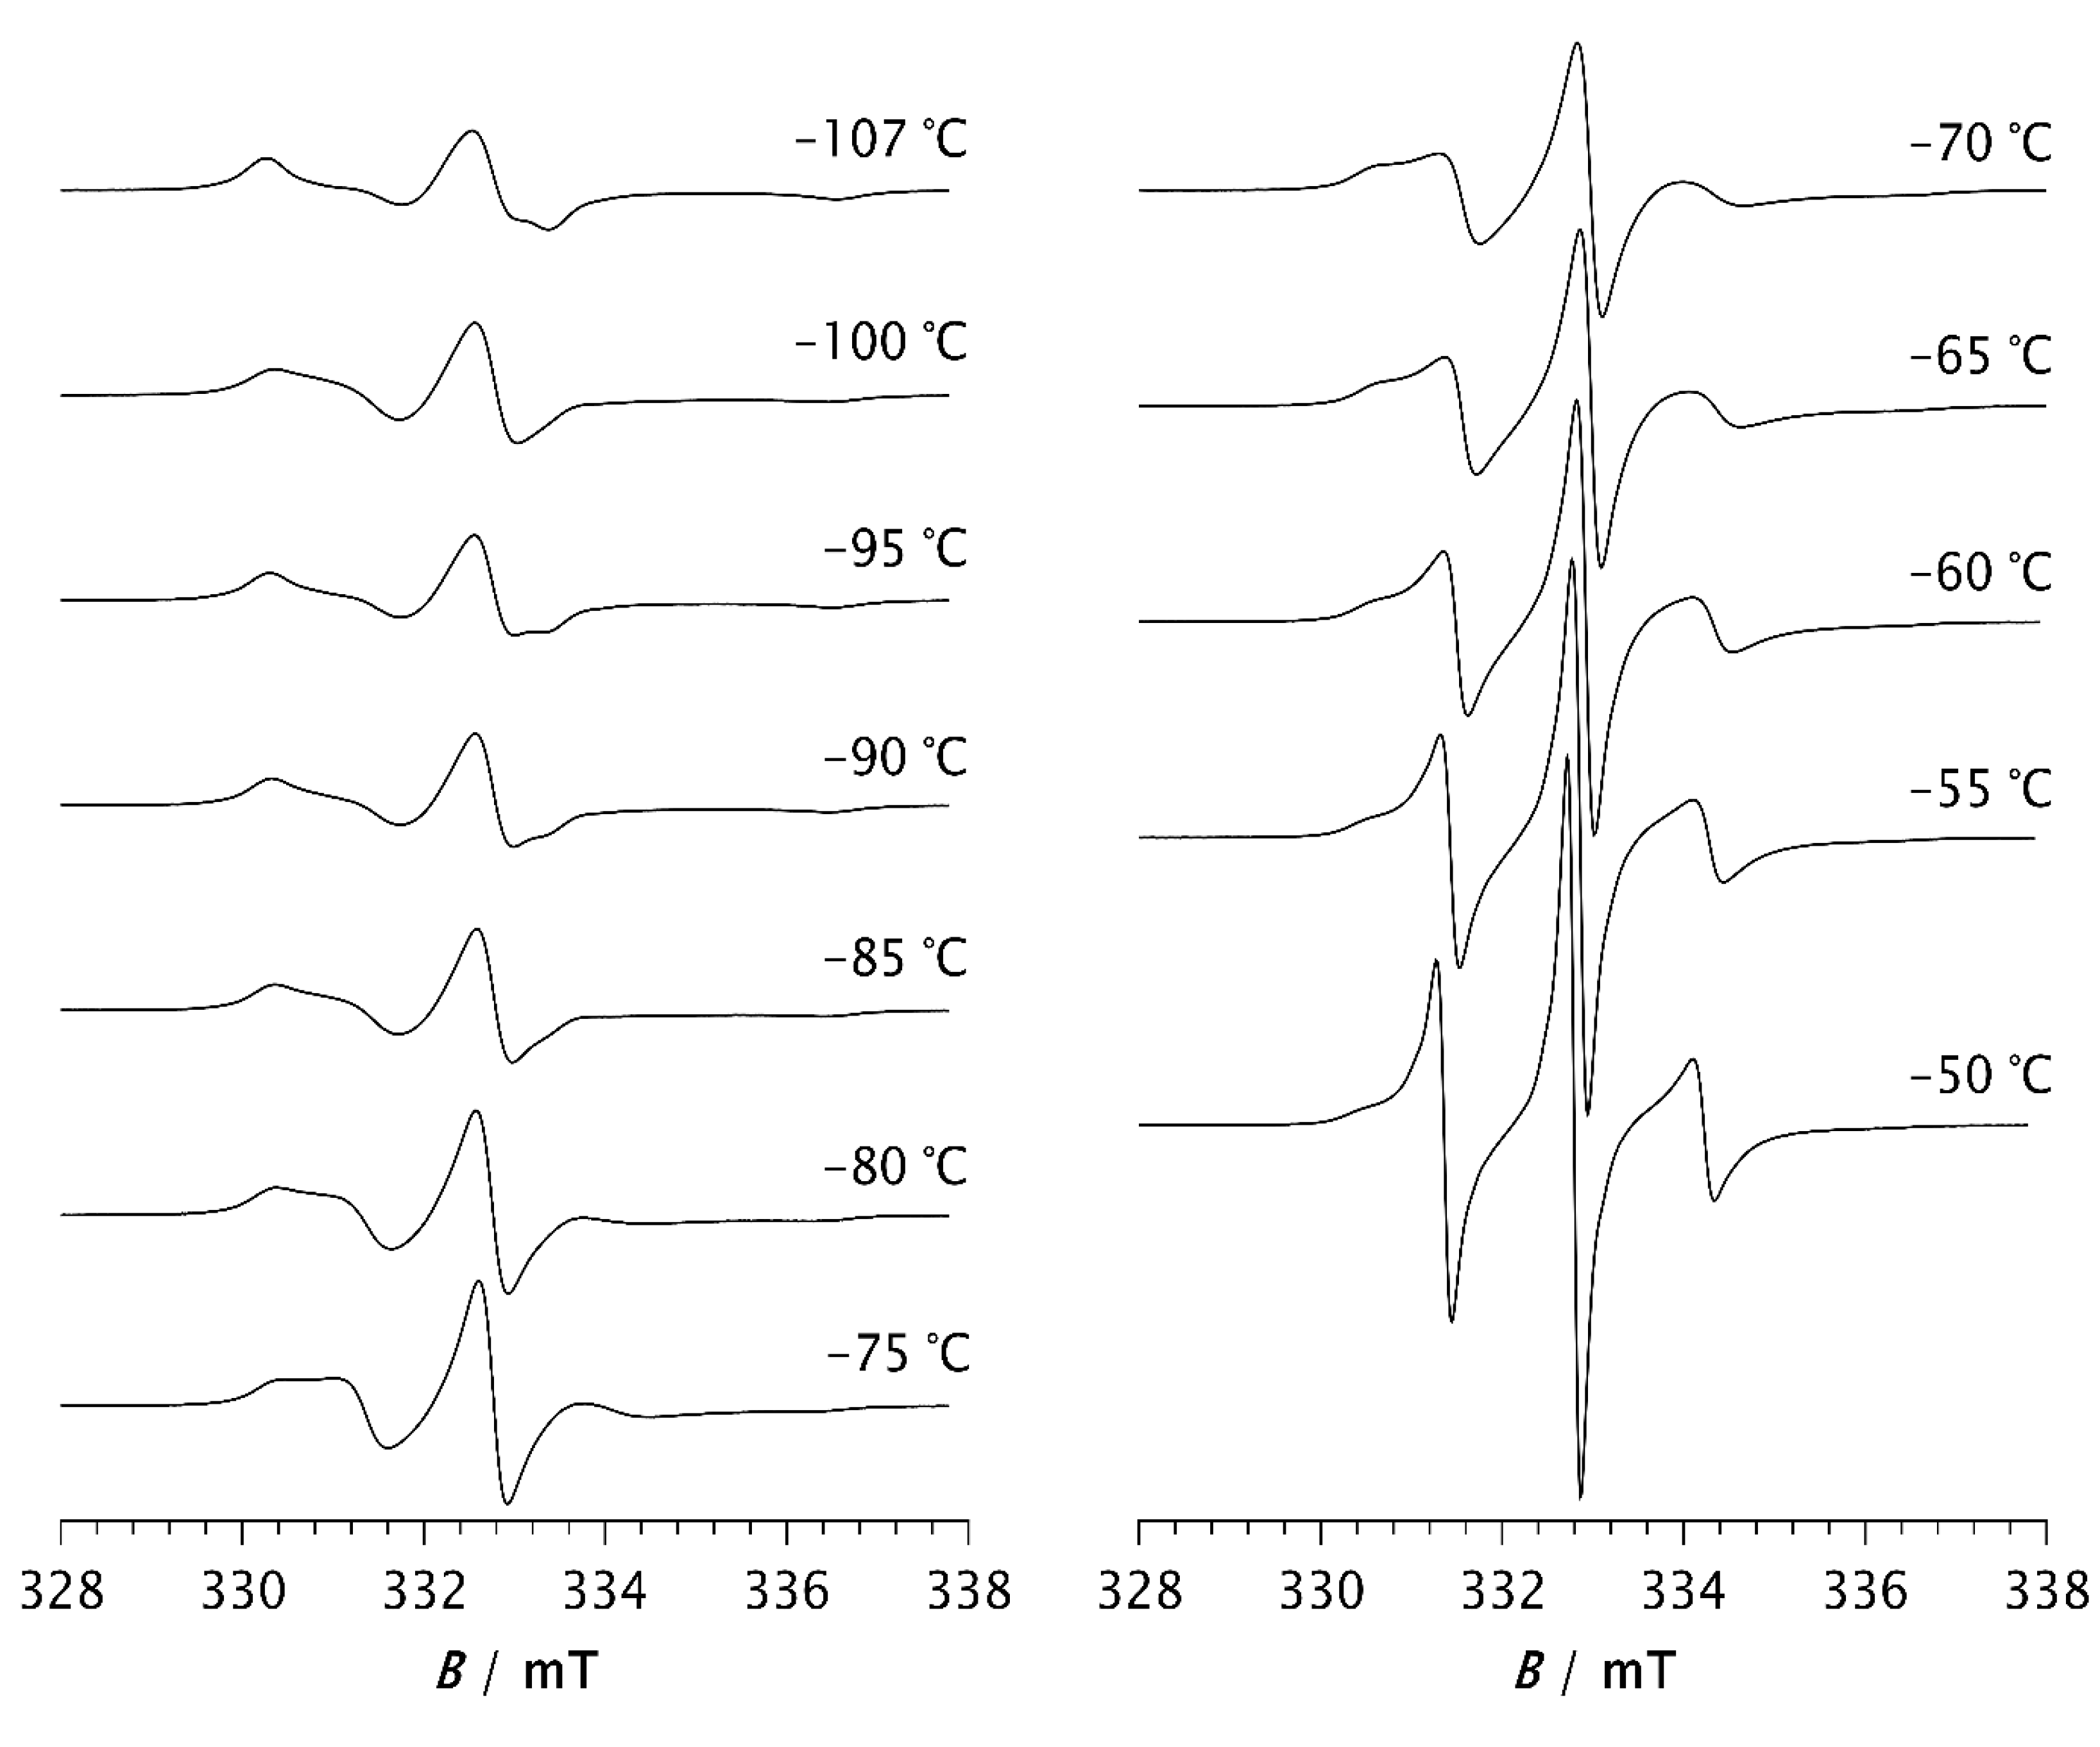
Figure 2.
ESR spectra of the spin probe in PDMS measured above melting temperature.
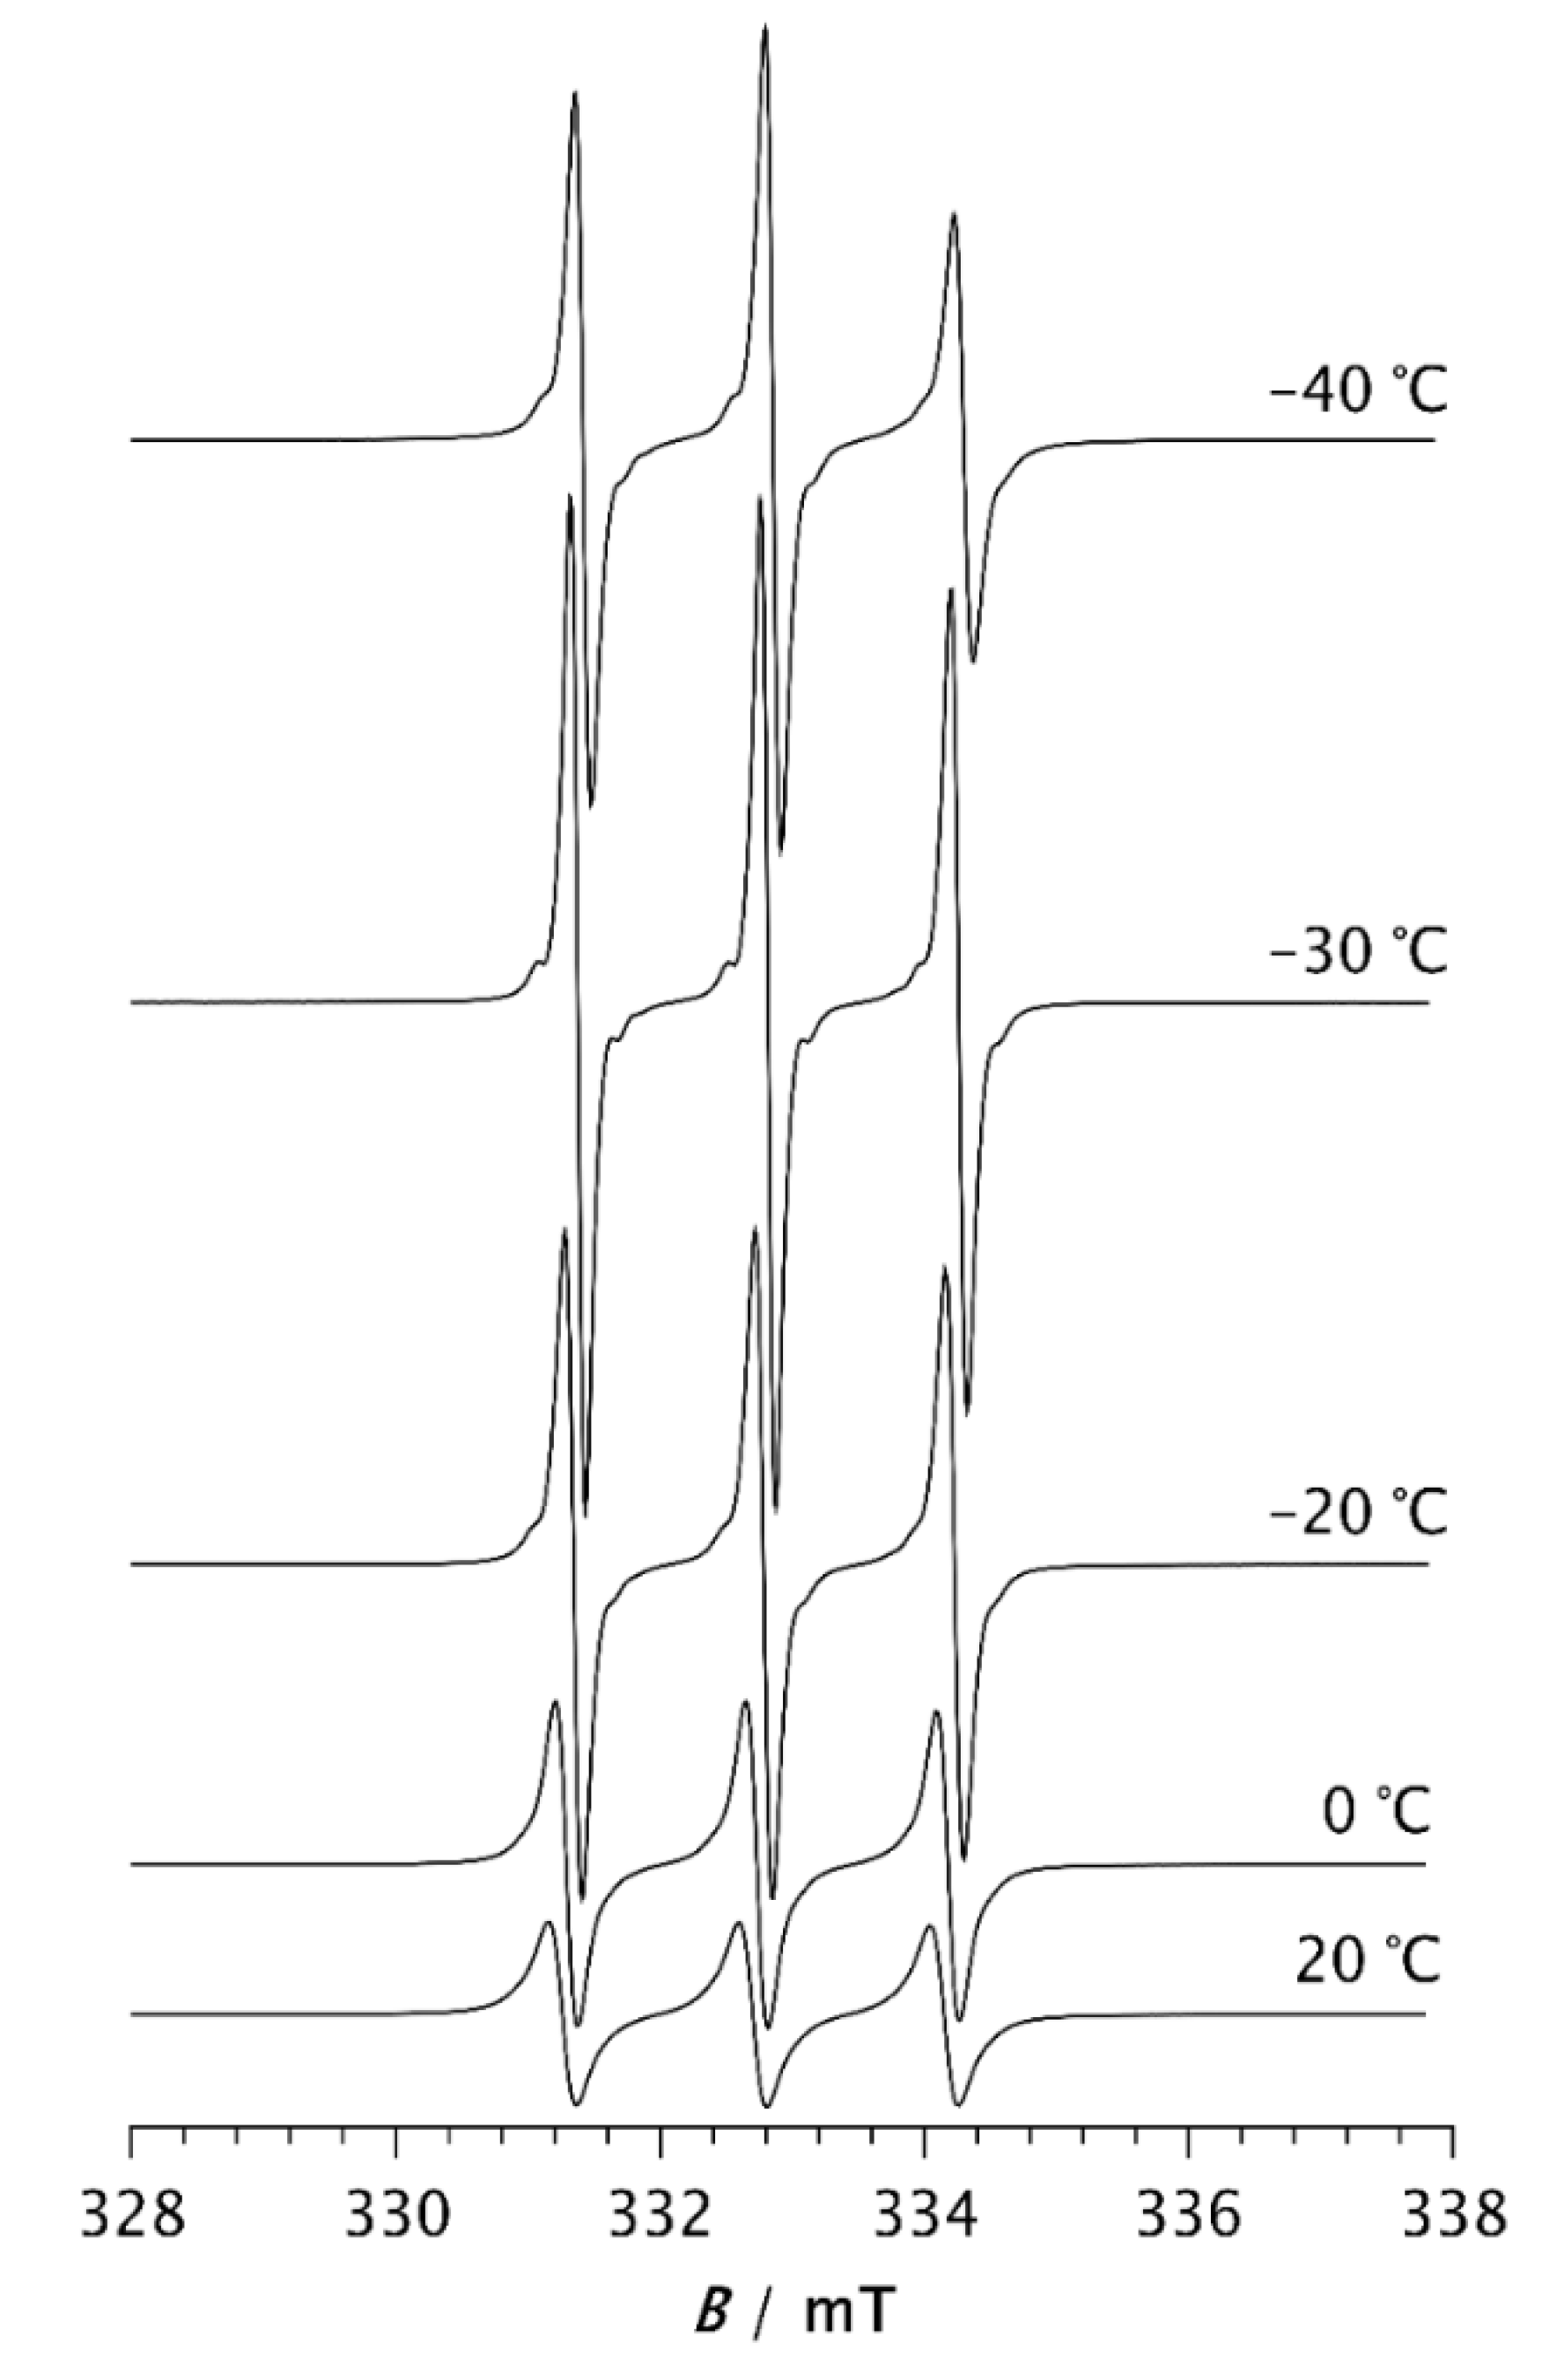
Figure 3.
Schematic presentation of a semicrystalline PDMS matrix and the distribution of the spin probe inside the amorphous region of PDMS at −85 °C after: a) 2 min and b) reaching the steady state.
Figure 3.
Schematic presentation of a semicrystalline PDMS matrix and the distribution of the spin probe inside the amorphous region of PDMS at −85 °C after: a) 2 min and b) reaching the steady state.
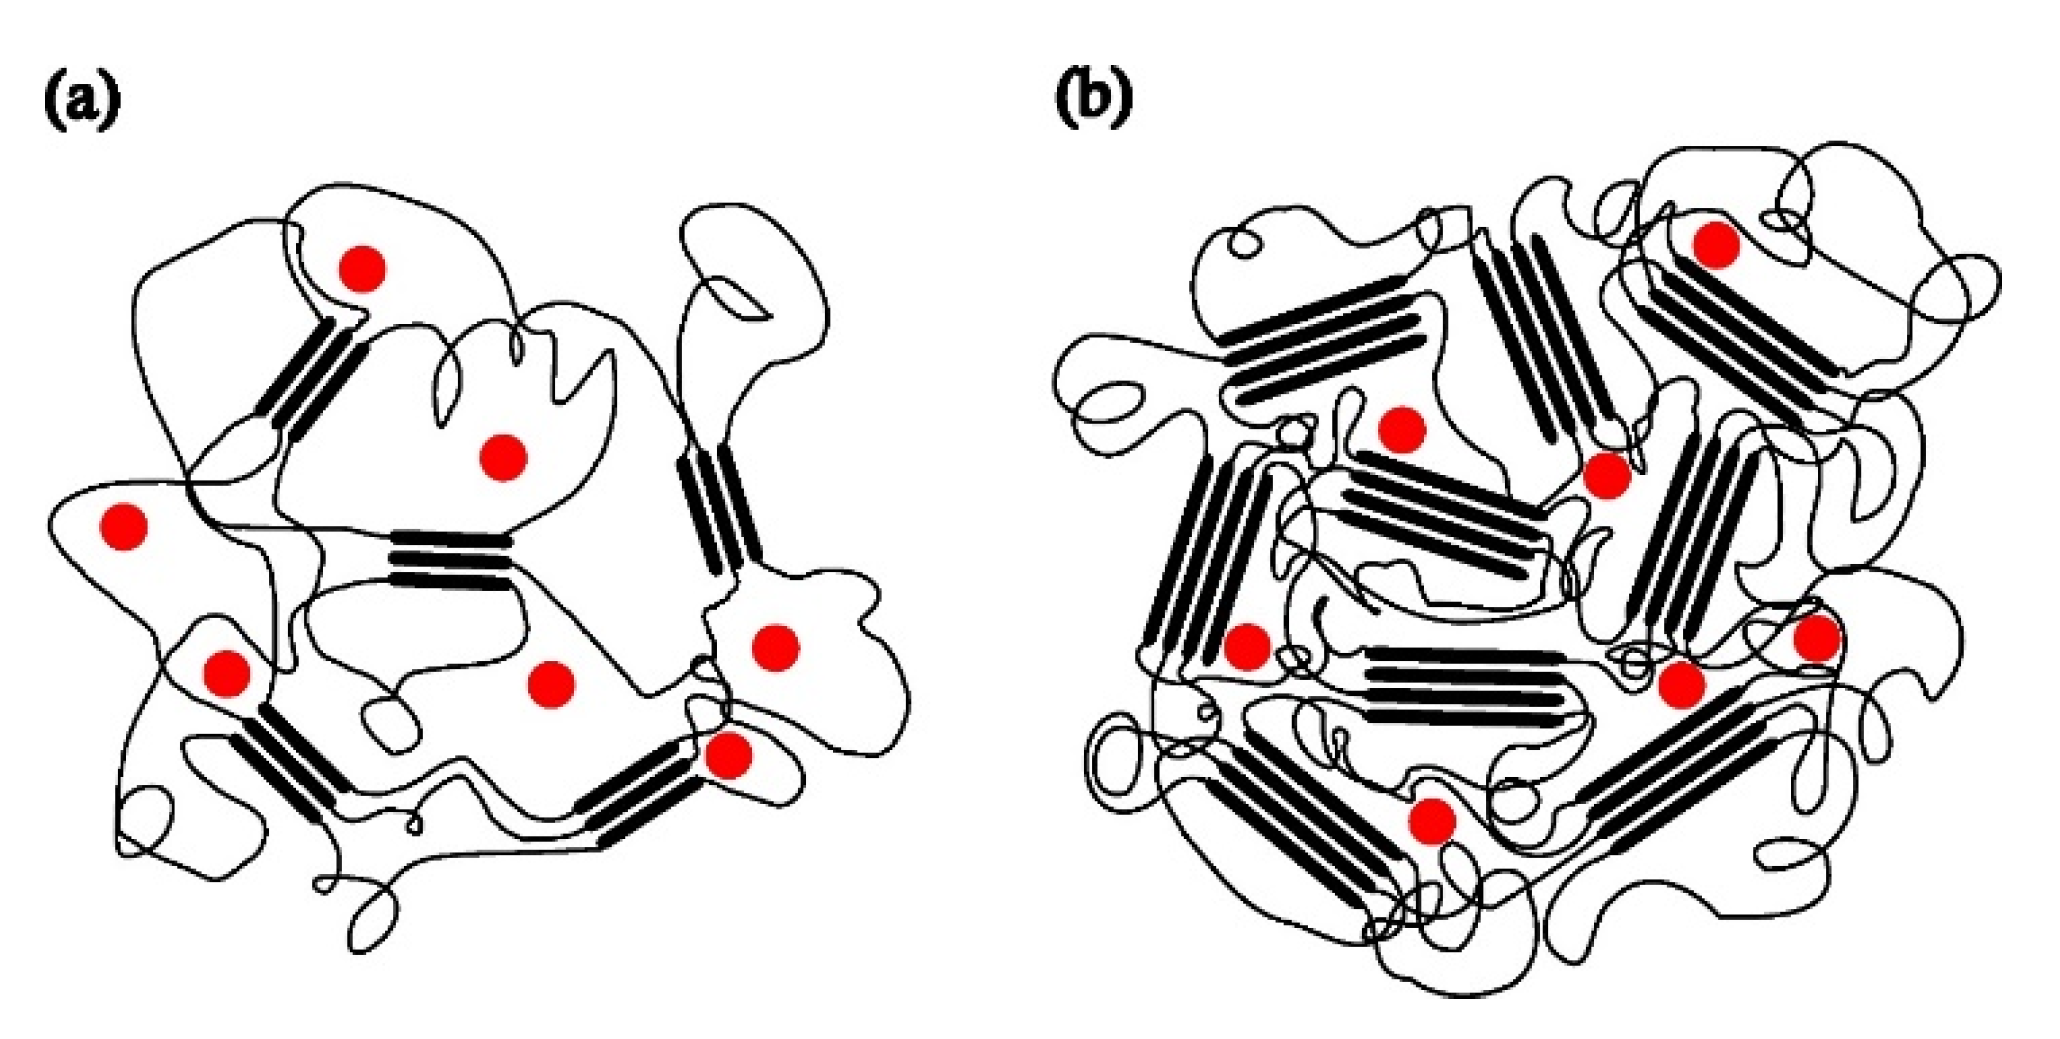
Figure 4.
ESR spectra of the spin probe measured as a function of time for PDMS held at –85 °C for: a) 2 min and b) 15 min, the time required to reach the steady state (t).
Figure 4.
ESR spectra of the spin probe measured as a function of time for PDMS held at –85 °C for: a) 2 min and b) 15 min, the time required to reach the steady state (t).
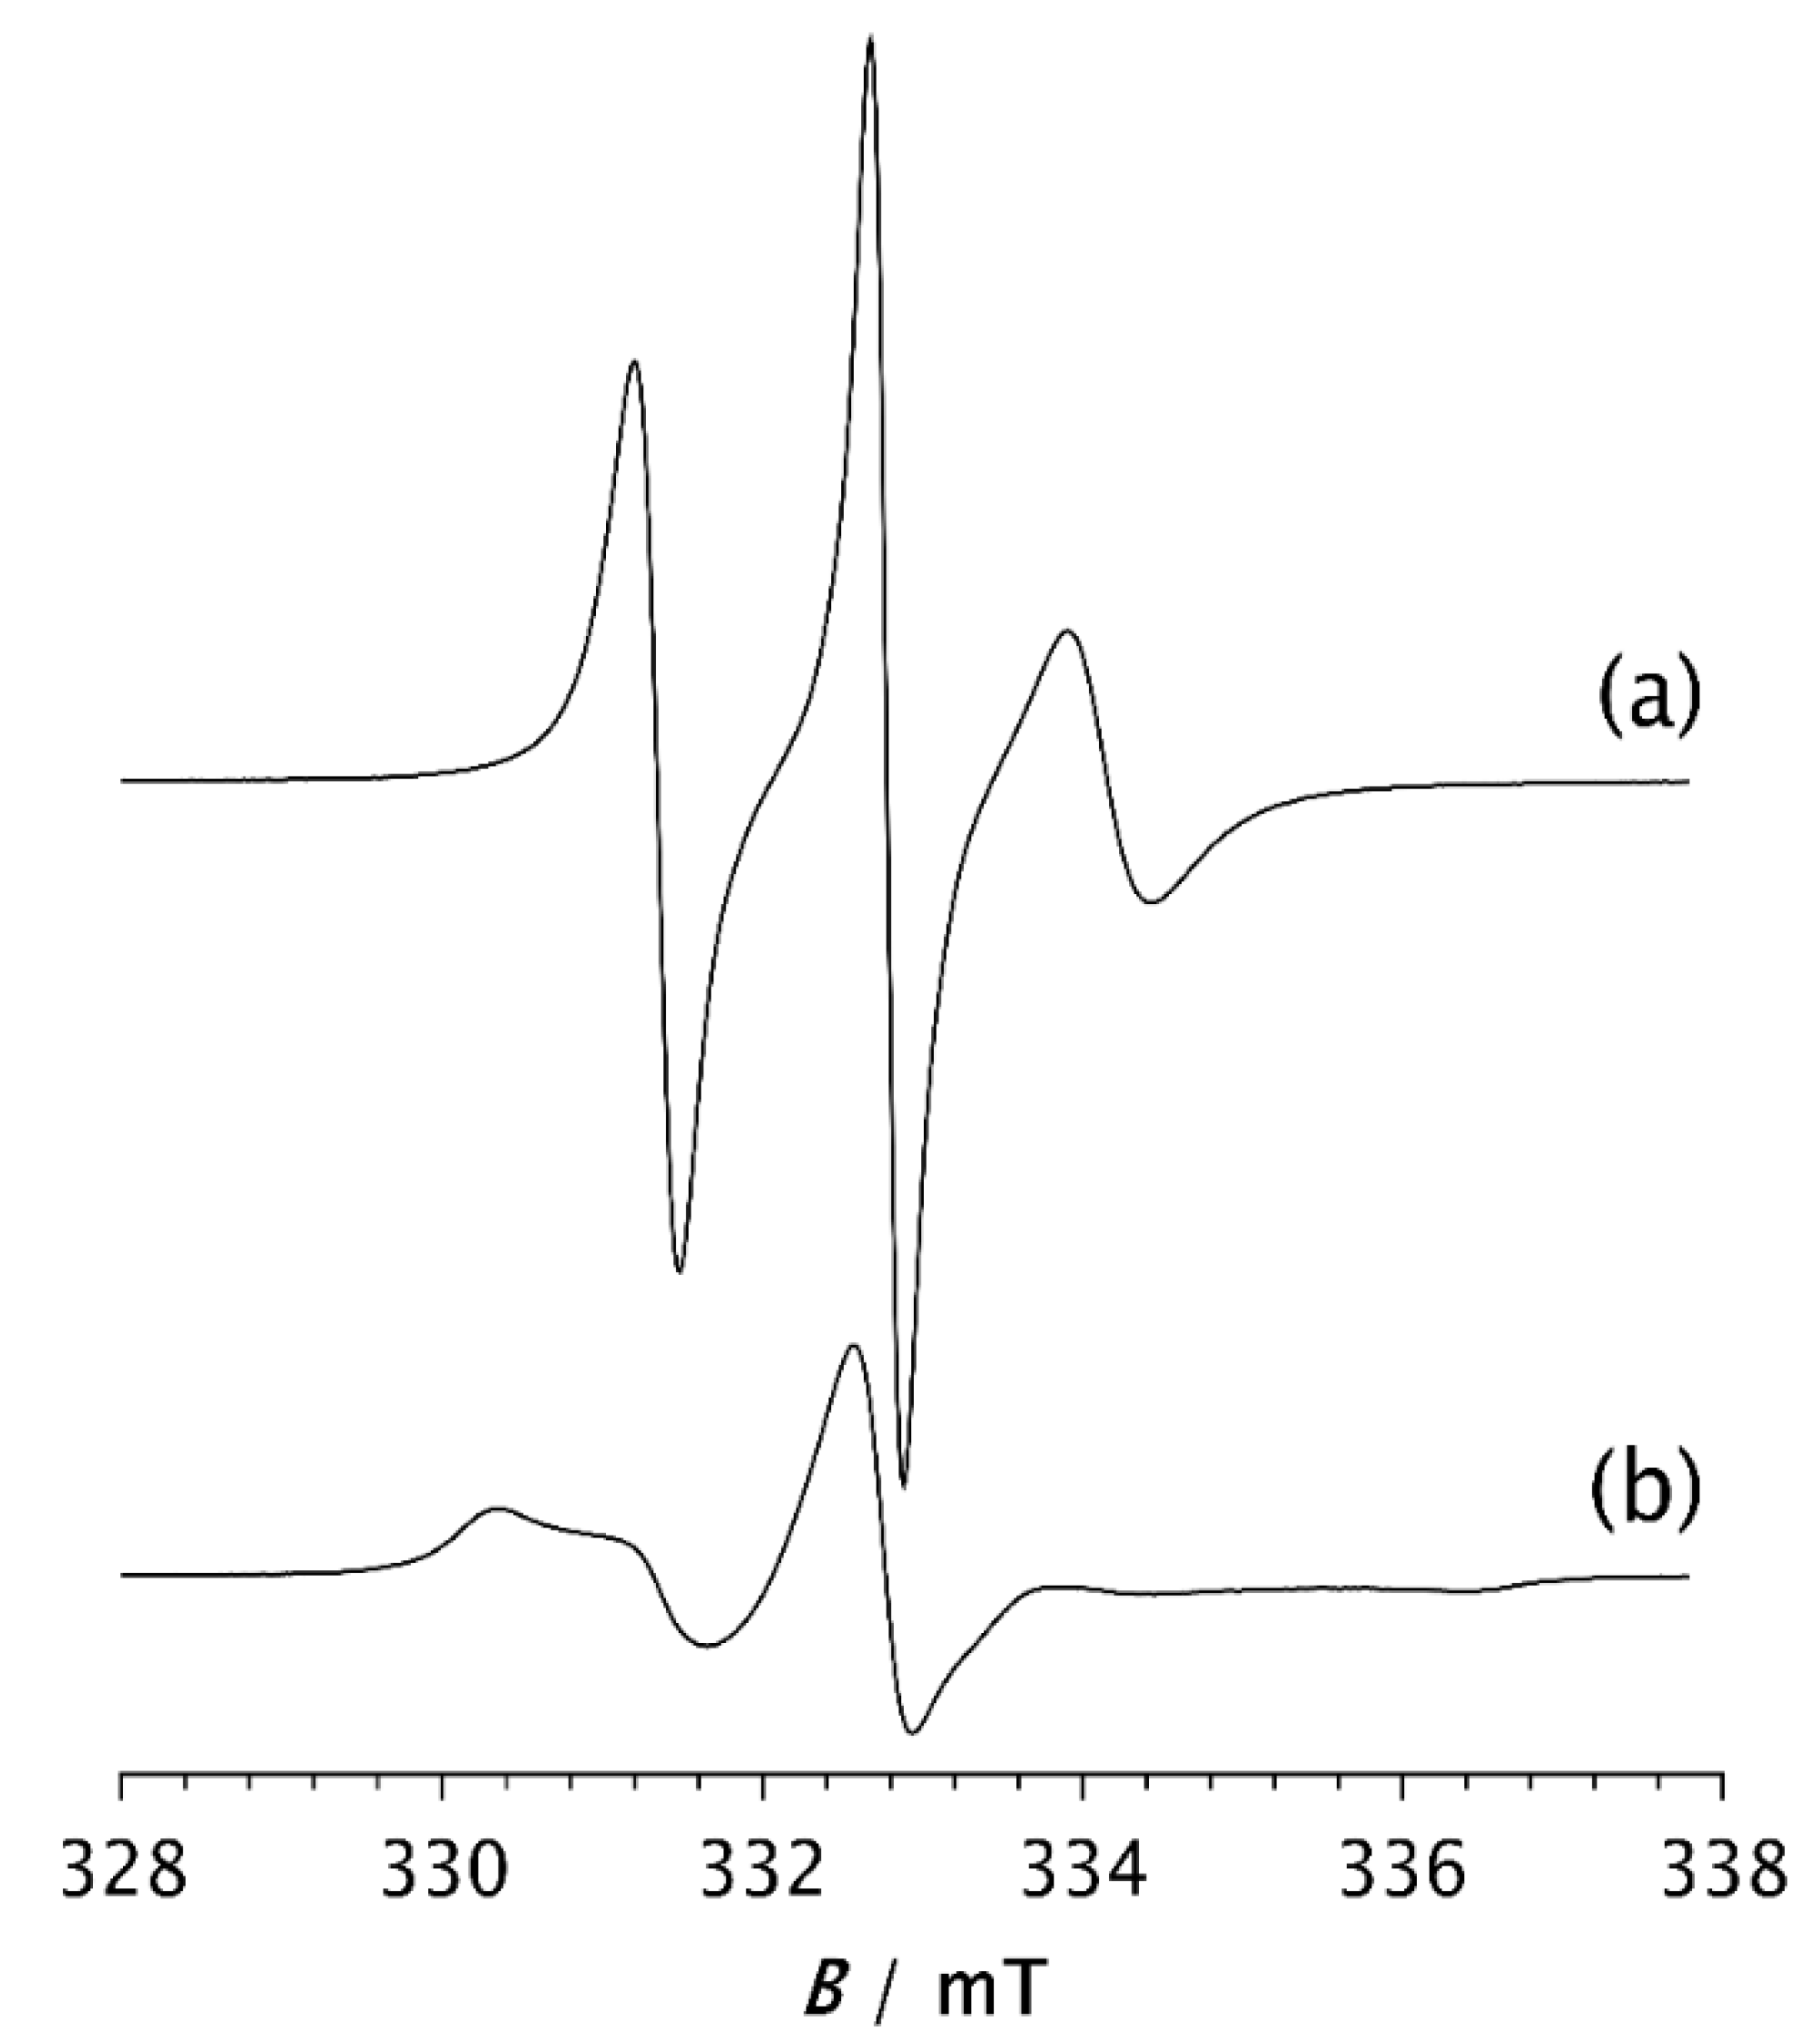
Figure 5.
ESR spectra of the spin probe in PDMS composites: a) 20AC, 20AS, 20X, b) 30AC, 30AS, 30X and c) 40AC, 40AS, 40X. The spectra were recorded 2 min after the samples had reached –85 °C.
Figure 5.
ESR spectra of the spin probe in PDMS composites: a) 20AC, 20AS, 20X, b) 30AC, 30AS, 30X and c) 40AC, 40AS, 40X. The spectra were recorded 2 min after the samples had reached –85 °C.
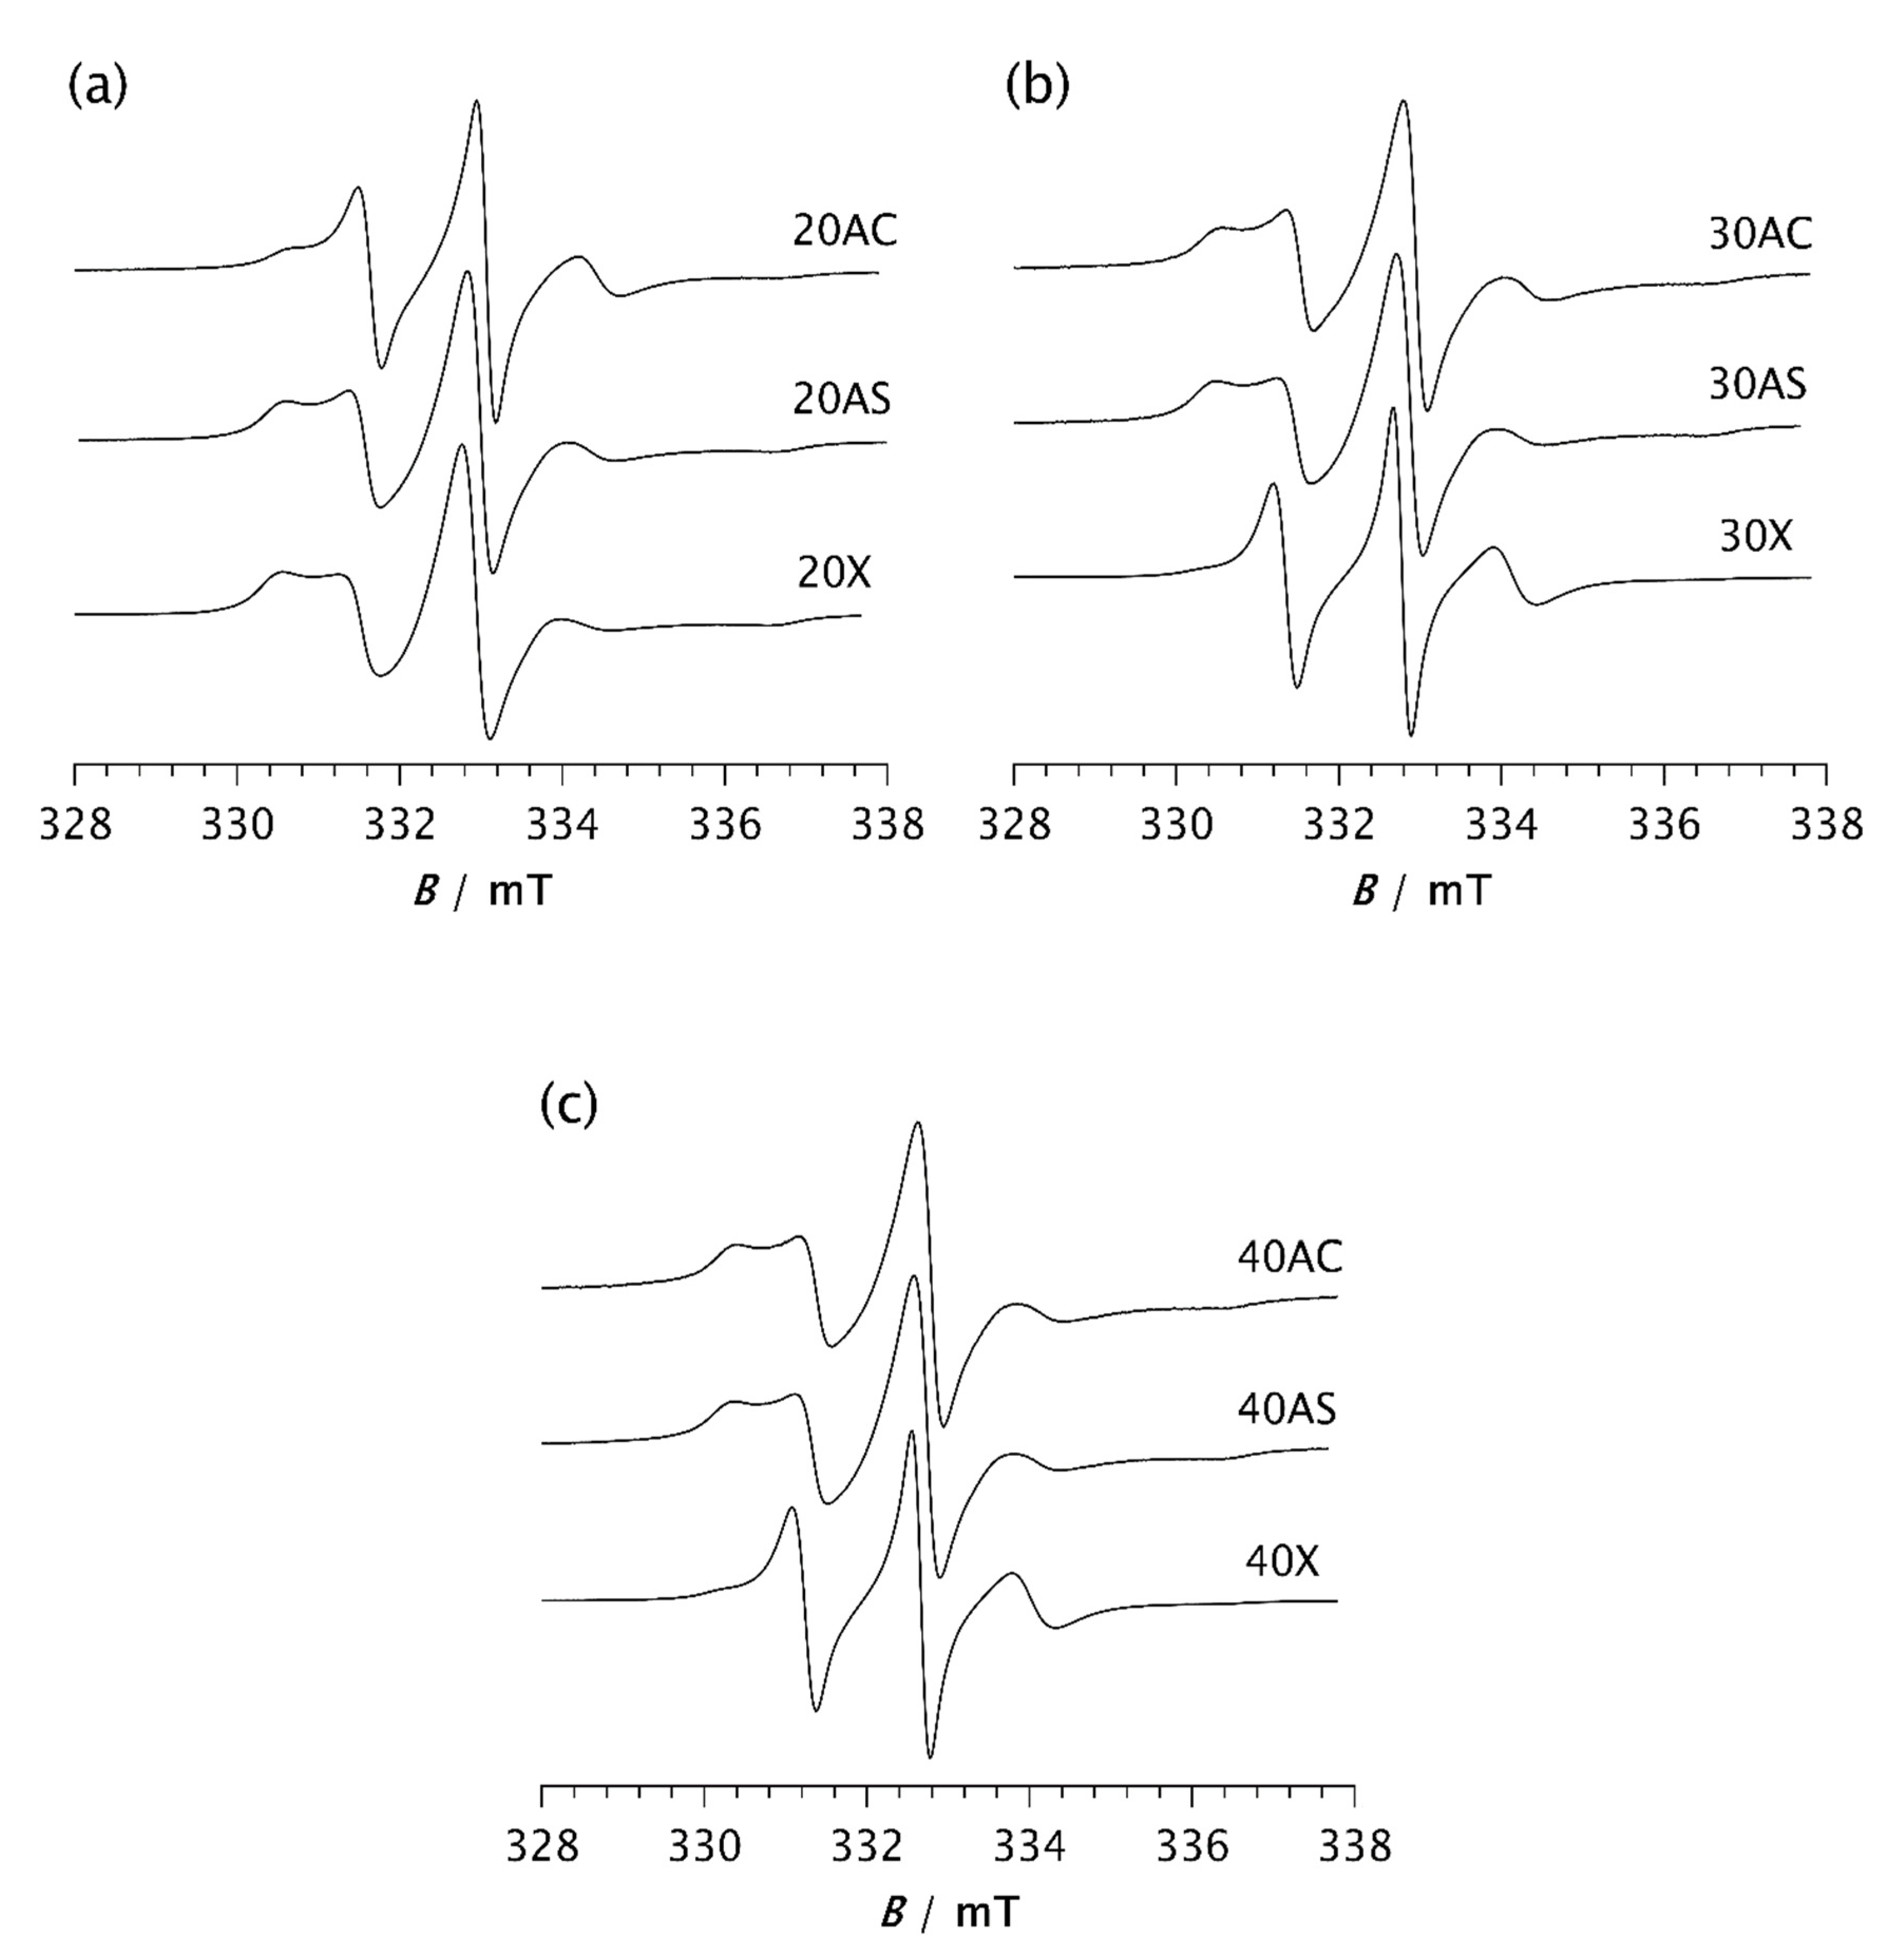
Figure 6.
ESR spectra of the spin probe in PDMS composites: a) 20AC, 20AS, 20X; b) 30AC, 30AS, 30X and c) 40AC, 40AS, 40X. The spectra were recorded at –85 °C after the time t, required to reach the steady state.
Figure 6.
ESR spectra of the spin probe in PDMS composites: a) 20AC, 20AS, 20X; b) 30AC, 30AS, 30X and c) 40AC, 40AS, 40X. The spectra were recorded at –85 °C after the time t, required to reach the steady state.
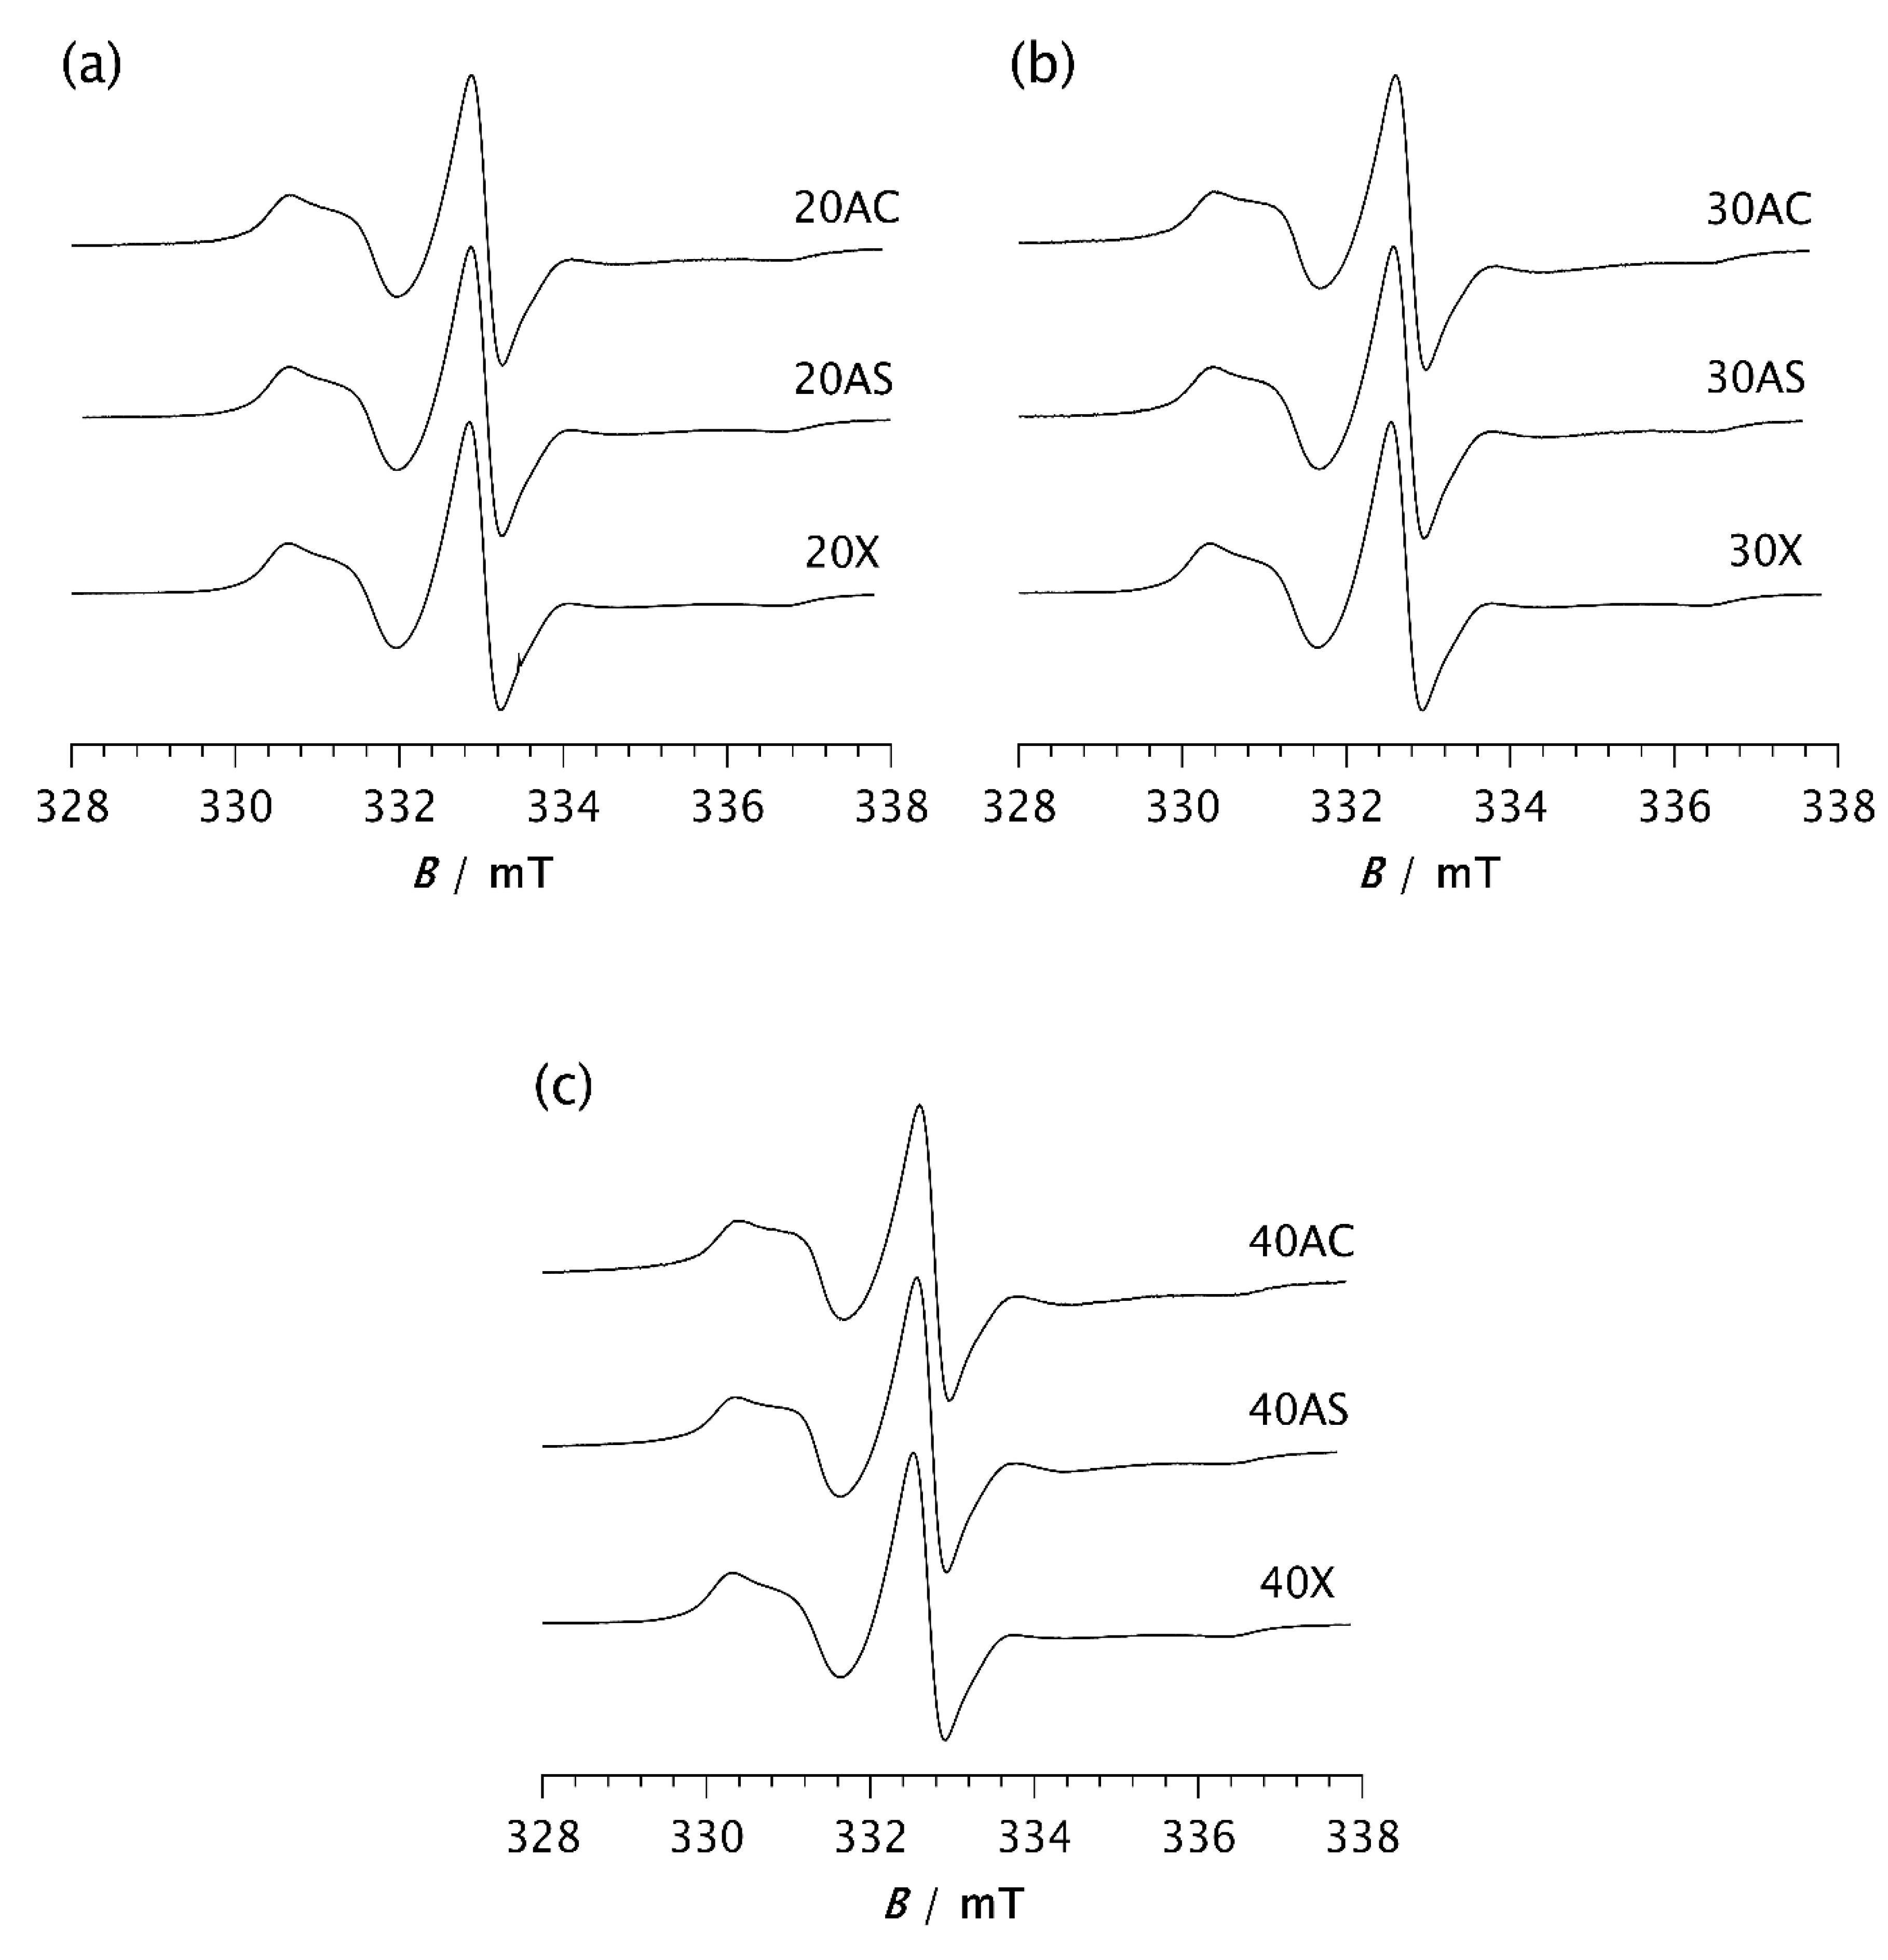
Figure 7.
DSC thermograms of a) pristine PDMS and PDMS-zeolite composites with the following loadings: b) 20 %, c) 30 % and d) 40 %.
Figure 7.
DSC thermograms of a) pristine PDMS and PDMS-zeolite composites with the following loadings: b) 20 %, c) 30 % and d) 40 %.
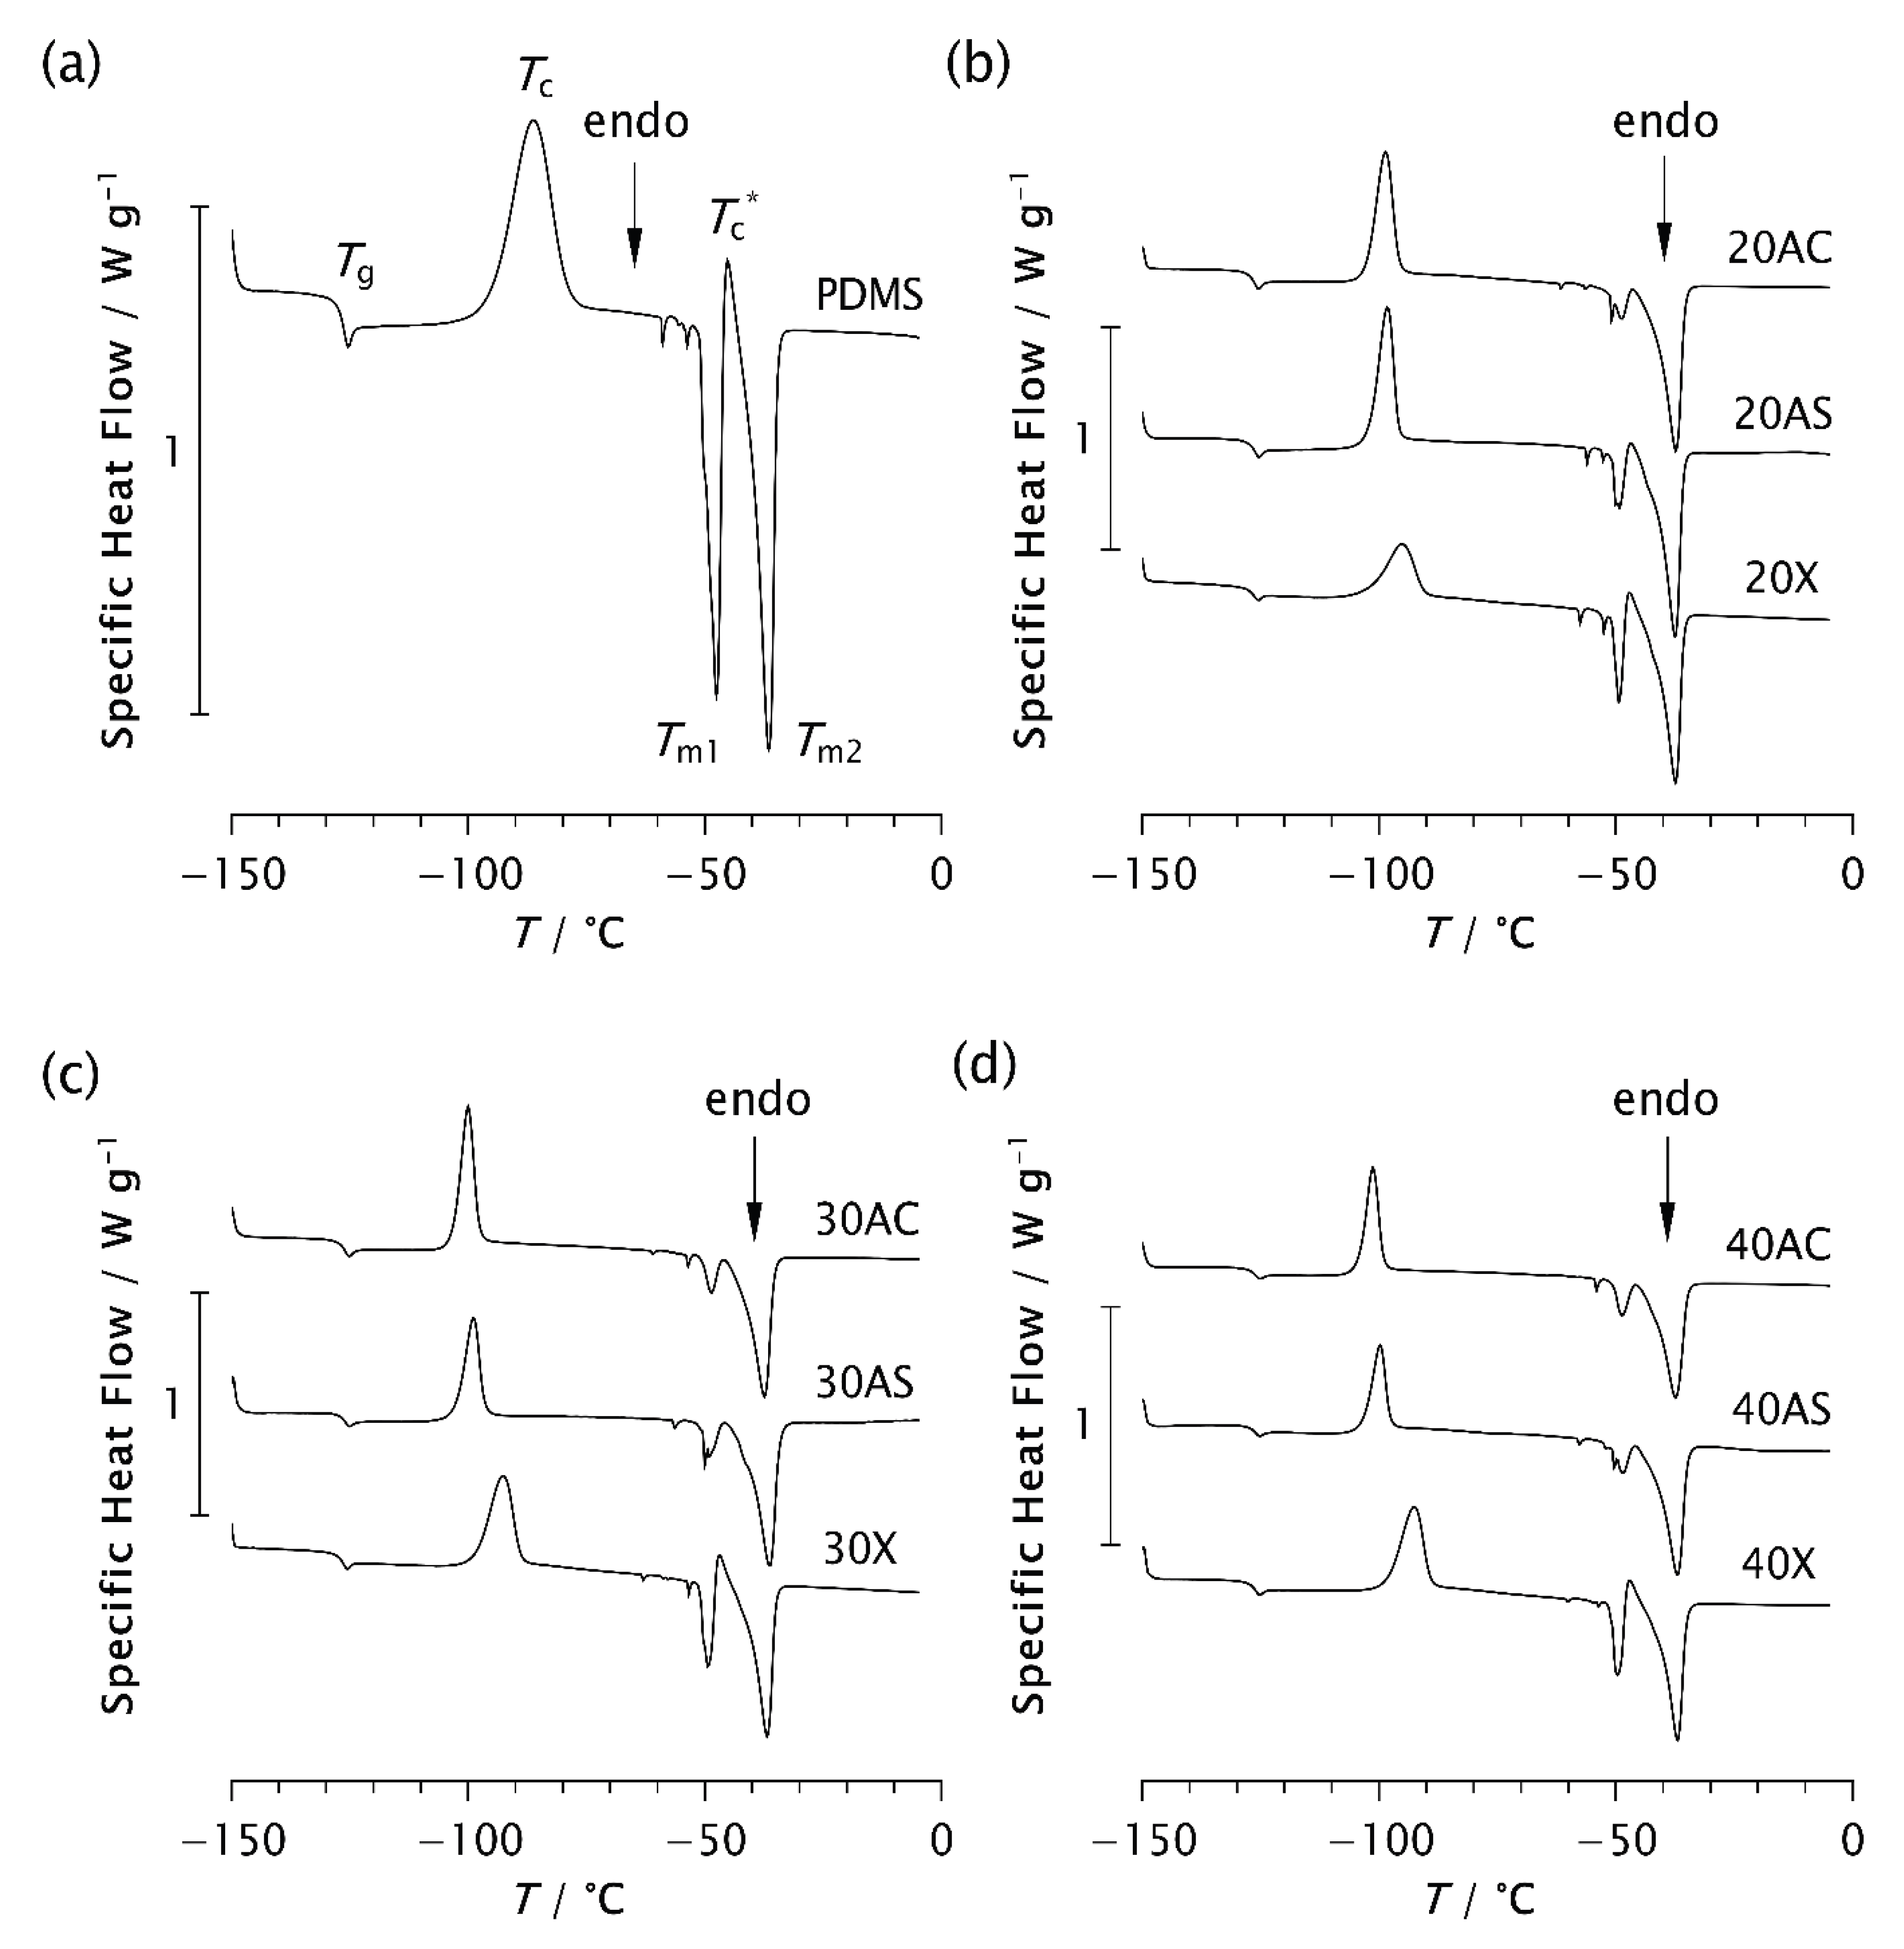

Table 1.
Composition and the labels of the investigated composite samples and pristine PDMS matrix.
| Matrix | Zeolite type | PDMS / wt% | Zeolite / wt% | Label |
|---|---|---|---|---|
| PDMS | - | 100 | 0 | PDMS |
| A - cubic | 80 | 20 | 20AC | |
| A - cubic | 70 | 30 | 30AC | |
| A - cubic | 60 | 40 | 40AC | |
| A - spherical | 80 | 20 | 20AS | |
| A - spherical | 70 | 30 | 30AS | |
| A - spherical | 60 | 40 | 40AS | |
| X | 80 | 20 | 20X | |
| X | 70 | 30 | 30X | |
| X | 60 | 40 | 40X |
Table 2.
Analysis of the ESR spectra measured at −85 °C: a) after 2 min and b) after the time t, required to reach the steady state. Shown are: the intensity ratio of the broad (Ib) and narrow (In) components for the low-field lines, the fraction of the slow (ϕs) and fast (ϕf) components and the corresponding correlation times of the slow (τRs) and fast (τRf) components.
| (a) | ||||||
| Sample | Ib/In | ϕs/% | ϕf/% | τRs/ns | τRf/ns | |
| PDMS | - | - | 100.0 | - | 2.59 | |
| 20AC | 0.277 | 62.2 | 37.8 | 10.99 | 1.42 | |
| 20AS | 0.769 | 81.2 | 18.8 | 10.76 | 1.59 | |
| 20X | 1.059 | 83.2 | 16.8 | 10.39 | 1.87 | |
| 30AC | 0.710 | 77.0 | 23.0 | 10.89 | 1.49 | |
| 30AS | 0.940 | 83.5 | 16.5 | 10.78 | 1.59 | |
| 30X | 0.110 | 36.5 | 63.5 | 11.49 | 1.49 | |
| 40AC | 0.833 | 84.0 | 16.0 | 11.02 | 1.59 | |
| 40AS | 0.849 | 83.7 | 16.3 | 10.54 | 1.59 | |
| 40X | 0.110 | 43.3 | 56.7 | 10.51 | 1.49 | |
| (b) | ||||||
| Sample | Ib/In | ϕs/% | ϕf/% | τRs/ns | τRf/ns | t/min |
| PDMS | 1.667 | 88.2 | 11.8 | 11.74 | 1.87 | 15 |
| 20AC | 1.769 | 90.3 | 9.7 | 11.12 | 1.86 | 5 |
| 20AS | 1.754 | 90.4 | 9.6 | 11.01 | 1.85 | 4 |
| 20X | 1.723 | 89.1 | 10.9 | 11.07 | 2.06 | 4 |
| 30AC | 1.500 | 89.0 | 11.0 | 10.40 | 3.28 | 4 |
| 30AS | 1.643 | 88.7 | 11.3 | 11.61 | 1.95 | 4 |
| 30X | 1.778 | 88.8 | 11.2 | 11.18 | 2.04 | 7 |
| 40AC | 1.531 | 89.0 | 11.0 | 10.27 | 3.26 | 3 |
| 40AS | 1.571 | 91.6 | 8.4 | 9.68 | 2.67 | 3 |
| 40X | 1.785 | 89.5 | 10.5 | 11.11 | 2.08 | 13 |
Table 3.
Phase transition temperatures determined by DSC: glass transition temperature (Tg), cold crystallisation temperature (Tc), recrystallisation temperature (Tc*) and melting temperatures (Tm1 and Tm2) for the investigated composites and pristine PDMS.
Table 3.
Phase transition temperatures determined by DSC: glass transition temperature (Tg), cold crystallisation temperature (Tc), recrystallisation temperature (Tc*) and melting temperatures (Tm1 and Tm2) for the investigated composites and pristine PDMS.
| Sample | Tg/°C | Tc/°C | Tc*/°C | Tm1/°C | Tm2/°C |
|---|---|---|---|---|---|
| PDMS | −126.35 | −86.15 | −45.18 | −47.66 | −36.53 |
| 20AC | −126.35 | −98.62 | - | −47.86 | −37.37 |
| 30AC | −126.02 | −99.94 | - | −48.59 | −37.38 |
| 40AC | −126.18 | −101.3 | - | −48.74 | −37.32 |
| 20AS | −126.35 | −98.13 | −46.70 | −49.25 | −37.52 |
| 30AS | −126.01 | −98.80 | - | −50.06 | −36.32 |
| 40AS | −126.18 | −99.81 | - | −48.58 | −36.86 |
| 20X | −126.51 | −95.16 | −46.86 | −49.43 | −37.33 |
| 30X | −126.52 | −92.64 | −46.88 | −49.49 | −36.92 |
| 40X | −126.18 | −92.65 | −47.03 | −49.60 | −36.83 |
Table 4.
Enthalpies of phase transitions for pristine PDMS and composite samples.
| Sample | ΔHc/Jg−1 | ΔHc*/Jg−1 | ΔHm1/Jg−1 | ΔHm2/Jg−1 |
|---|---|---|---|---|
| PDMS | 24.24 | 1.31 | −12.60 | −19.14 |
| 20AC | 18.86 | - | −3.46 | −25.00 |
| 30AC | 18.53 | - | −3.24 | −24.56 |
| 40AC | 14.78 | - | −3.57 | −23.20 |
| 20AS | 20.61 | 0.59 | −3.93 | −26.44 |
| 30AS | 15.53 | - | −4.10 | −26.74 |
| 40AS | 12.95 | - | −3.87 | −25.32 |
| 20X | 14.04 | 0.71 | −5.69 | −23.64 |
| 30X | 21.21 | 1.73 | −8.20 | −25.40 |
| 40X | 20.77 | 1.77 | −6.97 | −23.75 |
Table 5.
Degrees of crystallinity χc and χc* correspond to crystals formed during cold crystallisation and recrystallisation, respectively and χm1 and χm2 correspond to crystals melted at Tm1 and Tm2, respectively. Δχ is the amount of crystals formed during rapid cooling.
Table 5.
Degrees of crystallinity χc and χc* correspond to crystals formed during cold crystallisation and recrystallisation, respectively and χm1 and χm2 correspond to crystals melted at Tm1 and Tm2, respectively. Δχ is the amount of crystals formed during rapid cooling.
| Sample | χc/% | χc*/% | χm1/% | χm2/% | χ’ /% | χ /% | Δχ/% |
|---|---|---|---|---|---|---|---|
| PDMS | 64.81 | 3.50 | 33.69 | 51.18 | 68.31 | 84.87 | 16.56 |
| 20AC | 50.43 | - | 9.26 | 66.84 | 50.43 | 76.10 | 25.67 |
| 30AC | 49.55 | - | 8.66 | 65.67 | 49.55 | 74.33 | 24.78 |
| 40AC | 39.52 | - | 9.55 | 62.03 | 39.52 | 71.58 | 32.06 |
| 20AS | 55.11 | 1.58 | 10.51 | 70.70 | 56.69 | 81.21 | 24.52 |
| 30AS | 41.52 | - | 10.96 | 71.50 | 41.52 | 82.46 | 40.94 |
| 40AS | 34.63 | - | 10.35 | 67.70 | 34.63 | 78.05 | 43.42 |
| 20X | 37.54 | 1.90 | 15.21 | 63.21 | 39.44 | 78.42 | 38.98 |
| 30X | 56.71 | 4.63 | 21.93 | 67.91 | 61.34 | 89.84 | 28.50 |
| 40X | 55.53 | 4.73 | 18.64 | 63.50 | 60.26 | 82.14 | 21.88 |
Disclaimer/Publisher’s Note: The statements, opinions and data contained in all publications are solely those of the individual author(s) and contributor(s) and not of MDPI and/or the editor(s). MDPI and/or the editor(s) disclaim responsibility for any injury to people or property resulting from any ideas, methods, instructions or products referred to in the conte |
© 2025 by the authors. Licensee MDPI, Basel, Switzerland. This article is an open access article distributed under the terms and conditions of the Creative Commons Attribution (CC BY) license (http://creativecommons.org/licenses/by/4.0/).
Copyright: This open access article is published under a Creative Commons CC BY 4.0 license, which permit the free download, distribution, and reuse, provided that the author and preprint are cited in any reuse.


