
Submitted:
13 November 2025
Posted:
14 November 2025
You are already at the latest version
Abstract
In this study, we propose a dynamic fractal dimension modeling (DFDM) framework that integrates image analysis, wavelet-based fractal methods, and structural fractal geometry to quantify the evolution of pore complexity. Unlike conventional static fractal approaches, our method captures time-dependent scaling laws and captures the spatiotemporal evolution of pore networks. The results demonstrate that dynamic fractal dimensions provide a robust descriptor of multi-scale heterogeneity, effectively bridging pore-scale processes with reservoir-scale behavior. This framework not only advances the theoretical understanding of fractal pore dynamics but also establishes a predictive tool with potential applications in unconventional hydrocarbon recovery, geological CO2 sequestration, and multi-phase flow in porous media.
Keywords:
dynamic fractal dimension modeling (DFDM)
; wavelet analysis
; pore structure heterogeneity
; spatiotemporal evolution
; tight reservoirs
1. Introduction
The pore structure of tight reservoirs fundamentally controls hydrocarbon recovery, fluid transport, and CO2 storage efficiency. However, the intrinsic heterogeneity and complexity of these formations continue to pose major challenges for accurate reservoir characterization [1,2]. Shales, coals, and carbonate rocks exhibit multi-scale pore systems ranging from nanometre-scale micro-pores to interconnected micro-fractures, forming a hierarchical structure with significant spatial variability [3,4]. This heterogeneity governs adsorption, permeability, and capillary behavior, thereby influencing reservoir quality and production performance [5,6].
Recent advances in experimental and numerical techniques have greatly improved our understanding of pore systems. Methods such as low-pressure gas adsorption, NMR relaxometry, and X-ray micro-CT imaging have revealed complex pore geometries and connectivity patterns across scales [7,8]. Quantitative characterization of these pore networks has demonstrated that their morphology and surface roughness often obey fractal scaling laws, implying that fractal geometry provides a powerful mathematical framework for describing pore heterogeneity [9,10,11]. By linking geometric irregularity to measurable physical properties, fractal analysis enables the quantification of porosity, specific surface area, tortuosity, and permeability in unconventional reservoirs [12,13,14]. Building on this foundation, recent studies have refined fractal and multi-fractal descriptors to better capture heterogeneity across scales [15,16], enhancing our ability to relate micro-structural features to macroscopic transport behavior.
The concept of fractal dimensions has thus become an indispensable tool in reservoir petrophysics. Numerous studies have confirmed that fractal dimensions correlate strongly with reservoir parameters such as porosity, pore-size distribution, and permeability [17,18,19]. Notably, recent studies have demonstrated the applicability of pore-type-dependent fractal analysis to shale reservoirs [20] and advanced multi-fractal scaling for dynamic heterogeneity characterization [21,22]. Furthermore, multi-fractal analysis and wavelet-based methods have been successfully applied to distinguish the contributions of different pore scales and to describe the dynamic evolution of pore morphology [23,24,25]. Such approaches provide insights into the scaling and self-similarity of pore systems, revealing the hierarchical nature of storage and flow mechanisms within tight reservoirs [26,27].
Despite these advances, traditional fractal approaches typically treat pore geometry as static, neglecting the time-dependent evolution of pore structures under stress, temperature, and fluid-rock interaction [28,29]. This limitation hampers predictive modeling because actual reservoirs experience continuous structural evolution due to compaction, dissolution-precipitation reactions, and multi-phase flow [30,31]. Dynamic fractal models have been proposed to capture this temporal evolution [32], thereby establishing a conceptual bridge between micro-structural evolution and macroscopic transport behavior [33,34,35]. Such models enable the interpretation of hysteresis and permeability changes by quantifying how the fractal dimension evolves with stress and saturation [36].
Several researchers have further embedded fractal descriptors into digital rock physics and flow simulations. By coupling micro-CT imaging with lattice Boltzmann or pore-network models, fractal-based parameters can reproduce non-linear flow, capillary hysteresis, and wettability-dependent behavior [37]. Nevertheless, challenges remain in establishing a unified, physics-based dynamic fractal framework that captures the coupling between mechanical deformation, fluid saturation, and evolving pore topology [38,39]. Addressing this gap requires integrating time-lapse observations, scale-localized analysis, and constitutive relations that embed fractal descriptors within transport equations [40,41]. Recent studies have begun to explore this by tracking fractal dimension evolution during stress cycling and chemical alteration, revealing distinct signatures of structural versus topological transformations [42,43]. These insights highlight the potential of fractal geometry to serve as a bridge between micro-structure and macro-scale performance, enabling the formulation of data-efficient, physics-informed models for unconventional reservoir development.
In this context, the present study aims to develop a dynamic fractal characterization framework that couples evolving pore structure with transport and mechanical properties. By quantifying the temporal trajectory of fractal parameters under varying reservoir conditions, this framework provides a comprehensive link between pore-scale morphology and macroscopic flow behavior. Ultimately, it seeks to advance our understanding of how structural heterogeneity, fractal scaling, and dynamic evolution jointly control the performance of tight reservoirs under realistic subsurface environments.
In contrast to previous multi-fractal or wavelet-based approaches that statistically track heterogeneity (e.g., in shale or carbonate systems) and to stress-dependent fractal permeability models that remain static in time, the Dynamic Fractal Dimension Model (DFDM) introduces a physics-informed, time-dependent framework for pore-structure evolution.
The key technical innovations are:
- (i)
- formulation of a partial differential equation for the spatiotemporal evolution of the fractal dimension that integrates diffusive, stress-induced, and flow-driven mechanisms;
- (ii)
- establishment of explicit coupled relationships between fractal dimension, porosity, and permeability consistent with the Katz-Thompson scaling [44]; and
- (iii)
- incorporation of stochastic forcing to represent micro-scale restructuring under dynamic stress-flow interactions.
This study constitutes, to our knowledge, the first attempt to couple a partial differential equation (PDE) on the geometric fractal dimension with the porosity-permeability evolution under CO2-driven or stress-perturbed flow regimes. This coupling extends conventional static fractal descriptions toward predictive modeling of reservoir micro-structural dynamics. The fractal dimension represents the geometric fractal descriptor derived from the Hurst exponent (via ), which quantifies the morphological complexity of gray-level pore surfacesand represents the self-affine gray-level surface ().
2. Modeling
We propose a Dynamic Fractal Dimension Modeling (DFDM) framework that explicitly incorporates temporal variations into fractal descriptors. The central idea is that pore networks evolve as a combined effect of intrinsic reservoir stress-sensitivity and extrinsic fluid-rock interactions. By doing so, DFDM establishes a dynamic, process-oriented bridge between pore-scale complexity and reservoir-scale properties, thereby laying the foundation for the modeling framework presented in this section. The DFDM modeling framework is formulated in terms of explicit inputs, outputs, and underlying assumptions. The input data comprise thin-section micro-graphs of the rock matrix, which are first binarized for pore-matrix segmentation and subsequently used to reconstruct gray-level intensity surfaces for fractal analysis. These gray-level surfaces serve as the basis for estimating the geometric fractal dimension . Additional inputs include pressure-displacement curves along the core length, and external loading parameters describing boundary stress conditions. The primary output of the model is the spatiotemporal field of the dynamic fractal dimension , which captures the evolution of pore geometry under coupled mechanical and flow processes. In addition, auxiliary properties such as porosity and permeability can be inferred from through established fractal or empirical relationships. These derived quantities serve to bridge the dynamic fractal analysis with experimentally measurable transport parameters. Throughout this work, denotes the geometric fractal dimension controlling the spatiotemporal evolution of pore geometry within the PDE framework, whereas the empirically fitted (from Weibull scaling) is used solely for statistical correlation. The former () represents the physically evolving geometric descriptor of pore morphology, while the latter () captures statistical heterogeneity in pore-size distributions.
To ensure clarity and consistency in notation, all variables and parameters used in the modeling framework are summarized in Table A.1 of Appendix A.1.
2.1. Fundamentals of Fractal Geometry and Scaling Laws
Fractal geometry provides a powerful mathematical framework for characterizing the irregularity and heterogeneity of pore networks across scales. Unlike Euclidean measures, the fractal dimension quantifies scale-dependent complexity. The classical box-counting dimension is defined as:
Where denotes the number of covering boxes of size length covering the pore space,with representing the characteristic length scale of the imaging domain (in m). This approach has been widely implemented in tools such as ImageJ with the FracLac plugin, offering a fast and intuitive way to characterize pore morphology. However, such static approaches provide only a single-valued fractal dimension and cannot capture the temporal evolution of pore structures. In reservoir systems, pore networks evolve continuously under stress perturbations, fluid-rock interactions, and diagenetic processes, requiring a more advanced approach. To address these limitations, wavelet-based fractal analysis has been introduced (see Section 2.3). Unlike the box-counting method, wavelets possess strong time-frequency localization, making them particularly effective in analyzing non-stationary signals, local heterogeneity, and dynamic evolution. values derived from the wavelet-based approach were compared with those obtained from the classical box-counting method. Both methods yielded consistent mean values (), while exhibited smoother temporal trends and improved stability under noisy or non-stationary conditions. This confirms that the wavelet analysis does not alter the underlying fractal scaling but provides enhanced localization and noise resilience. This establishes the theoretical basis for the development of the Dynamic Fractal Dimension Model (DFDM) presented later.
2.2. Probability Distribution of Pore Networks
Beyond scaling descriptors, the stochastic nature of pore geometry can be quantified via probability distribution functions (PDFs). The Weibull distribution provides a flexible representation of pore radius statistics:
Here, is the Weibull modulus reflecting heterogeneity, and is the scale parameter representing characteristic pore size. For , the distribution converges to a delta function corresponding to homogeneous pores; conversely, small values indicate wide pore size dispersion. This statistical representation provides a baseline for linking probability models with fractal scaling laws. The cumulative distribution function (CDF) is expressed as:
Which can be directly linked to porosity by integrating over pore volumes:
To reconcile statistical and fractal descriptions, we impose the condition that the pore number at scale follows a power law:
By comparison with the Weibull PDF, the scale-dependent exponent is obtained as:
The detailed derivation of Eq.2.6, including the underlying assumptions, is provided in A.2.1 of Appendix A.2. It is worth noting that Eq.2.6 defines a scale-dependent , which varies monotonically with . In the asymptotic regime , the exponential term dominates, leading to ,whereas for , . Therefore, represents the limiting scale exponent at intermediate scales, whereas, continuously evolves with both and the pore-scale parameters . The formulation captures scale-dependent irregularity and bridges probabilistic and fractal descriptions of pore structures.
- Limiting Cases
Homogeneous Reservoir ():, indicating near-Euclidean uniform pore geometry.
Highly Heterogeneous Reservoir (): exhibits strong dependence on pore size , indicating pronounced multi-scale irregularity.
Dynamic Evolution: If evolves with compaction, explicitly tracks spatiotemporal heterogeneity.
2.3. Dynamic Fractal Dimension Model (DFDM)
The proposed Dynamic Fractal Dimension Modeling (DFDM) framework establishes a systematic workflow to bridge experimental pore-scale characterization with reservoir-scale predictive modeling. Unlike static fractal approaches (e.g., Image J/FracLac), DFDM explicitly incorporates temporal variability and dynamic interactions, making it particularly suited for stress-sensitive tight reservoirs.
The framework integrates five interconnected modules (Figure 1): (i) acquisition of pore-scale digital images, (ii) multi-scale decomposition using wavelet transforms, (iii) derivation of dynamic fractal dimensions through structural geometry and time-dependent corrections, and (iv) validation against experimental measurements. This hierarchical workflow transforms raw experimental data into dynamic descriptors of pore evolution, ultimately enabling numerical simulations of multi-phase flow and storage processes.
2.3.1. Governing Principles and Dynamic Scaling Law
Within DFDM, the fractal dimension evolves dynamically with the physical state of the reservoir, reflecting the coupled influence of porosity change , stress perturbation , and fluid transport :
Here, represents a nonlinear coupling function quantifying the rate and direction of fractal evolution under multi-physical perturbations. This dynamic scaling law provides a process-based link between pore-structure evolution and the time-dependent fractal descriptors. Formally, the dynamic fractal dimension is defined from the time-dependent occupation number as the local scaling exponent:,
This expression captures the evolution of pore structures at different scales over time . To account for stochastic micro-structural variability and non-stationary topology, we generalize the classical power law to:
Where is a normalization associated with porosity and accounts for random micro-structural variability, This decomposition cleanly separates deterministic evolution (captured by ) from stochastic variability.
Wavelet analysis provides the necessary multi-resolution machinery to track these dynamics. The continuous wavelet transform decomposes pore-image signals across scales and positions .
And its energy spectrum follows a fractal scaling law with Hurst exponent :
The Hurst exponent quantifies the long-term memory of pore structure evolution, reflecting the self-similar behavior of the pore network across different scales.
In 2D thin sections reconstructed as gray-level scalar fields embedded in , the relationship between the Hurst exponent and geometric fractal dimension follows the standard self-affine form , where quantifies the spectral roughness obtained from wavelet-based analysis, and the embedding dimension reflects the gray-level surface representation .
Higher indicates smoother, more persistent connectivity (lower ), while smaller corresponds to increased irregularity and rougher pore structures (higher ).
This correspondence can be intuitively interpreted in terms of pore morphology. A higher Hurst exponent represents local variations in pore radius are gradual and the structure approaches a quasi-continuous texture, thus yielding a lower . Conversely, a lower characterized by abrupt multi-scale fluctuations in pore boundaries and higher structural roughness, which correspond to a larger . This morphological contrast, high H/low D versus low H/high D, provides a physical interpretation of the spectral-geometric linkage in heterogeneous reservoirs. This consistent D-H relation establishes the physical linkage between spectral roughness and morphological complexity in the DFDM framework.
Under static equilibrium, is time-invariant and , then the fractal dimension reduces to a constant value . However, under dynamic conditions (such as during compaction, fracture development, or fluid injection), the fractal dimension evolves as a function of both time and pore structure changes, reflecting the dynamic coupling between mechanical compaction, fluid flow, and diagenesis. The evolution of pore networks in tight reservoirs arises from two dominant processes: mechanical compaction and stress redistribution, reducing pore volume; Fluid-rock interactions, dissolving pores or fractures at multiple scales. We therefore define the dynamic fractal dimension as a spatiotemporal field variable, dependent on both time and spatial coordinate :
Here, denotes the local occupation number of pores at resolution , time , and position . Building on this spatiotemporal definition, the classical scaling laws must be generalized to incorporate temporal variability, motivating a Dynamic Scaling Law in which time-dependent coefficients capture the evolving effects of stress, fluid flow, and diagenesis.
Here, represents the initial scaling constant linked to porosity at , is the compaction rate parameter that governs pore size evolution. By differentiating the generalized power-law scaling equation with respect to time, we derive the dynamic scaling equation, which links the time-dependent evolution of the fractal dimension to the temporal variation in the pore network structure:
This equation quantifies how the internal reorganization of the pore network modulates the rate of change of fractal dimension. The detailed algorithm for parameter extraction and stability evaluation is provided in A.2.2 of Appendix A.2.
2.3.2. Wavelet Spectral Estimation
The multiscale analysis of pore heterogeneity was conducted using the FracLab 2.2 toolbox, which integrates continuous wavelet transforms and fractal geometry descriptors. The Morlet wavelet was adopted as the mother function for the continuous wavelet transform owing to its superior time-frequency localization and smooth oscillatory kernel, ensuring accurate characterization of pore-boundary irregularities across scales. Prior to scale decomposition, image noise was mitigated through wavelet shrinkage filtering, where high-frequency coefficients were adaptively thresholded to suppress random noise while preserving geometrical edges and connectivity of the pore network. This procedure effectively enhances the signal-to-noise ratio without compromising multiscale roughness, thus improving the stability of the subsequent fractal estimation.
To incorporate the temporal evolution of pore heterogeneity, spatial coordinates were treated as a pseudo-time variable, reflecting the progressive compaction along the sample core. This spatiotemporal mapping enables tracking of the dynamic Hurst exponent and the corresponding effective fractal dimension , linking structural scaling variability with evolving stress and fluid effects.
The wavelet energy spectrum of pore images evolves with time as:
This equation reflects the redistribution of pore-scale heterogeneity across scales, allowing dynamic tracking of structural evolution, where a is scale, b is position, and t is time. Empirically,
,enabling a direct time-resolved estimate of the Hurst exponent. For gray-level pore surfaces (embedded in ), the effective fractal dimension is obtained using . This formulation is consistent with the self-affine scaling theory of natural surfaces and provides a physically justified link between wavelet-based roughness and fractal geometry.
To incorporate stress and flow effects in a tractable way for reservoir-scale simulations, we approximate the time-varying fractal dimension inferred from wavelet spectra by a reduced-order phenomenological expression:
Here, denotes the static baseline fractal dimension ( in this study).
The coefficients and quantify the temporal and spatial attenuation of the fractal dimension,, respectively (both dimensionless). The term represents represents small-scale oscillations in local pore geometry, where (dimensionless) controls the oscillation amplitude and local oscillations, and (dimensionless) governs its exponential damping over time. This oscillatory term captures the periodic heterogeneity of pore throats and grain contacts observed in thin-section images, while the decay factor ensures that these fluctuations gradually vanish as the system approaches a quasi-steady fractal state. Such a reduced-order formulation maintains physical interpretability, while keeping the model computationally efficient for core-scale simulations and readily extensible to reservoir-scale applications.
2.3.3. Coupled Fluid-Solid Interaction
Beyond spectral estimation, pore structure dynamics are also strongly influenced by external driving forces, particularly the coupling between stress perturbations and fluid invasion. We define an effective fractal dimension governed by the competition between mechanical compaction (stress tensor ) and flow-driven enhancement (pressure gradient ):
Here, quantifies stress sensitivity (volumetric stress promotes pore closure and structural simplification), while quantifies fluid-induced dissolution/scouring and the opening of new flow channels.
Diagnostic regimes:
Pure mechanical compaction (): , fractal dimension decreases monotonically as pores collapse under stress.
Pure fluid dissolution , fractal dimension increases due to flow-driven pore opening and dissolution.
Steady-state equilibrium , pore system reaches a dynamic equilibrium where compaction and dissolution exactly balance, maintaining a stable fractal state.
This formulation indicates that compaction processes generally decrease fractal complexity, whereas fluid-solid interactions driven by strong pressure gradients enhance it, highlighting the competing roles of stress and flow in governing pore evolution, providing a first-order closure linking fractal descriptors to measurable geomechanical and hydraulic parameters.
2.3.4. Dynamic Porosity-Permeability Relationship
To connect fractal dynamics to transport properties, we express porosity and permeability as functions of Following Katz-Thompson-type scaling, permeability obeys a fractal-dependent power law:
The equation describes how permeability evolves over time as a function of porosity, with the fractal dimension dictating the scaling relationship between these two properties. This is based on the assumption that changes in the pore network structure, as characterized by , significantly influence the connectivity of the pore spaces, which in turn impacts the flow characteristics of the reservoir.
Mechanistically, decreasing under compaction generally correlates with declining permeability, while increasing under fluid-induced reorganization correlates with enhanced permeability through improved connectivity. Tracking the evolution of therefore provides a predictive handle on how reservoir processes (compaction, dissolution, fracture activation) reshape the permeability-porosity relation over time.
2.4. Governing Equation for Spatiotemporal Fractal Evolution
2.4.1. Field Representation
We consider the fractal dimension as a continuous scalar field defined over the reservoir domain . Its dynamics are driven by competing processes: Compaction-driven reduction, caused by mechanical stress and pore closure; Fluid-driven enhancement, arising from dissolution, fracturing, and reorganization; Diffusive smoothing, redistributing pore-scale heterogeneity across scales. Thus, the general governing PDE takes the form:
Here, is the fractal diffusivity (smoothing coefficient), the diffusive term smooths local fluctuations in pore-scale heterogeneity; is the stress-compaction coefficient, the compaction term accounts for stress-driven pore closure; is the fluid enhancement coefficient, the fluid-driven enhancement term reflects dissolution and flow-induced reorganization of pore networks. The stochastic forcing term captures random fracture nucleation, mineral dissolution, and other unresolved micro-scale processes. The numerical discretization and solver configuration for Eq 2.12 detailed in Appendix A.4.
This PDE naturally embeds the dynamic porosity-permeability relationship (Section 2.3.4) within a spatiotemporal framework. Specifically, the solution of governs the evolution of porosity and permeability across the reservoir domain, thereby coupling micro-scale fractal dynamics with macro-scale transport properties.
To describe the dependence of porosity on the evolving fractal morphology,porosity evolves in tandem with fractal dimension, a nonlinear empirical coupling relationship proposed [45,46]:
Where and denote the stress-induced compaction and structure-driven dilation rates, respectively. The function characterizes the influence of fractal geometry on pore connectivity and is expressed as :, Where is the upper-bound porosity at the critical fractal dimension , and is an empirical sensitivity exponent calibrated from image-derived pore morphology.
This monotonic form captures the enhanced connectivity and reduced tortuosity associated with increasing , consistent with the multiscale features observed in Section 2.3.2. The permeability-porosity relationship is formulated as a fractal scaling law [44,45].
Similarly,Permeability follows a fractal-dependent scaling [44]:
Physically, this equation characterizes the hydraulic aspect of fractal behavior, where the exponent captures the bidirectional feedback between fractal dynamics and flow capacity. Specifically, variations in modify both and ,while stress-induced permeability alterations in turn reshape the evolving fractal geometry.
It is noted that in the empirical expression represents the geometric scaling of porosity with fractal dimension, whereas Eq. 2.21 reflects the hydraulic scaling between permeability and porosity. Together, these relations provide a physically consistent framework for linking pore-scale morphology and flow behavior within the DFDM model.
2.4.2. Boundary and Initial Conditions
For simplicity, the spatial evolution of was modeled along the axial direction of the core plug (1D representation), which captures the dominant gradient of pore compaction and fluid transport.
Domain: The governing domain corresponds to a 1D spatial representation of the flow-through core plug,
Initial condition: The initial condition for the effective fractal dimension was prescribed as: , the effective fractal dimension field was initialized as a spatially varying baseline obtained from the static grayscale maps, , and is a small random perturbation representing natural micro-scale heterogeneity.
Boundary conditions: At the inlet and outlet , Neumann-type boundary conditions: was imposed, ensuring no net transfer of structural irregularity across the boundaries.
Stochastic term: The stochastic forcing term was implemented as a zero-mean Gaussian random field with short spatial and temporal correlation lengths , which emulates unresolved local perturbations due to microfracture growth and stress fluctuations. Here, and denote the spatial and temporal correlation scales of the stochastic forcing field, respectively, both much smaller than the characteristic domain length and simulation duration , ensuring effectively uncorrelated (white-noise-like) perturbations. Representative values used in calibration satisfy and , consistent with the image resolution and temporal discretization scales. The variance of the stochastic term was calibrated to match the experimental scatter of the measured fractal dimension , as obtained from the static grayscale pore maps.
2.4.3. Limiting Cases of the PDE
The general PDE admits several limiting forms under specific physical conditions, which provide physical intuition for the role of diffusion, stress, and flow.
Case 1: Pure Diffusion .
This case corresponds to the redistribution of pore-scale heterogeneity without net gain or loss of pore volume, analogous to a heat equation-pore complexity homogenizes over time.
Case 2: Stress-Dominated Under this regime, compaction continuously decreases pore connectivity, fractal dimension decreases steadily with compaction monotonically.
Case 3: Flow-Dominate
Here, Dissolution and flow-driven reorganization promote the opening of new pathways, leading to an increase in fractal complexity.
These limiting cases highlight the fundamental physical regimes captured by the governing PDE, ranging from pure diffusion to stress- and flow-dominated evolution.
2.5. Numerical Implementation Strategy
2.5.1. Discretization
We discretize the governing PDE using a finite element/finite volume method, depending on the geometry of reservoir samples. The weak formulation is:
Here, is a test function. In practice, dynamic fractal dimension calculations can be implemented using both box-counting and wavelet-based methods. MATLAB routines and ImageJ plugins (e.g., FracLac) enable efficient fractal estimation and numerical stability. This combined strategy highlights the advantage of wavelet transforms in resolving multi-scale dynamics, whereas box-counting offers a robust baseline for static scaling analysis.
2.5.2. Multi-Scale Up-Scaling and Stability Constraints
Since reservoir processes span nano-meters to meters, we adopt a two-scale strategy to ensure both physical and numerical stability.
Micro-scale (cast thin-section images): Fractal evolution is extracted at representative elementary volumes (REV), typically using high-resolution pore-scale imaging.
Macro-scale (reservoir grid): Effective fields of , and are obtained by homogenization and transferred into reservoir-scale simulations.
To guarantee well-posed numerical evolution during up-scaling, additional stability constraints are imposed:
Positivity Constraint: .
Energy Dissipation Constraint: .
These constraints prevent nonphysical divergence and guarantee monotonic energy decay, ensuring robust numerical solutions during up-scaling.
2.6. Validation and Experimental Bench-Marking
2.6.1. Experimental Data and Calibration
Validation of the DFDM framework relies on high-resolution experimental datasets:
Case Thin-Section Images: Provide high-resolution 2D pore maps under stress and fluid perturbations, enabling direct assessment of spatiotemporal fractal evolution.
Displacement experiments: Capture multi-phase flow behavior and fluid-rock interactions, serving as benchmarks for evaluating the predictive capability.
Calibration is performed by computing spatial correlation functions:
Ensuring that the simulated pore structures and flow dynamics reproduced the experimental observations from these datasets. Importantly, cast thin-section imaging constrains the structural heterogeneity of the pore system, while displacement experiments constrain the dynamic flow behavior, making them complementary to the DFDM framework. This integration enhances the reliability and robustness of the subsequent simulations.
2.6.2. Model Validation and Bench-Marking
Validation proceeds through comparison between DFDM predictions and experimental measurements:
Static Validation: At , the predicted baseline fractal dimension was benchmarked against values derived from case thin-section images (Figure 2). The close agreement (deviation <5%) ensured correct initialization of DFDM simulations.
Dynamic Validation: The temporal evolution of predicted by DFDM was compared against experimental curves obtained from CO2 flooding through long cores under controlled injection conditions. The error metric was quantified as:
With acceptable agreement defined as across multiple time scales.
Although explicit boundary-condition-limiting tests (e.g., pure compaction, pure dissolution) were not performed, the CO2 flooding experiments inherently encapsulated competing effects of stress-induced compaction and fluid-driven dissolution. This indirect validation demonstrated the model's ability to capture spatiotemporal evolution of pore networks under realistic reservoir conditions.
Figure 2 illustrates the image-to-fractal workflow, where thin-section micro-graphs were processed into binary pore-matrix representations and gray-level surface reconstruction analyzed via box-dimension regression, yielding baseline fractal descriptors for DFDM initialization and subsequent validation.
In this context, image-based analysis provides a quantitative link between experimental observation and DFDM model initialization. As illustrated in Figure 2, the workflow begins with thin-section micro-graphs of the rock matrix (a), which are segmented into binary pore-matrix representations (b). The corresponding gray-level surface is then reconstructed from the grayscale intensity field, Here, is estimated from the gray-level intensity surface, which effectively represents a pseudo-3D morphological structure. The subsequent box-dimension regression using the MATLAB interface (c) yields a baseline fractal dimension of approximately , representing the surface roughness of the pore network. This baseline value is thus adopted to initialize DFDM predictions and serves as the experimental-theoretical bridge connecting static imaging with dynamic model evolution. This sequence explicitly demonstrates how pore-scale heterogeneity, captured through imaging, is rigorously translated into mathematical descriptors that can be bench-marked against the predictions of the Dynamic Fractal Dimension Model.
2.6.3. Statistical Confidence
The robustness of DFDM was further established by assessing statistical confidence across experimental datasets. Quantitative agreement between model predictions and experimental measurements was evaluated using the coefficient of determination:
In general, empirical predictive models are expected to achieve 9 to ensure statistical robustness. In contrast, the calibrated DFDM achieved , which remains satisfactory for a physics-informed model constrained by first-principles dynamics and experimental uncertainties.
This result confirms that DFDM reliably reproduces both the structural constraints from thin-section analyses and the flow responses observed in CO2 flooding experiments. By explicitly integrating temporal variability, fluid-solid coupling, and spatiotemporal PDEs, DFDM provides a rigorous predictive framework for pore-structure evolution in stress-sensitive reservoirs, with direct implications for CO2 storage and enhanced hydrocarbon recovery.
3. Results and Discussion
The proposed Dynamic Fractal Dimension Modeling (DFDM) framework provides a systematic approach to quantify the spatiotemporal evolution of pore structures in tight reservoirs, bridging pore-scale imaging with predictive reservoir-scale simulations. By explicitly incorporating temporal variability into fractal characterization, DFDM represents a paradigm shift from static pore-scale descriptors to dynamic, predictive modeling of reservoir evolution.
In this section, we present the numerical predictions, experimental validations, and mechanistic insights derived from DFDM, followed by a critical discussion of model robustness, limitations, and implications for reservoir engineering. To assess the predictive capacity of the framework, model outputs were directly compared with laboratory measurements, sensitivity analysis with alternative parameter sets underscores the model's adaptability to varying geological conditions.
Together, these results confirm that DFDM not only advances the theoretical understanding of fractal pore dynamics but also provides a practical tool for predicting reservoir behavior in unconventional hydrocarbon recovery and CO2 sequestration. The simulation results form the basis for the following discussion, including spatiotemporal evolution, mechanistic insights, and model validation and limitations.
3.1. Spatiotemporal Evolution of Fractal Dimension
The spatiotemporal evolution of fractal dimensions under CO₂ flooding reflects the coupled effects of pore-scale heterogeneity, stress sensitivity, and multi-phase flow. To capture this process, a stepwise framework is employed, beginning with static baseline derived from thin-section imaging, followed by experimental observation of pressure propagation, and ultimately dynamic prediction through the DFDM approach. Figure 3, Figure 4 and Figure 5 collectively illustrate this progression: the static fractal baseline (Figure 3), the experimentally observed displacement stages (Figure 4), and the predicted dynamic evolution of fractal dimension (Figure 5).
The static fractal dimension obtained from thin-section images provides a necessary reference for evaluating the dynamic evolution of pore structures under CO2 flooding. As illustrated in Figure 3, the box-counting regression applied to binary micro-graphs yields a fractal dimension of approximately .
To further investigate displacement behavior, pressure-propagation experiments were carried out along a long-core sample during CO2 injection. The measured pressure responses at nine monitoring points reveal systematic changes over time. As shown in Figure 4, three distinct stages can be identified: (i) the mixed-phase formation stage, (ii) the mixed-phase displacement stage, and (iii) the gas post-breakthrough stage. These transitions mark the progressive redistribution of pore pressure and reflect the underlying stress-sensitive heterogeneity of the rock matrix.
To further interpret these experimental findings, DFDM was applied to predict the spatiotemporal distribution of fractal dimension , the results are presented in Figure 5. The contour map demonstrates a systematic evolution from higher values near the injection point toward lower values after breakthrough as CO2 flooding proceeds. Notably, the baseline dimension serves as a transition threshold: values above this baseline correspond to relatively well-connected pore networks during early displacement, while reductions below mark the onset of channelization and non-uniform flow. The predicted dynamic range (1.5-2.8) aligns with experimental observations and remains physically consistent with pore-scale heterogeneity and stress-induced permeability alterations.
- Model-Experiment Consistency of Fractal Dimension Thresholds
The permeability-porosity relation expressed in Eq.2.21 originates from the fractal scaling theory of porous media [44,45,46], where the exponent characterizes the non-linear sensitivity of permeability to porosity as a function of the pore-network fractal dimension .
- Dependence of on :
When increases toward 3, the exponent diverges, implying that small changes in porosity result in large variations in permeability. This reflects a highly complex, heterogeneous structure where flow becomes concentrated along preferential channels, corresponding to the mixed-phase formation stage in CO2 flooding. Conversely, when decreases toward 2, the exponent approaches unity, indicating a smoother and less connected pore system with unstable displacement and fingering (post-breakthrough stage).
- Mathematical sensitivity analysis:
The rate of change in the scaling exponent, ,increases sharply from to , highlighting a distinct non-linear inflection zone between and . Within this range, the coupling between porosity and permeability transitions from quasi-linear to strongly non-linear behavior. This window represents the mixed-phase displacement stage, characterized by effective connectivity and relatively uniform flow, i.e., the most stable sweep regime.
- Quantitative and experimental consistency:
The mathematical inflection region (2.2-2.6) coincides with the three displacement stages identified in the CO2 flooding experiments (Figure 4). Specifically, corresponds to the mixed-phase formation stage with emerging preferential channels; corresponds to the mixed-phase displacement stage with uniform and stable sweep; and corresponds to the post-breakthrough stage with localized fingering.
- Relation to :
The threshold marks the onset of non-uniform flow, where . This indicates that permeability becomes approximately six times more sensitive to porosity variations than in the quasi-linear regime, signifying the initiation of channelization. Hence, lies within the mathematically derived and experimentally verified transitional window (2.2-2.6), providing quantitative justification for the adopted thresholds.
In summary, the ranges correspond to physically distinct regimes of pore-network evolution and flow behavior, demonstrating the internal consistency between the DFDM formulation and the observed CO2 flooding dynamics. Based on the mathematical sensitivity analysis of Eq.2.21 and the observed transition near , the dynamic fractal dimension can be divided into three characteristic flow regimes, as summarized in Table 1.
3.2. Model Validation and Predictive Robustness
The predictive capability of the Dynamic Fractal Dimension Model (DFDM) must be validated to ensure its applicability under reservoir-relevant conditions. While the static fractal dimension () has been experimentally determined and serves as the baseline descriptor of pore structures, direct measurements of dynamic fractal dimensions are not available. To address this limitation, the validation strategy adopted here relies on three complementary aspects: (i) consistency of predicted trends with experimental pressure responses and pore-network evolution, (ii) alignment of the initial condition with the experimentally derived static fractal dimension, and (iii) agreement with scaling behaviors reported in previous studies.
As illustrated in Figure 6, the DFDM framework predicts a progressive decline in the fractal dimension with increasing cumulative CO2 injection volume. Two parameter sets are shown to represent the range of model variability (solid and dashed lines). The experimental static fractal dimension () is included as a reference point at the onset of injection, serving as the critical anchor for validation. Although direct dynamic measurements are absent, the predicted reduction of is physically consistent with pore-network simplification, compaction-induced stress redistribution, and non-uniform flow patterns during CO2 flooding. This agreement underscores the physical plausibility of DFDM predictions.
Beyond validation, A systematic sensitivity analysis was performed to evaluate the robustness of DFDM predictions under parameter perturbations. Variations in the scaling exponent, stress-coupling coefficient, and initial pore heterogeneity were introduced to examine their influence on the predicted fractal dimension . Results (Figure 7) demonstrate that while parameter changes shift the detailed trajectory of , the overall predictive fidelity and mechanistic stability of the framework are preserved.
3.3. Mechanistic Insights: Stress Sensitivity and Flow-Driven Processes
The mechanistic analysis reveals the fundamental competition between stress-induced compaction (increasing D ) and flow-driven dissolution/enhancement (reducing D and improving connectivity), As illustrated in Figure 8, these dual regimes delineate the operational bounds of reservoir evolution: Compaction-dominated regime: Pore contraction reduces connectivity, leading to permeability loss. Flow-driven regime: Fluid injection enlarges pore structures, accelerating flow pathways. By explicitly resolving these dual processes, DFDM provides a mechanistic closure between fractal descriptors and stress-flow interactions, extending beyond descriptive statistics toward predictive physical modeling of pore-network evolution.
- Practical implications for subsurface engineering applications
The distinction between compaction-dominated and flow-driven regimes also provides practical insight into subsurface engineering strategies. In CO2 sequestration, compaction-dominated regimes generally enhance long-term storage security by reducing pore connectivity and permeability, thereby stabilizing trapped CO2. Conversely, flow-driven regimes, while promoting dissolution and reactive transport, may increase leakage risks if not balanced by mechanical sealing. In enhanced oil recovery (EOR), moderate flow-driven behavior, manifested as controlled channelization, can improve sweep efficiency by creating preferential flow paths through low-permeability zones. However, excessive channelization or fingering leads to early breakthrough and reduced recovery. The DFDM framework thus provides a predictive tool to identify and manage the transition between desirable and detrimental flow regimes.
3.4. Limitations and Future Work
While DFDM demonstrates substantial predictive capability, several limitations merit consideration and suggest directions for further development:
- Computational cost:
The current DFDM simulations rely on high-resolution time-lapse imaging and fine spatial grids, resulting in considerable computational demand. This limits large-scale or long-term applications unless advanced solvers or parallelization strategies are employed.
- Representativeness of input data:
The model's predictive accuracy depends strongly on the representativeness of the input data. Reconstructions derived from thin-section images may under-sample sub-resolution heterogeneities that are crucial for flow and transport, leading to potential scale-dependent biases.
- Parameter sensitivity:
The DFDM's sensitivity to stress, fracture-pore coupling coefficients, and boundary conditions can introduce uncertainties when extrapolating beyond laboratory settings. Further calibration under varied flow and stress conditions is necessary to improve robustness.
- Model extensibility:
The hierarchical and fractal-based architecture of DFDM allows natural integration with multiphase flow models, geochemical feedbacks, or physics-informed neural networks. Future efforts will focus on coupling DFDM with hybrid multi-scale solvers and machine-learning-assisted parameter estimation to enhance computational efficiency and generalizability.
Despite these limitations, DFDM provides a robust and physically grounded pathway to bridge pore-scale heterogeneity with reservoir-scale performance, offering a flexible foundation for future multi-physics and multi-scale simulations.
4. Conclusions
This study introduces a Dynamic Fractal Dimension Modeling (DFDM) framework to quantify the spatiotemporal evolution of pore structures in tight reservoirs. By integrating high-resolution thin-section imaging, CO2 long-core displacement experiments, wavelet-based fractal analysis, and structural fractal geometry, DFDM advances beyond conventional static fractal approaches to establish a dynamic, time-resolved representation of pore heterogeneity under reservoir-relevant conditions.
The DFDM predicts the proposed representative dynamic ranges of fractal dimension (2.2-2.6) were validated within the experimental ranges of effective stress (5-25 MPa), a constant injection rate of approximately 1.304 , and system pressure varying from 30-42 MPa during CO2 displacement. This configuration ensured steady-state flow and allowed pressure evolution to be monitored continuously along the core. The model reproduces the measured permeability-porosity-fractal trends with a mean error below 10% (). These ranges define the model's current domain of applicability, extension to other fluids or mineralogies would require additional calibration.
The validated DFDM framework quantitatively captures stress-induced transitions in pore complexity during CO2 flooding, linking stress-induced compaction and flow-driven reorganization with measurable changes in fractal dimension. The Model validation against laboratory experiments demonstrates strong agreement with dynamic pressure responses, while sensitivity analysis confirms robustness across varying geological settings.
The framework provides direct implications for reservoir engineering: (i) predicting permeability loss and optimizing injection strategies in enhanced oil recovery, (ii) evaluating capacity and long-term stability in geological CO2 storage, and (iii) extending to geothermal systems, aquifers, and engineered porous media where heterogeneity governs multi-phase flow.
In summary, DFDM offers a dynamic and predictive approach to pore-scale heterogeneity, bridging imaging, fractal geometry, and stress-coupled transport. This methodological innovation not only advances theoretical understanding of fractal pore dynamics but also establishes a scalable, quantitatively validated tool for energy recovery, carbon sequestration, and sustainable subsurface resource management. DFDM thereby unifies pore-scale imaging and reservoir-scale modeling, providing a robust framework to quantify and predict dynamic heterogeneity in subsurface energy systems.
Author Contributions
Conceptualization, X.Y. and J.-Y.L.; Methodology, X.Y.; Software, X.Y.; Validation, J.-Y.L.; Formal analysis, X.Y.; Investigation, X.Y.; Resources, J.-Y.L.; Data curation, X.Y.; Writing-original draft, X.Y.; Writing-review & editing, J.-Y.L.; Visualization, X.Y.; Supervision, J.-Y.L.; Project administration, J.-Y.L. All authors have read and agreed to the published version of the manuscript.
Funding
This research did not receive any specific grant from funding agencies in the public, commercial, or not-for-profit sectors.
Data availability
Data will be made available on request.
Conflicts of Interest
The authors declare no conflicts of interest.
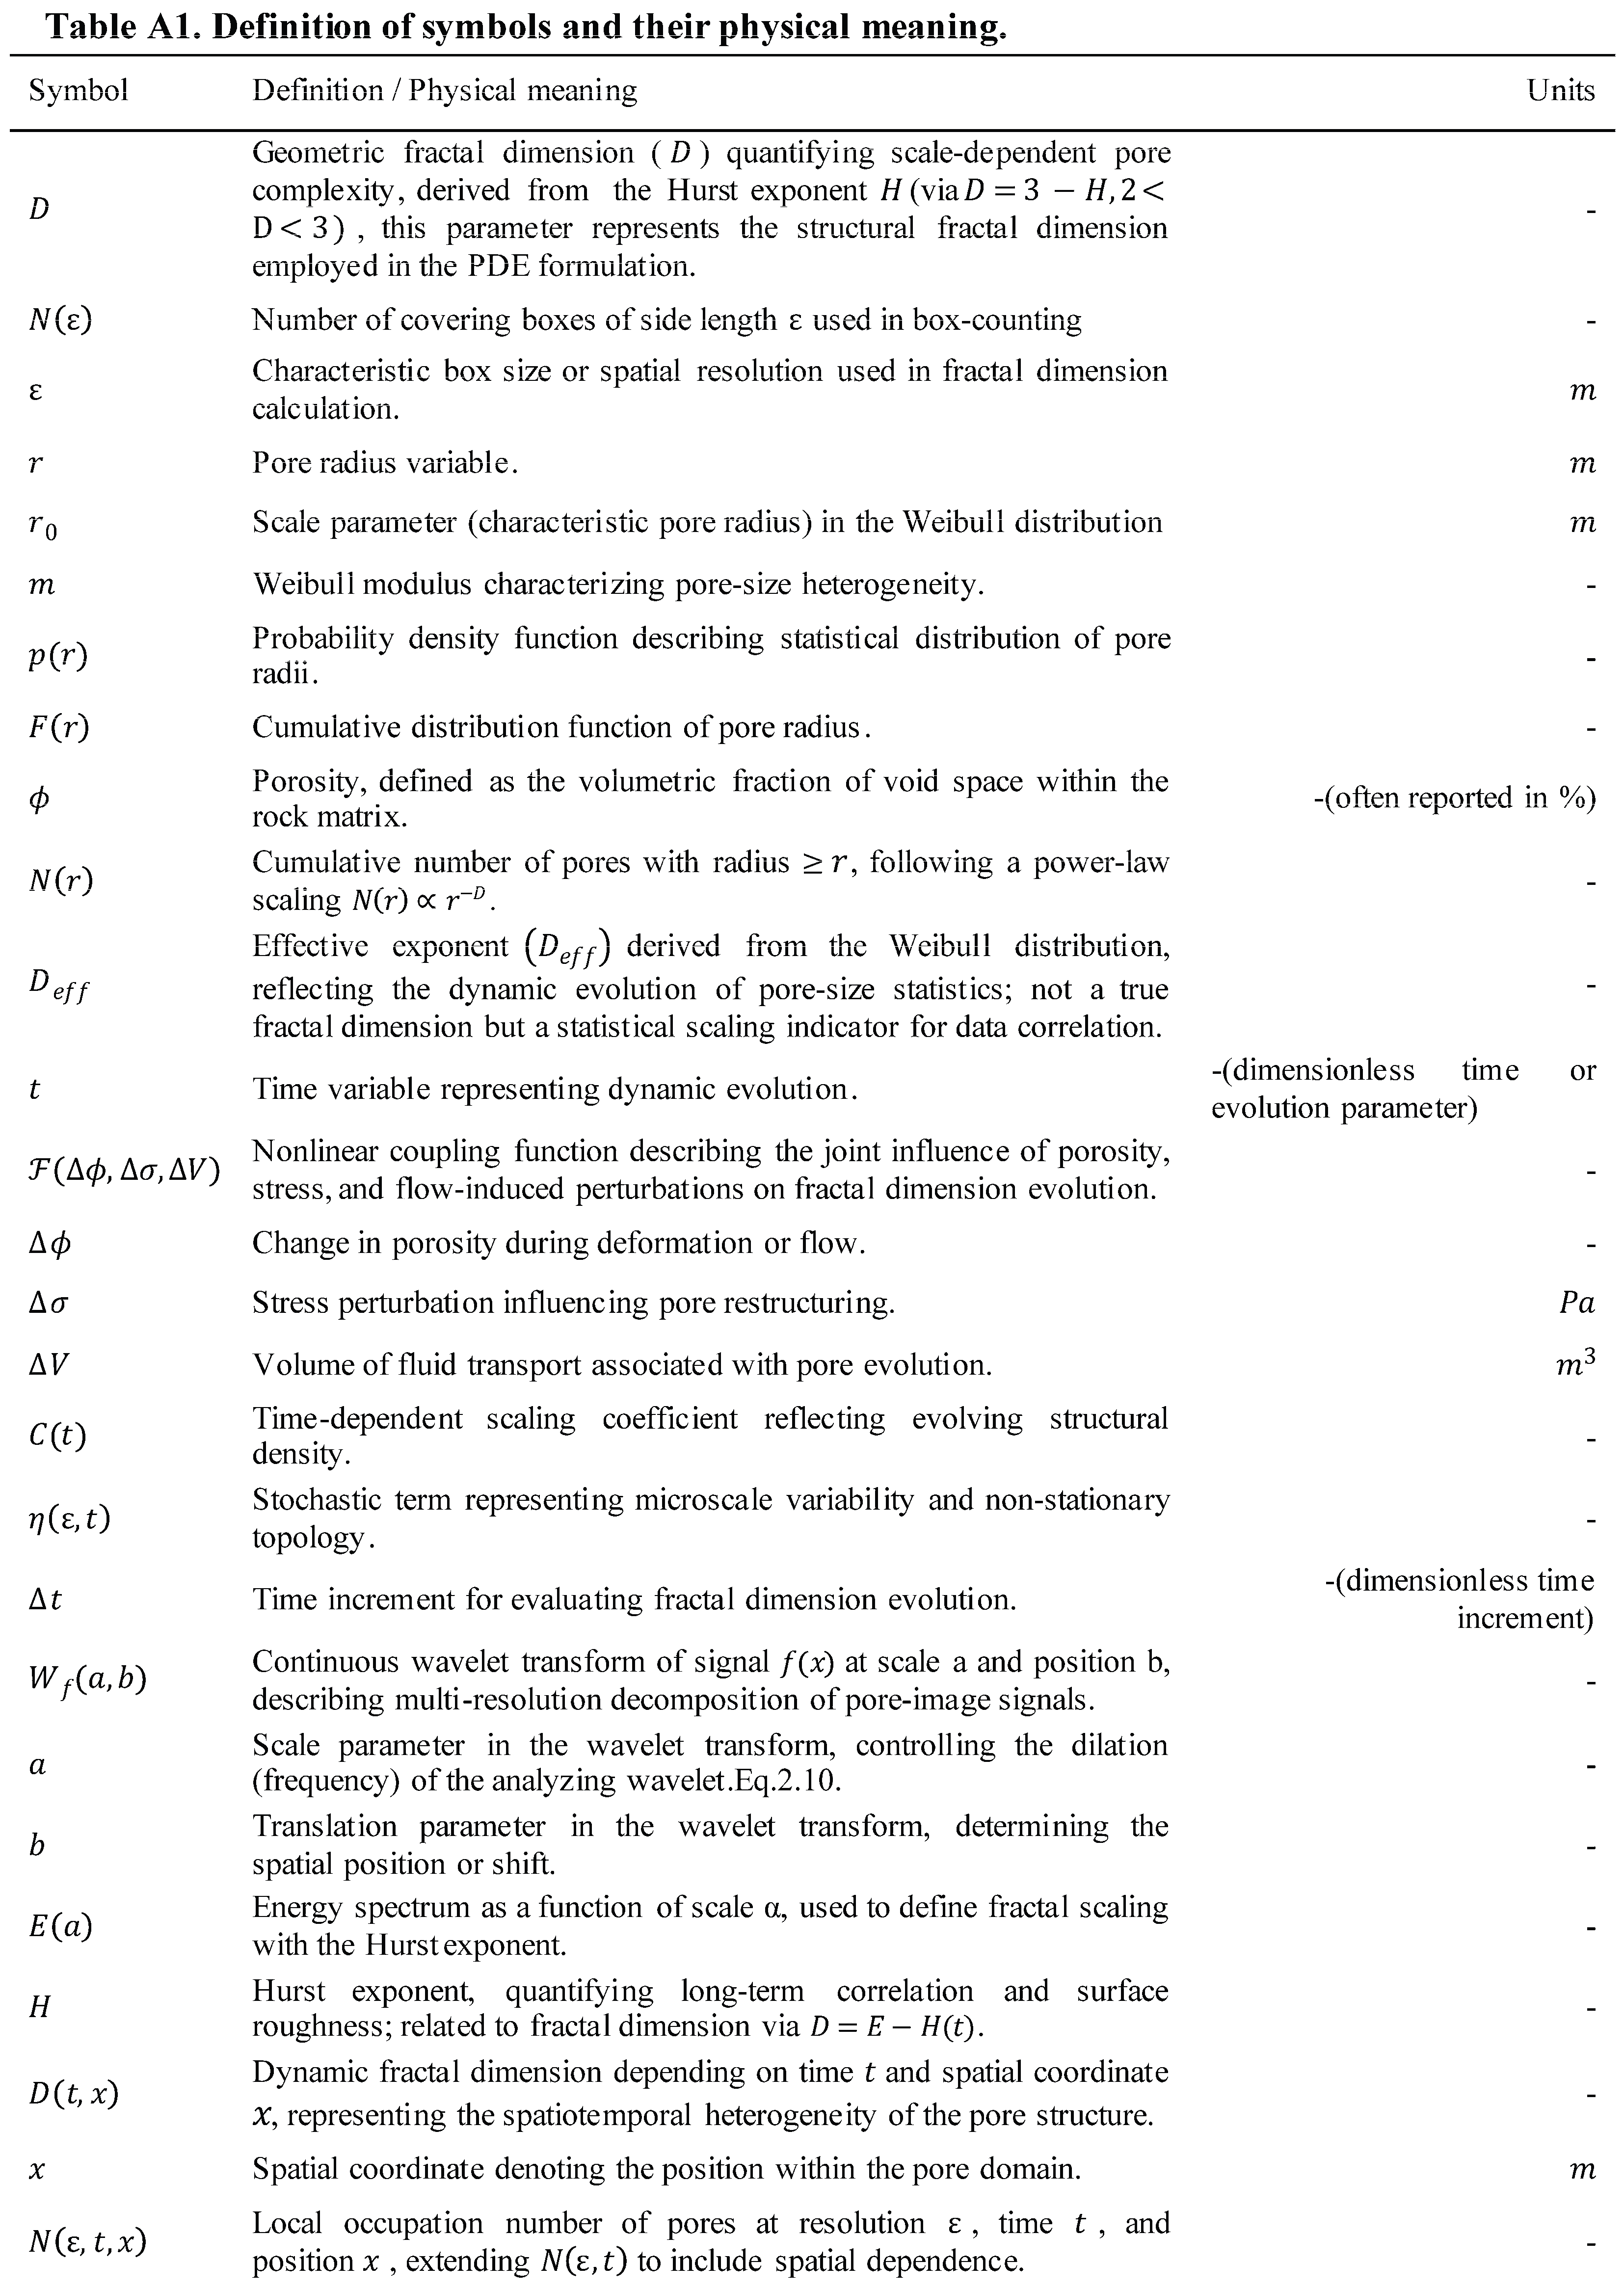
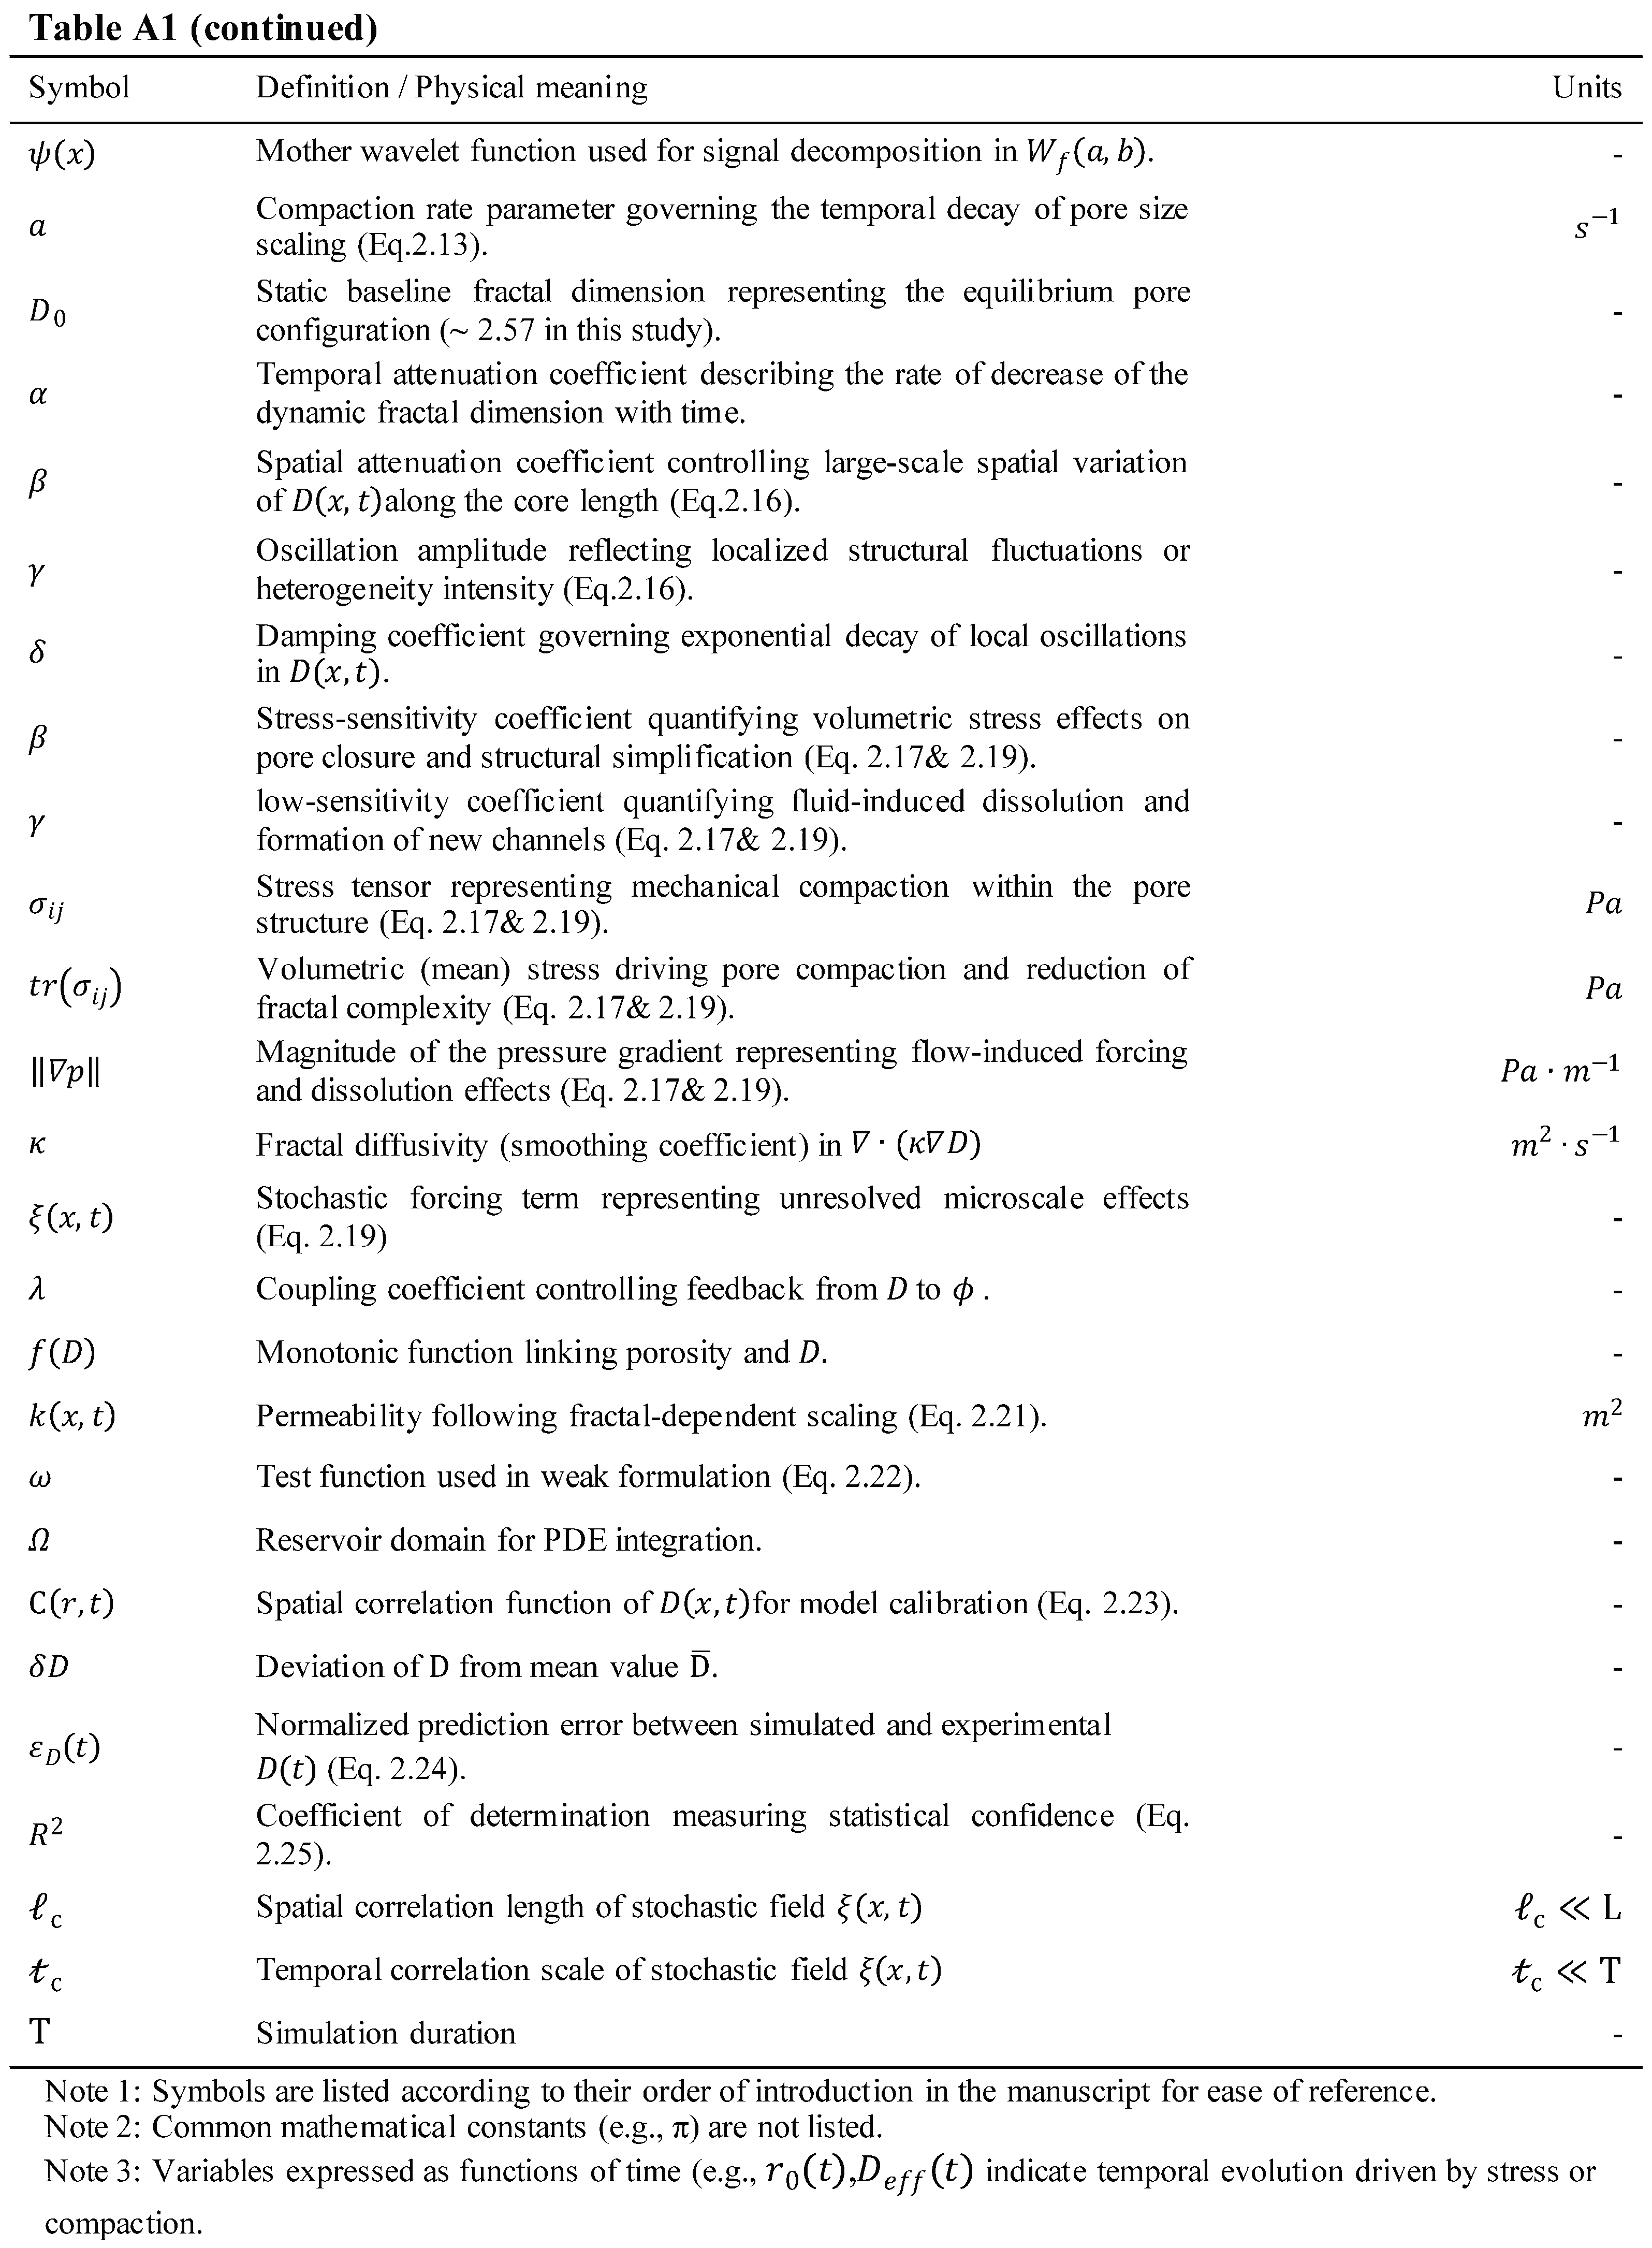
Appendix A.1. Table of Symbols

Table A1.
lists all symbols, parameters, and constants used in this study, together with their units and physical meanings.
Table A1.
lists all symbols, parameters, and constants used in this study, together with their units and physical meanings.
 |
 |
Appendix A.2. Effective and Dynamic Fractal Dimension:Derivation and Implementation
A.2.1. Derivation of the Scale-Dependent Exponent (Eq. 2.6)
The pore radius distribution is assumed to follow a Weibull probability density function (PDF):
Where is the Weibull modulus describing pore-size heterogeneity, and is the scale parameter characterizing the representative pore size.
To relate this statistical form to a fractal representation, we recall that the pore number density in a fractal medium generally follows a power-law scaling.
By analogy, we generalize this power-law scaling to a scale-dependent form. Here, the exponent is introduced as a local slope describing the scale-dependent decay rate of the Weibull distribution. Taking logarithmic differentiation of the probability density function gives a generalized definition of as the local slope of with respect to :
Substituting the Weibull form into the above expression yields:
Thus,
For most natural pore systems, typically ranges between 1 and 5, and the exponential term dominates the variation with scale.
When the distribution is sufficiently broad ,the offset is negligible compared to the exponential term, leading to the simplified expression adopted in the main text:
- Assumptions underlying this derivation
Self-similarity: the pore network exhibits scale-invariant statistics over the range where the Weibull form is valid.
Power-law number density: the pore population can be expressed as , linking probabilistic and fractal descriptions.
Isotropy: pore orientations and shapes are statistically isotropic, allowing the use of a single scalar radius .
Continuity: the distribution is smooth and differentiable with respect to , enabling the use of local logarithmic derivatives.
- Physical interpretation
quantifies the local scaling exponent of the pore-size distribution on a log-log plot. As and m evolve under stress and fluid-rock interactions, serves as a scale-dependent statistical exponent characterizing the evolution of pore-size heterogeneity.
A.2.2. Parameter Extraction Algorithm and Stability Criteria
The parameter extraction procedure was developed to implement the Dynamic Fractal Dimension Model (DFDM) introduced in Section 2.3.1 and defined by Eqs. (2.12-2.14).
These equations describe the temporal evolution of the fractal dimension through a generalized scaling relation that links the measured pore-space occupation to time-dependent structural parameters , , and the fluctuation term . The section provides the detailed algorithm for estimating the parameters, defining the stability criteria, and ensuring reproducible evaluation of across temporal sequences.
The parameters , , and are estimated from time-series pore images or segmentation maps via a multi-scale regression procedure, summarized below.
- Algorithm (pseudocode)
- Input: Binarized pore images across time frames
- Output:
- 1.
-
For each time frame t:a.Compute number of occupied boxes for a set of scales ( logarithmically spaced).b. Perform linear regression of log [] vs. within a stable scale window [min, max].c. Obtain initial -slope, intercept.
- 2.
- Fit exponential decay to estimate .
- 3.
- Compute residual C0(t) exp(-α t).
- 4.
- Evaluate noise level ; if , readjust -range by excluding small scales.
- 5.
- Smooth by Savitzky-Golay filter (window 3-5 frames) to suppress temporal noise.
- 6.
- Repeat across all t to construct field.
- Stability and Sensitivity Criteria
- Scale window selection: A minimum of one decade of (i.e.,) is required for robust regression. Windows are chosen by maximizing the coefficient of determination .
- Temporal stability:The time step is limited by the imaging frequency such that to ensure quasi-stationary evolution.
- -range sensitivity: The variation of with respect to is evaluated asensuring that the estimated D is scale-independent within the selected range.
These criteria provide reproducible and noise-resilient estimates of the dynamic fractal dimension and associated parameters, fully consistent with the DFDM theoretical framework presented in Section 2.
Appendix A.3. Wavelet and Box-Counting Implementation Details
The Morlet wavelet was employed as the mother function for the continuous wavelet transform, owing to its superior time-frequency localization and smooth oscillatory kernel suitable for multiscale pore-structure characterization. The analysis was conducted over a normalized scale range of to , corresponding to the smallest and largest box sizes (1/512-1/2 of the image dimension) used in the subsequent box-counting regression. This range ensures consistent spatial resolution across spectral and geometrical analyses. Mirror-symmetric boundary padding was applied to suppress edge artifacts, and local mean detrending was performed prior to spectral regression to ensure stationary residuals and numerical stability.
For the box-counting procedure, binary segmentation of the pore-matrix system was performed using adaptive grayscale thresholding (Otsu method, which automatically determined a normalized threshold of ), followed by morphological filtering to remove isolated artifacts. A grid hierarchy of nine box sizes, ranging from 1/512 to 1/2 of the image dimension with power-law progression, was adopted. The logarithmic relationship between the box size and the number of occupied boxes was fitted using the least-squares method to obtain the baseline fractal dimension . These standardized preprocessing and regression protocols ensure the derived scaling parameters and their consistent initialization within the DFDM framework.
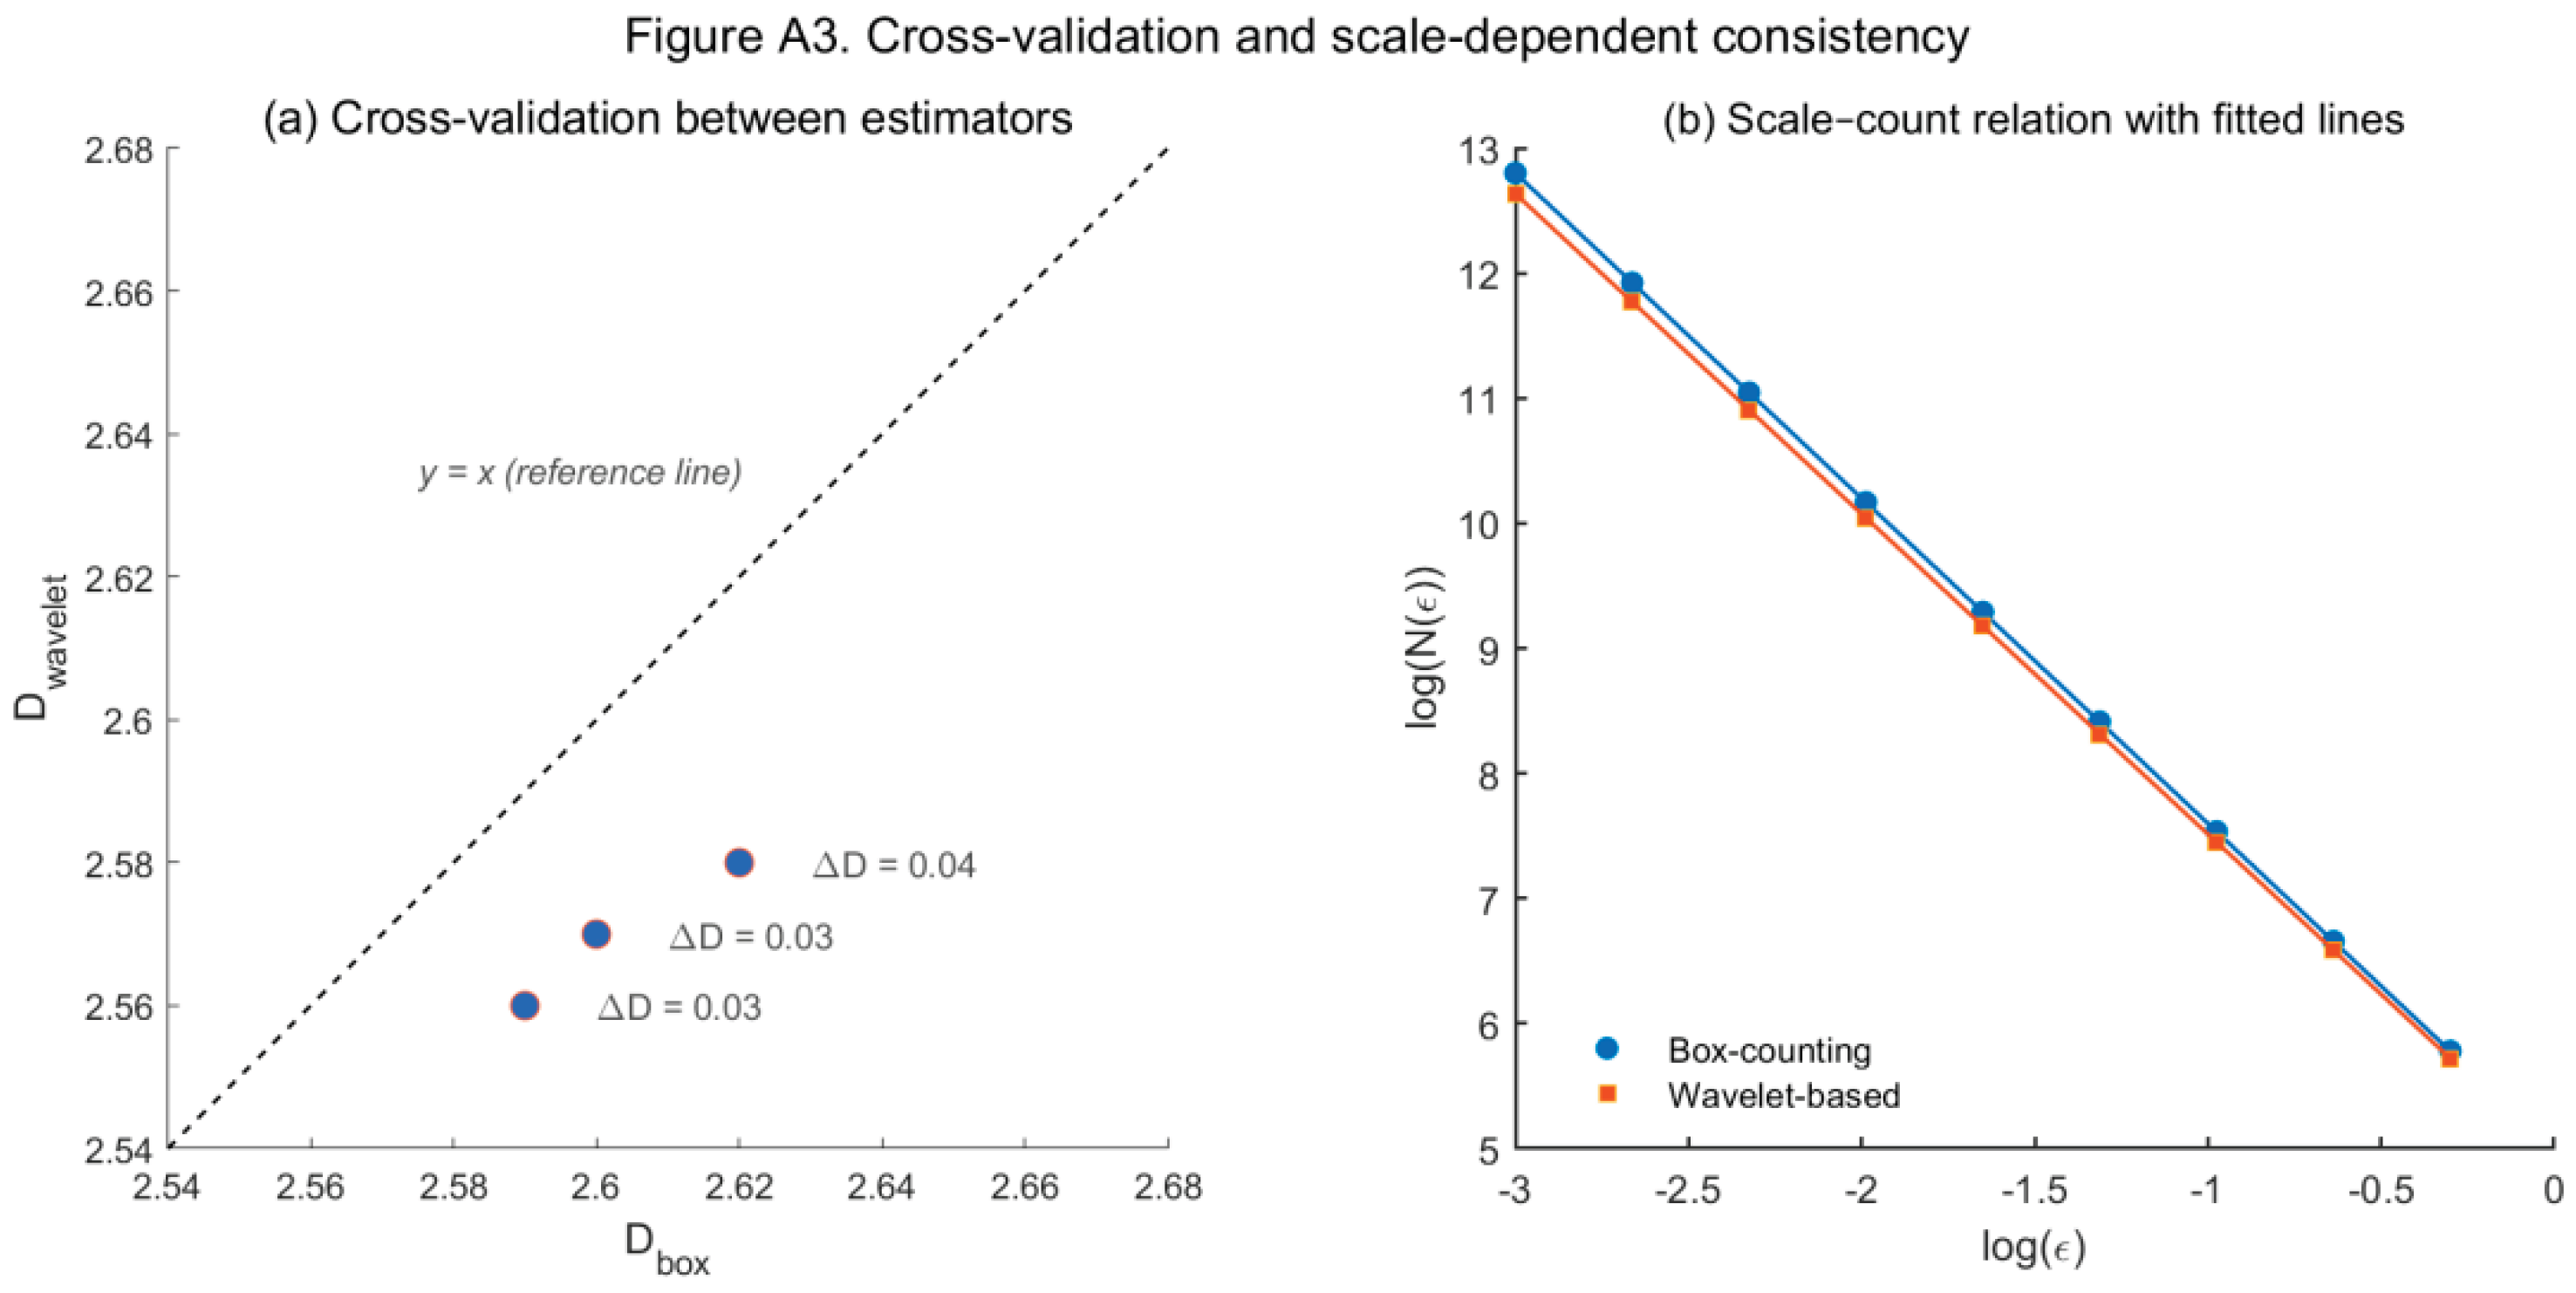
- Cross-validation between box-counting and wavelet-derived dimensions
To verify the methodological consistency between the classical box-counting approach (Db) and the wavelet-derived fractal dimension (Dw), both estimators were applied to the same pore-structure data-set. The comparison (Figure A3) shows highly consistent results, with a small deviation of , confirming that both estimators capture the same underlying fractal scaling behavior. The wavelet-derived estimator exhibits a slightly smoother and more noise-robust trend due to its denoising and localization effects.
Figure A3 illustrates (a) the direct cross-validation between Db and Dw, and (b) the corresponding scale-count relations that demonstrate their consistent log-log scaling behavior.
Figure A3.
Cross-validation and scale-dependent consistency between box-counting and wavelet-based estimators.(a) Scatter plot showing the agreement between Db and Dw. The dashed line () denotes the ideal 1:1 agreement. All samples show small and consistent deviations (, confirming the close methodological agreement between both estimators and the expected smoothing effect of the wavelet-based approach. (b) Log–log plots of the scale-count relation, vs. , for both methods with fitted lines. The box-counting curve (blue) lies slightly above the wavelet-based curve (red), consistent with the marginally lower Dw values indicated in panel (a). This suggests that the wavelet-derived estimator provides smoother scaling behavior and reduced noise sensitivity, while both methods capture the same fractal trend. Together, panels (a) and (b) confirm the methodological coherence between the two estimators and the robustness of the wavelet-based fractal analysis framework.
Appendix A.4. Numerical Discretization and Solver Configuration
Equation (2.19) was solved numerically using a finite-difference scheme implemented on a uniform structured grid. The computational domain was discretized into m, with second-order central differences for spatial derivatives and an explicit forward-Euler time integration.
The time step s was selected to satisfy the Courant-Friedrichs-Lewy (CFL) stability condition:
where denotes the upper bound of the fractal diffusivity. Under these parameters, the maximum Courant number remained , ensuring numerical stability. The system was iterated until the relative change in the global L2 norm of between consecutive time steps satisfied
Boundary conditions followed those introduced in Section 2.4.2. All simulations were implemented in MATLAB R2023a, with sparse-matrix operations and adaptive time-stepping checks to prevent overshoot or divergence. The stochastic term was generated as a spatially correlated Gaussian noise field (zero mean, ) using a spectral-synthesis method.
These configurations ensure numerical stability and convergence.
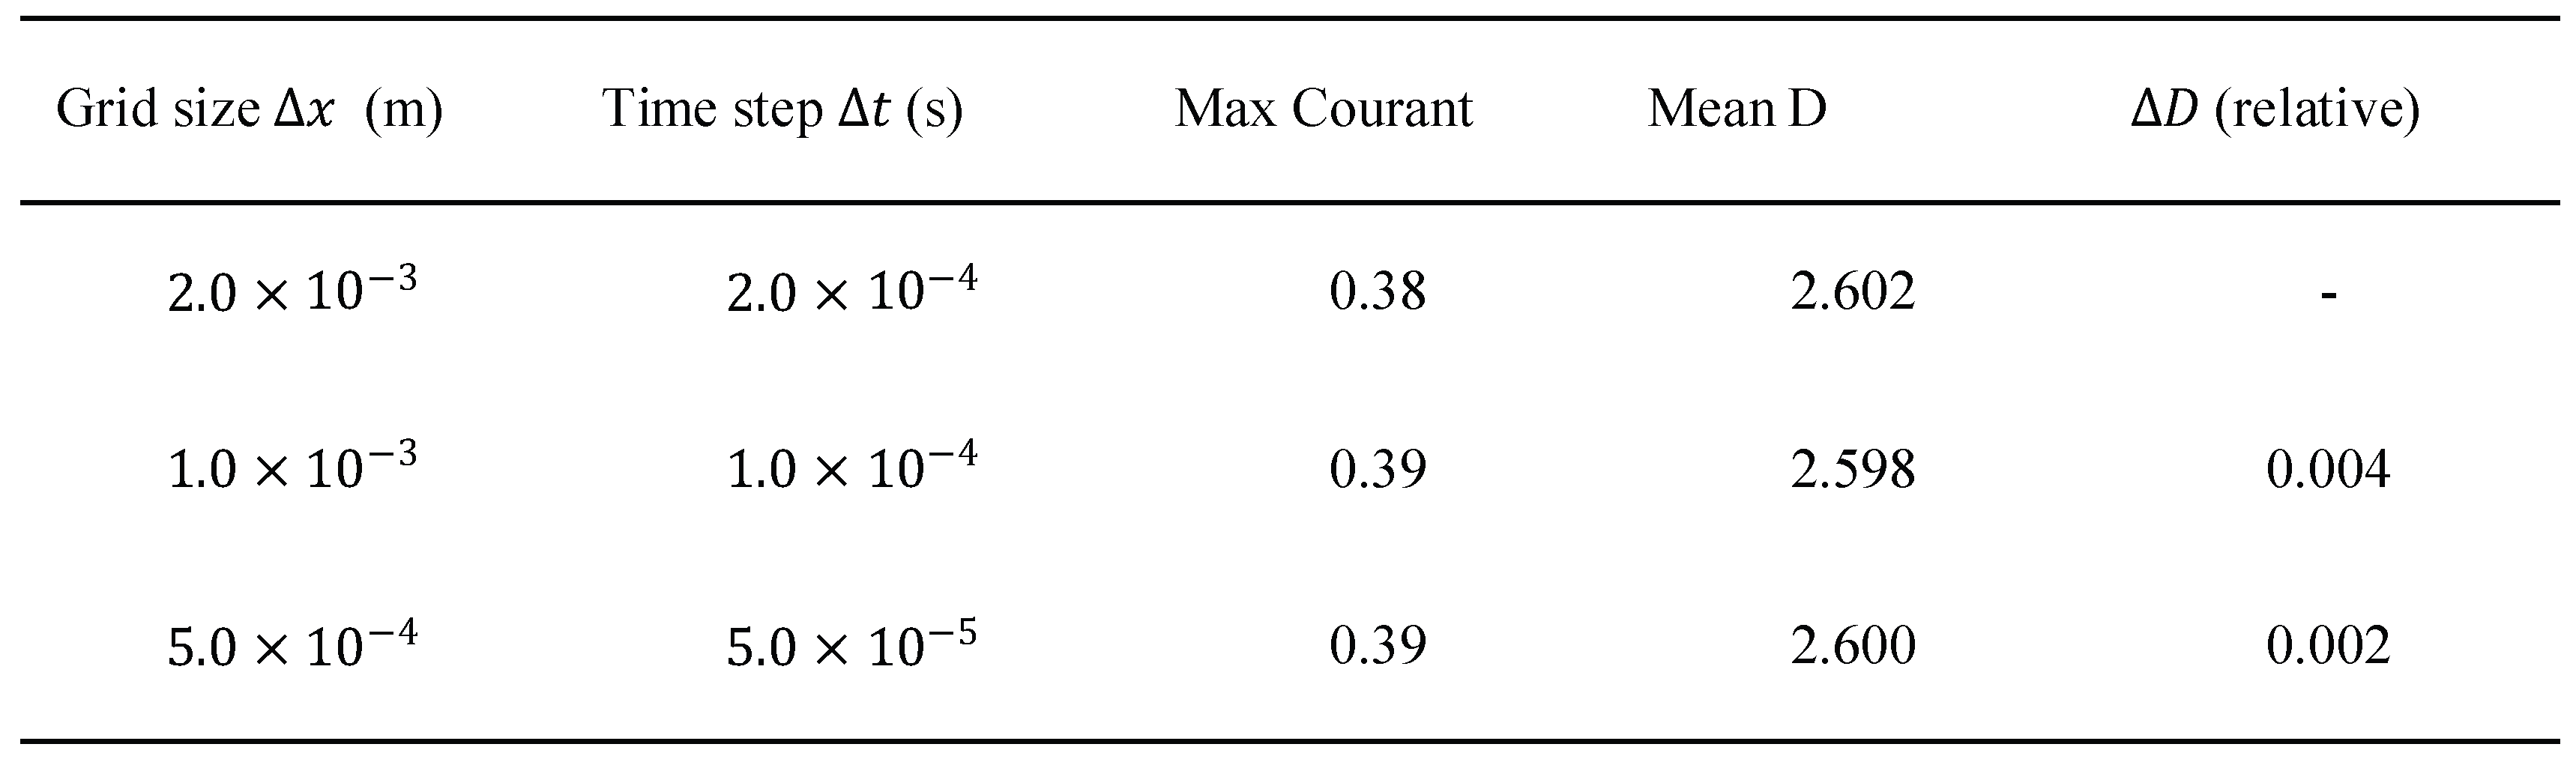
- Grid Convergence and Discretization Sensitivity Test
To verify the grid independence and temporal stability of the numerical implementation, a systematic grid refinement test was performed. The computational domain was discretized with three representative resolutions:
with corresponding time steps adjusted according to the CFL criterion.
The resulting mean fractal dimension D values varied by less than 0.005, corresponding to a relative deviation of approximately 0.15% across all tested resolutions, indicating that both spatial and temporal discretizations yielded numerically convergent results. Table A4 summarizes the convergence behavior, showing that further refinement of and did not produce significant differences in .The results in Table A4 were obtained by re-solving Equation (2.19) for three representative grid resolutions, while keeping the solver configuration and boundary conditions identical to those described above.
Table A4.
Grid refinement and discretization sensitivity test for numerical convergence of the computed fractal dimension.
Table A4.
Grid refinement and discretization sensitivity test for numerical convergence of the computed fractal dimension.
 |
References
- Zhou, S.; Wang, H.; Jiang, S.; Yan, D.; Liu, D.; Zhang, Z.; Li, G. A novel approach to obtain fractal dimension in coals by LFNMR: Insights from the T2 peak and T2 geometric mean. 2022, 148, 04022009. [CrossRef]
- Yao, P.; Zhang, J.; Qin, Z.; Fan, A.; Feng, G.; Vandeginste, V.; Zhang, P.; Zhang, X. Effect of pore structure heterogeneity of sandstone reservoirs on porosity–permeability variation by using single–multi-fractal models. 2024, 9, 23339-23354. [CrossRef]
- Zhang, W.; Mehrabian, A. Poromechanics Constitutive Relations and Analytical Solution for Nonlinear Gas Transport and Sorption in Deformable Rocks. 2023, 149, 853-890. [CrossRef]
- Xu, P.; Chen, Z.; Qiu, S.; Yang, M.; Liu, Y. An analytical model for pore and tortuosity fractal dimensions of porous media. 2021, 29, 2150156. [CrossRef]
- Zhang, W. Nonlinear Poroelastic Solutions for the Pore Fluid Flow and Sorption in Deformable Rocks. In Pennsylvania State University: 2022.
- Wang, J.; Jiang, F.; Zhang, C.; Song, Z.; Mo, W. Fuels Study on the pore structure and fractal dimension of tight sandstone in coal measures. 2021, 35, 3887-3898. [CrossRef]
- Turlapati, V.Y.; Prusty, B.K.; Bakshi, T. Fuels Detailed pore structure study of Damodar Valley and upper Assam basin shales using fractal analysis. 2020, 34, 14001-14011. [CrossRef]
- Hazra, B.; Wood, D.A.; Panda, M.; Sethi, C.; Vishal, V.; Chandra, D.; Ostadhassan, M. Fuels Pore structural complexities and gas storage capacity of Indian coals with various thermal maturities. 2025, 39, 5818-5831. [CrossRef]
- Zezhang, S.; Abide, A.; Mingyang, L.; ZHANG, Y.; JIANG, F.; Zheyu, L.; ZHENG, W.; Xiayang, W.; Geology, G. Quantitative analysis of nitrogen adsorption hysteresis loop and its indicative significance to pore structure characterization: A case study on the Upper Triassic Chang 7 Member, Ordos Basin. 2023, 44, 495-509. [CrossRef]
- Sun, H.; Koch, M. Hydraulics Fractal generation of surface area of porous media. 1998, 12, 83-96. [CrossRef]
- Guan, W.; Cai, W.; Li, Z.; Lu, H. Engineering Microscopic Characterization and Fractal Analysis of Pore Systems for Unconventional Reservoirs. 2024, 12, 908. [CrossRef]
- Wang, Y.; Tian, Z.; Nolte, S.; Krooss, B.; Wang, M. Influence of equation nonlinearity on pulse-decay permeability measurements of tight porous media. 2023, 148, 291-315. [CrossRef]
- Li, C.; Xu, Y.; Jiang, Z.; Yu, B.; Xu, P. Fractional Fractal analysis on the mapping relationship of conductivity properties in porous material. 2022, 6, 527. [CrossRef]
- Mishra, S.; Dixit, A.; Mishra, V.K.; Singh, V.P.; Mendhe, V. Pore structures and fractal dimensions in early Permian Barakar shales of Rajmahal Basin, Jharkhand, India. 2021, 14, 2340. [CrossRef]
- Lin, W.; Zhao, X.; Li, M.; Zhuang, Y. Fractional Pore Structure Characterization and Fractal Characteristics of Tight Limestone Based on Low-Temperature Nitrogen Adsorption and Nuclear Magnetic Resonance. 2024, 8, 371. [CrossRef]
- Guan, D.; Pan, T.; Guo, R.; Wei, Y.; Qi, R.; Fu, C.; Zhang, Z.; Zhu, Y.K. Fractional Fractal and multifractal analysis of microscopic pore structure of UHPC matrix modified with nano silica. 2024, 8, 360. [CrossRef]
- Tibebu, D.T.; Avramidis, S.; Walters, C. Technology Fractal dimension of wood cell wall pores from pore size distribution: insights from nitrogen gas adsorption analyzer. 2023, 57, 651-669. [CrossRef]
- Rigby, S.P. Solitons;Fractals Theoretical aspects of the estimation of pore and mass fractal dimensions of porous media on the macroscopic scale using NMR imaging. 1998, 9, 1519-1527. [CrossRef]
- Pavón-Domínguez, P.; Díaz-Jiménez, M. Characterization of synthetic porous media images by using fractal and multifractal analysis. 2023, 14, 27. [CrossRef]
- Zhang, Q.; Dong, Y.; Tong, S.Q. Fractional Pore-Type-Dependent Fractal Features of Shales and Implications on Permeability. 2023, 7, 803. [CrossRef]
- Zhou, D.; Lv, Z.; Cao, Y.; Liu, G.; Zhang, X.; Shi, B.; Zhang, J.; Liu, S. Fractional Fractal Evolution Characteristics of Pore Structure in Coal-Acidified Stimulation. 2025, 9, 62. [CrossRef]
- Ullah, A.S.; D’Addona, D.M.; Seto, Y.; Yonehara, S.; Kubo, A. Fractional Utilizing fractals for modeling and 3D printing of porous structures. 2021, 5, 40. [CrossRef]
- Mondal, I.; Singh, K.H. Petrophysical insights into pore structure in complex carbonate reservoirs using NMR data. 2024, 9, 439-450. [CrossRef]
- Mallat, S. A wavelet tour of signal processing; Elsevier: 1999.
- Li, S.; Bian, H.; Zhang, D.; Liu, Y.; Liu, G.; Wang, F. Research on pore structure and classification evaluation of tight oil reservoirs based on fractal theory. 2024, 72, 4079-4089. [CrossRef]
- Pan, H.; Shao, Y.; Liu, Z.; Zuo, Q.; Su, J.; Bai, J.; Miao, H.; Guo, Y.; Zhang, J. A Physical Parameter Characterizing Heterogeneity of Pore and Fracture Structures in Coal Reservoirs. 2024, 12, 1553. [CrossRef]
- Jiang, W.; Zhang, Y.; Ma, T.; Chen, S.; Hu, Y.; Wei, Q.; Zhuang, D. Fractional Pore structure and its fractal dimension: A case study of the marine shales of the Niutitang formation in Northwest Hunan, South China. 2025, 9, 49. [CrossRef]
- He, S.-H.; Ding, Z.; Hu, H.-B.; Gao, M. Fractional Effect of grain size on microscopic pore structure and fractal characteristics of carbonate-based sand and silicate-based sand. 2021, 5, 152. [CrossRef]
- El-Dib, Y.O.; Mady, A.A.; Alyousef, H.A. Interfacial stability control of MHD Bingham fluids in micro-porous MEMS structures via fractal analysis. 2025, 13, 1634769. [CrossRef]
- Zhang, C.; Guan, P.; Zhang, J.; Liang, X.; Ding, X.; You, Y. A review of the progress on fractal theory to characterize the pore structure of unconventional oil and gas reservoirs. 2023, 59, 897-908.
- Liang, X.; Hu, Q.; Pu, X.; Li, W.; Wang, Q.; Sun, M.; Han, W. Fractional Multifractal Methods in Characterizing Pore Structure Heterogeneity During Hydrous Pyrolysis of Lacustrine Shale. 2024, 8, 657. [CrossRef]
- Li, S.; Tao, C.; Fu, H.; Miao, H.; Qiu, J.T. Fractional Analysis of the Microscopic Pore Structure Characteristics of Sandstone Based on Nuclear Magnetic Resonance Experiments and Nuclear Magnetic Resonance Logging Technology. 2025, 9, 532. [CrossRef]
- Xue, K.; Pu, H.; Li, M.; Luo, P.; Liu, D.; Yi, Q. Fractal-based analysis of stress-induced dynamic evolution in geometry and permeability of porous media. 2025, 37. [CrossRef]
- Liu, F.; Yang, M.; Wu, K.; Zong, J.; Song, H.; Wang, F. Pore structure characterization and permeability prediction with fractal theory considering the tortuosity effect. 2025, 394, 134978. [CrossRef]
- Chen, C.; Ding, X.; Wang, Y.; Luo, Z.; Zhai, P. Fractional Fractal dimension analysis of structure and bending strength of porous alumina prepared using starch and carbon fiber as pore-forming agents. 2022, 6, 574. [CrossRef]
- Tan, X.-H.; Zhou, X.-J.; Xu, P.; Zhu, Y.; Zhuang, D.J. A fractal geometry-based model for stress-sensitive permeability in porous media with fluid-solid coupling. 2025, 455, 120774. [CrossRef]
- Ayad, A. Applications of Fractal Geometry in Geosciences: A Literature. 2025. [CrossRef]
- Dathe, A.; Thullner, M. The relationship between fractal properties of solid matrix and pore space in porous media. 2005, 129, 279-290. [CrossRef]
- Blair, J.; Falconer, R.E.; Milne, A.; Young, I.M.; Crawford, J.W. ModelingThree-Dimensional Microstructure in Heterogeneous Media. 2007, 71, 1807-1812. [CrossRef]
- Isah, A.; Mahmoud, M.; Eltom, H.; Salih, M.; Arif, M.; Aljawad, M.S. Engineering Exploring the Impact of Mineralogy on Pore Structure and Fluid Dynamics in Tight Reservoir Rocks: Insights for Enhanced Oil Recovery and Gas Storage. 2025, 50, 5055-5080. [CrossRef]
- Basham, M.R.; Cerato, A.B.; Tabet, W.E. Using fractal geometry theory to quantify pore structure evolution and particle morphology of stabilized kaolinite. 2024, 36, 04024247. [CrossRef]
- Khangar, R.G.; Mendhe, V.A.; Kamble, A.D.; Ranjan Das, P.; Shukla, P.; Bannerjee, M.; Varma, A.K. Variation in pore structure and associated fractal dimensions of Barakar and Barren measures carbon-rich gas shales of Jharia Basin, India. 2021, 6, 28678-28698. [CrossRef]
- Jouini, M.S.; Alabere, A.O.; Alsuwaidi, M.; Morad, S.; Bouchaala, F.; Al Jallad, O.A. Experimental and digital investigations of heterogeneity in lower cretaceous carbonate reservoir using fractal and multifractal concepts. 2023, 13, 20306. [CrossRef]
- Katz, A.J.; Thompson, A.H. Quantitative prediction of permeability in porous rock. 1986, 34, 8179. [CrossRef]
- Yu, B.; Li, J. Fractal dimensions for unsaturated porous media. 2004, 12, 17-22. [CrossRef]
- Xu, P.; Yu, B. Developing a new form of permeability and Kozeny–Carman constant for homogeneous porous media by means of fractal geometry. 2008, 31, 74-81. [CrossRef]
Figure 1.
Conceptual workflow of the Dynamic Fractal Dimension Modeling (DFDM) framework. The framework integrates multi-scale imaging and laboratory experiments with fractal analysis, dynamic fractal dimension modeling, governing PDEs, and numerical solvers, ultimately linking pore-scale heterogeneity with reservoir-scale applications such as CO2 sequestration, enhanced oil recovery (EOR), and unconventional hydrocarbon recovery.
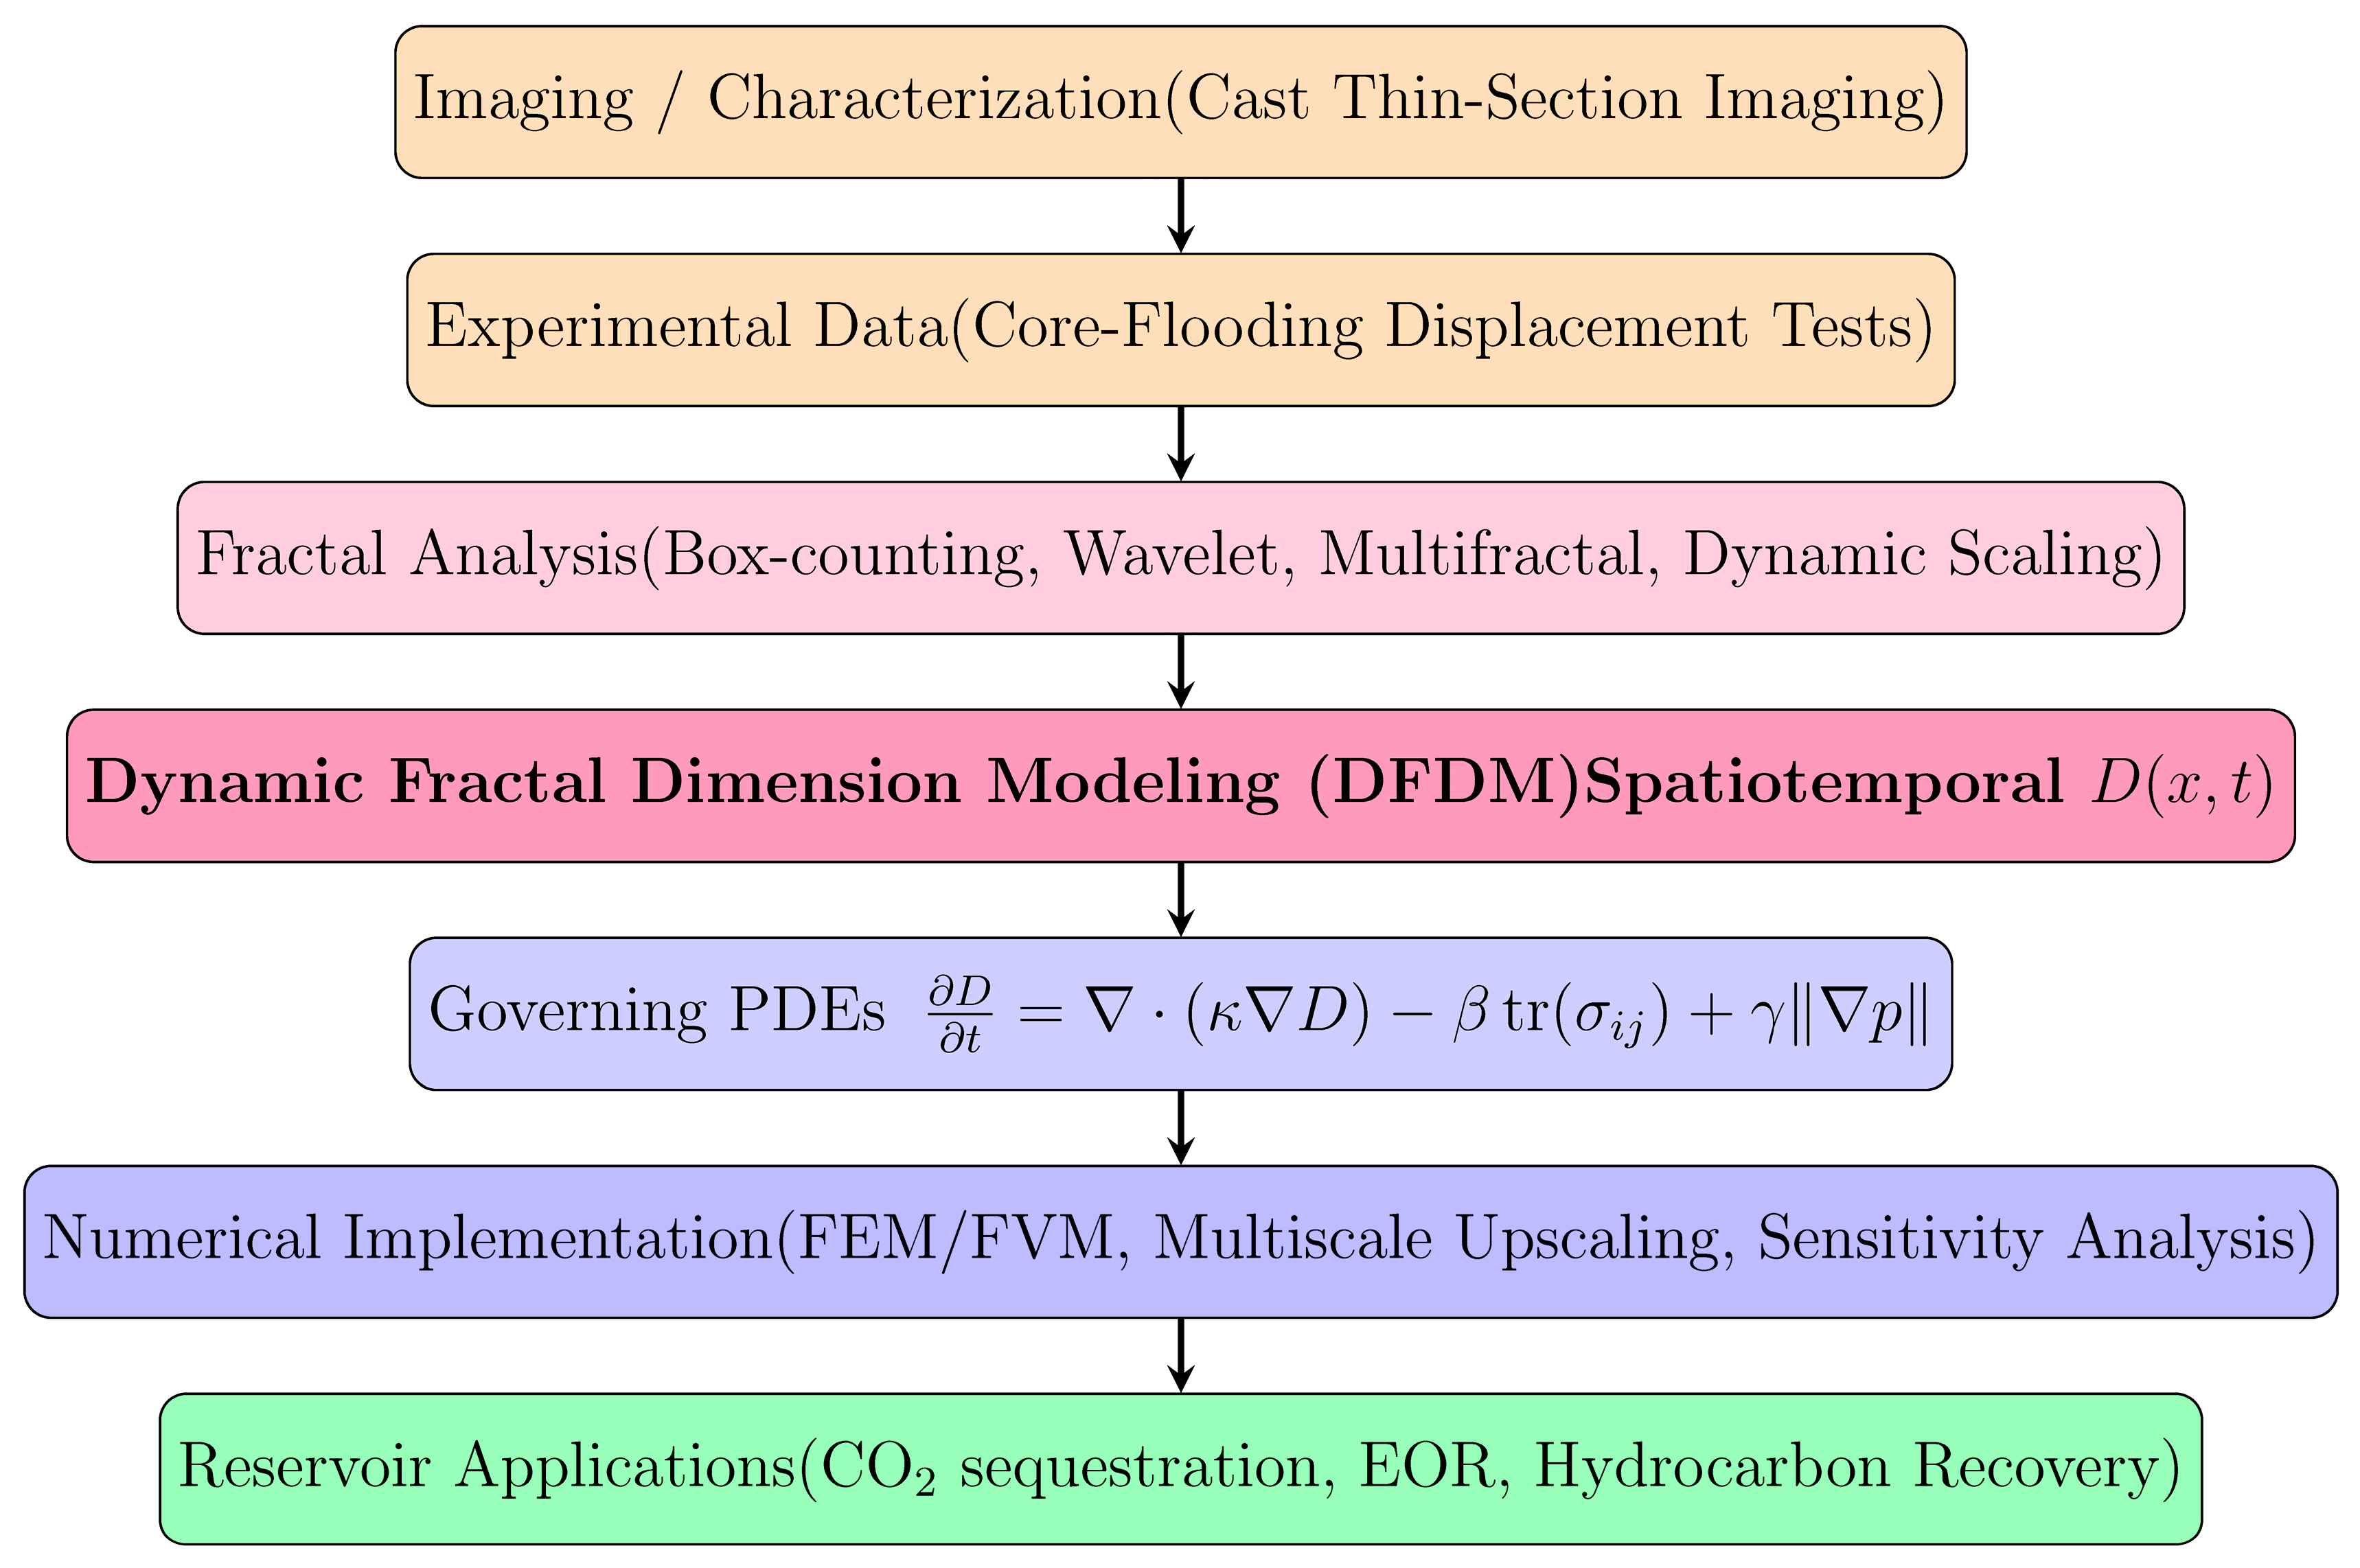
Figure 2.
Representative example of fractal dimension estimation using image-based analysis. (a) Thin-section micro-graph, (b) binary segmentation for pore-matrix identification and gray-level surface reconstruction, (c) box-dimension regression output from MATLAB interface. The regression in (c) yields a static fractal dimension of approximately , which is adopted as the baseline value for initializing DFDM predictions. The detailed implementation of the wavelet and box-counting procedures is summarized in Appendix A.3.
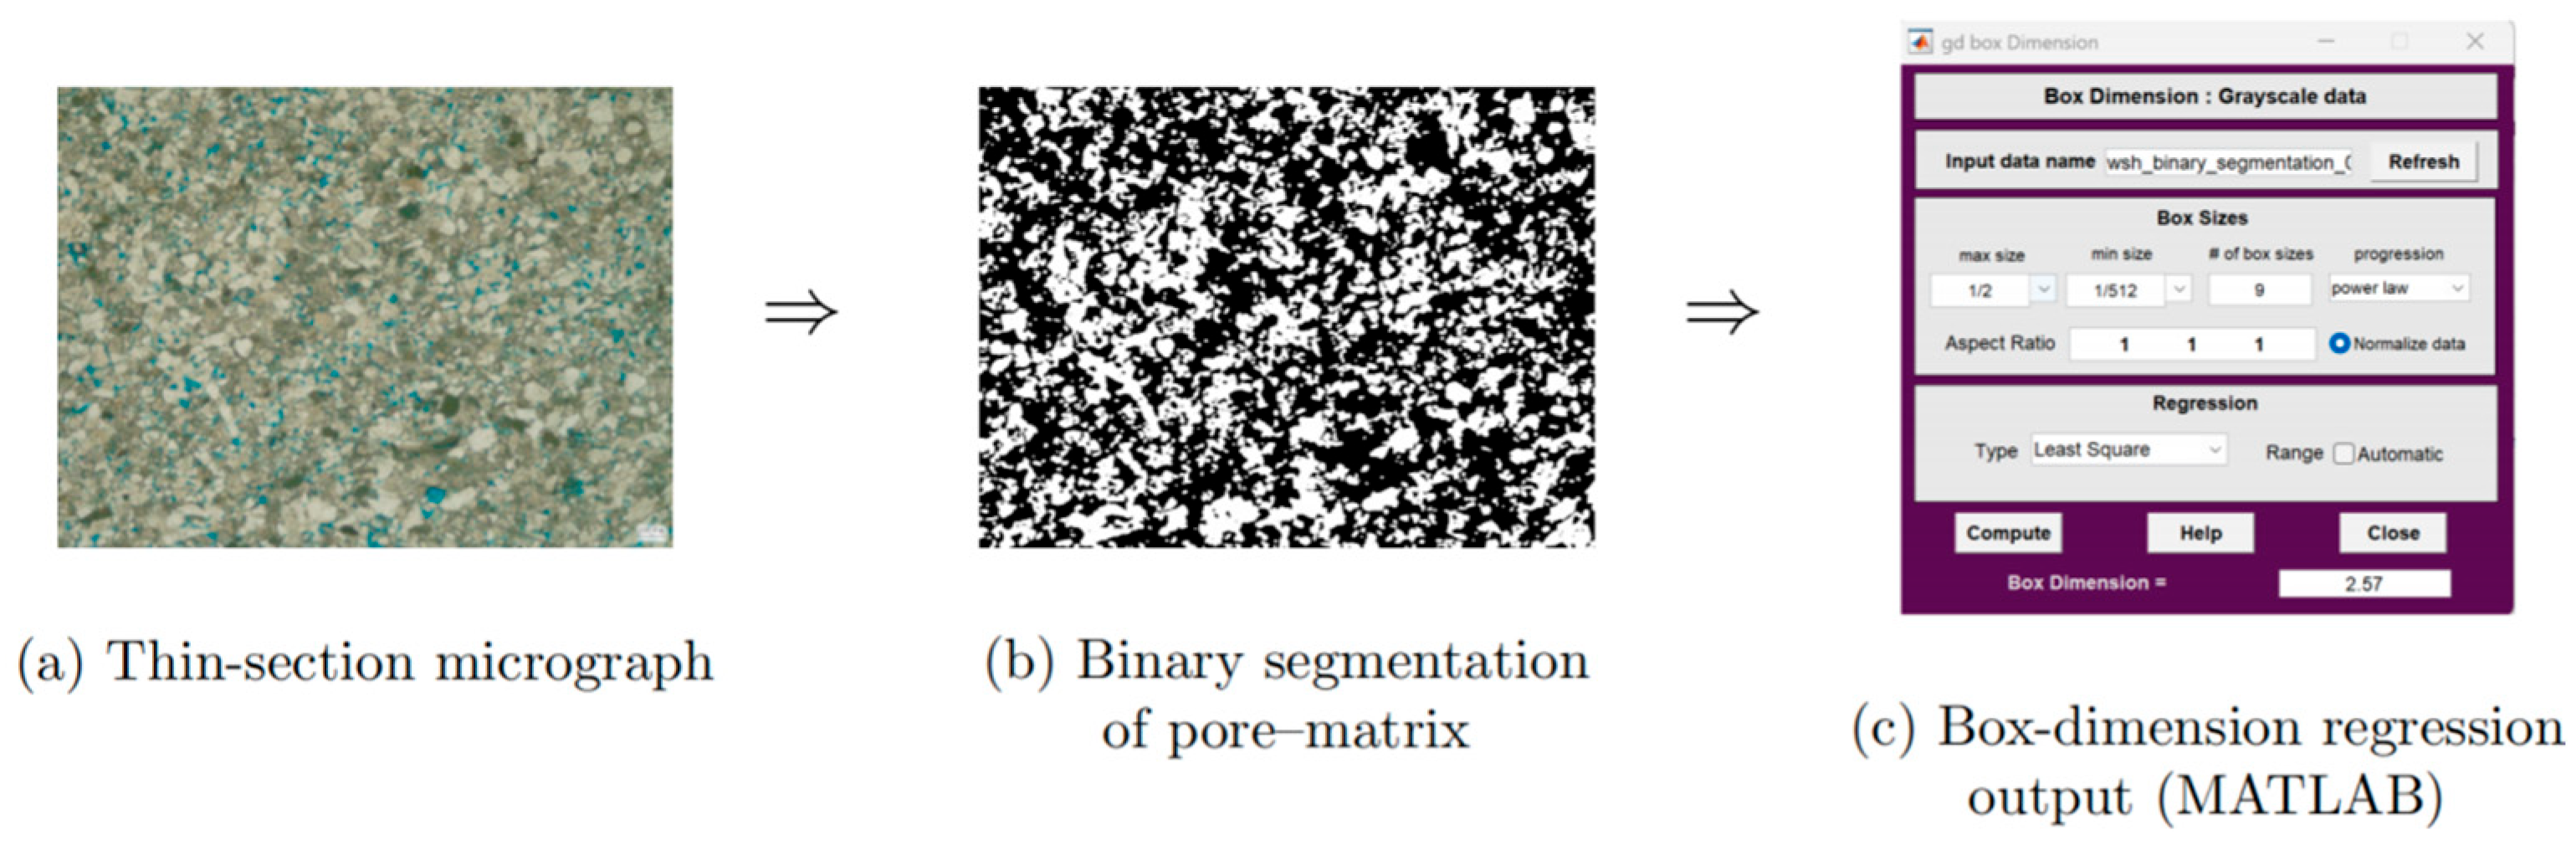
Figure 3.
Static fractal dimension estimation of pore structures. (a) Representative binary micro-graph of the rock thin-section, (b) binary pore-matrix representation and gray-level surface reconstruction after wavelet shrinkage preprocessing, and (c) log-log regression curve from the box-counting method. The slope of the fitted line yields an estimated fractal dimension of , which serves as the static baseline value for subsequent dynamic fractal dimension analysis.
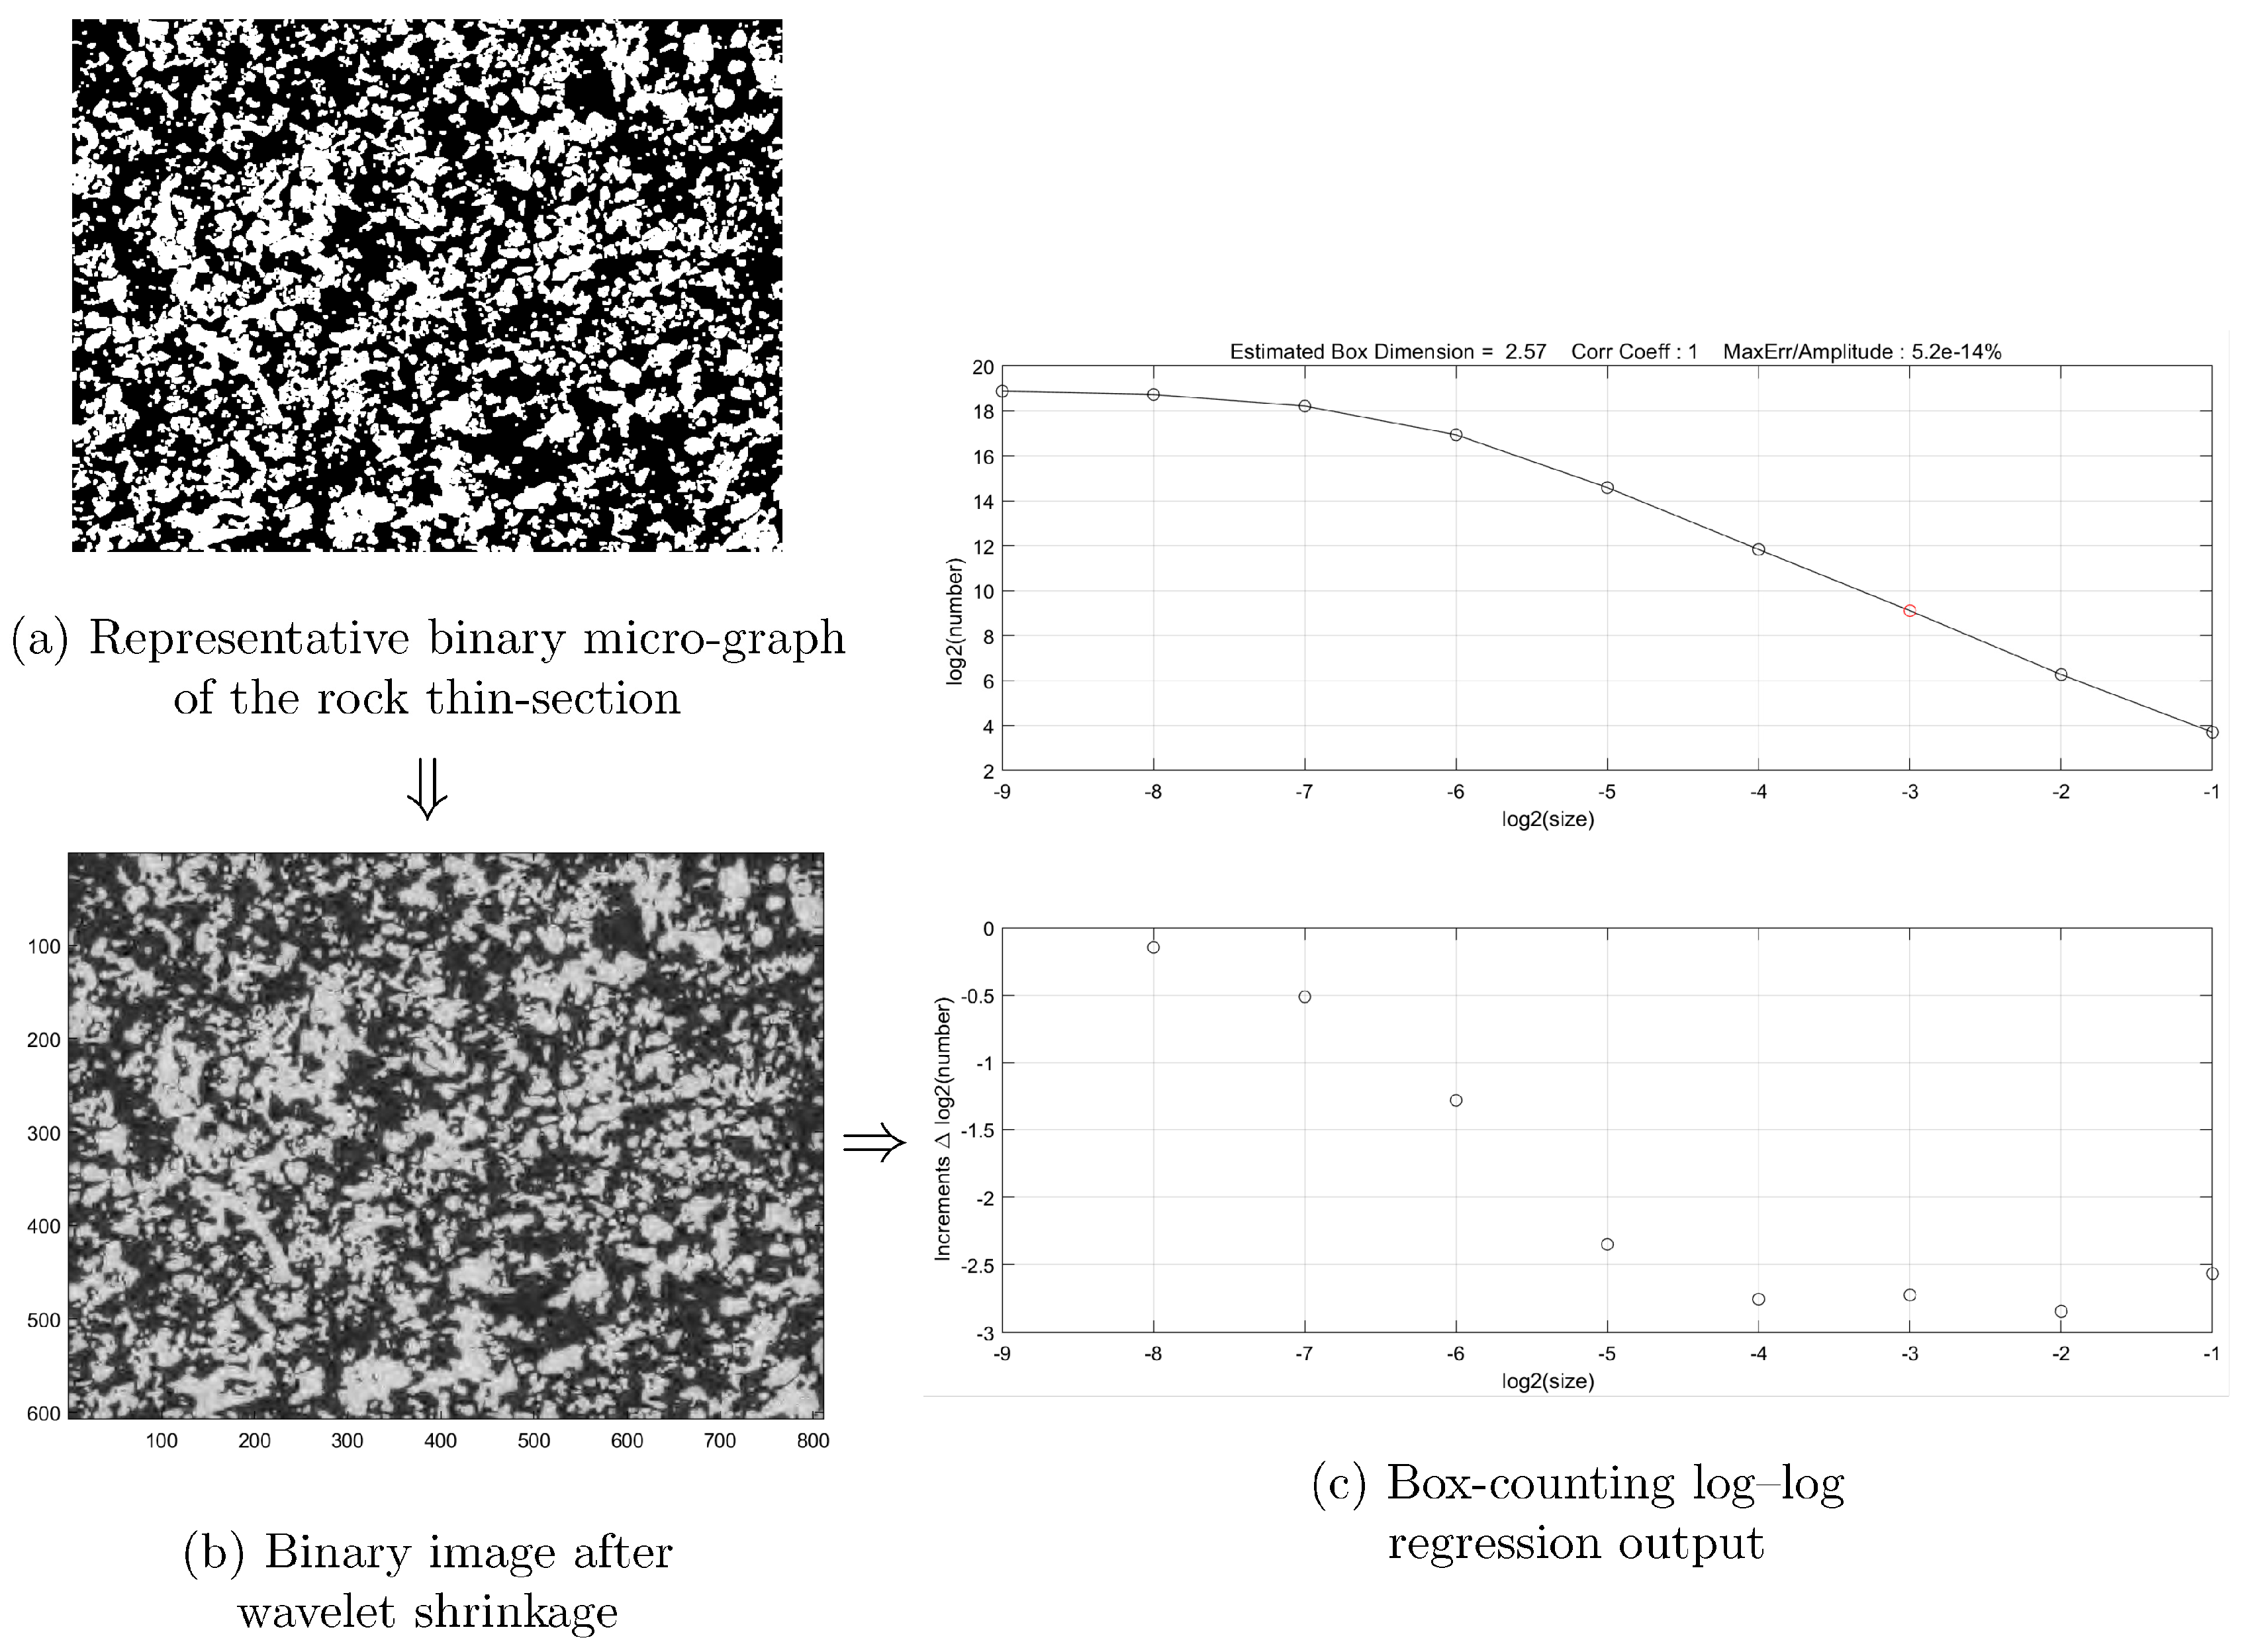
Figure 4.
Experimental Pressure Propagation Curves Showing Three Stages of CO2 Flooding. The graph illustrates the pressure distribution over time at nine measurement points (P1-P9) along a long core sample during CO2 displacement in stress-sensitive porous media. The orange and purple dashed lines represent the Boundary Transition Zone 1 and Boundary Transition Zone 2, respectively. The results demonstrate the gradual pressure propagation and stabilization over time, with evident transitions as CO2 breakthrough occurs.
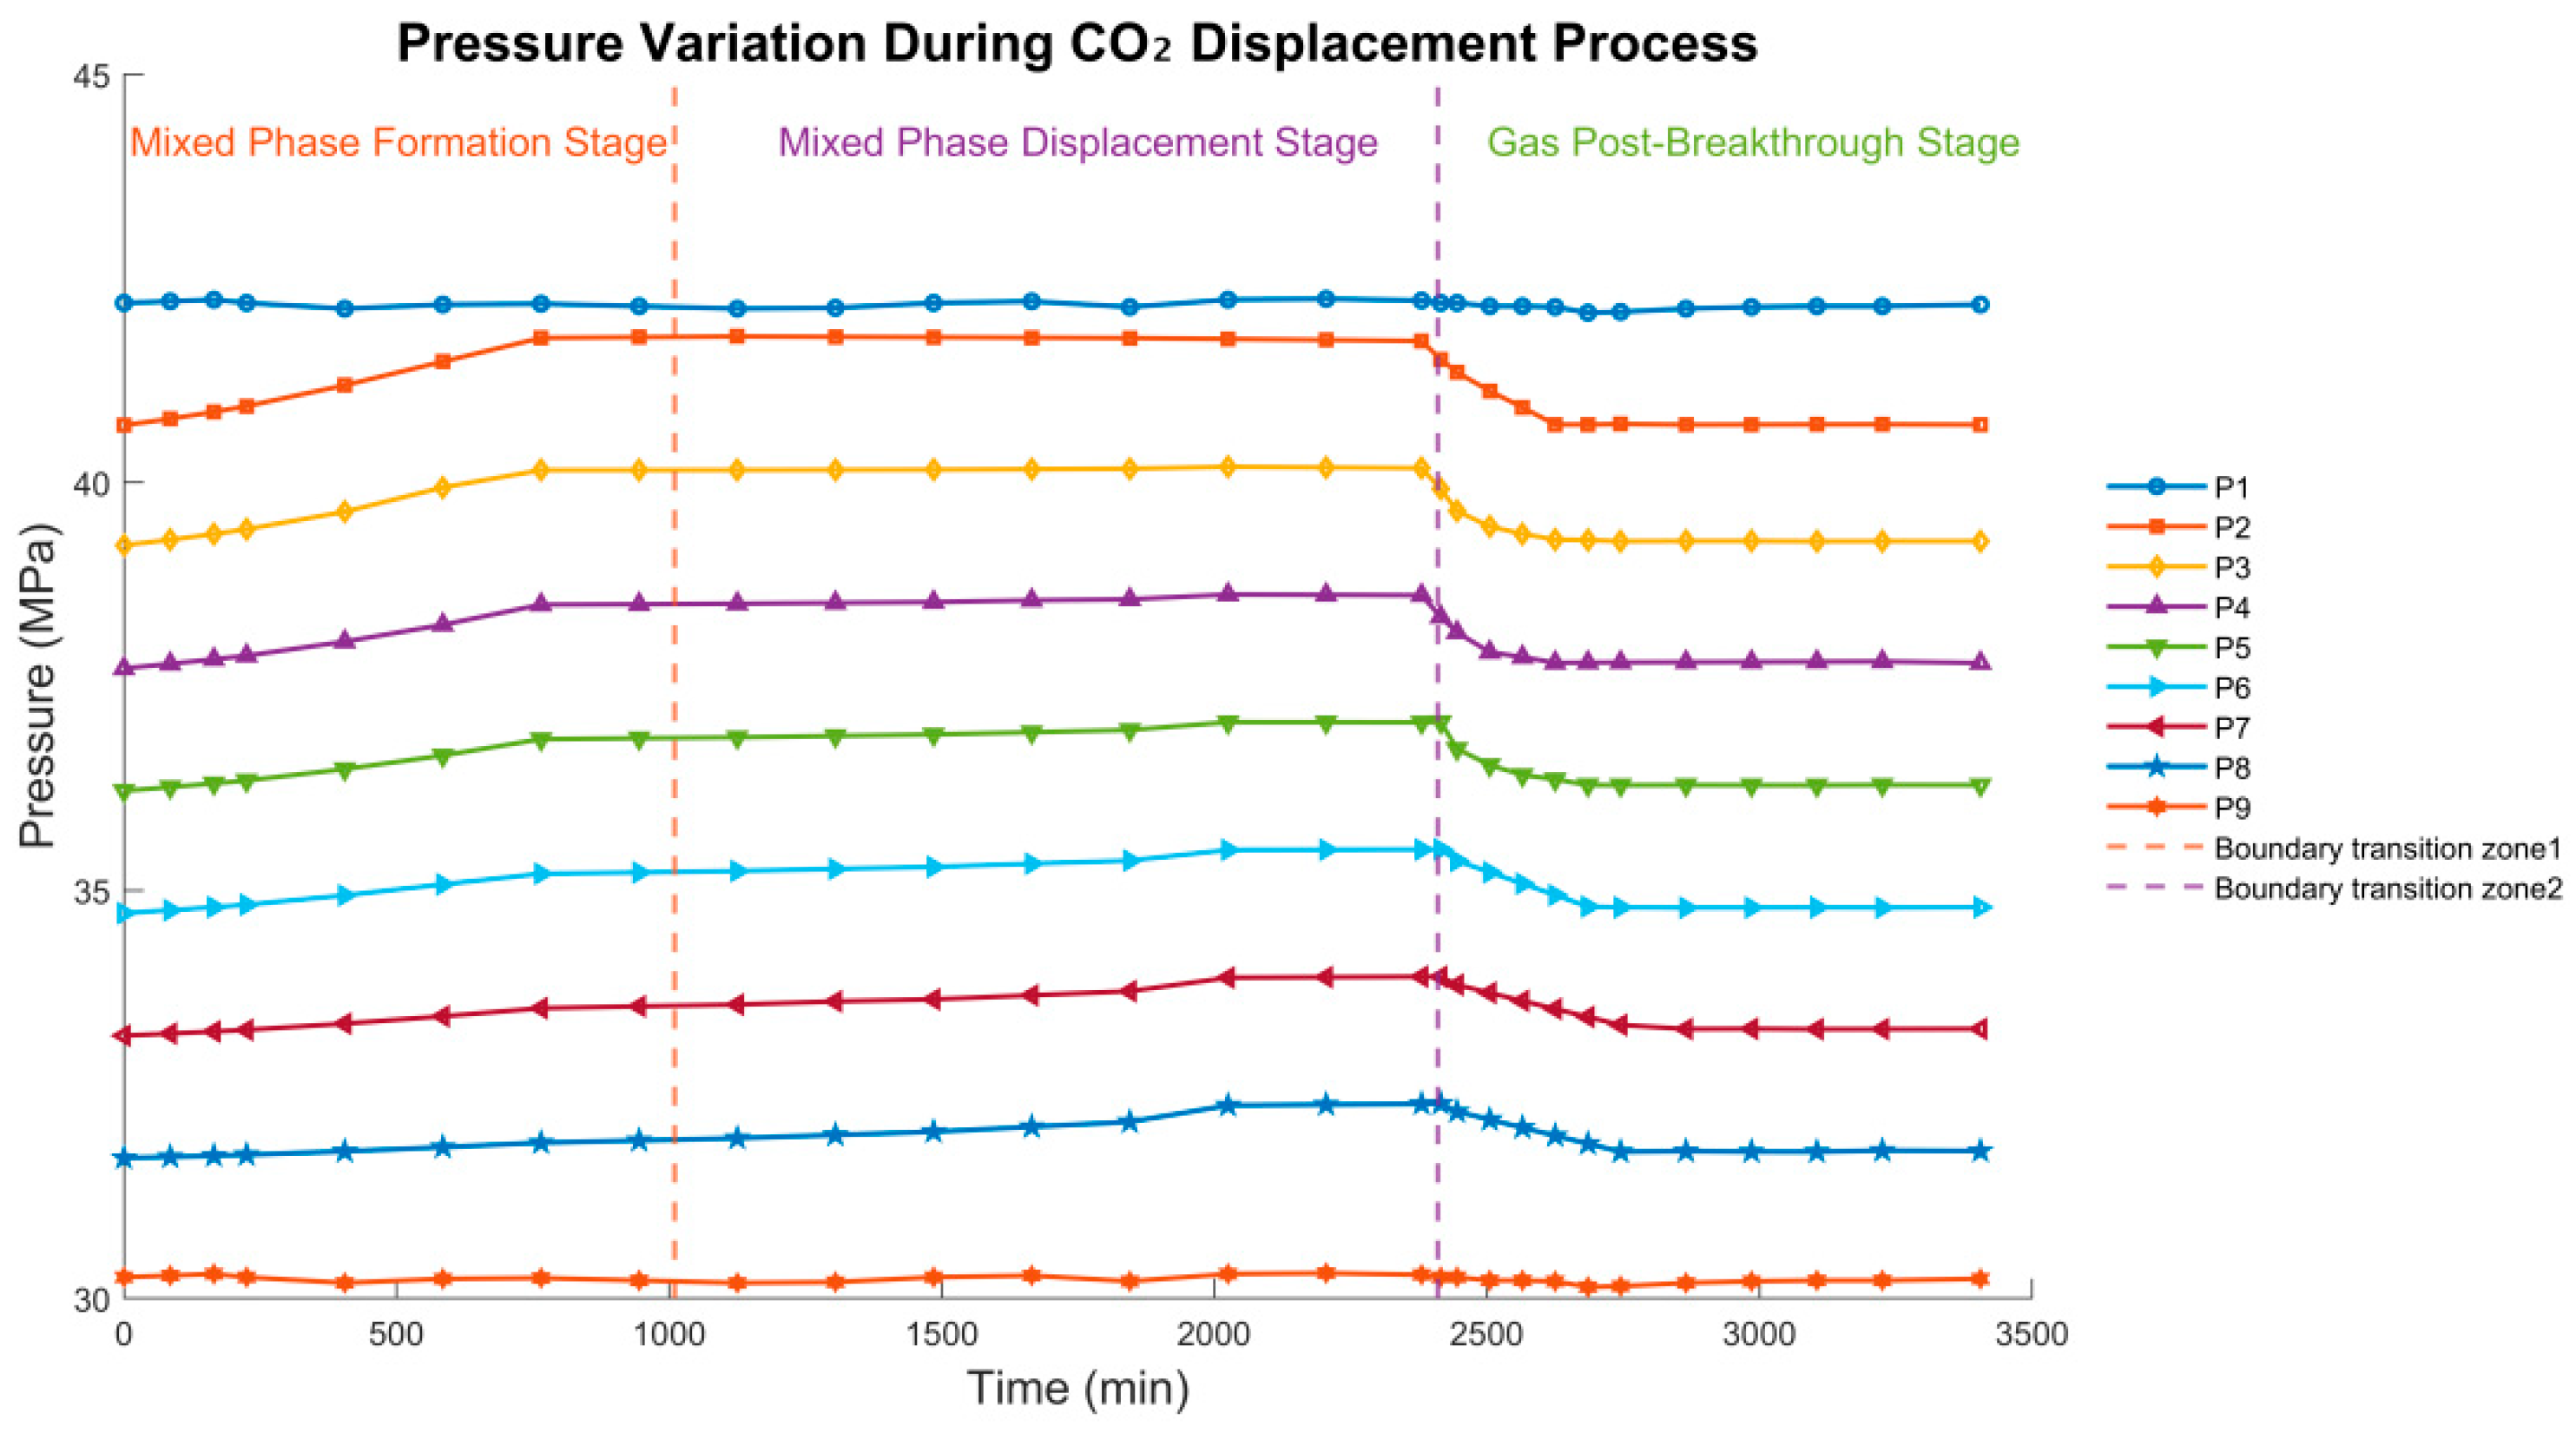
Figure 5.
Spatiotemporal Evolution of Fractal Dimensions Predicted by DFDM. The Heat-map of dynamic fractal dimension as a function of normalized core length x/L and injection time t. The color scale indicates continuous variations in pore-scale heterogeneity, while white contour lines highlight key scaling thresholds. Results demonstrate a progressive attenuation of fractal complexity with increasing injection time, reflecting stress-dependent reorganization of pore networks.
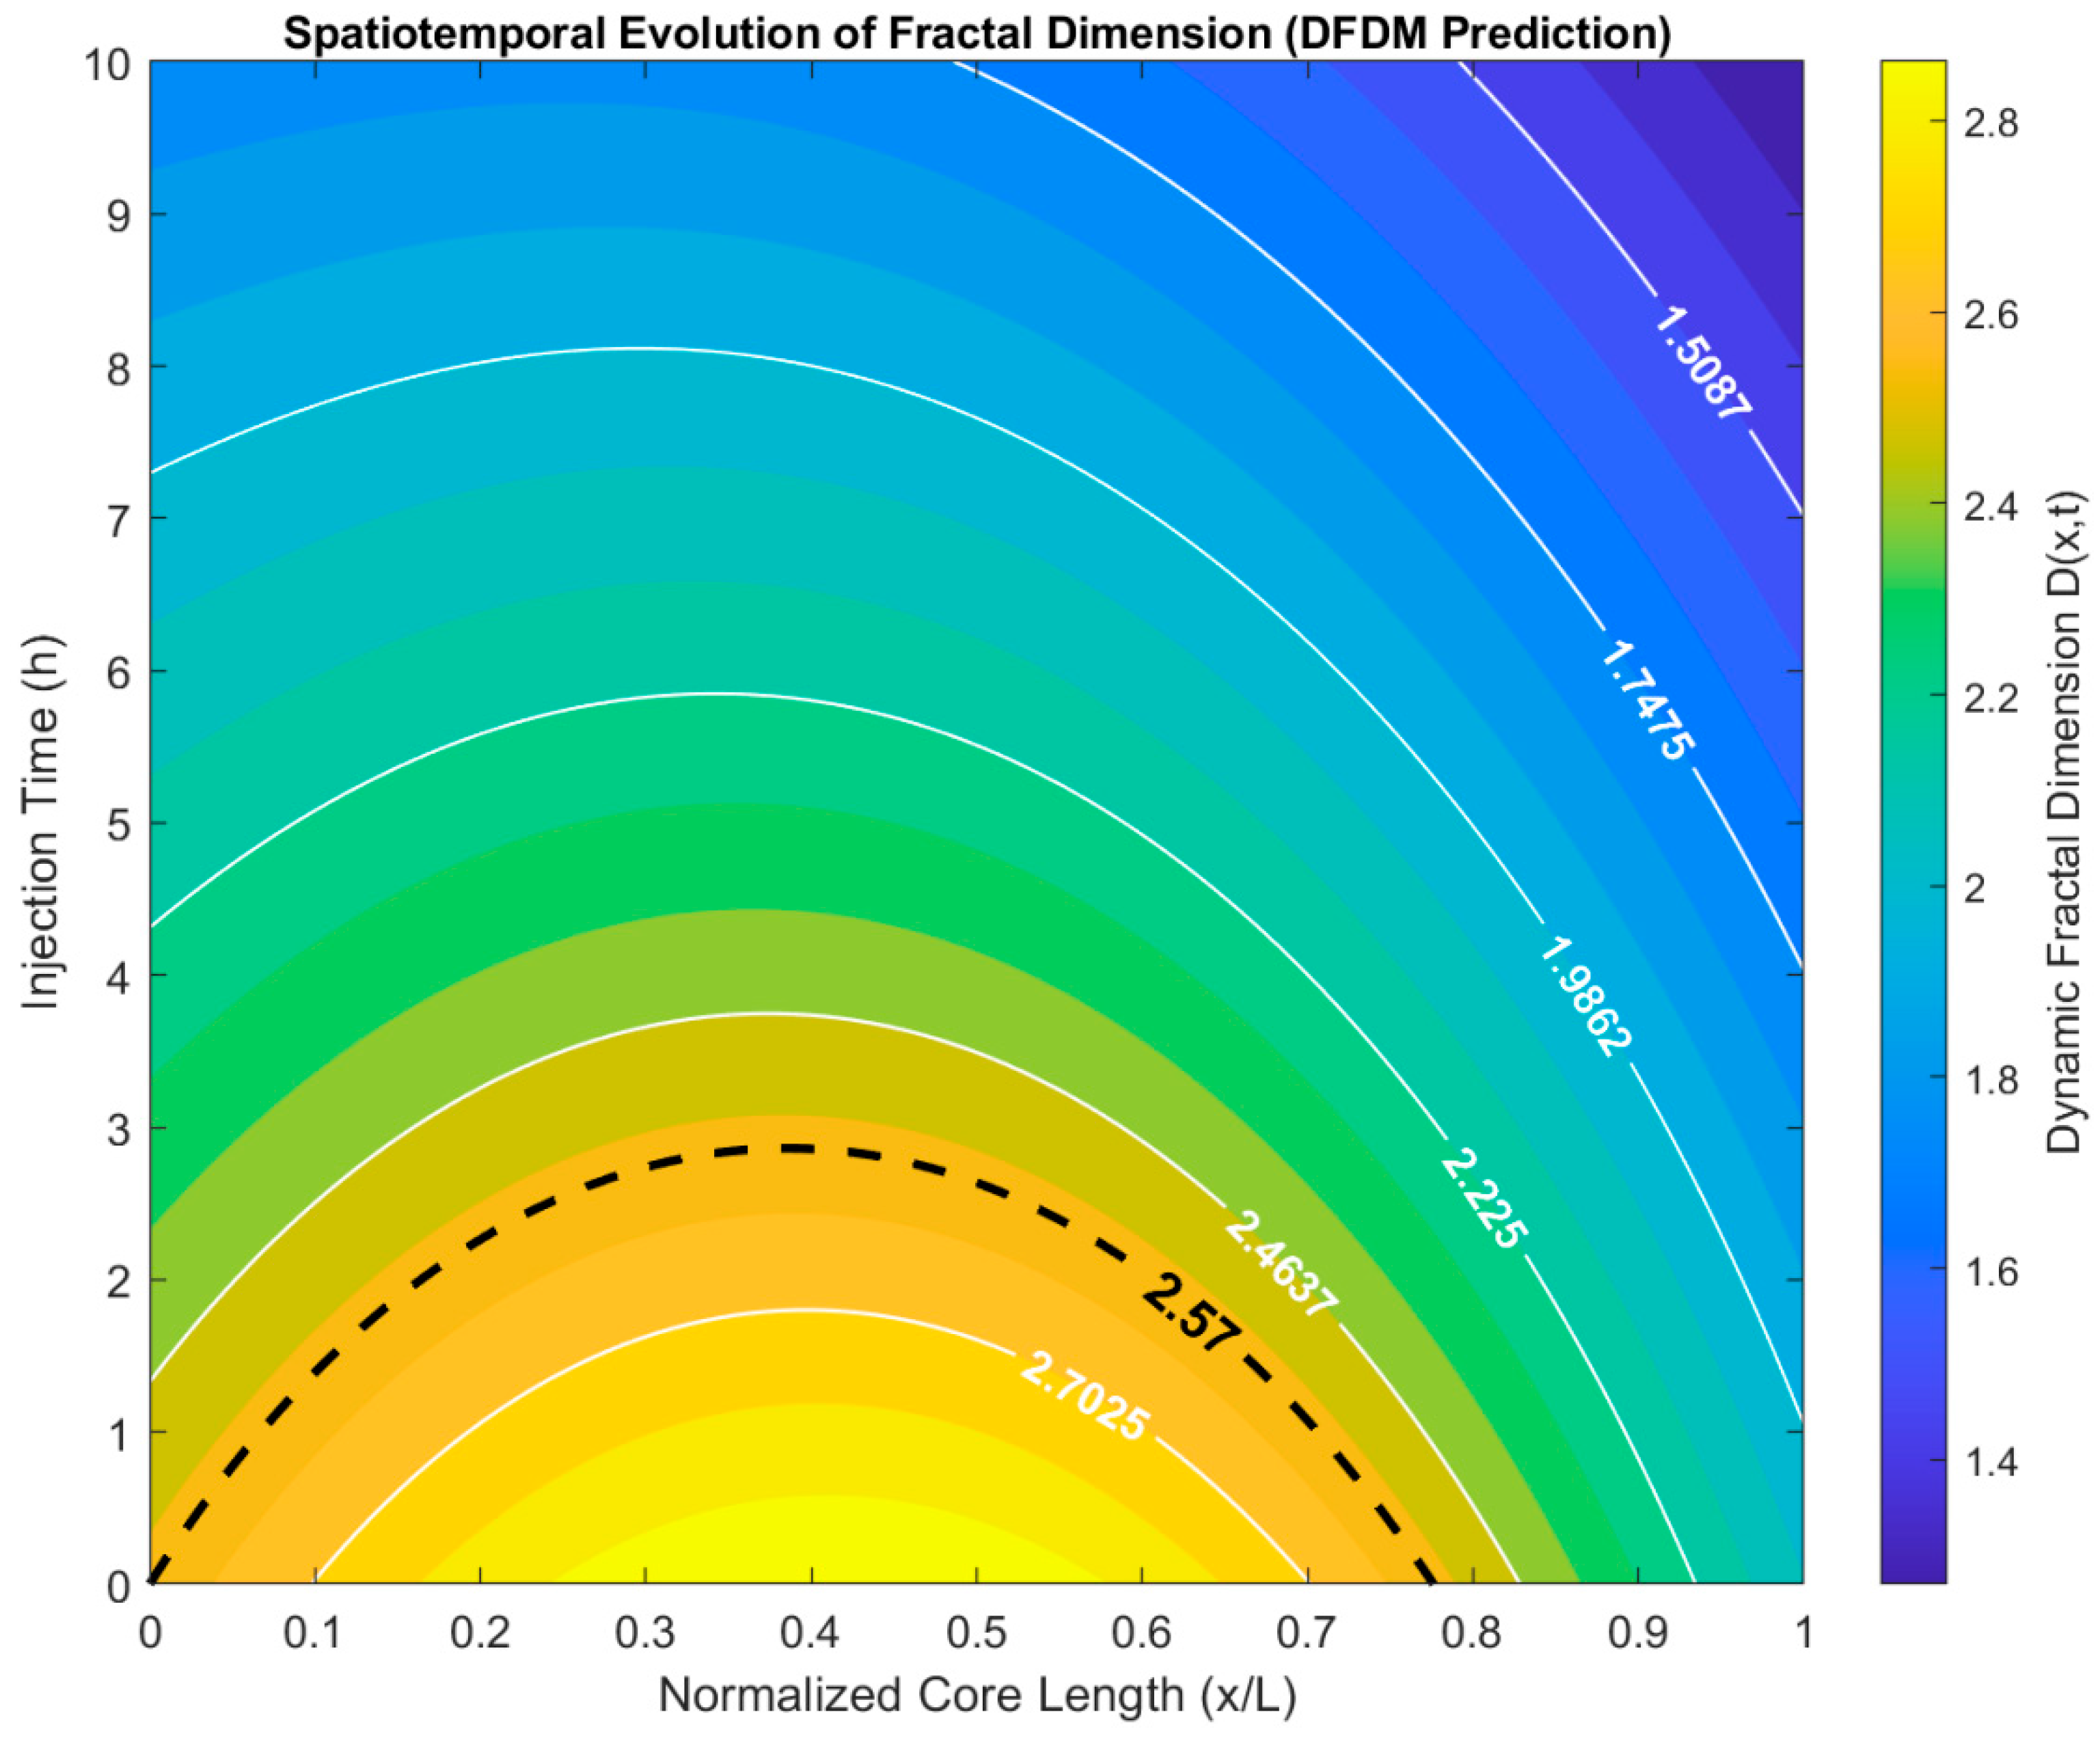
Figure 6.
Validation of DFDM Predictions against Experimental Observations. Black circles with error bars represent experimental fractal dimensions , which were constructed based on the static baseline value () to provide reference points for validation. The blue solid line denotes the DFDM prediction after parameter calibration, while the green dashed line shows an uncalibrated prediction used for comparison. The close match between the calibrated DFDM curve and the experimental trend is quantitatively supported by a coefficient of determination (), indicating that 88% of the variance in the experimental data is explained by the model. The mean squared error (MSE=0.0013) further demonstrates the model's predictive accuracy by quantifying the average squared deviation between predictions and experimental points. The regression metrics (, MSE=0.0013) were computed based on 40 experimental data points of the fractal dimension as a function of the cumulative injection volume V. The dataset corresponds to one-dimensional regression rather than volumetric image data.Together, these results confirm that DFDM can reliably reproduce the spatiotemporal evolution of fractal dimensions under CO2 flooding conditions.
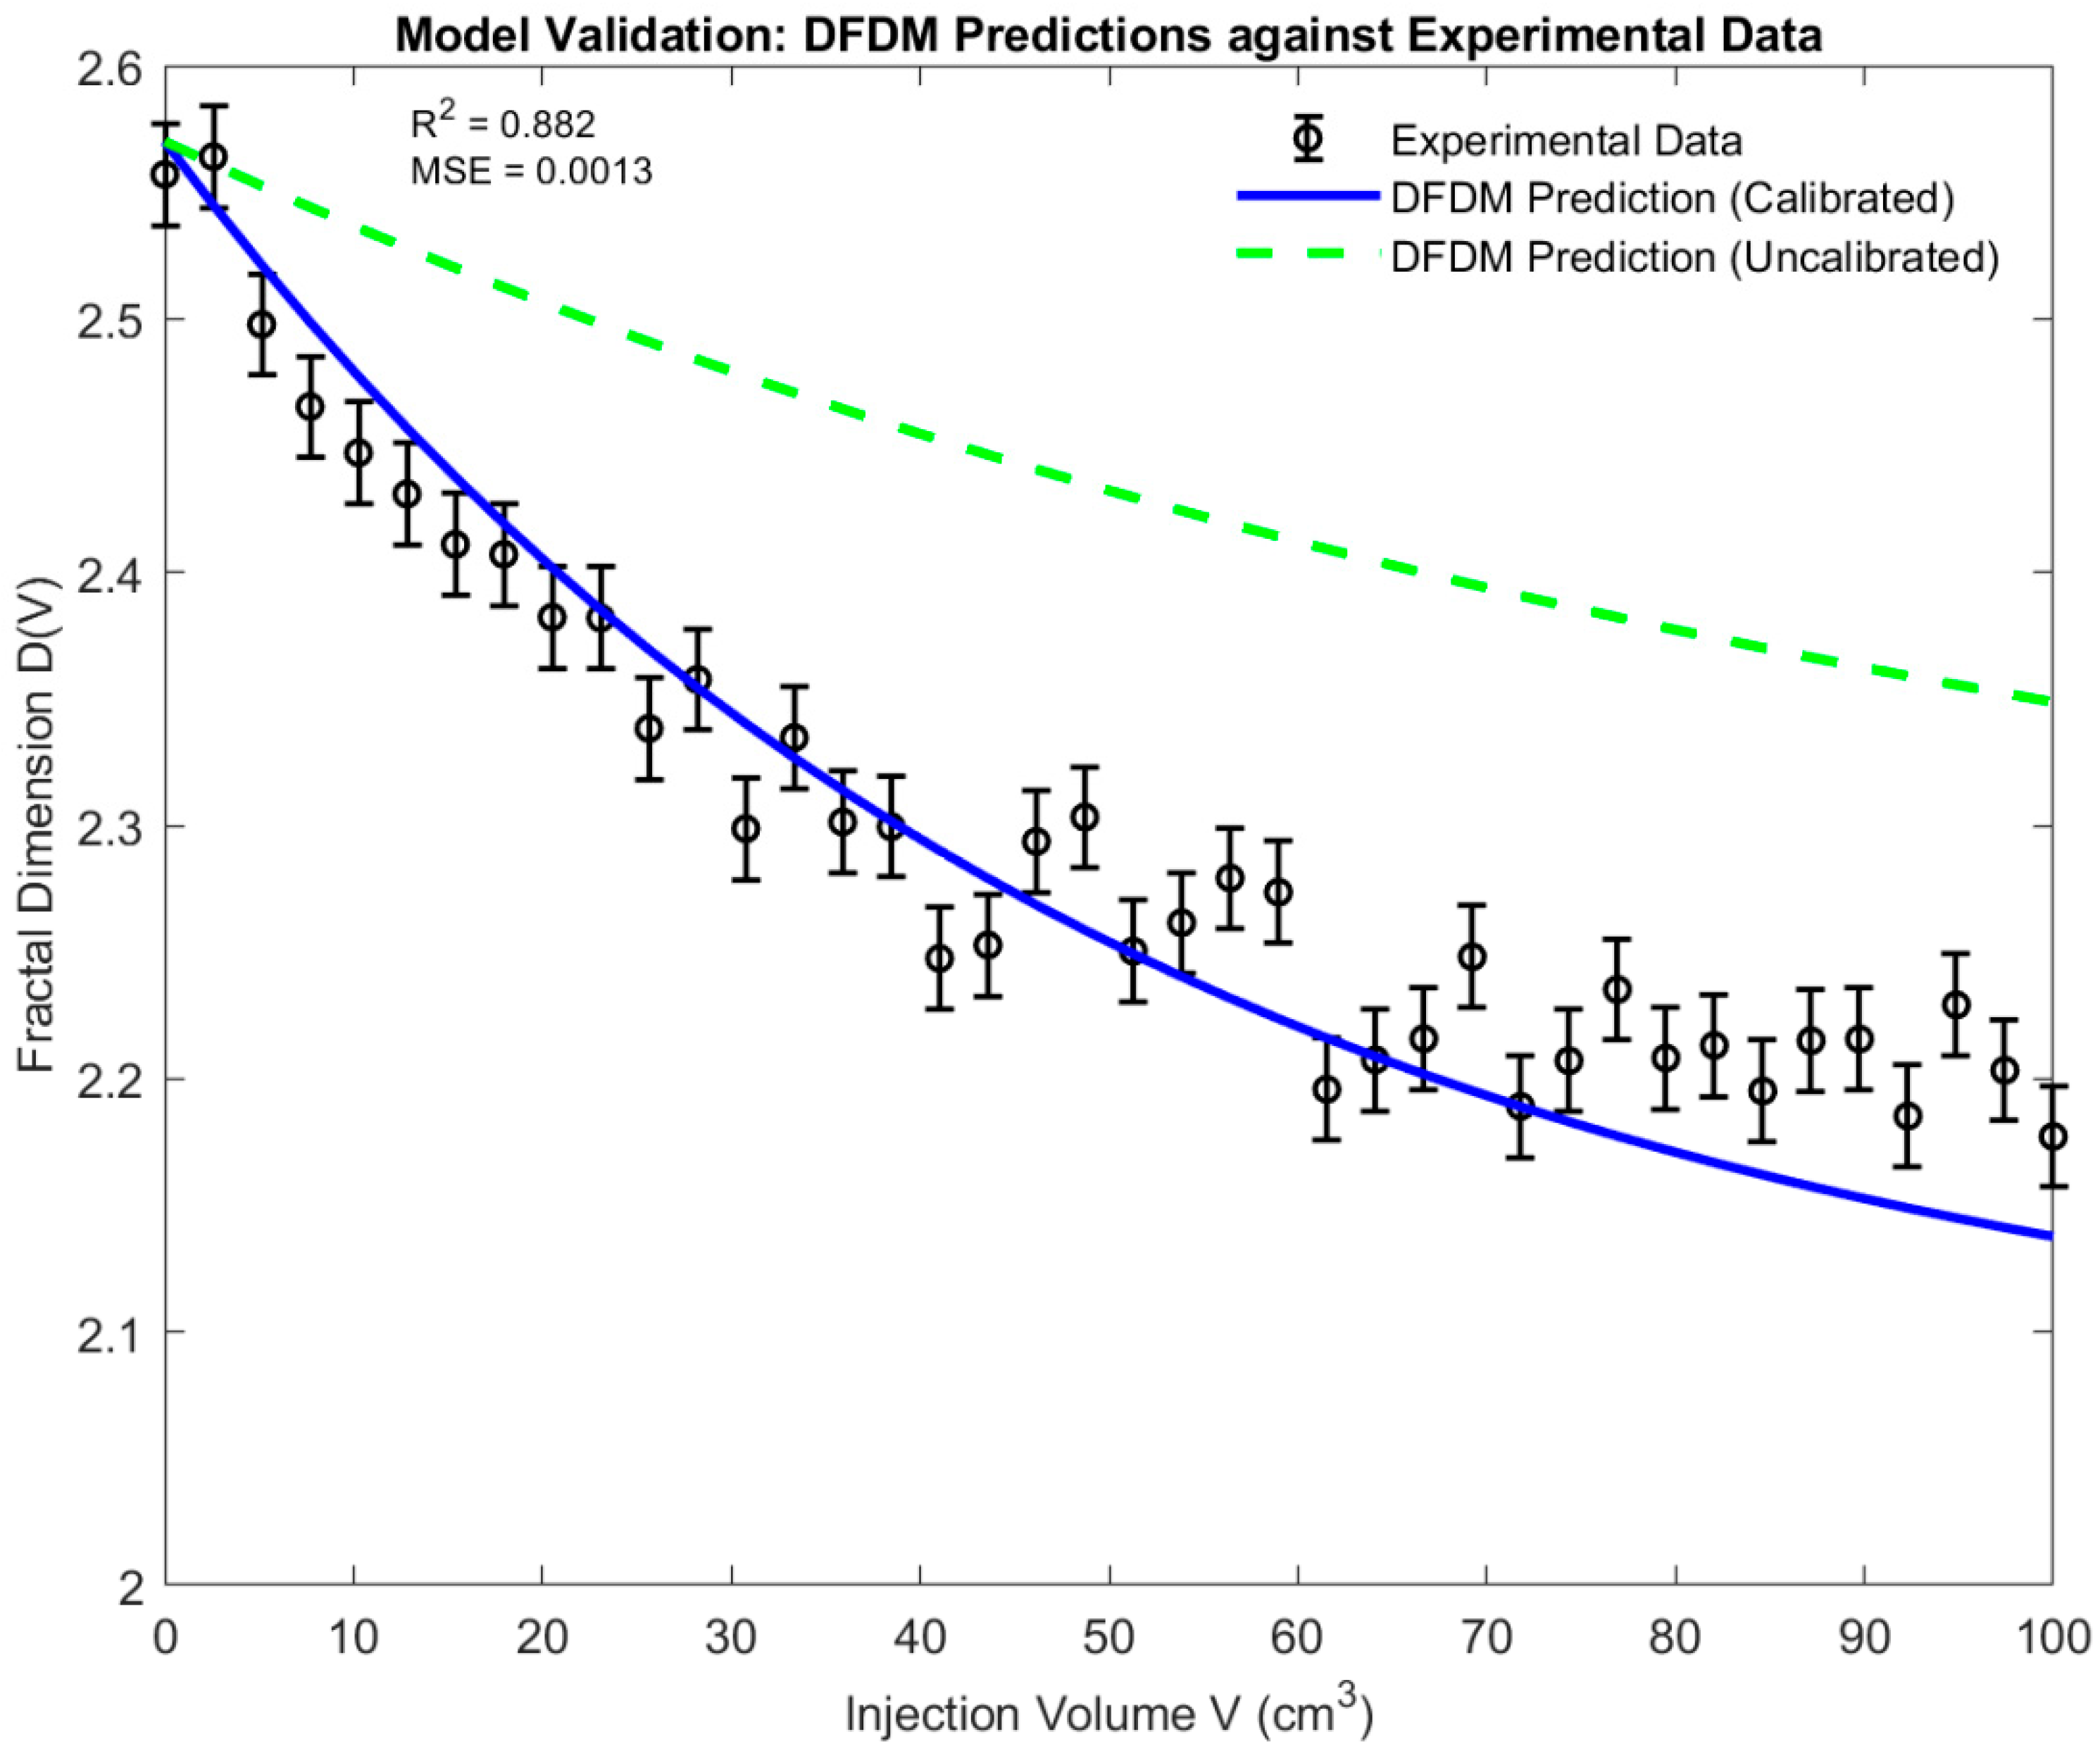
Figure 7.
Sensitivity Analysis of DFDM Predictions with Respect to Key Parameters. (a) Bar chart showing normalized sensitivity values of the four governing parameters, and (b) radar chart illustrating the relative contribution of each parameter. Relative sensitivities of the four governing parameters () obtained from perturbation tests, were carefully re-evaluated and are now expressed in consistent scientific notation. The time-scaling exponent exhibits the highest normalized sensitivity () on the predicted fractal dimensions, governing the overall temporal decline of the fractal dimension. The stress-coupling coefficient ranks second , reflecting its significant control over the spatial gradient of fractal reorganization. The oscillatory modulation parameter shows a lower sensitivity (), suggesting that sinusoidal heterogeneity exerts secondary effects, while the attenuation factor shows the weakest effect (), indicating that exponential damping has minimal impact on the global fractal evolution. A radar chart provides a global comparison, confirming the relative ranking and highlighting the consistency of the updated sensitivity values across parameter perturbations. These results highlight that the DFDM framework is most sensitive to and , but overall retains predictive robustness across parameter variations, underscoring the global stability and adaptability of the model under diverse reservoir conditions. Taken together, the bar chart (Figure 7a) highlights the relative ranking of parameters, while the radar chart (Figure 7b) provides a global comparison, confirming that the predictive framework remains stable even when subject to parameter variability.
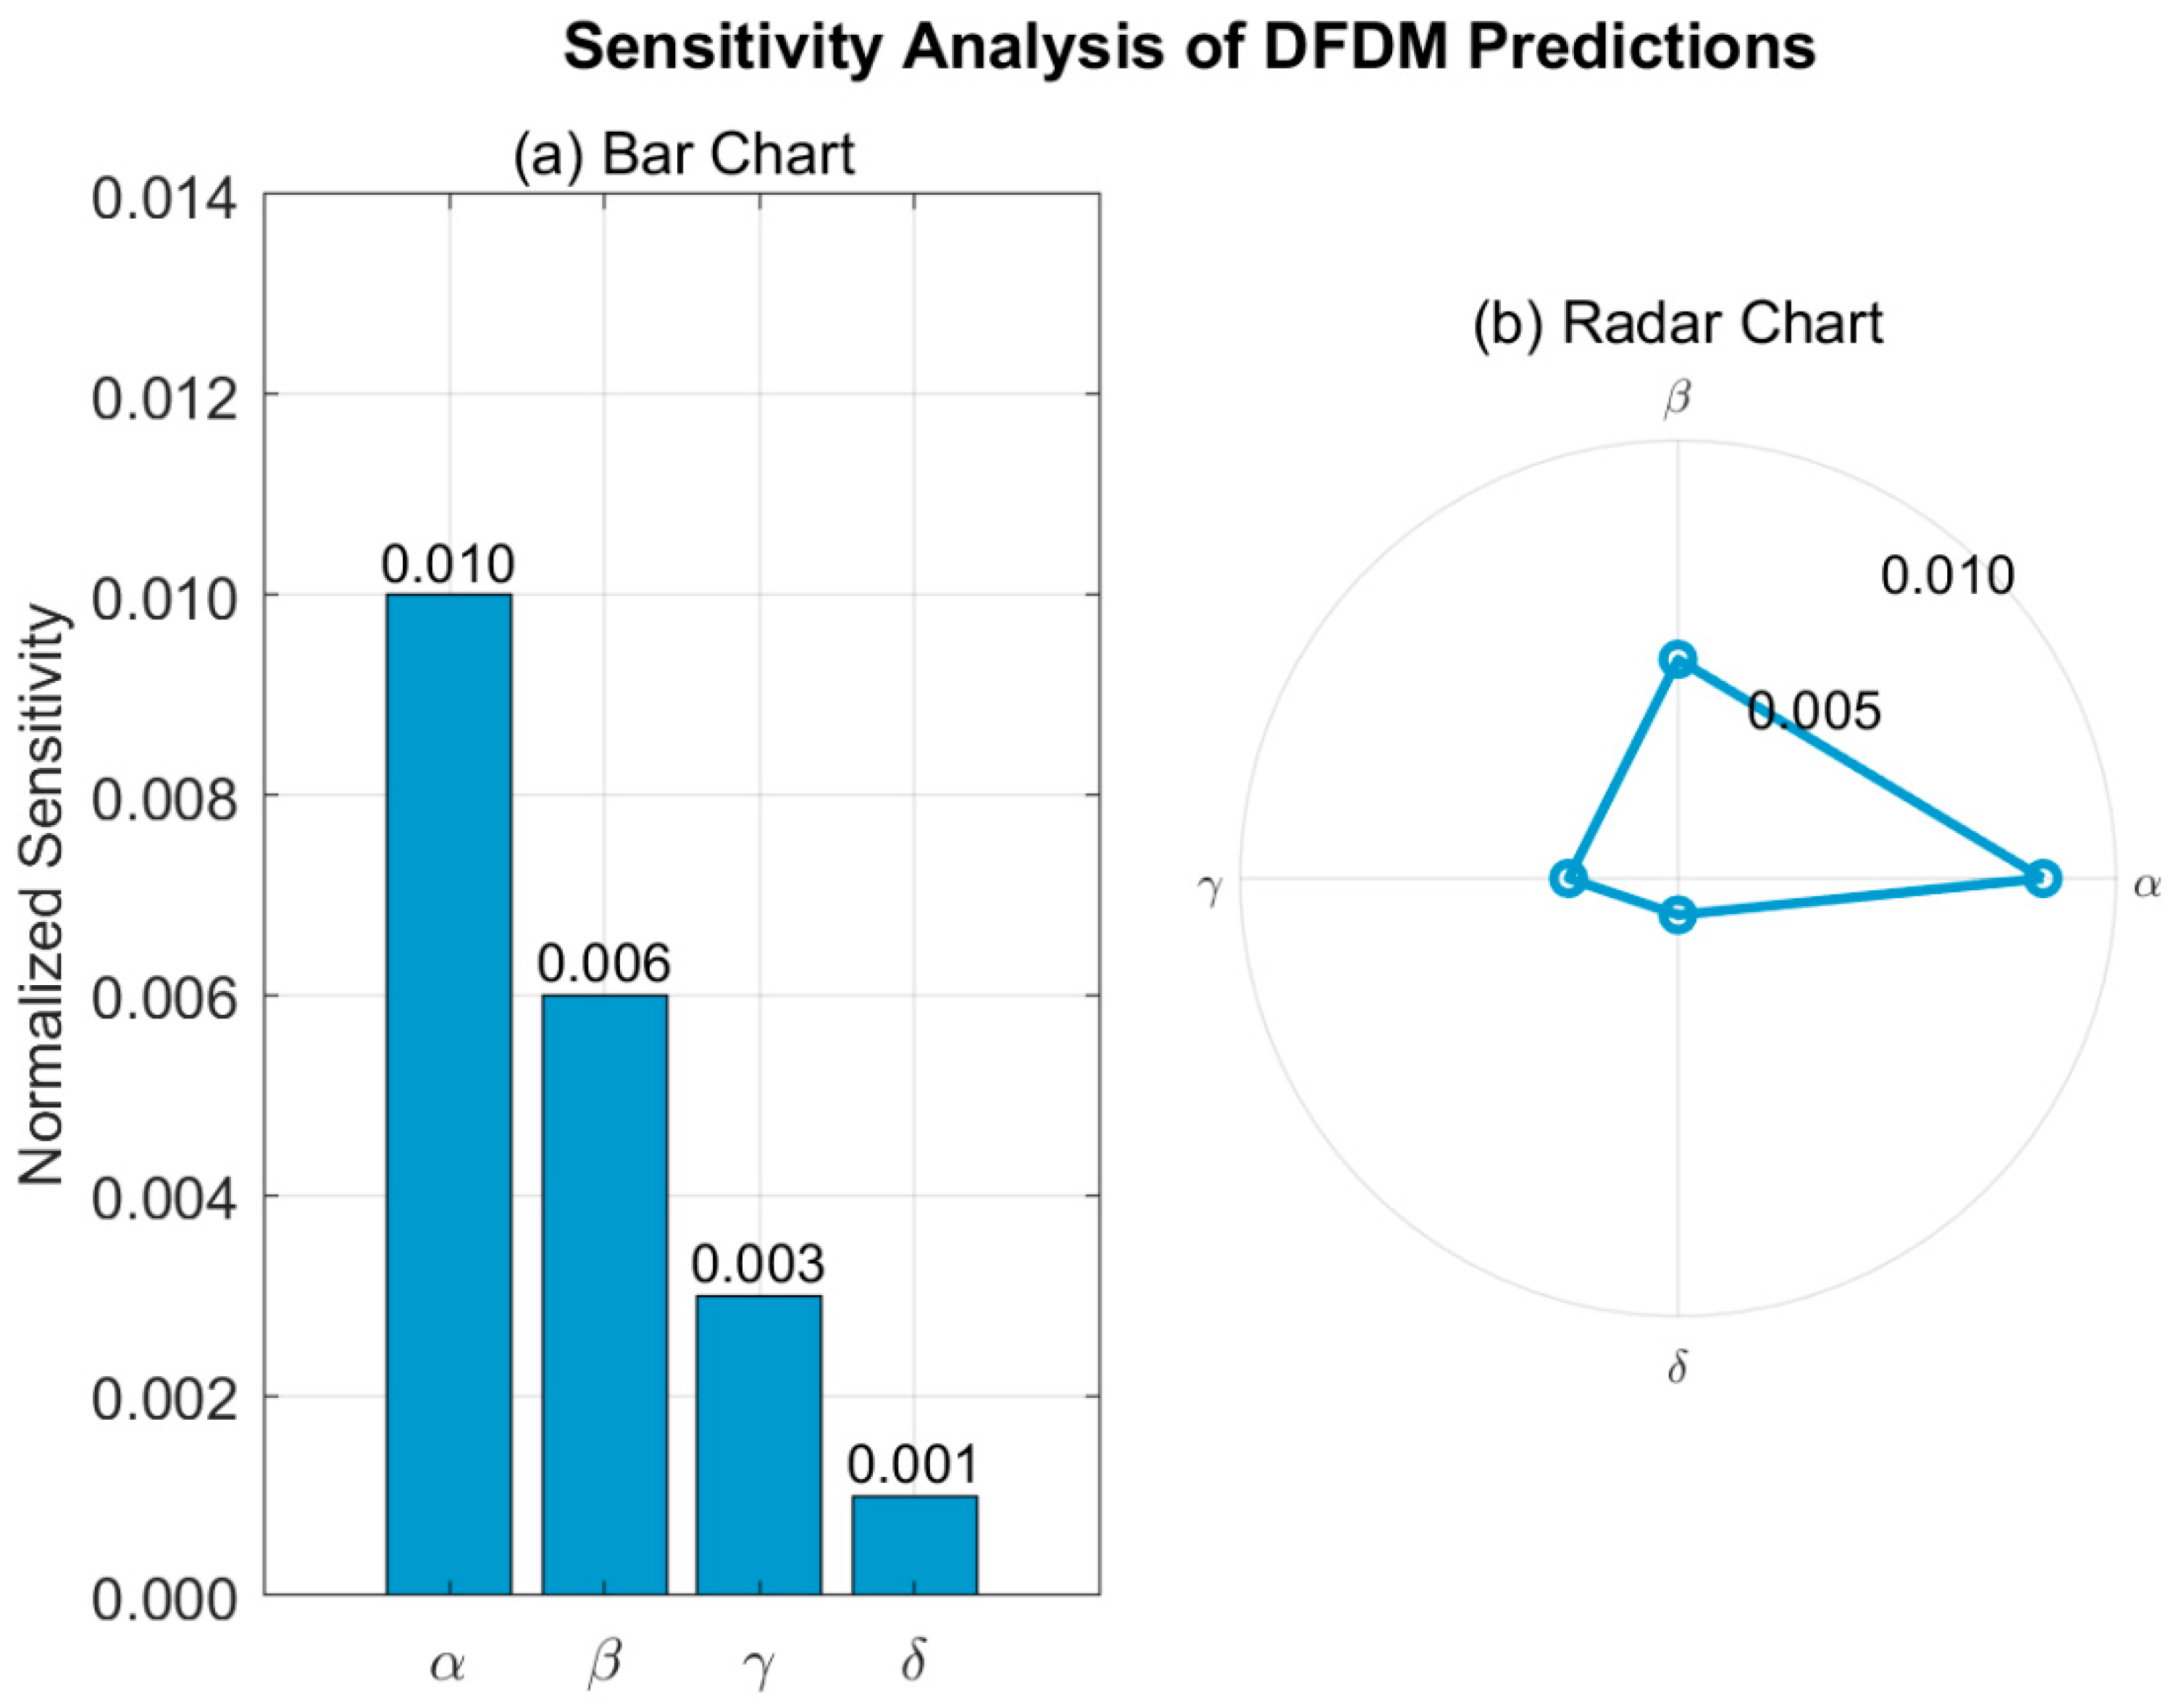
Figure 8.
Mechanistic insights from DFDM. (a) Compaction-dominated regime: Stress-induced pore compaction increases fractal dimension () and lowers permeability(), reflecting stress-sensitive loss of connectivity. (b) Dissolution-dominated regime: Flow-driven dissolution enlarges pore structures, leading to a reduction in fractal dimension () and enhanced permeability ().
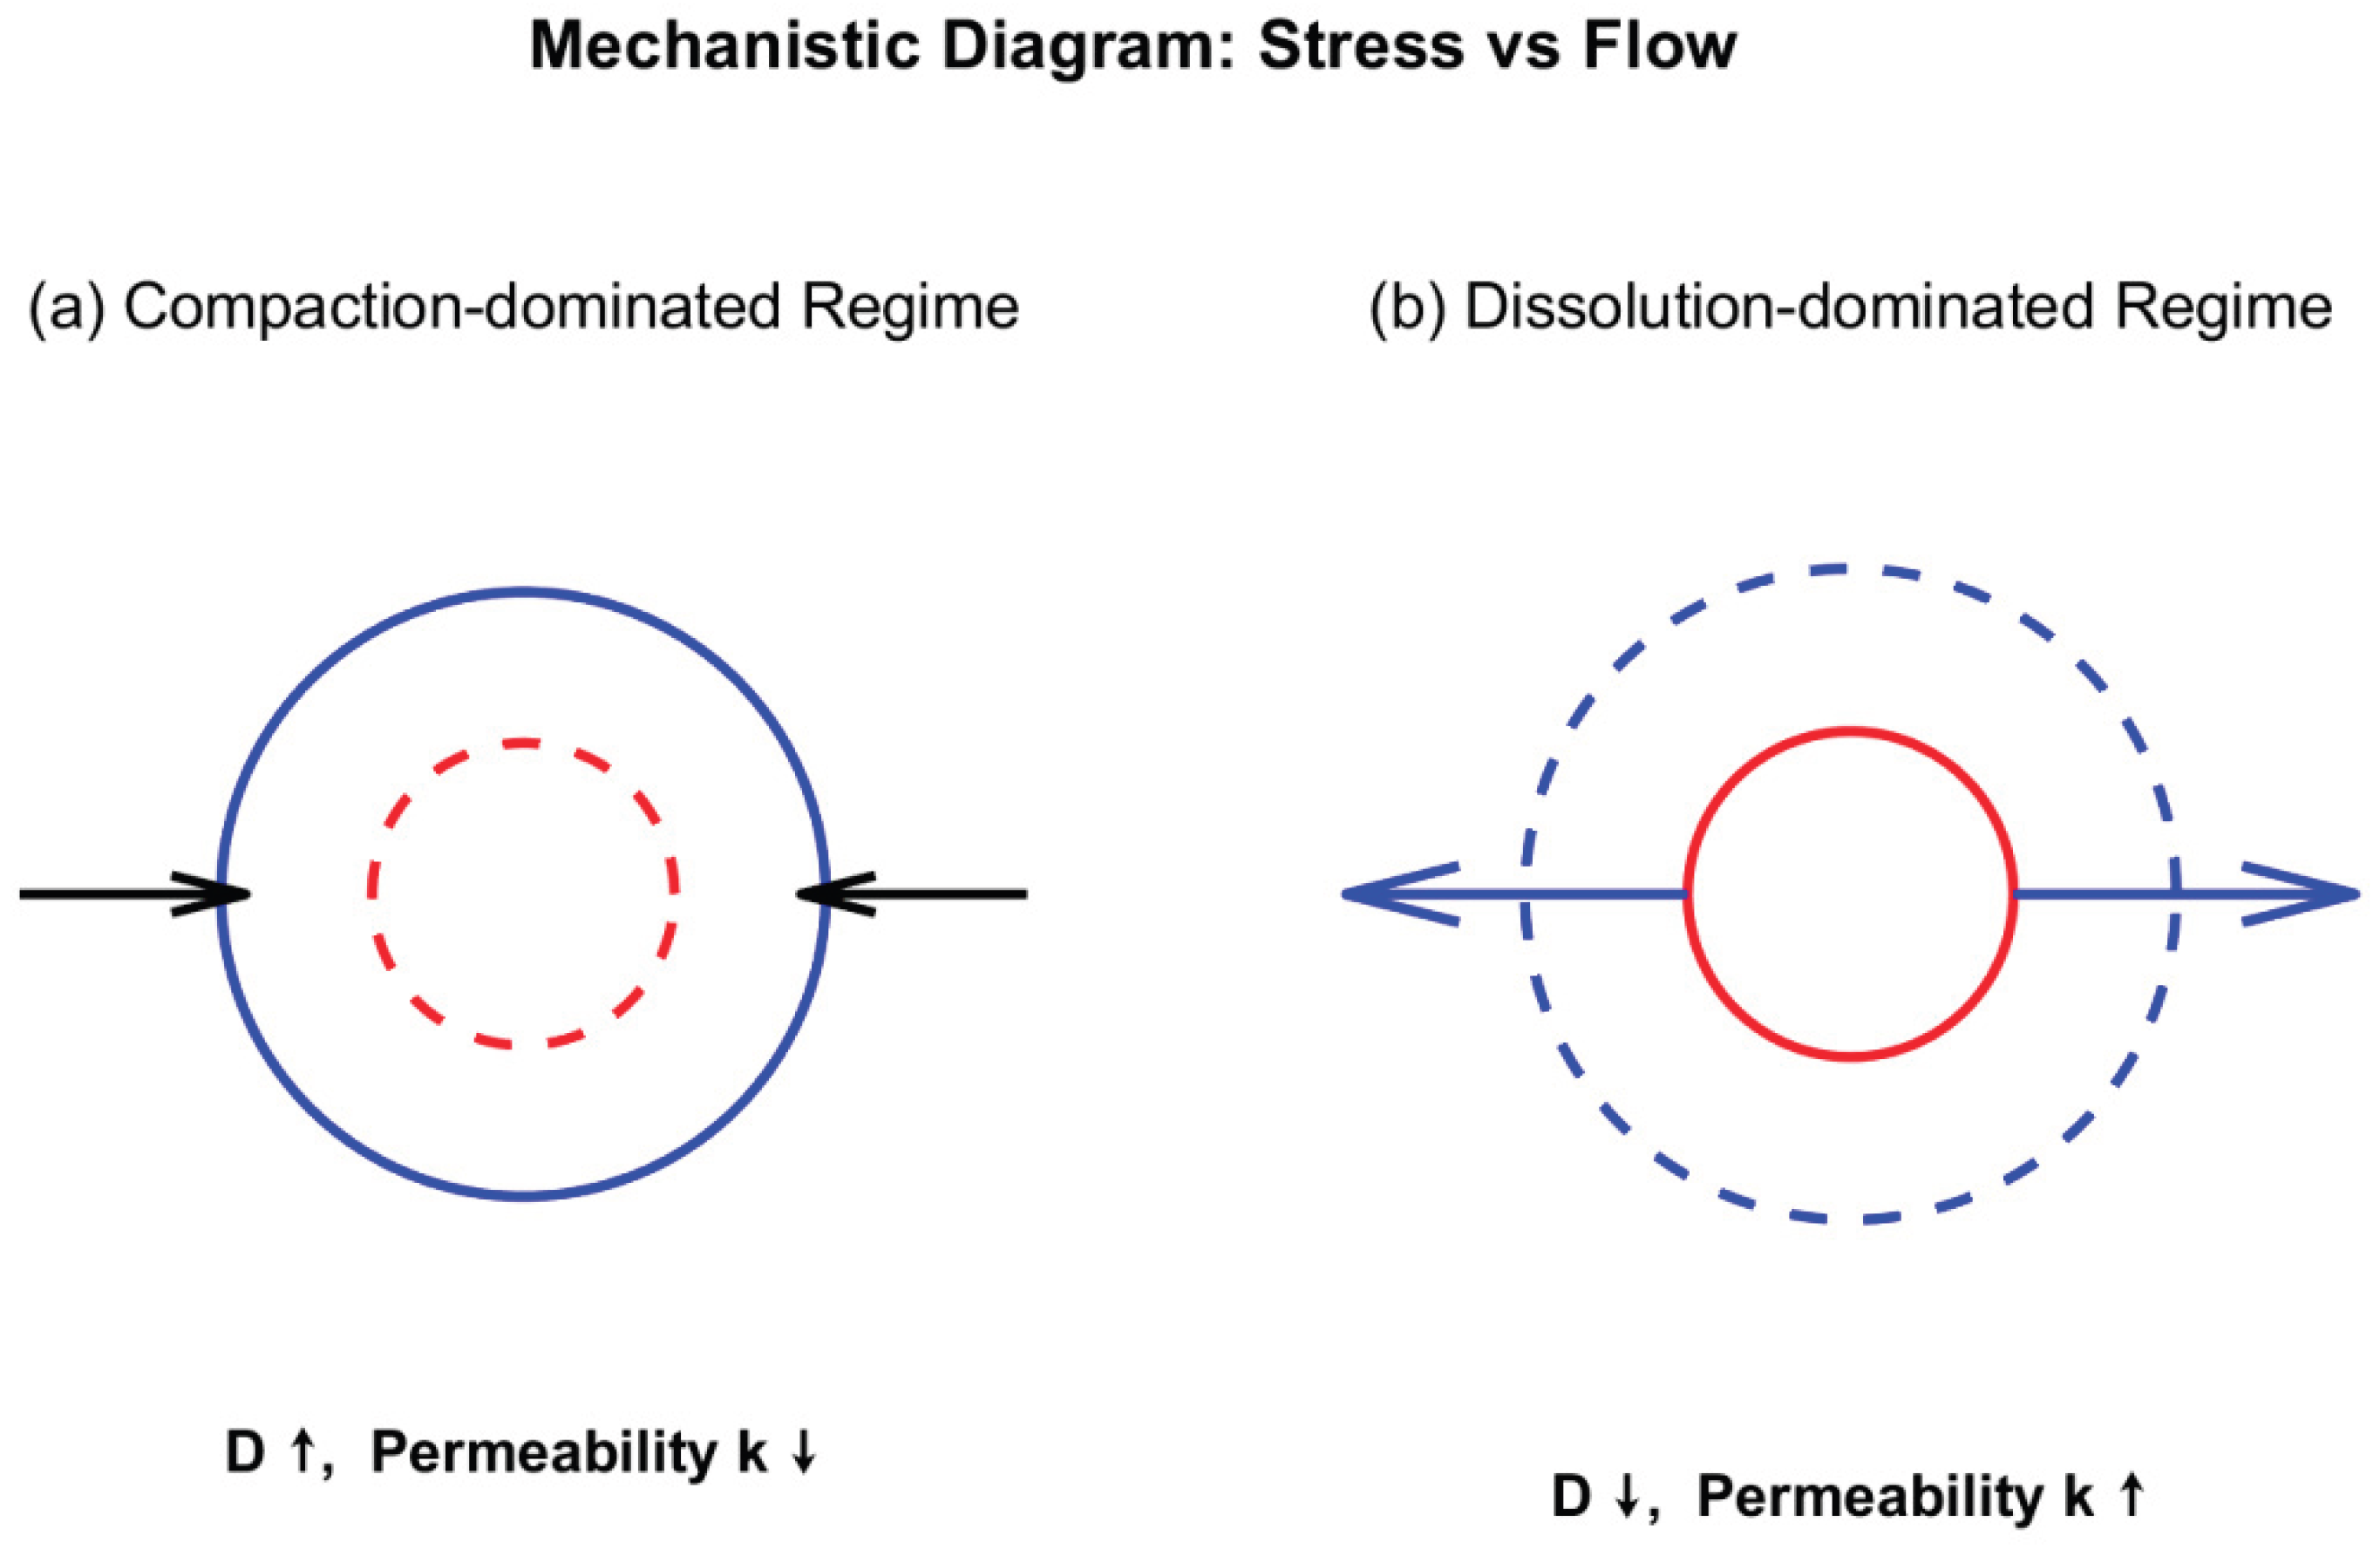
Table 1.
Representative ranges of fractal dimension and corresponding flow regimes.
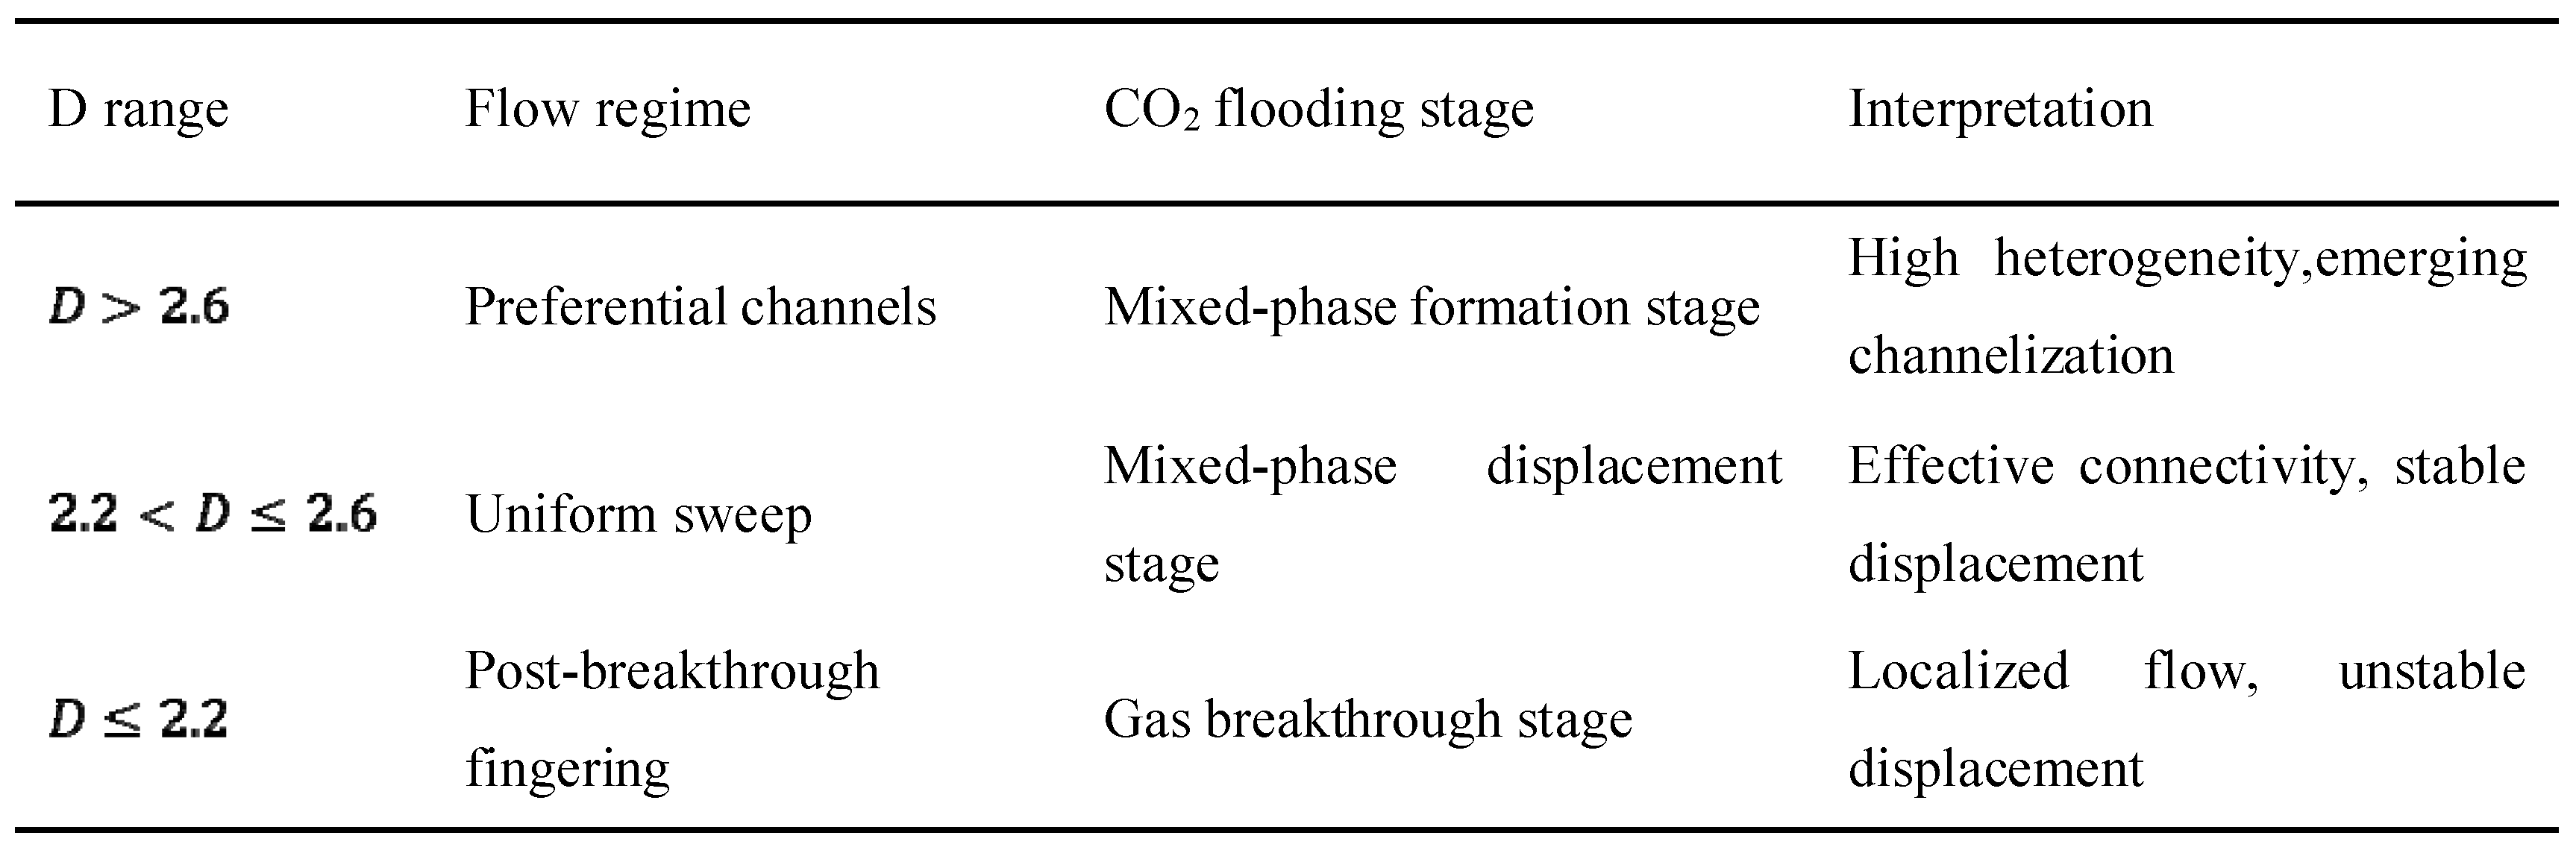 |
Disclaimer/Publisher’s Note: The statements, opinions and data contained in all publications are solely those of the individual author(s) and contributor(s) and not of MDPI and/or the editor(s). MDPI and/or the editor(s) disclaim responsibility for any injury to people or property resulting from any ideas, methods, instructions or products referred to in the content. |
© 2025 by the authors. Licensee MDPI, Basel, Switzerland. This article is an open access article distributed under the terms and conditions of the Creative Commons Attribution (CC BY) license (http://creativecommons.org/licenses/by/4.0/).
Copyright: This open access article is published under a Creative Commons CC BY 4.0 license, which permit the free download, distribution, and reuse, provided that the author and preprint are cited in any reuse.


