
Submitted:
29 September 2025
Posted:
30 September 2025
You are already at the latest version
Abstract
Plant sap analysis has emerged as a practical, real-time tool for nutrient monitoring, complementing conventional tissue tests. As adoption expands, standardization has become a priority; yet current research emphasizes tissue selection and analytical procedures, whereas short-term variation in sap composition has been largely overlooked. Consequently, a single-day diagnostic paradigm has prevailed, resting on the unverified premise that inter-day shifts lack practical relevance. To test this, we conducted a five-day field trial in broccoli, quantifying sap pH, EC, K+, NO3-, and °Bx daily under five extraction methods. Extraction method had a negligible effect on inter-day shifts (%Δ), whereas chemical parameters differed markedly, ranking pH (0.8%) < °Bx (3.7%) < K+ (5.9%) < EC (6.2%) < NO3- (8.2%). The largest observed changes across successive days were 0.13 pH units, 0.49 °Bx, 6.94 mmol/L K+ (271 mg/L), 1.17 dS/m EC, and 11.98 mmol/L NO3- (743 mg/L). These results show that inter-day instability can bias single-day diagnostics, motivating adoption of new sampling strategies. We urge researchers and advisors to account for inter-day variation and incorporate multi-day sampling into experimental design and decision-making until predictive frameworks are available. Recognizing and addressing this dimension will improve sap diagnostic reliability and support more sustainable, science-based nutrient management.
Keywords:
crop nutritional assessment
; fertilizer management
; ion-selective electrodes
; nutrient monitoring
; on-farm quick tests
; plant nutrition
; plant sap
1. Introduction
Plant sap analysis has emerged as a promising technique for monitoring the nutritional status of crops in a practical and timely manner [1,2,3,4,5]. In contrast to conventional dry matter tissue analysis, which reflects total nutrient accumulation over extended periods, sap analysis measures the soluble and metabolically accessible fraction of key parameters [6,7,8,9,10]. By reflecting the plant’s real-time nutritional status, this method supports more accurate and responsive fertilization strategies, particularly in short-cycle crops and intensive production systems [11,12,13,14,15,16]. However, as adoption of the technique expands across scientific and commercial contexts, concerns over protocol standardization intensify, reflecting unresolved issues in ensuring reproducible and comparable sap measurements [17,18,19,20,21].
Efforts to enhance methodological consistency have focused on several critical aspects, including the selection of plant tissue for sap extraction [22,23,24,25,26], the time of day at which samples are collected [27,28,29,30,31], the sample size needed to ensure representativeness [32,33,34,35], and the analytical tools used for nutrient quantification [36,37,38,39,40]. Yet one dimension has received comparatively little attention: the role of temporal variation—specifically, how sap composition may fluctuate across consecutive days.
In practice, scientific studies and field monitoring programs often rely on single-day sampling at specific phenological stages, without accounting for potential shifts in baseline sap composition across nearby days [41,42,43,44,45]. However, routine practices—including irrigation events and the application of plant growth regulators—as well as environmental fluctuations (e.g., light intensity, temperature, vapor pressure deficit), can alter photosynthetic activity, plant water potential, and transpiration rates [46,47,48,49,50]. Such physiological processes shape the plant’s metabolic profile and, consequently, are expected to influence the composition of the sap expressed from its tissues [51,52,53].
This calls into question the temporal stability of sap composition under field conditions. Most existing research has focused on contrasting sampling scales, either capturing intra-day fluctuations [54,55,56,57,58] or relying on weekly intervals [59,60,61,62,63], thereby overlooking the intermediate dynamics that unfold on a day-to-day basis. Based on our extensive literature review, Matthäus & Gysi [64] stands as the only published work that has explored sap composition over multiple successive days (>3), focusing exclusively on NO3- in broccoli. This underscores the need for empirical data to clarify the extent and implications of short-term variability. To address this gap, the present study provides a novel exploratory assessment in the same species, incorporating four additional sap chemical parameters and evaluating their daily variation over five consecutive days in an open-field production system.
2. Materials and Methods
2.1. Study Site
The study was conducted during the 2024-2025 summer season in a broccoli crop (Brassica oleracea var. italica, cv. Zafiro) cultivated in Quillota, Valparaíso Region, Chile, at coordinates 32°54’32.63”S and 71°15’24.93”W. Plants were evaluated at the preharvest phase, corresponding to stage 49 on the BBCH scale, as described by Meier [65].
The crop was established at a planting density of 0.40 × 0.65 m, with inter-row paths inserted after every eight planting lines. This spatial arrangement resulted in a plant population of ~35,000 individuals per hectare. At the time of sampling, plants exhibited an average of 23 [20,21,22,23,24,25] leaves, a height of 23 [21,22,23,24,25,26,27] cm, and a basal inflorescence diameter—measured below the first bract—of 54 [48,49,50,51,52,53,54,55,56,57,58,59,60,61,62,63] mm.
The soil at the site was classified as clay loam, with a pH of 7.68 determined in a soil-to-water suspension at a 1:2.5 ratio, electrical conductivity (EC) of 1.02 dS/m measured in a saturated paste extract, and organic matter content of 4.0%. Available nitrogen (sum of N-NO3- and N-NH4+) and potassium levels in the soil were 22.3 mg/kg and 250 mg/kg (0.64 cmol/kg), respectively. Irrigation was provided through a drip system using water with a pH of 7.15, EC of 0.73 dS/m, nitrate (NO3-) concentration of 177 mg/L (2.85 mmol/L), and potassium levels below the analytical detection limit (<1 mg/L; <0.03 mmol/L).
2.2. Experimental Design
In a 0.1-hectare section of the field, 525 broccoli plants were randomly selected over five consecutive days (13-17 January 2025). To minimize potential bias in sap nutrient composition, only healthy, undamaged, and unshaded plants were included in the sampling [66,67].
The most recently mature leaves (MRML) were selected as the sampling organ, following the recommendations of several authors [68,69,70,71]. These leaves were consistently located at the third or fourth node below the inflorescence and were identified in the field by their insertion angle, ranging from 65° to 75° [72]. The adaxial surface exhibited vivid green hues (5 G 3/2, 2.5 G 3/4, and 2.5 G 4/2), while the abaxial side displayed lighter, moderately saturated tones such as 5 G 6/2 and 7.5 G 6/2. Lamina thickness ranged from 300 to 500 μm, with surface texture varying from smooth to slightly rough.
The central third of each MRML petiole was excised and cleared of any remaining leaflets. Each day, 7 biological replicates were formed by grouping 15 petiole segments, each taken from a different individual plant. To avoid confounding effects from diurnal variation, all samples were collected daily between 9:00 and 9:30 a.m.
Immediately after collection, samples were transported to the Agronomy campus of the Pontificia Universidad Católica de Valparaíso, situated about 10 km away from the field site (32°53’44.29”S, 71°12’31.22”W). To preserve tissue integrity and minimise post-harvest handling effects, we followed previous recommendations for short-term storage [54,56,68,73,74]. Insulated containers with ice packs maintained the samples at a mean 4.1 °C during the 18 min field-to-laboratory transfer. Upon arrival, they were transferred to zip-lock plastic bags and stored at 4.0 °C in complete darkness until analysis (<8h).
Petiole samples were removed from refrigeration just prior to sap extraction, then immediately cut into ~5 mm segments and thoroughly homogenized to produce a uniform composite sample. Sap was extracted using five distinct methods, each defined by a manually operated device and its specific mode of operation, applying an average hand grip force of 33 kg: (1) A citrus squeezer (Zulay Kitchen, “2-in-1 Lemon Squeezer”); (2) a potato press (Metaltex, “Mr Mash”); and (3) a garlic press (MI Store, “Kitchen Series n°9191”), each operated according to its typical culinary use; (4) a domestic juicer (Sindelen, “BM-490IN 450W”), where samples were processed twice at power level 1 (5 s each) and sap subsequently separated from tissue residues using the garlic press; and (5) a garlic grinder (Ilko, “New Line”), operated through 40 rotations of 45° under constant hand pressure. For each method, a portion of the composite sample was used, with mean fresh weights of 30 g (26 segments), 18 g (15 segments), 8.4 g (7 segments), 13 g (10 segments), and 18 g (16 segments), respectively.
2.3. Measurements
Five chemical parameters were assessed: pH, electrical conductivity (EC), nitrate (NO3-), potassium (K+), and soluble solids (°Bx). pH and EC measurements were obtained using Horiba® LAQUATwin compact meters (models pH-33 and EC-33), each fitted with flat sensors (S010 and S070, respectively). NO3- and K+ concentrations were determined using ion-selective electrodes (ISEs) from the same equipment line: NO3-11 with sensor S040 and K-11 with sensor S030. New electrodes were used to ensure optimal performance and minimize the risk of measurement drift caused by the progressive degradation of their PVC gel-filled membranes [40,75,76]. °Bx was measured using a digital refractometer (Refratec®, model DR32).
Instruments were rinsed with distilled water and dried with tissue paper between samples. Calibration was performed every five measurements using reference standards [77]. To reduce thermal interference in ISE responses, both sap samples and calibration solutions were equilibrated to 18.5 °C in a temperature-controlled room [78,79,80].
2.4. Statistical Analyses
All analyses were conducted in R (v4.4.2). For each chemical parameter and extraction method, raw observations were aggregated to day-level means. Relative inter-day shifts were then derived as the classical relative change (%Δ), using successive day pairs 1-2, 2-3, 3-4, and 4-5. We first tested the null hypothesis that extraction method had no effect on relative inter-day shifts using a linear mixed-effects model, with extraction method as a fixed effect and day pair as a random intercept; no significant method effects were detected. Consequently, data were pooled across methods, and inter-day variability within each parameter was assessed by one-way ANOVA with Tukey’s HSD (α = 0.05). A separate one-way ANOVA evaluated differences in inter-day shifts among parameters. Model assumptions were checked using the Shapiro-Wilk test and the Levene test.
3. Results
There was no evidence that the extraction method affected relative inter-day shifts (p = 0.071-0.718 across parameters), implicating plant and environmental drivers rather than the sap extraction procedure. The magnitude of these shifts was parameter-dependent (p < 0.05), with means ranked as follows: pH (0.8 ± 0.4% [0.2-1.2]) < °Bx (3.7 ± 1.9% [2.1-6.2]) < K+ (5.9 ± 2.1% [2.8-7.5]) < EC (6.2 ± 2.1% [3.1-8.7]) < NO3- (8.2 ± 5.9% [2.7-15.9]) (Figure 1). In practical terms, the observed changes across successive days reached 0.13 pH units, 0.49 °Bx, 6.94 mmol/L (i.e., 271 mg/L) for K+, EC 1.17 dS/m, and 11.98 mmol/L (i.e., 743 mg/L) for NO3- (Table 1).
Beyond differences in shift magnitude, parameters exhibited distinct inter-day variability. K+ shifts did not differ significantly across days (p = 0.058), whereas pH, EC, and °Bx varied (p < 0.05, η2 = 0.39-0.53), with Tukey contrasts resolving at most two groups (a and b, with occasional ab overlaps). For NO3-, heterogeneity was greater, with three groups (a-c; p < 0.001, η2 = 0.74) and inter-day shifts ranging from 2.7% (days 1-2) to 16% (days 3-4), suggesting a more complex, externally driven dynamic rather than a uniform oscillation.
4. Discussion
Several studies have shown that the nutritional profile of plant sap changes over time, from intra-day periods (<24h) to broader stages monitored at fixed intervals of 7, 10, or ≥14 days [81,82,83,84]. However, short-term dynamics unfolding within a single week remain scarcely addressed in the literature. Our findings provide novel evidence that sap composition fluctuates across successive days, underscoring the need to account for this temporal dimension in sap-analysis protocols.
Among the measured parameters, pH exhibited the smallest relative shifts and NO3- the largest. To date, only the two parameters have previous evidence enabling direct magnitude comparisons; however, most of this assessed a single interval between two days, yielding isolated cases rather than time-series behaviours. Exceptions are the 3-day and 4-day assessments conducted by Loehwing [85] and Matthäus & Gysi [64], respectively.
For pH, we observed modest shifts of 0.8% [0.2-1.2] across successive days, in agreement with the 0.8% [0.0-2.5] reported by Loehwing [85] in wheat, but markedly lower than the 6.9% [2.8-12] documented by Ingalls & Shive [86] in Bryophyllum and Tradescantia. In contrast, sap NO3- exhibited shifts nearly tenfold higher (mean of 8.2%), reaching up to 16% in one of the intervals evaluated in this study. This exceeded the 3.8% [3.5-4.1] reported in potato by Vitosh & Silva [30] yet remained below other previously documented values. Among these, Matthäus & Gysi [64] reported shifts of 16% [1.9-36] in broccoli, Justes et al. [87] 26% [14,15,16,17,18,19,20,21,22,23,24,25,26,27,28,29,30,31,32,33,34,35,36,37,38,39,40,41] in wheat, and Papastylianou [88] 27% [0.0-158] in barley. Overall, this evidence supports day-to-day variation as a persistent, cross-species phenomenon, with sap nutrient concentrations rarely remaining constant on successive days. Multiple factors likely modulate these shifts and explain the wide ranges reported across studies.
For instance, daily fluctuations in soil nutrient availability [89,90] can affect its uptake and translocation by plants, ultimately leading to measurable shifts in sap concentrations. Direct evidence of this was early provided by Hoagland & Broyer [91], who traced the uptake of K+ and Br- in barley roots, reporting that sap composition changed markedly within 8h of exposure to modified external concentrations, reaching its maximum after 24h. Similarly, Justes et al. [87] showed that, following fertilization with 15N-labeled nitrate, the tracer became detectable in wheat sap within 3h and attained its maximum isotopic excess at 48h. However, the extent of this uptake may be influenced by soil fertility, yet evidence remains scarce and inconsistent. Whereas one study reported nearly threefold greater inter-day shifts in sap NO3- under N fertilization relative to N deficiency [87], another found levels remained stable at high N but fluctuated in the absence of fertilization [88].
Environmental conditions can also play a crucial role in shaping the nutrient profile of plant sap. Hoagland & Broyer [91] and Zhang et al. [92] reported increases in sap NO3- and K+ with rising temperature, likely reflecting enhanced root activity and increased xylem transport driven by higher transpiration rates. Conversely, testing three temperature levels, Palenski & Kemp [29] detected significant differences in sap NO3- concentration, yet no clear relationship between both—a result also reported by Coltman [93] and Papastylianou [88] suggesting that temperature effects are contingent on additional factors.
In the case of sap pH, prior work documents light-driven diurnal oscillations, characterized by daytime alkalinization followed by overnight reversion to baseline. However, the recovery rate appears temperature-dependent—an inference from graphical evidence rather than explicit authorial interpretation—with low temperatures precluding full restoration and thereby increasing inter-day shifts [85,94].
Soil moisture may also be a key driver of short-term variability in sap composition, as suggested by convergent evidence from three studies. First, Smith [95] found that irrigation pulses temporarily elevated sap phosphorus and other nutrients (not specified). Then, MacKerron et al. [96] noted rainfall-coincident peaks in sap NO3-, hypothesizing greater rhizosphere ion availability; and more recently, Janeiro-Cid et al. [97] documented a linear positive relationship between soil moisture and sap NO3- in strawberry (R2 = 0.78).
Therefore, multiple sources of variability likely act concurrently, shaping the temporal stability of individual sap chemical parameters. Disentangling these influences will require multivariate designs that jointly evaluate candidate drivers to yield adjusted estimates, or else define standardized sampling conditions that reduce variability to a practical scale. A contemporary study by Llanderal et al. [98] begins to address this gap at the weekly scale in greenhouse tomato, offering a clear methodological precedent for future work targeting inter-day dynamics. By jointly evaluating soil-solution chemistry, climatic drivers, and canopy attributes, they found that ETc, VPD, and LAI were the most informative predictors of weekly changes in sap profile, with nutrient-specific response patterns.
However, pending predictive frameworks, standardizing sampling protocols remains the pragmatic priority for both scientific research and real-world fertilization decisions. In line with previous evidence and published guidelines, sampling should be avoided immediately after cloudy weather, irrigation or rainfall, or under atypical temperature conditions, which can perturb sap dynamics [99,100,101]. Furthermore, given inter-day variability, samples should be collected on successive days and averaged rather than relying on single-day measurements to better capture intra-week nutrient status and reduce the influence of anomalous readings, especially when monitoring NO3-.
5. Conclusions
Our results demonstrate that meaningful short-term dynamics in the sap nutritional profile occur and can bias single-day diagnostics. Pending a mechanistic understanding of their drivers and the development of predictive frameworks to adjust measurements, moving toward standardized protocols can enhance precision by minimizing measurement noise. Therefore, we encourage researchers to explicitly incorporate day-to-day variation into experimental design, and agricultural advisors to account for it when planning field measurements and making fertilization decisions. Addressing these gaps will improve diagnostic reliability and advance a more sustainable, science-based agriculture.
Author Contributions
Conceptualization, J.S-C., H.A., and P.P.; methodology, J.S-C., D.C. and S.V.; investigation, J.S-C., D.C., S.V., J.C., C.G. and A.A.; formal analysis, J.S-C. and D.C.; validation, J.S-C., D.C. and I.H.; visualization, D.C. and I.H.; writing—original draft preparation, J.S-C. and P.P.; writing—review and editing, J.S-C., D.C., and H.A.; supervision, J.S-C. and P.P.; funding acquisition, J.S-C., D.C. and S.V. All authors have read and approved the manuscript.
Funding
Support was provided by Universidad Viña del Mar (Fondo Interno de Investigación: Línea Investigación en Ciencia, Tecnología y Conocimiento; FII-CTC-2306), Pontificia Universidad Católica de Valparaíso (InES I+D; TPI 02-INID230010), Agencia Nacional de Investigación y Desarrollo (MSc scholarships; 22231615 and 22241938), and Nodo CIV-VAL (Tesis para Impactar el Territorio; ND-26).
Data Availability Statement
All supporting data are presented in the main text. Additional details can be requested from the corresponding author upon reasonable request.
Acknowledgments
We thank the laboratory interns (Antonella Carrillo, Áurea Chinchay, Rafaela Jara, and Vicente Piwonka) for their valuable support throughout this study. We are also grateful to José Luis Céspedes for granting access to his farm, which made this research possible.
Conflicts of Interest
The authors declare no conflicts of interest.
Abbreviations
The following abbreviations are used in this manuscript:
| °Bx | Degree Brix (soluble solids) |
| BBCH | Phenological growth stage scale |
| EC | Electrical conductivity |
| ETc | Crop evapotranspiration |
| ISE | Ion-selective electrode |
| K+ | Potassium |
| LAI | Leaf area index |
| MRML | Most recently mature leaves |
| NO3- | Nitrate |
| VPD | Vapor pressure deficit |
References
- Muñoz-Huerta, R.F.; Guevara-Gonzalez, R.G.; Contreras-Medina, L.M.; Torres-Pacheco, I.; Prado-Olivarez, J.; Ocampo-Velazquez, R. V. A Review of Methods for Sensing the Nitrogen Status in Plants: Advantages, Disadvantages and Recent Advances. Sensors 2013, 13, 10823–10843. [Google Scholar] [CrossRef]
- Tong, R.C.; Whitehead, C.S.; Fawole, O.A. Effects of Conventional and Bokashi Hydroponics on Vegetative Growth, Yield and Quality Attributes of Bell Peppers. Plants 2021, 10, 1281. [Google Scholar] [CrossRef]
- Rojas-Velázquez, Á.N.; Guillén-Castillo, O.I.; Alcalá-Jauregui, J.A.; Loredo-Osti, C.; Ramírez-Tobías, H.M.; Romero-Méndez, M.J.; Méndez-Cortés, H.; Hernández-Montoya, A. Effect of a Nitrogenous Nanocomposite on Leaching and N Content in Lettuce in Soil Columns. Discover Nano 2023, 18, 98. [Google Scholar] [CrossRef]
- Mahal, N.K.; Miguez, F.E.; Sawyer, J.E.; Dong, L.; Schnable, P.S.; Castellano, M.J. Stalk Sap Nitrate Test as a Potential Tool for Nitrogen Fertilizer Recommendations for Maize. Field Crops Res 2024, 310, 109330. [Google Scholar] [CrossRef]
- Kremper, R.; Juhász, E.K.; Novák, T.; Kincses, I.; Sándor, Z.; Tállai, M.; Béni, Á.; Szabó, A.; Szarvas, S.; Balla Kovács, A. Assessment of Spring Oat Nitrogen Supply Based on Plant Sap Nitrate Concentration and SPAD Values. Nitrogen 2025, 6, 19. [Google Scholar] [CrossRef]
- Olsen, J.K.; Lyons, D.J. Petiole Sap Nitrate Is Better than Total Nitrogen in Dried Leaf for Indicating Nitrogen Status and Yield Responsiveness of Capsicum in Subtropical Australia. Aust J Exp Agric 1994, 34, 835–843. [Google Scholar] [CrossRef]
- Pino, P.; Callejas, R.; Razeto, B.; Reginato, G. Petiole Extract Chemical Analysis to Evaluate Nutritional Status in Grapevine. Pesq Agropec Bras 2012, 47, 111–117. [Google Scholar] [CrossRef]
- Zhou, G.; Yin, X. Assessing Nitrogen Nutritional Status, Biomass and Yield of Cotton with NDVI, SPAD and Petiole Sap Nitrate Concentration. Exp Agric 2018, 54, 531–548. [Google Scholar] [CrossRef]
- Peña-Fleitas, M.T.; Gallardo, M.; Thompson, R.B.; Farneselli, M.; Padilla, F.M. Assessing Crop N Status of Fertigated Vegetable Crops Using Plant and Soil Monitoring Techniques. Ann Appl Biol 2015, 167, 387–405. [Google Scholar] [CrossRef]
- Roacho-Cortés, E.; Castellanos-Ramos, J.Z.; Etchevers, J.D. Field Diagnostic Techniques to Determine Nitrogen in Maize. Terra Latinoam 2021, 39, e820. [Google Scholar] [CrossRef]
- Viana, M.C.M.; da Silva, I.P.; Freire, F.M.; Ferreira, M.M.; da Costa, É.L.; Mascarenhas, M.H.T.; Teixeira, M.F.F. Production and Nutrition of Irrigated Tanzania Guinea Grass in Response to Nitrogen Fertilization. Rev Bras Zootec 2014, 43, 238–243. [Google Scholar] [CrossRef]
- Padilla, F.M.; Farneselli, M.; Gianquinto, G.; Tei, F.; Thompson, R.B. Monitoring Nitrogen Status of Vegetable Crops and Soils for Optimal Nitrogen Management. Agric Water Manag 2020, 241, 106356. [Google Scholar] [CrossRef]
- Dong, Z.; Liu, Y.; Li, M.; Ci, B.; Lu, X.; Feng, X.; Wen, S.; Ma, F. Effect of Different NPK Fertilization Timing Sequences Management on Soil-Petiole System Nutrient Uptake and Fertilizer Utilization Efficiency of Drip Irrigation Cotton. Sci Rep 2023, 13, 14287. [Google Scholar] [CrossRef] [PubMed]
- Kim, M.Y.; Lee, K.H. Electrochemical Sensors for Sustainable Precision Agriculture—A Review. Front Chem 2022, 10, 848320. [Google Scholar] [CrossRef]
- da Silva, A.O.; Silva, D.J.; Bassoi, L.H.; de Melo Chaves, A.R. NO3–, K+, and Chlorophyll Index in Fertigated Grapevines in the Semi-Arid Region of Brazil. Sci Agric 2023, 80, e20210122. [Google Scholar] [CrossRef]
- Gallardo, M.; Peña-Fleitas, M.T.; Padilla, F.M.; Cedeño, J.; Thompson, R.B. Prescriptive-Corrective Irrigation and Macronutrient Management in Greenhouse Soil-Grown Tomato Using the VegSyst-DSS v2 Decision Support Tool. Horticulturae 2023, 9, 1128. [Google Scholar] [CrossRef]
- Parks, S.E.; Irving, D.E.; Milham, P.J. A Critical Evaluation of On-Farm Rapid Tests for Measuring Nitrate in Leafy Vegetables. Sci Hortic 2012, 134, 1–6. [Google Scholar] [CrossRef]
- Incrocci, L.; Massa, D.; Pardossi, A. New Trends in the Fertigation Management of Irrigated Vegetable Crops. Horticulturae 2017, 3, 37. [Google Scholar] [CrossRef]
- Riechelman, B.; Postma, R.; Specken, J.; de Haan, J. Critical Nutrient Concentrations of Arable Crops. Literature Study on the Usability of Critical Concentrations to Diagnose Nutrient Deficiency and/or Steer Fertiliser Application (Rapport 1792.N.20); Nutriënten Management Instituut BV: Wageningen, The Netherlands, 2021; p. 42. [Google Scholar]
- Esteves, E.; Locatelli, G.; Bou, N.A.; Ferrarezi, R.S. Sap Analysis: A Powerful Tool for Monitoring Plant Nutrition. Horticulturae 2021, 7, 426. [Google Scholar] [CrossRef]
- Silva-Pumarada, G.; Di Gioia, F. Assessing the Reliability of Portable Ion-Selective Electrodes Proposed for the On-Farm Management of Nutrient Solutions and Fertigation of Horticultural Crops. Acta Hortic 2023, 1377, 801–807. [Google Scholar] [CrossRef]
- Sonneveld, C.; De Bes, S.S. Relationship between Analytical Data of Plant Sap and Dried Material of Glasshouse Crops. Commun Soil Sci Plant Anal 1983, 14, 75–87. [Google Scholar] [CrossRef]
- Burns, I.G.; Hutsby, W. Choice of Leaf for Estimation of K Status by Analysis of Petiole Sap. J Sci Food Agric 1986, 37, 115–128. [Google Scholar] [CrossRef]
- Alt, D.; Füll, A.M. Control of the Nitrogen Status of Lettuce by Nitrate Analysis of Plant Sap. Acta Hortic 1988, 222, 23–27. [Google Scholar] [CrossRef]
- Wira, A.B.; Jamil, A.Z.; Armizatul, S.A.H. Effect of Varying Nitrogen Levels on Plant Sap Characteristics and Growth Performance of Tomato (Lycopercisum esculentum var. baccarat). J Trop Agric and Fd Sci 2013, 41, 183–191. [Google Scholar]
- Yosoff, S.F.; Mohamed, M.T.M.; Parvez, A.; Ahmad, S.H.; Ghazali, F.M.; Hassan, H. Production System and Harvesting Stage Influence on Nitrate Content and Quality of Butterhead Lettuce. Bragantia 2015, 74, 322–330. [Google Scholar] [CrossRef]
- Cadahía López, C. El Análisis de Savia Como Índice de Fertilización Para las Plantas de Tomate. PhD Thesis, Universidad Central, Madrid, Spain, 1964; p. 228. [Google Scholar]
- Azuara, P.; García López de Sa, M.E.; Hernando, V. The Effect of Light Intensity on the Concentration of Bioelements in the Sap of the Tomato Plant (Lycopersicon esculentum L.). J Plant Nutr 1982, 5, 111–121. [Google Scholar] [CrossRef]
- Palenski, F.J.; Kemp, P.D. Validity of the Nitrate Test Strip Technique for Use on Cereals. Agr Soc Proc NZ 1989, 19, 35–42. [Google Scholar]
- Vitosh, M.L.; Silva, G.H. Factors Affecting Potato Petiole Sap Nitrate Tests. Commun Soil Sci Plant Anal 1996, 27, 1137–1152. [Google Scholar] [CrossRef]
- He, Y.; Terabayashi, S.; Namiki, T. The Effects of Leaf Position and Time of Sampling on Nutrient Concentration in the Petiole Sap from Tomato Plants Cultured Hydroponically. J Japan Soc Hort Sci 1998, 67, 331–336. [Google Scholar] [CrossRef]
- Raynal, C.; Cousin, I. Petiolar Sap Nitrate as a Guide in the Fertilization of Strawberry. Acta Hortic 1997, 439, 753–762. [Google Scholar] [CrossRef]
- Nagarajah, S. A Petiole Sap Test for Nitrate and Potassium in Sultana Grapevines. Aust J Grape Wine Res 1999, 5, 56–60. [Google Scholar] [CrossRef]
- Studstill, D.W.; Simonne, E.H.; Hutchinson, C.M.; Hochmuth, R.C.; Dukes, M.D.; Davis, W.E. Petiole Sap Testing Sampling Procedures for Monitoring Pumpkin Nutritional Status. Commun Soil Sci Plant Anal 2003, 34, 2355–2362. [Google Scholar] [CrossRef]
- Llanderal, A.; García-Caparrós, P.; Segura, M.L.; Contreras, J.I.; Lao, M.T. Nutritional Changes in Petiole Sap over Space and Time in a Tomato Crop Greenhouse. J Plant Nutr 2019, 42, 1205–1217. [Google Scholar] [CrossRef]
- Scaife, A.; Stevens, K.L. Monitoring Sap Nitrate in Vegetable Crops: Comparison of Test Strips with Electrode Methods, and Effects of Time of Day and Leaf Position. Commun Soil Sci Plant Anal 1983, 14, 761–771. [Google Scholar] [CrossRef]
- Rosen, C.J.; Errebhi, M.; Wang, W. Testing Petiole Sap for Nitrate and Potassium: A Comparison of Several Analytical Procedures. HortScience 1996, 31, 1173–1176. [Google Scholar] [CrossRef]
- Arunachalam, V.; Fernandes, C.M.; Salgaonkar, D.C. Quick Method to Quantify the Potassium and Sodium Content Variation in Leaves of Banana Varieties. Anal Sci 2020, 36, 1255–1259. [Google Scholar] [CrossRef]
- Mota, M.; Martins, M.J.; Sprey, L.; Maurício, A.; Rosa, C.; Faria, J.; Martins, M.B.; de Sousa, M.L.; Santos, R.; de Sousa, R.M.; et al. Analysis of Petiole Sap Nutrients Using Rapid and Standard Methods and Its Relation to Leaf Analysis of Fertilized Malus domestica cv. Gala. Horticulturae 2024, 10, 36. [Google Scholar] [CrossRef]
- Peña-Fleitas, M.T.; Gallardo, M.; Padilla, F.M.; Rodríguez, A.; Thompson, R.B. Use of a Portable Rapid Analysis System to Measure Nitrate Concentration of Nutrient and Soil Solution, and Plant Sap in Greenhouse Vegetable Production. Agronomy 2021, 11, 819. [Google Scholar] [CrossRef]
- Ulissi, V.; Antonucci, F.; Benincasa, P.; Farneselli, M.; Tosti, G.; Guiducci, M.; Tei, F.; Costa, C.; Pallottino, F.; Pari, L.; et al. Nitrogen Concentration Estimation in Tomato Leaves by VIS-NIR Non-Destructive Spectroscopy. Sensors 2011, 11, 6411–6424. [Google Scholar] [CrossRef] [PubMed]
- Simonne, E.; Hochmuth, R. An Overview of Fertilization and Irrigation Management in the Conventional and Certified Organic Production of Vegetable Crops in Florida. Horticulturae 2016, 2, 7. [Google Scholar] [CrossRef]
- Silva Filho, J.B.; Fontes, P.C.R.; Ferreira, J.F.S.; Cecon, P.R.; Crutchfield, E. Optimal Nutrient Solution and Dose for the Yield of Nuclear Seed Potatoes under Aeroponics. Agronomy 2022, 12, 2820. [Google Scholar] [CrossRef]
- Hochmuth, G.; Hochmuth, R. Plant Petiole Sap-Testing for Vegetable Crops (CIR1144); UF/IFAS Extension: Florida, United States, 2022; p. 6. [Google Scholar]
- García Monroy, A.; Barrios Díaz, J.M.; Barrios Díaz, B.; Medina, E.J.; Vázquez Cruz, F. Monitoreo del Estado Nutrimental del Cultivo de Jitomate en Invernadero (COMEII-23036); VIII Congreso Nacional y I Congreso Internacional de Riego, Drenaje y Biosistemas: Coahuila, Mexico, 2023; p. 9. [Google Scholar]
- Vialet-Chabrand, S.; Matthews, J.S.A.; Simkin, A.J.; Raines, C.A.; Lawson, T. Importance of Fluctuations in Light on Plant Photosynthetic Acclimation. Plant Physiol 2017, 173, 2163–2179. [Google Scholar] [CrossRef]
- Grossiord, C.; Buckley, T.N.; Cernusak, L.A.; Novick, K.A.; Poulter, B.; Siegwolf, R.T.W.; Sperry, J.S.; McDowell, N.G. Plant Responses to Rising Vapor Pressure Deficit. New Phytol 2020, 226, 1550–1566. [Google Scholar] [CrossRef]
- Sun, Y.; Wang, C.; Chen, H.Y.H.; Ruan, H. Response of Plants to Water Stress: A Meta-Analysis. Front Plant Sci 2020, 11, 978. [Google Scholar] [CrossRef]
- Jiao, X.; Yu, X.; Ding, J.; Du, Q.; Zhang, J.; Song, X.; Bai, P.; Li, J. Effects of Rising VPD on the Nutrient Uptake, Water Status and Photosynthetic System of Tomato Plants at Different Nitrogen Applications under Low Temperature. Sci Hortic 2022, 304, 111335. [Google Scholar] [CrossRef]
- Wang, X.Q.; Zeng, Z.L.; Shi, Z.M.; Wang, J.H.; Huang, W. Variation in Photosynthetic Efficiency under Fluctuating Light between Rose Cultivars and Its Potential for Improving Dynamic Photosynthesis. Plants 2023, 12, 1186. [Google Scholar] [CrossRef] [PubMed]
- Pantoja-Benavides, A.D.; Garces-Varon, G.; Restrepo-Díaz, H. Foliar Cytokinins or Brassinosteroids Applications Influence the Rice Plant Acclimatization to Combined Heat Stress. Front Plant Sci 2022, 13, 983276. [Google Scholar] [CrossRef] [PubMed]
- Ugarte Barco, F.A.; Zhiñin-Huachun, I.A.; Hernández Pérez, R. Biostimulant Influence on Morphological and Agrochemical Characters in Banana (Musa AAA cv. Williams). Terra Latinoam 2022, 40, e1456. [Google Scholar] [CrossRef]
- Díaz-Vázquez, F.A.; Sandoval-Rangel, A. Influence of Mulching and Poultry Manure on Wild Tomato (Solanum lycopersicum var. cerasiforme (Dunal)) Production. Ecosist Recur Agropec 2023, 10, e3605. [Google Scholar] [CrossRef]
- Casado Alcalá, M. Estudio de la Fertilización y Nutrición del Fresón Mediante el Análisis de Savia. PhD Thesis, Universidad Complutense, Madrid, Spain, 1974; p. 218. [Google Scholar]
- Bonoan, R.R. An Assessment of the Nitrogen Fertilizer Requirements of Winter Cabbages (Brassica oleracea var. capitata L.). PhD Thesis, Massey University, New Zealand, 1990; p. 257. [Google Scholar]
- Abarza, E.; Raynal, C. Tests et Analyses de Laboratoire: Le Nutrichek® à l’étude. Infos-Ctifl 2003, 196, 38–43. [Google Scholar]
- Delgado, J.A.; Follett, R.F. Sap Test to Determine Nitrate-Nitrogen Concentrations in Aboveground Biomass of Winter Cover Crops. Commun Soil Sci Plant Anal 1998, 29, 545–559. [Google Scholar] [CrossRef]
- Lee, M.J.; Rhee, H.C.; Choi, G.L.; Oh, S.S.; Lee, J.T.; Lee, J.G. Rapid Analysis of Nitrate Concentration in Different Growth Stages and Plant Parts of Paprika Leaf Using On-Site Rapid Detection Kit. Protect Hortic Plant Factory 2017, 26, 333–339. [Google Scholar] [CrossRef]
- Prasad, M.; Spiers, T.M. A Rapid Nitrate Sap Test for Outdoor Tomatoes. Sci Hortic 1985, 25, 211–215. [Google Scholar] [CrossRef]
- Coltman, R.R. Yields of Greenhouse Tomatoes to Maintain Specific Petiole Sap Nitrate Levels. HortScience 1988, 23, 148–151. [Google Scholar] [CrossRef]
- Hochmuth, G.J.; Hochmuth, R.C.; Donley, M.E.; Hanlon, E.A. Eggplant Yield in Response to Potassium Fertilization on Sandy Soil. HortScience 1993, 28, 1002–1005. [Google Scholar] [CrossRef]
- White, J.M.; Tyson, R.V.; Hanlon, E.A.; Hochmuth, G.J.; Neal, C.A. Plant Petiole Sap Testing for Nitrogen and Potassium in Sweet Corn Grown on Mineral Soil. Proc Fla State Hort Soc 1996, 109, 149–151. [Google Scholar]
- Rodríguez, A.; Peña-Fleitas, M.T.; Padilla, F.M.; Gallardo, M.; Thompson, R.B. Petiole Sap Nitrate Concentration to Assess Crop Nitrogen Status of Greenhouse Sweet Pepper. Sci Hortic 2021, 285, 110157. [Google Scholar] [CrossRef]
- Matthäus, D.; Gysi, C. Plant-Sap Analysis in Vegetables - a Tool to Decide on Nitrogen Top Dressing. Acta Hortic 2001, 563, 93–102. [Google Scholar] [CrossRef]
- Meier, U. Growth Stages of Mono- and Dicotyledonous Plants. BBCH Monograph; Julius Kühn-Institut: Quedlinburg, Germany, 2018; p. 204. [Google Scholar]
- da Silva, J.R.; de Alvarenga, F.V.; Boaretto, R.M.; Lopes, J.R.S.; Quaggio, J.A.; Coletta Filho, H.D.; Mattos, D. Following the Effects of Micronutrient Supply in HLB-Infected Trees: Plant Responses and ‘Candidatus Liberibacter asiaticus’ Acquisition by the Asian Citrus Psyllid. Trop Plant Pathol 2020, 45, 597–610. [Google Scholar] [CrossRef]
- Meesters, C.; Cialdella, L.; Ingels, R.; Jacquemyn, H.; Lievens, B. Cultivar-Dependent Effects of Plant-Beneficial Fungi on Plant Nutrient Composition and Feeding Damage by Nesidiocoris tenuis. Plant Soil 2023, 492, 177–190. [Google Scholar] [CrossRef]
- Hochmuth, G.J. Efficiency Ranges for Nitrate-Nitrogen and Potassium for Vegetable Petiole Sap Quick Tests. HortTechnology 1994, 4, 218–222. [Google Scholar] [CrossRef]
- Rosen, C.J.; Eliason, R. Nutrient Management for Commercial Fruit & Vegetable Crops in Minnesota; University of Minnesota Extension Service: Minnesota, United States, 2005; p. 38. [Google Scholar]
- Schulbach, K.; Smith, R.; Hartz, T.; Jackson, L. Guide to Nitrogen Quick-Test for Vegetables with the “Cardy” Nitrate Meter; California Department of Food and Agriculture: California, United States, 2007; p. 11. [Google Scholar]
- Havlin, J.L.; Tisdale, S.L.; Nelson, W.L.; Beaton, J.D. Soil Fertility and Fertilizers. An Introduction to Nutrient Management, 8th ed.; Pearson India: India, 2017; p. 520. [Google Scholar]
- Santa Cruz, J.; Calbucheo, D.; Valdebenito, S.; Cáceres, C.; Castillo, P.; Aguilar, M.; Allendes, H.; Vidal, K.; Peñaloza, P. Crushed, Squeezed, or Pressed? How Extraction Methods Influence Sap Analysis. Agronomy submitted. 2025. [Google Scholar] [CrossRef]
- Hartz, T.K.; Smith, R.F.; Schulbach, K.F.; LeStrange, M. On-Farm Nitrogen Tests Improve Fertilizer Efficiency, Protect Groundwater. Calif Agric 1994, 48, 29–32. [Google Scholar] [CrossRef]
- Panique, E.; Kelling, K.A.; Schulte, E.E. Establishment of Potassium Tissue and Sap Critical Values; University of Wisconsin-Madison: Wisconsin, United States, 1996; p. 16. [Google Scholar]
- Altland, J.E.; Gilliam, C.H.; Keever, G.J.; Edwards, J.H.; Sibley, J.L.; Fare, D.C. Rapid Determination of Nitrogen Status in Pansy. HortScience 2003, 38, 537–541. [Google Scholar] [CrossRef]
- Selk, G.E.; LeValley, R.C.; Highfill, G.A.; Buchanan, D.S. Comparing the Accuracy of the Cardy Portable Nitrate Meter with Laboratory Analysis of Nitrate Concentrations in Summer Annual Forages; Oklahoma Agricultural Experiment Station: Oklahoma, United States, 2004; p. 4. [Google Scholar]
- Giannothanasis, E.; Cedeño, J.; Ntatsi, G.; Thompson, R.B.; Savvas, D. Developing and Validating a Modelling Approach Linked with Ion Selective Electrodes to Control Pollution of Water Resources from Greenhouse Crops. J Environ Manage 2025, 387, 125792. [Google Scholar] [CrossRef]
- Thompson, R.B.; Fernández Fernández, M.M.; Cánovas Fernández, G.; Gallardo, M. Aplicaciones Prácticas de Sistemas de Análisis Rápido de Nutrientes Para Mejorar el Manejo del Nitrógeno en Cultivos de Invernadero. In Mejora en la Eficiencia del Uso de Agua y Fertilizantes en Agricultura, Gázquez, J.C., Ed.; ed; Cajamar Caja Rural,; 2018; pp. 181–202. [Google Scholar]
- Blidi, S.; Granholm, K.; Sokalski, T.; Mousavi, Z.; Lewenstam, A.; Leito, I.; Bobacka, J. Long-Time Evaluation of Solid-State Composite Reference Electrodes. Membranes 2022, 12, 569. [Google Scholar] [CrossRef]
- Peña-Fleitas, M.T.; Grasso, R.; Gallardo, M.; Padilla, F.M.; de Souza, R.; Rodríguez, A.; Thompson, R.B. Sample Temperature Affects Measurement of Nitrate with a Rapid Analysis Ion Selective Electrode System Used for N Management of Vegetable Crops. Agronomy 2022, 12, 3031. [Google Scholar] [CrossRef]
- Kurtz, C.; Pauletti, V.; Gervini de Menezes Júnior, F.O.; Mora, C. Nitrogen for Diagnosis by Chlorophyll Index and Nitrate in Sap for Onion in Direct Seeding System. Rev Thema 2022, 21, 92–114. [Google Scholar] [CrossRef]
- Li, Q.; Denison, J.; Gluck, M.; Liu, G. Comparison of SPAD-Based Leaf Greenness and Paralleled Petiole Sap Nitrate Concentrations for Monitoring Potato Vine Nitrogen Status. Veg Res 2023, 3, 30. [Google Scholar] [CrossRef]
- Maltais-Landry, G.; Buchanan, C.; Longanecker, J. Using Processed Fertilizers or Composted Poultry Manure Results in Similar Yields but Contrasting Nutrient Budgets in Organic Cabbage Production. J Plant Nutr 2023, 46, 2462–2472. [Google Scholar] [CrossRef]
- Nascente, A.S.; Cobucci, T.; Brasil, V.; Reis, R. dos A. Cotton, Bean, and Soybean Yield and Nutrient Redistribution in Leaf Sap in Response to Organic Molecules Complexed Fertilizers. Aust J Crop Sci 2023, 17, 74–82. [Google Scholar] [CrossRef]
- Loehwing, W.F. Effects of Insolation and Soil Characteristics on Tissue Fluid Reaction in Wheat. Plant Physiol 1930, 5, 293–305. [Google Scholar] [CrossRef] [PubMed]
- Ingalls, R.A.; Shive, J.W. Relation of H-Ion Concentration of Tissue Fluids to the Distribution of Iron in Plants. Plant Physiol 1931, 6, 103–125. [Google Scholar] [CrossRef]
- Justes, E.; Meynard, J.M.; Mary, B.; Plénet, D. Diagnosis Using Stem Base Extract: JUBIL Method. In: Diagnosis of the Nitrogen Status in Crops; Lemaire, G., Ed.; Springer-Verlag, 1997; pp. 163–187.
- Papastylianou, I. Diurnal Variation of Nitrate Concentration in Cereals Grown under Rainfed Mediterranean Conditions. Commun Soil Sci Plant Anal 1995, 26, 1121–1131. [Google Scholar] [CrossRef]
- Capstaff, N.M.; Domoney, C.; Miller, A.J. Real-Time Monitoring of Rhizosphere Nitrate Fluctuations under Crops Following Defoliation. Plant Methods 2021, 17, 11. [Google Scholar] [CrossRef]
- Zhu, Y.; Chen, Y.; Ali, M.A.; Dong, L.; Wang, X.; Archontoulis, S. V.; Schnable, J.C.; Castellano, M.J. Continuous in Situ Soil Nitrate Sensors: The Importance of High-Resolution Measurements across Time and a Comparison with Salt Extraction-Based Methods. Soil Sci Soc Am J 2021, 85, 677–690. [Google Scholar] [CrossRef]
- Hoagland, D.R.; Broyer, T.C. General Nature of the Process of Salt Accumulation by Roots with Description of Experimental Methods. Plant Physiol 1936, 11, 471. [Google Scholar] [CrossRef]
- Zhang, H.; Smeal, D.; Arnold, R.N.; Gregory, E.J. Potato Nitrogen Management by Monitoring Petiole Nitrate Level. J Plant Nutr 1996, 19, 1405–1412. [Google Scholar] [CrossRef]
- Coltman, R.R. Sampling Considerations for Nitrate Quick Tests of Greenhouse-Grown Tomatoes. J Amer Soc Hort Sci 1987, 112, 922–927. [Google Scholar] [CrossRef]
- Gustafson, F.G. Diurnal Changes in the Acidity of Bryophyllum calycinum. J Gen Physiol 1925, 7, 719–728. [Google Scholar] [CrossRef] [PubMed]
- Smith, D.L. Plant Sap Analysis as a Monitoring Technique for Tomatoes in Rockwool. Acta Hortic 1988, 221, 403–411. [Google Scholar] [CrossRef]
- MacKerron, D.K.L.; Young, M.W.; Davies, H.V. A Critical Assessment of the Value of Petiole Sap Analysis in Optimizing the Nitrogen Nutrition of the Potato Crop. Plant Soil 1995, 172, 247–260. [Google Scholar] [CrossRef]
- Janeiro Cid, R. Análisis Químico del Extracto Celular de Peciolo en Fresa Mediante Laboratorios Portátiles. MSc Thesis, Colegio de Postgraduados, Texcoco, Mexico, 2014; p. 50. [Google Scholar]
- Llanderal, A.; García-Caparrós, P.; Pérez-Alonso, J.; Contreras, J.I.; Segura, M.L.; Reca, J.; Lao, M.T. Approach to Petiole Sap Nutritional Diagnosis Method by Empirical Model Based on Climatic and Growth Parameters. Agronomy 2020, 10, 188. [Google Scholar] [CrossRef]
- López Núñez, R.; García, I.; Cabrera, F.; Murillo, M.; Roca, M.; Martin, F. Nitrato en Pecíolo de Fresa. Horticultura 1999, 136, 17–22. [Google Scholar]
- Brust, G.J. Using Nitrate-N Petiole Sap-Testing for Better Nitrogen Management in Vegetable Crops; University of Maryland Extension: Maryland, United States, 2008; p. 9. [Google Scholar]
- Hochmuth, G.J.; Maynard, D.; Vavrina, C.; Hanlon, E.; Simonne, E. Plant Tissue Analysis and Interpretation for Vegetable Crops in Florida (HS964); UF/IFAS Extension: Florida, United States, 2018; p. 48. [Google Scholar]
Figure 1.
Inter-day shifts (%) in sap parameters, pooled across extraction methods. Lowercase letters denote Tukey HSD groups within each parameter (p < 0.05).
Figure 1.
Inter-day shifts (%) in sap parameters, pooled across extraction methods. Lowercase letters denote Tukey HSD groups within each parameter (p < 0.05).
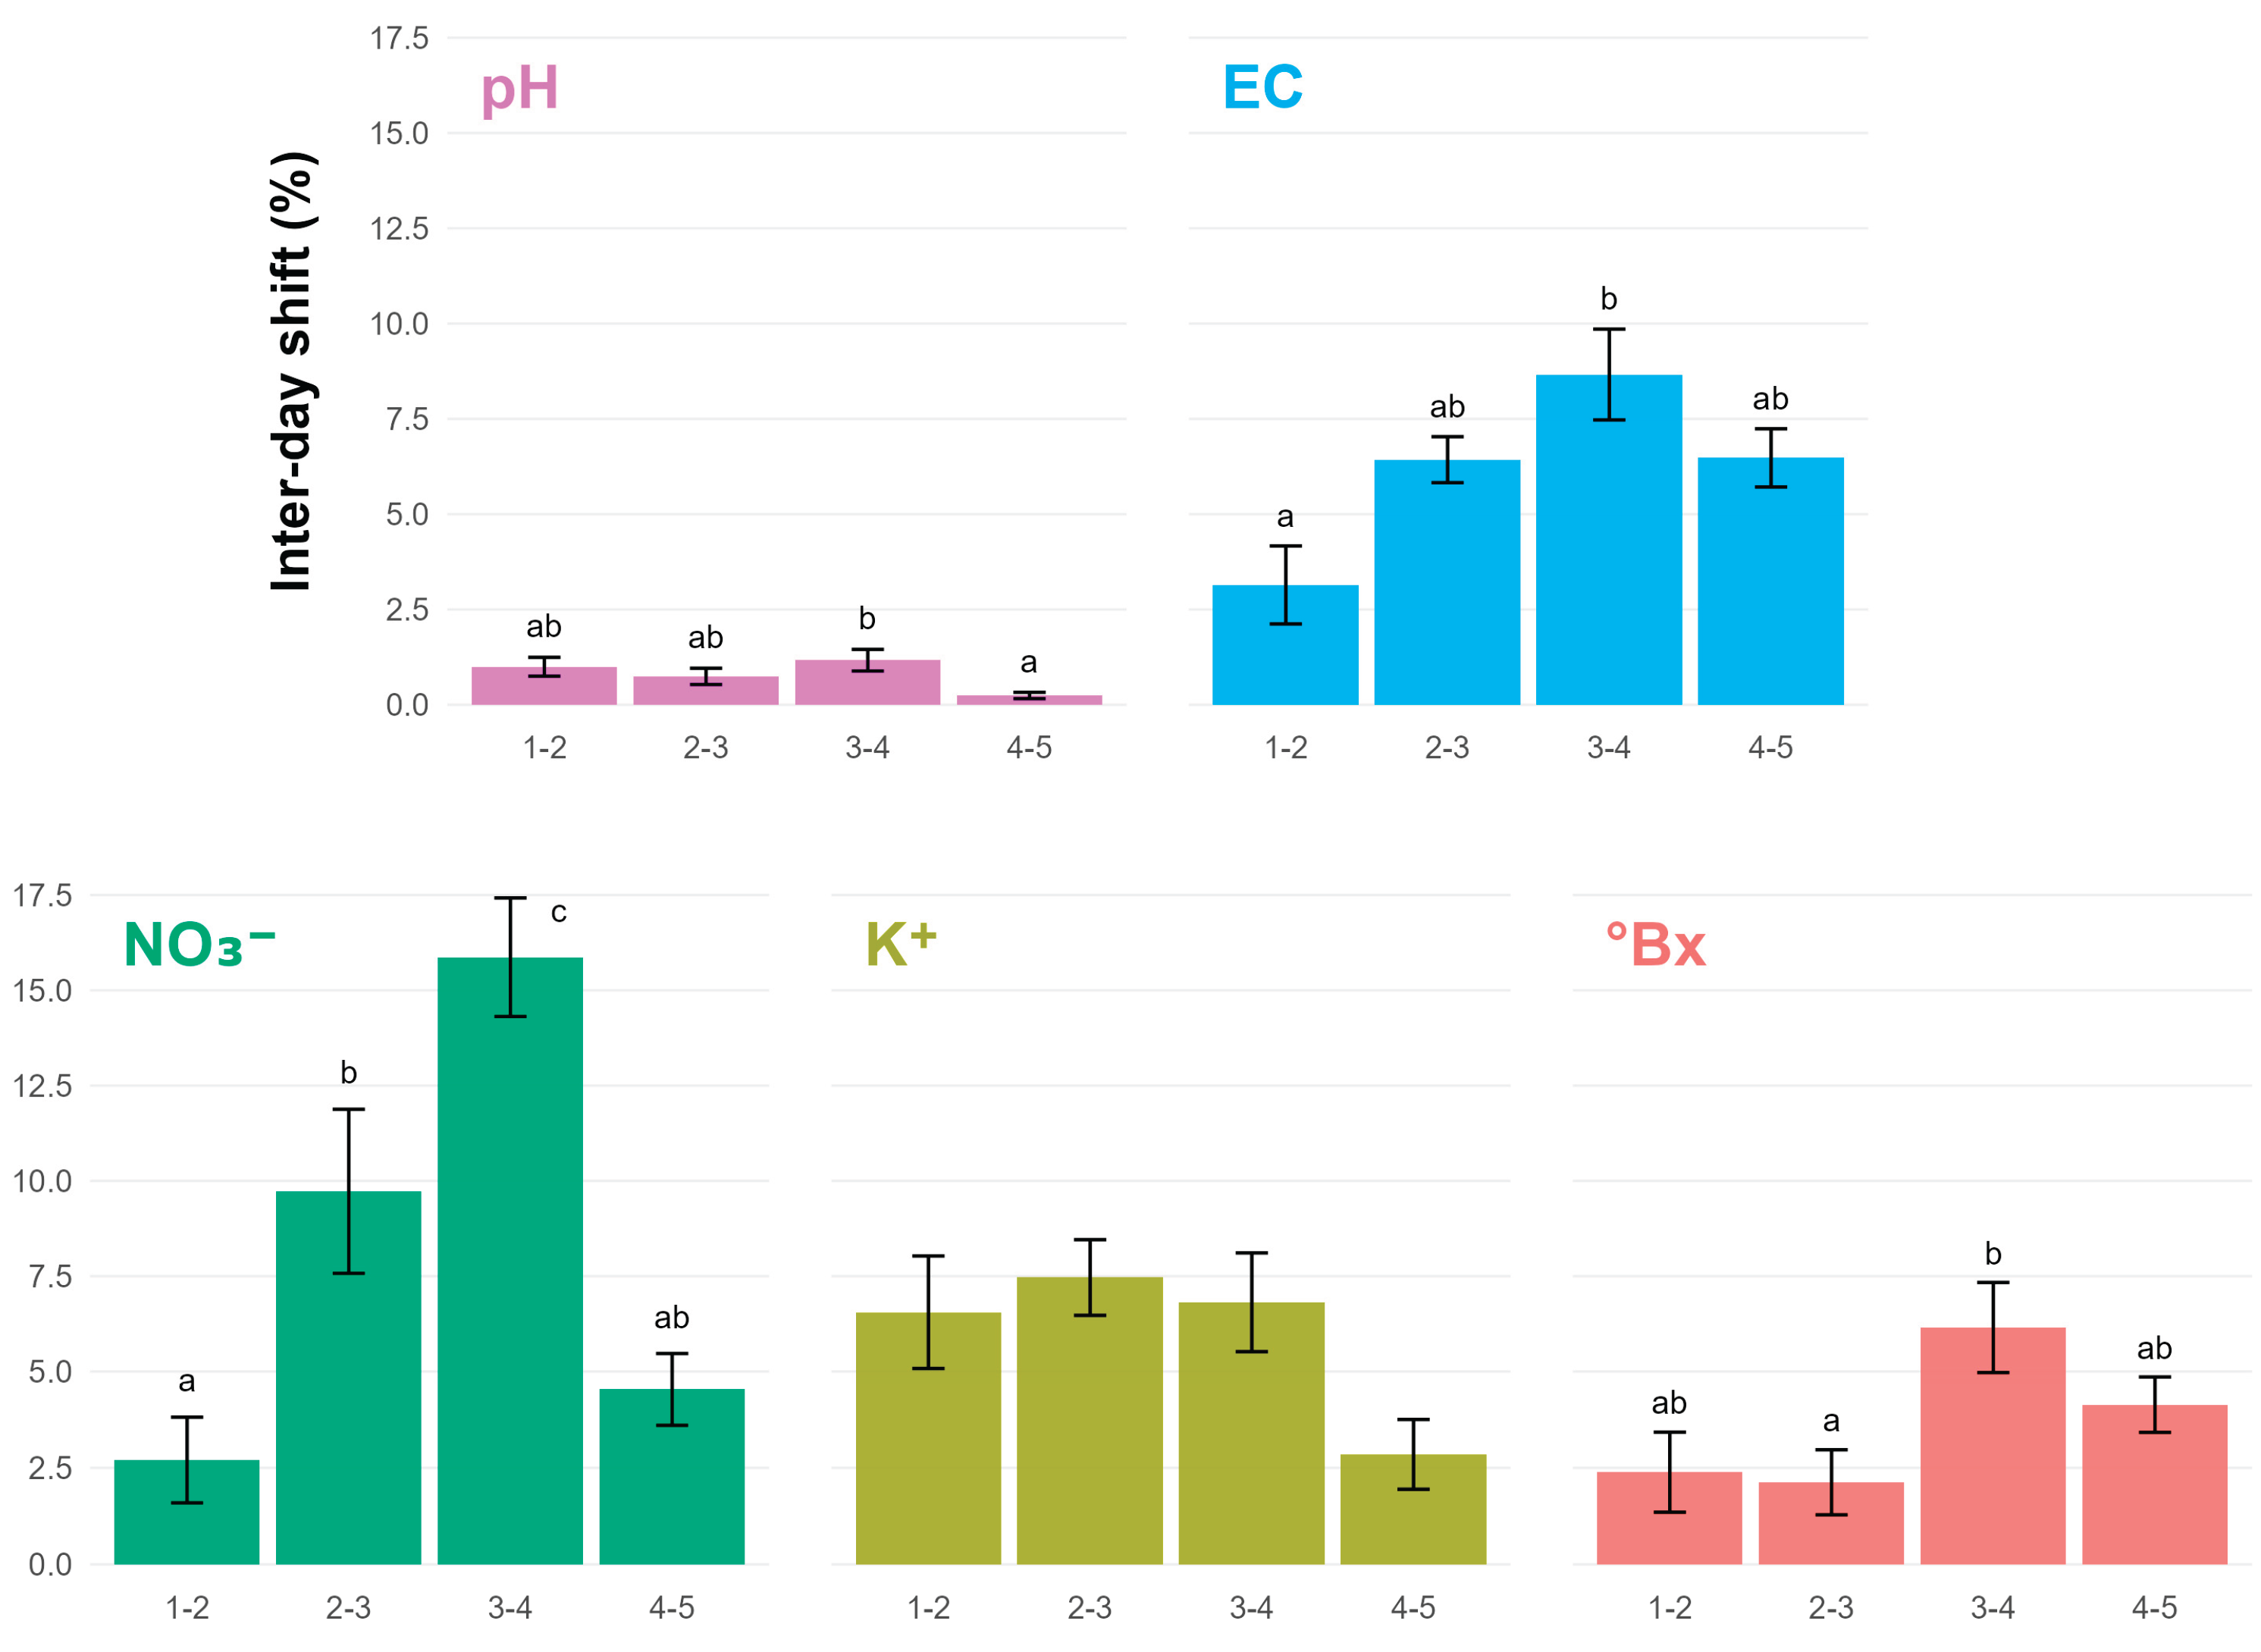

Table 1.
Sap composition over five consecutive days by extraction method (mean ± SD).
| Parameter | Extraction method | Day 1 | Day 2 | Day 3 | Day 4 | Day 5 |
|---|---|---|---|---|---|---|
| pH | Citrus squeezer | 6.33 ± 0.02 | 6.27 ± 0.03 | 6.35 ± 0.03 | 6.28 ± 0.04 | 6.26 ± 0.03 |
| Potato press | 6.31 ± 0.03 | 6.26 ± 0.03 | 6.28 ± 0.02 | 6.20 ± 0.02 | 6.19 ± 0.02 | |
| Garlic press | 6.25 ± 0.01 | 6.22 ± 0.03 | 6.19 ± 0.02 | 6.21 ± 0.03 | 6.24 ± 0.03 | |
| Juicer | 6.49 ± 0.01 | 6.45 ± 0.02 | 6.47 ± 0.03 | 6.34 ± 0.02 | 6.35 ± 0.01 | |
| Garlic grinder | 6.31 ± 0.01 | 6.18 ± 0.02 | 6.26 ± 0.02 | 6.19 ± 0.03 | 6.20 ± 0.02 | |
| EC (dS/m) |
Citrus squeezer | 9.20 ± 0.10 | 9.07 ± 0.20 | 9.47 ± 0.13 | 10.29 ± 0.16 | 9.67 ± 0.12 |
| Potato press | 9.48 ± 0.13 | 8.95 ± 0.18 | 9.53 ± 0.13 | 10.70 ± 0.18 | 9.72 ± 0.10 | |
| Garlic press | 8.96 ± 0.14 | 8.97 ± 0.09 | 9.71 ± 0.14 | 10.19 ± 0.18 | 9.63 ± 0.11 | |
| Juicer | 9.69 ± 0.17 | 9.22 ± 0.17 | 9.79 ± 0.17 | 10.57 ± 0.24 | 10.08 ± 0.15 | |
| Garlic grinder | 9.52 ± 0.19 | 9.16 ± 0.09 | 9.79 ± 0.13 | 10.72 ± 0.12 | 9.96 ± 0.11 | |
| NO3- (mmol/L) |
Citrus squeezer | 52.07 ± 1.71 | 50.23 ± 4.35 | 52.30 ± 1.96 | 61.29 ± 5.29 | 58.53 ± 4.16 |
| Potato press | 56.91 ± 2.19 | 56.91 ± 5.63 | 51.61 ± 1.99 | 61.98 ± 4.22 | 57.37 ± 2.75 | |
| Garlic press | 56.68 ± 3.56 | 60.37 ± 5.66 | 55.07 ± 3.77 | 61.52 ± 4.75 | 64.98 ± 2.63 | |
| Juicer | 65.44 ± 2.79 | 66.82 ± 6.54 | 60.83 ± 3.06 | 68.66 ± 5.98 | 67.05 ± 5.76 | |
| Garlic grinder | 67.74 ± 3.30 | 68.66 ± 5.56 | 56.68 ± 3.18 | 66.59 ± 7.36 | 68.43 ± 2.08 | |
| K+ (mmol/L) |
Citrus squeezer | 63.21 ± 2.28 | 68.69 ± 1.97 | 62.11 ± 1.74 | 64.30 ± 1.03 | 68.32 ± 2.07 |
| Potato press | 65.40 ± 2.29 | 67.96 ± 3.10 | 62.48 ± 2.00 | 69.05 ± 1.12 | 68.32 ± 2.07 | |
| Garlic press | 61.38 ± 1.37 | 68.32 ± 4.01 | 62.48 ± 1.10 | 67.96 ± 1.46 | 66.13 ± 2.33 | |
| Juicer | 66.13 ± 2.26 | 69.42 ± 2.92 | 64.30 ± 2.26 | 67.23 ± 1.65 | 68.32 ± 2.72 | |
| Garlic grinder | 65.40 ± 1.35 | 67.96 ± 2.89 | 65.40 ± 1.66 | 69.78 ± 1.55 | 67.96 ± 2.00 | |
| Bx (°) |
Citrus squeezer | 4.67 ± 0.04 | 4.79 ± 0.06 | 4.84 ± 0.13 | 5.09 ± 0.13 | 4.99 ± 0.10 |
| Potato press | 4.81 ± 0.04 | 4.89 ± 0.09 | 5.07 ± 0.20 | 5.21 ± 0.07 | 5.04 ± 0.06 | |
| Garlic press | 4.73 ± 0.09 | 5.03 ± 0.09 | 5.01 ± 0.09 | 5.29 ± 0.09 | 4.97 ± 0.11 | |
| Juicer | 5.04 ± 0.08 | 5.10 ± 0.16 | 4.87 ± 0.14 | 5.26 ± 0.07 | 5.04 ± 0.06 | |
| Garlic grinder | 5.13 ± 0.09 | 5.10 ± 0.06 | 5.06 ± 0.10 | 5.54 ± 0.21 | 5.24 ± 0.10 | |
Disclaimer/Publisher’s Note: The statements, opinions and data contained in all publications are solely those of the individual author(s) and contributor(s) and not of MDPI and/or the editor(s). MDPI and/or the editor(s) disclaim responsibility for any injury to people or property resulting from any ideas, methods, instructions or products referred to in the content. |
© 2025 by the authors. Licensee MDPI, Basel, Switzerland. This article is an open access article distributed under the terms and conditions of the Creative Commons Attribution (CC BY) license (http://creativecommons.org/licenses/by/4.0/).
Copyright: This open access article is published under a Creative Commons CC BY 4.0 license, which permit the free download, distribution, and reuse, provided that the author and preprint are cited in any reuse.


