
Submitted:
30 September 2025
Posted:
30 September 2025
You are already at the latest version
Abstract
Mangrove ecosystems play an important role in supporting diverse marine life, offering protection, reproduction, and food for various species. However, mangrove forests are especially gastropods. A study on the North Coast of East Java, Indonesia, revealed communities of different gastropod species that coexist in each zone of mangrove vegetation. In each mangrove zone, the species composition of gastropods changes depending on the type of substrate, soil, mangrove stems, or mangrove leaves. The Shannon-Wiener diversity index values range from low to high diversity, and the community structure index values in the mangrove zone vary. The evenness index varies by region, with Avicennia, Bruguiera, and Sonneratia having the highest index value. These findings indicate that the mangrove vegetation zone at each station is - crucial for maintaining the diversity of gastropod populations, with different composition and abundance patterns influenced by the distance of each mangrove zone from the ocean. This data can influence conservation efforts to preserve mangrove habitats and the various organisms that depend on them.
Keywords:
Avicennia
; biodiversity
; Bruguiera
; diversity index
; Shannon-Wiener
; Sonneratia
1. Introduction
Mangrove ecosystems play a vital role in supporting a wide variety of marine life, acting as essential habitats for numerous species. These coastal environments are rich in biodiversity, offering shelter, breeding sites, and nourishment for many organisms, as emphasized by several studies [1,2,3,4]. Species such as fish, crabs, shrimp, mollusks, and many other marine creatures depend heavily on mangroves for their survival and development. A notable characteristic of mangroves is their complex root networks, which provide a safe haven for juvenile fish and small benthic fauna, shielding them from predators and supplying food resources [1,5,6]. Furthermore, mangroves enhance water quality by trapping sediments and nutrients, thereby decreasing the concentration of harmful pollutants that could adversely affect marine organisms [7,8]. The overall health of marine ecosystems is closely tied to the existence and vitality of mangrove forests, which offer essential support for a diverse array of species [9].
The survival and health of gastropods are closely connected to the vitality and continuity of mangrove ecosystems. Studies emphasize that gastropod diversity flourishes in pristine mangrove forests, highlighting the negative effects of habitat degradation and conversion to other land uses [10,11]. Mangroves provide a safe refuge for gastropods, offering secure environments for their feeding and reproductive activities. These coastal woodlands supply gastropods with crucial nourishment, as the breakdown of leaves and organic material within mangrove ecosystems creates nutrient-rich food sources [4,12]. Additionally, the extensive and complex root structures of mangroves are essential in protecting gastropods from predators and challenging marine conditions [6].
The distribution of gastropods within mangrove ecosystems is influenced by a complex combination of factors, making it an intricate subject of study with significant implications for habitat conservation. This pattern is not consistent and varies depending on the specific mangrove ecosystem examined. Noticeable differences exist in the abundance and diversity of gastropods among various dominant mangrove species, underscoring the complexity of these environments [10]. Numerous factors influence gastropod distribution, including physical parameters such as temperature, salinity, and water depth, as well as biological influences like predation and competition [13]. In addition, human activities such as pollution and habitat destruction further complicate the distribution patterns of gastropods within mangrove habitats [10].
This research aims to determine the distribution of mangrove gastropods based on dominant vegetation classes and their relationship with physicochemical characteristics in the mangroves along the northern coast of East Java, Indonesia. In the northern coastal area of East Java, six regions were chosen to represent the conditions of the mangrove ecosystem. Such knowledge can help in developing management strategies that consider the local distribution of marine gastropod populations across different mangrove forest zones. Several recent studies have highlighted the critical role of gastropods in mangrove ecosystems, functioning as key contributors to nutrient cycling and benthic community structure. Environmental factors such as substrate composition, dissolved oxygen, pH, and salinity have been shown to strongly influence gastropod diversity and distribution [47]. However, there remains a significant gap in the integrative analysis of physicochemical parameters and gastropod communities across different Indonesian mangrove regions, especially those less studied areas. This study addresses this gap by conducting a comprehensive assessment of how environmental variables shape gastropod assemblages, aiming to provide better insights for mangrove ecosystem conservation.
The northern coast of East Java has a relatively high diversity of mangroves, with dominant species such as Rhizophora mucronata, Avicennia marina, and Sonneratia alba. This area encompasses the mangrove ecosystems in Surabaya, Pasuruan, Probolinggo, and Situbondo, supported by muddy substrates and high organic matter content. These conditions create an ideal habitat for various types of gastropods. In Baluran National Park and Alas Purwo, 21 and 19 species of gastropods were found with a high community similarity index, showing a strong relationship between vegetation conditions and the structure of the benthic fauna community [14].
2. Materials and Methods
2.1. Study Area
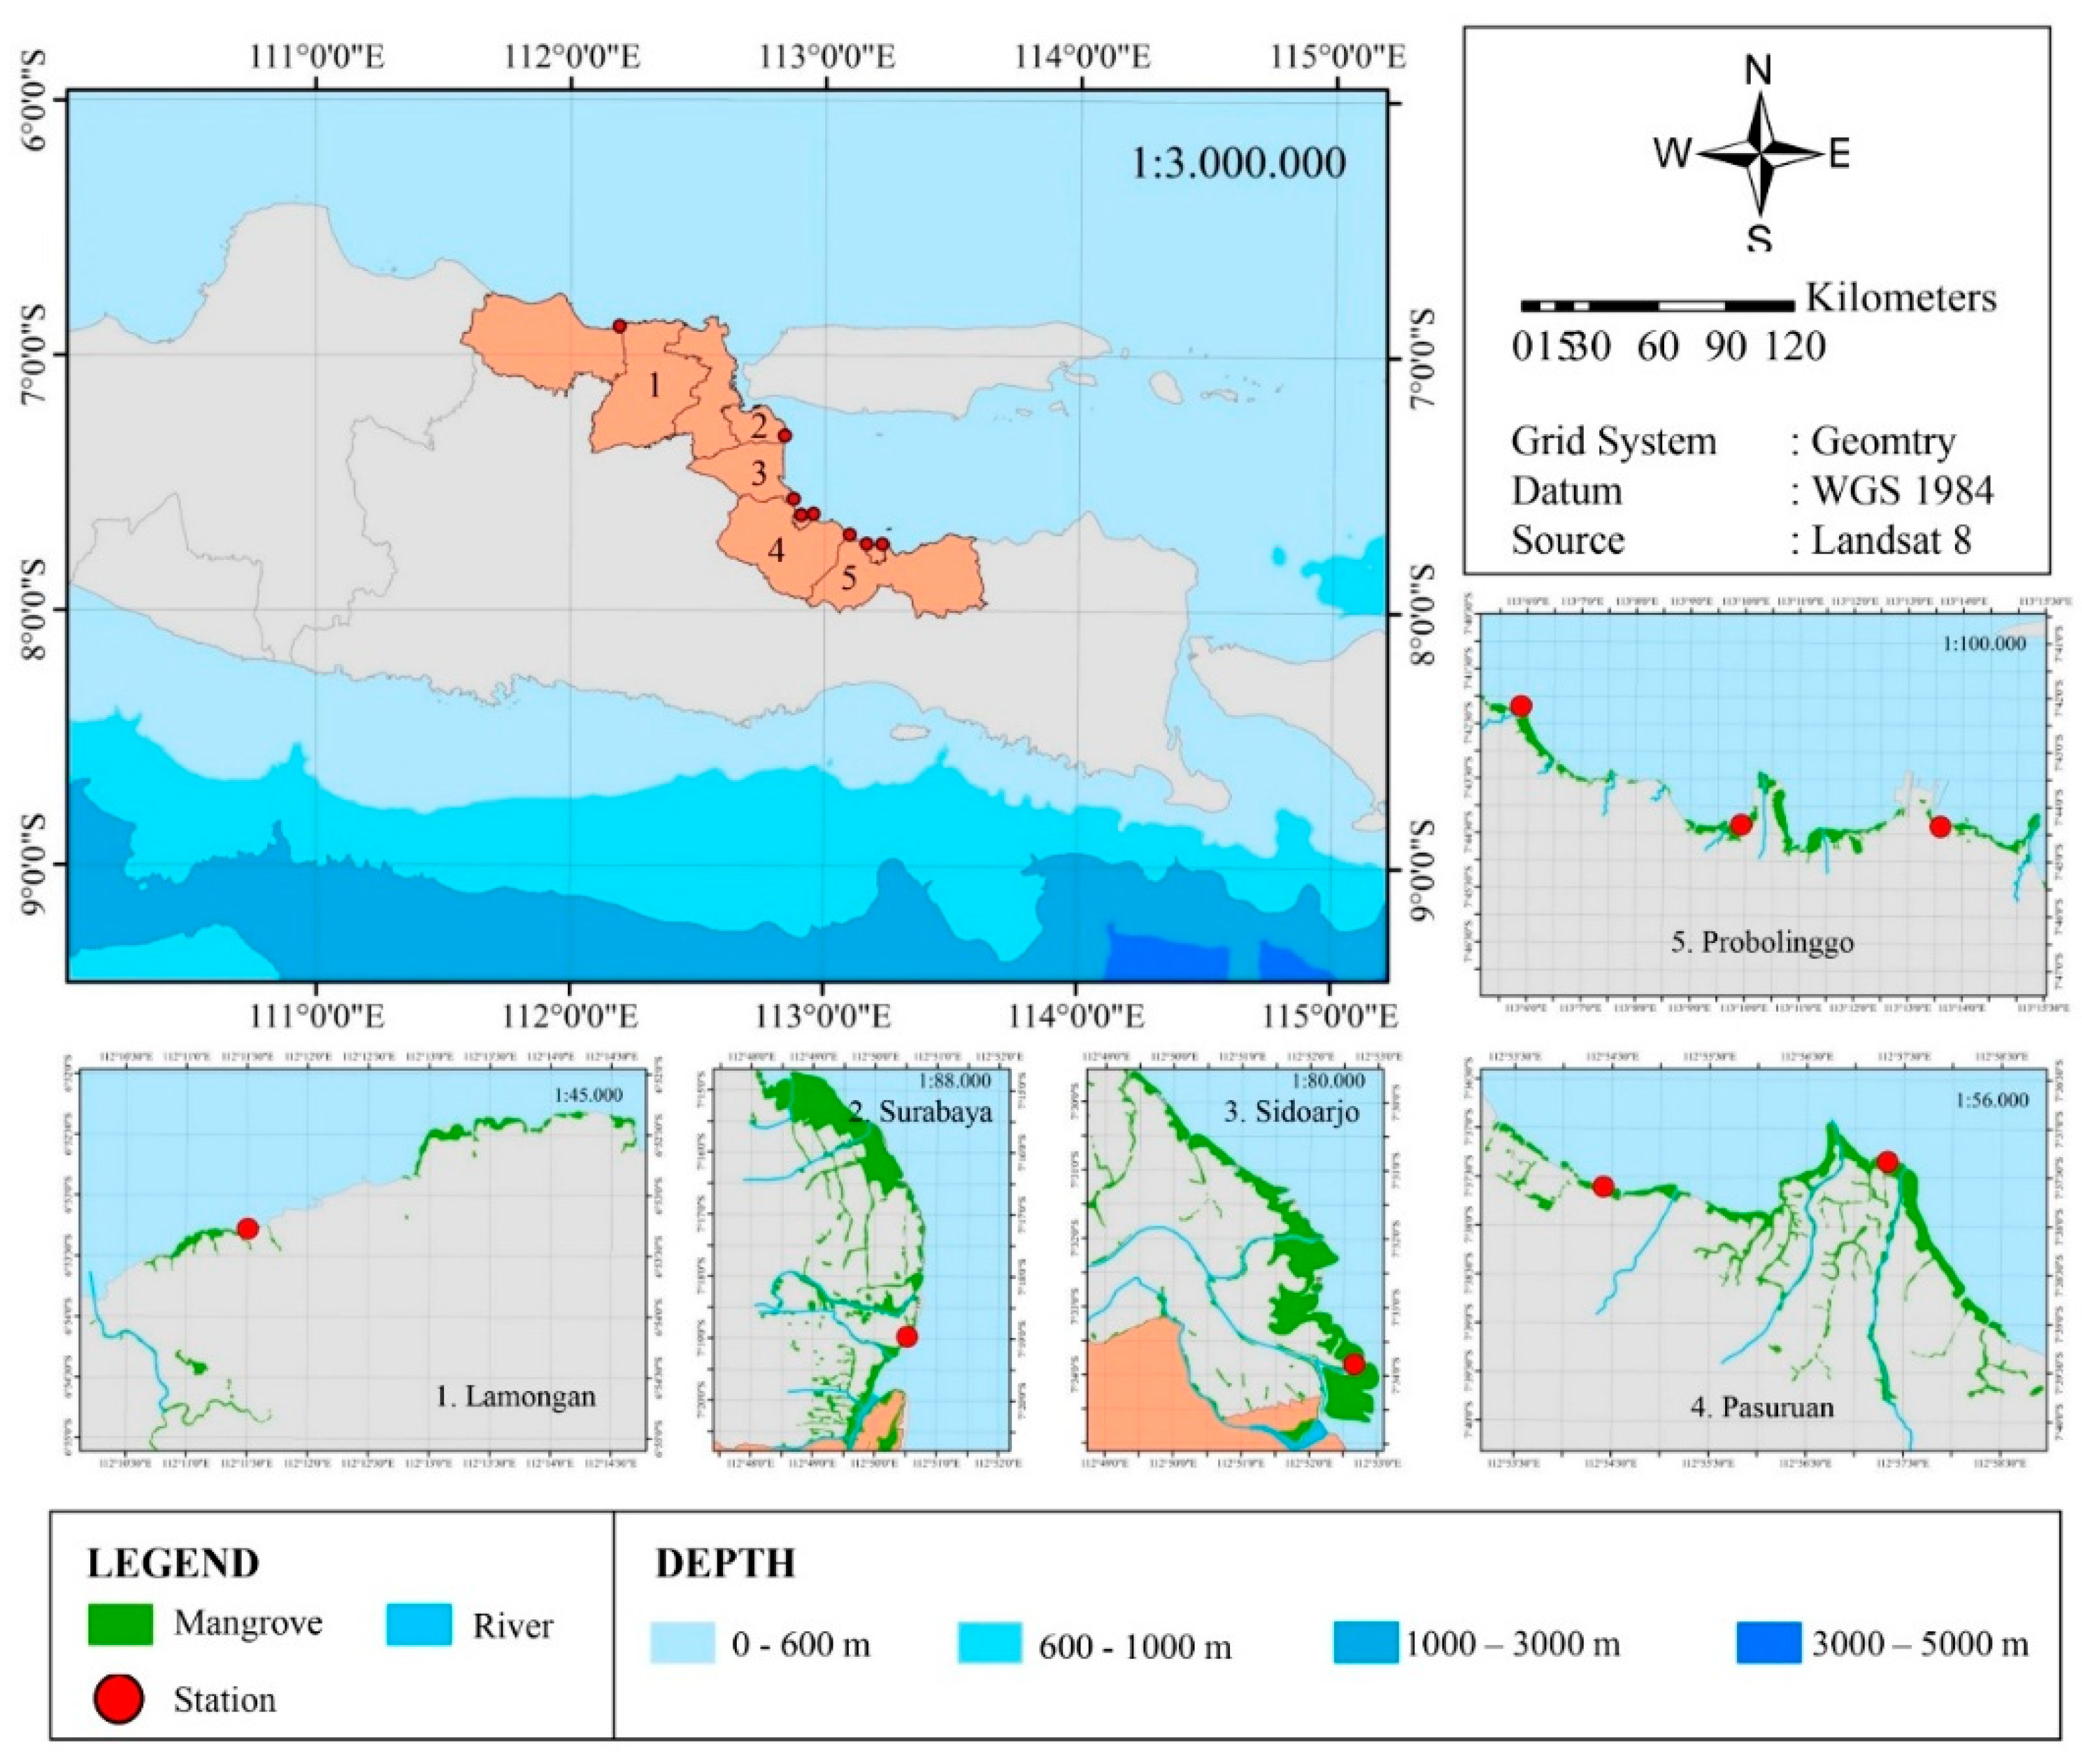
This research was conducted from March to September 2024 in 8 northern coastal areas of East Java, namely Probolinggo City, Pasuruan, Sidoarjo, Surabaya, and Lamongan. Productivity observations were conducted once a month.
Figure 1.
Map showing the 8 sampling sites on the Northern Coast of East Java.
2.2. Mangrove Productivity
Litter was collected using litter traps made of nylon (1 m x 1m with a mesh size of 1 mm) and placed at a height of 1 m above the ground. Three litter traps were installed at each location. Mangrove litter is collected from each location every month and sorted into different components such as leaves, flowers, seeds, twigs. The litter that was obtained was dried and weighed at constant weight (70°C for 48 hours). The drying process is carried out in an oven litter production was estimated as dry weight.
2.3. Mangrove Productivity
Sampling was carried out on a 1 m x 1 m quadrat transect using the method purposive sampling. Sampling will be carried out by applying hand sampling techniques to all gastropods found on the substrate, roots, stems, and mangrove leaves. Gastropods were collected in May, July, and September 2024 [16,17]. There were two stations observed, and each consisted of nine observation sub-stations. Gastropod sampling was carried out at low tide.
2.4. Data Analysis
Statistical analysis components (PCA) are used to determine the relationship between mangrove productivity and environmental conditions. Principal component analysis displays data in the form of graphs, data matrices, which consist of research zones as productivity (lines) and environmental variables as well (columns). This analysis uses a program XlStat version 2023.3.1.
Gastropod associations using correspondence analysis Correspondence Analysis (CA). Analysis of the row data matrix (gastropod categories small, medium, large) and columns (mangrove type, mangrove density, and mangrove productivity) aims to determine the association between gastropods and productivity. This analysis is carried out using the program XlStat version 2023.3.1.
3. Results
3.1. Mangrove Litter
Every change in time experiences fluctuations in the production of leaves, branches, flowers, and fruits. The production of mangroves, which consists of leaves, branches, flowers, and fruits, shows different amounts and the production of leaves is usually higher compared to the production of other components (Table 1).
3.2. The Physico-Chemical Condition
The nutrient content of different mangrove species varied significantly across locations. The highest tannin content was observed in Bruguiera gymnorhiza from the Brondong area, Lamongan, while the lowest was recorded in Avicennia alba from the Mangunharjo area, Probolinggo. In terms of total sugar content, the highest value was found in Avicennia marina from the Sumber Asih area, Probolinggo, whereas the lowest was noted in Rhizophora apiculata from the same location.
The highest phosphorus concentration was recorded in Avicennia officinalis from the Tambaan area, Pasuruan, while the lowest phosphorus content was found in Bruguiera gymnorhiza from Sumber Asih, Probolinggo. Amino acid content peaked in samples from the Kedung Pandan area, Sidoarjo, with the lowest value again observed in Bruguiera gymnorhiza from Sumber Asih, Probolinggo (Table 2).
This research reveals that overall, the texture of dust is more dominant compared to other textures. Finer sand is more likely to be carried by the tides to the mangrove forest area (Table 3).
The northern coast of East Java is the habitat of various ecosystems including mangroves and gastropods. The research area is focused on several points including 3 points in the city of Probolinggo, 2 points in the city of Pasuruan, 1 point in the city of Sidoarjo, 1 point in the city of Surabaya and 1 point in the city of Lamongan. The condition of the water parameters at all points can be seen in Table 4.
3.3. Distribution of Gastropods
In the 8 research points, mangrove species are scattered including Avicennia, Bruguiera and Sonneratia. As for the gastropod ecosystems found are Canarium labiatum, Cassidula aurifelis, Cassidula mustelina, Cassidula nucleus, Cassidula vespertilionis, Cerithidea cingulata, Cerithidea quadrata, Ellobium aurisjudae, Littoraria melanostoma, Littoraria scabra, Littoraria vespacea, Littorina pintado, Monoplex pilearis, Natica unifasciata, Neritina turrita, Neritina violacea, Penion maximus, Polinices flemingianus, Polinices tumidus, Pseudostomatella papyracea, Pythia plicata, Rhinoclavis kochi, Telescopium telescopium, Terebralia palustris, Terebralia sulcata, Turbo argyrostoma, Turbo chrysostomus and Volegalea cochlidium (Table 5).
The composition of gastropod species varies found at 8 points on the East Java Coast. Cerithidea cingulata has the highest with a value of 27.01% which can be found on the coasts of Probolinggo and Pasuruan. The second highest position is Telescopium telescopium at 13.22% which is found on the entire coast of East Java and the third highest is Neritina violacea which is 8.49% found on the coast of Sidoarjo. The species Penion maximus and Canarium labiatum have almost the same values, namely 7.78% and 7.28%. Meanwhile, the species Volegalea cochlidium, Littorina pindatoto and Cerithidae quadrata have values of 5.43%, 5.06% and 5.01%. For the species Littoraria melanostoma and Turbo chrysostomus have the same value, which is 3.26%. The high or low abundance of an organism in a body of water is influenced by abiotic factors such as temperature, salinity, dissolved oxygen (DO) levels, pH and the bottom substrate of the water.
Figure 2.
Gastropod species composition in the northern coast of East Java (A. Mangunharjo, B. Sumber Asih, C. Nguling, D. Tambaan, E. Rejoso, F. Kedung Pandan, G. Wonorejo, and H. Brondong).
Figure 2.
Gastropod species composition in the northern coast of East Java (A. Mangunharjo, B. Sumber Asih, C. Nguling, D. Tambaan, E. Rejoso, F. Kedung Pandan, G. Wonorejo, and H. Brondong).
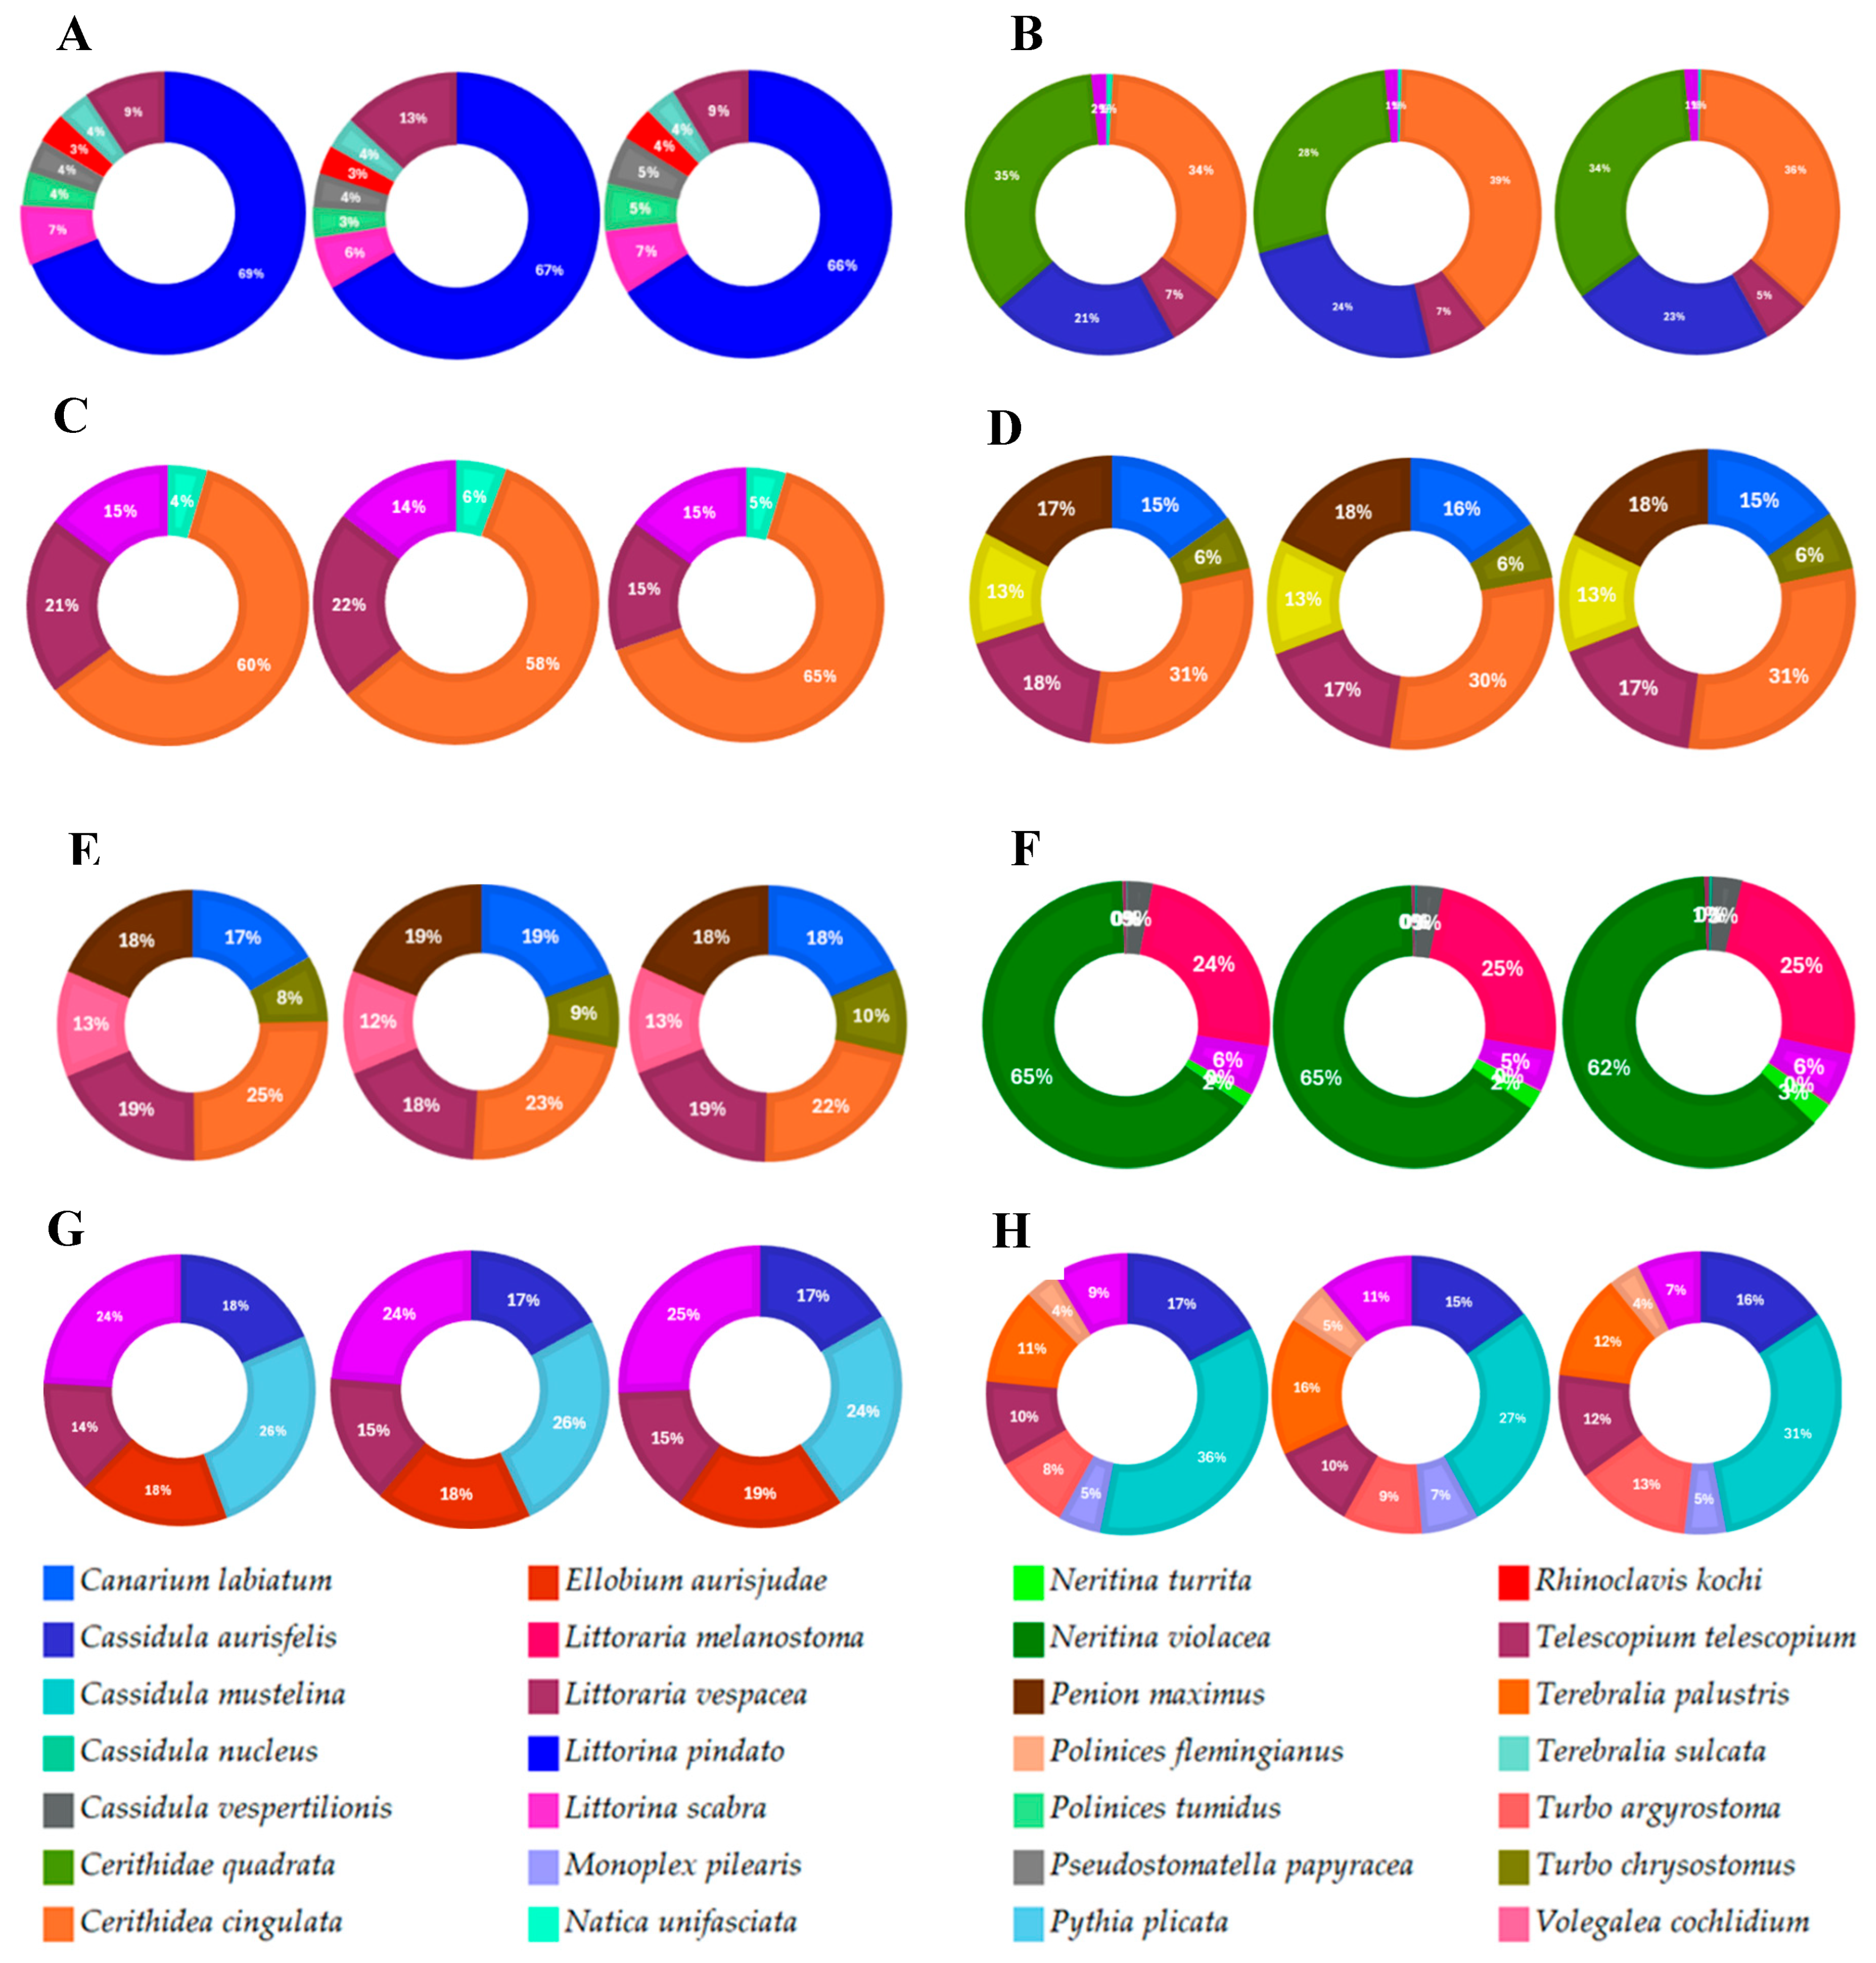
Telescopium telescopium dominates in all locations with a slightly low percentage value of 12.52%, while Littorina Scabra dominates in 4 regions, namely Probolinggo, Sidoarjo, Surabaya and Lamongan with a slightly high percentage of around 15.92%. Meanwhile, Cassidula aurisfelis species found in 3 locations, namely Probolinggo, Surabaya and Lamongan, has a high percentage value of around 10.86%. For the Cerithidea cingulata species, it is found in 2 regions, namely Probolinngo and Pasuruan, but it has a high percentage value of around 29.38% (Table 6).
The community structure indeces showed varied values between mangrove zonation. The Shannon-Wiener diversity index computation produced different values for each zone, ranging from low diversity (H'<1) to moderate diversity (1<H'<3), ranging from 1,028 ± 0,127 to 1,912 ± 0,072. All locations can be said to be zones with moderate diversity index values. The location with the highest moderate diversity value is Brondong with a value of 1.912 ± 0.072, and the lowest is Kedung Pandan with a value of 1.028 ± 0.127 (Table 7).
3.4. Relationship Between Mangrove Litter Productivity and Environmental Conditions
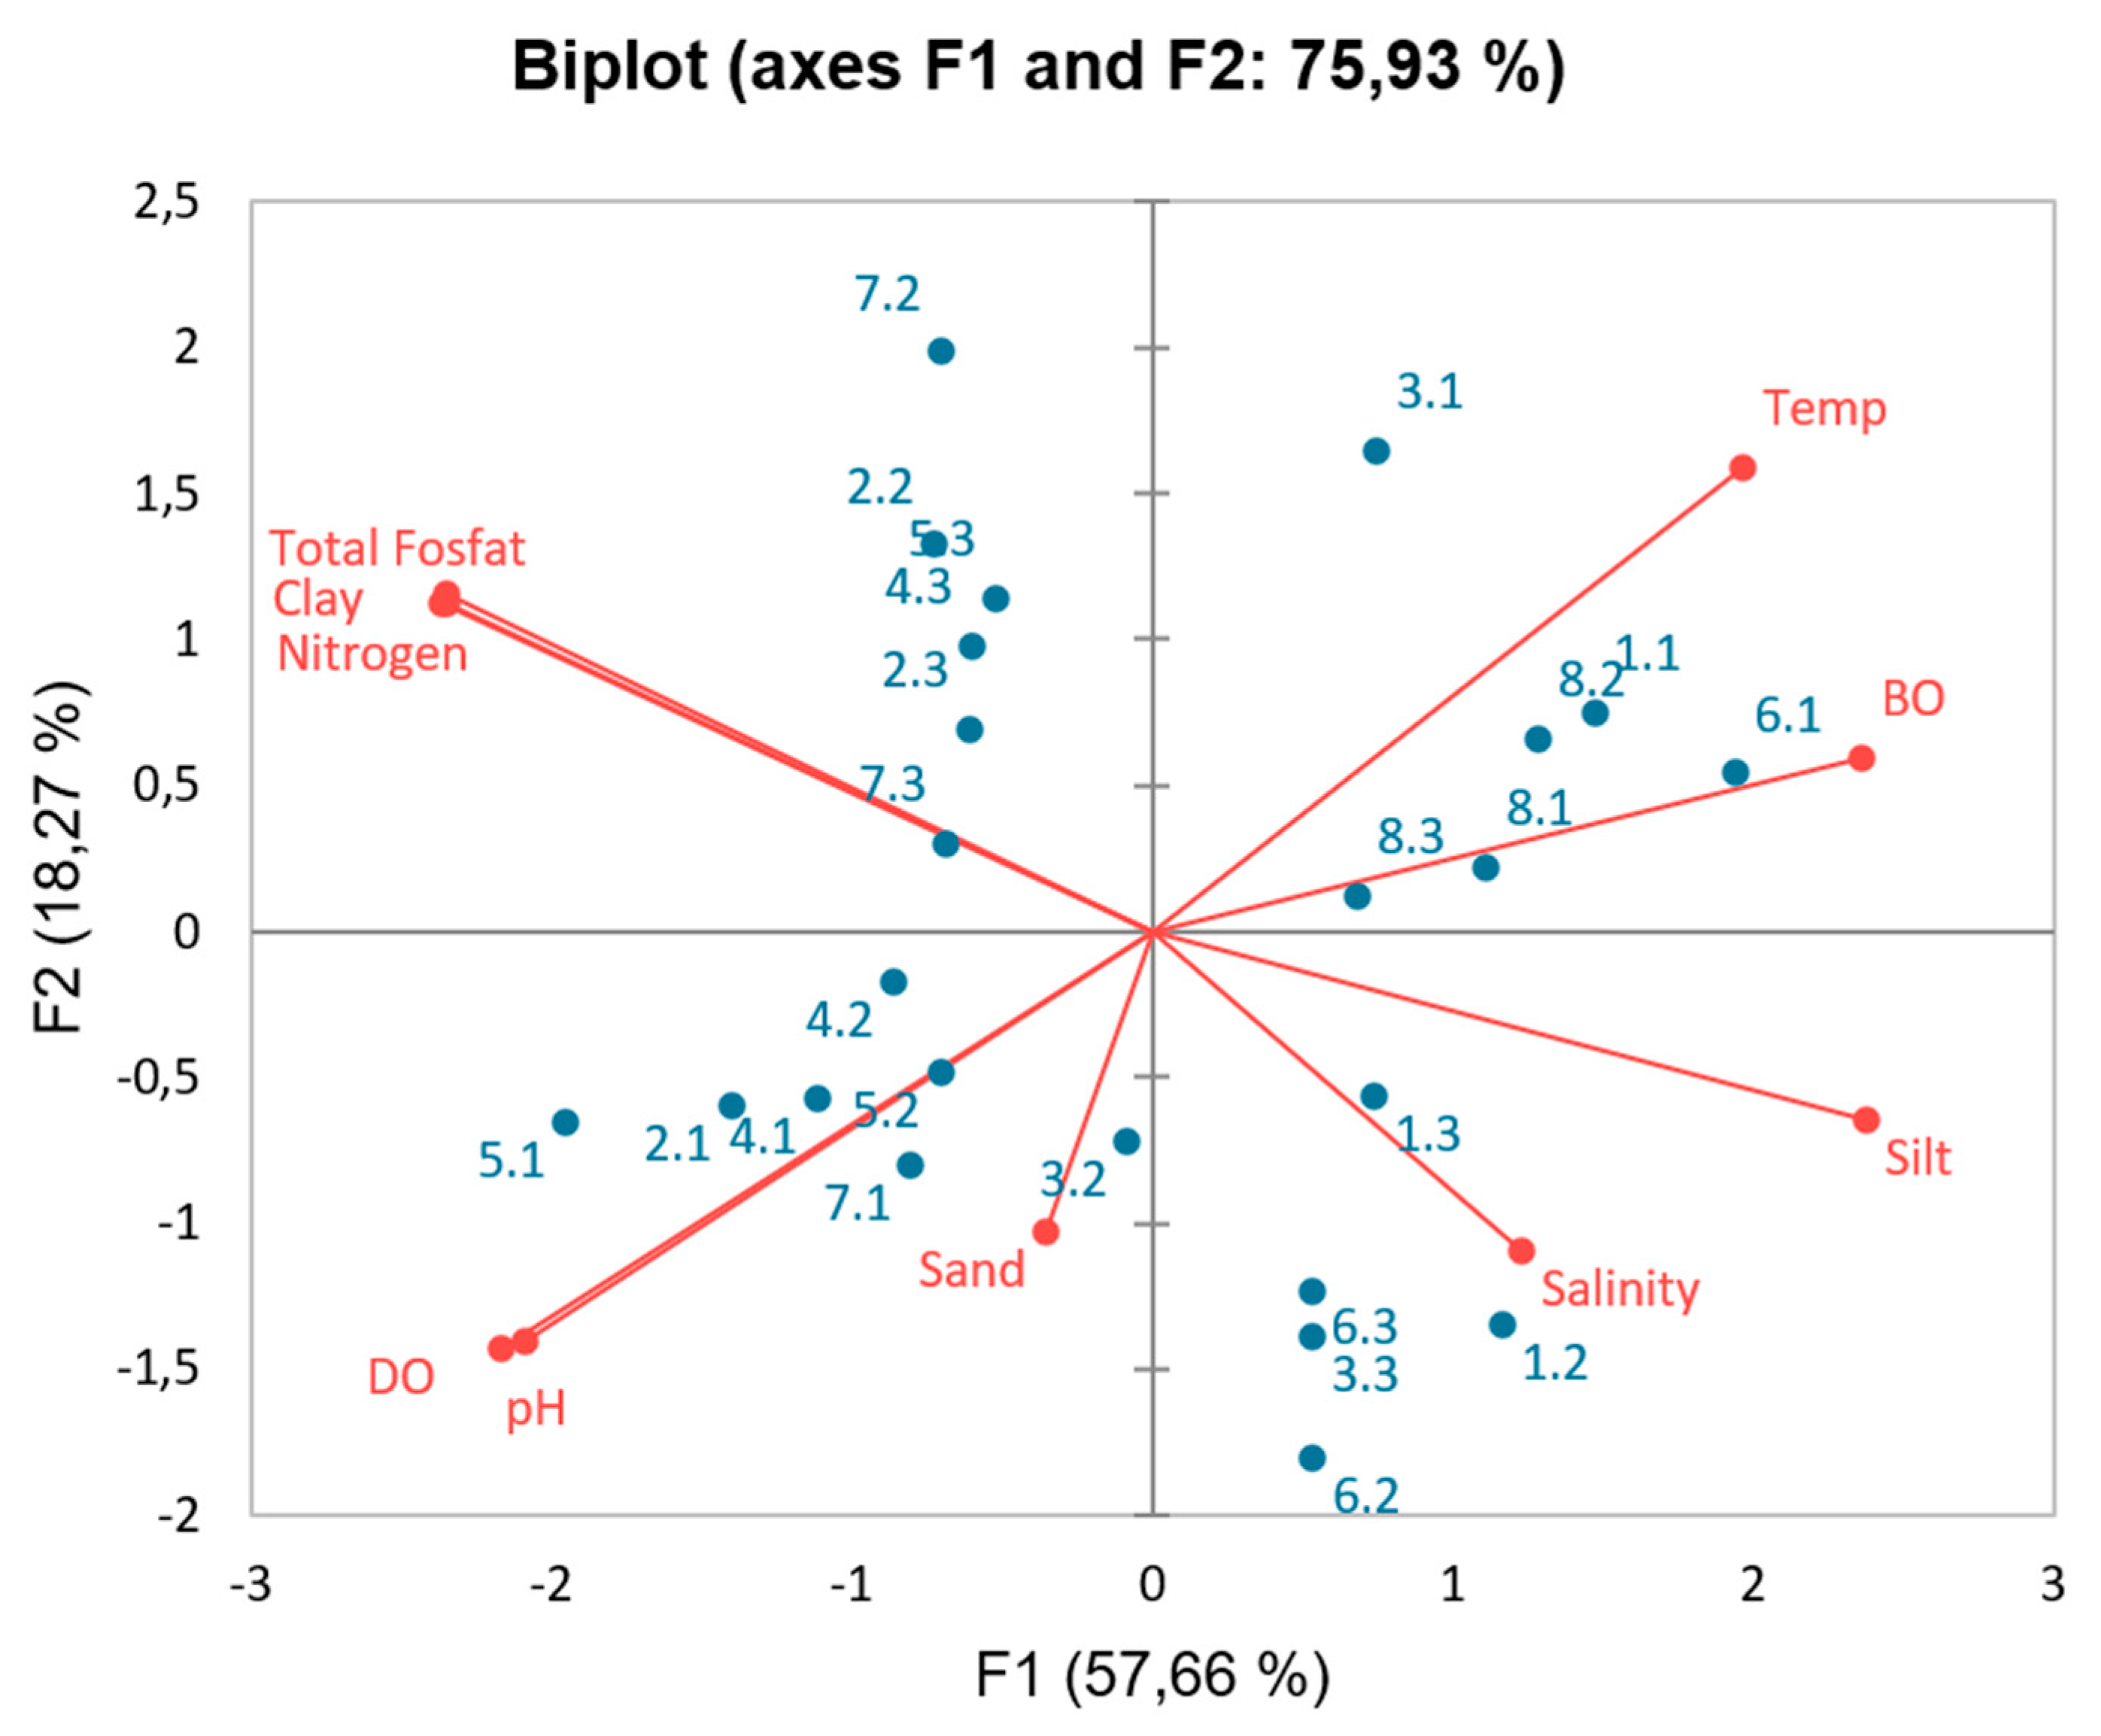
Figure 2 illustrates the relationship between litter productivity and environmental conditions. The results of the Principal Component Analysis (PCA) show three eigenvalues. The first PCA has an eigenvalue of 5.77 (variance of 57.66%), the second has an eigenvalue of 1.83 (variance of 18.27%), and the third has an eigenvalue of 1.059 (variance of 10.59%). These three new variables can explain the variability of the data by 86.523% (as seen from the cumulative/total variance percentage). The relationship between the original variables and the new variables formed by PCA is referred to as loading values. The loading values selected are those above 0.5, which are considered to effectively explain the variables influencing mangrove productivity. This indicates that the higher the mangrove productivity, the higher organic material, sandy and clay substrates will be found, supported by salinity. The second PCA that influences this is TN, dust substrate, and temperature, while the third PCA pertains to the pH condition of the water.
Figure 3.
PCA regarding productivity and environmental parameters.
3.5. The Relationship Between Gastropods and the Environment
The above figure shows the relationship between gastropods and environmental conditions using PCA resulted in three eigenvalues (Figure 4). The first principal component has an eigenvalue of 12.24 (variance of 33.99%), while the second has an eigenvalue of 6.99 (variance of 19.42%), and the third has an eigenvalue of 6.18 (variance of 17.18%). These three new variables can explain the diversity of the data by 53.41% (based on % cumulative/total variance). The relationship between the original variables and the new variables (principal components) formed by PCA is referred to as loading values. The selected loading values are those above 0.5, which are considered capable of explaining the variables that influence gastropods and the environment.
3.6. The Relationship Between Mangrove Productivity and Gastropod Productivity
The relationship of gastropods based on environmental characteristics can be seen in Figure 3. The CA results show a total variability of F1 and F2 amounting to 54.76%, consisting of F1 variability 30.67% and F2 variability 24.08%. Figure 5 illustrates the distribution of gastropods based on gastropod size and productivity.
4. Discussion
This study explains the physicochemical characteristics of mangroves and the distribution of gastropods on the northern coast of East Java. Salinity is influenced by the distance from the river and tides, namely the input of freshwater from river flows and the input of seawater through tidal conditions affecting the salinity levels. Temperature variation is one of the factors in the mangrove ecosystem that can affect the characteristics and distribution and abundance of flora and fauna [18].
Secondary metabolites include tannin content, sugars, free amino acids, and proteins found in mangrove leaves [19]. Tannins also play a role in enhancing growth, development, and reproduction, and act as a defense against various biotic and abiotic stresses [20].
Mangrove leaf litter has important significance as a contributor of nutrients and energy sources in the mangrove ecosystem [22]. The difference in the amount of litter can affect productivity, soil fertility, soil moisture, density, seasons, and stands. Mangrove litter usually shows seasonal variation influenced by several factors including geographical location, rainfall, temperature, solar radiation, wind, nutrient concentration, substrate type, and freshwater flow [23]. Leaves, twigs, fruits, and flowers of mangroves that fall are defined as the shedding of vegetative and reproductive structures caused by factors such as age, rain, and wind. High levels of organic carbon can be demonstrated by productivity with larger quantities. High salinity has negative consequences for metabolic processes and the growth rate and productivity of trees [24], species composition, phenological patterns (timing of flowering and fruiting), and mangrove productivity [25].
Litterfall accounts for approximately 30% of net primary productivity in mangrove ecosystems. The 30% estimate provides an overview and can be used for environmental stability assessments in mangrove ecosystems [26,27]. Litter production can be accepted as a primary pathway for nutrient enrichment in the ecosystem [28], showing a tendency to vary with geographical location [29] and seasons [30]. Mangroves located in tropical areas and at lower latitudes show higher litter production than those in higher latitudes [31,32]. Litter production in mangrove ecosystems typically exhibits seasonal variation due to several factors mainly related to chemical and physical environmental conditions (temperature, solar radiation, rainfall, substrate type, nutrient concentration, freshwater availability) [23].
The influence of nutrient influx, geomorphology, and sediment texture affects the production of mangrove litter in small areas [33]. Maximum litter production can occur during the rainy season in those areas [34,35]. Salinity varies compared to temperature and rainfall. Increased litter production can be marked by increased salinity and vice versa [36]. The tendency for increased salinity can lead to litter production in mangrove forests [37].
Associations can occur in response to environmental changes impacting local surroundings, monitoring levels of ecosystem disturbance, and levels of species diversity within an ecosystem. Practically, this involves individual aspects (health status, population size) or ecosystem aspects (primary productivity, nitrogen cycles, species diversity [38]. Gastropod criteria can be used as an association or relationship with productivity. Among others, gastropods can achieve very high species diversity in mangrove ecosystems [39], are dominant and prominent in mangrove ecosystem systems, and occupy various ecological niches with low mortality [40].
The presence of mollusks in the mangrove ecosystem occupies all levels of the food chain as predators, herbivores, detritivores, and filter feeders [41]. The high growth and survival ability of gastropods and their tolerance to various environmental conditions make them relatively sedentary. Gastropods can tolerate various environmental conditions [42]. Current research on gastropods includes studies on gastropods found in mangrove ecosystems regarding heavy metal pollution [43], environmental conditions [44], ecological cycles [45], and biodiversity [46].
5. Conclusions
The relationship between mangrove density and sediment organic matter content has a significant impact on the abundance of gastropods. The composition and abundance of gastropod species at the locations show differences among stations. Factors that influence include habitat characteristics and environmental conditions such as vegetation, sediment type, temperature, and salinity. Gastropods have a relationship with the productivity of mangrove ecosystems. The productivity of mangroves in the northern coastal region of East Java has a very close relationship with the abundance and instant biomass of gastropods, meaning that the higher the productivity of mangroves, the more diverse the size of gastropods will be, generating energy potential for gastropods.
References
- Nagelkerken, I.; Blaber, S.J.M.; Bouillon, S.; Green, P.; Haywood, M.; Kirton, L.G.; Meynecke, J.O.; Pawlik, J.; Penrose, H.M.; Sasekumar, A.; Somerfield, P.J. The habitat function of mangroves for terrestrial and marine fauna: A review. Aquat. Bot. 2008, 89, 155–185. [Google Scholar] [CrossRef]
- Kathiresan, K.; Bingham, B.L. Biology of mangroves and mangrove ecosystems. Adv. Mar. Bio. 2001, 40, 81–251. [Google Scholar]
- Hutchison, J.; Spalding, M.; zu Ermgassen, P. The Role of Mangroves in Fisheries Enhancement. The Nature Conservancy and Wetlands International. 2014. [Google Scholar]
- Rajpar, M.N.; Zakaria, M. Mangrove Fauna of Asia. In: Faridah-Hanum I, Latiff A, Hakem KR, Ozturk M (eds). Mangrove Ecosystems of Asia: Status, Challenges and Management Strategies. Springer, London. 2014; 153–197. [Google Scholar]
- Kon, K.; Kurokura, H.; Tongnunui, P. Do mangrove root structures function to shelter benthic macrofauna from predators? J. Exp. Mar. Bio. Ecol. 2009, 370, 171–180. [Google Scholar]
- Whitfield, A.K. The role of seagrass meadows, mangrove forests, salt marshes and reed beds as nursery areas and food sources for fishes in estuaries. Rev Fish Biol Fish. 2017, 27, 75–110. [Google Scholar] [CrossRef]
- Buhmann, A.; Papenbrock, J. Biofiltering of aquaculture effluents by halophytic plants: Basic principles, current uses and future perspectives. Environ Exp Bot. 2013, 92, 122–133. [Google Scholar]
- Cochard, R. Coastal water pollution and its potential mitigation by vegetated wetlands: An overview of issues in Southeast Asia. In: Shivakoti GP, Pradhan U, Helmi (eds). Redefining Diversity and Dynamics of Natural Resources Management in Asia. 2017, 1.
- Rog, S.M.; Clarke, R.H.; Cook, C.N. More than marine: Revealing the critical importance of mangrove ecosystems for terrestrial vertebrates. Divers Distrib. 2017, 23, 221–230. [Google Scholar] [CrossRef]
- Kabir, M.; Abolfathi, M.; Hajimoradloo, A.; Zahedi, S.; Kathiresan, K.; Goli, S. Effect of mangroves on distribution, diversity and abundance of molluscs in mangrove ecosystem: A review. AACL Bioflux 2014, 7, 286–300. [Google Scholar]
- Hasidu, L.O.A.F.; Jamili, J.; Kharisma, G.N.; Prasetya, A.; Maharani, M.; Riska, R.; Rudia, L.O.A.P.; Ibrahim, A.F.; Mubarak, A.A.; Muhsafaat, L.O.; Anzani, L. Diversity of mollusks (bivalves and gastropods) in degraded mangrove ecosystems of Kolaka District, Southeast Sulawesi, Indonesia. Biodiversitas. 2020, 21, 5884–5892. [Google Scholar]
- Ong, J.; Gong, W.; Wong, C. Allometry and partitioning of the mangrove, Rhizophora apiculata. Forest. Ecolog. Manag. 2004, 188, 395–408. [Google Scholar] [CrossRef]
- Imamsyah, A.; Arthana, I.W.; Astarini, I.A. The influence of physicochemical environment on the distribution and abundance of mangrove gastropods in Ngurah Rai Forest Park Bali, Indonesia. Biodiversitas. 2020, 21, 3178–3188. [Google Scholar] [CrossRef]
- Ardiyanshah, F.; Susanti, L.; Budiawan, H. Keanekaragaman Jenis dan Similaritas Gastropoda Mangrove Pada TN Baluran dan TN Alas Purwo. BIOSFER. J.Bio. & Pend.Bio. 2023, 8, 67–74. [Google Scholar]
- Ariyanto, D.; Bengen, D.G.; Prartono, T.; Wardianto, Y. Distribution of Batillaria Zonalis (Mollusca: Gastropoda) on Avicennia Marina (Forsk) Vierh in The Coast of Banggi, Rembang, Centra Java. Omni Akuatika. 2018, 14, 10–17. [Google Scholar] [CrossRef]
- Salim, G.; Rachmawani, D.; Agustianisa, R. Hubungan kerapatan mangrove dengan gastropoda di Kawasan Konservasi Mangrove dan Bekantan (KKMB) Kota Tarakan. J Harpondon Borneo. 2019, 12, 9–15. [Google Scholar]
- Pribadi, R. Retno. H.; Chrisna. A.S. Komposisi Jenis dan Distribusi Gastropoda di Kawasan Hutan Mangrove Segara Anakan Cilacap. J. Kel. 2009, 14, 102–111. [Google Scholar]
- Soundarapandian, P.; Premkumar, T.; Dinakaran, G.K. Studies on the hysico-chemical characteristic and nutrients in the Uppanar estuary of Cuddalore, South east coast of India. Curr Res. J. Biol. Sci. 2009, 1, 102–105. [Google Scholar]
- Yan, L.; Guizhu, C. Physiological Adaptability of Three Mangrove Species to Salt Stress. Acta Ecol. Sinica. 2007, 27, 2208–2214. [Google Scholar] [CrossRef]
- Achakzai, A.K.K.; Achakzai, P.; Masood, A.; Kayani, S.A.; Tareen, R.B. Response Of Plant Parts And Age On The Distribution Of Secondary Metabolites On Plants Found In Quetta Pakistan. J. Bot 2009, 41, 2129–2135. [Google Scholar]
- Reef, R.; Ilka, C.; Feller, I.C.; Catherine, E.; Lovelock, C.E. Nutrition of Mangroves. Tree Physiol. 2010, 30, 1148–1160. [Google Scholar] [CrossRef] [PubMed]
- Wafar, S.; Untawale, A.G.; Wafar, M. Litter fall and energy flux in a mangrove ecosystem. Estuar. Coast. Shelf. Sci. 1997, 44, 111–124. [Google Scholar] [CrossRef]
- Twilley R R, Day JW. 1999. The productivity and nutrient cycling of mangrove ecosystem. In: Yáñez-Aranciba, A., Lara-Dominguez, A. L. (Eds.). Ecosistemas de Manglar en America Tropical. Instituto de Ecologia, A.C. México, UICN/ORMA, Costa Rica, NOAA/NMFS Silver Springer MD USA, pp. 127–151.
- Cintron, G. A.E. Lugo, D.J.; Pool, G. Morris, Mangrove of arid environments in Puerto Rico & adjacent isl&s. Biotropica 1978, 10, 110–121. [Google Scholar]
- Gilman, E.L.; Ellison, J.; Duke, D.C.; Field, C. Threats to mangroves from climate change and adaptation options: A review. Aquat. Bot. 2008, 89, 237–250. [Google Scholar] [CrossRef]
- Alongi, D.M.; Clough, B.F.; Robertson, A.I. Nutrient-use efficiency in arid-zone forests of the mangroves Rhizophora stylosa and Avicennia marina. Aquat. Bot. 2005, 82, 121–131. [Google Scholar]
- Bouillon, S.; Borges, A.V.; Castaneda-Moya, E.; Diele, K.; Dittmar, T.; Duke, N.C.; Kirstensen, E.; Lee, S.Y.; Marchand, C. ; Middelburg. J.; Rivera-Monroy, V.H.; Smith III, T.J.; Twilley, R.R. Mangrove production and carbon sinks: a revision of global budget estimates. Global Biogeochem Cy. 2008; 22. [Google Scholar]
- Tam, N.F.Y.; Wong, Y.S.; Lan, C.Y.; Wang, L.N. Litter production and decomposition in a subtropical mangrove swamp receiving wastewater. J. Exp. Mar.Biol. Ecol. 1998, 226, 1–18. [Google Scholar]
- Woodroffe, C.D.; Bardsley, K.N.; Ward, P.J.; Hanley, J.R. Production of Mangrove Litter in a Macrotidal Embayment, Darwin Harbour, North Australia. Estuar. Coast. Shelf. Sci. 1988, 26, 581–598. [Google Scholar] [CrossRef]
- Bosire, J.O.; Dahdouh-Guebas, F.; Kairo, J.G.; Kazungu, J.; Dehairs, F.; Koedam, N. Litter degradation and CN dynamics in reforested mangrove plantations at Gazi Bay, Kenya. Biol Conserv. 2005, 126, 287–295. [Google Scholar]
- Komiyama, A.; Ong, J.E.; Poungparn, S. Allometry, biomass, and productivity of mangrove forests: a review. Aquat. Bot. 2008, 89, 128–137. [Google Scholar] [CrossRef]
- Bernini, E.; Rezende, E. Litterfall in a mangrove in Southeast Brazil. Pan-Am. J. Aquat. Sci. 2010, 5, 508–519. [Google Scholar]
- Coronado-Molina, C.; Alvarez-Guillen, H.; Day, J.W.; Reyes, E.; Perez, B.C.; VeraHerrera, F.; Twilley, R. Litterfall dynamics in carbonate and deltaic mangrove ecosystems in the Gulf of Mexico. Wetl. Ecol. Manag. 2012, 20, 123–136. [Google Scholar] [CrossRef]
- Arreola-Lazarrga, J.A.; Flores-Verdugo, F.J.; Ortega-Rubio, A. Structure and litter fall of mangrove stand on the Gulf of California, Mexico. Aquat. Bot. 2004, 79, 137–143. [Google Scholar] [CrossRef]
- Sanchez-Andres, R.; Sanchez-Carrillo, S.; Alatorre, L.C.; Cirujano, S.; Álvarez-Cobelas, M. Litterfall dynamics and nutrient decomposition of arid mangroves in the Gulf of California: their role sustaining ecosystem hetero-trophy. Estuar. Coast. Shelf. Sci. 2010, 89, 191–199. [Google Scholar] [CrossRef]
- Rani, V.; Sreelekshmi, S.; Preethy, C.M.; BijoyNandan, S. Phenology and litterfall dynamics structuring Ecosystem productivity in a tropical mangrove stand on South West coast of India. Reg. Studies Mar. Sci. 2016, 8, 400–407. [Google Scholar]
- Ghosh, R.; Banerjee, K. Inter-relationship between physico-chemical variables and litter production in mangroves of Indian sundarbans. J. Mar. Sci. : Res. Develop. 2013, 11, 001. [Google Scholar] [CrossRef]
- Burger, J.; Mayer, H.J.; Greenberg, M.; Powers, C.W.; Volz, C.D.; Gochfeld, M. Conceptual Site Models as a Tool in Evaluating Ecological Health: The Case of the Department of Energy'S Amchitka Island Nuclear Test Site. J. Toxicol. Environ. Health. 2006, 69, 1217–1238. [Google Scholar] [CrossRef] [PubMed]
- Camilleri, J.C. Leaf-litter processing by invertebrates in a mangrove forest in Queensland. Mar. Biol. 1992, 114, 139–145. [Google Scholar] [CrossRef]
- Cantera, J.R.; Thomassom, B.A.; Arnaud, P.M. Faunal zonation and assemblages in the Pacific Colombian mangroves. Hydrobiologia. 1994, 13, 17–33. [Google Scholar]
- Cannicci, S.; Burrows, D.; Fratini, S.; Smith, T.J.; Offenberg, J.; Dahdouh-Guebas, F. Faunal impact on vegetation structure and ecosystem function in mangrove forests: A review. Aquat. Bot. 2008, 89, 186–200. [Google Scholar] [CrossRef]
- Marsden, I.D.; Baharuddin, N. Gastropod growth and survival as bioindicators of stress associated with high nutrients in the intertidal of a shallow temperate estuary. Estuar. Coast. Shelf. Sci. 2015, 156, 175–185. [Google Scholar] [CrossRef]
- Gupta, S.K.; Singh, J. Evaluation of mollusc as sensitive indicatior of heavy metal pollution in aquatic system: A Review. J. Env. Manag. Sustain. Develop. 2011, 2, 49–57. [Google Scholar]
- Tablado, A.; López; Gappa, J. Morphometric diversity of the pulmonate limpet Siphonaria lessoni in different coastal environments. Sci. Mar. 2001, 65, 33–41. [Google Scholar] [CrossRef]
- Reid, D.G.; Dyal, P.; Lozouet, P.; Glaubrecht, M.; Williams, ST. Mudwhelks and mangroves: The evolutionary history of an ecological association (Gastropoda: Potamididae). Mol. Phylogenetics Evol. 2008, 47, 680–699. [Google Scholar] [CrossRef] [PubMed]
- Khade, S.N. Mangrove Associate gastropoda diversity of Turbadi, Raigad, coast of India. Int. J. Zool. Studies. 2017, 2, 17–19. [Google Scholar]
- Kathiresan, K. , Bingham, B.L. Biology of Mangroves and Mangrove Ecosystems. Advances in Marine Biology, 2001, pp. 81–251.
Figure 4.
PCA on the distribution of gastropods and environmental parameters.
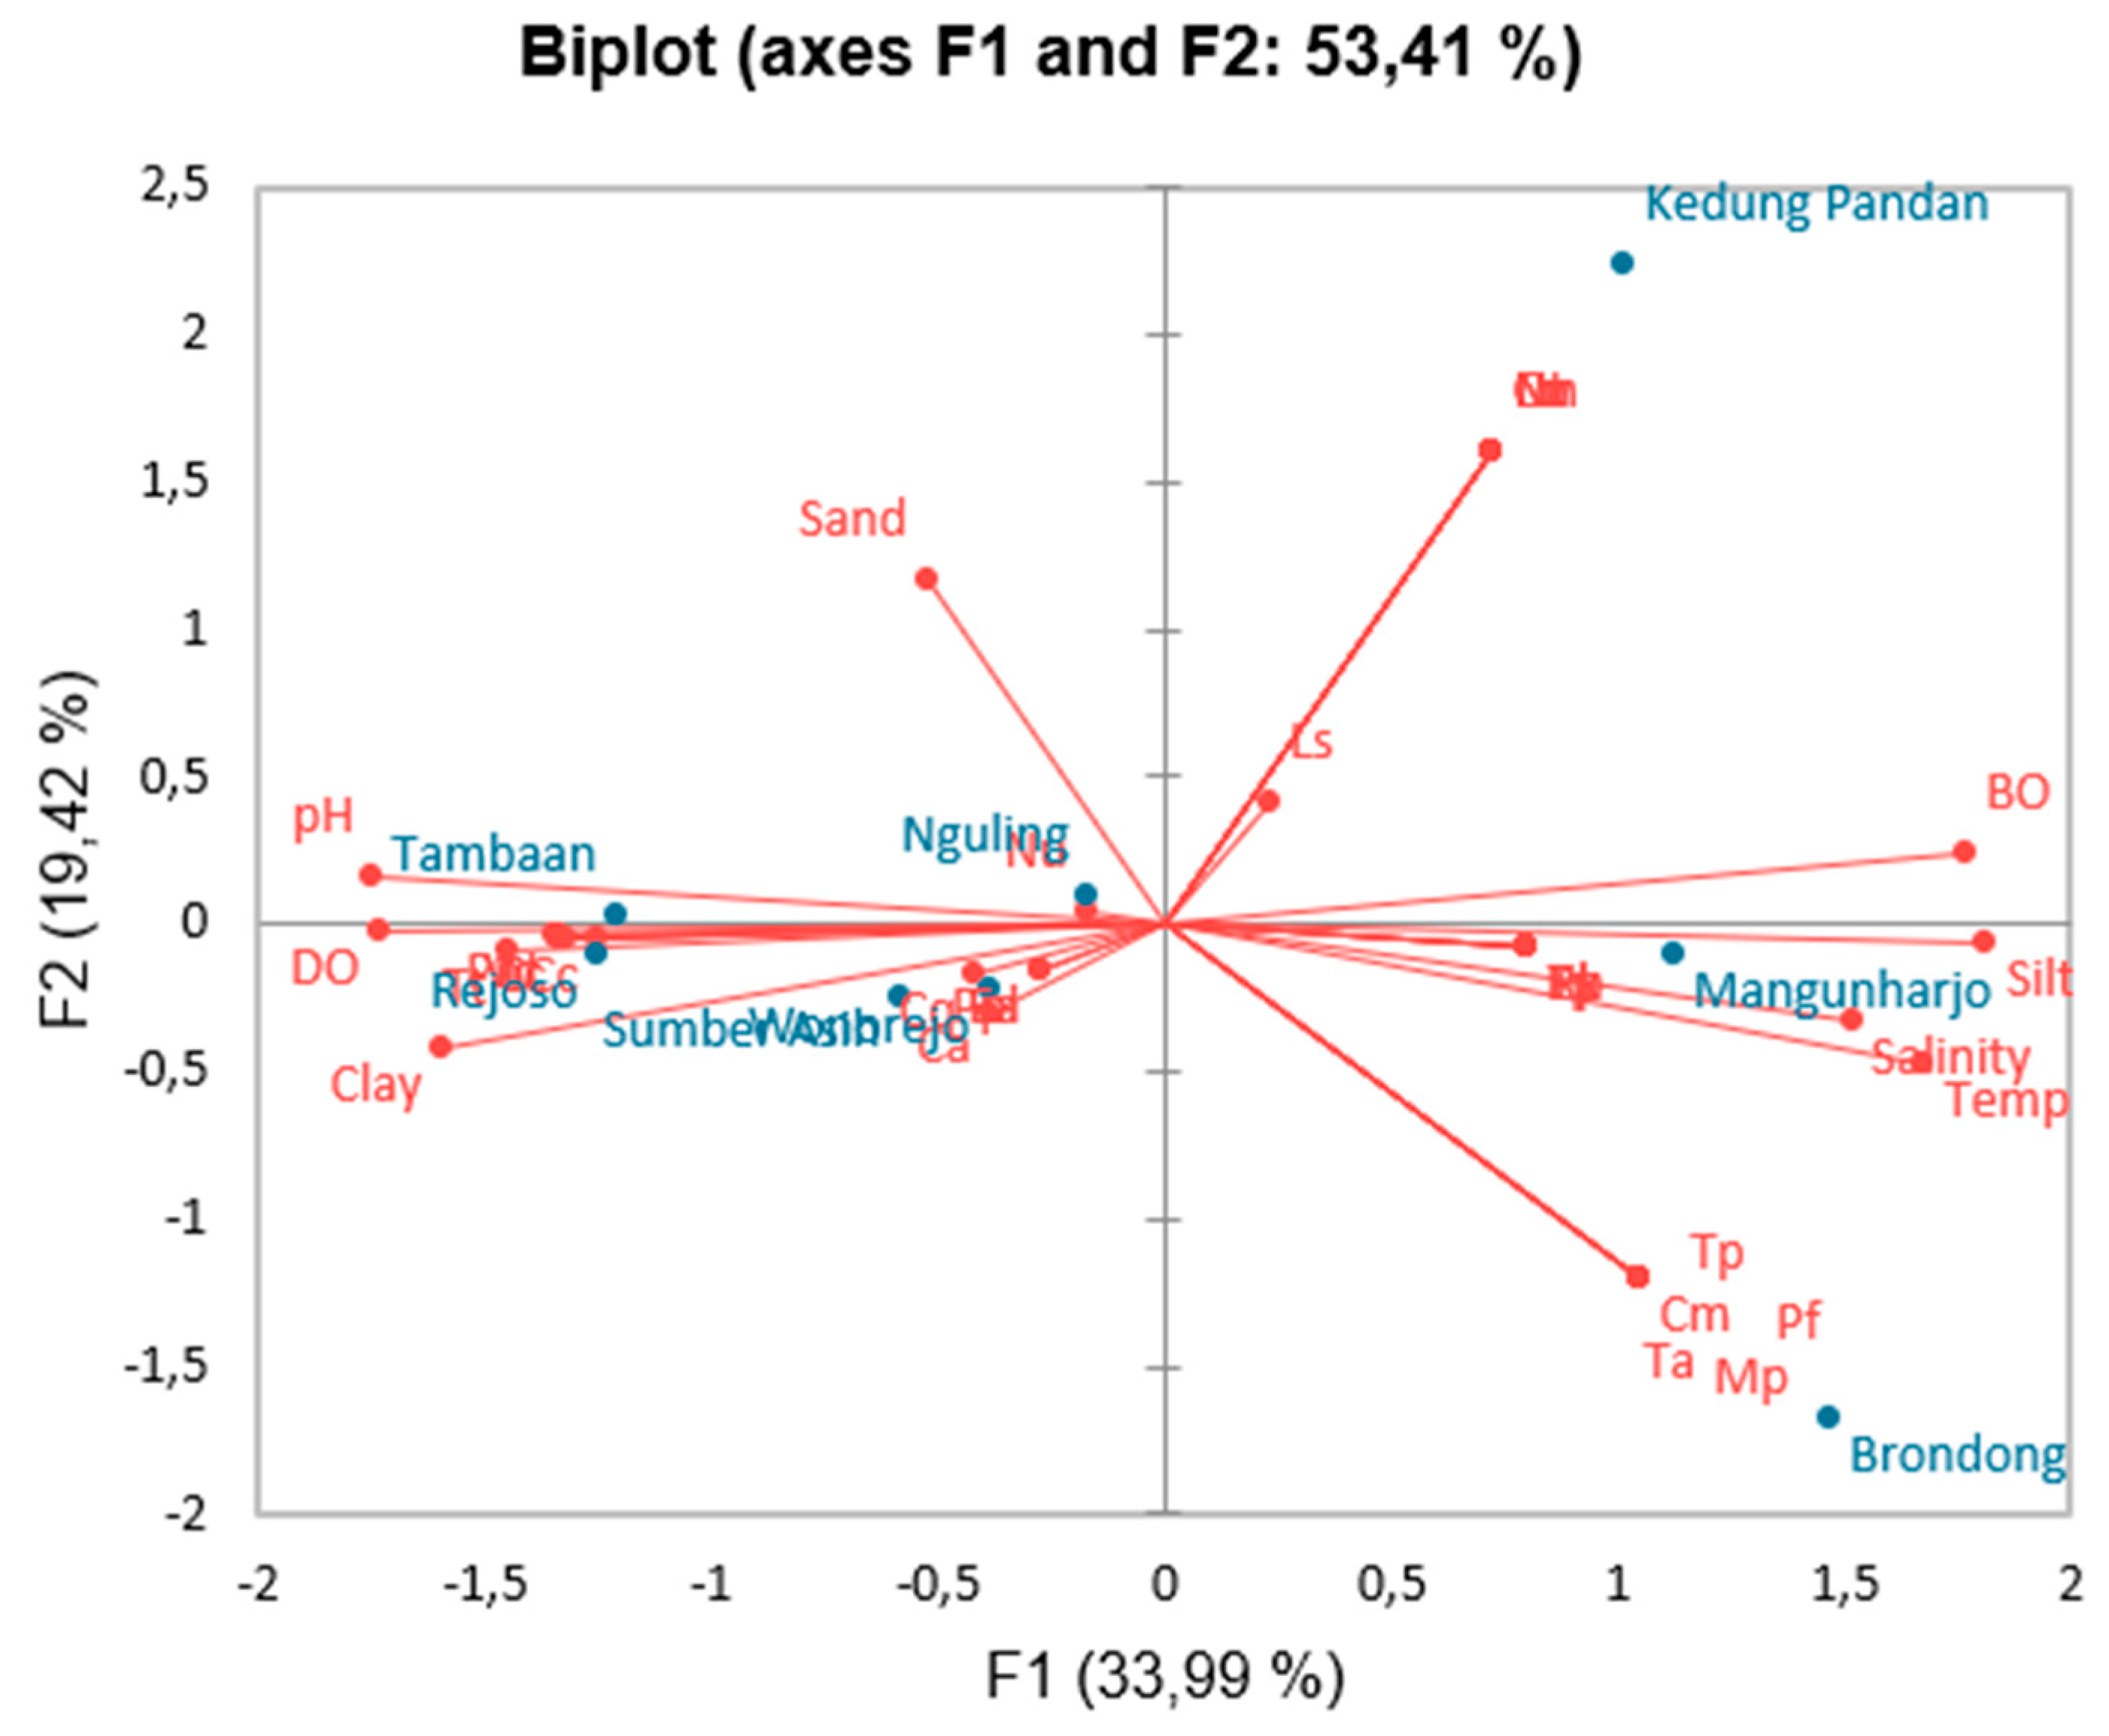
Figure 5.
Correspondence Analysis (CA) between gastropod and mangrove species based on the station at axis 1 (F1) and axis 2 (F2).
Figure 5.
Correspondence Analysis (CA) between gastropod and mangrove species based on the station at axis 1 (F1) and axis 2 (F2).
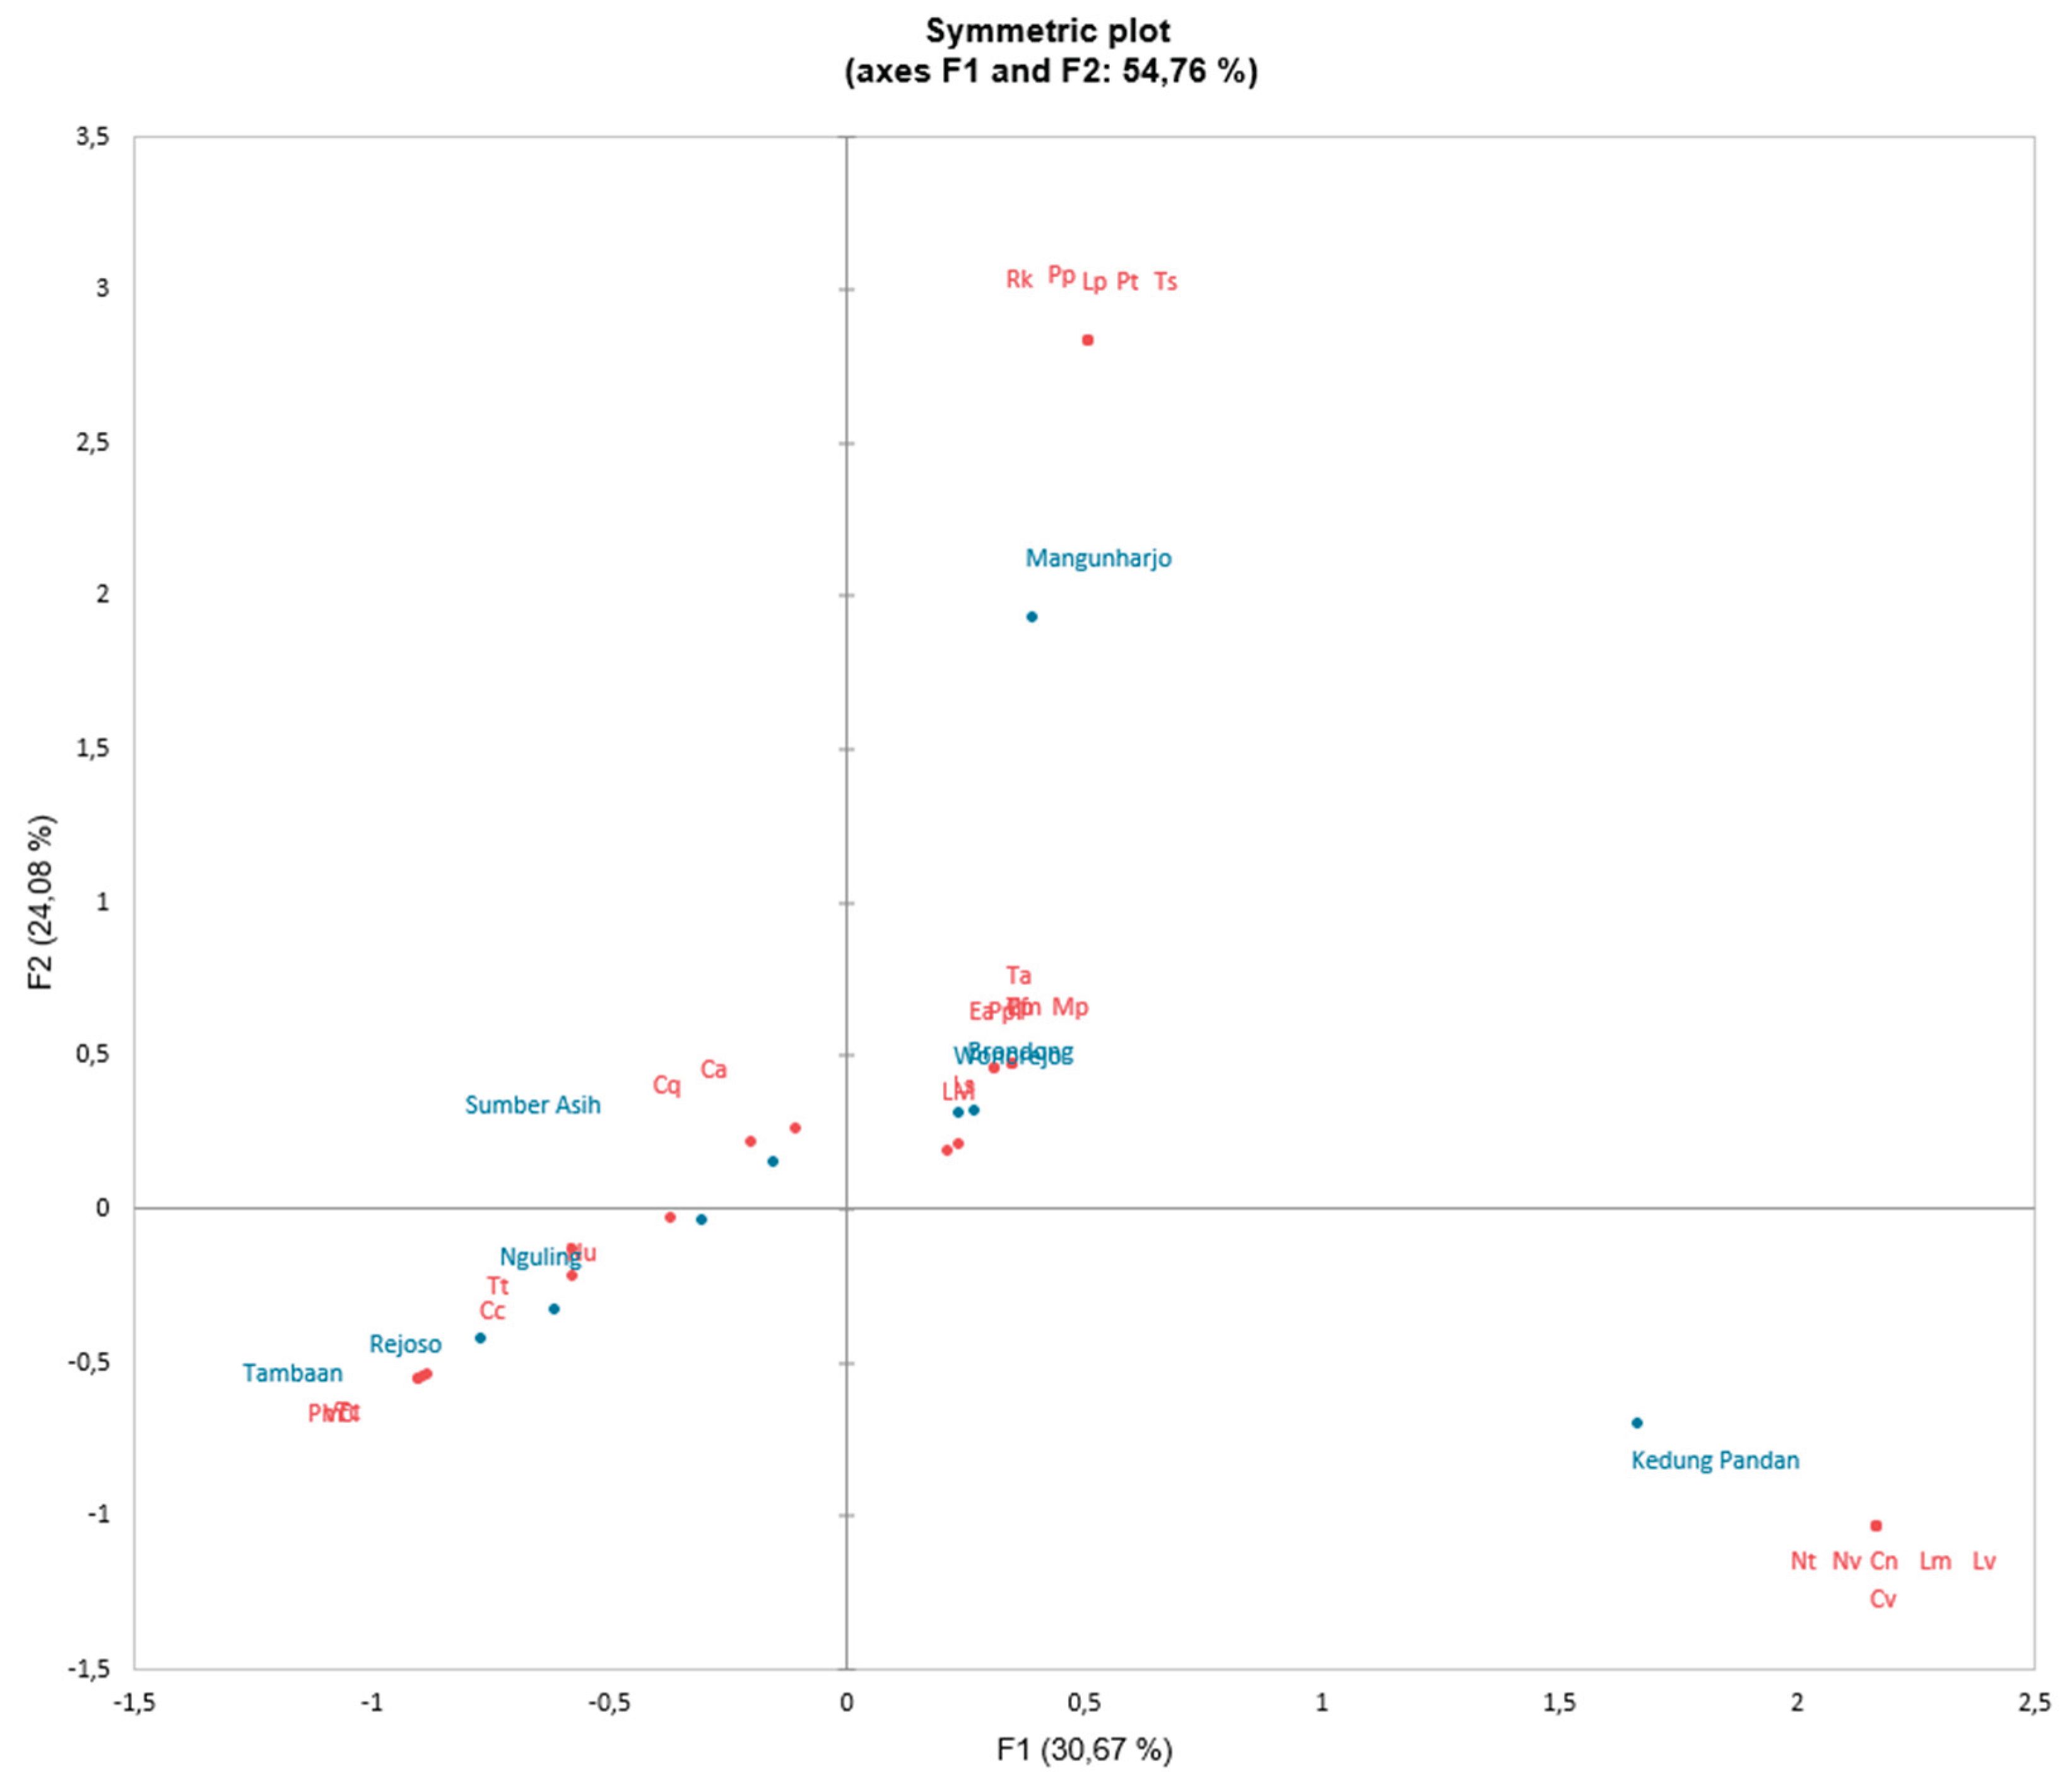

Table 1.
Production of mangrove components (g/m2) includes leaves, branches, and flowers.
| Species | Twig | Leave | Flower | Fruit |
|---|---|---|---|---|
| Mangunharjo | ||||
| Rhizopora Mucronata | 4,79 | 69,89 | 3,00 | 0,86 |
| Avicenia alba | 5,23 | 30,33 | 2,51 | 0,66 |
| Sumber Asih | ||||
| Rhizopora Mucronata | 4,46 | 76,24 | 2,46 | 0,46 |
| Rhizopora apiculata | 4,84 | 30,00 | 2,20 | 0,54 |
| Avicenia mariana | 13,94 | 34,20 | 4,61 | 2,10 |
| Bruguiera gymnorhiza | 4,57 | 15,16 | 1,93 | 0,40 |
| Nguling | ||||
| Rhizopora Mucronata | 4,86 | 67,76 | 2,46 | 0,46 |
| Rhizopora apiculata | 4,79 | 29,79 | 2,37 | 0,61 |
| Avicenia mariana | 12,43 | 34,76 | 4,61 | 2,10 |
| Tambaan | ||||
| Rhizopora Mucronata | 9,20 | 19,27 | 9,30 | 9,67 |
| Avicenia officinalis | 8,24 | 17,40 | 6,87 | 3,34 |
| Rejoso | ||||
| Rhizopora Mucronata | 4,86 | 76,24 | 2,46 | 0,46 |
| Avicenia officinalis | 4,73 | 31,09 | 2,30 | 0,59 |
| Rhizopora apiculata | 13,94 | 34,20 | 4,61 | 2,10 |
| Kedung Pandan | ||||
| Avicenia marina | 4,86 | 76,24 | 2,46 | 0,46 |
| Sonneratia alba | 4,94 | 32,29 | 2,19 | 0,59 |
| Sonneratia caseolaris | 13,94 | 34,20 | 4,61 | 2,10 |
| Avicenia alba | 4,57 | 15,16 | 1,93 | 0,40 |
| Wonorejo | ||||
| Sonneratia alba | 4,66 | 71,33 | 2,46 | 0,46 |
| Avicenia alba | 5,00 | 34,13 | 2,20 | 0,49 |
| Avicenia marina | 13,94 | 36,74 | 4,61 | 2,10 |
| Brondong | ||||
| Rhizopora apiculata | 4,87 | 74,41 | 2,80 | 0,46 |
| Bruguera gymnoriza | 5,03 | 30,43 | 2,27 | 0,49 |
| Avicenia alba | 14,47 | 34,26 | 4,61 | 2,10 |
Table 2.
The content of tannins, phosphorus, total sugars, and total amino acids in various types of mangroves.
Table 2.
The content of tannins, phosphorus, total sugars, and total amino acids in various types of mangroves.
| Mangrove | Tanin (mg/g) | Total Sugar (mg/g) | Phosphorus (mg/g) | Amino Acid (mg/g) | ||||
|---|---|---|---|---|---|---|---|---|
| Study | comparison | Study | comparison | Study | comparison | Study | comparison | |
| Mangunharjo | ||||||||
| Rhizophora mucronata | 4,39 | 1,231-5,71 | 0,44 | 0,06-1,231 | 17,08 | 0,98-4,93 | 4,52 | 5,71-9,49 |
| Avicenia alba | 0,85 | 1,5 | 0,9 | 5,65 | 27,18 | 25,85 | 5,55 | 4,73 |
| Sumber Asih | ||||||||
| Rhizophora mucronata | 4,43 | 1,231-5,71 | 0,49 | 0,06-1,231 | 17,15 | 0,98-4,93 | 4,63 | 5,71-9,49 |
| Avicenia mariana | 0,89 | 3,73 | 0,96 | 0,85-0,99 | 27,29 | 31,71±6,56 | 5,59 | 1,9 |
| Bruguiera gymnorhiza | 4,05 | 3,03 | 0,69 | 2,93 | 4,17 | 3,28 | 1,06 | 1,57 |
| Rhizopora apiculata | 1,07 | 0,4-1,23 | 0,35 | 0,3 | 4,64 | 7,12 | 6,05 | 3,2 |
| Nguling | ||||||||
| Rhizophora mucronata | 4,51 | 1,231-5,71 | 0,41 | 0,06-1,231 | 17,21 | 0,98-4,93 | 4,58 | 5,71-9,49 |
| Avicenia mariana | 0,93 | 3,73 | 0,93 | 0,85-0,99 | 27,25 | 31,71±6,56 | 5,52 | 1,9 |
| Rhizopora apiculata | 1,09 | 0,4-1,23 | 0,38 | 0,3 | 4,72 | 7,12 | 5,97 | 3,2 |
| Tambaan | ||||||||
| Rhizophora mucronata | 4,51 | 1,231-5,71 | 0,41 | 0,06-1,231 | 17,21 | 0,98-4,93 | 4,58 | 5,71-9,49 |
| Avicenia officinalis | 3,66 | 4,56 | 0,87 | 2,89 | 28,36 | 27,96 | 5,57 | 4,87 |
| Rejoso | ||||||||
| Rhizophora mucronata | 4,42 | 1,231-5,71 | 0,51 | 0,06-1,231 | 17,12 | 0,98-4,93 | 4,51 | 5,71-9,49 |
| Avicenia marina | 0,87 | 3,73 | 0,88 | 0,85-0,99 | 27,28 | 31,71±6,56 | 5,53 | 1,9 |
| Rhizopora apiculata | 1,09 | 0,4-1,23 | 0,31 | 0,3 | 4,72 | 7,12 | 6,07 | 3,2 |
| Kedung Pandan | ||||||||
| Avicenia alba | 4,71 | 1,5 | 0,67 | 5,65 | 17,15 | 25,85 | 4,53 | 4,73 |
| Avicenia marina | 0,89 | 3,73 | 0,91 | 0,85-0,99 | 27,19 | 31,71±6,56 | 5,59 | 1,9 |
| Sonneratia alba | 0,87 | 7,60-8,17 | 0,81 | 0,05-11 | 27,32 | 6 | 5,61 | 4,7 |
| Sonneratia caseolaris | 1,29 | 0,7 | 0,36 | 0,62 | 4,76 | 3,56 | 6,09 | 7,12 |
| Wonorejo | ||||||||
| Avicenia alba | 4,67 | 1,5 | 0,62 | 5,65 | 16,97 | 25,85 | 4,55 | 4,73 |
| Rhizophora apiculata | 1,01 | 0,4-1,23 | 0,38 | 0,3 | 4,68 | 7,12 | 6,07 | 3,2 |
| Rhizophora mucronata | 4,35 | 1,231-5,71 | 0,49 | 0,06-1,231 | 17,15 | 0,98-4,93 | 4,59 | 5,71-9,49 |
| Brondong | ||||||||
| Avicenia alba | 4,67 | 1,5 | 0,62 | 5,65 | 16,97 | 25,85 | 4,55 | 4,73 |
| Rhizophora apiculata | 1,01 | 0,4-1,23 | 0,38 | 0,3 | 4,68 | 7,12 | 6,07 | 3,2 |
| Rhizophora mucronata | 4,35 | 1,231-5,71 | 0,49 | 0,06-1,231 | 17,15 | 0,98-4,93 | 4,59 | 5,71-9,49 |
| Bruguiera gymnorhiza | 5,92 | 3,03 | 0,52 | 2,93 | 8,45 | 3,28 | 5,34 | 1,57 |
| Bruguiera parviflora | 5,82 | 6,85 | 0,57 | 1,87 | 8,49 | 4,65 | 5,45 | 3,76 |
Table 3.
Types of Substrates.
| Location | Sand | Silt | Clay | Substrate Type |
|---|---|---|---|---|
| Mangunharjo | 13 | 64 | 23 | Silt Loam |
| Sumber Asih | 32 | 48 | 20 | Loam |
| Nguling | 68 | 22 | 10 | Sandy Loam |
| Tambaan | 35 | 34 | 29 | Clay Loam |
| Rejoso | 39 | 40 | 21 | Loam |
| Kedung Pandan | 35 | 30 | 35 | ClayLoam |
| Wonorejo | 21 | 56 | 23 | Silt Loam |
| Brondong | 42 | 44 | 14 | Loam |
Table 4.
Water parameters.
| Parameter | Zone | |||||||
|---|---|---|---|---|---|---|---|---|
| Mangunharjo | Sumberasih | Nguling | Tambaan | Rejoso | Kd. Pandan | Wonorejo | Brondong | |
| Temperature (oC) | 30,34±0,19 | 31,31±0,48 | 29,95±0,28 | 30,27±0,36 | 30,24±0,42 | 29,95±0,28 | 31,38±0,62 | 32,53±0,95 |
| Salinity (ppt) | 29,61±0,18 | 26,17±0,19 | 30,22±0,57 | 24,88±0,41 | 26,47±0,43 | 26,22±0,57 | 21,46±2,78 | 27,7±0,07 |
| pH | 7,64±0,1 | 7,53±0,11 | 7,5±0,25 | 7,77±0,02 | 7,54±0,11 | 7,5±0,25 | 7,74±0,15 | 7,57±0,04 |
| DO | 6,37±0,15 | 6,3±0,42 | 6,92±0,34 | 7,02±0,09 | 7,59±0,38 | 6,92±0,34 | 7,55±0,97 | 5,56±0,13 |
Table 5.
Gastropods species checklist of each mangrove zone in the East Java Coast, Indonesia.
| Spesies | Probolinggo | Pasuruan | Sidoarjo | Surabaya | Lamongan |
|---|---|---|---|---|---|
| Canarium labiatum | - | + | - | - | - |
| Cassidula aurisfelis | + | - | - | + | + |
| Cassidula mustelina | - | - | - | - | + |
| Cassidula nucleus | - | - | + | - | - |
| Cassidula vespertilionis | - | - | + | - | - |
| Cerithidae quadrata | + | - | - | - | - |
| Cerithidea cingulata | + | + | - | - | - |
| Ellobium aurisjudae | - | - | - | + | - |
| Littoraria melanostoma | - | - | + | - | - |
| Littoraria vespacea | - | - | + | - | - |
| Littorina pindato | + | - | - | - | - |
| Littorina scabra | + | - | + | + | + |
| Monoplex pilearis | - | - | - | - | + |
| Natica unifasciata | + | - | - | - | - |
| Neritina turrita | - | - | + | - | - |
| Neritina violacea | - | - | + | - | - |
| Penion maximus | - | + | - | - | - |
| Polinices flemingianus | - | - | - | - | + |
| Polinices tumidus | + | - | - | - | - |
| Pseudostomatella papyracea | + | - | - | - | - |
| Pythia plicata | - | - | - | + | - |
| Rhinoclavis kochi | + | - | - | - | - |
| Telescopium telescopium | + | + | + | + | + |
| Terebralia palustris | - | - | - | - | + |
| Terebralia sulcata | + | - | - | - | - |
| Turbo argyrostoma | - | - | - | - | + |
| Turbo chrysostomus | - | + | - | - | - |
| Volegalea cochlidium | - | + | - | - | - |
| Total | 11 | 6 | 8 | 5 | 8 |
Table 6.
Overall mangrove gastropod composition in the East Java Coast, Indonesia.
| Species | Overall (%) | ||
|---|---|---|---|
| Leaf | Trunk | Sediment | |
| Canarium labiatum | 0 | 0 | 31,0 |
| Cassidula aurifelis | 0 | 32,6 | 0 |
| Cassidula mustelina | 0 | 4,0 | 0 |
| Cassidula nucleus | 0 | 0,2 | 0 |
| Cassidula vespertilionis | 1 | 2,6 | 0 |
| Cerithidea cingulata | 0 | 18,4 | 69,8 |
| Cerithidea quadrata | 1,3 | 6,5 | 11,8 |
| Ellobium aurisjudae | 0 | 4,1 | 0 |
| Littoraria melanostoma | 52,2 | 0,5 | 0 |
| Littoraria scabra | 26,8 | 21 | 0 |
| Littoraria vespacea | 0,4 | 0 | 0 |
| Littorina pintado | 1,4 | 8,2 | 11 |
| Monoplex pilearis | 0 | 0 | 0,3 |
| Natica unifasciata | 0 | 3,9 | 1,1 |
| Neritina turrita | 4,2 | 0,1 | 0 |
| Neritina violacea | 2,8 | 62,4 | 0 |
| Penion maximus | 0 | 0,0 | 22,1 |
| Polinices flemingianus | 0 | 0 | 0,2 |
| Polinices tumidus | 0,4 | 0,5 | 0,6 |
| Pseudostomatella papyracea | 0 | 0 | 0,9 |
| Pythia plicata | 11,7 | 0,2 | 0 |
| Rhinoclavis kochi | 0 | 0,5 | 0,6 |
| Telescopium telescopium | 0 | 0 | 37,6 |
| Terebralia palustris | 0 | 0 | 0,7 |
| Terebralia sulcata | 0,1 | 0,4 | 0,6 |
| Turbo argyrostoma | 0 | 0 | 0,5 |
| Turbo chrysostomus | 0 | 2,2 | 8,4 |
| Volegalea cochlidium | 0 | 0 | 15,4 |
Table 7.
Average values and criteria for the Gastropod Diversity Index, Uniformity, and Dominance in The Northern Coastal Mangrove Ecosystem of East Java.
Table 7.
Average values and criteria for the Gastropod Diversity Index, Uniformity, and Dominance in The Northern Coastal Mangrove Ecosystem of East Java.
| Location | Diversity (H') | Uniformity (E) | Dominance (C) |
|---|---|---|---|
| Mangunharjo | 1,192 ± 0,060 | 0,612 ± 0,031 | 0,473 ± 0,169 |
| Sumber Asih | 1,338 ± 0,121 | 0,745 ± 0,067 | 0,294 ± 0,058 |
| Nguling | 1,052 ± 0,073 | 0,759 ± 0,053 | 0,433 ± 0,154 |
| Tambaan | 1,698 ± 0,070 | 0,943 ± 0,043 | 0,198 ± 0,032 |
| Rejoso | 1,750 ± 0,042 | 0,977 ± 0,023 | 0,180 ± 0,015 |
| Kedung Pandan | 1,028 ± 0,127 | 0,494 ± 0,061 | 0,474 ± 0,143 |
| Wonorejo | 1,588 ± 0,028 | 0,986 ± 0,018 | 0,209 ± 0,019 |
| Brondong | 1,912 ± 0,072 | 0,919 ± 0,035 | 0,173 ± 0,030 |
Disclaimer/Publisher’s Note: The statements, opinions and data contained in all publications are solely those of the individual author(s) and contributor(s) and not of MDPI and/or the editor(s). MDPI and/or the editor(s) disclaim responsibility for any injury to people or property resulting from any ideas, methods, instructions or products referred to in the content. |
© 2025 by the authors. Licensee MDPI, Basel, Switzerland. This article is an open access article distributed under the terms and conditions of the Creative Commons Attribution (CC BY) license (http://creativecommons.org/licenses/by/4.0/).
Copyright: This open access article is published under a Creative Commons CC BY 4.0 license, which permit the free download, distribution, and reuse, provided that the author and preprint are cited in any reuse.


