
Submitted:
30 September 2025
Posted:
05 October 2025
You are already at the latest version
Abstract
Pacific sardine is a dynamic population that undergoes natural boom-and-bust cycles. Despite sardines’ ecological and economic importance, the variability that governs population changes remains poorly understood. Understanding the influence of oceanography on the life history, migration, and population dynamics of sardines is important for fishery management. Over the history of the California Current sardine fishery, numerous studies have attempted to explain why the US and Mexican portions of the sardine biomass off the West Coast should be divided into Northern (Cold - NSP) and Southern (Temperate - SSP) subpopulations. Since 2015, a habitat model including a Sea Surface Temperature (SST) threshold has been used to delineate subpopulations. The assessment and management of the NSP is conducted by the US (using an SST threshold of 16.7° C), while that of the SSP is conducted by Mexico (using a threshold of 17°C). Meantime, new population genetics and stock structure studies have found that the reproductive ecology of Pacific sardine reflects a single, panmictic population spread over a wide geographic range and influenced by environmental forcing, suggesting that assumptions regarding the two-subpopulation hypothesis be reconsidered, along with the influence of oceanography on sardine population dynamics. The implications of finding a single sardine population are significant, as this could result in a review of current US fishery management policies and reference points used to set the annual fishing quotas. In this paper we discuss the importance of the California Current’s influence on the population dynamics of sardine, current fishery management, and management implications.
Keywords:
Pacific sardine
; California current
; advection
; recruitment
; environmental forcing
; fishery management
1. Introduction
Pacific sardine is an iconic species and fishery that is renowned for its natural boom-and-bust cycles of abundance [1, 2]. It is difficult to monitor fishes whose distributions vary widely in response to changing environmental conditions [2-4]. Nonetheless, the US sardine fishery has been closed since 2015 due to low biomass estimates. The fishery was declared overfished in 2019 and is now under a strict rebuilding plan [5], in part due to scientific assumptions and management policies that are now under scrutiny.
1.1. The Science vs. Fishery Management
Warming ocean temperatures and a rapidly expanding sardine population triggered federal management of the US sardine fishery beginning in 2000. Initial management considered all of the sardines in US waters to be part of the same population [6], although it has been generally accepted that sardine off the West Coast formed three subpopulations: Northern, Southern, and Gulf of California. According to Zwolinski and Demer [7], “The northern stock migrates to feed as far north as Canada in summer, and returns south, likely offshore, west of 130 W longitude, in late fall and winter (Clark & Janssen, 1945; Zwolinski et al., 2011). The southern stock resides mostly off Baja California (Enciso-Enciso, Nevárez-Martínez, Sánchez-Cárdenas, Salcido-Guevara, et al., 2023) and migrates seasonally, typically synchronously and separately from the northern stock (Félix-Uraga et al., 2004; Smith, 2005), recurrently entering the Southern California Bight (SCB) during the summer and occasionally migrating to waters off Central California (Figure 1; Felin, 1954). The Gulf stock seasonally migrates from the Gulf of California to Southern Baja California in summer, returning to the Gulf in winter (Félix-Uraga et al., 2005).” (Also see [8 and 9]).
Beginning in 2015, in an effort to remove catches and survey abundance estimates of the Southern subpopulation (SSP) from Northern sardine (NSP) stock assessments, a habitat model based on an upper Sea Surface Temperature (SST) threshold of <16.7 °C, chlorophyll a concentration, and sea surface height, was developed to define potential habitat of the NSP [8]. Mexican scientists used SST boundaries for the SSP of >17°–22 °C. A management measure based on the habitat model was applied to the stock assessment model (in addition to existing reference points), and as a result, sardines in Southern California were removed from (i.e., not included in) the Northern sardine stock assessment [10]. Also beginning in 2015, the US directed sardine fishery was closed [11].
In 2020, landings in the Ensenada, Mexico, fishery attributed to the NSP exceeded the US Northern sardine biomass estimate [12, 7]. In the US, this triggered a revision of the habitat model used to apportion Northern from Southern subpopulations [7] as well as a stock structure workshop [13]. The revised multivariate habitat model lowered the SST threshold value for cumulative NSP habitat within an area, shifting the Northern sardine habitat boundary north of Monterey, California. Effectively, this implied that sardines in waters south of Monterey (in the Southern California Bight - SCB) were excluded from NSP stock assessments despite being present year-round, as discussed next.
A 2022-2024 study investigating the seasonal nearshore dynamics of Pacific sardine in California [14, 15] (see Nearshore Dynamics below) documented young sardines in the SCB yearlong, in a wide range of SSTs, corroborating earlier findings [16-22] that the nearshore waters of the SCB appear to be a sustained year-round habitat for young (age 0 and 1) sardines. These findings are at odds with recent assessments of NSP sardines that have claimed very low recruitment. Additionally, new genetic and biological analyses (e.g. [23]) support the concept of a single coastwide sardine population and run counter to existing scientific two-subpopulation hypotheses and management policies.
1.2. Recent Scientific Findings
In recent years, in-depth population genetics and stock structure studies have found no empirical genetic or biological evidence for two subpopulations or stocks of Pacific sardines in the California Current from any of the geographical areas that the population inhabits [23-26 also see 27]. The reproductive ecology of Pacific sardine is reflective of a single, panmictic population spread over a wide geographic range and influenced by environmental conditions. Sardine life history criteria are highly dependent on the environment: “… somatic growth in Pacific sardine is phenotypically plastic at the level of individual fish and varies spatially and temporally in response to environmental conditions and other factors. Reported regional patterns in length-at-age reflect a combination of the migratory behavior of Pacific sardine, ontogenetic shifts in habitat, variable birth dates associated with protracted spawning seasons and regional variations in spawning…” [25].
1.3. Seasonal Geographical Patterns of the California and Alaska Currents’ influence on Pacific Sardines
A key management need of the sardine fishery is consideration of juvenile distribution, schooling behavior, movements and relationships to environmental conditions, i.e. recruitment, beginning with the influence of oceanography and the California Current. The west coast of North America has two major surface currents: the southward flowing California Current and the northward flowing Alaska Current. The separation of the currents is variable, usually occurring off British Columbia (Canada) and the state of Washington (U.S.) [28-30] (Figure 1). While in some decades, Pacific sardines are abundant in the California Current, they are rarely seen in the Alaska Current, which is characterized by temperatures colder than the preferred temperature range, or thermal tolerance, of sardines [31].
An ecological model for sardine with geographical resolution was developed (R. Parrish, unpublished data); it contained nine regional compartments based on natural features of the California Current System (the red polygons in Figure 1 and Figure 2). Monthly vectors of near-surface advection for each model region were derived from monthly advection calculations from the Ocean Surface Currents Simulation (OSCURS) model [31]. (A detailed description of the data and analytical approaches is provided in Appendix A.)
The uniform cross-shore structure in surface transport/advection reflects the large-scale pattern in the California Current (Figure 2).
Advection of larvae is nuanced, influenced by the seasonal variability of environmental forcing. The OSCURS surface transport data show that the 1967-2003 average speed in the core of the California Current off of California was on the order of 17 cm/sec in the spring and summer. At this speed, eggs, larvae and early juvenile stages of sardine in June would be advected alongshore and southwards about 4 degrees of latitude, or 400 km, per month. During winter months (e.g., Jan-Feb) the southward advection is ~10 cm/sec – roughly half that of June – resulting in monthly advection of ~2.3 degrees of latitude, or ~230 km.
Sardine eggs are at the mercy of the surface currents, and larvae appear to have limited behavioral capabilities, with limited directed horizontal swimming behavior to remain in suitable habitats, as suggested by Weber et al. [22]. It is not known how long juvenile sardines are advected southwards by the California Current, or what size they are when they are large enough to migrate vertically, form schools or to move inshore, thereby reducing further alongshore advection.
Size at age of Pacific sardines is highly variable, again depending on the time of spawning, location and other environmental factors [25, 36] (also see [37-39]). As one example, Butler et al. [21] provided estimates of the size, duration and mortality rates of the sardine life history stages from egg to older adult (Figure 3). According to Butler [21], sardines recruit from the larval stage to the early juvenile stage when they are about 35 mm and 2.55 months old. Since this work was based primarily on samples from Southern California, these samples may not represent the size-at-age of sardine in the PNW or Southern Baja California where environmental drivers and feeding environments are different.
Sardines smaller than 85 mm are seldom seen in either surveys or the fishery. Weber et al. [22] modeled transport patterns of sardine eggs and larvae in the California Current System offshore of California in spring (2002-12) using a regional circulation model assuming five behavioral patterns. They found that a large fraction of larvae was transported south into Mexican waters by late summer in all five scenarios. According to Weber et al. [22], “Larger larvae and juveniles are captured rarely. Using CalCOFI data in a model, there were insufficient numbers of larvae in different size classes to perform the analysis for any cohort. Evidently, transport patterns of eggs captured in the CUFES alone do not index the changes in growth and survival that control recruitment well.” Weber [22] also stated: “We speculate that juvenile sardine advected southward as larvae may move inshore in the fall and return northward, aided by the California Undercurrent.” In other words, it is oceanographically possible (and perhaps likely) for sardines spawned in Southern California to recruit to Baja California.
The extended spawning season is a major reason for the wide variation in the size/age of the younger age groups. [25, 36]. This makes it almost impossible to sort out the size of Age 0 and Age 1 sardines. The present stock designations and stock assessments of the biomass of sardines in the California Current do not account for advection by the Current and its effect on dispersal of the early life history stages.
1.4. Nearshore Dynamics
In order to better inform contemporary sardine management, the non-profit California Wetfish Producers Association (CWPA), investigated the nearshore dynamics of sardine in California, with focus on the SCB. Three data sources were obtained for analysis: 1) sardine from a live bait collection effort, a novel data stream unique to this study; 2) sardine from the directed fishery (SDF) occurring when the sardine fishery was open with data available from 2004-2011; and 3) non-directed sardine fishery sources (SNDF) occurring when the fishery was closed, with data available from 2015-2023. The latter two sources were made available from data requests through the California Department of Fish and Wildlife (CDFW). The data showed that the smallest juveniles taken in the nearshore area of Southern California were 95 mm and taken in the summer (Figure 4 [14]). (A detailed description of the data and analytical approaches is provided in Appendix B.)
The results of this study, conducted from September 2022 to March 2024, indicated that in the first year of the study, September 2022 to June 2023, sampled sardines were almost exclusively Age 1, i.e. between their assumed size 12 months after spawning and their size at an age of 24 months (Figure 3). Fish from this cohort were present in Southern California all year, and fish of the same size range also represent the majority of sardines taken in the winter in Ensenada, Mexico (Figure 5 [15]).
According to Van Noord and Zwolinski [14], “During July 2023, a new cohort appeared and length increased through March 2024. No incursions of large fish, generally greater than 180 mm, punctuated the timeseries, which would have provided evidence for the migration of different populations into the SCB.” (Figure 4). Generally, data from the directed and non-directed fishery showed similar trends. The CWPA study concluded that the nearshore waters of the SCB appear to be a consistent year-round habitat for young sardines across a wide range of SSTs, corroborating early studies that seem to have been overlooked in recent years. [16-22].
2. Discussion of the Science
The question of where the age-0 fish came from and how they are dispersed throughout their early life history is critically important to addressing the stock designations, and other research and management of sardines. Were they spawned off of Point Conception (the northern limit of the SCB) and advected southwards, arriving in the inshore area of Southern California 4-6 months later via the Southern California Gyre and moved shoreward as juvenile fish, when they were 85-120 mm? Or were they retained by the circulation in the SCB? The findings in Erisman et al [25] and other studies imply that these fish may represent the recruitment that has been missing from recent-year Northern sardine stock assessments.
2.1. Factors Affecting the Distribution of Larval and Juvenile Sardine
Sardines commonly have extensive spawning grounds off of Central and Southern California. Figure 6 (taken from Zwolinski and Demer [7]) depicts multi-year composite distributions of Northern (blue) and Southern (red) stock sardine during spring (left), inferred from egg presences in CUFES samples from 1998-2019, and summer (center), inferred from sardine presence in trawl samples collected during 2012-2022 Acoustic Trawl (AT) summer surveys. This study noted that (a) sardine eggs were only sampled in the US Exclusive Economic Zone in spring and were all attributed to the Northern stock; and (b) sardine from the Southern and Northern stocks did not overlap in the same year (center). The gray polygons on the right plot represent the purported areas of operation of the San Pedro and Ensenada fleets that have targeted Northern stock sardine in the past.
The spawning pattern also extends into Northern Baja California. Valencia-Gasti et al. [37] combined egg survey data from Mexico and the US during spring 2000–2013 and found a small fraction (ranging from 0% to 10%) of all eggs captured occurred in the Mexican EEZ. The abundance and distribution of eggs found in warmer waters between 15˚C to 18˚C off northern Baja California appear to be dependent on periods of more intense flow of the California Current [37]. However, since sampling in U.S. waters is more intensive, egg counts in Mexican waters need to be corrected to account for differences in sampling efforts.
In some years, sardines spawn in the Pacific Northwest, a finding that has been known since the 1930’s [18, 39, 42]. Emmett et al. [42] found eggs, larvae and juvenile sardines as small as 50 mm in summer surveys off Oregon and Washington in 1998-2004. As an example of oceanographic effects, it is possible for a single female to spawn eggs offshore of Morro Bay in February, offshore of San Clemente Island in May and offshore of the State of Washington in July of the same year [42-44]. Based on the flow rate and direction of the California Current [31], juveniles of the first spawning would likely come to the inshore region near the Mexican Border, the second spawning would likely come to the region near Punta Baja (mid-Baja California) and the third spawning would likely come ashore in Oregon. This single female sardine could have spread juveniles over 15 degrees of Latitude (30-45°N) in the same spawning season.
In the recent study on sardine growth patterns, Erisman et al. [25] found that the geographic range of sardine spawning is broad and “…varies both seasonally and annually, with spawning occurring continuously throughout its range when conditions are favorable (Ahlstrom 1954, 1959; Hernandez-Vasquez et al. 1994). Sardine have a protracted spawning season with nearly year-round spawning at their primary spawning grounds off Central Baja and measurable spawning during most months elsewhere along their range (e.g., California), with females capable of spawning daily to weekly (Macewicz et al. 1996; Lluch-Belda et al. 2003).” However, fishery assessment models for coastal pelagic species typically lack spatial structure, and thus are unable to model either seasonal migration or advection of the early life history stages. Current management does not consider this range of reproductive behavior and the variable annual and decadal recruitment patterns seen in the Pacific sardine population.
Another oceanographic feature that influences the advection and distribution of larval and young juvenile sardines is the nearshore gyres created by the larger scale pattern of the California Current (Figure 7). The Southern California Gyre is a major circulation feature in the Southern California and Northern Baja California region. There is a smaller gyre in Southern Baja California; but the positive wind stress curl pattern all year in the Central Baja California nearshore region and the associated southward flow implies that there is little (or reduced) nearshore northward advection in Central Baja California [45, 46].
The significance of the two separate gyres is that sardine eggs spawned off and north of Point Conception would be advected southwards, alongshore to Central Baja California, where they would be transported towards shore and then northwards in the Southern California Gyre. According to Weber et al. [22], “The two limbs of the California Undercurrent and its near-surface manifestation occur in the Southern California Bight and just offshore of the Santa Rosa Ridge, about 117–119W off San Diego. The California Undercurrent is continuous throughout the year but intensifies during the fall months, and extends further north as the Davidson Current in winter.”
Smith and Moser [47] stated: “…water masses converge in the Southern California Bight (SCB) region where complexity is heightened by a field of mesoscale eddies that extends from the inner margin of the California Current into the Bight, an undercurrent flowing poleward along the slope, a poleward flowing inshore countercurrent, and a persistent frontal zone (Ensenada Front) at the Southwest corner of the Bight (Lynn and Simpson, 1987; Haury et al 1993). The meandering of the current in the SCB seems to favor sardine retention by pushing early life stages toward the shallow areas of the SCB and Northern Baja, where sardines are known to recruit.”
The advection and distribution of juvenile stages are poorly known. The only (known to us) systematic study of the distribution of juvenile sardines was carried out in the fall of 1938, 1939 and 1940 [19]. These studies were carried out during the peak of the sardine fishery: the 1939 year-class was the largest on record and about 800,000 tons were landed from this year class; the 1938 and 1940 year classes were also quite strong, with about 500,000 tons landed from each [19]. Detailed environmental data were not available for this time period. However, both the Hopkins Marine Station and Scripps Pier SST data show that all three years had annual SST that is slightly below the long-term means, with the exception that the 1938 Scripps SST was about 0.5° C lower than the mean.

Table 1.
Number of schools of young sardine observed during the fall months of 1938,1939 and 1940. Data from Phillips 1952 (Table 1).
Table 1.
Number of schools of young sardine observed during the fall months of 1938,1939 and 1940. Data from Phillips 1952 (Table 1).
| Number of schools by year-class. | 1938 | 1939 | 1940 |
|---|---|---|---|
| Central California (9 Regions) | 4 | 31 | 62 |
| Southern California (11 Regions) | 725 | 1 | 46 |
| Baja California (14 Regions) | 69 | 31 | 96 |
The 1938 survey showed that the young sardines were highly concentrated in Southern California, the 1939 survey found the smallest number of schools and they were virtually absent from Southern California, and the 1940 survey found the maximum number of schools in Baja California, with lower numbers in Central and Southern California. Phillips [19], referring to the 1939 year class, also noted, “Subsequent reports indicated that there was a greater than usual abundance of young sardines of the year north of Bodega Head. British Columbia and Washington State biologists noted, in the summer of 1940, an unusual abundance of young sardines, referring to a 1939 spawning, in inlets and bays around Vancouver Island and in Puget Sound (Walford and Mosher, 1941).”
2.2. Migration
It is known that sardines migrate from the Pacific Northwest (PNW) to California during the winter [48, 49]. The opposite happens in southern Baja California, where tropical SSTs drive sardines from Southern Baja to Central and Northern Baja during the summer [44]. The swimming ability and range of migration are highly size-dependent in fishes, and it has been known for nearly a century [20] that adult (age 2+) sardines are capable of migrating from Point Conception to Vancouver Island in about 2-3 months during the late spring. Tagging also showed movement from central Baja California to the PNW. Smaller sardines have not been observed to make this migration.
The relationship between size, age and migratory behavior in Age 0 and Age 1 California sardines was addressed by McDaniel et al. [50] and also earlier studies by Clark and Janssen [20] and Clark and Marr [43]. McDaniel et al. [50] showed that the age of sardine during July-September, when adults have migrated to the feeding grounds, has a latitudinal cline, with no sardines over age 2 being found in Southern or Central California. In contrast, ages 0-8 were found in Oregon, Washington and Canada. From July to December, the size-at-age was latitude dependent, with fish being largest in Canada and smallest in California. McDaniel et al. [50] suggested, “The best evidence for the potential role of maturation as the biological cue for migration can be found in the offshore movements.” In the offshore spawning habitat in Central and Southern California, every length class observed consisted of older fish on average than observed inshore. They concluded that size and age behaviors observed during the spawning season are based on ontogenic changes associated with maturation, which would explain why the distribution of young (age 0-1) sardines is different from that of migrating adults (age 2+) (also see Clark and Marr [43]).
The senior author (R, Parrish) developed Figure 8 to illustrate the seasonal and latitudinal distribution of satellite chlorophyll. Updated climatologies were generated using data from Jan 1998 to Dec 2024. The areas (i.e., latitude) extended from data off Central Baja California (CBC) to Canada’s Queen Charlotte Islands (QCIs). (A detailed description of Chlorophyll data synthesis is provided in Appendix C.).
This example shows that the relationship between the distribution of sardine and satellite chlorophyll is different on the spawning grounds and feeding grounds. It also suggests the reason why sardines that spawn off of California migrate to the Pacific Northwest for feeding. This finding is consistent with Ware and Thomson [51], who found marked alongshore variation in primary production correlated with fish yield. The highest productivity occurs off the coasts of Washington and southern British Columbia [51].
3. Discussion of Fishery Management ~ Sardine Stock Structure
3.1. Current Fishery Management
The US Assessment of the Pacific Sardine Resource [52] (and prior years) states, in reference to Northern and Southern stocks, “… the adult spawning stocks likely move north and south in synchrony and do not occupy the same space simultaneously to a significant extent (Garcia-Morales et al. 2012).” The present US management of Pacific sardine assumes that all of the sardines caught in southern California and a percentage of those caught in central California (Figure 9) are/were not NSP sardines, which are the only sardines managed by the US. Further, transboundary migration of the SSP into US waters is presently considered to be unavailable for harvest by management within the US. This hypothesis is not supported by the latest scientific studies or past research (e.g. [23]). There remains considerable debate over the validity of the hypotheses that there is little intermixing and there actually are two subpopulations with synoptic movements that can be identified via SST thresholds. The implications of a single Pacific sardine population to US fisheries management and to the US sardine fishery could render the notion of Northern and Southern subpopulations invalid, and require that assumptions about Pacific sardine stock structure and its management be reevaluated.
The 2024 US stock assessment of the Northern stock revised how US fishery scientists and managers separate the two subpopulations by employing a multivariate habitat model with lower SST threshold value for cumulative NSP habitat within an area. The revised habitat model has an upper SST limit of about 15° C and is based largely on the distribution of sardine eggs from CalCOFI spring surveys. As noted above, the model shifted the summer southern boundary of the Northern stock to Northern California, classifying all sardines south of Northern California as members of the SSP. In the spring spawning season, this model predicts that the NSP occurs in Central California and Southern California in the offshore plume of the California Current, where sardines and eggs / larvae have been largely absent in CalCOFI surveys for several years [53]. But US NSP sardine stock assessments are based mainly on the habitat model applied to summer Acoustic Trawl (AT) surveys. According to this habitat model as applied to the 2024 stock assessment, as with previous years since 2015, all sardines inside the Southern California Bight in California were classified as SSP and were again excluded from the Northern sardine stock assessment [7, 52].
This leaves the sardines in the SCB unaccounted for from the perspective of assessment and management. While it is generally agreed that presently there is a moderate biomass of small sardines in Southern California, many age 0, and they are found there all year long, there is no management agreement on this part of the population. Consequently, these fish are unavailable to the US fishery due to current management policy.
3.2. Management Factors to Consider
The adult (Age 1+) biomass of the sardines found in US waters is estimated by the Acoustic -Trawl (AT) summer survey results (see [54] and references therein), as key inputs to a statistical stock assessment population model, but the age composition observed in the AT Surveys suggests that these surveys are missing (or misclassifying) the juvenile (age 0 + age 1) portion of the biomass. In recent years, the surveys have included sampling conducted in summer in nearshore waters of California and the Pacific Northwest in collaboration with the fishing industry, utilizing commercial purse seiners outfitted with EK 60 acoustic arrays. Even so, the conditional age data from AT surveys used in stock assessments have been questioned. Erisman et al. [25] stated, “Reported regional patterns in length-at-age reflect a combination of the migratory behavior of Pacific sardine, ontogenic shifts in habitat, variable birth dates associated with protracted spawning seasons and regional variations in spawning, and biased length and age data from commercial catches and fishery-independent surveys. Therefore, length-at-age data and growth information should not be used to help delineate subpopulations or apportion biomass or catch for use in stock assessments of Pacific sardine.”
The multivariate environmental habitat model that is currently used to assess the Northern stock is limited because the model was developed from behavioral preferences of adult sardines observed offshore, during the spring spawning season, as measured by CalCOFI egg surveys. Historical CalCOFI egg and larvae surveys implied that spawning off of California was seasonal (concentrated in the late winter and spring). However, in 2015, sardines spawned earlier and later than their historical spawning period and at locations 500 miles north of their normal spawning areas, in the Pacific Northwest [55, 56]. This information was not included in CalCOFI egg production estimates or considered in the Northern stock assessment, in part because of the mismatch in the timing of the surveys. Moreover, the McDaniel et al. [50] study implied that sardines do not follow the habitat model until they are sexually mature.
While important for documenting trends in the California Current overall, CalCOFI surveys are now questioned as an effective measurement of sardine productivity in light of the range expansion caused by environmental changes [55]. Moreover, the relationship to environmental variables may be very different when sardines are on the summer feeding grounds, and there is no reason to assume that sub-adult sardines (age 0 and age 1), which are most commonly found nearshore, have the same environmental preferences as spawning adults [50].
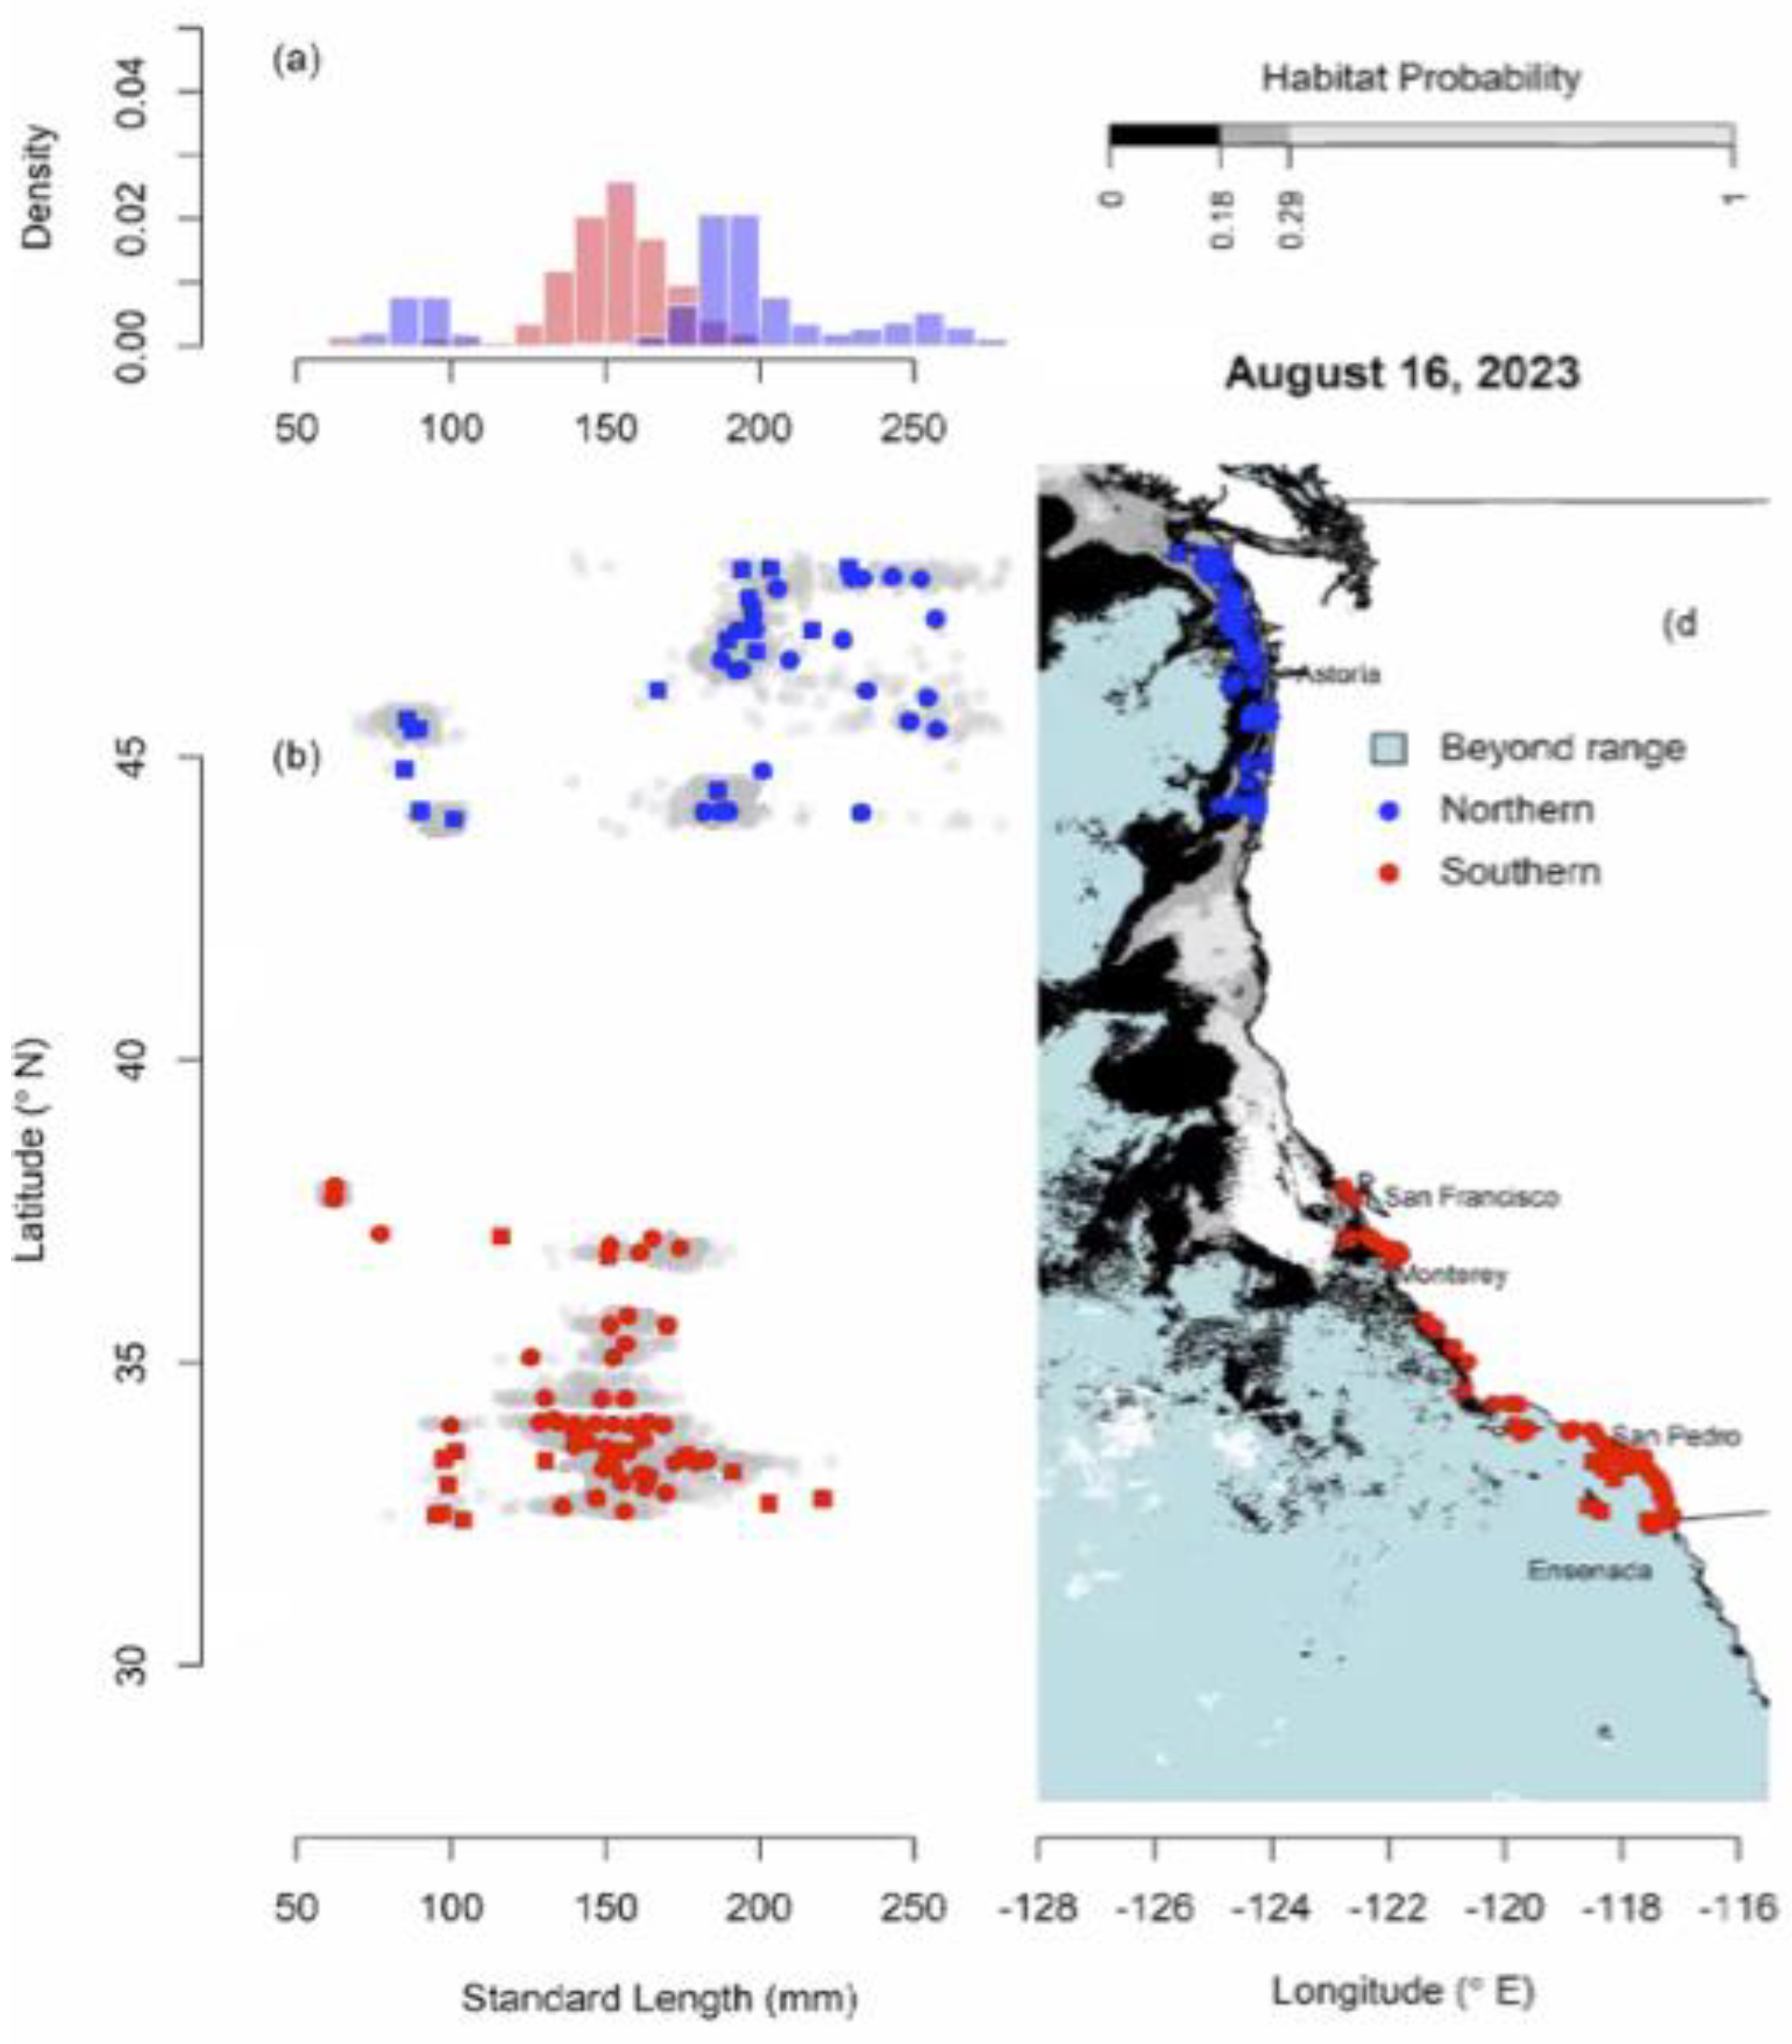
Currently, US assessments of sardine biomass are based primarily on summer AT Surveys and input from the revised multivariate habitat model, which assumes that larval, juvenile and immature age 0 and age 1 sardines follow the same spring spawning season pattern as adults. The revised sardine habitat model (Figure 10) indicates that in August 2023, the entire biomass of the Northern stock was north of the Oregon border. Sardines smaller than 100 mm and all sardines in Southern California were again excluded from the habitat model as they were south of the new boundary in California (i.e., the red dots in Figure 10). Figure 10 is misleading as the data were not collected at the same time over the range considered. But Figure 10 clearly illustrates the problems with current NSP stock assessments. The younger sardines in southern California were classified as SSP and were also excluded from the Northern sardine stock assessment, although US management counts any sardines caught as part of the NSP quota. The Northern stock assessment continued to state there was no evidence of recruitment, as has been the case with Northern stock assessments in recent years [52] (and prior assessments).
4. Conclusions
The case for Pacific sardine illustrates both the dynamic variability of the environmental conditions that drive sardine behavior and current sardine management challenges. Recent scientific studies (e.g., [23-26]) challenge the framework of two distinct sardine subpopulations (Northern and Southern) along the U.S. Pacific coast. Instead, they present information that supports the concept of a highly dynamic single population influenced largely by environmental variability. These findings have significant policy implications: the current US practice of managing only the “Northern” stock is not supported by genetic, demographic, or tagging data. The recent studies suggest that U.S. management revise its framework to consider all sardines within U.S. waters as a single management unit, at least until validated evidence of population structure emerges or international coordination is established [57].
In order to effectively assess the dynamics of Pacific sardine, additional surveys would need to be conducted in more than one season of the year, with explicit consideration given in the survey design to oceanographic factors, including the influence of advection on larvae, juveniles, and age 0-1 sardines off California. Weber et al. [22] suggested that surveying juvenile sardines in fall in the SCB and near the border of the U.S. and Mexico could be an efficient means of estimating recruitment because the advection pattern of eggs and larvae to the south is opposite the adult migration pattern to the north.
In the absence of international management, the U.S. could simply draw a line at the border and adopt regional management for all sardines in U.S. waters. The argument for this approach is that these sardines are different components of the same biological population, with the older spawners being in the North on their summer feeding grounds, and the younger non-migrating fish being in the South. A solution to manage all sardine resident in U.S. waters also is suggested in the Transboundary Issues section of the Coastal Pelagic Species Fishery Management Plan (CPS FMP). “In practice, this approach is similar to managing the US and Mexican portions of a stock separately, since harvest for the US fishery in a given year depends ultimately on the biomass in US waters.” [58]. Managing all US sardines as a single fishery unit could remove their “overfished” status and lighten the currently severe restrictions of the rebuilding plan. Counting all sardines in US waters, rather than omitting the biomass in Southern California, could also hasten the reopening of the US sardine fishery.
Funding
The original paper was contracted as part of NOAA-NMFS Saltenstall-Kennedy Grant NA22NMF4270167, Investigating Seasonal Nearshore Dynamics of Pacific Sardine (Sardinops sagax) in California.
Acknowledgments
We extend grateful thanks to Concepción Enciso Enciso for sharing Mexican sardine length frequency data, and to the California Department of Fish and Wildlife for providing historical sardine biological data. We thank Lynn DeWitt, Pacific Fisheries Environmental Group, for providing the OSCURS model data used in Figures 1 and 2, and Dr. Cara Wilson, SWFSC Environmental Research Division, for providing the Chlorophyll data used in Figure 8. We thank the participants in the SK Grant study, including the fishermen, research technician, principal investigator and collaborator who collected and processed samples and provided the biological data included in this review. We also extend thanks to the scientists and others who reviewed drafts of the original paper and this revision.
Conflict of Interest
The authors have declared no competing interest.
Appendix A—Detailed Description of the Data and Analytical Approaches of OSCURS Model Runs
The OSCURS (Ingraham and Miyahara, 1988) numerical model is a research tool that allows oceanographers and fisheries scientists to perform retrospective analyses of daily ocean surface currents anywhere in a 90-km ocean-wide grid from Baja California to China and from 10N to the Bering Strait. The OCSURS model is used to measure the movement of surface currents over time, as well as the movement of what is in or on the water. Investigation of events such as spills of cargo containers loaded with plastic bathtub toys has been used to fine-tune the OSCURS model. The model was developed at Alaska Fisheries Science Center, Resource Ecology and Fisheries Management Division and operationalized by the Environmental Research Division, Southwest Fisheries Science Center. Input to the model is daily values of Fleet Numerical Meteorological and Oceanography Center’s (FNMOC’s) 6-hourly model sea level pressure.
A web application (https://oceanview.pfeg.noaa.gov/oscurs) allows users to run the model, starting at any point in the Pacific, by choosing a start date, duration, and other parameters characterizing the drifting object. The resulting tracks can be visualized and downloaded.
For this study, an ecological model with geographical resolution was developed (R.Parrish, unpublished data); it contained nine regional compartments based on natural features of the California Current System. The OSCURS model was used to characterize the near surface advection of the California Current within and between regional compartments. Monthly vectors of near-surface advection for each model region were derived from monthly advection calculations from the Ocean Surface Currents Simulation (OSCURS) model (Ingraham and Miyahara, 1985)
Appendix B—Description of the Data Collection and Analytical Approaches Used in the SK Grant Nearshore Study
For the live bait collection, fish were collected from five live bait operators within the SCB on a monthly basis, as part of their normal fishing operations. Participating ports, from south to north, included: Mission Bay (San Diego), Oceanside, Dana Point, Long Beach and Marina Del Rey (near Los Angeles, California). Fishing generally occurred adjacent to the port of operation, or as close as possible. This fishing behavior may bias samples toward smaller sardines, which typically reside closer to shore. For this reason, analyses were done by port, and fish were assumed to have been captured within a relatively small radius of the port. To maintain confidentiality, location was reported by 10x10 square mile CDFW fishing blocks.
Sardine schools were selected as part of the normal fishing operations of the vessel, and school selection was not influenced by the research objectives. Samples were provided at a target frequency of once per month, with samples from any given port spread as evenly as possible from month to month. Once a school was landed and the vessel returned to port, fish were extracted from the beginning, middle, and end of the off-loading process as fish were being sluiced from the vessel holding wells to the bait barges. Fish were sampled using dip nets, and a target of 100 specimens per vessel was collected, frozen, and transported to a laboratory for processing, giving a maximum of approximately 500 specimens per month.
In the laboratory, standard length, in millimeters (mm), was measured for each individual, from the tip of the jaw to the center of the hypural bone. Mean length by port was ranked monthly to gauge differences by port across time. A rank of five to one was assigned for each port every month, with five signifying the port with the greatest mean SL and a one for the smallest. When only four ports provided samples during a given month, the rankings went from five – two. When there were three ports during a month, values of five, three, and one were given.
Historic morphometric data were used to assess how monthly length distributions in the SCB were different when the SDF was open, the period spanned from 2004-2011, and when the fishery was closed, from 2015-2023 (SNDF sources). The directed fishery period was selected as it reflected a relatively stable period of high Northern sardine (NSP) abundance and a robust commercial fishery; while the later period was selected because it reflected a period of low abundance and a closed commercial fishery. These SNDF sources included: Non-Directed Fishery (NDF), Live bait (Live), Nearshore Cooperative Survey (NCS), and biological sample Exempted Fishing Permit (EFP) and point set EFP survey data. Some EFP data were obtained through funding from the SK grant.
For the EFP effort, vessels were to sampled once a month throughout the duration of the study period. These specimens were sampled and processed by CDFW and made available as part of the same data request. SDF samples were taken following CDFW finfish sampling protocol and based on a stratified random sampling plan, where each month one area was selected and 12 days were randomly sampled within each month from each port area (Los Angeles, Ventura, Monterey) with the goal of obtaining 12 samples of each target species from each port complex (D. Porzio, pers comm). NDF sardine were sampled when sardines were bycatch in other CPS fisheries, Live Bait sardine were sampled from the live bait fishery (similar to the data collected as part of this project but from only 2016 and sampled directly by CDFW instead of this study), NCS sardine were captured as part of a CDFW-led Nearshore Cooperative Survey using purse seine vessels to sample CPS schools observed by an aerial spotter pilot, and EFP sardines were collected from efforts to obtain biological data on sardines while the directed fishery was closed. Approximately 80 percent of the sardines from the historical dataset was obtained from the SDF effort.
Sea surface temperature (SST) values were obtained from NOAA’s Moderate Resolution Imaging Spectroradiometer (MODIS) satellite (https://coastwatch.pfeg.noaa.gov/erddap/index.html) and accessed in April, 2024. SST’s were obtained at a resolution of 6 nm2 (~20 km2) at a composite of 8 days. Depending on satellite coverage and location, up to 25 observations were made to yield an SST value; SST values were not included if less than four observations were made.
Standard Generalized Additive Models (GAMs) and quantile GAMs were explored to test the effect of SST on trends in SL in the live bait data using the packages “mgcv” (Wood, 2011) and “qgam” (Fasiolo et al., 2021). Quantile regression allows for the discovery of more underlying relationships for the extreme portions of the data when there is no relationship using the mean. In this study, quantile regression analysis was explored to test the effect of SST (for the live bait collection) or month (for the SDF and SNDF collections) on the largest sardines in the study, as any migratory behavioral responses to abiotic factors were likely observed primarily among the largest sized fish. Month was used as a proxy for SST due to the lack of precise or consistent geographic details within the historic data collection. Quantiles were tested at increments of 0.05 between 0.80 and 0.95. The number of knots in the smooth splines was limited to four to prevent over-fitting. All statistics and analysis were done in the computing language program R.
In addition to analysis of the SK data, we reviewed relevant studies pertaining to sardine stock structure, oceanography and management, including many sources from the archives of the senior author.
Appendix C—Detailed Explanation of Chlorophyll Data Synthesis
Updated monthly composites of chlorophyll from ESA’s Ocean Colour Climate Change Initiative (OC-CCI) dataset, Version 6.0 were used to generate climatologies for nine regions along the west coast. The OC-CCI dataset merges chlorophyll data from the SEaWifS, MODIS, MERIS, VIIRS, and OLCI sensors to create a continuous time-series back to 1998. The climatologies were generated using data from Jan 1998 to Dec 2024. Data were downloaded from the West Coast node of CoastWatch ERDDAP at https://coastwatch.pfeg.noaa.gov/erddap/griddap/pmlEsaCCI60OceanColorMonthly.graph
References
- Baumgartner T, A. Soutar, V. Ferreira-Bartrina. 1992. Reconstruction of the History of Pacific Sardine and Northern Anchovy Populations over the past two Millennia from Sediments of the Santa Barbara Basin, California. California Cooperative Oceanic Fisheries Investigations Rep. Vol. 33: 1-17.
- McClatchie, S., I.L. Hendy, A.R. Thompson and W.Watson. 2017. Collapse and recovery of forage fish populations prior to commercial exploitation. Geophys. Res. Lett., 44. [CrossRef]
- Robinson, J., 2004. Squaring the circle? Some thoughts on the idea of sustainable development. Ecological Economics 48 (2004) 369-384. [CrossRef]
- Checkley Jr., D, R.G. Asch, R.R. Rykaczewski. 2017. Climate, Anchovy, and Sardine. Ann. Rev. Mar. Sci. 2017, 9:469-93. [CrossRef]
- 5. Pacific Fishery Management Council. 2024-b. Revised Draft Pacific Sardine Rebuilding Plan Preliminary Draft Environmental Assessment. Pacific Fishery Management Council, 7700 NE Ambassador Place, Suite 101, Portland, Oregon 97220-1384.
- Pacific Fishery Management Council, 1998. Coastal Pelagic Species Fishery Management Plan Amendment 8 Appendix B.
- Zwolinski, J. P., and D. A. Demer. 2023. An updated model of potential habitat for northern stock Pacific Sardine (Sardinops sagax) and its use for attributing survey observations and fishery landings. Fisheries Oceanography, 1–14. [CrossRef]
- Demer, D.A., Zwolinski, J.P., 2014. Corroboration and refinement of a method for differentiating landings from two stocks of Pacific sardine (Sardinops sagax) in the California current. ICES J. Mar. Sci. 71 (2), 328–335. [CrossRef]
- Demer, D.A., Zwolinski, J.P., Byers, K.A., Cutter, G.R., Renfree, J.S., Sessions, T.S., Macewicz, B.J., 2012. Prediction and confirmation of seasonal migration of Pacific sardine in the California Current. Fishery Bulletin 110(1).
- Hill, K.T., Crone, P., Dorval, E., Macewicz B. 2015. Assessment of the Pacific Sardine Resource in 2015 for USA Management in 2015-16. Pacific Fishery Management Council, Agenda Item G.1.a April 2015.
- NOAA Fisheries https://www.fisheries.noaa.gov/species/pacific-sardine.
- Pacific Fishery Management Council. 2021. Scientific and Statistical Committee Report on Pacific Sardine Assessment, Harvest Specifications, and Management Measures – Final Action. Supplemental SSC Report 1. Agenda Item E.4.a., April 2021.
- Yau, A. 2022. Report from the Pacific Sardine Stock Structure Workshop, November, 2022. Southwest Fisheries Science Center.
- Van Noord, J.E. and J.P. Zwolinski. 2024. Nearshore waters of the Southern California Bight as a year-round habitat for small sardine (Sardinops sagax) from 2022 – 2024. FY22 Saltenstall-Kennedy Grant, NOAA-NMFS-FHQ-2022-2006956, Final Report.
- Enciso-Enciso, C., M.O. Nevdrez-Martinez, R. Sanchez-Cardenas et al. Regional Studies in Marine Science 62 (2023) Assessment and management of the temperate stock of Pacific sardine (Sardinops sagax) in the south of California Current System.
- Godsil, H.C. 1931. The commercial catch of adult California Sardines (Sardina caerulea) at San Diego. California Fish and Game Bulletin 31:41–53.
- Scofield, E.C., 1934. Early Life History of the California Sardine (Sardina caerulea): with Special Reference to Distribution of Eggs and Larvae. California State Print.Off, Sacramento, California 54p.
- Ahlstrom, E.H. 1959. Distribution and abundance of the eggs of the Pacific Sardine, 1952–1956. Fishery Bulletin, U.S. 60:185–213.
- Phillips, J. B. 1952. Report on the survey for young sardines, Sardinops caerulea, in California and Mexican waters, 1938-40. Fish Bull 87: 9-30.
- Clark FN, Janssen JF Jr. 1945. Movements and abundance of the sardine as measured by tag returns. Fish Bulletin California Department of Fish and Game. 1945:7±42.
- Butler, J.L., P.E. Smith and N. C. Lo. 1993. The effect of natural variability of life-history parameters on anchovy and sardine population growth. CalCOFI Ref., Vol., p 104-111.
- Weber, E.D., L. Chao, F. Chai, and S. McClatchie. 2015. Transport patterns of Pacific sardine Sardinops sagax eggs and larvae in the California Current System. Deep Sea Res. Part 1. Oceano. Papers. Vol. 100 p. 127-139. [CrossRef]
- Craig, Matthew T., Brad E. Erisman, Ella S. Adams-Herrmann, Kelsey C. James, and Andrew R. Thompson. 2025. The subpopulation problem in Pacific sardine, revisited. U.S. Department of Commerce, NOAA Technical Memorandum NMFS-SWFSC-713. [CrossRef]
- Erisman B.E., Craig M.T., James K.C., Schwartzkopf B, Dorval E, Adams ES, Thompson AR. 2024. The subpopulation problem in Pacific Sardine (Sardinops sagax), revisited: do sardine have isolated spawning areas? Proceedings of the 24th Annual Trinational Sardine and Small Pelagics Forum, May 2024.
- Erisman, Brad, Matthew Craig, Kelsey James, Brittany Schwartzkopf, and Emmanis Dorval. 2025-a. Systematic review of somatic growth patterns in relation to population structure for Pacific Sardine (Sardinops sagax) along the Pacific Coast of North America. U.S. Department of Commerce, NOAA Technical Memorandum NMFS-SWFSC-708. [CrossRef]
- Longo, G., D′Amelio K.,| Larson W., Enciso Enciso C., Torre J., Minich J.J., Michael T.P.,| Craig M.T.. 2025. Population Genomics Reveals Panmixia in Pacific Sardine (Sardinops sagax) of the North Pacific. Wiley Evolutionary Applications, 2025; 18:e70154 1 of 13 . [CrossRef]
- Hedgecock, D., Hutchinson, E.S., Li, G., Sly, F.L., Nelson, K. 1989. Genetic and morphometric variations in the Pacific Sardine Sardinops sagax caerulea: comparisons and contrasts with historical data and with variability in northern anchovy Engraulis mordax. Fishery Bulletin 87:653–671.
- Parrish R.H, F.B. Schwing and R. Mendelssohn, 2000. Mid-latitude wind stress: The energy source for climatic shifts in the North Pacific Ocean. Fisheries Oceanography, 9(3), pp.224-. [CrossRef]
- Parrish, R.H., C.S. Nelson and A. Bakun. 1981. Transport mechanisms and reproductive success of fishes in the California Current. Biol. Oceanogr. 1(2):175-203.
- Bakun, A., Parrish, R.H., 1982. Turbulence, transport, and pelagic fish in the California and Peru current systems. Calif. Cooperative Oceanic Fish. Investigations Rep. 23, 99–112.
- Ingraham, W. J., and R. K. Miyahara 1988. Ocean Surface Current Simulations in the North Pacific Ocean and Bering Sea. Res. Ecol. & Fish. Mgt. Div. NWFC NMFS March 1988. 154 p.
- Nieto, K., McClatchie, S., Weber, E.D., Lennert-Cody, C.E., 2014. Effect of mesoscale eddies and streamers on sardine spawning habitat and recruitment success off Southern and central California. J. Geophys. Res.: Oceans 119 (9), 6330–6339. [CrossRef]
- Lynn, R.J., Simpson, J.J., 1987. The California current system – the seasonal variability of its physical characteristics. J. Geophys. Res.–Oceans 92 (C12),12947–12966. [CrossRef]
- Rykaczewski, R.R., Checkley Jr., D.M., 2008. Influence of ocean winds on the pelagic ecosystem in upwelling regions. Proc. Natl. Acad. Sci. USA 105 (6), 1965–1970.
- Rykaczewski, R.R., Checkley Jr., D.M., 2008. Influence of ocean winds on the pelagic ecosystem in upwelling regions. Proc. Natl. Acad. Sci. USA 105 (6), 1965–1970.
- Dorval, E., McDaniel, J.D., Macewicz, B., Porzio, D.L. 2015. Changes in growth and maturation parameters of Pacific Sardine Sardinops sagax collected off California during a period of stock recovery from 1994 to 2010. Journal of Fish Biology 87(2): 286–30. [CrossRef]
- Valencia-Gasti, J.A. and R. Durazo, E.D. Weber and S. McClatchie, T. Baumgartner, C.E. Lennert-Cody. 2018. Spring Spawning Distribution of Pacific Sardine in US and Mexican Waters. CalCOFI Rep. Vo. 59, 2018. pp. 79-85.
- Hernandez-Vazquez, S. 1994. Distribution of eggs and larvae from sardine and anchovy off California and Baja California. 1951-1989. CalCOFI Rep. Vol. 25. pp 94-107.
- Ahlstrom, E.H., 1954. Distribution and abundance of egg and larval populations of the Pacific Sardine. Fish. Bull. 56 (1), 83–140.
- Lluch-Belda, D., D. B. Lluch-Cota and S. E. Lluch-Cota 2003 Baja California’s Biological Transition Zones: Refuges for the California Sardine Journal of Oceanography, Vol. 59, pp 503-513.
- Lluch-Belda, D., Hernandez-Vazquez, S., Lluch-Cota, D.B., Salinas-Zavala, C.A., Schwartzlose, R.A., 1992. The recovery of the California Sardine as related to global change. Calif. Cooperative Oceanic Fish. Investig. Rep. 33, 50–59.
- Emmett. R.L., R.D. Brodeur, T.W. Miller, S.S. Pool, G.K. Krutzikowsky, P.J. Bentley and J. McCrae. 2005. Pacific sardine (Sardinops sagax) abundance, distribution and ecological relationships in the Pacific Northwest. CalCOFI Rept., Vol. 46. p 122-143.
- Clark, F.N., Marr, J.C. 1955. Population dynamics of the Pacific Sardine. California Cooperative Oceanic Fisheries Investigations Reports 1: 1-48.
- Lluch-Belda, D., R.H Parrish, T. Kawasaki, D.M. Hedgecock, R.J.M. Crawford, A.D. MacCall, R.A. Schwartzlose, P.E. Smith. 1991. “Environmental fluctuations, pelagic sardine recruitment, and migration in the California Current.” Canadian Journal of Fisheries and Aquatic Sciences, 48(12): 2026-2039.
- Hickey, B.M. (1979) The California current system—hypotheses and facts, Prog. in Oceanogr., v8, 191-279, . [CrossRef]
- Checkley, D.M., J.A. Barth. 2009. Patterns and Processes in the California Current System. Progress in Oceanography 83 (2009) 49–64. [CrossRef]
- Smith, P.E., H.G. Moser. 2003. Long-term trends and variability in the larvae of Pacific sardine and associated fish species of the California Current region. Deep-Sea Research II 50 (2003) 2519-2536. [CrossRef]
- Janssen, J.F. Jr., 1939. Two Years of Sardine Tagging in California. California State Fisheries Laboratory, Terminal Island, CA. [CrossRef]
- Radovich J. 1982. Collapse of the Sardine Fishery: What Have We Learned CalCOFI Rep., Vol. XXIII, 1982.
- 50. McDaniel, J, K. Piner, H. Lee and K. Hill. 2016. Evidence that the Migration of the Northern Subpopulation of Pacific Sardine (Sardinops sagax) off the West Coast of the United States is Age Based. PLOS ONE |. [CrossRef]
- Ware, D.M and Thomson, R.E. 2005. Bottom-Up EcosystemTrophic Dynamics Determine Fish Production in the Northeast Pacific. Science Vol. 308, 27 May 2005. [CrossRef]
- Kuriyama, P., Allen Akselrud, C., J. Zwolinski and K. Hill, 2024. Assessment of the Pacific sardine resource (Sardinops sagax) in 2024 for U.S. management in 2024-2025.
- 53. Leising et al, Eds. 2025. California Current Integrated Ecosystem Assessment Team. 2024-2025 California Current Ecosystem Status Report 1. Pacific Fishery Management Council, February 2025.
- Stierhoff, K.L., J.P. Zwolinski, J.S. Renfree, and D.A. Demer. 2023. Distribution, biomass, and demographics of coastal pelagic fishes in the California Current Ecosystem during summer 2022 based on acoustic-trawl sampling. U.S. Department of Commerce, NOAA Technical Memorandum NMFS-SWFSC-683. [CrossRef]
- Dorval, E., B. J. Macewicz, D. A. Griffith, N. C. H. Lo, and Y. Gu, and., 2016. Spawning biomass of Pacific sardine (Sardinops sagax) estimated from the daily egg production method off California in 2015. NOAA-TM-NMFS-SWFSC-560.
- Pacific Fishery Management Council. 2016. Scientific and Statistical Committee Report on Final Action on Sardine Assessment, Specifications and Management Measures. Supplemental SSC Report. Agenda Item H.1.b. April 2016.
- Erisman Brad, Matthew Craig, Kelsey James, Emmanis Dorval. 2025-b. Aligning Stock Structure of Pacific Sardine (Sardinops sagax) with Biological Reality. Proceedings of the 25th Annual Trinational Sardine and Small Pelagics Forum, June 2025.
- Pacific Fishery Management Council, 2024-a. Coastal Pelagic Species Fishery Management Plan as amended through Amendment 21. Jun 2024, p. 43.
Figure 1.
Latitudinal comparison of 37 years of February and June surface transport vectors calculated from the OSCURS Model [31] for nine regional compartments (red polygons) based on natural features of the California Current System. The length of the black vectors represents the average distance traveled/advected over one month (February or June) for each of the 37 years. (From R. Parrish, unpub.)
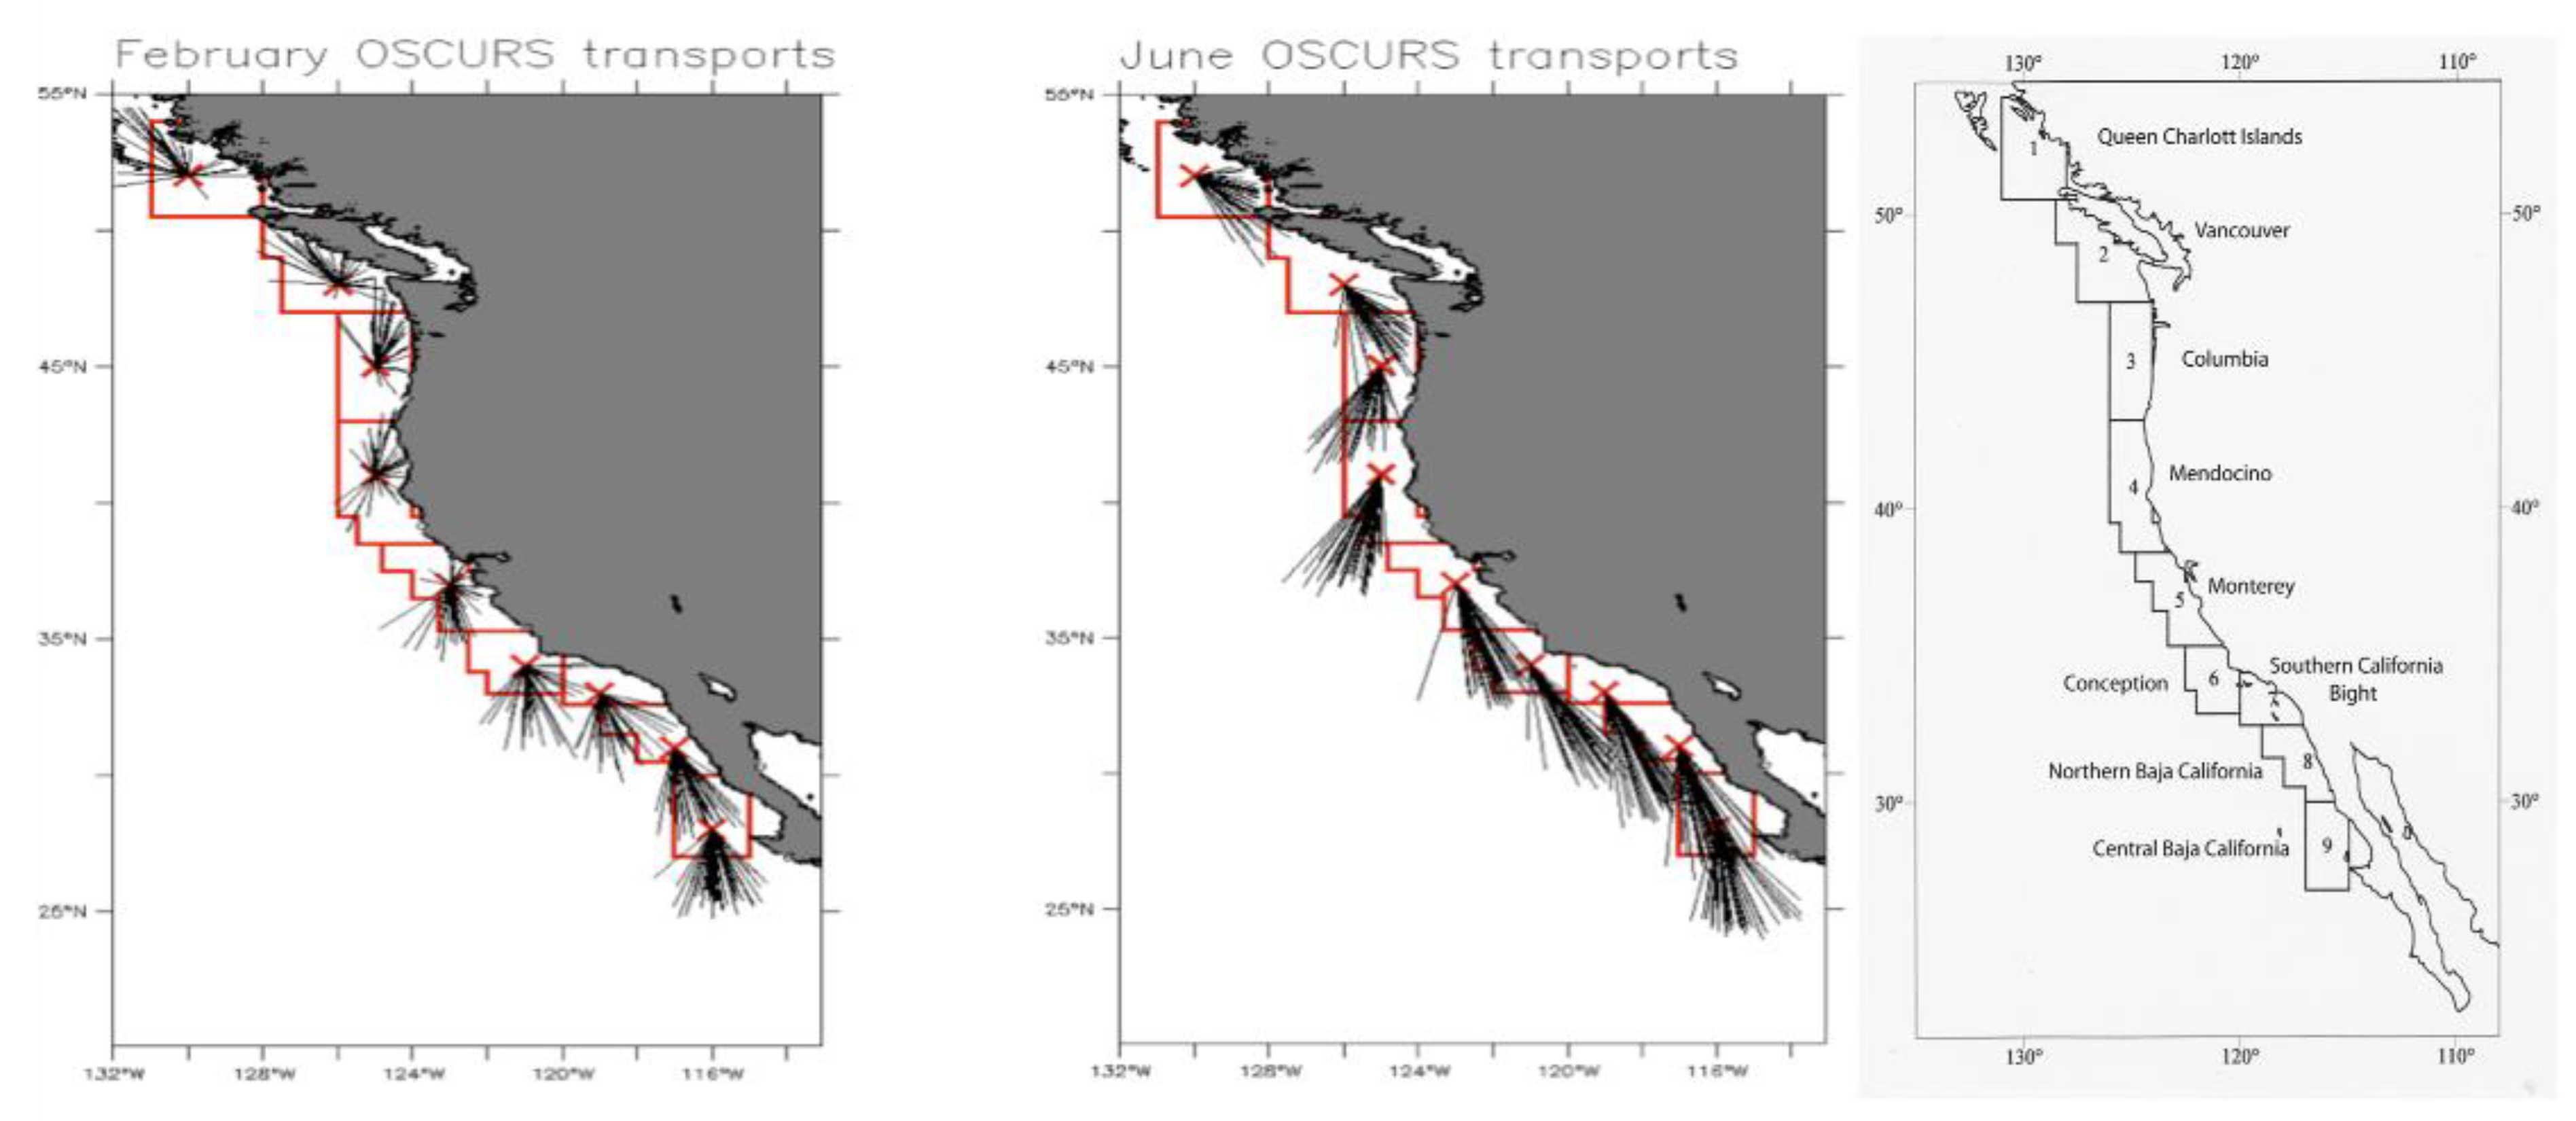
Figure 2.
Cross-shelf comparison of 37 years of January and July surface transport vectors calculated from the OSCURS Model [31] for three longitudinal cross sections of the California Current. The colored vectors visually separate the longitudinal comparison and their lengths represent the average distance traveled/advected over one month (January or July) for each year, with black lines being closest to shore, and pink farthest offshore. (From R.Parrish, unpub.).
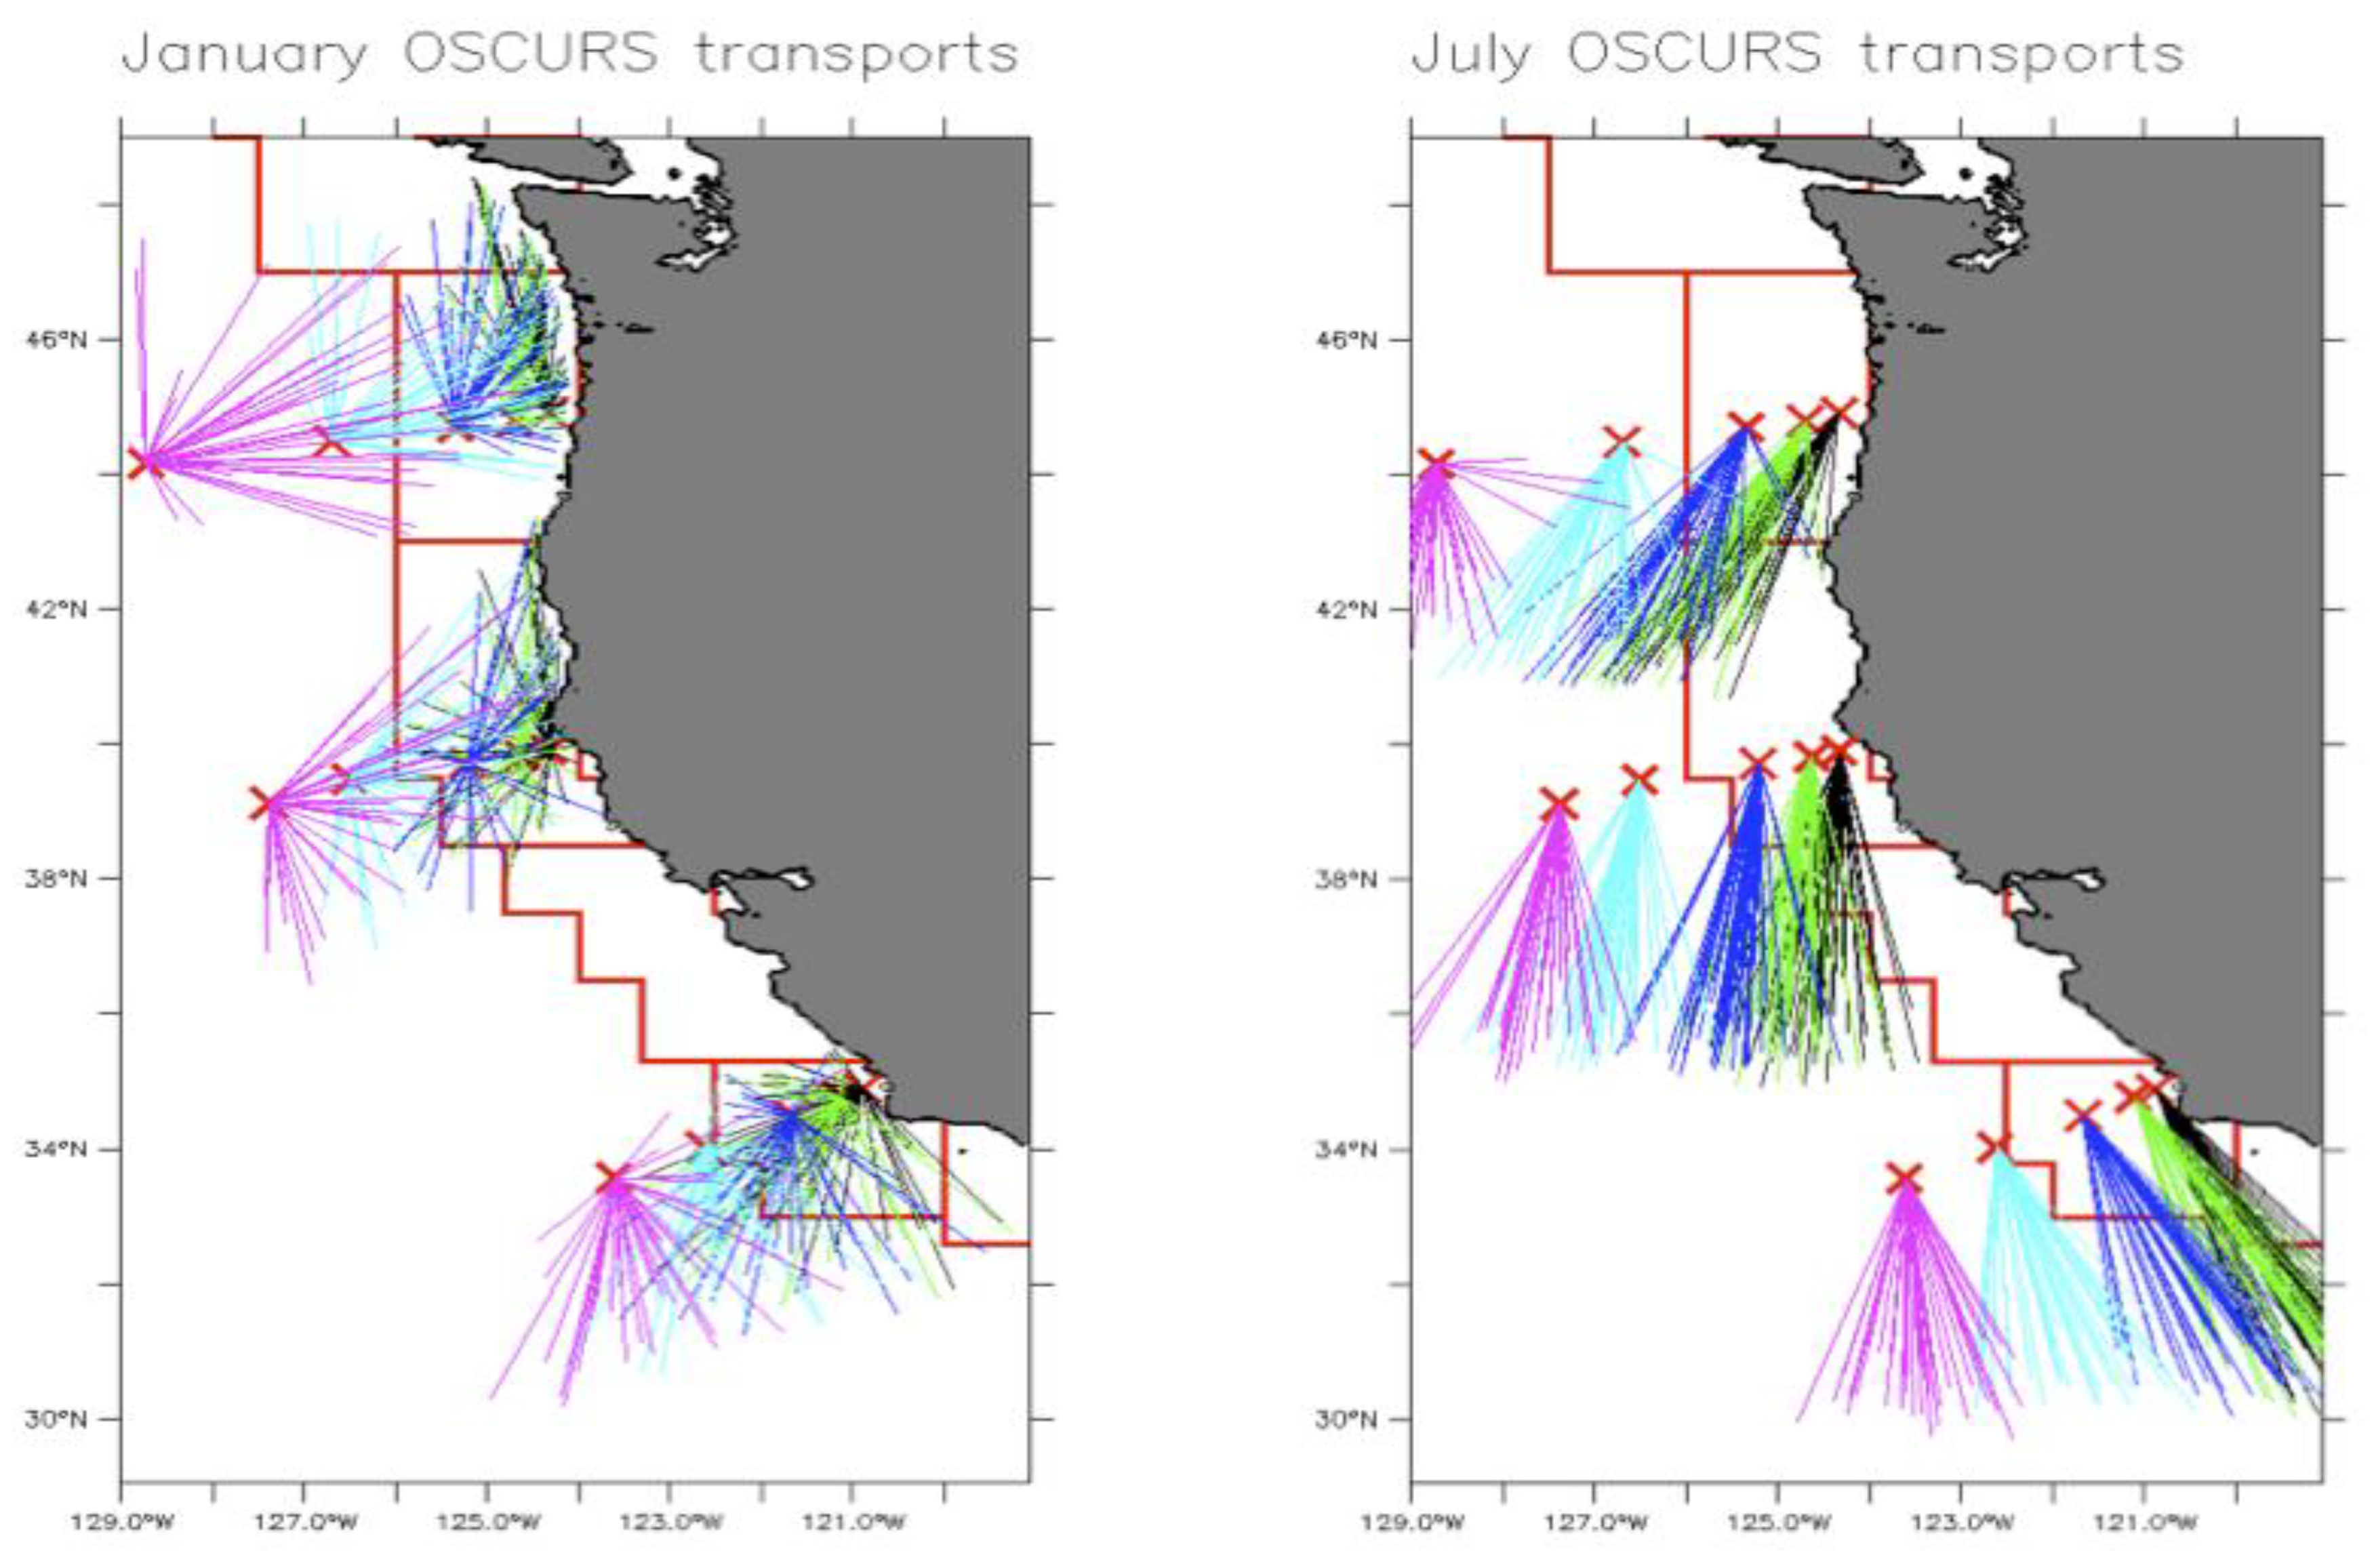
Figure 3.
Size-at-age of life history stages for Pacific sardine larvae spawned on Feb 1 (upper curve) versus June 1 (lower curve). Reproduced from Table 4 in Butler et al. (1993).
Figure 3.
Size-at-age of life history stages for Pacific sardine larvae spawned on Feb 1 (upper curve) versus June 1 (lower curve). Reproduced from Table 4 in Butler et al. (1993).
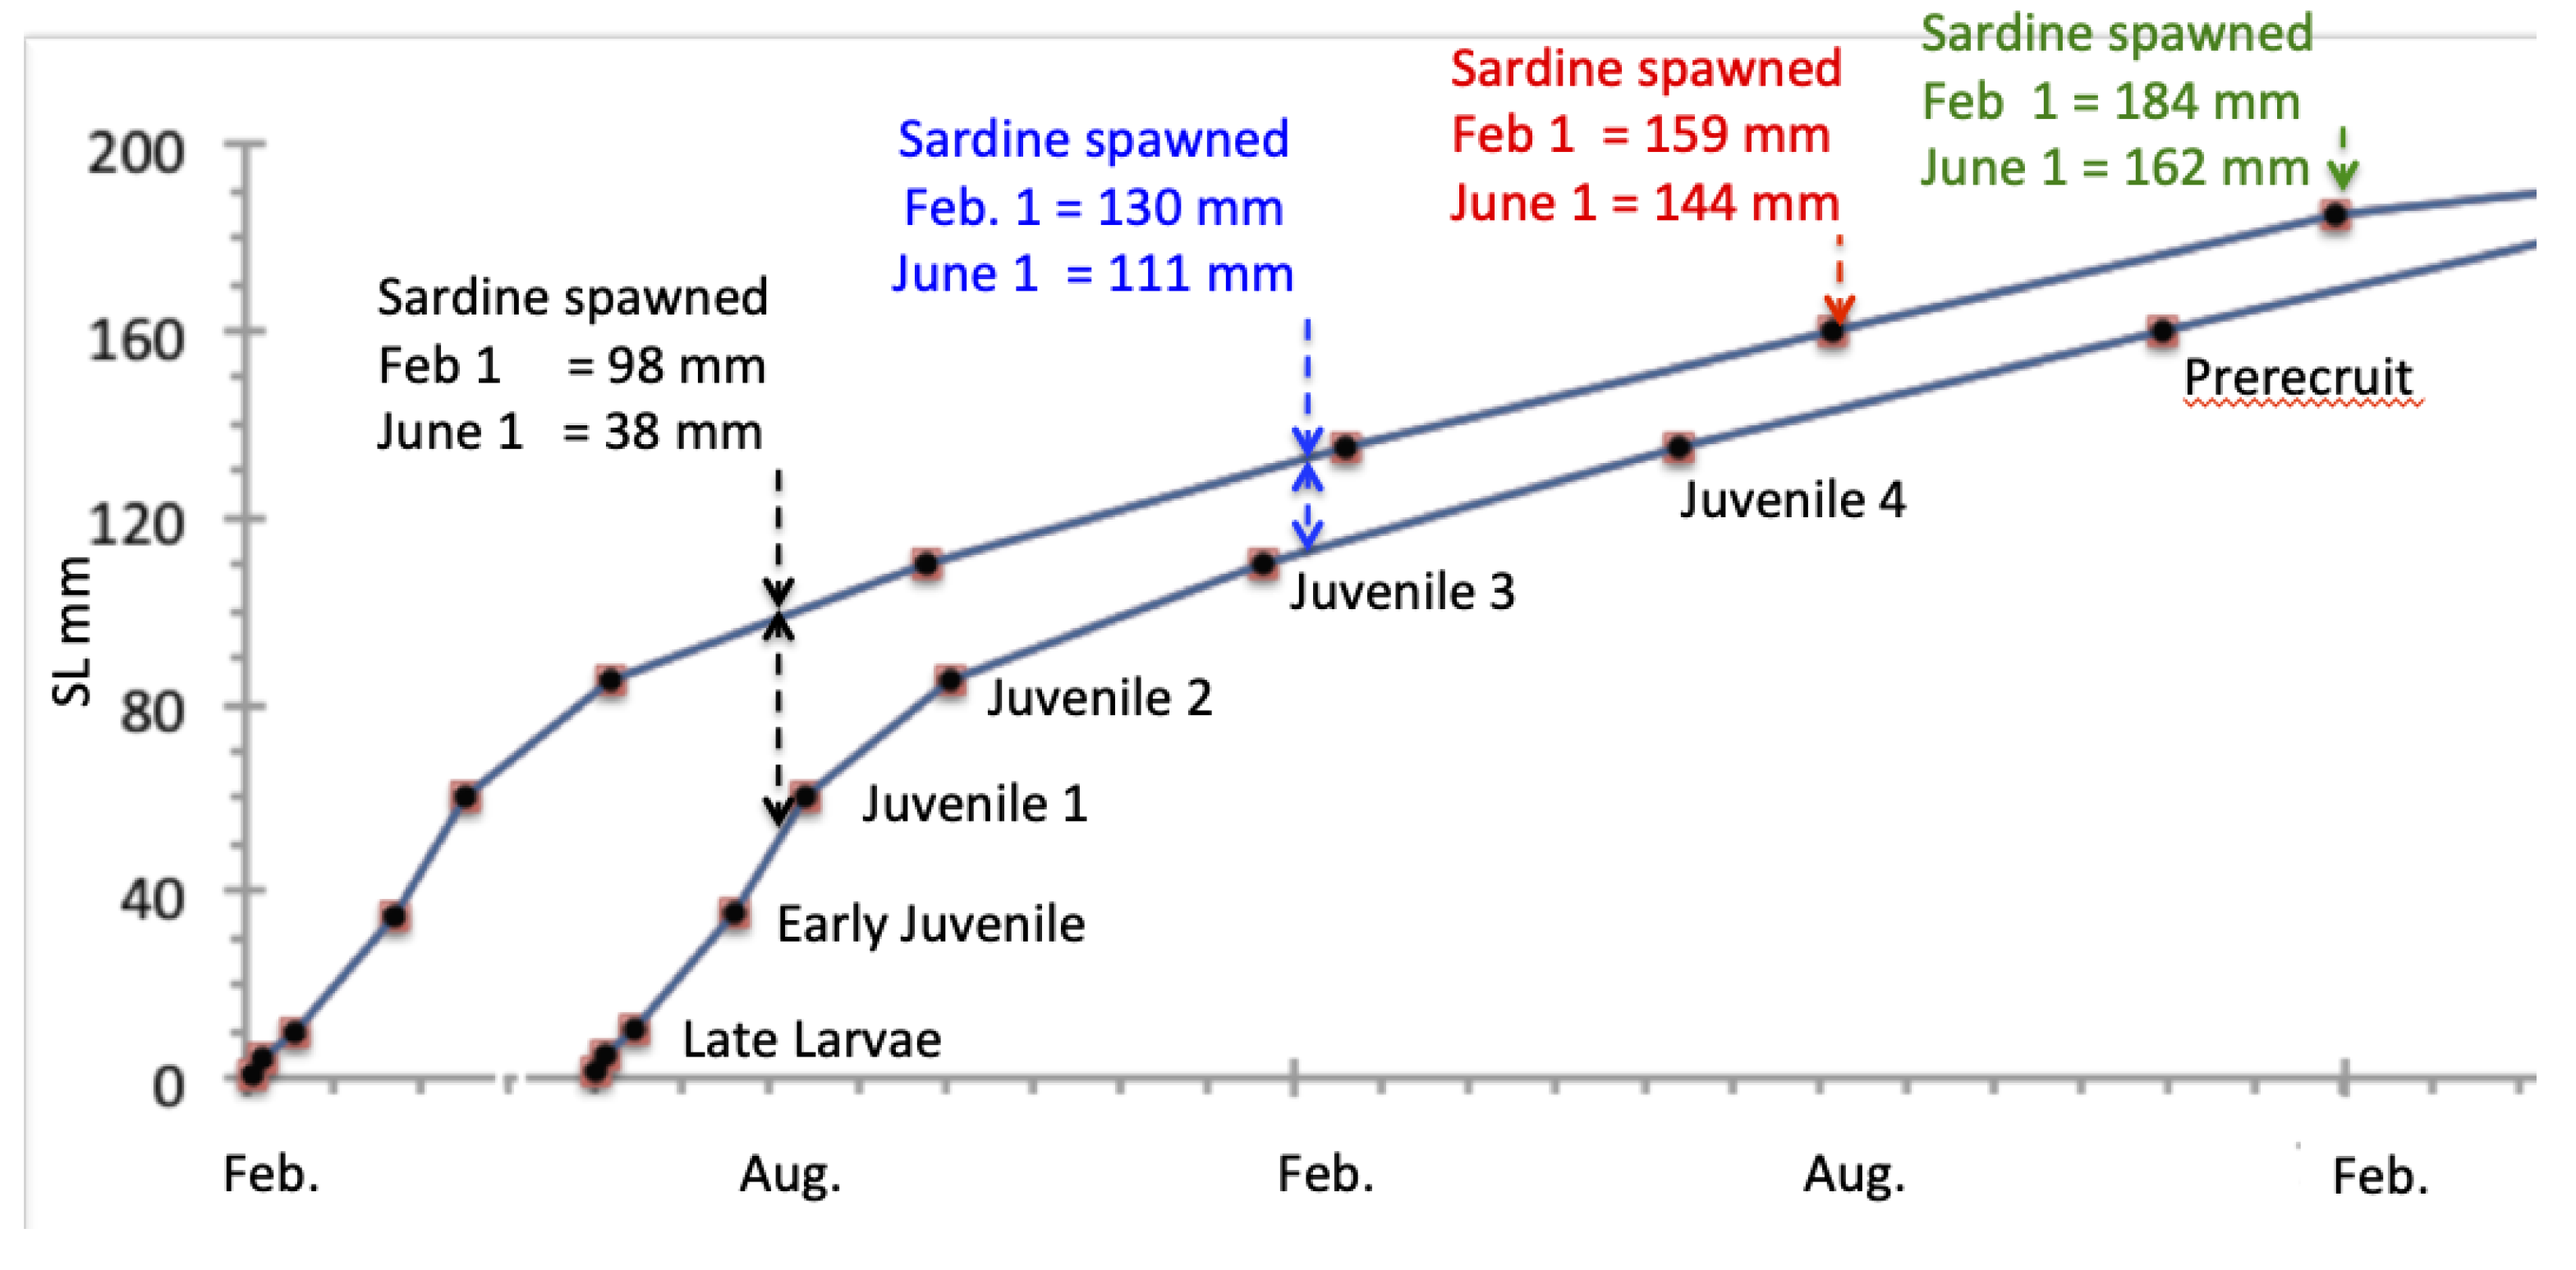
Figure 4.
Sardine Length Frequencies (Standard Length in millimeters). Size-at-age from Butler et al 1993 Table 4.
Figure 4.
Sardine Length Frequencies (Standard Length in millimeters). Size-at-age from Butler et al 1993 Table 4.
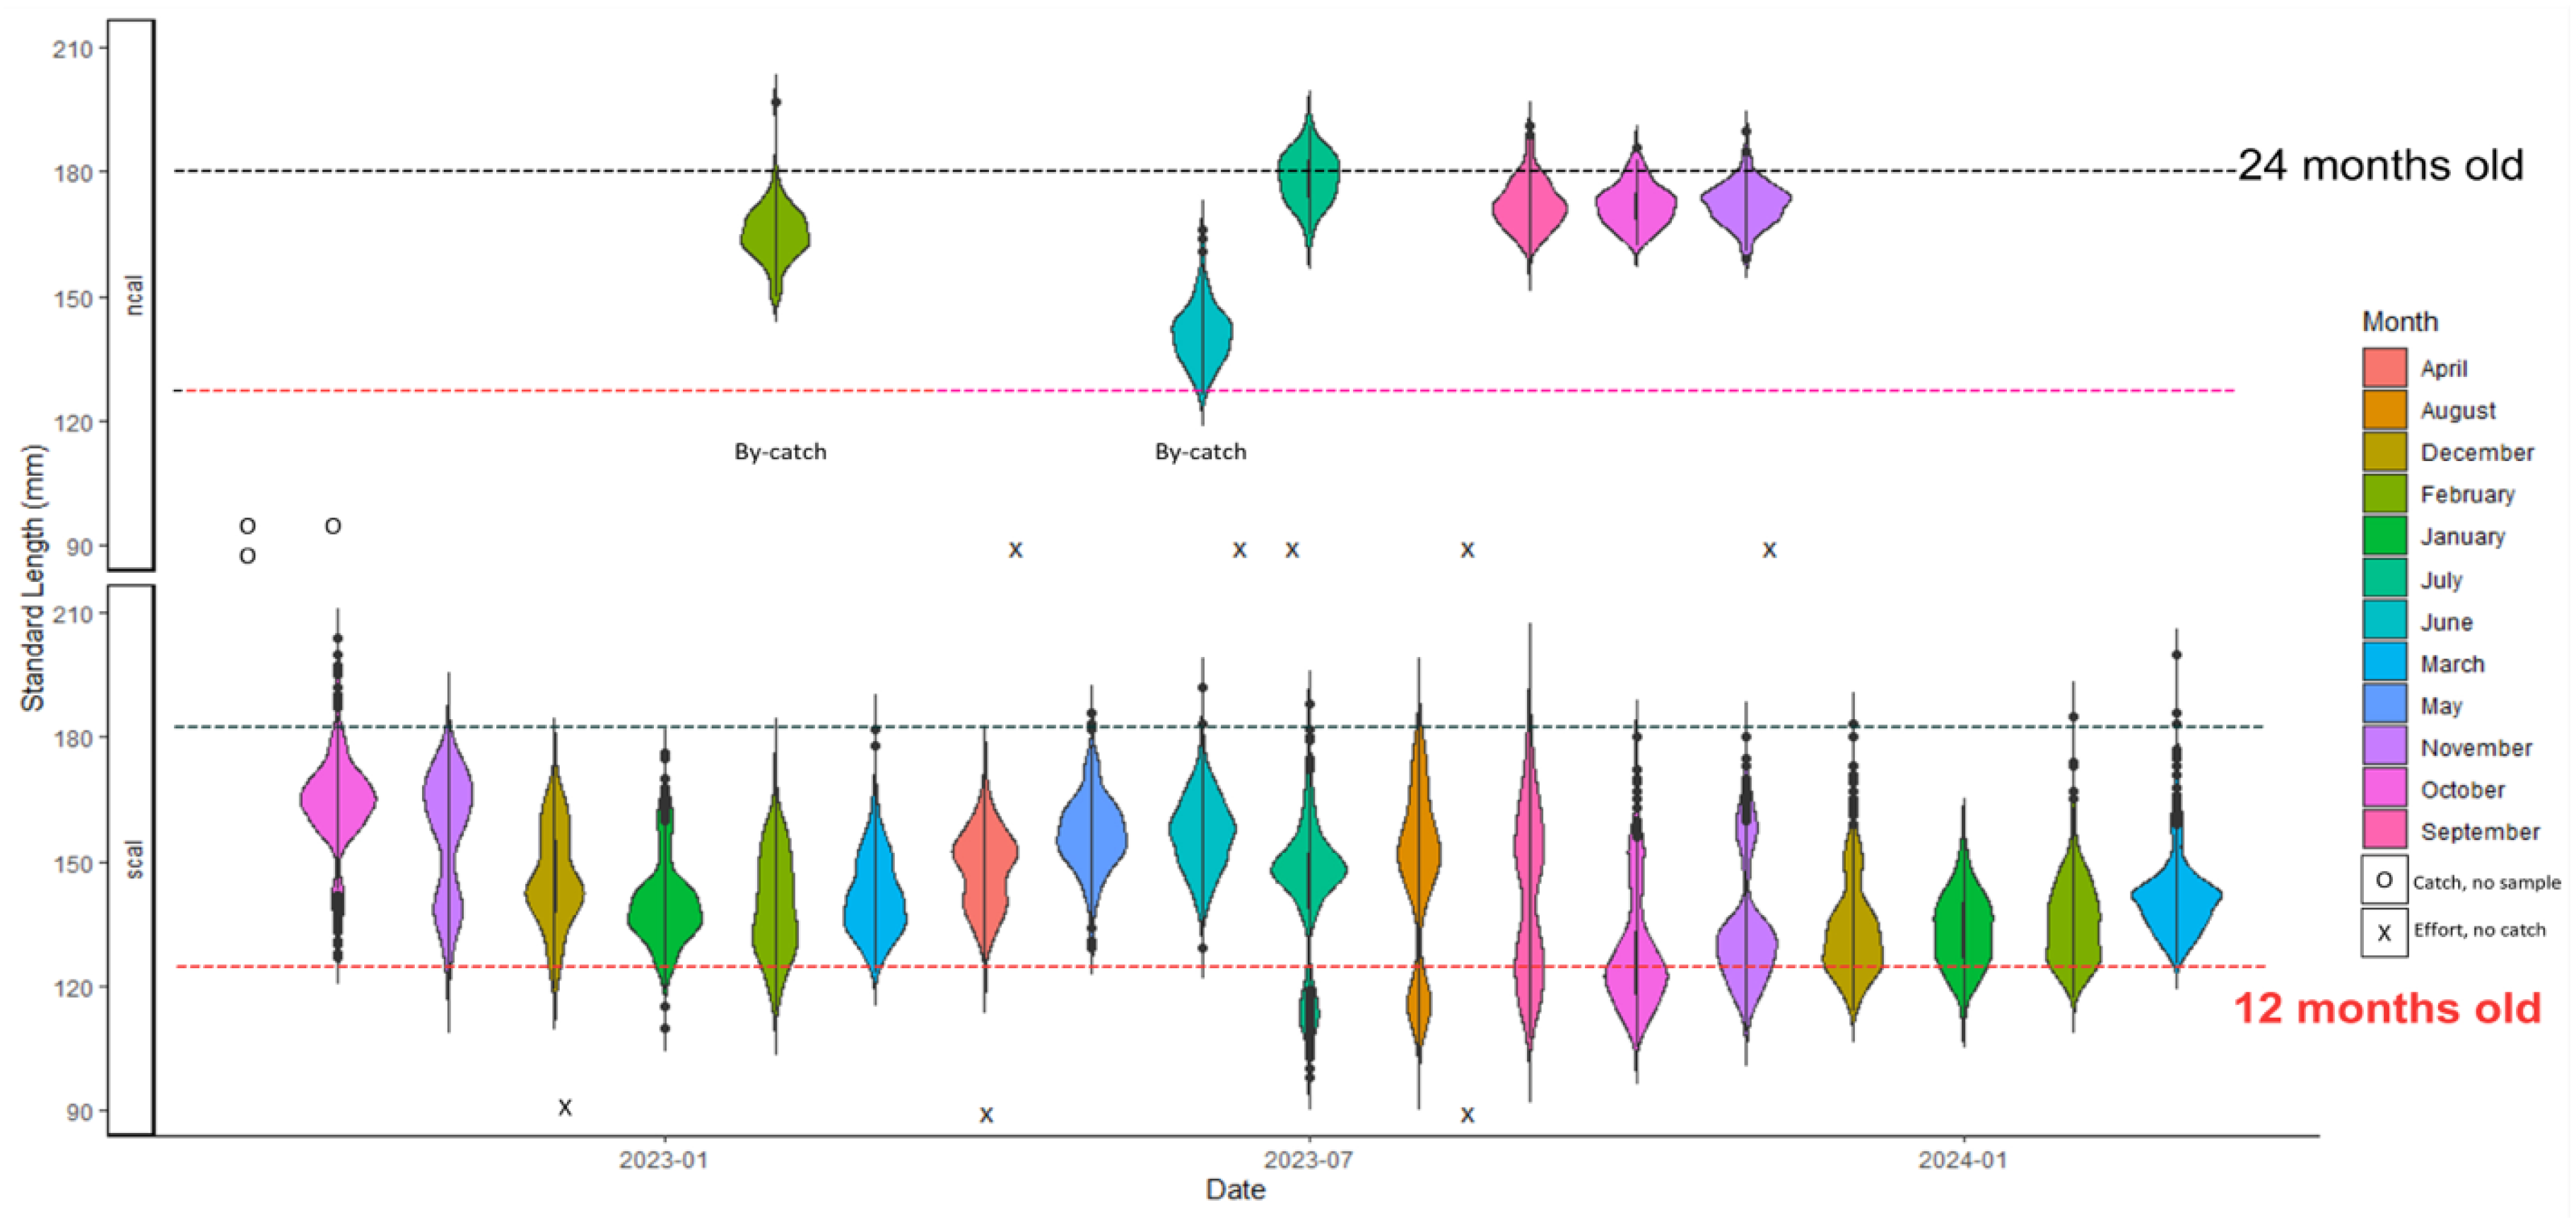
Figure 5.
Seasonal length frequencies of sardine in Southern California and Northern Baja California (California data provided by CDFW, Cold stock data provided by Concepcion Enciso Enciso and California length-at-age example from Butler et al. 1993).
Figure 5.
Seasonal length frequencies of sardine in Southern California and Northern Baja California (California data provided by CDFW, Cold stock data provided by Concepcion Enciso Enciso and California length-at-age example from Butler et al. 1993).
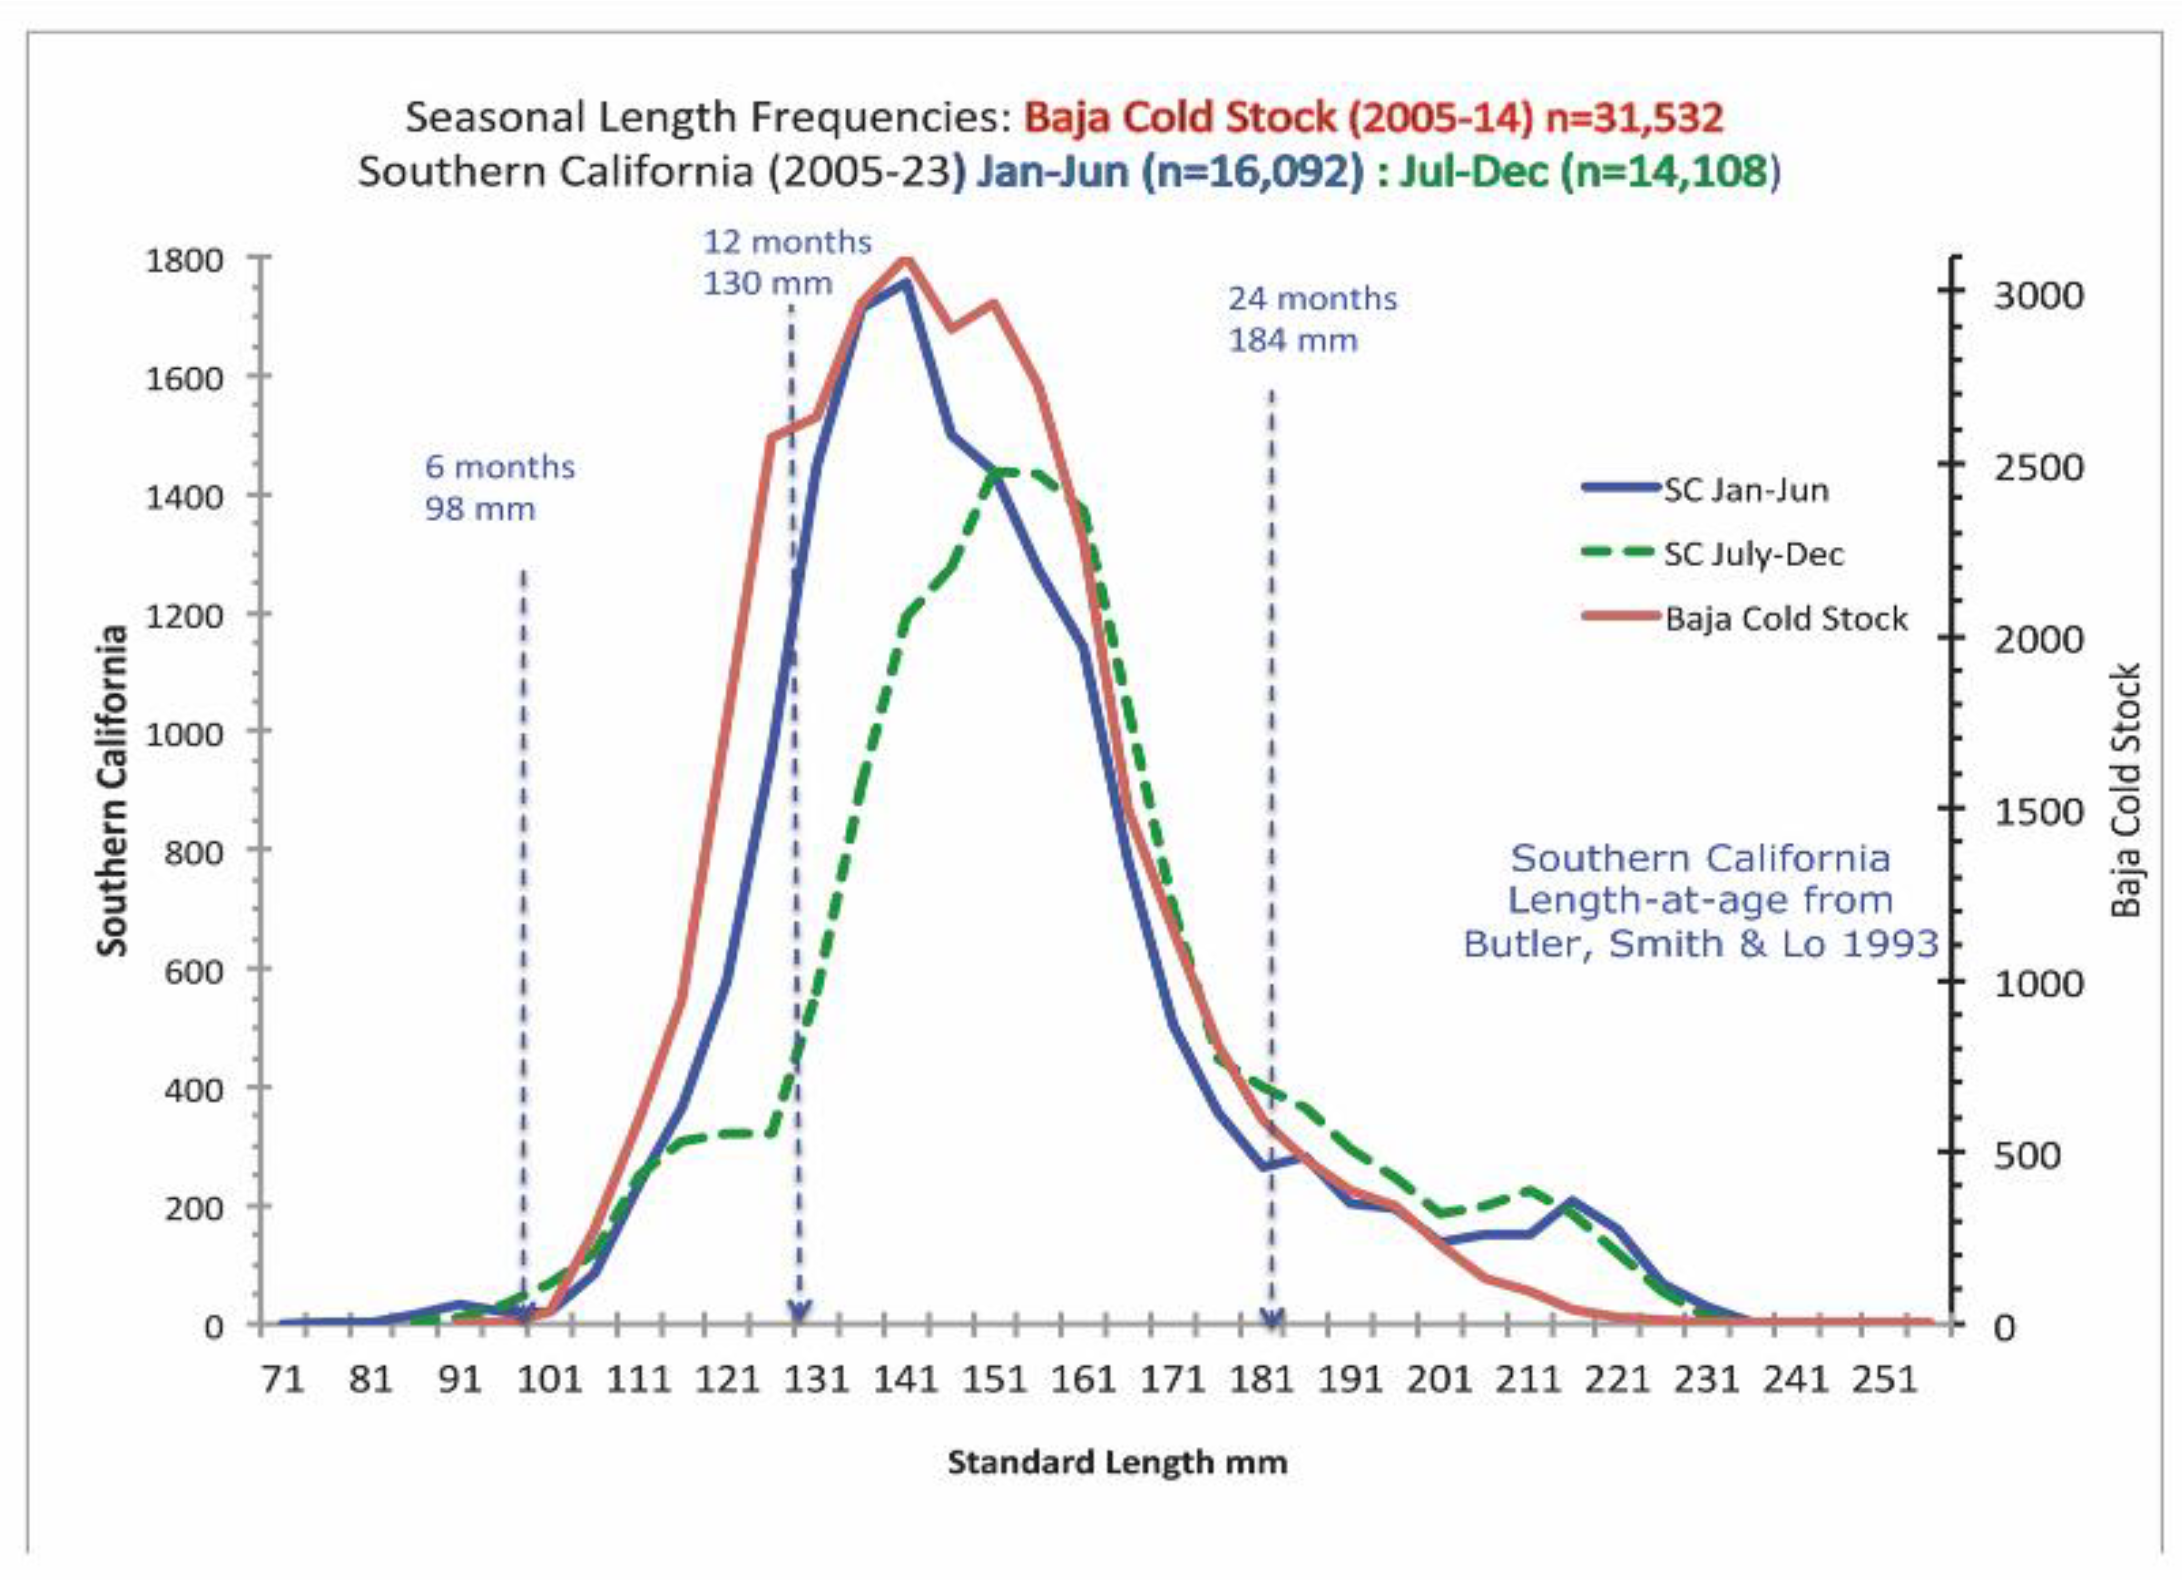
Figure 6.
Multiyear (1998-2019) distribution of sardine eggs from CUFES spring samples. (Adapted from Zwolinsky and Demer, 2023).
Figure 6.
Multiyear (1998-2019) distribution of sardine eggs from CUFES spring samples. (Adapted from Zwolinsky and Demer, 2023).
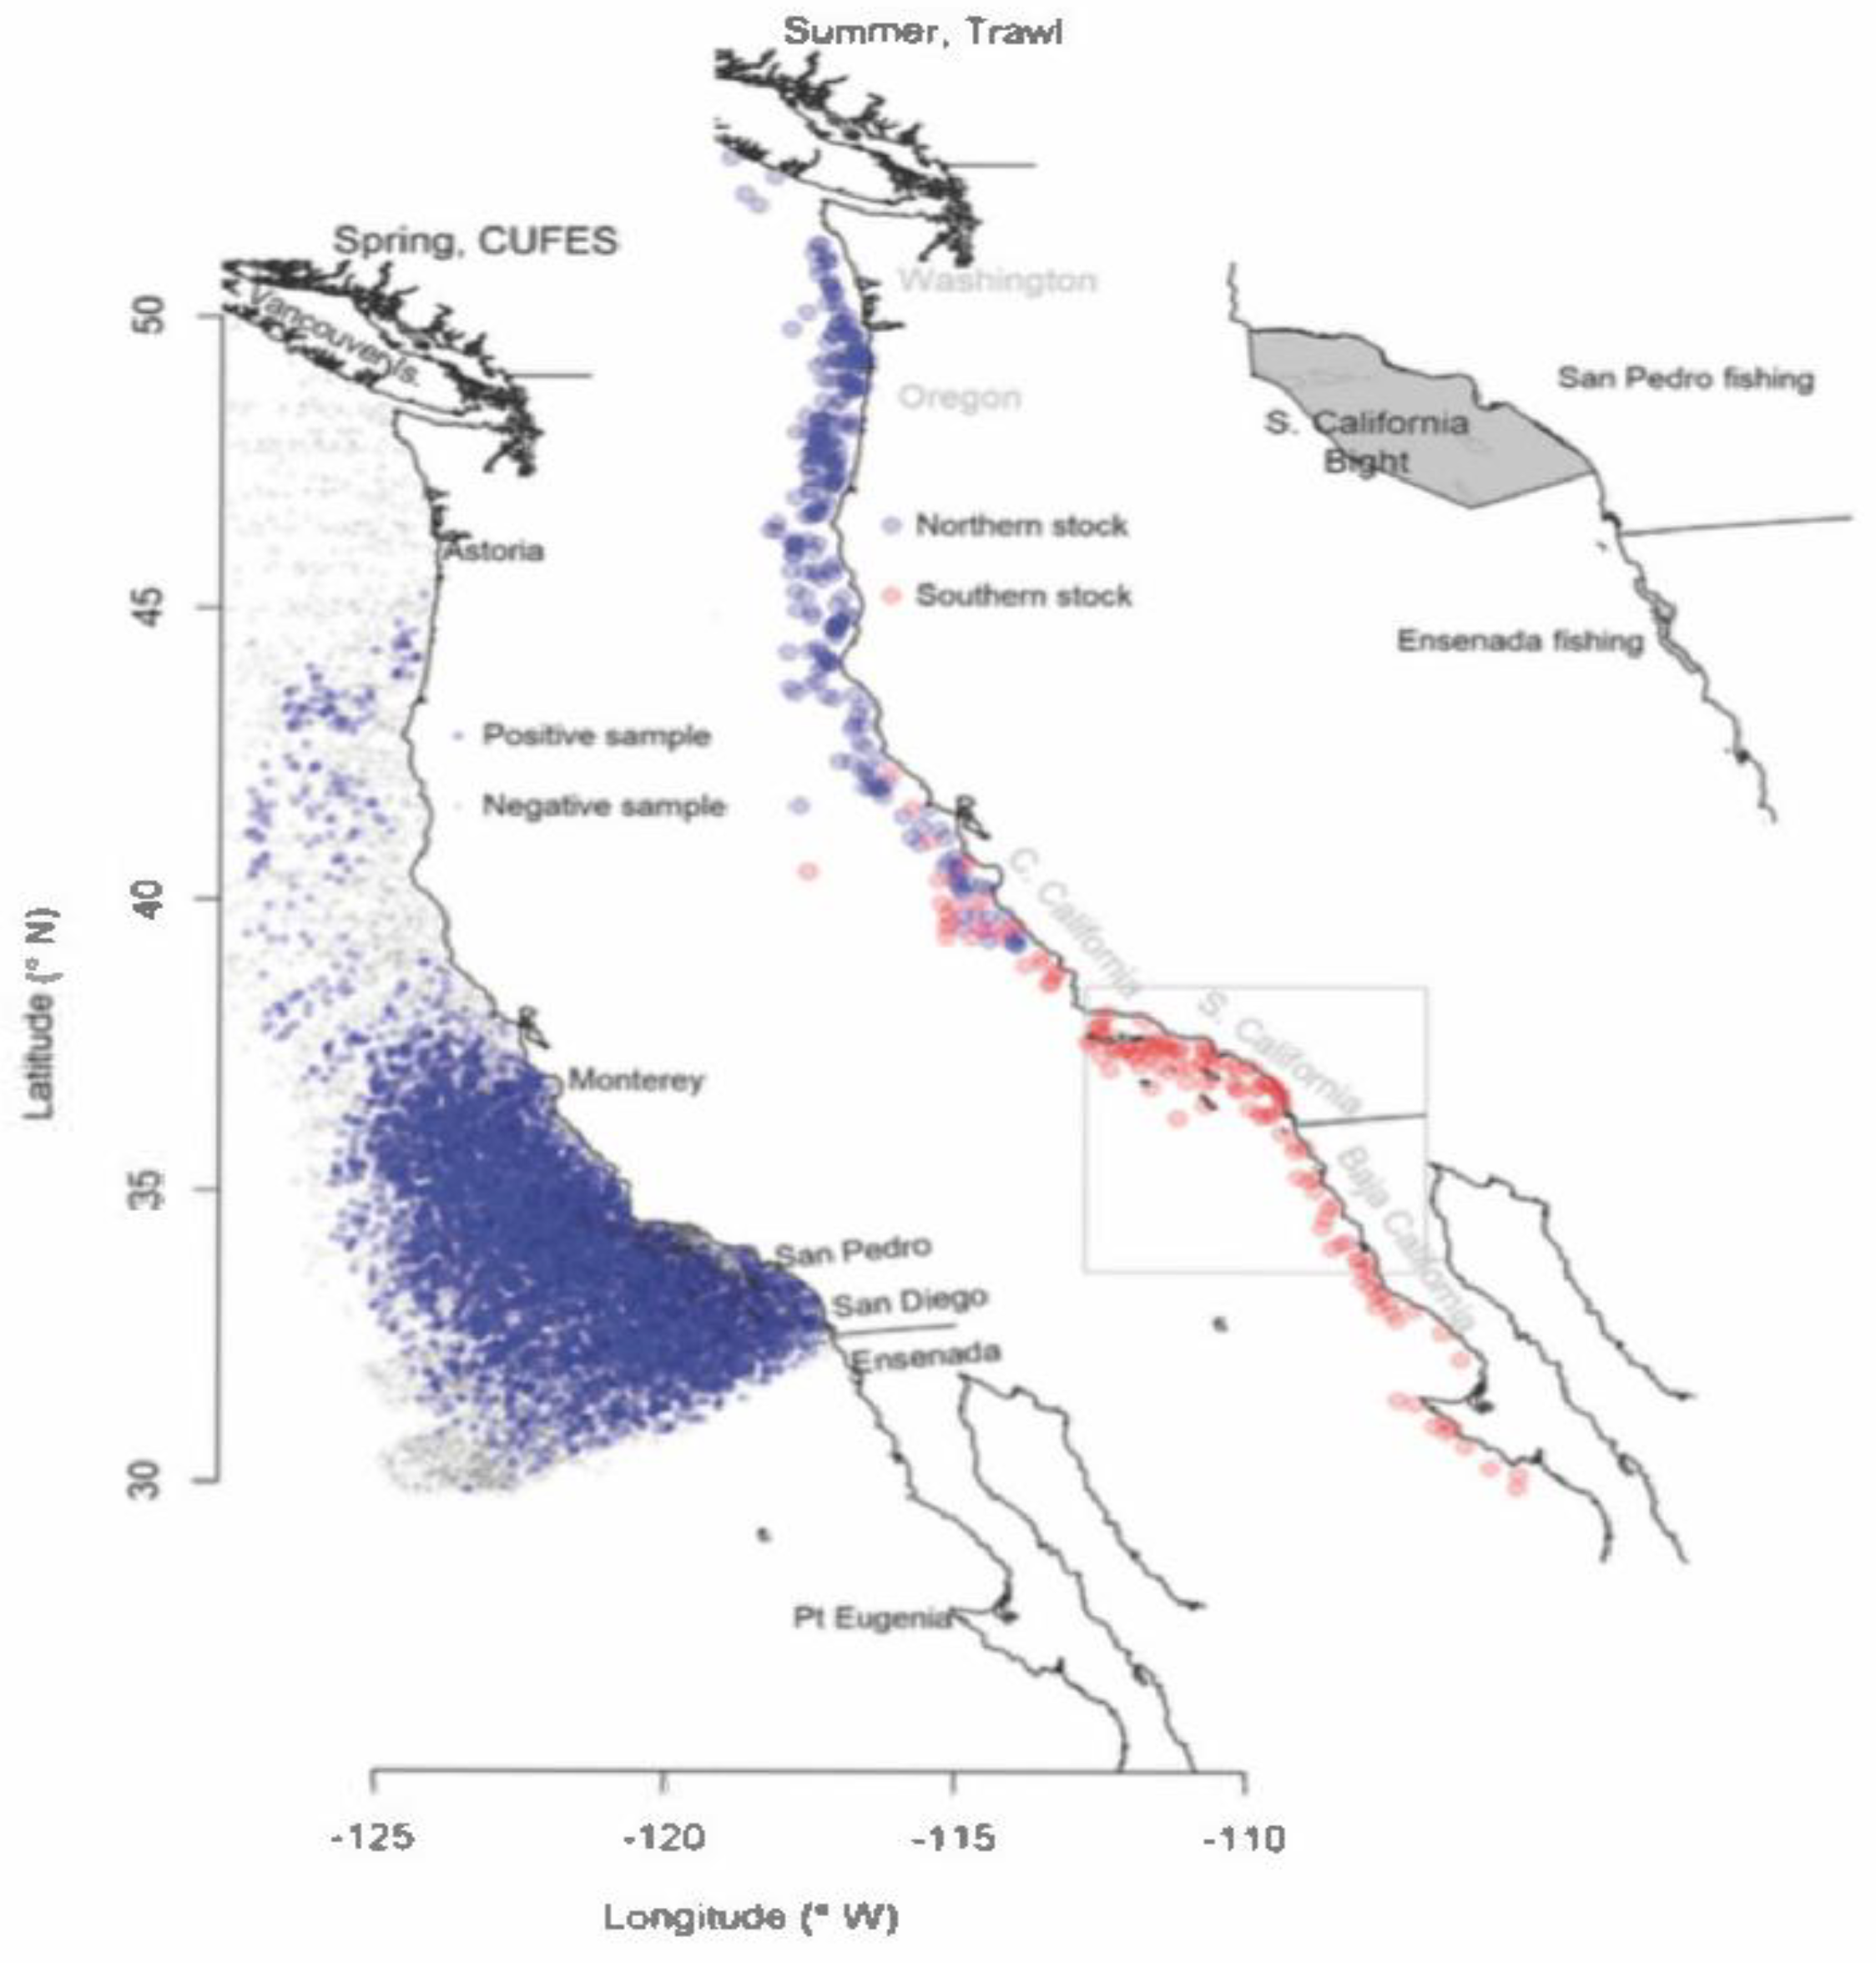
Figure 7.
Map of the California Current System with major regions, currents and geographic features. (From Checkley et al., 2009b).
Figure 7.
Map of the California Current System with major regions, currents and geographic features. (From Checkley et al., 2009b).
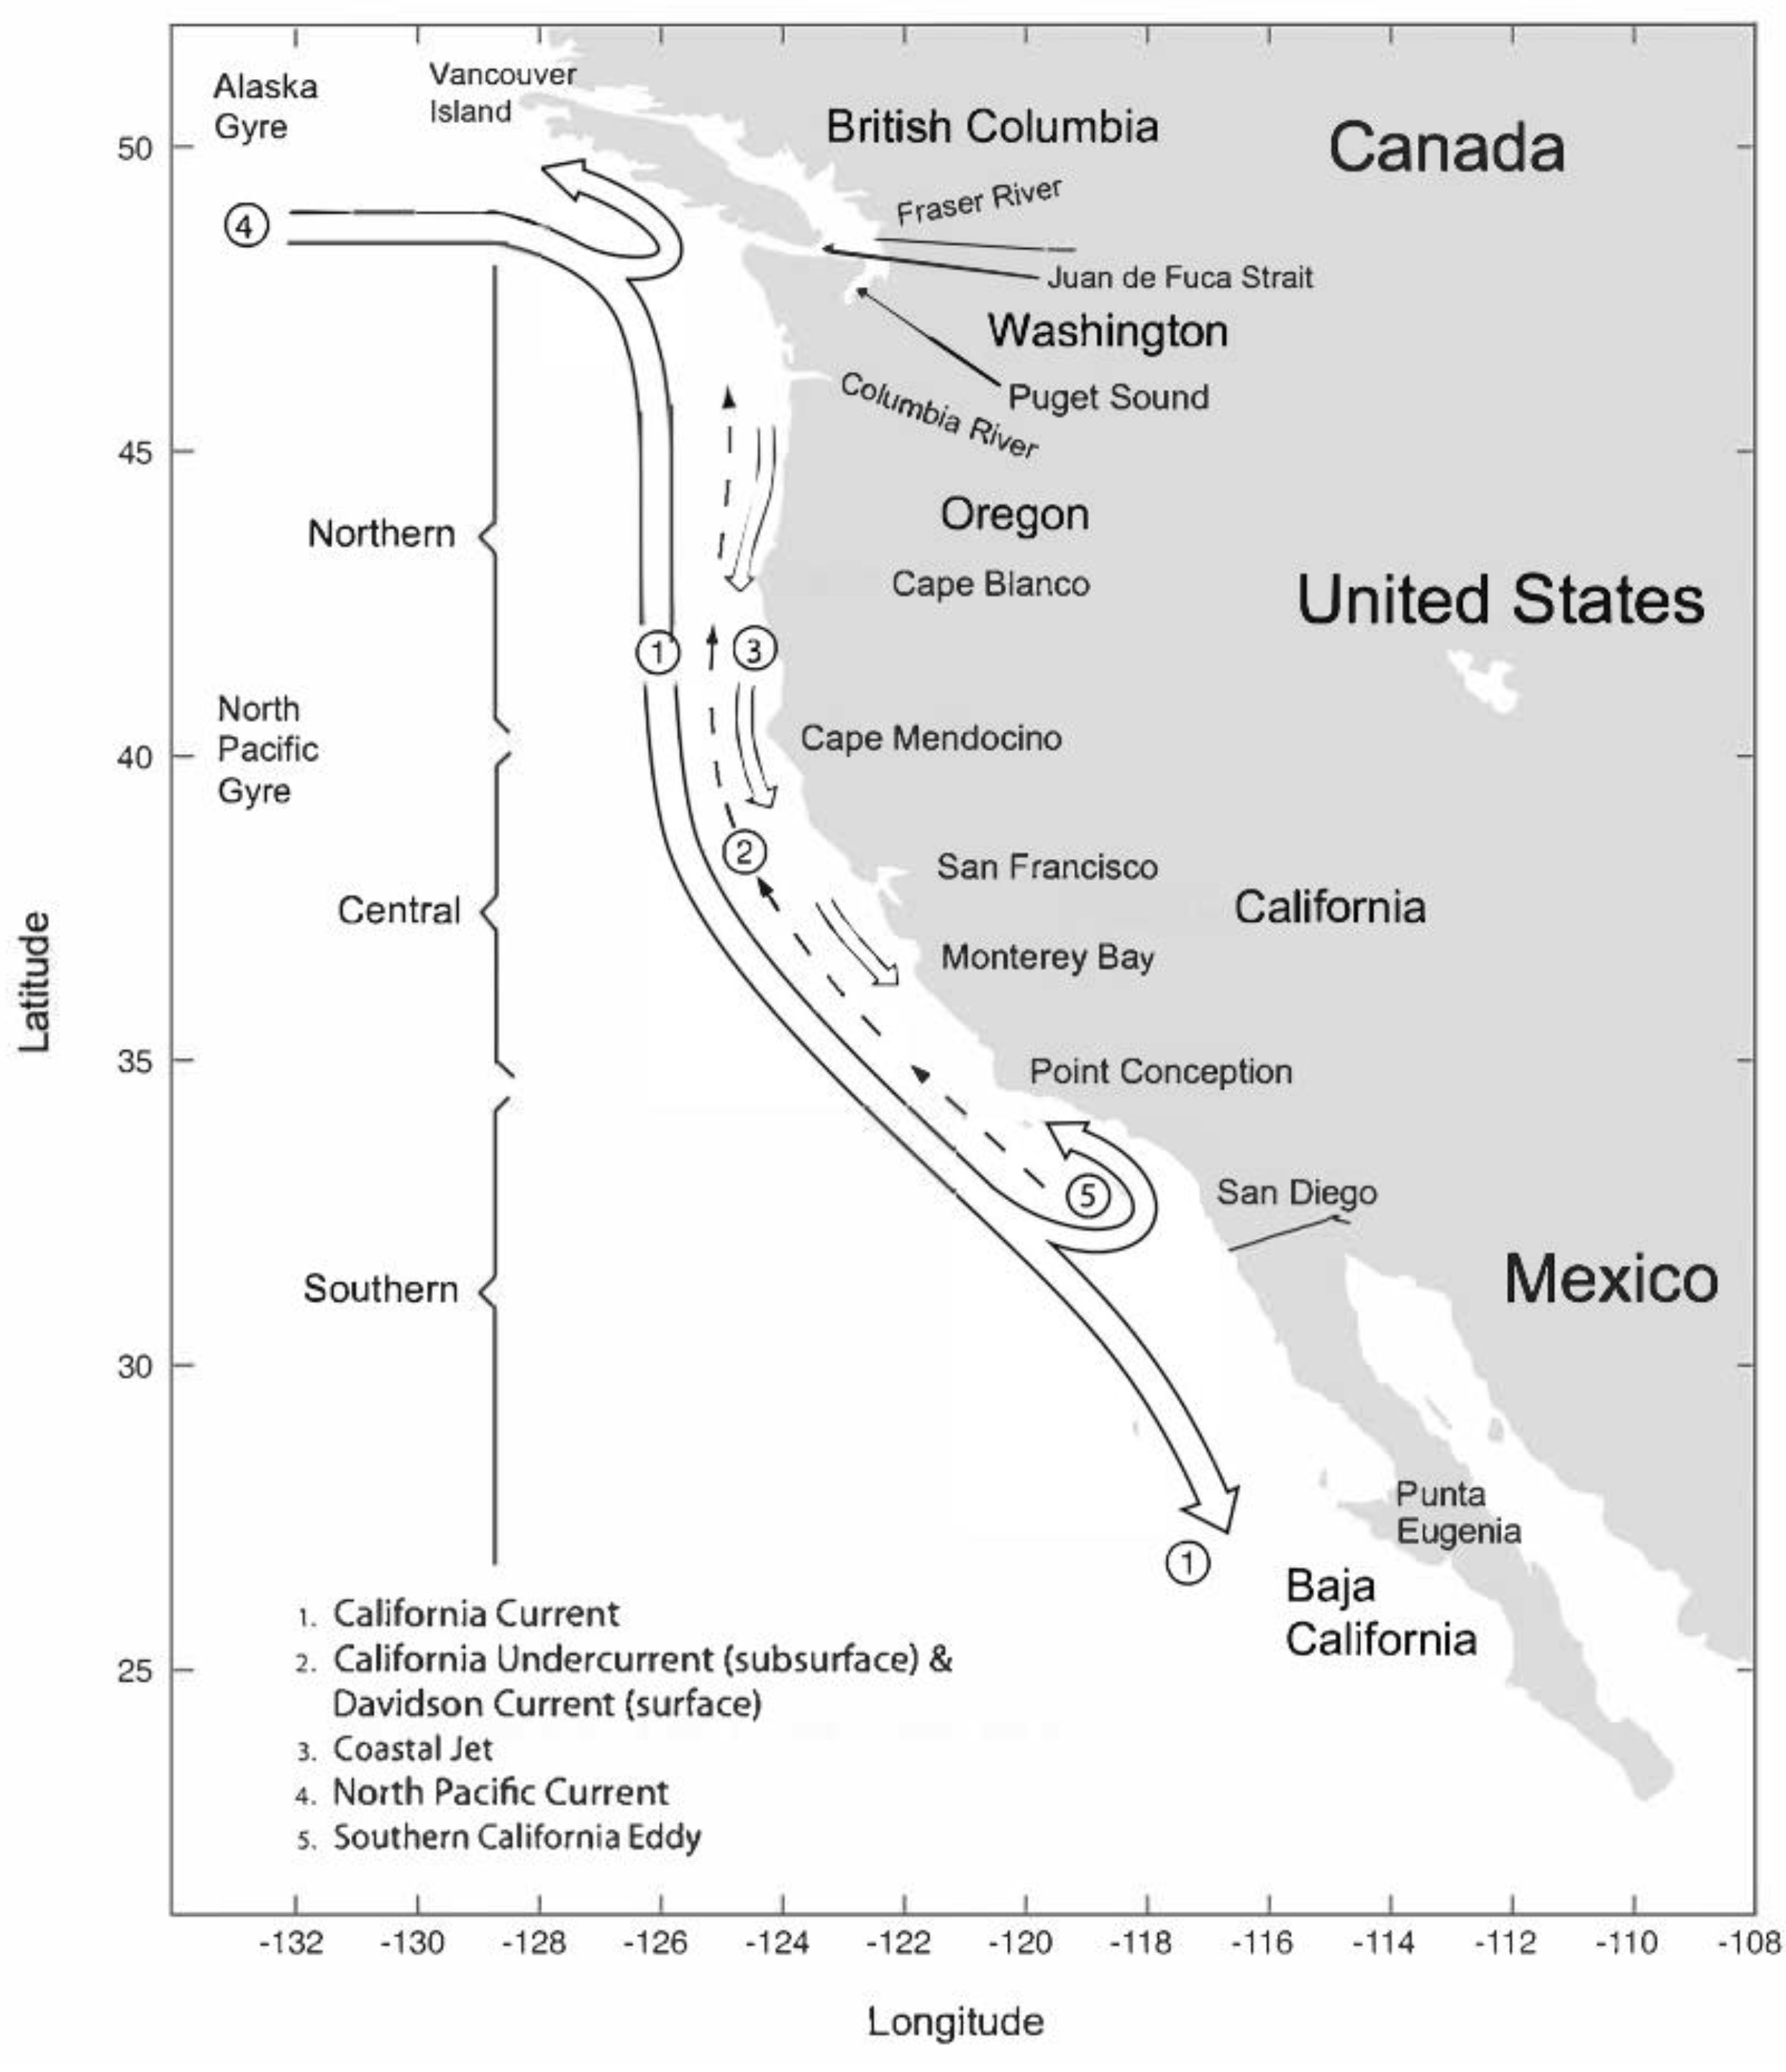
Figure 8.
Monthly composites of chlorophyll from ESA’s Ocean Colour Climate Change Initiative (OC-CCI) dataset generated using data from Jan 1998 to Dec 2024. (Adapted from R.Parrish, unpub. Source: West Coast node of CoastWatch ERDDAP).
Figure 8.
Monthly composites of chlorophyll from ESA’s Ocean Colour Climate Change Initiative (OC-CCI) dataset generated using data from Jan 1998 to Dec 2024. (Adapted from R.Parrish, unpub. Source: West Coast node of CoastWatch ERDDAP).
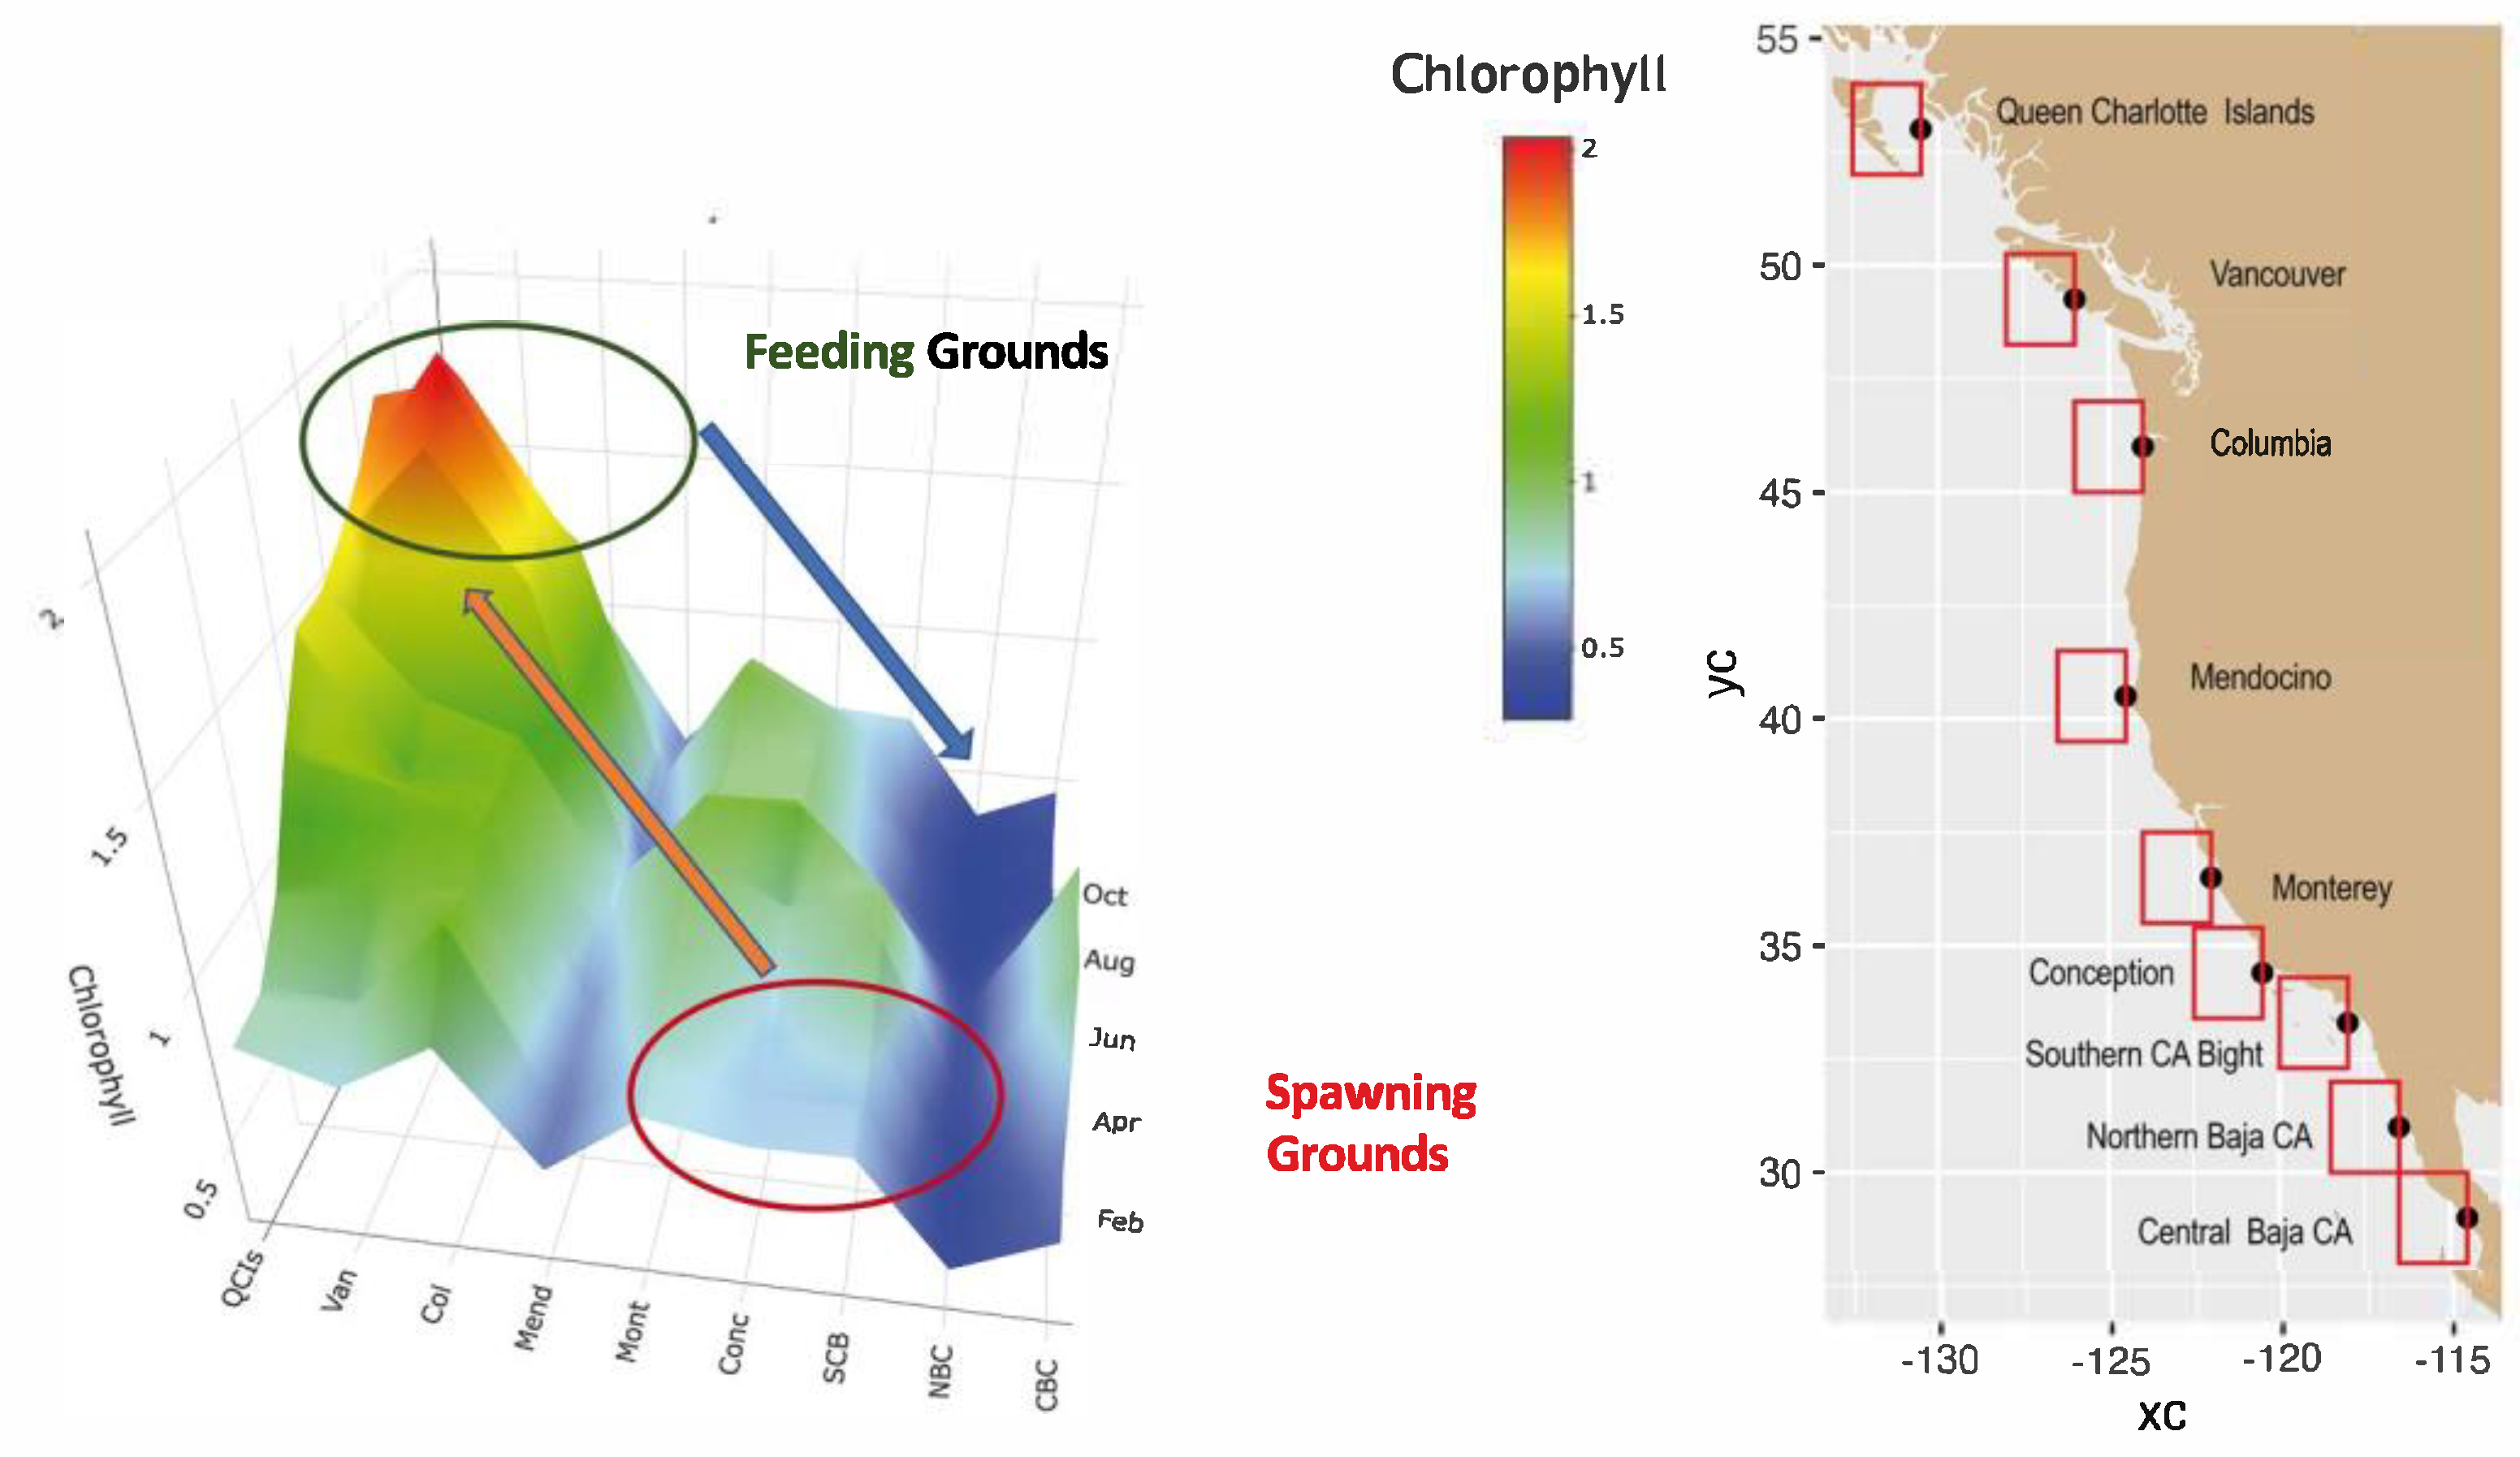
Figure 9.
Landings of sardine in California 1926-2023. Source: CDFW landings records.
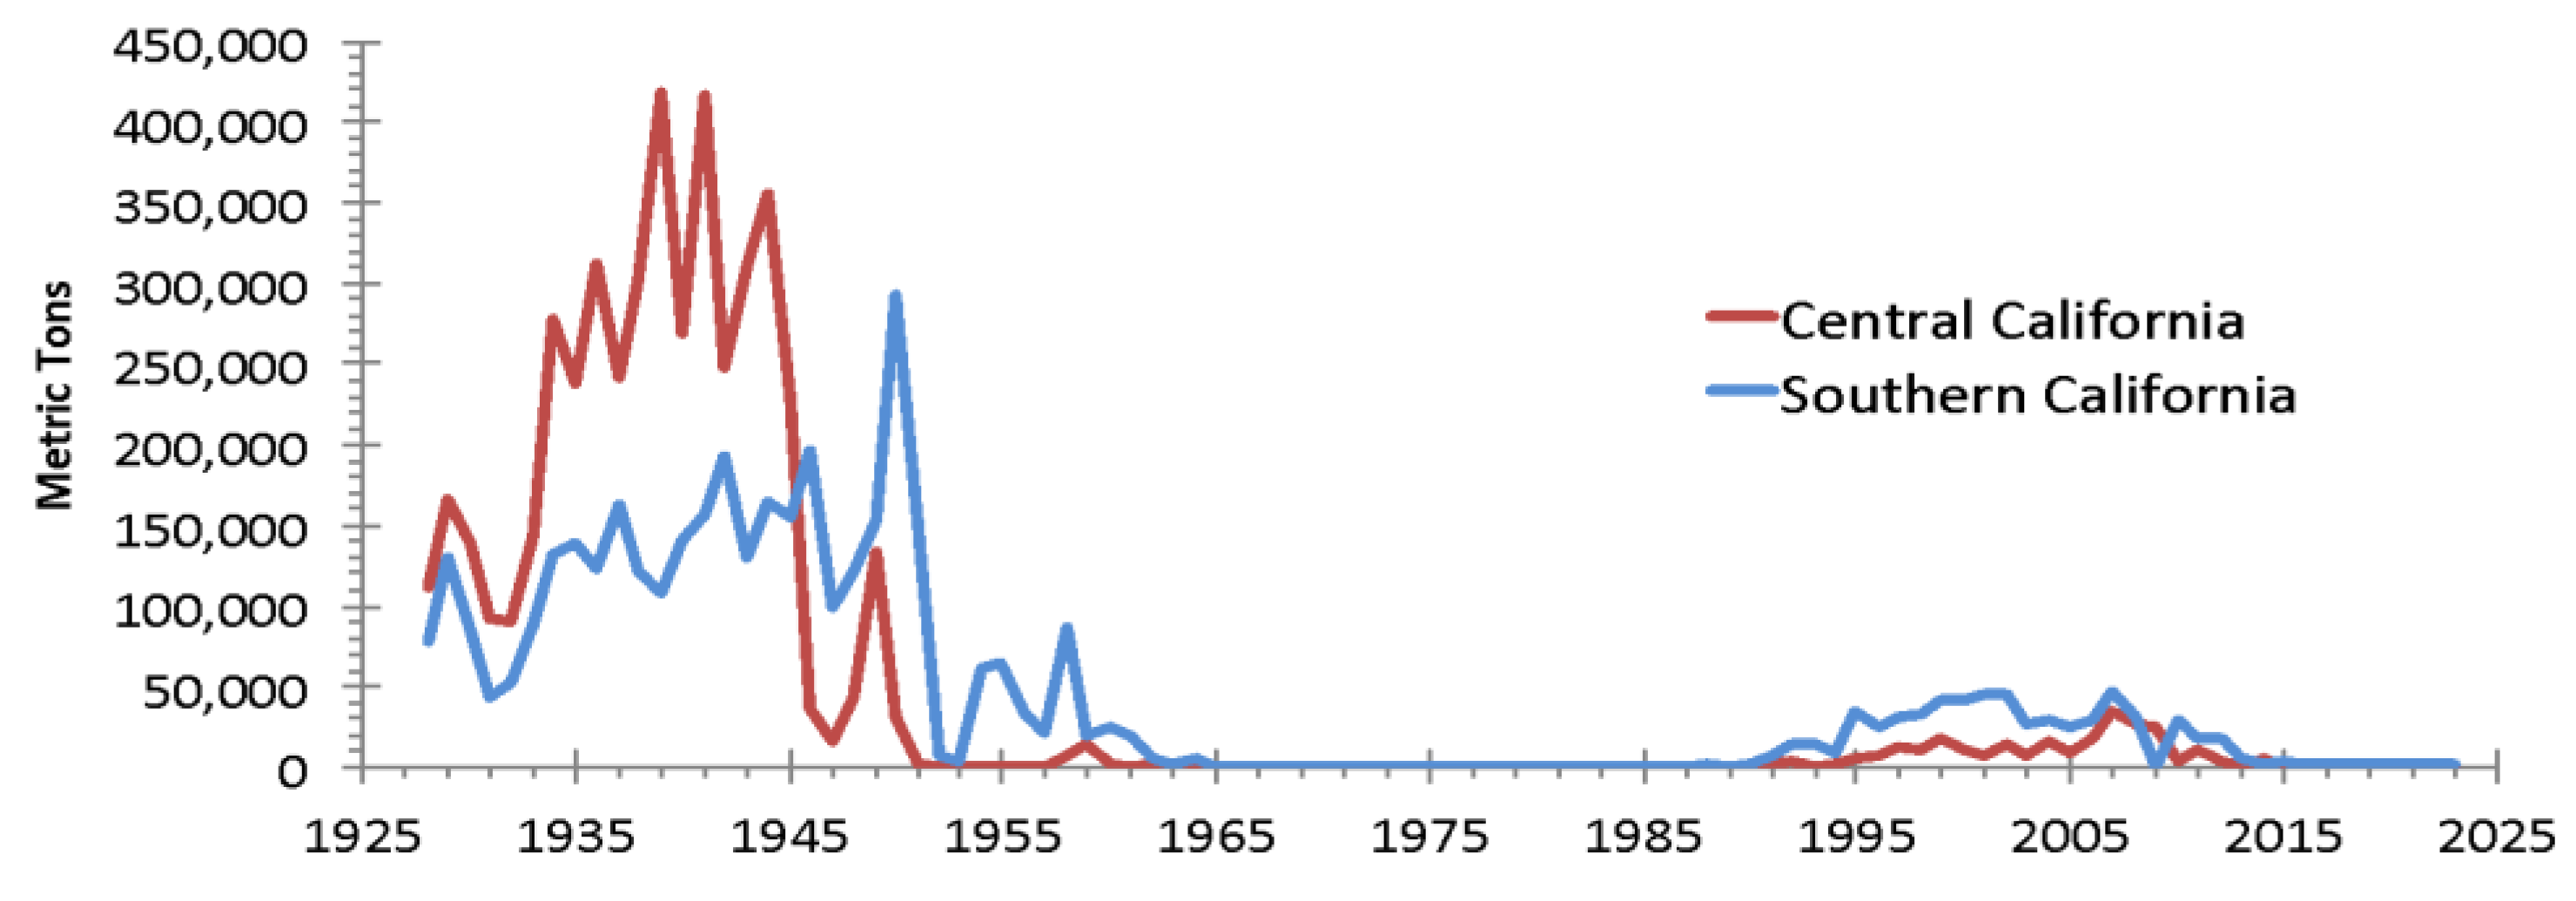
Figure 10.
Length frequencies and distribution of sardine from 2023 sardine AT Survey. (From J. Zwolinski, Presentation to Sardine STAR Panel, 2024).
Figure 10.
Length frequencies and distribution of sardine from 2023 sardine AT Survey. (From J. Zwolinski, Presentation to Sardine STAR Panel, 2024).
Disclaimer/Publisher’s Note: The statements, opinions and data contained in all publications are solely those of the individual author(s) and contributor(s) and not of MDPI and/or the editor(s). MDPI and/or the editor(s) disclaim responsibility for any injury to people or property resulting from any ideas, methods, instructions or products referred to in the content. |
© 2025 by the authors. Licensee MDPI, Basel, Switzerland. This article is an open access article distributed under the terms and conditions of the Creative Commons Attribution (CC BY) license (http://creativecommons.org/licenses/by/4.0/).
Copyright: This open access article is published under a Creative Commons CC BY 4.0 license, which permit the free download, distribution, and reuse, provided that the author and preprint are cited in any reuse.


