1. Introduction
The In engineering construction, slope stability is a crucial issue, and slope instability can lead to project failure or even cause casualties. There are many factors affecting the stability of slopes, such as topography, geomorphology, geomaterials, construction methods and hydrogeological conditions. In addition to this, rainfall infiltration is also an important factor in slope destabilization in engineering [
1]. On the one hand, rainfall infiltration will increase the water content and pore water pressure of the slope soil. This in turn leads to a decrease in matrix suction and a weakening of shear strength. On the other hand, rainfall increases the soil unit weight, which increases the slope sliding force. Both of these aspects increase the possibility of slope destabilization [
2,
3].
Scholars at home and abroad have carried out multi-faceted research on slope stability under rainfall conditions. It mainly focuses on theoretical model construction, numerical simulation and experimental analysis. In terms of theoretical modeling, Zhang F et al. [
4] innovatively combined the Green-Ampt model with the Fredlund criterion to propose a tensile strength cutoff (TSC) calculation model considering different rainfall conditions. And its applicability was verified by comparing with Fredlund and Mohr-Coulomb codes; Hao C et al. [
5] proposed a limit equilibrium method that strictly satisfies the three-dimensional force balance conditions. The effects of rainfall parameters on slope stability were systematically studied; Weihua F et al. [
6] and Han et al. [
7] combined the minimum potential energy method with the analytical solution of seepage field respectively. A real-time evaluation method of unsaturated soil slope stability was established.
In terms of numerical simulation, scholars have adopted a variety of analytical methods: Wang et al. [
8] investigated the stability of a three-layer non-uniform slope based on the generalized limit equilibrium method. The dynamic influence laws of rainfall parameters on seepage and stress fields were revealed; Ming et al. [
9] analyzed the stability of a landslide during a rainstorm by transient seepage-stability coupling. The dynamic stability of landslides during heavy rainfall was assessed; Rahayu et al. [
10] found that recycled concrete aggregate (RCA) protection can significantly improve the slope safety factor through a comparative study; Yuke et al. [
11] systematically analyzed the effects of multiple rainfall parameters and protection measures by using a coupled flow-solidity method; and Kenta et al. [
12] developed a three dimensional risk assessment method.
In terms of experimental studies, Miao F et al. [
13] combined numerical simulation through centrifugal modeling tests. The mechanism of water level fluctuation on slope deformation was revealed; Tian et al. [
14] established a finite element model considering rainfall parameters based on indoor geotechnical tests; and Zhang et al. [
15] innovatively used a discrete element model to investigate the effects of different infiltration boundaries on slope instability. It is particularly noteworthy that most scholars [
16,
17] found that fissure seepage significantly accelerates rainwater infiltration, leading to a rapid decrease in the stability coefficient.
In addition, significant progress has been made in several specialized studies: Cheng Q et al. [
18] combined erosion criteria with an infinite slope model to quantitatively analyze the impact of fine particle migration on stability; Zhen Z L et al. [
19] established a variable moisture content infiltration model based on the Green-Ampt model; and Sun et al. [
20] revealed the failure mechanism of silty sand slopes through saturated-unsaturated theory. These studies provide important theoretical foundations and technical support for a deeper understanding of the mechanisms underlying rainfall-induced slope instability.
Through the combing analysis of domestic and foreign scholars for the stability analysis of slope rainfall infiltration research, it can be found that most scholars use saturated-unsaturated seepage theory combined with finite element, numerical simulation and other conceptual models to comprehensively analyze the stability analysis of slopes under rainfall infiltration conditions. Based on a typical slope project in southern Shaanxi, this paper adopts the analysis method of saturated-unsaturated seepage theory and coupled flow and solid of strength reduction method, combined with three-dimensional actual geological model. The three-dimensional slope stability analysis is carried out by self-weight condition and rainfall infiltration condition. According to the results of the analysis, the protective measures for the key parts of the slope are proposed to provide a basis for the stability of the slope under rainfall conditions and disaster prevention.
2. Numerical Modeling and Methods
2.1. Project Overview
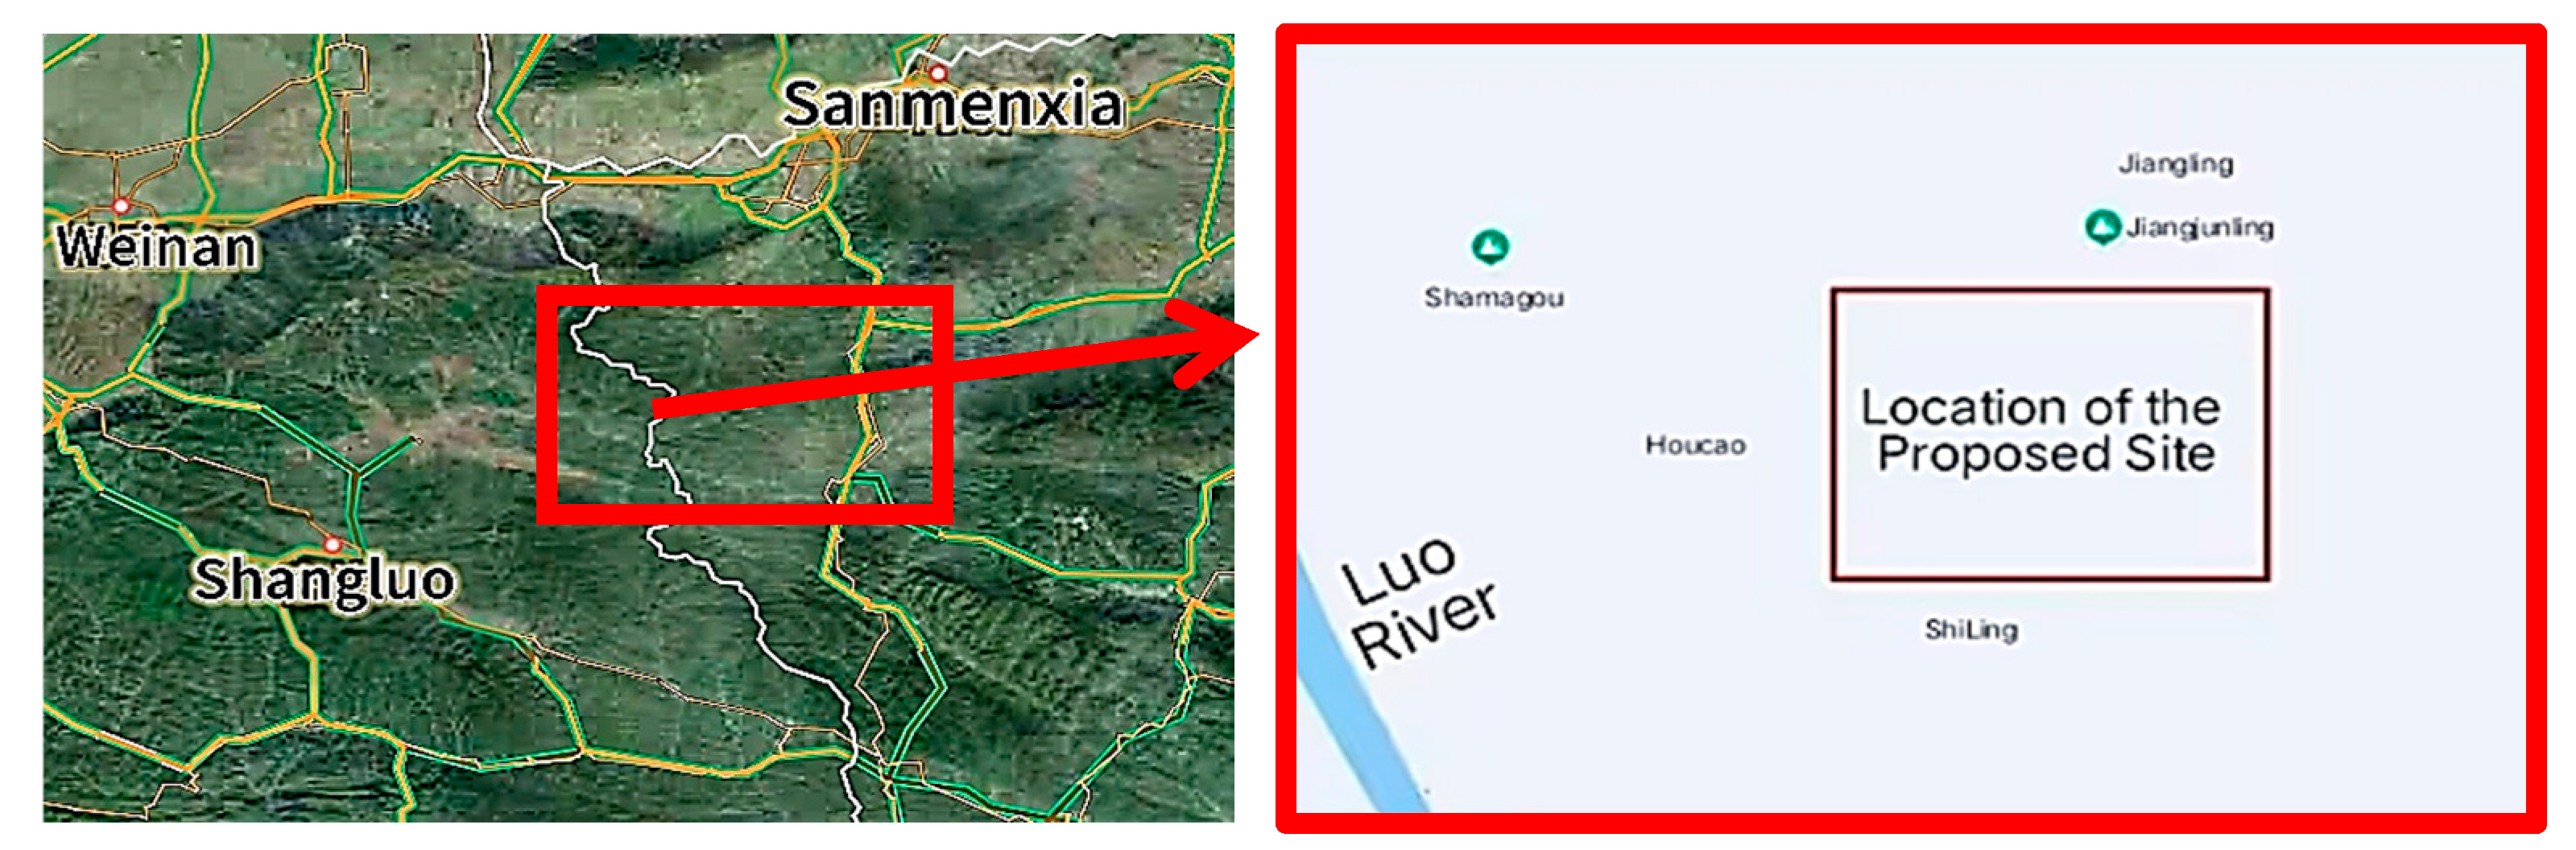
The The proposed site for this photovoltaic power generation project is primarily located on a mountain slope with a steep gradient and significant topographic undulations, generally sloping from south to north. Ground elevations at survey points range from 834.27 to 1139.81 meters. The site borders the Luo River to the southwest at a straight-line distance of approximately 3.4 kilometers. The surrounding terrain consists mainly of mountainous land with natural pasture vegetation. The proposed site is illustrated in
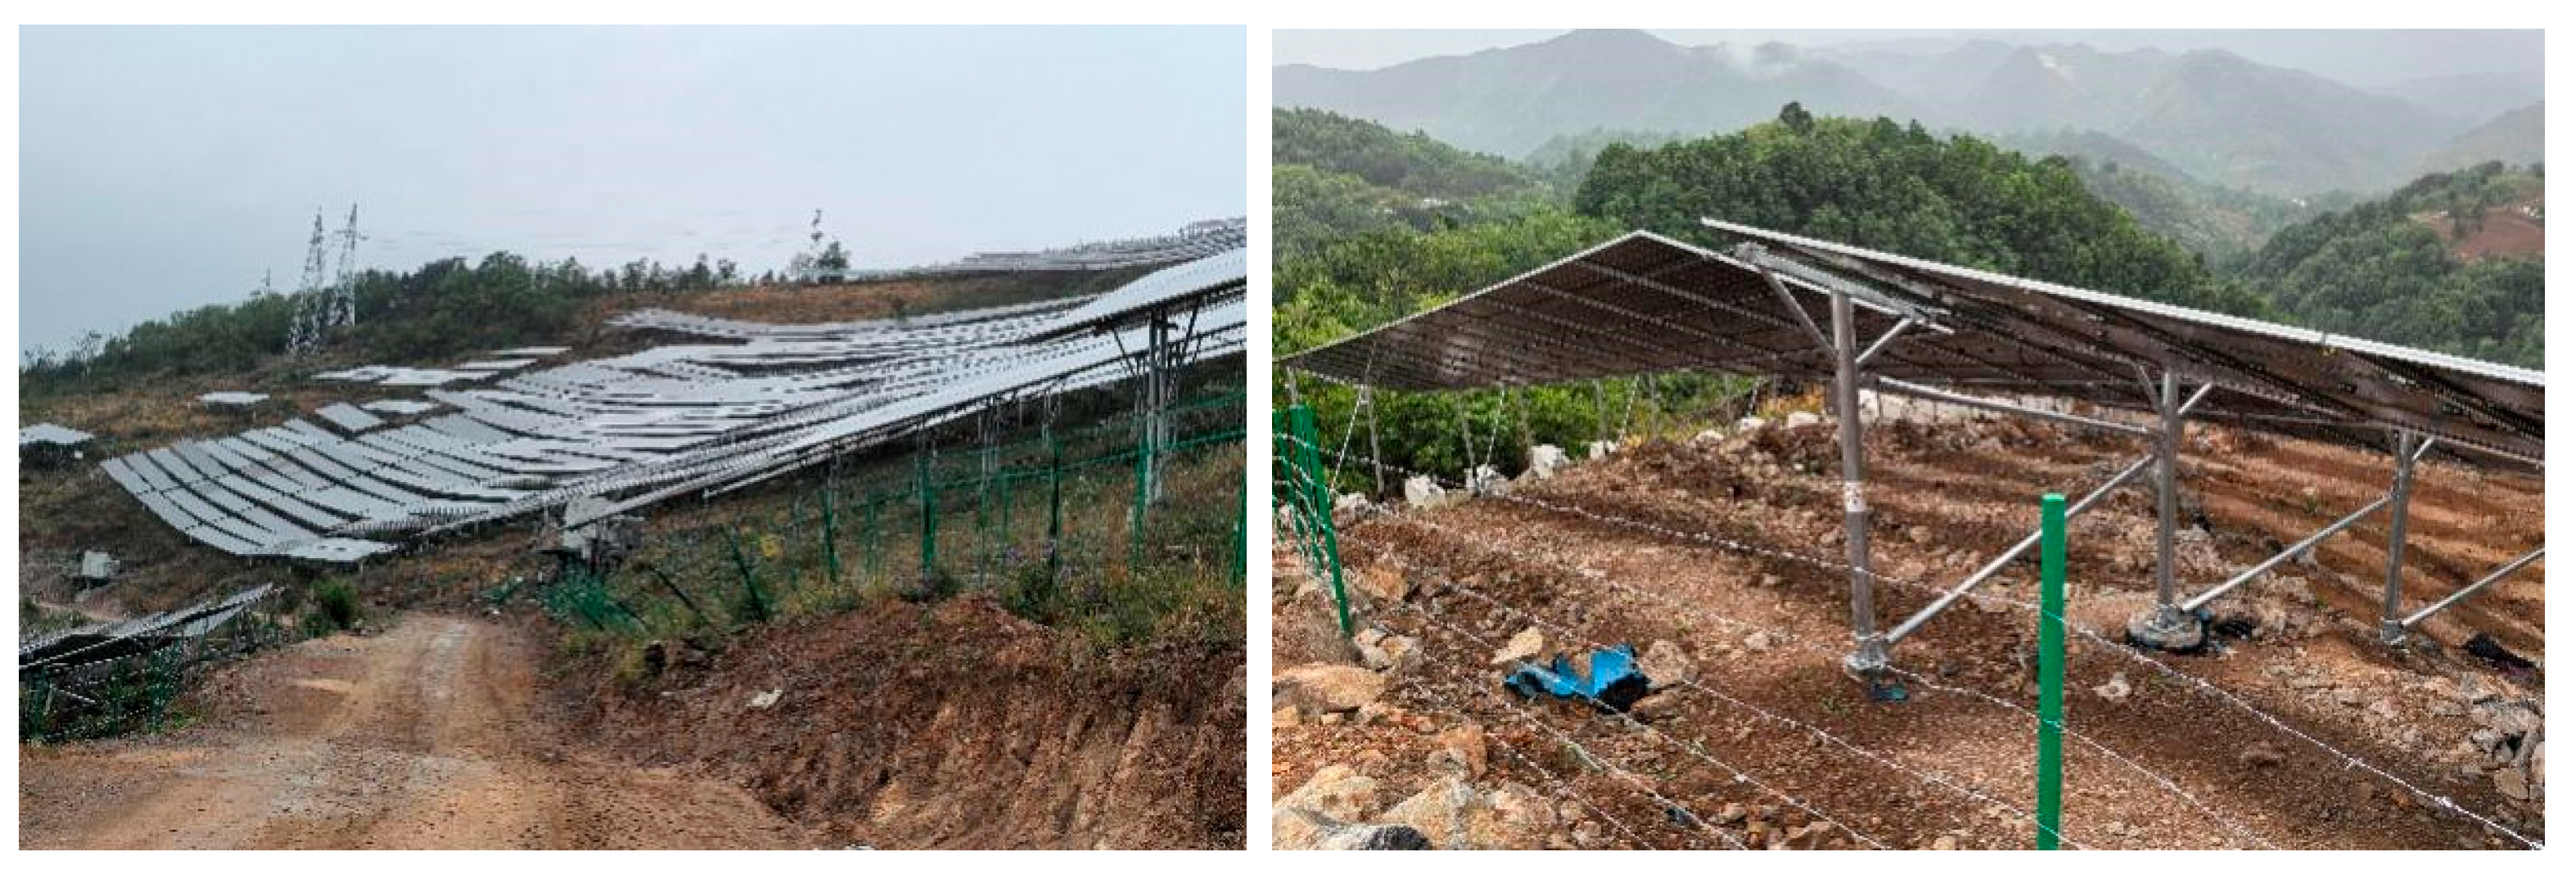
Figure 1. The field condition of the side slopes is shown in
Figure 2.
Based on regional hydrogeological data and field investigations, the hydrogeological conditions within the project area are relatively simple, with groundwater primarily consisting of phreatic aquifers. The project area is classified as arid, with groundwater recharge mainly sourced from atmospheric precipitation and fissure water recharge, discharging into valley rivers. Total water resources amount to 2.426 billion m³, representing a 51.6% reduction from the long-term average. Surface water resources total 2.426 billion m³, while groundwater resources amount to 1.033 billion m³, with an overlap of 1.033 billion m³ between the two. The multi-year average flow rate is 8.8 m³/s, with an annual runoff volume of 277.64 million m³. The annual sediment transport volume is 932,400 tons. The multi-year average self-generated water volume is 223.44 million m³, while inflow water amounts to 54.2 million m³. Hydropower resources total 17,700 kW, with a straight-line distance of approximately 3.4 km, which can be disregarded for this project.
According to the Code for Seismic Design of Buildings, the site area is classified as a general seismic zone for buildings. The foundation soil is primarily loess (with localized bedrock). The equivalent shear wave velocity of rock (soil) layers ranges from 250 m/s to 500 m/s, with local overburden thickness exceeding 5 m. The site is classified as Category II. For Category II sites, the 50-year return period peak ground acceleration (PGA) is 0.15g, with a characteristic period of 0.40s in the seismic response spectrum. The corresponding basic seismic intensity is 7 degrees, and the regional tectonic stability is poor. The design earthquake group is classified as Group II.
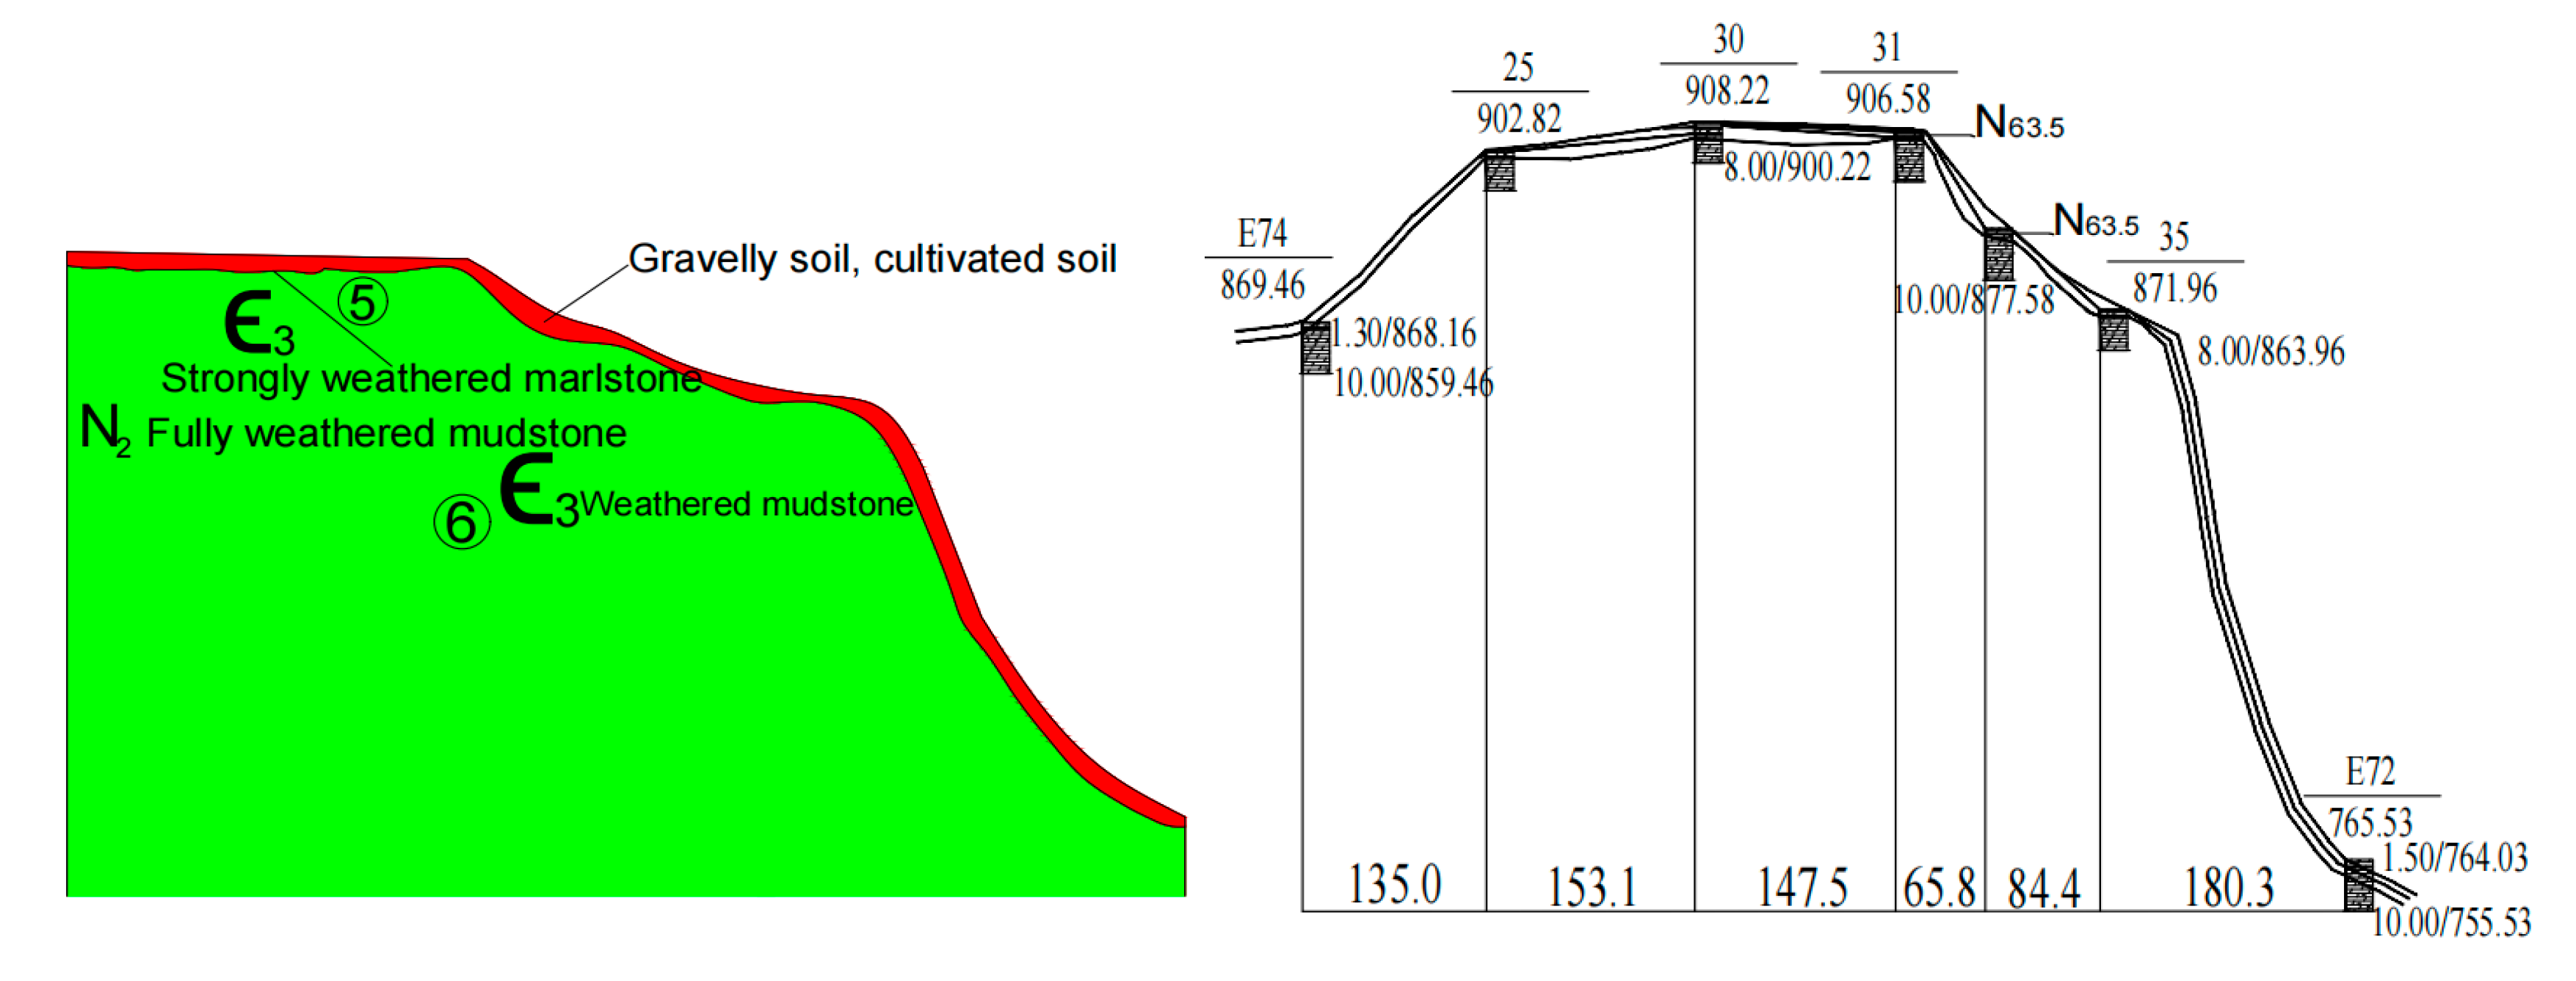
Based on the model scope and cross-sectional/longitudinal profiles of the mountain, a three-dimensional stratigraphic structure model was constructed for the corresponding slope locations. The 3D model primarily accounts for gravelly soil layers, cultivated soil layers, fully weathered marl layers, strongly weathered marl, and moderately weathered marl layers, as shown in
Figure 3. Material properties for each stratum are listed in
Table 1.
2.2. Rainfall Infiltration Modeling
2.2.1. Three-Dimensional Modeling
MIDAS GTS NX is a widely utilized finite element numerical simulation software in the field of geotechnical engineering, capable of performing linear dynamic analysis, seepage and consolidation analysis, among other functions. This software can effectively simulate a variety of specialized working conditions under complex operational scenarios. In this study, a finite element model of the slope is constructed using MIDAS GTS NX, employing the strength reduction method to compute the stability and safety coefficient of the slope. The integration of the finite element method with the strength reduction technique enables a comprehensive evaluation of the internal structural characteristics of the targeted slope, as well as the external complex contours, boundary conditions, non-homogeneity, and discontinuity. This approach also allows for the incorporation of various isotropic relationships that align with the material properties while considering the environmental factors affecting the slope, which ultimately influences the geo-stress factors on the slope’s deformation and failure mechanisms.
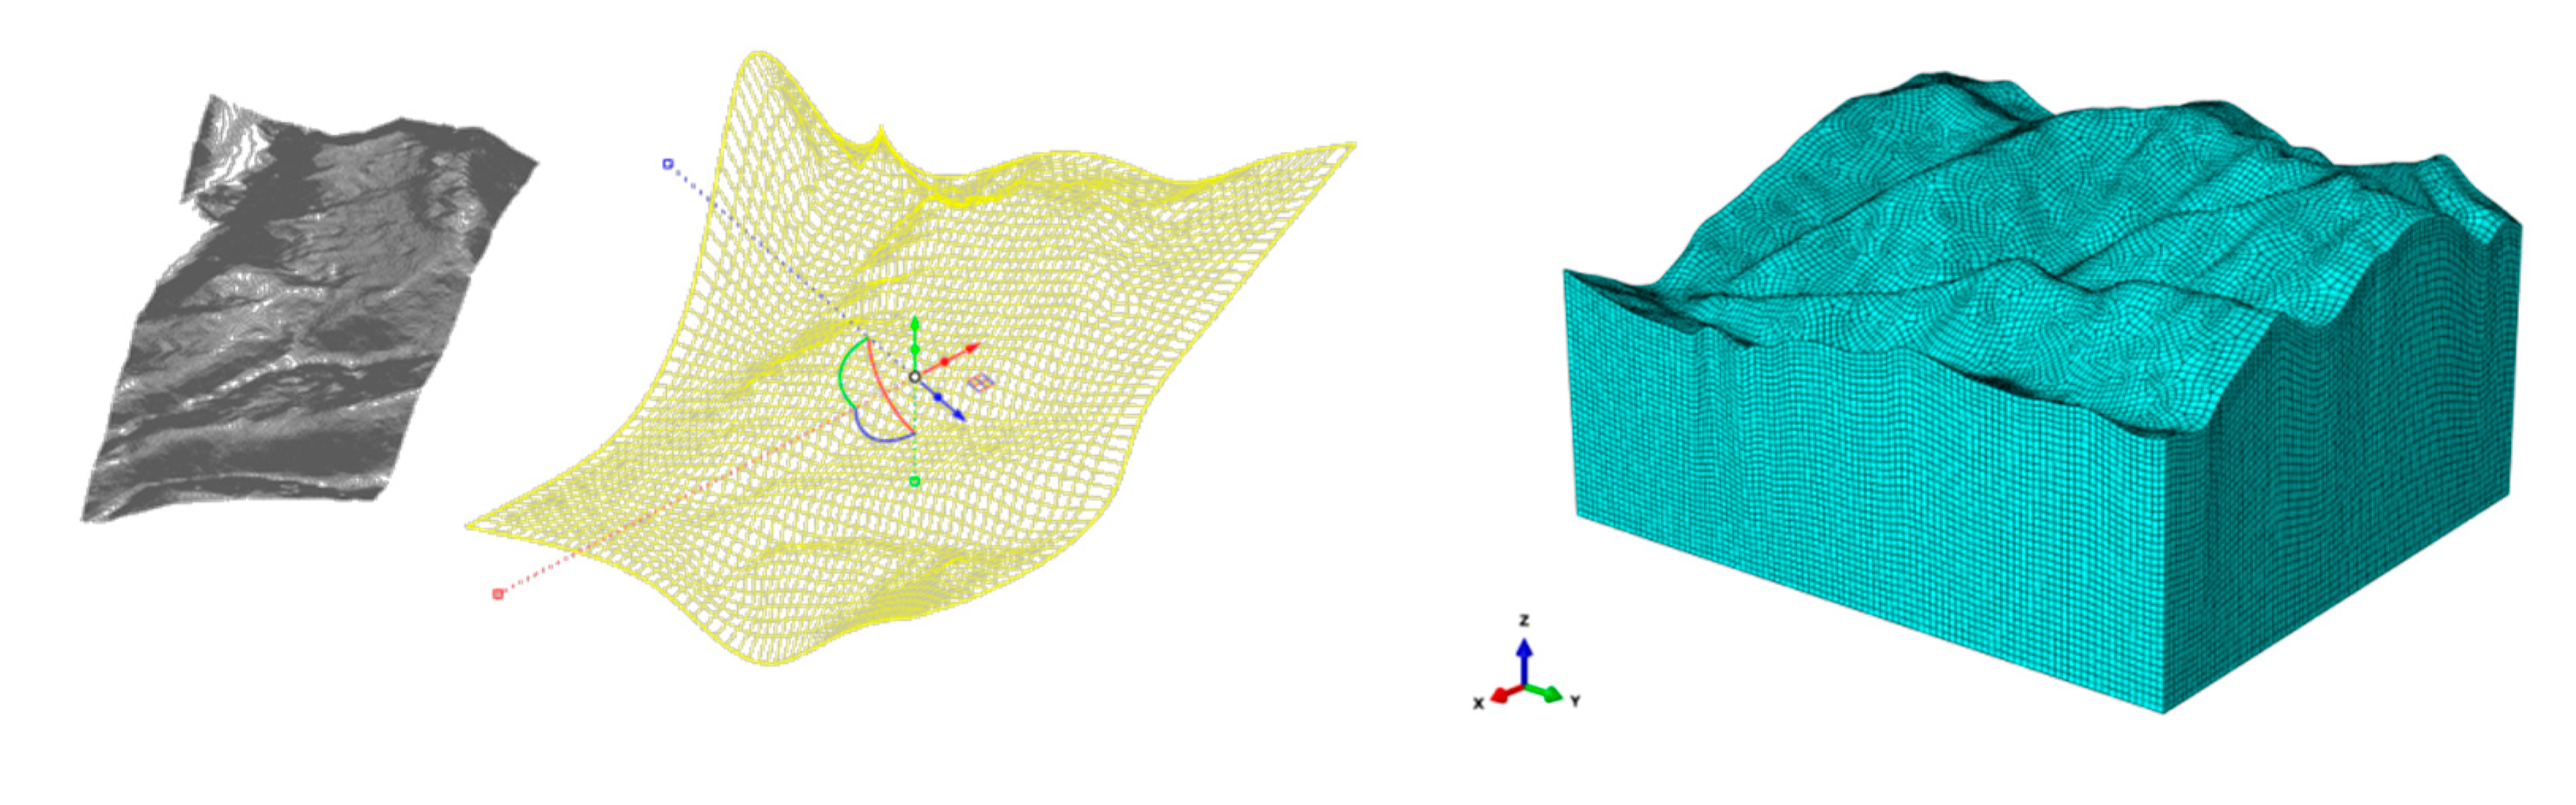
Based on the engineering geological profile and plan view, and to minimize boundary influences while ensuring a reasonable model construction, NURBS curves, surfaces, and solids are generated in Rhino. Following the actual terrain’s complexity and size, the corresponding restricted grid is developed. After the measurement and calculation of the grid size, the minimum grid size of 0.1m is initially selected. five groups are taken for trial calculation, and it is found that there is no effect on the calculation results when the grid size is less than 0.3m. So the minimum grid size is 0.3m, and the three-dimensional model of the slope established is shown in
Figure 4.
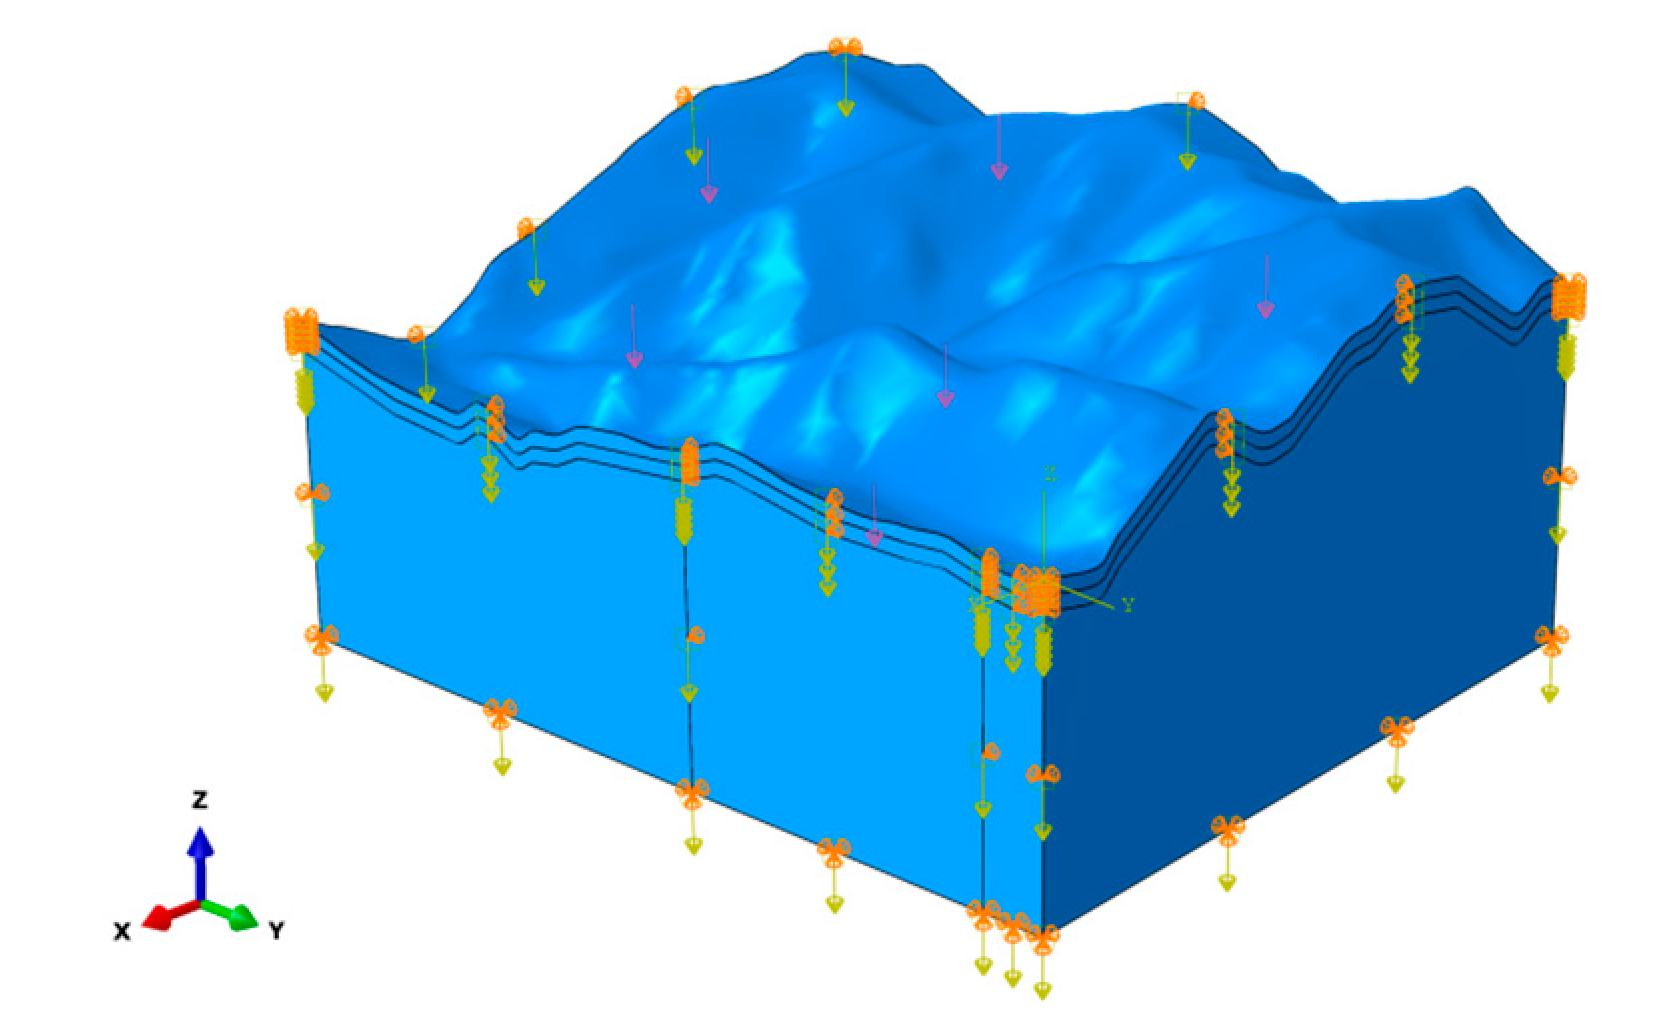
The field area is characterized by the absence of significant geotectonic activity, negating the need to account for tectonic stress and related factors in the calculations. The analysis involves solely the self-gravitational stress field. An isotropic model is chosen based on the materials’ mechanical properties, where the geotechnical body utilizes the Mohr-Coulomb isotropic model. For 3D calculations, the bottom controls the displacements in the , and directions. The surrounding sides are controlling the normal displacement of the parcel. The top surface of the parcel is the rainfall boundary. The simulated rainfall is the flow boundary of the parcel as shown in
Figure 5.
2.2.2. Saturated-Unsaturated Seepage Theory
In this study, the saturated-unsaturated seepage within the slope geotechnical body is treated as Darcy seepage. Darcy’s law states that the seepage rate is directly proportional to the hydraulic gradient, expressed as follows:
where:
is the seepage velocity;
is the permeability coefficient;
is the hydraulic gradient;
is the total head; and
is the seepage path.
The seepage continuity equation for saturated-unsaturated seepage is presented below, where the unsteady seepage continuity equation can be formulated as follows:
where
θ is the water content per unit volume;
is the time;
,
,
for the seepage velocity in the
,
,
, direction of the partial velocity.
Equation (2) for anisotropic media can be expressed as
where
,
,
is the component of the permeability coefficient k in the
,
,
, direction.
Steady-state seepage assumes that the skeletal structure is not deformed and that the liquid is incompressible. This implies that the rate of change of volumetric water content at any position in the medium over time is zero. Therefore, the continuity equation for steady-state seepage is given by:
The steady-state seepage anisotropic medium continuity equation is given by
In geotechnical contexts, distinct saturated and unsaturated regions exist. Seepage within these geotechnical structures typically represents a saturated-unsaturated seepage problem in anisotropic soils. Here, the permeability coefficient varies continuously with burial depth; in the saturated region, this coefficient remains constant, whereas, in the unsaturated region, the permeability coefficient is a function of volumetric water content (i.e., degree of saturation).
2.2.3. Strength Reduction Method
Nowadays, the strength reduction method based on shear strength theory is the predominant approach for determining the stability coefficient in the numerical analysis of geotechnical mechanics. While it remains a topic of debate within the industry, its application continues to be widespread due to its alignment with practical algorithms. In addition to scenarios involving bulk weathered rock slopes, rockslides often present challenges that do not conform to arc-type geometries. Therefore, analyzing slope stress-strain parameters and utilizing the Mohr-Coulomb shear strength theory are essential for evaluating shear damage and deriving the stability coefficient of slopes. This approach ensures compliance with industry standard safety coefficients. When employing numerical methods, such as finite element or finite difference methods alongside the strength reduction technique for slope stability analysis, it is possible to thoroughly account for the internal structural characteristics, complex external geometries, boundary conditions, as well as the non-homogeneity and discontinuities of the target slope. This flexibility allows for the incorporation of various isomorphic relations relevant to material characteristics. It effectively addresses a significant limitation of rigid-body limit equilibrium analysis, which often overlooks the influence of internal forces during landslides. Additionally, the geo-stress factors affecting the deformation and damage mechanisms of slopes can be evaluated within the context of their surrounding environments.
Scholars like Zienkiewicz and Duncan [
21,
22] have suggested defining the stability coefficient as the ratio of the actual shear strength of the geotechnical material to the shear strength at critical damage. The resulting discount factor represents the stability coefficient of the material in question. By maintaining the gravitational acceleration of the geotechnical body as constant, a new set of strength indicators
ci and
φi can be derived by progressively reducing the shear strength indicators and simultaneously dividing the values of
c and
φ by the discount factor
Fsi. Finite element analysis is then conducted, with calculations repeated until the slope reaches a critical damage state—at which point, the corresponding discount factor is identified as the stabilization factor
Fs. The calculation flow of the strength reduction method based on the numerical method architecture is illustrated in
Figure 6.
3. Analysis and Discussion
In this section, a three-dimensional numerical calculation model is used to analyze slope stability under rainfall infiltration conditions. The analysis is based on the geotechnical parameters of the slope and the recommended values for rainfall infiltration. Pore water pressure, displacement, and strain of typical slope profiles are calculated following rainfall to assess stability.
3.1. Evolution of Slope Seepage Field Under Different Rainfall Conditions
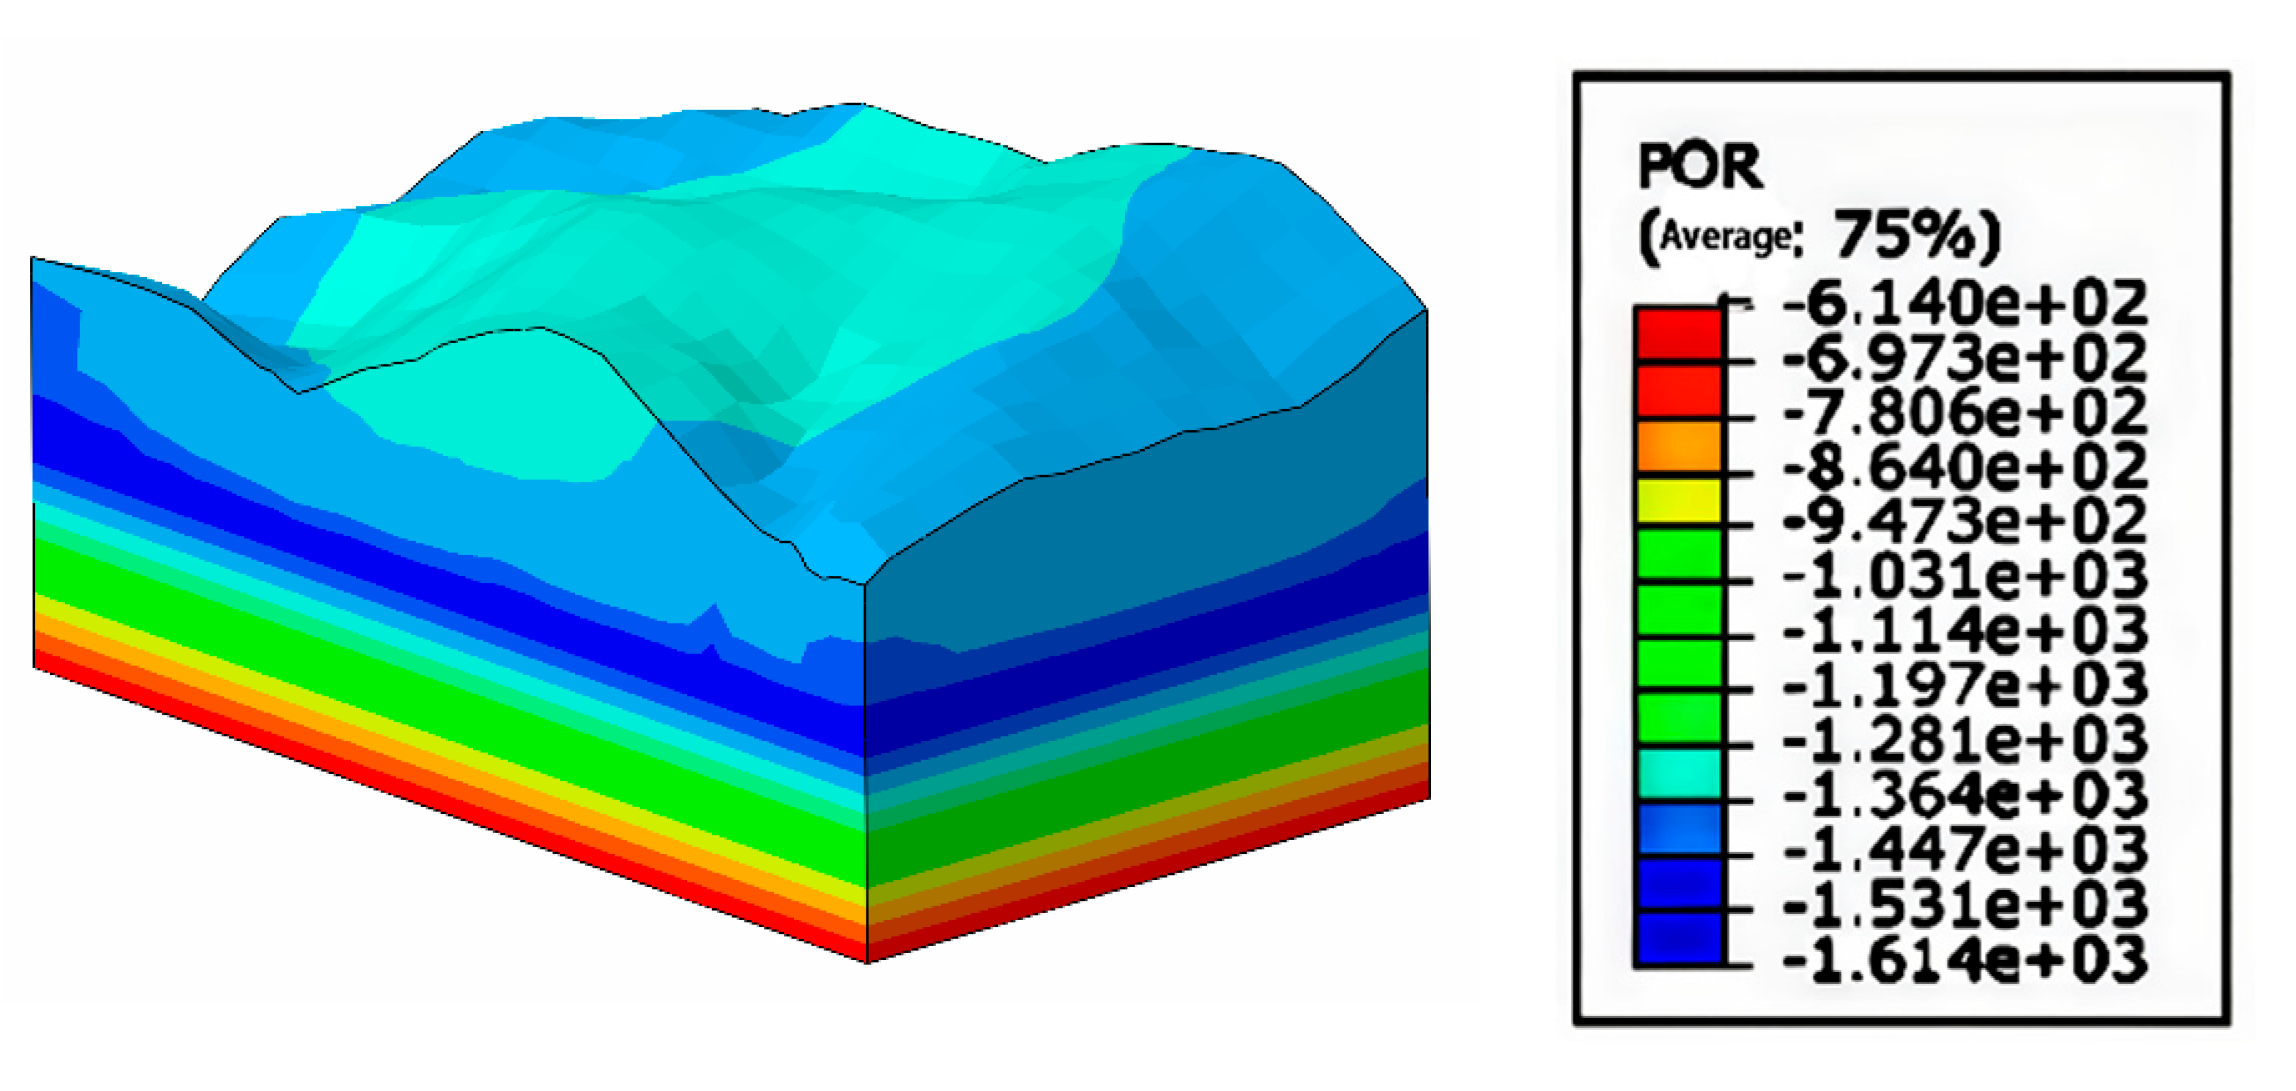
In order to provide a basis for the subsequent transient seepage calculations in the slope stability analysis, the distribution law of pore water pressure in the initial state of the slope is first obtained by analyzing the steady state seepage of the slope. As can be seen from
Figure 7, the pore water pressure of the slope is distributed in a laminar pattern. The pore pressure is negative decreases gradually from the water table line to the top of the slope. The pore water pressure at the water table of the slope is zero, which is the interface between the positive and negative values of the pore water pressure of the slope. Below the groundwater level, the pore water pressure of the slope is positive, and the pore water pressure is within 1.7KPa. The pore water pressure on the surface of the hill is 1.364 KPa. according to the analysis of the pore pressure distribution state, it is consistent with the combination of the stratigraphic structure of the slope.
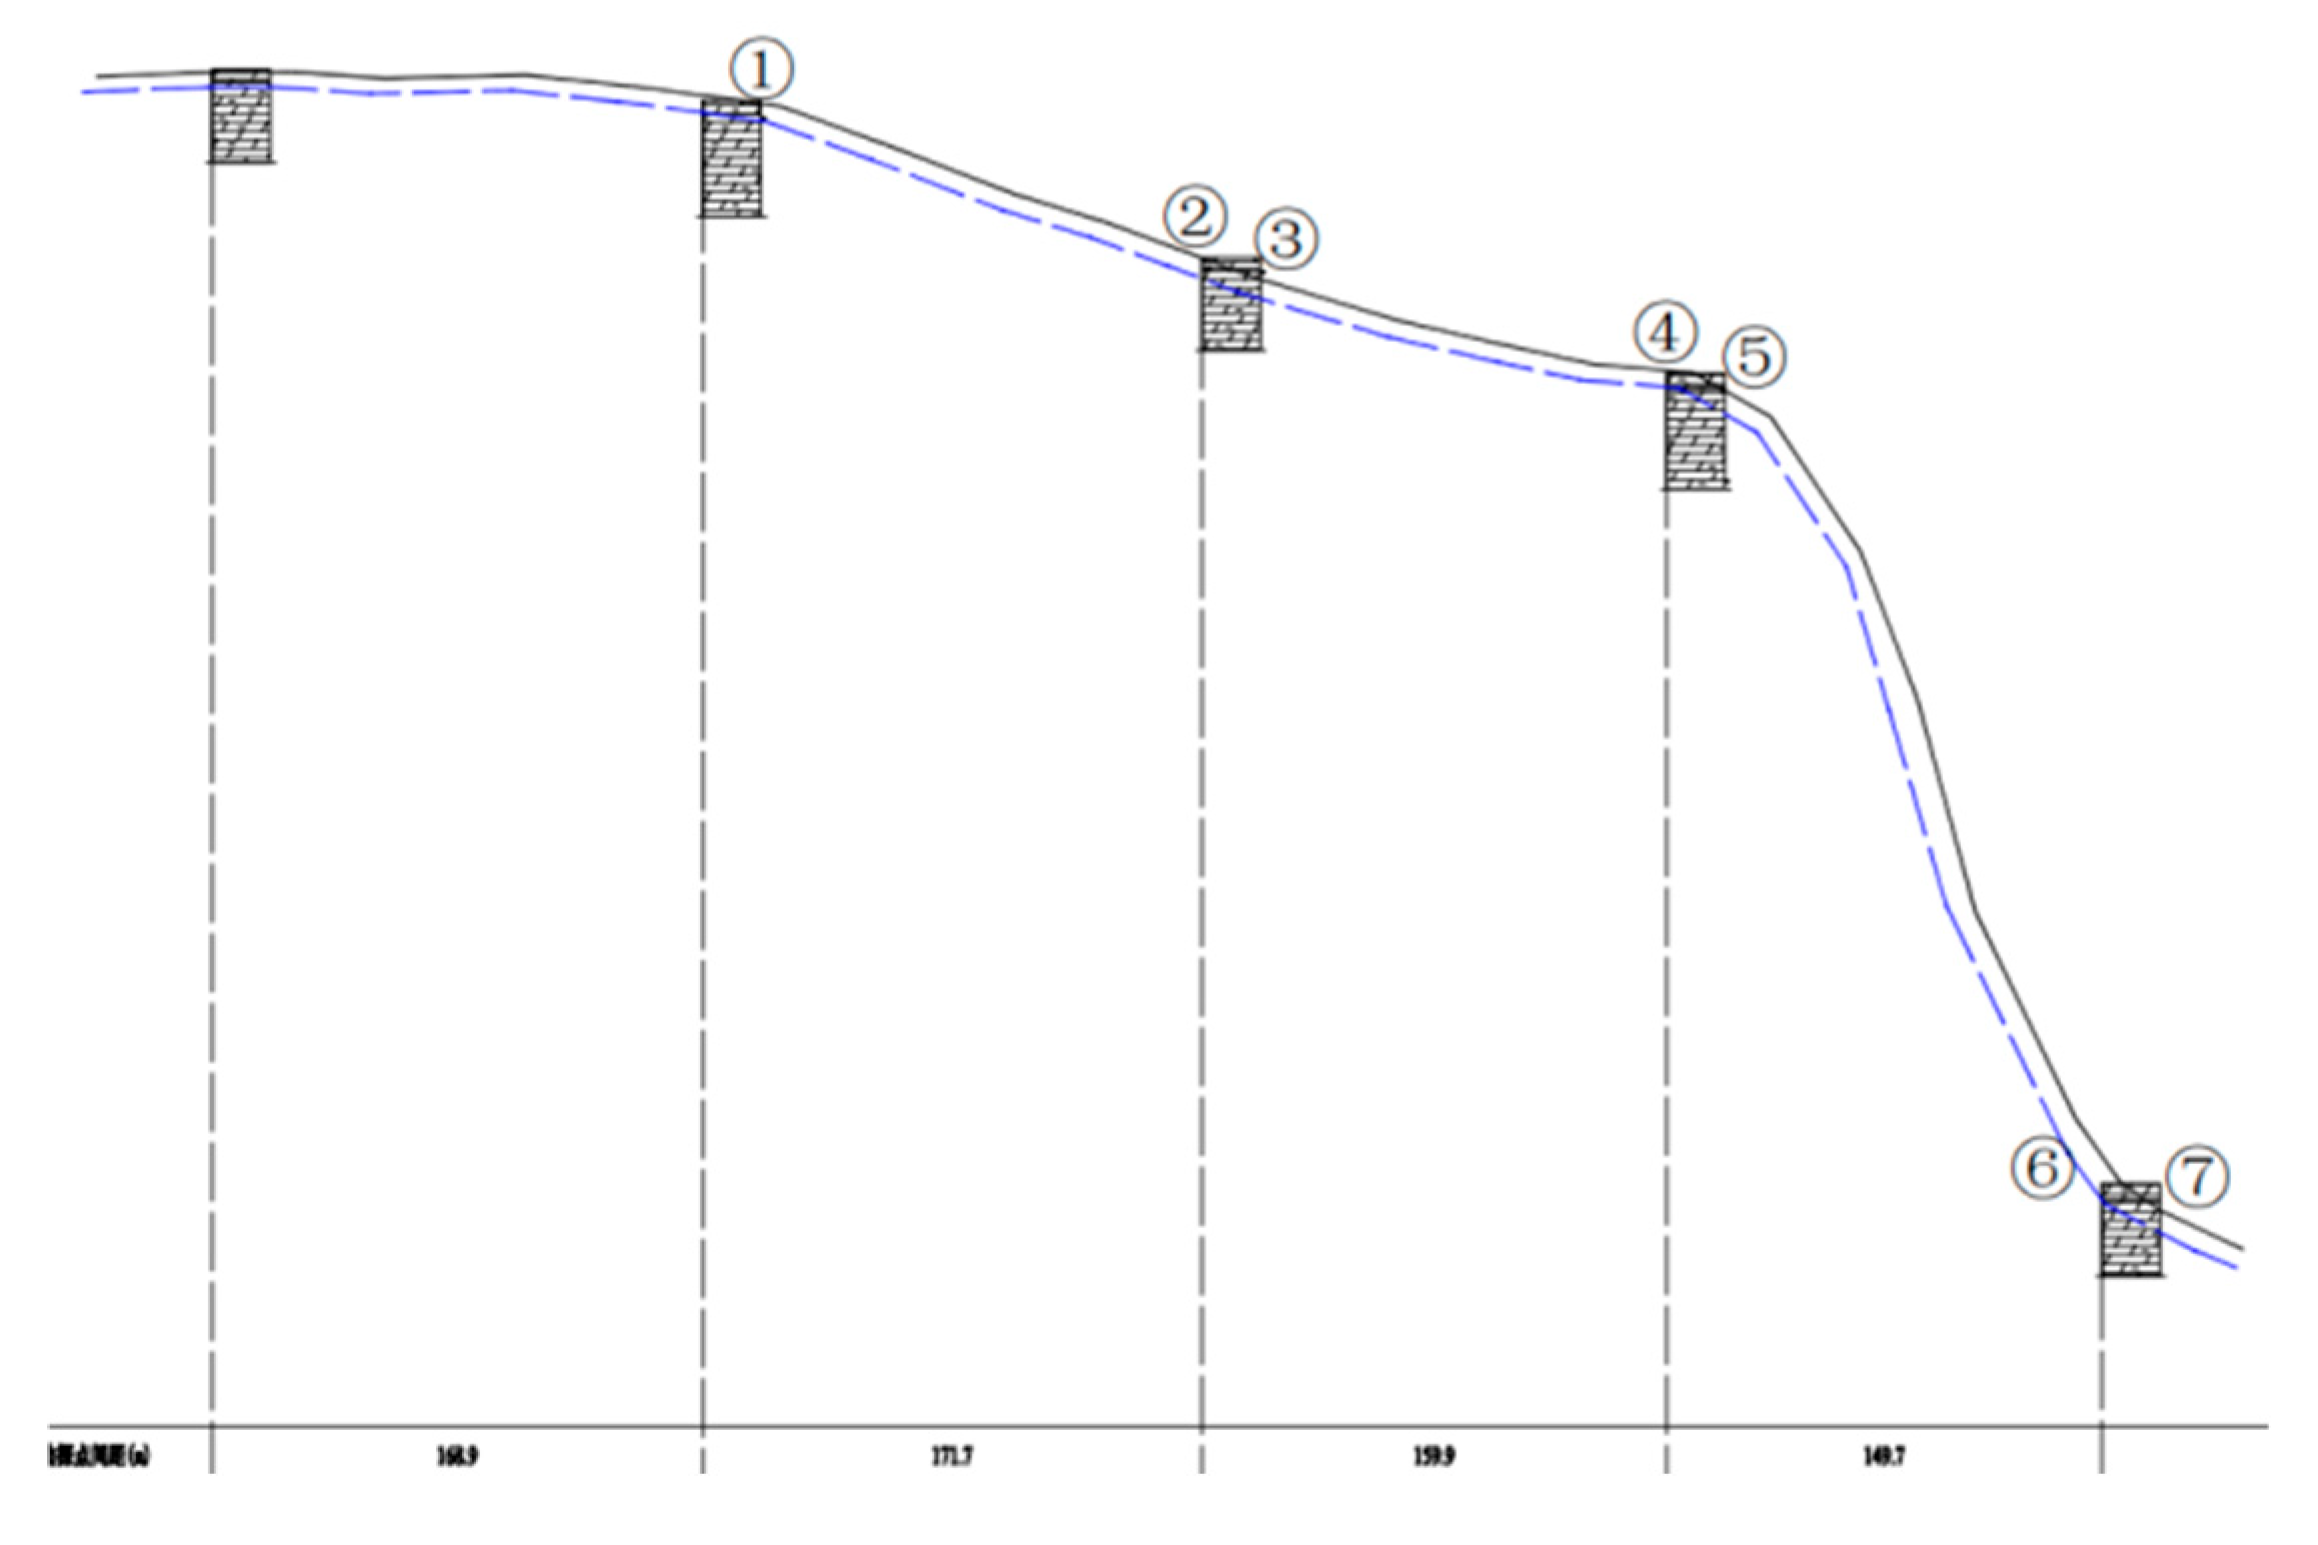
For the stability analysis, a typical slope profile was selected, with seven characteristic points identified as shown in
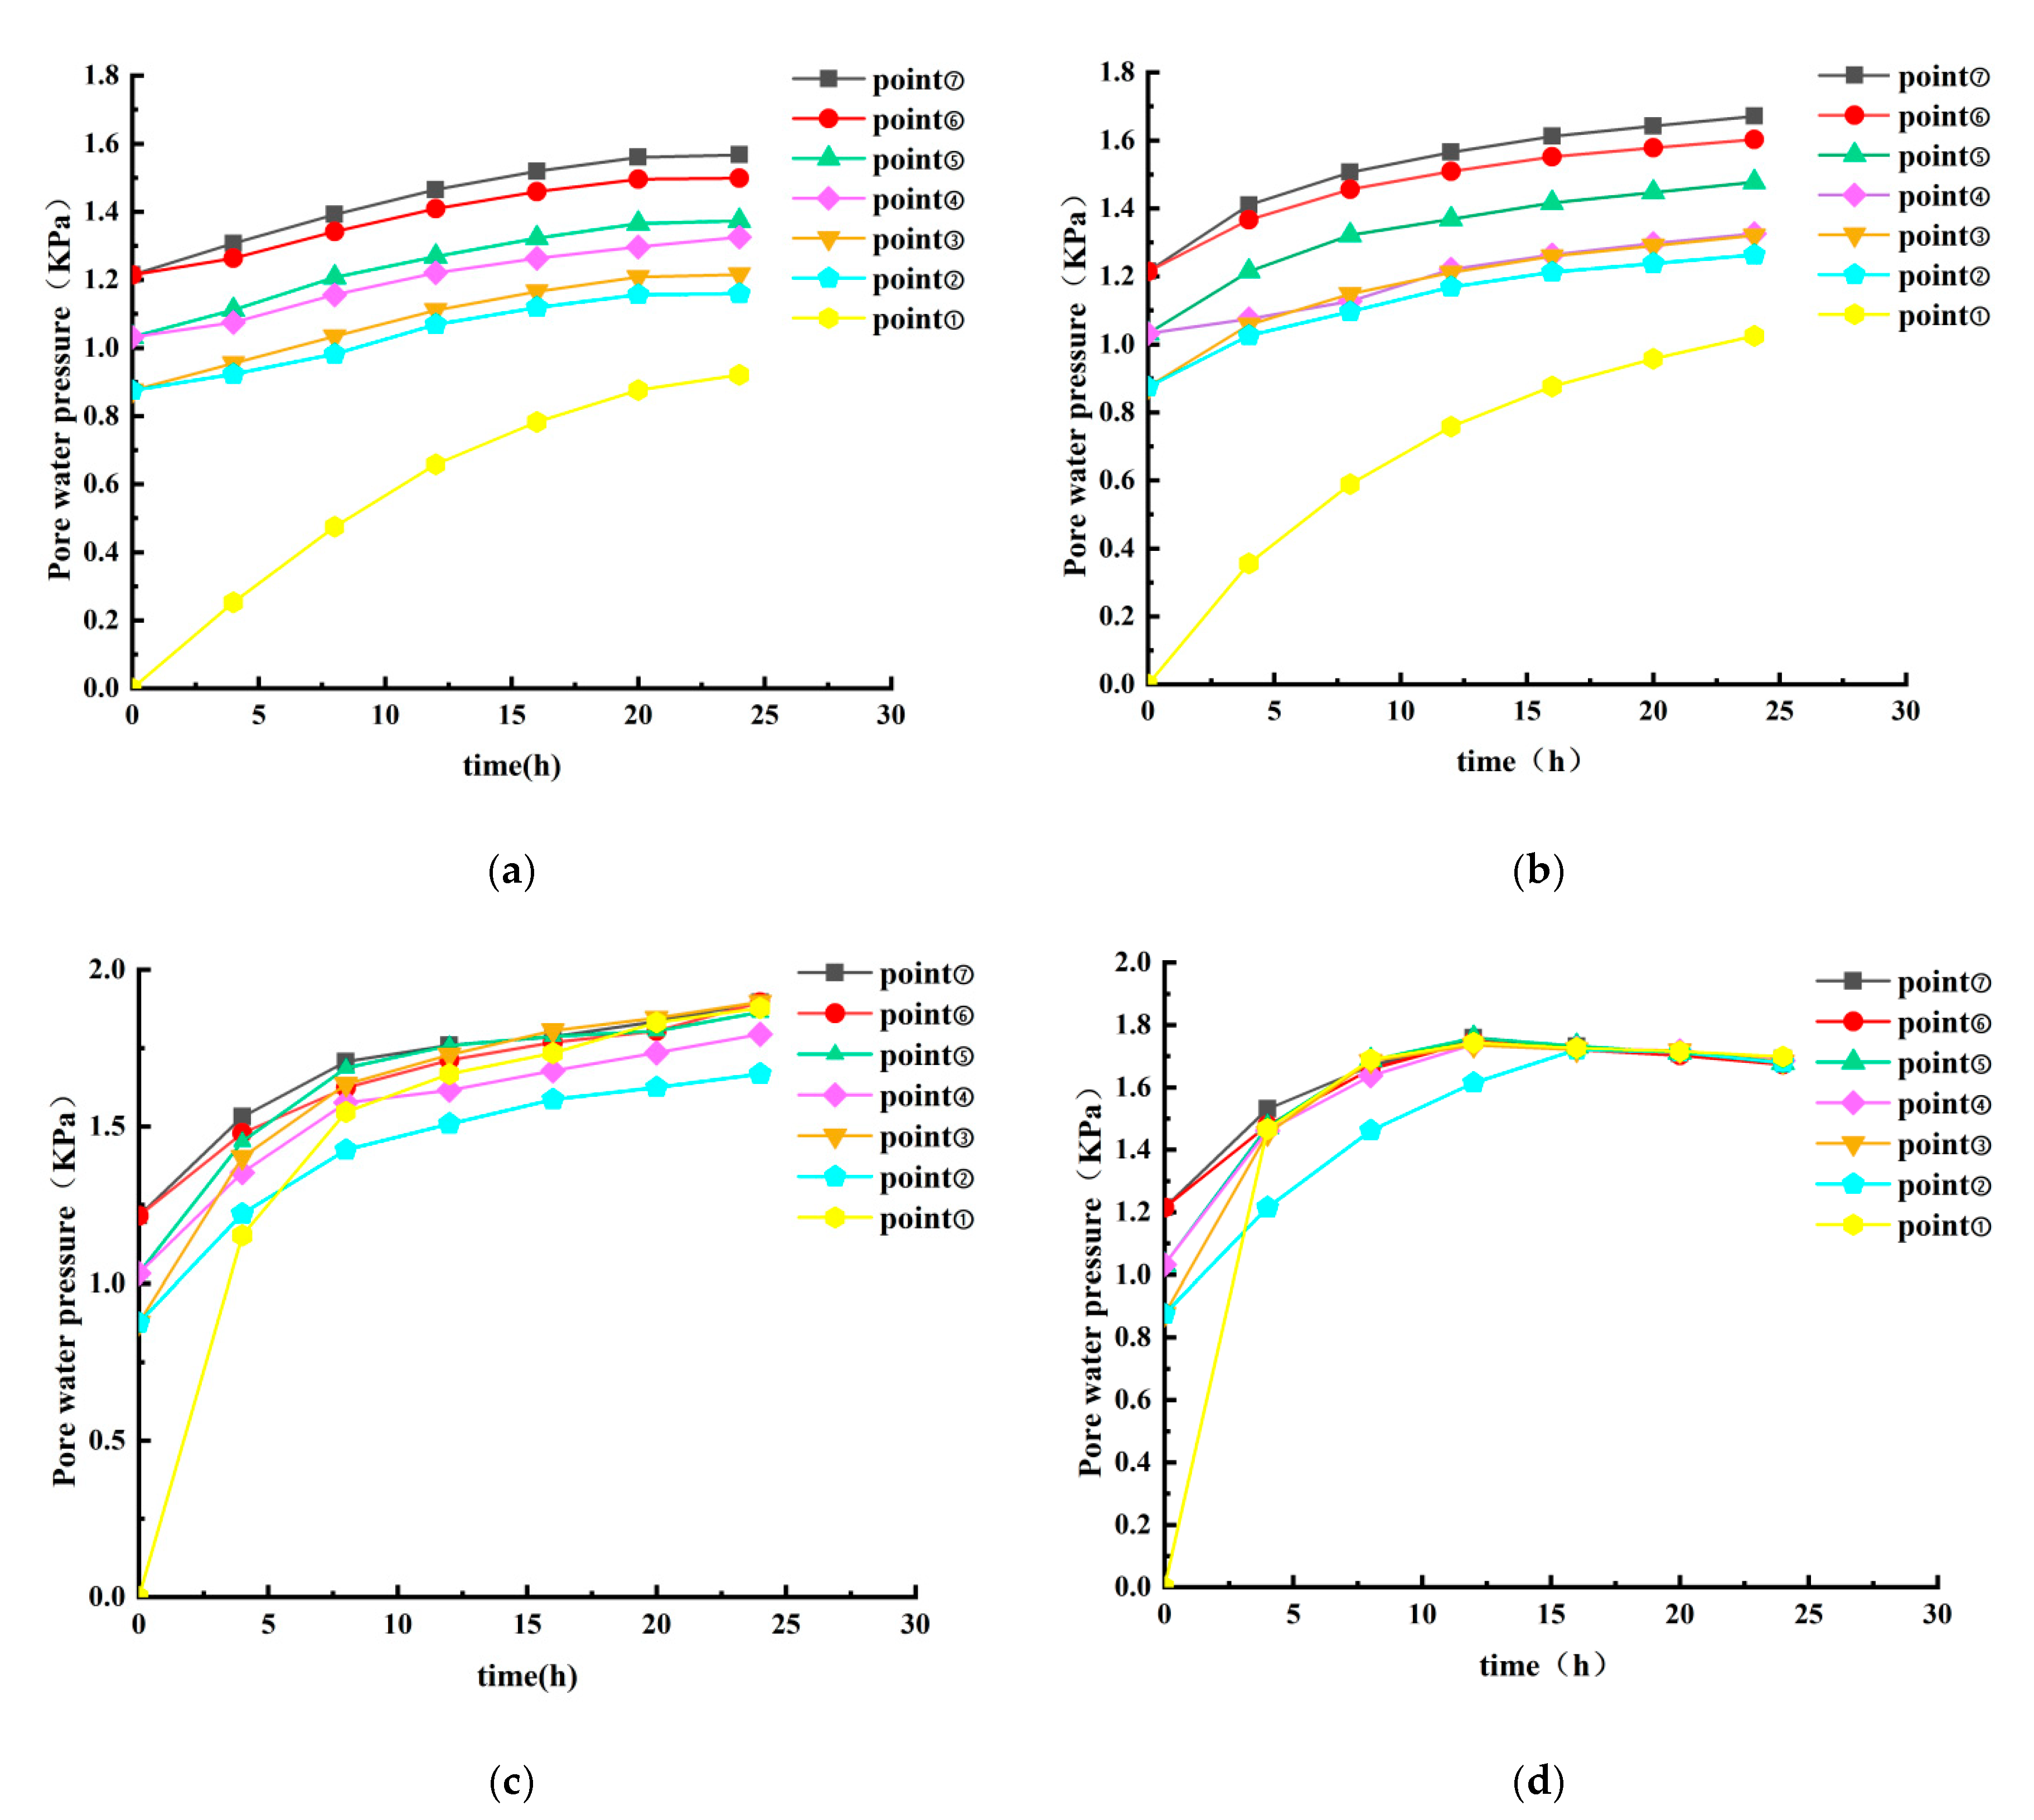
Figure 8. The study area experiences a monsoon humid climate typical of the southern edge of the warm temperate zone, characterized by the highest precipitation during summer, often accompanied by thunderstorms and heavy downpours. Rainfall intensities of 0.00375, 0.00833, 0.015, and 0.03 m/h were investigated in this study, based on China’s heavy rainfall classification (12-hour total rainfall): torrential rain (30-69.9 mm), downpour (70-139.9 mm), and extraordinarily heavy rain (≥140 mm). The distribution of pore water pressure over time, from before rainfall to 24 hours post-rainfall, is shown in
Figure 9.
Analyzing
Figure 9a,b, it can be seen that the pore water pressure at the characteristic points of the side slopes changes relatively slowly with the increase of time under the condition of small rainfall intensity. This is because the rate of water transportation in the slope is lower under small rainfall intensity. The drainage system of the slope is able to discharge excess water in time, and the change in soil saturation is not obvious. The change of pore water pressure is also relatively gentle, and the trend of pore water pressure change is basically the same for the characteristic points at the same altitude. Analysis of
Figure 9c shows that when the rainfall intensity is 0.015m/h, the pore water pressure at the characteristic points of the slope increases to basically stable within 5h. The change of pore water pressure at the top of the slope is more significant, but it is not destroyed. Analysis of
Figure 9d shows that when the rainfall intensity is high, the pore water pressure at the characteristic points of the slope increases rapidly in a short period of time and then decreases to a steady state. It is analyzed that under high intensity rainfall, the pore water pressure increases rapidly due to rapid water infiltration and rapid saturation of the soil body. And then the pore water pressure due to the functioning of drainage system and moisture redistribution. Eventually, the pore water pressure will stabilize. A state of equilibrium with external conditions (e.g., rainfall, drainage) and soil properties is reached.
The overall trend shows that the closer the soil is to the slope surface the more significant the impact is. The pore water pressure increases with time, but decreases from the top of the slope to the bottom of the slope. And it can be seen that the change in pore pressure is greatest at the top of the slope. The value becomes stable after the maximum pore water pressure is reached at the slope surface.
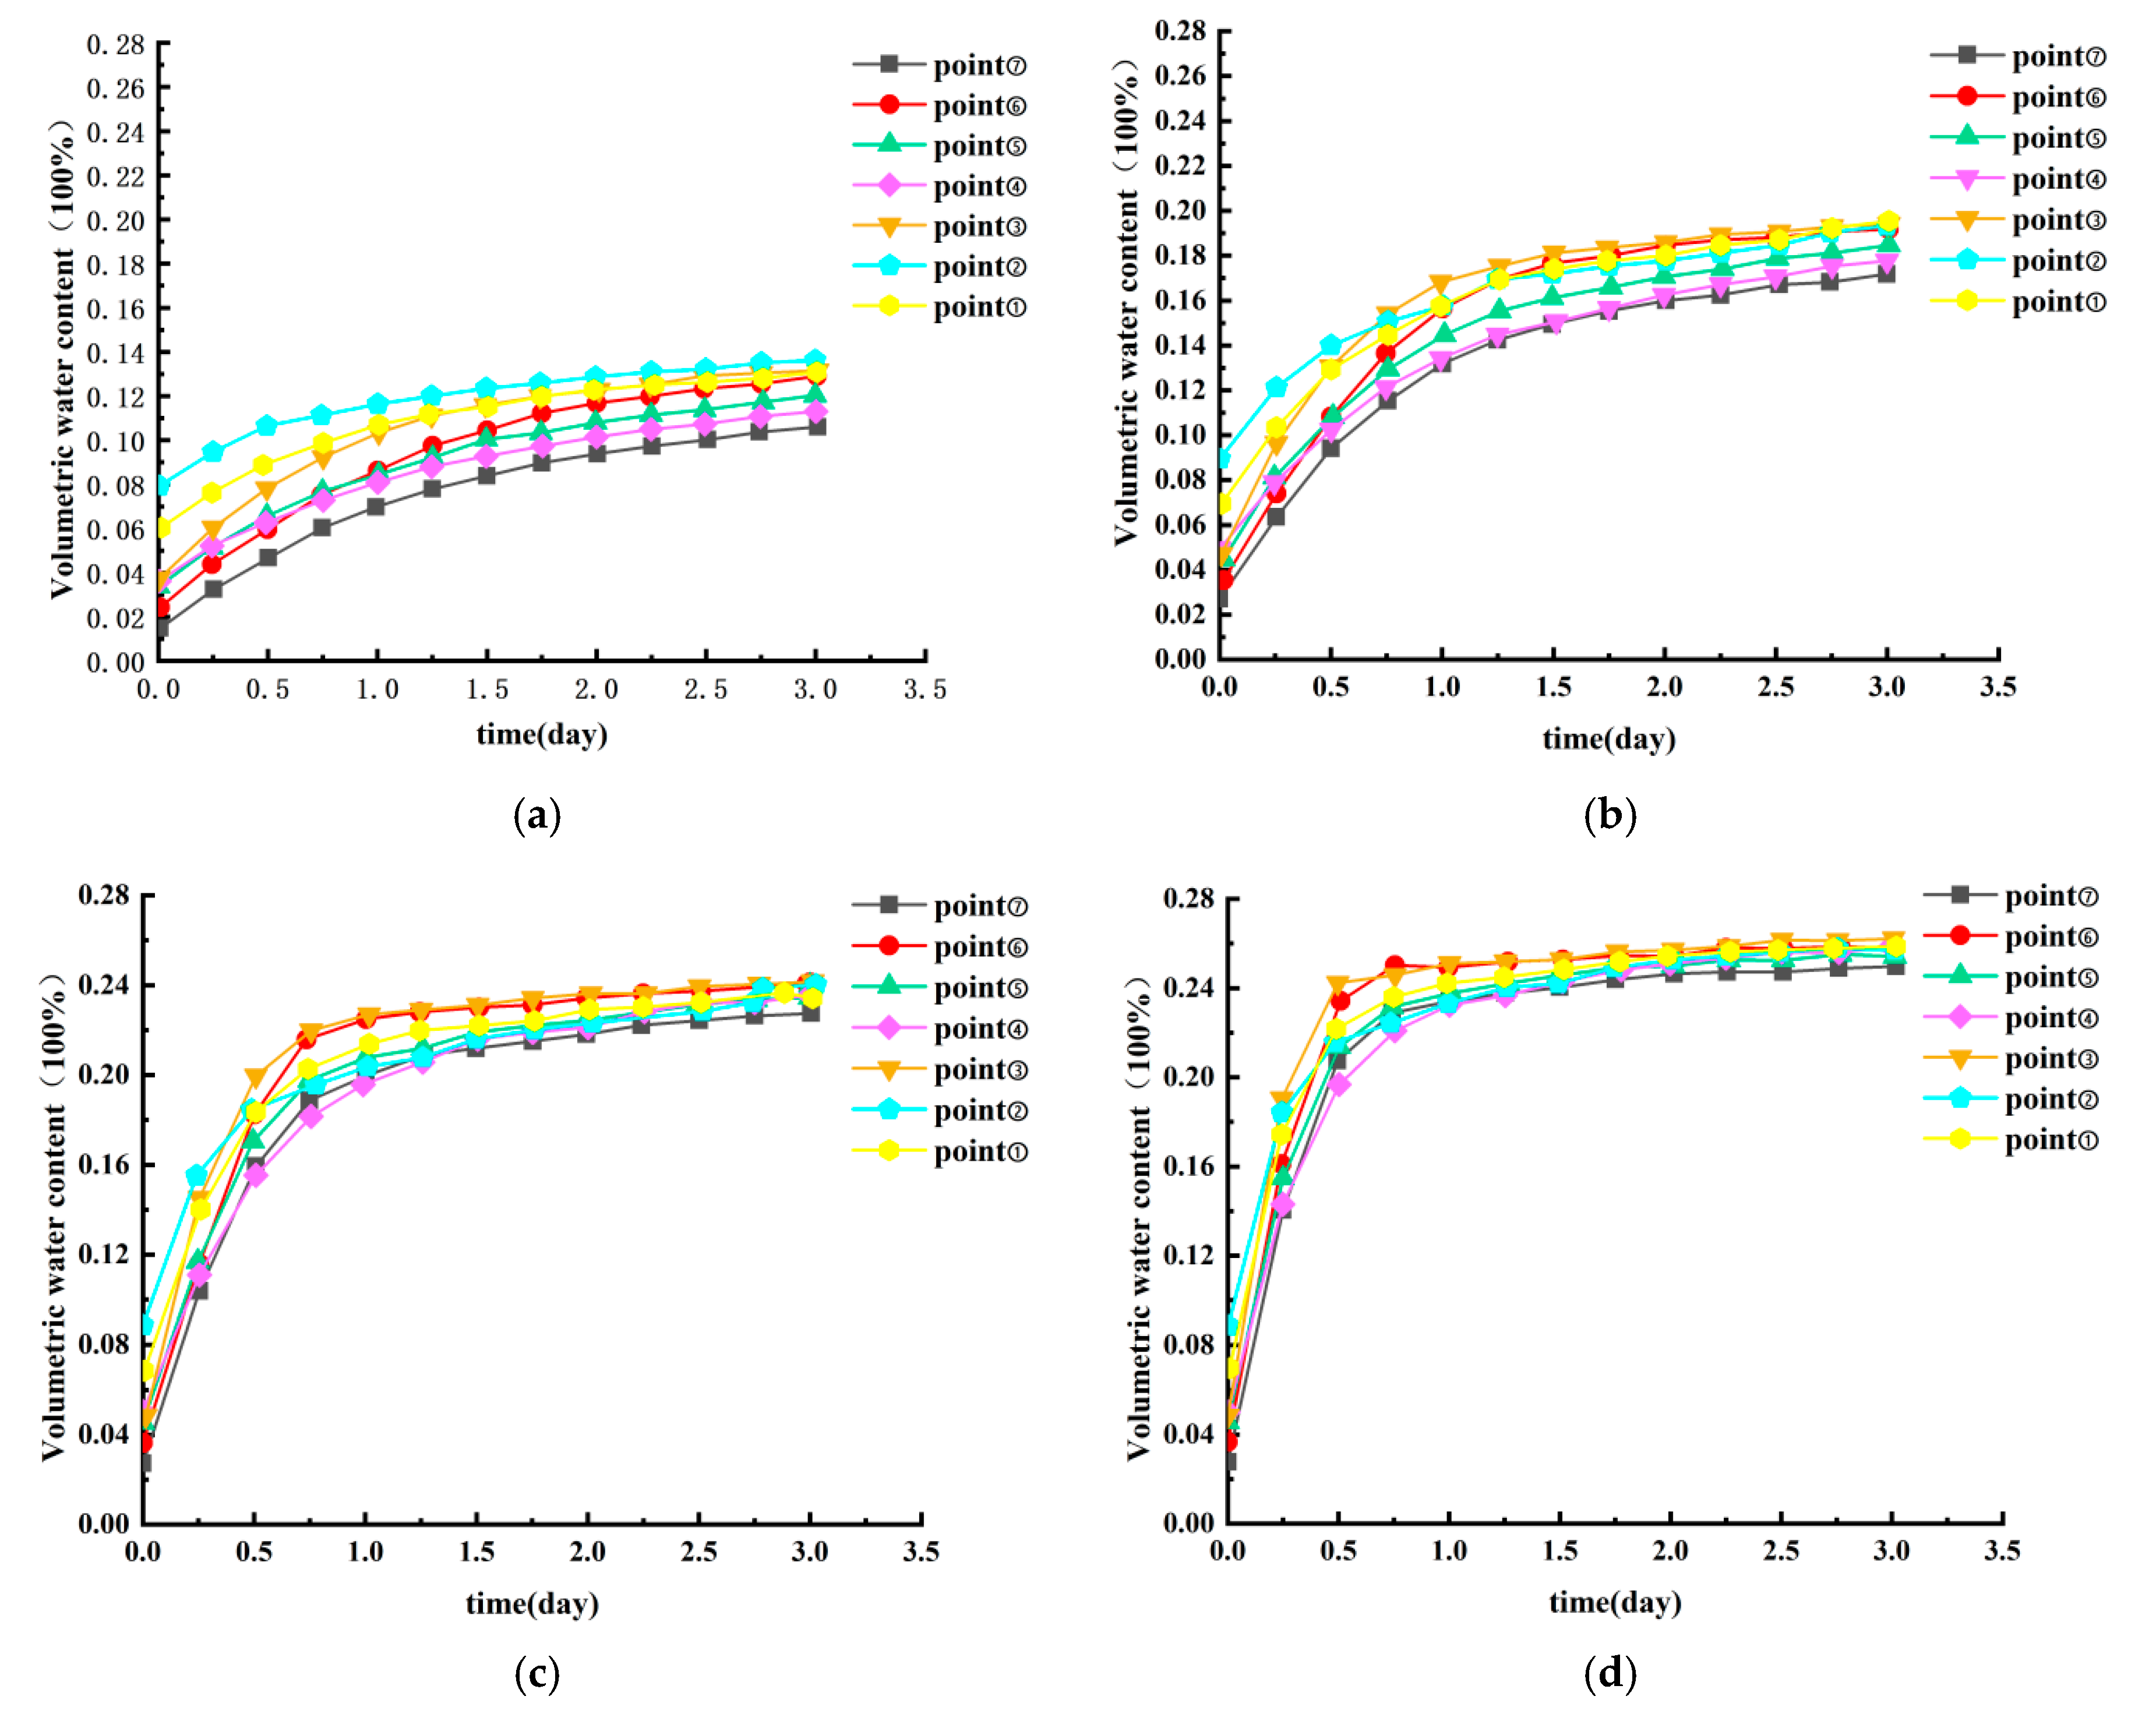
The relationship between volumetric water content at each monitoring point with time for different rainfall intensities is shown in
Figure 10.
The dynamic change of volumetric water content of each monitoring point under different rainfall intensities shows that, with the increase of rainfall intensity, the volumetric water content of the slope surface layer from the top to the foot of the slope shows a trend of rapid growth followed by gradual stabilization. When the rainfall intensity reaches 0.0015m/h, the volumetric water content of each monitoring point finally tends to 27% of the saturated water content value. This phenomenon indicates that the top soil layer of the slope has reached a nearly saturated state. It is worth noting that point ④, located at the middle step of the slope, showed the most significant water accumulation characteristics at the beginning of the rainfall. This is mainly attributed to the fact that this location not only receives rainfall infiltration directly. At the same time, the runoff water from the upper slope that failed to infiltrate in time was also collected, which led to a significantly higher growth rate of soil moisture content in this area than the other monitoring points.
3.2. Stress-Strain Analysis of Slope
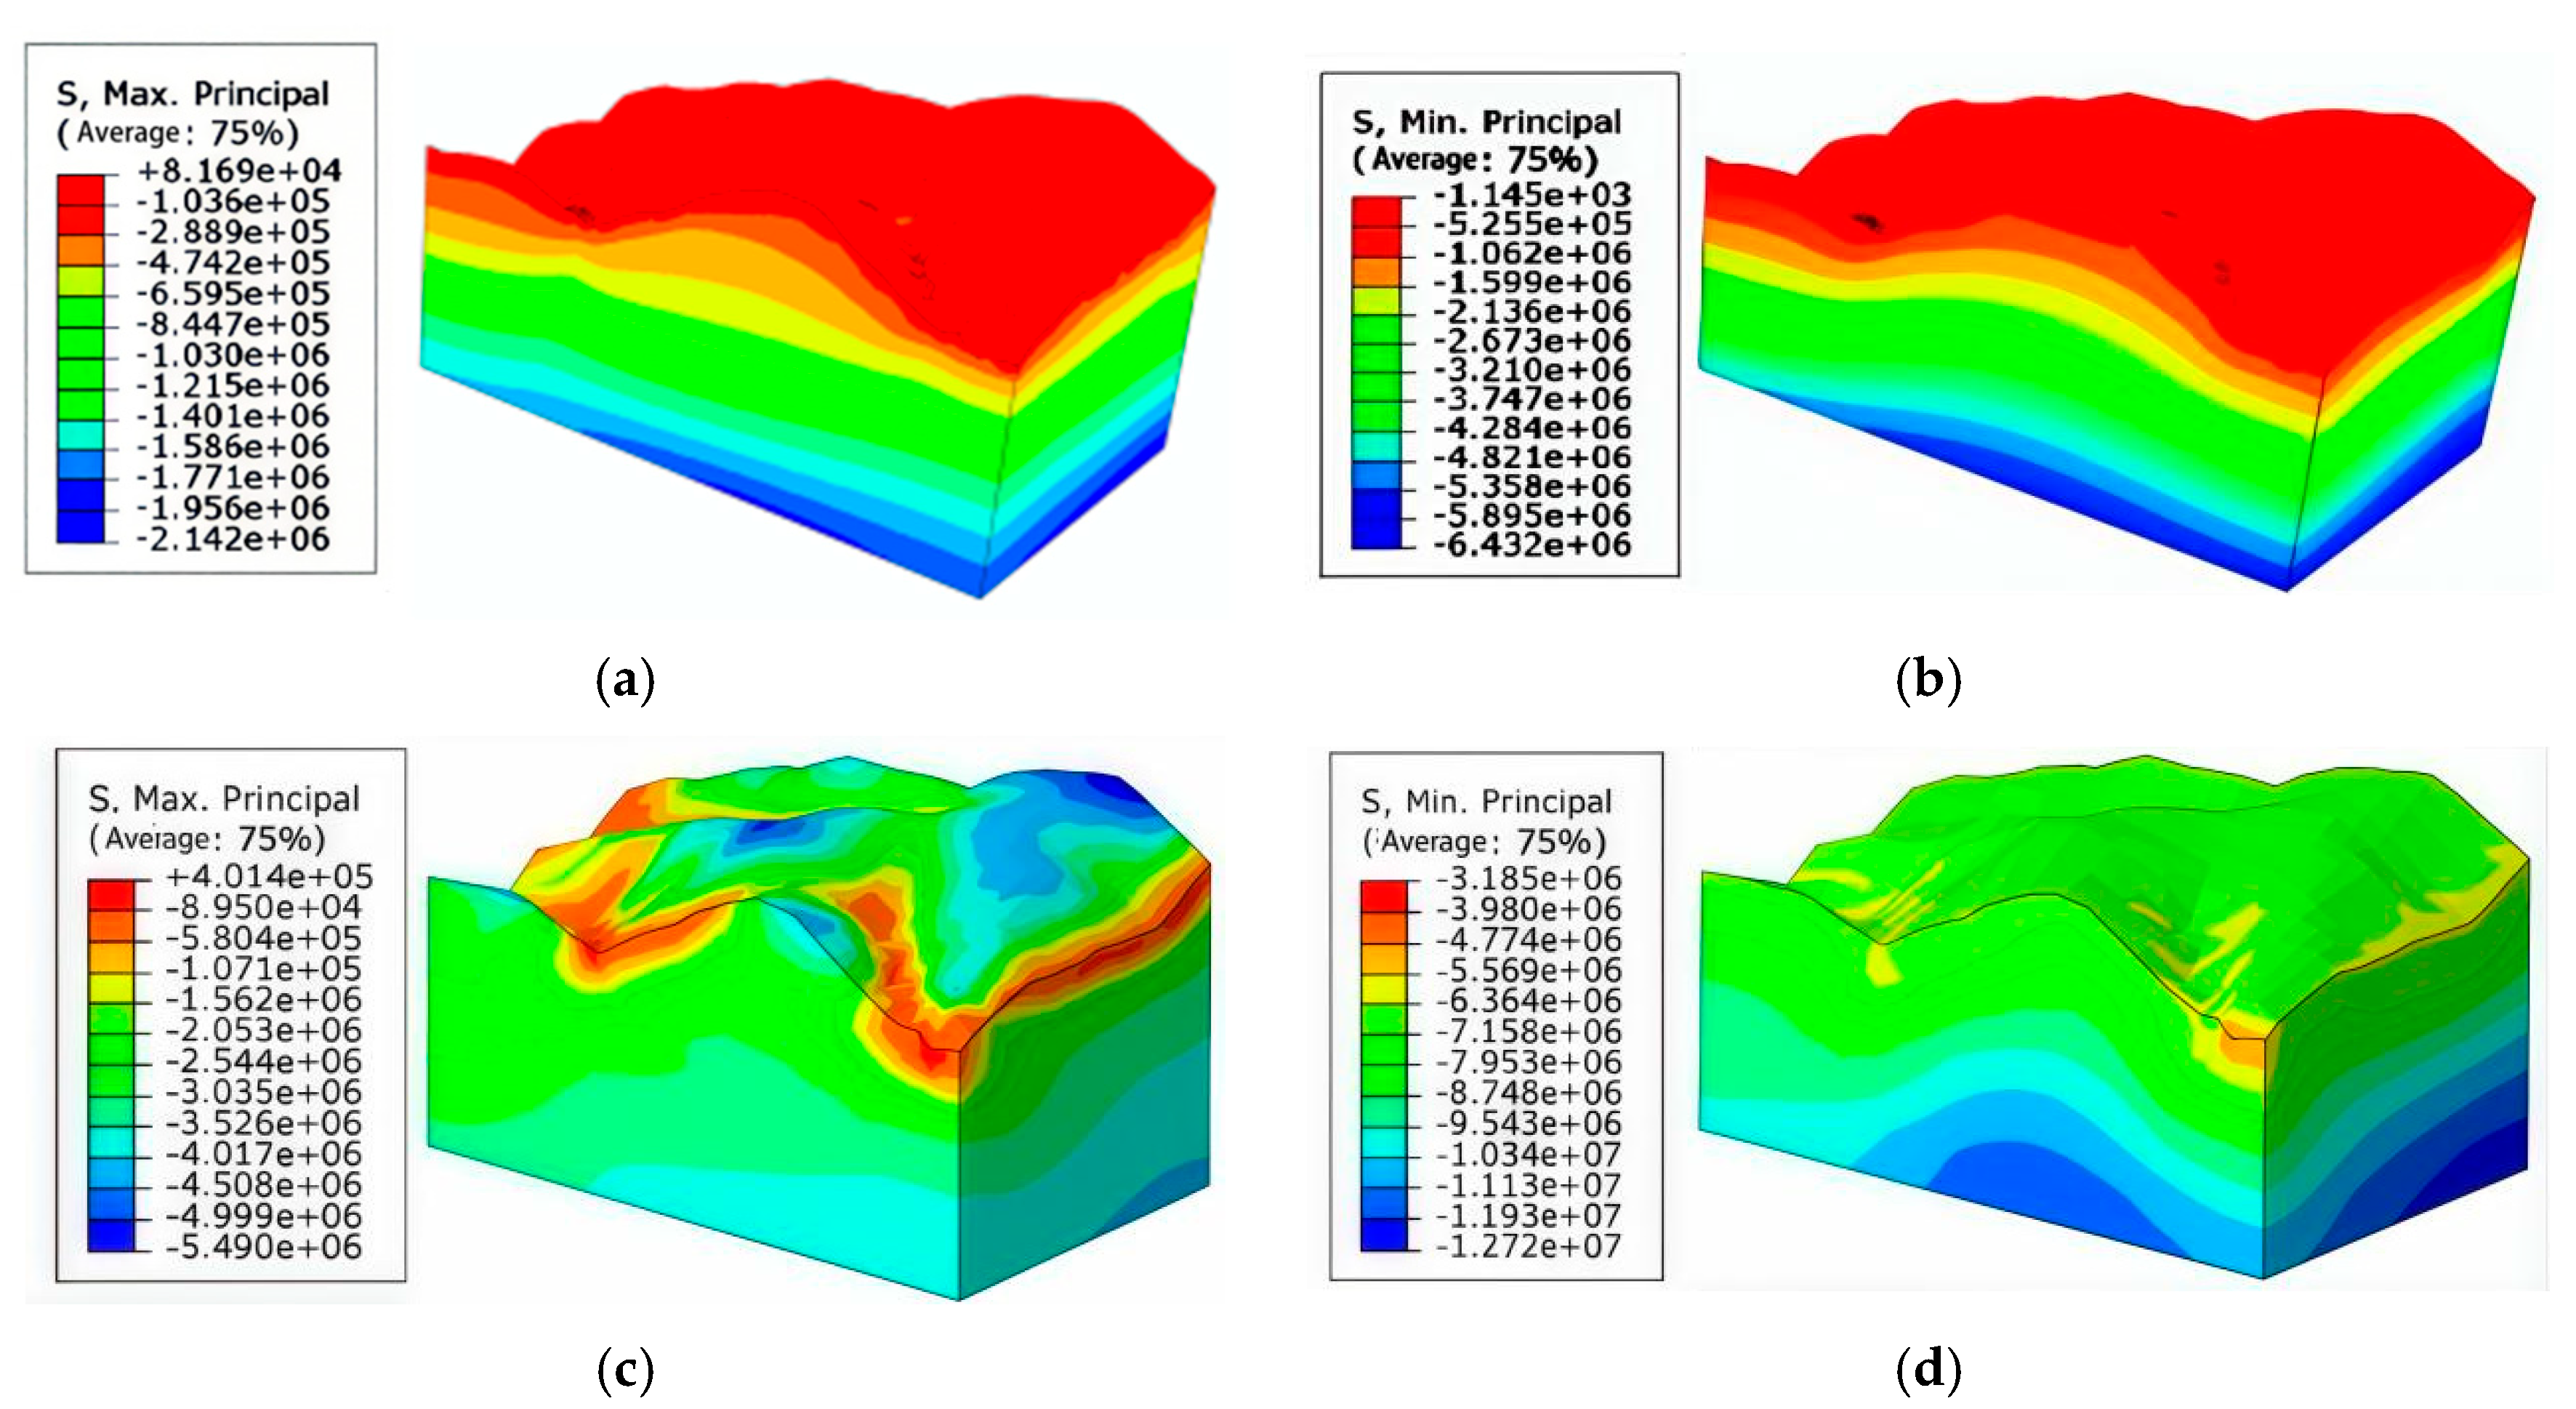
The change of effective stress of slope under rainfall condition will reduce the slope stability. Therefore, it is necessary to study the change rule of effective slope stress under rainfall conditions. The calculation of the first principal stress and the third principal stress before and after rainfall on a typical plot of slope under the conditions of pile load arrangement is shown in
Figure 11.
According to the comparison of the first and third principal stresses before and after the rainfall in
Figure 10, it can be seen that the first principal stress cloud maps are dominated by negative values under the pile load environment applied to the natural mountain before and after the rainfall. That is, the mountain model is stressed in the form of compressive stress in the state of applied pile load, and the stress value is about 5.5 MPa or less before rainfall. The maximum value of compressive stress is about 5.490 MPa, and the shear strain increases rapidly after rainfall. The third principal stress cloud is negative, i.e., there is no tensile stress in the mountain model under the applied pile load condition, while the maximum compressive stress grows from 1.145 MPa to 3.185 MPa. and the stress distribution increases sequentially from the top of the slope to the bottom of the slope. This is mainly due to the fact that at the beginning of rainfall, the matrix suction in the unsaturated soil body forms additional effective stresses to support the soil skeleton through capillary action, and at this time the third principal stress is at a low level. With the continuous infiltration of rainwater, the soil body is gradually saturated, and the matrix suction disappears, leading to the collapse of the original “implicit support” provided by the negative pore water pressure. The effective stress between soil particles decreases, and the self-weight of the overlying soil and external loads are forced to redistribute. At the same time, the increase of pore water pressure shared part of the load, so that the soil body as a whole is still in the state of compression. Therefore, under the combined effect of rainfall and pile load, the hill model shows the distribution of compressive stress increasing from the top to the bottom of the slope.
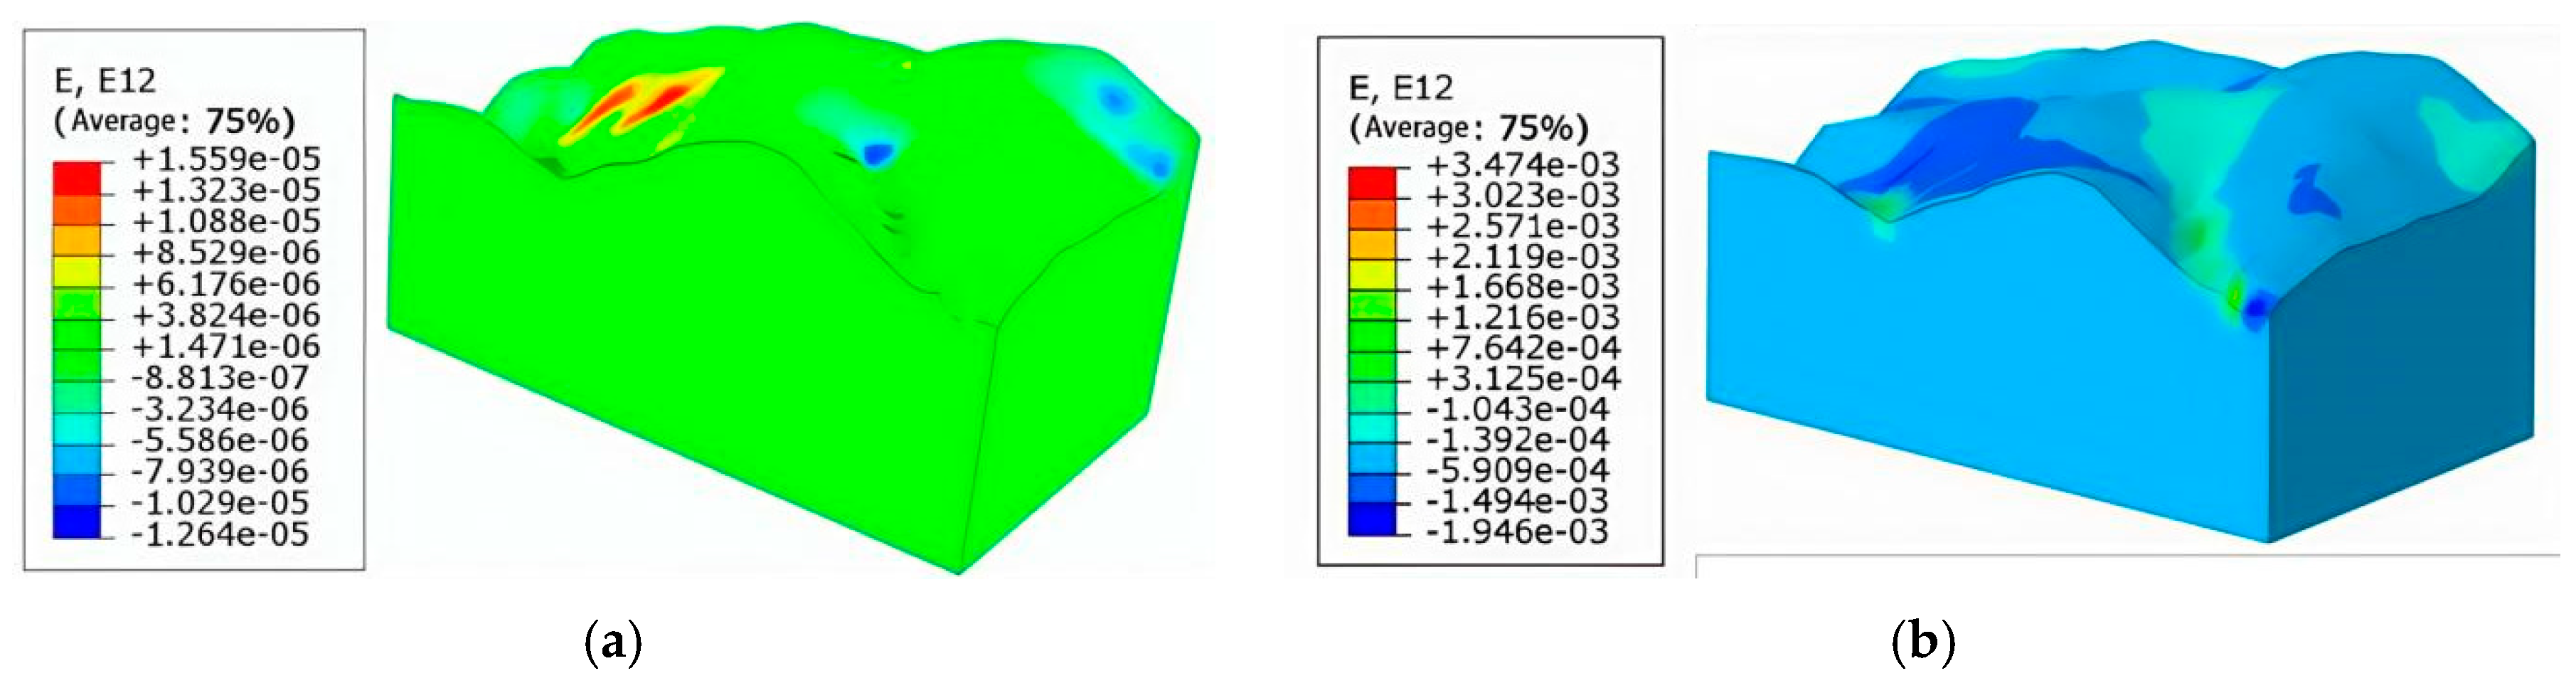
The change in shear strain of the site before and after rainfall is shown in
Figure 12. Analyzing
Figure 12, it can be seen that the maximum shear strain before and after rainfall is mainly distributed on the surface of the cover layer. The maximum shear strain after the rainfall is about 1.559e
-5, which is more intensive than before the rainfall to increase the maximum shear strain change in the cover layer at the slope surface. The maximum shear strain change tends to be gentle at deeper depths. In order to quantitatively analyze the law of different rainfall intensities on the slope stress and deformation field, a monitoring node ① was selected on the slope surface.
A plot of XY displacement versus time for different rainfall intensities at monitoring node ① is shown in
Figure 13.
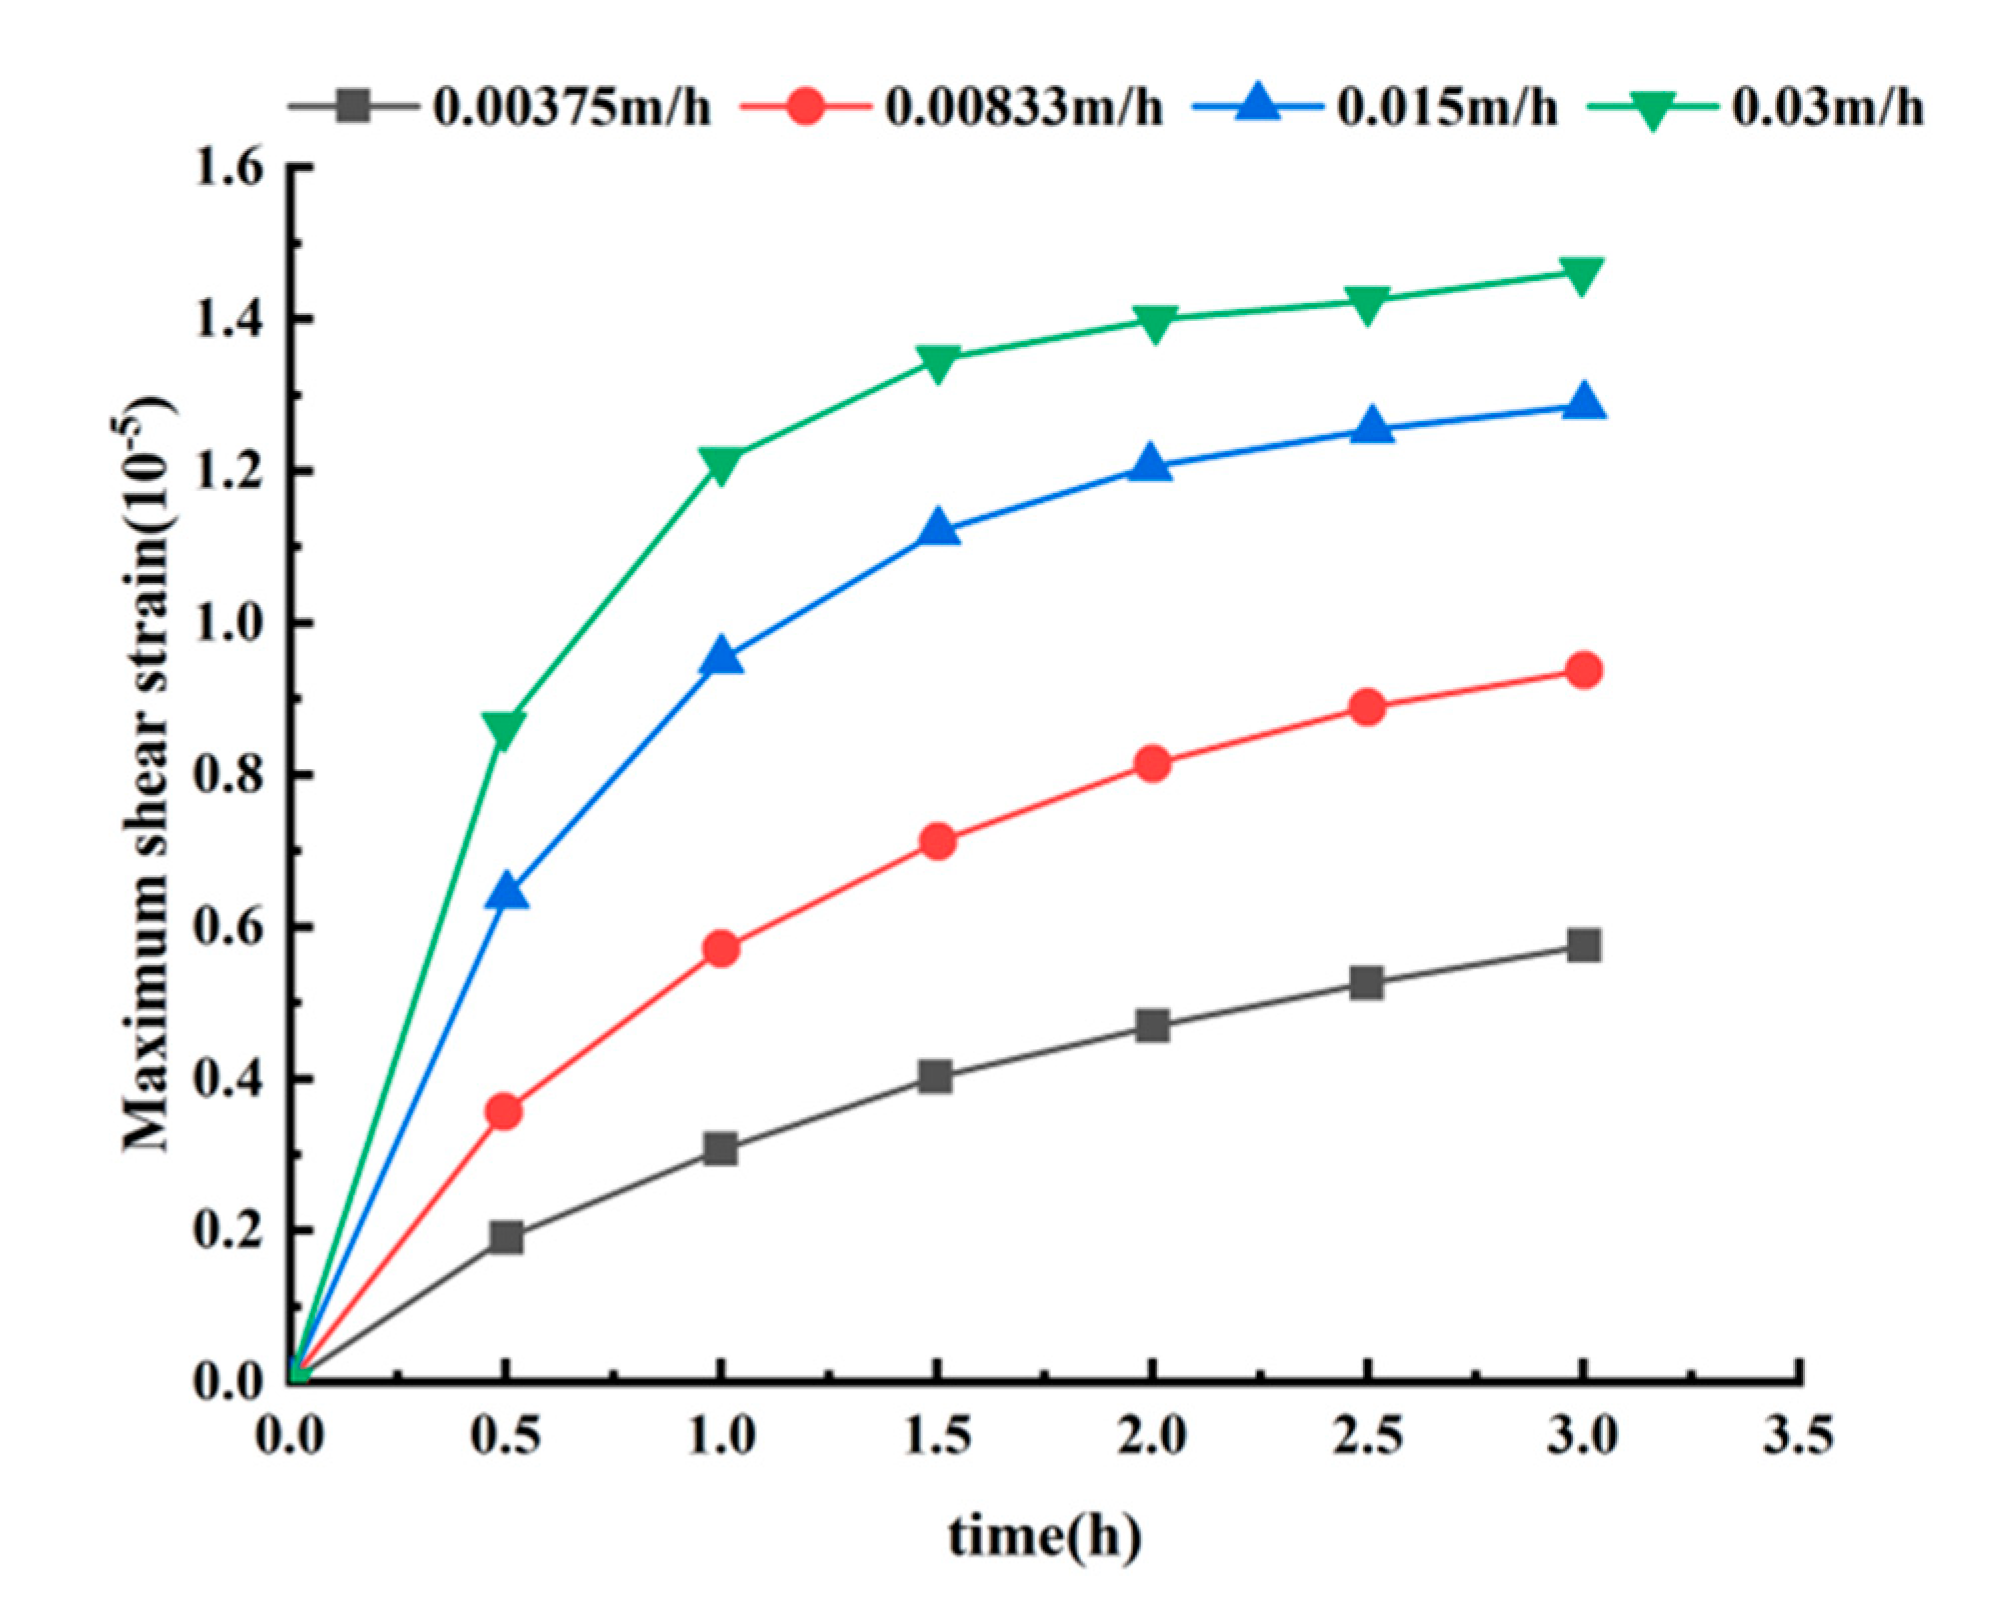
From the change of maximum shear strain, it can be seen that the greater the intensity of rainfall, the greater the maximum shear strain of the soil body. With the growth of rainfall time, the growth rate of maximum shear strain of the soil body gradually decreases until it tends to zero, and the maximum shear strain eventually tends to stabilize. The difference in maximum shear strain between the rainfall intensity of 0.00375m/h and 0.03m/h is 1.5401e-5.
3.3. Prediction of Slope Safety Factor Under Rainfall Conditions
The Random Forest (RF) method is an ensemble learning algorithm proposed by Breiman [
23]. It serves as an extended variant of Bagging, further enhancing the performance of ensemble models by introducing random attribute selection during the training process of decision trees. Its core principle involves generating multiple data subsets through random sampling, training numerous weak learners, and combining these weak learners into an ensemble model with strong generalization capabilities (
Figure 14). The algorithm’s general procedure is as follows:
(1) Random Data Sampling: Using the Bootstrap method, multiple sample subsets are randomly drawn with replacement from the original training set. Each subset is used to train an independent decision tree.
(2) Random feature selection: During node splitting in each decision tree, instead of selecting the optimal splitting feature from all M features, a random subset of m (m<M) features is first chosen as candidate features. The best splitting attribute and split point are then selected from this subset to enhance diversity among trees.
(3) Training multiple decision trees: The above steps are repeated n times to obtain new sample sets P1, P2,…, Pn and train corresponding decision trees T1, T2,…,Tn. The ensemble of these trees forms the random forest.
(4) Ensemble Prediction: For regression tasks, the random forest averages the predictions from each tree as the final output value. For classification tasks, it employs Majority Voting [
24], using the majority vote as the final class label.
Random forests enhance model generalization capabilities by introducing dual randomness in both data and features, while also exhibiting strong resistance to overfitting. They support parallel training and are suitable for various regression and classification tasks. In this model, we use the following function to train the random forest model:
In the formula:
and
represent the two feature spaces partitioned by feature a and threshold t;
and
denote the mean values of samples in the two partitioned regions [
25].
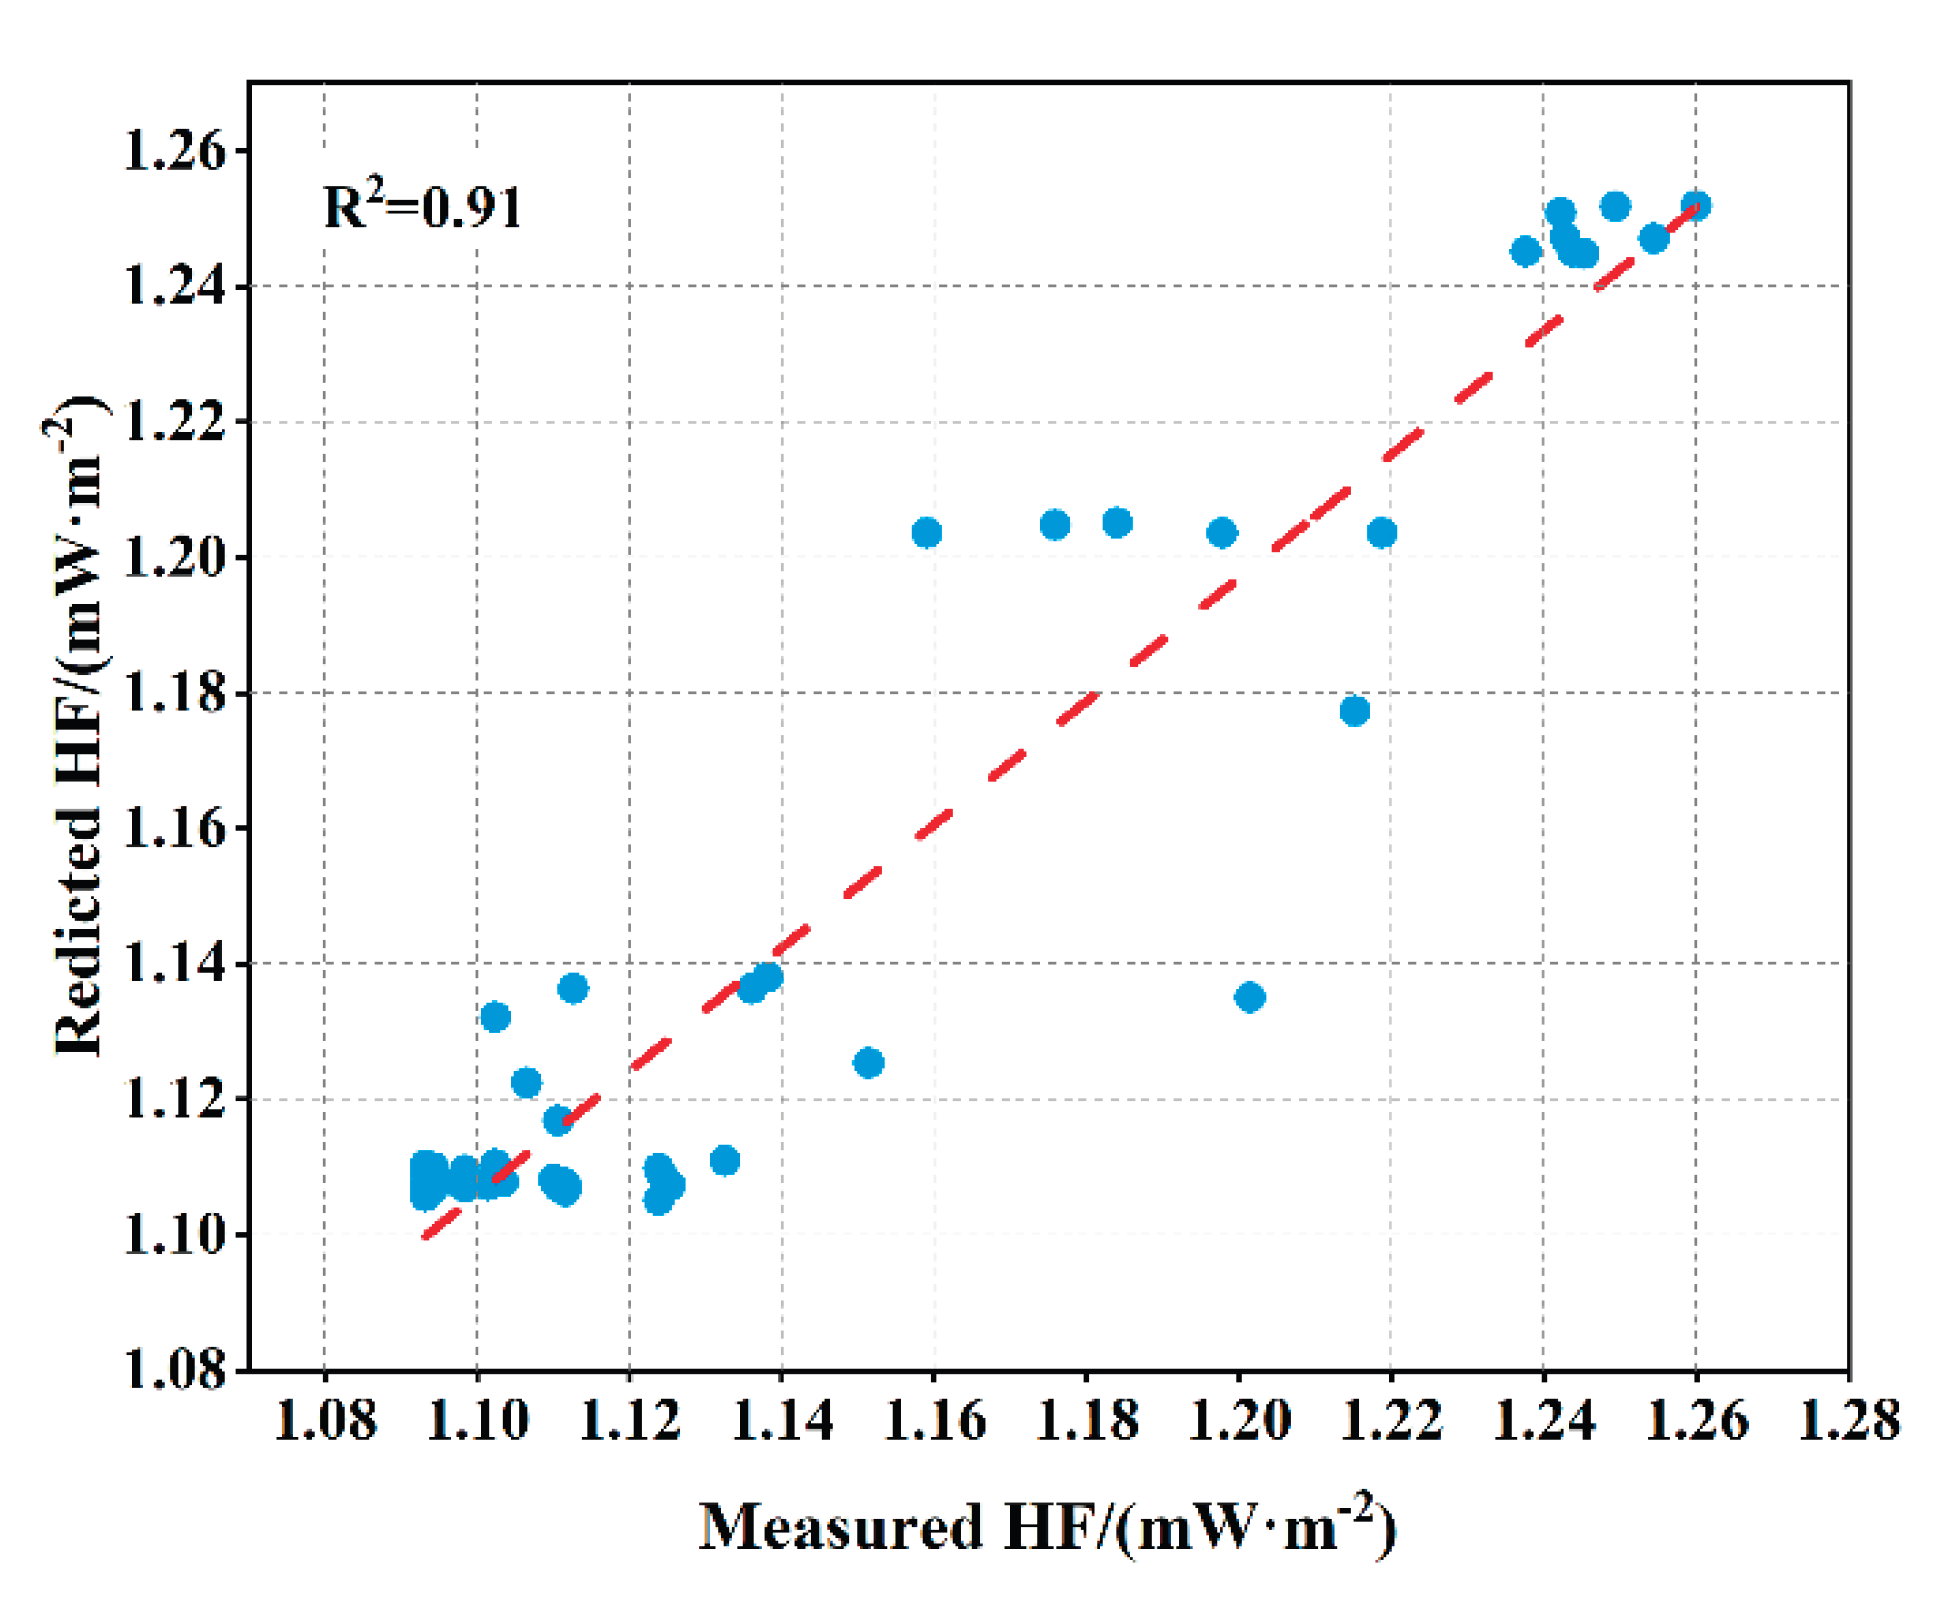
The selected hyperparameters are: the number of decision trees (n_estimators), the maximum number of features per decision tree (max_features), the maximum depth of decision trees (max_depth), the minimum number of samples required for splitting each node (min_samples_split), the minimum number of samples required for each leaf node (min_samples_leaf), and the quality metric for evaluating each node split (criterion). In the Random Forest model, the step size for n_estimators is set to 20, adjusted between 20 and 300. max_depth is adjusted in increments of 2 between None and 30. max_features was selected as sqrt and log2, min_samples_split was adjusted from 1 to 30 with a step size of 2, and min_samples_leaf was adjusted from 1 to 10 with a step size of 1. After cross-validation with neural grid search, the optimal parameter combination was output as n_estimators=247, max_depth=24, max_features=log2, min_samples_split=20, min_samples_leaf=10, criterion=mae. The prediction results are shown in
Figure 13, with an R² value of 91% and a maximum N-RMSE of 0.0254 across the five safety factor group.
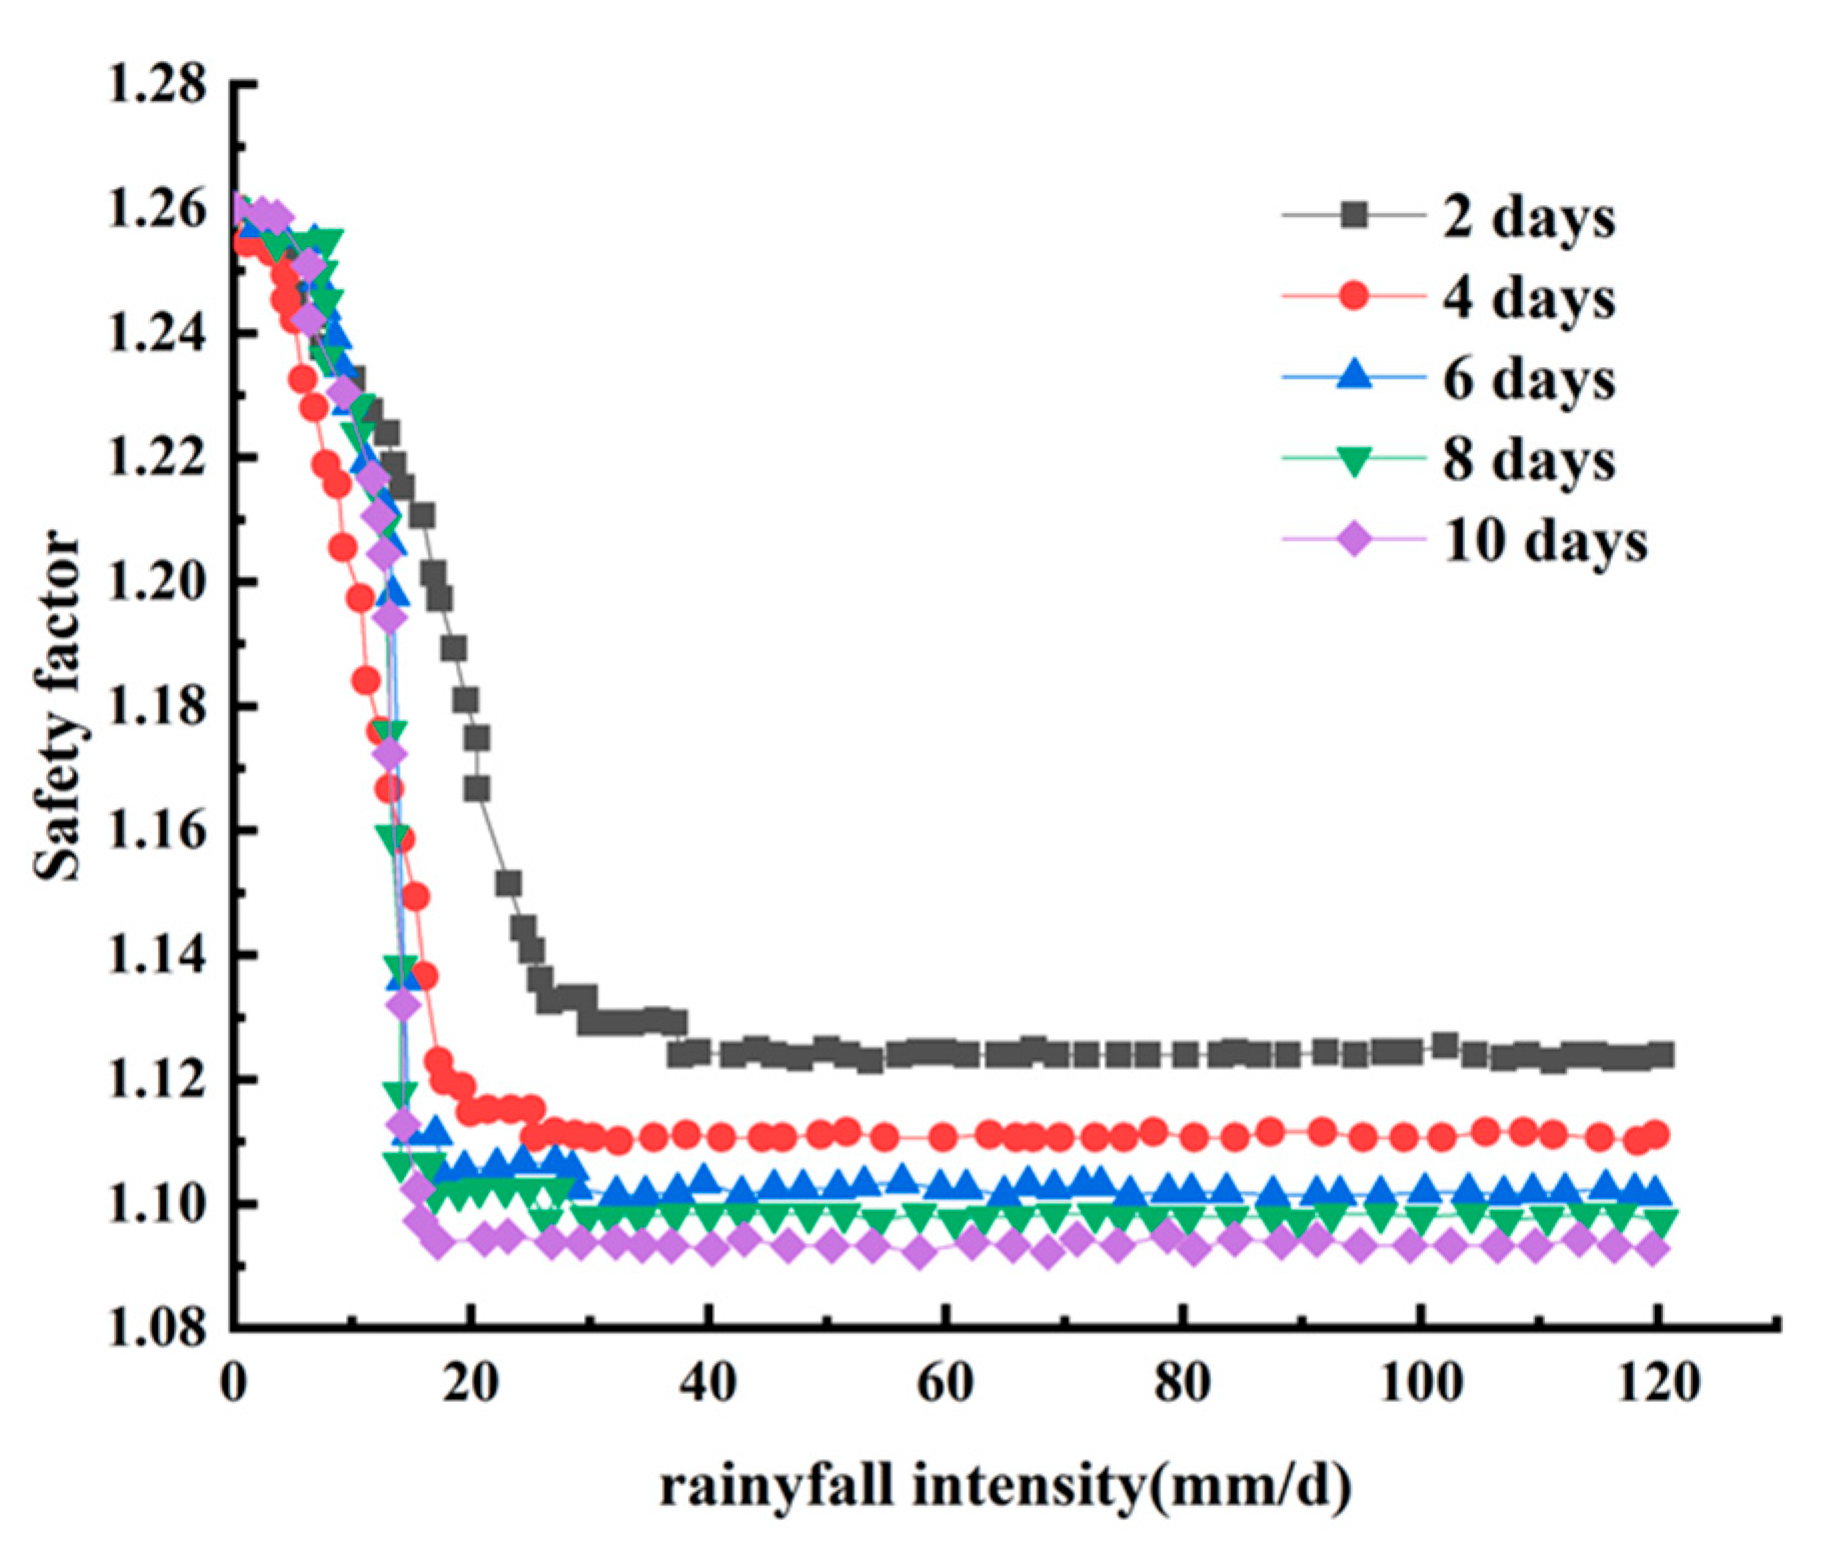
This paper analyzes the variation patterns of the safety factor for slopes under different rainfall intensities and durations, using the worst-case scenario as an example, as shown in
Figure 12. Based on the classification criteria for slope stability states outlined in the “Code for Engineering Investigation of Landslide Prevention and Control” (GB/T 32864-2016) [
26], the relationship between the safety factor and stability states is presented in
Table 2.
Figure 12 shows that the slope safety factor decreases gradually during the initial rainfall phase. As rainfall intensity and duration increase, the safety factor rapidly diminishes until it stabilizes. The longer the rainfall duration, the lower the stabilized safety factor value. After Bayesian hyperparameter optimization, the R² values for the safety factor test sets under different rainfall intensities and durations were 0.76, 0.96, 0.98, 0.83, and 0.88, respectively. This indicates that the random forest model achieved good learning performance and can effectively predict the safety factor of photovoltaic power station slopes under rainfall conditions.
Figure 14.
Schematic diagram of random forest algorithm.
Figure 14.
Schematic diagram of random forest algorithm.
Figure 15.
Law of change of safety coefficient.
Figure 15.
Law of change of safety coefficient.
Figure 16.
Prediction performance of random forest.
Figure 16.
Prediction performance of random forest.
4. Conclusions
(1) At the beginning of rainfall, the matrix suction (negative pore water pressure) in the unsaturated zone gradually decreases with water infiltration, and the pore pressure at the top of the slope changes most significantly. During high-intensity rainfall, the pore water pressure rises sharply in the short term (e.g., rapid saturation under 0.03 m/h rainfall intensity), and then tends to equilibrate due to drainage. The distribution of pore pressure shows the laminar characteristic of “top of slope > bottom of slope”, and the expansion of saturated zone leads to the reduction of effective stress. With the increase of rainfall intensity, the volumetric water content of the surface layer of the slope from the top of the slope to the foot of the slope at each monitoring point showed a trend of rapid growth followed by gradual stabilization.
(2) The maximum compressive stress of the third principal stress increased from 1.145 MPa to 3.185 MPa (about 178% increase) after rainfall. The main reason is that the effective stress of soil skeleton decreases after the disappearance of matrix suction, the load is concentrated to the interface of water barrier layer, and the pore water pressure rises to passively enhance the compressive stress of soil particles. The first principal stress is always dominated by compressive stress (maximum value 5.49 MPa), and the rainfall triggered a change in the stress path, which intensified the local compressive stress concentration.
(3) The maximum shear strain reached 1.559×10-⁵ after rainfall, which increased significantly and was concentrated in the slope cover layer. Water infiltration saturated and softened the shallow soil and attenuated the shear strength. The dynamic water pressure further drove the shear deformation to gather toward the potential slip surface, forming a strain localization zone, which may eventually lead to shear damage.
(4) The safety factor exhibits a three-stage pattern of “gradual decline—accelerated reduction—dynamic stabilization”: During the intermediate phase, the expansion of the saturated zone causes a sudden drop in effective stress and an increase in permeation force, leading to a rapid decrease in the safety factor; In the later phase, prolonged immersion expands the softened soil area and impedes drainage, ultimately stabilizing the safety factor near the critical value (close to 1.0). The slope reaches a state of limit equilibrium, becoming highly susceptible to instability under external disturbances. The slope stability prediction model developed using the Random Forest algorithm effectively integrates multi-source rainfall and geological parameters, enabling rapid and accurate safety factor predictions. This provides an intelligent tool for real-time early warning and decision-making in the prevention and control of rainfall-induced slope hazards.
Author Contributions
For Jiangjiang Wu: Conceptualization, Methodology, Writing – original manuscript, Validation. Junrui Chai: Conceptualization, Methodology, Writing – review & editing, Supervision. Yuan Qin: Methodology, Supervision, Data curation, Writing – review & editing, Conceptualization. Jiayue Yin: Methodology, Writing – review & editing. Weihua Zhang:Methodology, Writing – review & editing.
Funding
Please add: This research was funded by the National Natural Science Foundation of China, grant number 52279139”.
Data Availability Statement
The original contributions presented in this study are included in the article. Further inquiries can be directed to the corresponding author.
Conflicts of Interest
The authors declare no conflicts of interest.
References
- Chatra A S,Dodagoudar G R,Maji V, B. Numerical modeling of rainfall effects on the stability of soil slopes[J]. International Journal of Geotechnical Engineering 2019, 13(5): 425. [CrossRef]
- Liu G, Tong F, Zhao Y, et al. A force transfer mechanism for triggering landslides during rainfall infiltration[J]. Journal of Mountain Science, 2018, 15(11): 2480-2491.
- He Z, Huang Y, Li Y, et al. Probabilistic fragility assessment of slopes considering uncertainty associated with temporal patterns of rainfall intensity[J]. Computers and Geotechnics, 2024, 173: 106534.
- Zhang F,Pei H.Stability analysis of shallow slopes under rainfall infiltration considering tensile strength cut-off[J].Computers and Geotechnics,2024,171106327-.
- Hao C,Zhijun W,Hong C, et al. Stability analysis of unsaturated–saturated soil slopes under rainfall infiltration using the rigorous limit equilibrium method[J]. 2024.
- Weihua F, Rongqiang Y,Hui H, et al. Slope stability analysis under rainfall infiltration condition using the minimum potential energy method[J]. 2023.
- Xi C H,Shun T H,Ye C.Three-dimensional slope stability and anti-slide pile treatment of Zhang jiayao landslide under rainfall[J].Engineering Computations,2023,40(9-10):2667-2692.
- Wang Y,Chai J,Cao J, et al. Effects of seepage on a three-layered slope and its stability analysis under rainfall conditions[J].Natural Hazards,2020,102(3):1-10.
- Ming G R,Min X,Mei S L.Stability Analysis of a Landslide Influenced by Rainfall[J].Soil Mechanics and Foundation Engineering,2023,60(1):55-62.
- Rahayu W,Ramadhan I R, Adinegara W A, et al. Effect of slope protection using concrete waste on slope stability during rainfall[J].Results in Engineering,2024,24103244-103244.
- Yuke W,Musen H,Xiaoying L, et al.Influence of Rainfall Conditions on Stability of Slope Reinforced by Polymer Anti-slide Pile[J]. 2021.
- Kenta T,J. L N D,Yoshiya T, et al. Limit equilibrium method-based 3D slope stability analysis for wide area considering influence of rainfall[J]. 2022.
- Miao F, WuY, LiL, et al. Centrifuge model test on the retrogressive landslide subjected to reservoir water level fluctuatio[J]. Engineering Geology, 2018, 245: 169-179.
- J. Tian, L. J. Tian, L. Han, X. Jin, L. Xu, X. Wang, and Y. Dong, “Effect of rainfall on slope stability of Picea crassifolia forest based on finite element method in Qinghai,” Science of Soil and Water Conservation, vol. 17, no. 6, pp. 11–18, 2019.
- Zhang J,Hu F,Zhang Q, et al. Evaluation of the Effects of Rainfall Infiltration Boundaries on the Stability of Unsaturated Soil Slopes Using the Particle Flow Code[J].Water,2024,16(24):3704-3704.
- Lei Z,Xin J,Rong S, et al. Stability analysis of unsaturated soil slopes with cracks under rainfall infiltration conditions[J]. 2024.
- Jianqing J, Chengxin M,O. V T.Slope stability considering multi-fissure seepage under rainfall conditions[J].Scientific Reports,2024,14(1):11662-11662.
- Cheng Q,Hou K,Sun H, et al. Numerical Simulation of Rainfall-Induced Erosion on Infiltration and Slope Stability[J]. 2024.
- Zhen Z L,Xin Z Y,Hong Z Q, et al. Stability analysis of an unsaturated soil slope considering rainfall infiltration based on the Green-Ampt model[J].Journal of Mountain Science,2020,17(10):2577-2590.
- C. Sun, A. C. Sun, A. Li, and H. Zhang, “Numerical simulation on slope stability under rainfall infiltration,” Port Engineering Technology, vol. 50, no. 4, pp. 67–70, 2013.
- M Z.Identification of unstable reference points and estimation of displacements using squared Msplit estimation[J]. 2022.
- Hubert M Z,S. P D.Matrix strengthening the identification of observations with split functional models in the squared Msplit(q) estimation process[J].Measurement,2023,217.
- Breiman L.Random Forests.[J].Machine Learning,2001,45(1):5-32.
- Shandhoosh V,S V N,Chakrapani G, et al. Intelligent fault diagnosis for tribo-mechanical systems by machine learning: Multi-feature extraction and ensemble voting methods[J].Knowledge-Based Systems,2024,305112694-112694.
- Min L,Song H,Miao D, et al. Prediction of marine heat flow based on the random forest method and geological and geophysical features[J]. 2021.
- Code for geological investigation of landslide prevention: GB/T 32864-2016[S]. Beijing, General Administration of Quality Supervision、Inspection and Quarantine of the People’s Republic of China,2016.
|
Disclaimer/Publisher’s Note: The statements, opinions and data contained in all publications are solely those of the individual author(s) and contributor(s) and not of MDPI and/or the editor(s). MDPI and/or the editor(s) disclaim responsibility for any injury to people or property resulting from any ideas, methods, instructions or products referred to in the content. |
© 2025 by the authors. Licensee MDPI, Basel, Switzerland. This article is an open access article distributed under the terms and conditions of the Creative Commons Attribution (CC BY) license (http://creativecommons.org/licenses/by/4.0/).