Submitted:
29 September 2025
Posted:
30 September 2025
You are already at the latest version
Abstract
One of the biggest risks to safety on offshore platform safety is the ignition of high pressure natural gas streams. Currently, the size and number of fugitive emissions on offshore platforms is unknown and methods used to detect fugitives have significant shortcomings. To investigate the frequency, size and potential impact of fugitives, a data collection exercise was conducted using incidents reported, leak survey data and independent measurements. The size and number of fugitives on offshore facilities were simulated to investigate likely areas of safety concern. Incident reports indicate in 2021 there were 113 reports of gas leaks on 1119 offshore facilities suggesting 0.02 fugitives per Type 1 facility (older, shallow water platforms) and 0.31 fugitives per Type 2 facility (larger deeper-water facilities). Leak survey data report 12 fugitives per Type 1 facility (average emission 0.6 kg CH4 h-1 leak-1) and 15 fugitives per Type 2 facility (average emission 1.5 kg CH4 h-1 leak-1). Reconciliation of direct measurements with a bottom-up model suggests that the number of fugitive emissions generated from the leak report data is an underestimate for Type 1 platforms (44 fugitives facility-1; average emission 0.6 kg CH4 h-1 leak-1) and in general agreement for the Type 2 platforms (15 fugitives facility-1; average emission 1.5 kg CH4 h-1 leak-1). Analysis of the fugitive emission rates on an offshore platform suggests that gas will not collect to explosive concentration if any air movement is present (> 0.36 mph), however, large volumes of air (~600 m3) near representative leaks on the working deck could become explosive in hour-long zero-wind conditions. We suggest that wearable technology could be employed to indicate gas build up, safety regulations amended to consider low-wind conditions and real-world experiments are conducted to test assumptions of air mixing on the working deck.
Keywords:
offshore
; gas production
; safety
; explosion
1. Introduction
Globally, 29% of all crude oil (27 MMbbl day-1) and 28% of all natural gas (27 MMboe day-1) is produced offshore [1,2]. Saudia Arabia (13% global production) and Brazil (12%) are the largest offshore producing countries while the largest production regions are the Persian Gulf, the Gulf of Mexico, West Coast of Africa, and the North Sea. In 2022, almost all US offshore oil and natural gas production took place in the Gulf of Mexico, where an average of 1.8 million barrels per day (15% of the total US crude oil) and 0.8 Tcf natural gas (2.3% of the total US natural gas) is produced by 1119 production platforms [2,3,4].
Offshore platforms operating in the Gulf of Mexico typically consist of a deck that is fixed in place above well heads on the seafloor by either a rigid structure (e.g. legs) or a floating structure tethered via cables. Produced oil, gas and water are separated then either stored, exported to shore, or processed on the working deck. Typically, production platforms can be categorized into: Fixed Leg (806 operating between Texas and Louisiana in the Gulf of Mexico in 2023; Figure 1), Caisson (253), Spar (17), Semi-Submersible (15), Tension leg (17), Well Protector (6), Compliant tower (2), Floating Production, Storage and Offloading (FPSO) facilities (2), and Mobile Production Units (1). A full description of each type can be found in Lyons et al. (2016) [5] and a brief summary in Riddick et al. (2025) [6], but more usefully they can be grouped into two types (described in Section 2.1).
The Bureau of Safety and Environmental Enforcement (BSEE) is America’s lead agency charged with advancing safety, environmental protection and conserving natural resources related to energy development on the U.S. Outer Continental Shelf (OCS) for facilities in the Gulf of Mexico west of the 87.5o latitude and areas offshore the North Slope Borough of Alaska [7]. The mission statement of BSEE is to promote safety, protect the environment, and conserve resources offshore through vigorous regulatory oversight and enforcement. The BSEE 2023-2026 Strategic Plan has four goals (People, Protection, Reliability, and Sustainability) which are guided by five core principles (Culture, Communication, Coordination, Collaboration, and Commitment). The first goal, People, aims to attract, develop, and retain a diverse, skilled, and engaged workforce. Protection aims to reduce risk to people and the environment in offshore operations. Reliability aims to deliver consistent reliance on systems and tools that sustain trust, transparency, and accountability. Sustainability advances the conservation of natural resources through conscientious and responsible energy development. BSEE’s Center for Offshore Safety (COS) is focused on requiring Safety and Environmental Management System (SEMS) tools, good practices, and the implementation of techniques based on API Recommended Practice 75 (API RP 75). API RP 75 provides a framework for companies to evaluate and improve their safety and environmental protection programs. Organizations can mitigate risks and better protect their workforce and the environment by incorporating the API RP 75 guidelines into their operations. API RP 75 serves as a benchmark for best practices in safety and environmental protection within the oil and gas sector and encourages a proactive approach to safety management rather than a reactive one. As part of the BSEE remit, operators are responsible for implementing a SEMS program throughout the life of their offshore operations. This requires a commitment to hazard identification, risk management, and continual improvement as well as the goals of operational integrity and safety and environmental protection. US OCS contractors and drillers seeking a SEMS certificate are required to complete an audit which includes details of risk assessment and risk controls (Element 3) and safe work management and safe work practices (Element 5), both of which are directly affected by the presence of fugitive emissions which are hitherto not considered in the audit.
Despite the systems in place, upstream oil and gas production is one of the most dangerous occupations in the US. In 2023 and of the 382,928 people directly employed in the oil and gas upstream sector [8], 78 fatal injuries occurred in oil and gas extraction activities [9]. The fatal work injury rate for oil and gas (20.4 per 100,000 full-time workers) is larger than other private sector industries, agriculture-forestry-fishing-hunting (20.3), transportation/warehousing (12.9), construction (9.6), and seven times larger than the national average (3.3). Five occupational health risks for offshore workers are defined by the UK Health and Safety Executive (musculoskeletal disorders; hazardous substances; physical hazards; biological hazards; and psychosocial hazards) [10] which generally tracks with the causes of fatal injuries in the US (transportation events: 51% of offshore fatal events; contact with objects and equipment: 13%; fires and explosions: 13%; exposure to harmful substances/environments: 13%; others: 7%) [9,11,12,13]. While most of the causes of fatal events happen to an individual, offshore fires and explosions have been highlighted in as being relatively rare but catastrophic in outcome where single events can result in multiple fatalities [12,13,14,15].
Methane gas is the primary component of natural gas (between 70 and 95%) and is generally considered harmless to an individual unless it collects within a space to a mixing ratio of between 4% (lower explosive limit) and 14% (upper explosive limit) where the methane enriched atmosphere can ignite and/or cause an explosion. The BSEE has identified ignition of high pressure natural gas streams as a primary fire hazard [16] and offers guidance on best practice for offshore leak detection including using primary protection (SCADA-based methods that monitor flow, pressure, and temperature indicate leaks) and secondary protection (sensors to detect small leaks) [17].
Several top-down methods, including driving, tall tower, aircraft and satellite surveys [18,19,20,21,22,23], have been used to detect and quantify methane emissions from onshore oil and gas operations and estimate normalized methane losses at between 2 and 4 % of production. Currently, normalized methane loss from offshore oil and gas production is estimated by bottom-up approaches at 0.4% [24] and many studies have recently reported on discrepancy between the expected and observed emissions [25,26,27] with offshore emission thought to be underestimated by a factor of five [28]. Even though direct measurement of whole facility offshore emissions have been developed using downwind, aircraft and satellite methods [29,30,31,32,33,34,35,36,37,38,39,40], fugitive emissions on offshore facilities are detected by operators only using methods that directly find emissions. Audio, visual, and olfactory (AVO) surveys are conducted when an offshore worker uses their senses to detect emissions. These surveys are limited by access, background noise and the surveyor’s innate abilities. More recently, leak detection and repair (LDAR) surveys have been conducted using optical gas imaging (OGI) cameras that use infra-red absorption to indicate the presence of methane, however, these cameras can only detect emission greater than 130 g CH4 h-1 , the detection is limited by operator experience, access and background temperature, and emission cannot be detected in wind speeds more than 9 m/s (21 mph) [41].
To our knowledge, the only available data on the number and size of offshore fugitive emissions are either leakage incidents reported to BSEE [11], those reported to the US Bureau of Ocean Energy Management (BOEM) and used as part of their annual emission inventory from the Gulf of Mexico [42], or inferred from the direct measurement of emissions [29,30,40,43]. Using each of the sources has strengths and weaknesses, however, data are available and could be used synergistically to generate a holistic view of offshore fugitive emissions. The BSEE incident reports cover all events from all offshore practices and therefore should give a geo spatial spread of events. The BOEM data do not report emissions from all facilities, however, they include surveys that are looking for leaks from a sub-set of operating platforms. Inferring fugitives is difficult from direct measurements as total facility emissions include vented and combustions emissions as well as those unintended, therefore, methods must be used to disaggregate them.
Given the discrepancy between onshore and offshore normalized methane loss, the importance of better understanding the expected number of fugitives with regard to safety and the potential shortcomings of current offshore fugitive detection methods, this study aims to better understand the size and frequency of fugitive emissions on offshore oil and gas production facilities and determine whether this could be a real problem. Specifically, we aim to 1. Conduct a data collection exercise using incidents reported to BSEE, size-number of fugitives reported to BOEM and independent measurement data to better understand the size and number of fugitives on offshore production facilities in the Gulf of Mexico; then 2. Use the size/number estimates superimposed onto a virtual oil production facility to investigate likely areas of safety concern. It is anticipated this study will help better inform safety protocols when working on manned offshore facilities and how best to prepare for visits to unmanned facilities.
2. Materials and Methods
2.1. Platforms in the Gulf of Mexico
As mentioned in Section 1, similarities in location, production rates and installed equipment exist between types of platforms. Here, and following the description in Riddick et al. (2025) [6], we describe how platforms in the Gulf of Mexico can be grouped into two facility types. Type 1 prototypical facilities are platforms that are fixed to the seabed that operate in shallower water (< 200 m) and are closer to shore (< 50 nm from shore). These are unmanned, typically older, have lower average facility production rates (178 bbl oil day-1; 620 Mscf day-1), have little or no processing equipment and both oil and gas are exported to shore via pipelines [3]. Type 2 prototypical facilities operate farther from shore (> 50 nm from shore) in deeper water (> 200 m). These platforms are manned 24 hours a day, have higher average facility production rates (4032 bbl oil day-1; 2928 Mscf day-1), and have processing equipment across the working deck (oil storage tanks, compressors and power generation). Henceforth, unmanned Fixed Leg, and Caisson platforms are defined as type 1 prototypical facilities while manned Fixed Leg platforms and all types of production platforms are defined as Type 2 (Figure 1).
2.2. BSEE Safety Reports
BSEE uses a performance-based approach, the Safety and Environmental Management System (SEMS), that integrates and manages offshore operations to enhance the safety and environmental performance of operations by reducing the frequency and severity of incidents [44]. The four principal SEMS objectives are: 1. focus attention on the influences that human error and poor organization have on incidents; 2. the continuous improvement in the offshore industry's safety and environmental records; 3. encourage the use of performance-based operating practices; and 4. collaborate with industry in efforts that promote the public interests of offshore worker safety and environmental protection.
SEMS regulation requires all operators submit safety incident reports to BSEE [11]. The safety incidents detail injuries, loss of well control incidents, collisions, and other incidents occurring offshore. These also include gas leakage events which can include gas leaks events reported by workers on the facility (i.e. detected through AVO), leak events that resulted in a fire, leaks detected by gas alarm systems and false alarms. For use in this study, data on the number of events reported to BSEE from each type of facility was collated as used to generate estimates of the number of leaks per facility for each type of facility.
2.2. LDAR Reports Published by BOEM
The number of leaks and size of fugitive emissions were generated using leak detection and repair (LDAR) data presented in the BOEM 2017 Gulfwide Emission Inventory Study [42]. For this inventory, 5% of active platforms reported having an active LDAR program with 91% of facilities conducting annual surveys and 9% conducting monthly surveys. Data show that surveys were conducted using optical gas imagers (91% of leaks) or by visual inspection (9%) [42]. To generate figures for actual number of fugitives per platform and size of average leaks, we extracted all measurement data from the 54 facilities in the 2017 BOEM inventory and disaggregated by prototypical facility type.
2.3. Measured Methane Emissions
Estimating fugitive emission from offshore facilities using measurement data requires an understanding of facility emission during normal operation, which can be subtracted from the total measured emission to give the total fugitive emission rate. Following the calculation presented in Riddick et al. (2025) [6], total working emissions from Type 1 facilities can be calculated from intermittent bleed pneumatic controllers (4.9 controllers per well; 2.6 wells per facility), process equipment (chemical injectors and dehydrators), produced water storage tank (43 bbl water h-1), and high pressure 2-phase and low pressure 3-phase separators. Similarly, emissions from type 2 facility can be calculated from intermittent bleed pneumatic controllers (4.9 controllers per well; 4 wells per facility); process equipment (treater, headers, chemical injectors and dehydrators); condensate/oil storage tanks (0.3 M bbl oil h-1); a produced water storage tank (0.2 Mbbl water h-1); 9 low pressure 3-phase separators; one high pressure 2-phase separator; a glycol dehydrator; and gas turbines driving dry seal centrifugal gas export compressors. Fugitive emission rates for both types of facility are taken from the results of the BOEM LDAR reports (as described in Section 2.2).
Whole facility measured methane emission data were taken from 294 platforms in the Gulf of Mexico: 151 measured using an aircraft-mounted spectrometer [29]; 52 measured using aircraft mass-balance [30]; and 103 using downwind dispersion approach [40]. Following Riddick et al. (2025) [6,45], these data were separated into types 1 and 2 and filtered using QC/QA criteria which results in emissions from 43 facilities that were most likely to be operating under normal operations, i.e. high confidence in measured data and no upset conditions or maintenance. The bottom-up operating emissions were subtracted from these 43 measured emissions to generate average fugitive emission rates from type 1 and type 2 facilities.
2.4. Case Study: Fugitive Methane Accumulation on a Production Platform
2.4.1. Platform Description
Even though there are common features to platform types (i.e. caisson, fixed leg and FPSO), the design and layout of each platform is not uniform. This means methane accumulation could vary significantly between individual structures. For the purposes of this study we make several assumptions about the facility design and investigate if it is possible for methane from fugitive emission to accumulate to the lower explosive limit (LEL) of methane and, if so, what environmental conditions would make this possible and how long would take. The assumption made are:
- Pipes carrying methane are external and valves/flanges are not found within sealed volumes (i.e. pipes do not pass through internal rooms) and are naturally vented by the wind.
- The working deck area has floors and ceilings that are impermeable to gas flow, the sides are open but the area is separated by solid walls.
- Fugitives emit at a continuous rate.
2.4.2. Size and Typical Locations of Fugitive Emissions
Using BOEM 2017 Gulfwide Emission Inventory Study [42], data were collected on the types of leaks observed on the 43 Type 1 and 11 Type 2 platforms and maximum, minimum and average emission rates calculated (kg CH4 h-1), as well as the probability of the type of leak occurring (i.e. being detected on an LDAR survey). The largest leaks (average > 0.1 kg CH4 h-1) with a higher-than-average chance of being detected (probability > 0.25) were then used to investigate accumulation.
2.4.3. Estimating Accumulated Methane Concentrations
To investigate potential maximum methane concentrations resulting from fugitives, a simple dilution approach is used. It is assumed that methane is emitted from gas pipework on the working deck where there is no vertical dispersion but gas can disperse horizontally with the wind. We also assume that the working deck has a height of 3 m and comprises sections separated by solid walls, but gas can move when wind moves the air [46]. The methane concentration of methane LEL (CM, g m-3) can be calculated from the fugitive emission rate (Q, g s-1) and the flow of air through the working deck (F, m3 s-1) (Equation 1). Here we assume the wind speed is a proxy for flow of air through the working deck.
Time taken to reach LEL (t, s) can be calculated using CM, Q, F, the density of air (ρ, g m-3) and the volume of the working space (V, m3) (Equation 2).
3. Results
3.1. BSEE Safety Reports
In 2021, there were 544 individual offshore safety incidents reported to BSEE from 1119 platforms operating in the Gulf of Mexico. 113 of these incidents were related to fugitive emissions with 68 events reported by workers on the facility, 13 that resulted in a fire, 13 correctly detected by gas alarm systems and 19 false alarms (Table 1). Of the 94 true fugitive emission reported to BSEE, 76 were reported from the 242 platforms manned 24 hours a day while 18 were reported from the 877 unmanned platforms. Using the BSEE incident reports, there were an average of 0.02 fugitives per facility reported on Type 1 facilities and 0.31 fugitives on Type 2 facilities.
3.2. LDAR Reports Published by BOEM
In the 2017 Gulfwide Emission Inventory Study there were 54 LDAR surveys reported from 54 offshore platforms, 43 Fixed Leg, 1 FSPO, 3 Semi-Submersibles, 3 Spar and 4 Tension Leg platforms (Table 2). For the 43 Fixed Leg platforms, there were 537 fugitives detected (average 12 fugitive emissions per platform) with an average emission rate of 0.64 kg h-1. There were fewer fugitive emissions found on the FPSOs (4 total; 4 average), but more on the Semi-Submersibles (54 total; 18 average), Spar platforms (49 total; 16 average) and Tension Leg platforms (61 total; 15 average). Emission rates from the larger platforms are also larger than the average emissions from the simpler facilities (Table 3). We assume the Fixed Leg platform data are representative of the number and size of fugitive emissions from prototypical facility type 1 facilities, resulting in 12 fugitive emissions per facility with an average emission of 0.62 kg CH4 h-1 leak-1. Type 2 facilities are the others resulting in an average of 15 fugitive emissions per facility with an average emission rate of 1.46 kg CH4 h-1.
3.3. Measured Methane Emissions
3.3.1. Type 1 Platforms
Using the bottom-up approach outlined in Section 2.3, the total operational emissions from a prototypical facility type 1 are estimated at 5.1 kg CH4 h-1 with the largest emissions from pneumatic controllers (2.0 kg CH4 h-1) and produced water treatment (2.2 kg CH4 h-1). This emission corresponds to a loss of 2.7 % of the average facility production of 480 kg CH4 h-1. Average emission from 33 Type 1 platforms was estimated at 17.6 kg CH4 h-1, and when compared against facility specific production rates, the median production loss is estimated at 8 %.
3.3.2. Type 2 Platforms
The calculated total emission from processing equipment on deep water, higher production platform facilities is estimated at 64.2 kg CH4 h-1, with the largest emissions from the liquid storage tanks (48.9 kg CH4 h-1), water storage tanks (8.2 kg CH4 h-1), and pneumatic controllers (3.1 kg CH4 h-1). This emission corresponds to a normalized methane loss of 2.5% of production of the average facility production of 3495 kg CH4 h-1. Average emission from 19 Type 2 platforms was estimated at 35.5 kg CH4 h-1, and when compared against facility specific production rates, the median production loss is estimated at 2.6 %.
3.4. Simulating Methane Emissions
3.4.1. Size and Typical Locations of Fugitive Emissions
Data in the BOEM 2017 Gulfwide Emission Inventory Study show that fugitives from gas connectors, ‘other equipment’ related to gas pipework and valves on gas lines are encountered during every LDAR survey of a Type 1 facility with emissions ranging from 0.001 to 7.6 kg CH4 h-1 (Supplementary Material Table S1). Fugitive emissions from oil and water pipelines are both less likely and emit at a lower rate when encountered. Even though emissions from gas pipelines (connectors, ‘other equipment’ and valves) are less likely, the emission on Type 2 facilities are much larger (0.1 to 15 kg CH4 h-1). Emissions from water and oil pipelines on Type 2 platforms are similar to those on Type 1 facilities.
3.4.2. Estimating Accumulated Methane Concentrations
Any non-zero wind speed will dilute all fugitives encountered during the BOEM 2017 Gulfwide Emission Inventory Study to below the LEL (Figure 2). The highest emitting fugitive, 15 kg CH4 h-1 emission detected from ‘other equipment’ on a gas line, would need a wind of 0.16 m s-1 (0.36 mph) to dissipate the methane. However, in the Gulf of Mexico there are many periods of zero wind conditions with between 4% and 19% of the time in November and October having zero-wind conditions, respectively (Supplementary Material Figure S1). During zero wind conditions methane concentrations from the largest measured emissions (15 kg CH4 h-1) can build up to LEL in areas as large as 14 m by 14 m in one hour on Type 2 platforms and up to 9 m by 9 m spaces on Type 1 platforms (Figure 2).
4. Discussion
4.1. Likely Size and Number of Fugitive Emission Sources
This study investigates estimating the number and size of fugitive methane emissions from offshore oil and gas production platforms in the Gulf of Mexico using a range of data sources. Individual production platforms vary even within specific type and to simplify our main findings they were defined as two types of facilities. Type 1 facilities fixed to the seabed, operating in shallower water closer to shore, unmanned, older, have lower production rates (178 bbl oil day-1; 620 Mscf day-1), negligible processing equipment and product is exported to shore via pipelines. Type 2 facilities are farther from shore in deeper water, manned 24 hours a day, have higher production rates (4032 bbl oil day-1; 2928 Mscf day-1), has processing equipment, gas is piped to shore and oil is generally stored on the platform.
Of the 544 safety incidents reported to BSEE from the 1119 platforms operating in the Gulf of Mexico in 2021, 94 were fugitive emissions: 76 fugitives from 242 manned platforms; and 18 fugitives from 877 unmanned platforms. This corresponds to an average of 0.02 fugitives per Type 1 facility and 0.31 fugitives per Type 2 facility. Significantly, these reports highlight the shortcomings of current leak detection approaches (gas detection alarms and AVO surveys): 1. Even though alarms are installed on the facilities, it is just as likely that a fugitive emission will result in a fire than be detected by the alarm (the cause of this is currently unknown but likely the result of poor mixing of air); 2. If the alarm sounds, it will more likely be a false alarm than an actual fugitive (steam from showers is the most common cause of triggering alarms); 3. Either there are more leaks on newer Type 2 facilities than older Type 1 facilities, or a large number of leaks remain undetected on unmanned facilities.
Of the 54 LDAR surveys reported in the 2017 Gulfwide Emission Inventory Study, there was an average of 12 fugitives per Type 1 facility (average emission of 0.62 kg CH4 h-1 leak-1) and 15 fugitives per Type 2 facility (average emission rate of 1.46 kg CH4 h-1). This suggests that the actual number of fugitives is 600 times larger than the number of leaks currently detected by alarms or AVO surveys. The LDAR surveys show fugitives from gas pipelines are ubiquitous on Type 1 faculties and almost always present on Type 2 facilities. Emission rates are highest from gas pipelines on both Type 1 and 2 facilities and average emissions are a factor of 3 higher on Type 2 facilities. The main shortcoming of LDAR surveys is that they are inherently biased low and emissions can only be detected/quantified where they can be accessed.
Validation of the number/size of fugitive emissions generated from the BOEM reported LDAR surveys can be determined using whole facility emission estimates. For Type 1 facilities, the bottom-up total facility emission (including the 12 fugitives facility-1 and average emission of 0.62 kg CH4 h-1 leak-1) was estimated at 5 kg CH4 h-1 (produced gas loss of 2.7%) while the average measured emission loss was 17.6 kg CH4 h-1 (produced gas loss of 8 %). For Type 2 facilities, the bottom-up total facility emission (15 fugitives facility-1 and average emission of 1.46 kg CH4 h-1 leak-1) was estimated at 64 kg CH4 h-1 (produced gas loss of 2.5%) while the average measured emission loss was 36 kg CH4 h-1 (produced gas loss of 2.6 %). The agreement between the percentage of gas loss between the bottom-up and measured emissions for Type 2 facilities suggests that the fugitive emission rate is reasonably good and a fugitive emission rate of 1 % of production is a good estimate for these types of facility. For Type 1 facilities, the disagreement between the percentage of gas loss between the bottom-up (2.7%) and measured emissions (8%) suggests the number and size of fugitives generated by the LDAR reports (2% of produced gas) is likely an underestimate and a fugitive emission rate of 7.3% of production a more reasonable estimate. A larger normalized fugitive emission rate from Type 1 facilities, as compared to Type 2, is in-line with current thinking that older, unmanned platforms undergo less maintenance and likely adversely affected by the effects hurricanes on the edges of the Gulf of Mexico where the wind and wave action is at its maximum [29,30]. If we assume that the average emission rate reported by the LDAR surveys is reasonable, the number of fugitives is 3.7 times higher than the 12 reported, therefore, we suggest Type 1 facilities could have an average of 44 fugitives and average emission of 0.62 kg CH4 h-1 leak-1.
One point of note is that if LDAR surveys were to be conducted on the gas lines alone it is estimated that there would be a reduction in emissions of 72% (taking Type 2 platform LDAR surveys only; Supplementary Material Table S1). Valves and ‘other equipment’ on the gas lines are the largest emitters and concentrating on these could significantly reduce the extent of the pipelines surveyed and the time taken to do the survey making this a less onerous and more effective task.
4.2. Safety Implications
The analysis presented in Section 4.1 suggests that the number of fugitives on most production platforms in the Gulf of Mexico is significantly underestimated (by around a factor of 3), however, that does not necessarily correlate to increased safety concerns. Calculations suggest that even in very low wind speeds or ventilation rates (air movement greater than 0.36 mph) methane cannot accumulate to LEL near the largest of observed leaks (15 kg CH4 h-1) (Figure 2). This may help to explain why gas alarms set to identify %LEL appear to be poor at detecting fugitives that could result in a fire.
Additionally, as produced gas has no odour and background noise on facilities is high, the likelihood of detection through AVO is reduced significantly. With the development of low-power and lower-cost methane sensors [47,48], it is possible that wearable technology could be developed to report the location of methane concentration across a facility as workers move around the platforms. The major difficulty in developing this for offshore are the safety requirements (certifications including ATEX, IECEx and FM-approved) that can make sensor development for offshore prohibitively expensive.
The major safety concern for fugitives on offshore platforms is the risk of an explosive atmosphere in zero-wind conditions. Historical meteorological data suggests that zero-wind conditions occur in the Gulf of Mexico every month with occurrences higher in late summer and autumn (July through October) with the highest in July (11% of working hours are zero-wind). In these conditions large volumes of air on the working deck could become explosive (methane > LEL) , up to 14 m by 14 m near the 15 kg CH4 h-1 leak. This is of particular concern for workers conducting hot work (welding or grinding) or those arriving at unmanned facilities. Here again, we suggest that wearable technology could alert the worker to methane build up or that safety regulations are amended to consider low-wind conditions as hazardous.
4.3. Safeguarding Offshore Facilities
This study has used existing data to infer the number/size of fugitives on offshore platforms, how this could affect safety, and what operators can do to mitigate the effect of fugitives on workers’ safety. The major short coming is that there is currently no clear way to test the assumption made in a real-world environment. The likelihood is that the air flow around the working deck is more complex than assumed here and complete airflow past aerodynamic obstructions is improbable resulting in small volumes of explosive air near fugitives.
One way to test this is to develop a controlled release offshore facility like the METEC-Offshore, that has been funded by the U.S. Department of Energy’s Office of Fossil Energy and Carbon Management. The main aim of this facility is to test methods that quantify whole facility emissions and better understand how solution quantification uncertainty changes in different environmental conditions. However, this facility could also be used to better understand how safety in affected by the presence of fugitive emissions.
Experiments of the facility could be used to optimize policy that safeguards against safety risks associated with fugitive emissions using both continuous monitoring and survey methods and testing against protocols that were developed for the METEC Advancing Development of Emissions Detection (ADED) project [49,50,51]. Relatively small controlled releases of methane in line with the observed during actual LDAR surveys could be used to simulate fugitive emissions from likely emission points across a facility (up to 44 fugitives for Type 1 facilities). These controlled releases would ideally simulate the duration, frequency and size of typical fugitives, as measured at offshore facilities and modelled using METEC’s Mechanistic Air Emissions Simulator (MAES) [52,53].
Controlled release experiments could include informing safety protocol when approaching an unmanned facility, how these could differ in changing environmental conditions, establishing safe environments when near potential ignition sources (hot work, lightning or sparks), and testing the ability of continuous or wearable monitors to detect localize and quantify emissions from fugitives. Following ADED protocols, survey method and continuous monitoring performers could be invited to test leak detection and quantification solutions and report the presence of an emission, the location of the source and the emission rate.
An offshore measurement program could be implemented to better understand potential risks and help BSEE to achieve their core strategic goals of: People, Protection, Reliability, and Sustainability. Controlled emission experiments conducted in an offshore environment could be used to investigate the effects of fugitive emissions on safety when approaching unmanned facilities, working on facilities and how best to monitor for fugitives. Here we suggest the presence of fugitives will likely affect any facility risk assessment and alter safe work practices.
5. Conclusions
This study investigates the frequency, size and potential impact of fugitives using incidents reported to the Bureau of Safety and Environmental Enforcement (BSEE), size-frequency data reported to the US Bureau of Ocean Energy Management (BOEM) and independent measurement data. BSEE safety records indicate in 2021 there were 113 reports of gas leaks on 1119 offshore facilities (68 identified using audio, visual, auditory methods; 13 that resulted in a fire; 13 detected by gas alarm systems; and 19 false alarms)., This corresponds to an average of 0.02 fugitives per Type 1 facility and 0.31 fugitives per Type 2 facility. BOEM’s Gulf-wide Offshore Activity Data System data show 12 and 15 fugitives per facility per year with average emission rates of 0.6 and 1.5 kg CH4 h-1 on smaller-inshore facilities and larger-deeper platforms, respectively. Direct measurement data reconciled with a bottom-up model suggests that the number/size of fugitive emissions generated from BOEM reported LDAR data underestimate the number for the smaller near-shore platforms (44 fugitives facility-1 and emission 0.6 kg CH4 h-1 leak-1) and are about right for the larger deeper facilities (15 fugitives facility-1 and emission of 1.5 kg CH4 h-1 leak-1). Analysis of the fugitive rates shows that gas will not collect to explosive concentration if any air movement is present (> 0.36 mph), however, large volumes of air on the working deck could become explosive in prolonged zero-wind conditions. While wearable technology could be employed to indicate gas build up, it is suggested that safety regulations are amended to consider low-wind conditions and that real-world test should be conducted to test the assumptions made on air flow across the working deck.
Supplementary Materials
The following supporting information can be downloaded at the website of this paper posted on Preprints.org. Table S1— Table S1 Minimum emission rate, maximum emission rate, average emission rate and probability of specific leak types occurring on a facility generated from LDAR emissions reported to BOEM.; Figure S1 A. Total number of hours per month and number of hours during working hours (9 to 5 local time) of zero wind conditions in the Gulf of Mexico (using data from Venice, LA as a proxy). B. Total time and time during working hours (9 to 5 local time) of zero wind conditions in the Gulf of Mexico expressed as a percentage.
Author Contributions
S.N.R.: Funding Acquisition, Conceptualization, Investigation, Methodology, Supervision, and Writing—original draft preparation, review, and editing. M.M.: Investigation and Writing—original draft preparation. C.L.: Funding Acquisition, Project Administration, Conceptualization, Supervision, and Review and editing. D.J.Z.: Funding Acquisition, Project Administration, Conceptualization, Supervision, and Review and editing. All authors have read and agreed to the published version of the manuscript.
Funding
This project has been funded by the U.S. Department of Energy’s Office of Fossil Energy and Carbon Management (FECM) project # DE-FE0032276 “Capabilities Enhancement for Methane Emissions Technology Evaluation Center (METEC) to Decarbonize Natural Gas Resources”.
Institutional Review Board Statement
All data used for analysis are publicly available.
| Organization providing data. | Description of data | Web address |
| Bureau of Safety and Environmental Enforcement (BSEE) | Data on number, production rates and equipment on platforms | https://www.data.bsee.gov/Main/Default.aspx |
| Bureau of Safety and Environmental Enforcement (BSEE) | Offshore Incident Statistics | https://www.bsee.gov/stats-facts/offshore-incident-statistics |
| Bureau of Ocean Energy Management (BOEM) | 2017 Gulfwide Emission Inventory Study - Leak detection and repair data | https://www.boem.gov/environment/environmental-studies/ocs-emissions-inventory-2017 |
| Gorchov Negron et al. (2023) | Measured methane emissions | https://www.pnas.org/doi1073/pnas.2215275120/10. |
Informed Consent Statement
Not applicable.
Data Availability Statement
No new data were created during this study. Data sharing is not applicable to this article.
Conflicts of Interest
The authors declare no conflicts of interest.
References
- EIA Natural Gas Explained. Available online: https://www.eia.gov/energyexplained/natural-gas/use-of-natural-gas.php (accessed on 12 October 2021).
- Statistica Production of Natural Gas Worldwide in 2022 with a Forecast for 2030 to 2050, by Project Location. Available online: https://www.statista.com/statistics/1365007/natural-gas-production-by-project-location-worldwide/ (accessed on 8 August 2025).
- BSEE Bureau of Safety and Environmental Enforcement (BSEE) Data Center. Available online: https://www.data.bsee.gov/Main/Default.aspx (accessed on 4 February 2025).
- EIA Offshore Production Nearly 30% of Global Crude Oil Output in 2015. Available online: https://www.eia.gov/todayinenergy/detail.php?id=28492 (accessed on 28 December 2021).
- Standard Handbook of Petroleum and Natural Gas Engineering, 3rd ed.; Lyons, W.C., Plisga, G.J., Lorenz, M.D., Eds.; Elsevier : GPP: Amsterdam ; Boston, 2016; ISBN 978-0-12-383846-9. [Google Scholar]
- Riddick, S.N.; Mbua, M.; Laughery, C.; Zimmerle, D.J. Calculating Methane Emissions from Offshore Facilities Using Bottom-Up Methods. Eng 2025, 6, 199. [Google Scholar] [CrossRef]
- BSEE Bureau of Safety and Environmental Enforcement (BSEE) Available online:. Available online: https://www.bsee.gov/ (accessed on 4 February 2025).
- TIPRO Texas Independent Producers And Royalty Owners Association. 2024 State Of Energy Report. Available online: https://tipro.org/tipro-energy-report-2024/ (accessed on 7 August 2025).
- US BLS, U.S.; Bureau of Labor Statistics. Fatal Occupational Injuries in Private Sector Mining, Quarrying, and Oil and Gas Extraction Industries. Available online: https://www.bls.gov/charts/census-of-fatal-occupational-injuries/fatal-occupational-injuries-private-sector-mining.htm (accessed on 7 August 2025).
- HSE Health and Safety Executive. Offshore Oil and Gas. Occupational Health Risks Offshore. Available online: https://www.hse.gov.uk/offshore/healthrisks.htm (accessed on 7 August 2025).
- BSEE Bureau of Safety and Environmental Enforcement (BSEE). Offshore Incident Statistics. Available online: https://www.bsee.gov/stats-facts/offshore-incident-statistics (accessed on 4 February 2025).
- Centers for Disease Control and Prevention (CDC) Fatal Injuries in Offshore Oil and Gas Operations - United States, 2003-2010. MMWR Morb Mortal Wkly Rep 2013, 62, 301–304.
- Brkić, D.; Praks, P. Probability Analysis and Prevention of Offshore Oil and Gas Accidents: Fire as a Cause and a Consequence. Fire 2021, 4, 71. [Google Scholar] [CrossRef]
- Benny, A.; V R, R. A Review of Risk Analysis and Accident Prevention of Blowout Events in Offshore Drilling Operations. Saf. Extreme Environ. 2025, 7, 1. [Google Scholar] [CrossRef]
- Brkić, D. Fire Hazards Caused by Equipment Used in Offshore Oil and Gas Operations: Prescriptive vs. Goal-Oriented Legislation. Fire 2025, 8, 29. [Google Scholar] [CrossRef]
- BSEE Bureau of Safety and Environmental Enforcement (BSEE). Offshore Oil and Gas Production Platforms (Rigs) Wellhead Fires and Associated Environmental Hazards. Available online: https://www.bsee.gov/sites/bsee.gov/files/tap-technical-assessment-program//017ab.pdf (accessed on 4 February 2025).
- API API Recommended Practice 14c Seventh Edition, March 2001. Recommended Practice for Analysis, Design, Installation, and Testing of Basic Surface Safety Systems for Offshore Production Platforms. Upstream Segment. Available online: https://law.resource.org/pub/us/cfr/ibr/002/api.14c.2001.pdf (accessed on 4 February 2025).
- Riddick, S.N.; Cheptonui, F.; Yuan, K.; Mbua, M.; Day, R.; Vaughn, T.L.; Duggan, A.; Bennett, K.E.; Zimmerle, D.J. Estimating Regional Methane Emission Factors from Energy and Agricultural Sector Sources Using a Portable Measurement System: Case Study of the Denver–Julesburg Basin. Sensors 2022, 22, 7410. [Google Scholar] [CrossRef] [PubMed]
- Barkley, Z.; Davis, K.; Miles, N.; Richardson, S.; Deng, A.; Hmiel, B.; Lyon, D.; Lauvaux, T. Quantification of Oil and Gas Methane Emissions in the Delaware and Marcellus Basins Using a Network of Continuous Tower-Based Measurements. Atmos. Chem. Phys. 2023, 23, 6127–6144. [Google Scholar] [CrossRef]
- Varon, D.J.; Jacob, D.J.; Hmiel, B.; Gautam, R.; Lyon, D.R.; Omara, M.; Sulprizio, M.; Shen, L.; Pendergrass, D.; Nesser, H.; et al. Continuous Weekly Monitoring of Methane Emissions from the Permian Basin by Inversion of TROPOMI Satellite Observations. Atmos. Chem. Phys. 2023, 23, 7503–7520. [Google Scholar] [CrossRef]
- Peischl, J.; Eilerman, S.J.; Neuman, J.A.; Aikin, K.C.; de Gouw, J.; Gilman, J.B.; Herndon, S.C.; Nadkarni, R.; Trainer, M.; Warneke, C.; et al. Quantifying Methane and Ethane Emissions to the Atmosphere From Central and Western U.S. Oil and Natural Gas Production Regions. J. Geophys. Res. Atmos. 2018. [Google Scholar] [CrossRef]
- Caulton, D.R.; Li, Q.; Bou-Zeid, E.; Fitts, J.P.; Golston, L.M.; Pan, D.; Lu, J.; Lane, H.M.; Buchholz, B.; Guo, X.; et al. Quantifying Uncertainties from Mobile-Laboratory-Derived Emissions of Well Pads Using Inverse Gaussian Methods. Atmos. Chem. Phys. 2018, 18, 15145–15168. [Google Scholar] [CrossRef]
- Robertson, A.M.; Edie, R.; Field, R.A.; Lyon, D.; McVay, R.; Omara, M.; Zavala-Araiza, D.; Murphy, S.M. New Mexico Permian Basin Measured Well Pad Methane Emissions Are a Factor of 5–9 Times Higher Than U.S. EPA Estimates. Environ. Sci. Technol. 2020, 54, 13926–13934. [Google Scholar] [CrossRef]
- OGCI Oil and Gas Climate Initiative. 2025 Methane Intensity Target. Available online: https://www.ogci.com/action-and-engagement/reducing-methane-emissions/ (accessed on 25 October 2022).
- Nisbet, E.; Weiss, R. Top-Down Versus Bottom-Up. Science 2010, 328, 1241–1243. [Google Scholar] [CrossRef]
- Riddick, S.N.; Mbua, M.; Santos, A.; Hartzell, W.; Zimmerle, D.J. Potential Underestimate in Reported Bottom-up Methane Emissions from Oil and Gas Operations in the Delaware Basin. Atmosphere 2024, 15, 202. [Google Scholar] [CrossRef]
- Vaughn, T.L.; Bell, C.S.; Pickering, C.K.; Schwietzke, S.; Heath, G.A.; Pétron, G.; Zimmerle, D.J.; Schnell, R.C.; Nummedal, D. Temporal Variability Largely Explains Top-down/Bottom-up Difference in Methane Emission Estimates from a Natural Gas Production Region. Proceedings of the National Academy of Sciences 2018, 115, 11712–11717. [Google Scholar] [CrossRef]
- Riddick, S.N.; Mauzerall, D.L. Likely Substantial Underestimation of Reported Methane Emissions from United Kingdom Upstream Oil and Gas Activities. Energy Environ. Sci. 2023, 16, 295–304. [Google Scholar] [CrossRef]
- Ayasse, A.K.; Thorpe, A.K.; Cusworth, D.H.; Kort, E.A.; Negron, A.G.; Heckler, J.; Asner, G.; Duren, R.M. Methane Remote Sensing and Emission Quantification of Offshore Shallow Water Oil and Gas Platforms in the Gulf of Mexico. Environ. Res. Lett. 2022, 17, 084039. [Google Scholar] [CrossRef]
- Gorchov Negron, A.M.; Kort, E.A.; Chen, Y.; Brandt, A.R.; Smith, M.L.; Plant, G.; Ayasse, A.K.; Schwietzke, S.; Zavala-Araiza, D.; Hausman, C.; et al. Excess Methane Emissions from Shallow Water Platforms Elevate the Carbon Intensity of US Gulf of Mexico Oil and Gas Production. Proc. Natl. Acad. Sci. U.S.A. 2023, 120, e2215275120. [Google Scholar] [CrossRef]
- Riddick, S.N.; Mauzerall, D.L.; Celia, M.; Harris, N.R.P.; Allen, G.; Pitt, J.; Staunton-Sykes, J.; Forster, G.L.; Kang, M.; Lowry, D.; et al. Methane Emissions from Oil and Gas Platforms in the North Sea. Atmospheric Chemistry and Physics 2019, 19, 9787–9796. [Google Scholar] [CrossRef]
- Nara, H.; Tanimoto, H.; Tohjima, Y.; Mukai, H.; Nojiri, Y.; Machida, T. Emissions of Methane from Offshore Oil and Gas Platforms in Southeast Asia. Scientific Reports 2015, 4. [Google Scholar] [CrossRef] [PubMed]
- Foulds, A.; Allen, G.; Shaw, J.T.; Bateson, P.; Barker, P.A.; Huang, L.; Pitt, J.R.; Lee, J.D.; Wilde, S.E.; Dominutti, P.; et al. Quantification and Assessment of Methane Emissions from Offshore Oil and Gas Facilities on the Norwegian Continental Shelf. Atmos. Chem. Phys. 2022, 22, 4303–4322. [Google Scholar] [CrossRef]
- Pühl, M.; Roiger, A.; Fiehn, A.; Gorchov Negron, A.M.; Kort, E.A.; Schwietzke, S.; Pisso, I.; Foulds, A.; Lee, J.; France, J.L.; et al. Aircraft-Based Mass Balance Estimate of Methane Emissions from Offshore Gas Facilities in the Southern North Sea. Atmos. Chem. Phys. 2024, 24, 1005–1024. [Google Scholar] [CrossRef]
- Lee, J.D.; Mobbs, S.D.; Wellpott, A.; Allen, G.; Bauguitte, S.J.-B.; Burton, R.R.; Camilli, R.; Coe, H.; Fisher, R.E.; France, J.L.; et al. Flow Rate and Source Reservoir Identification from Airborne Chemical Sampling of the Uncontrolled Elgin Platform Gas Release. Atmos. Meas. Tech. 2018, 11, 1725–1739. [Google Scholar] [CrossRef]
- Valverde, A.; Irakulis-Loitxate, I.; Roger, J.; Gorroño, J.; Guanter, L. Satellite Characterization of Methane Point Sources by Offshore Oil and Gas PlatForms. In Proceedings of the IV Conference on Geomatics Engineering; MDPI, January 12 2024; p. 22. [Google Scholar]
- Irakulis-Loitxate, I.; Gorroño, J.; Zavala-Araiza, D.; Guanter, L. Satellites Detect a Methane Ultra-Emission Event from an Offshore Platform in the Gulf of Mexico. Environ. Sci. Technol. Lett. 2022, 9, 520–525. [Google Scholar] [CrossRef]
- Dahan, B.; Machuca, V.; Castillo, R.; Hess, M. Gulf of Mexico Health & Air Quality II Mapping Methane Emission Plumes Using Sunglint-Configured Imagery for Monitoring Offshore Oil & Gas Activity. NASA DEVELOP National Program California – JPL. Fall 2022. Available online: https://ntrs.nasa.gov/api/citations/20230001674/downloads/20230001674.pdf (accessed on 19 May 2025).
- MacLean, J.-P.W.; Girard, M.; Jervis, D.; Marshall, D.; McKeever, J.; Ramier, A.; Strupler, M.; Tarrant, E.; Young, D. Offshore Methane Detection and Quantification from Space Using Sun Glint Measurements with the GHGSat Constellation. Atmos. Meas. Tech. 2024, 17, 863–874. [Google Scholar] [CrossRef]
- Yacovitch, T.I.; Daube, C.; Herndon, S.C. Methane Emissions from Offshore Oil and Gas Platforms in the Gulf of Mexico. Environ. Sci. Technol. 2020, 54, 3530–3538. [Google Scholar] [CrossRef] [PubMed]
- Zimmerle, D.; Vaughn, T.; Bell, C.; Bennett, K.; Deshmukh, P.; Thoma, E. Detection Limits of Optical Gas Imaging for Natural Gas Leak Detection in Realistic Controlled Conditions. Environ. Sci. Technol. 2020, 54, 11506–11514. [Google Scholar] [CrossRef]
- BOEM Bureau of Ocean Energy Management (BOEM) OCS Emissions Inventory - 2017 Available online:. Available online: https://www.boem.gov/environment/environmental-studies/ocs-emissions-inventory-2017 (accessed on 4 February 2025).
- Gorchov Negron, A.M.; Kort, E.A.; Conley, S.A.; Smith, M.L. Airborne Assessment of Methane Emissions from Offshore Platforms in the U.S. Gulf of Mexico. Environ. Sci. Technol. 2020, 54, 5112–5120. [Google Scholar] [CrossRef]
- BSEE Bureau of Safety and Environmental Enforcement (BSEE). Safety and Environmental Management Systems - SEMS. Available online: https://www.bsee.gov/sems (accessed on 4 February 2025).
- Riddick, S.N.; Mbua, M.; Laughery, C.; Zimmerle, D.J. A Review of Offshore Methane Quantification Methodologies. Atmosphere 2025, 16, 626. [Google Scholar] [CrossRef]
- Tait, J.; Hetherington, C.; Tait, A. Enhancing Student Employability with Simula Tion: The Virtual Oil Rig and DART, Poster Presentation, 3rd International Enhancement in Higher Education Conference: Inspiring Excellence - Transforming the Student Experience, 6th-8th June 2017, Radisson Blu Hotel, Glasgow, UK.; Glasgow, June 2017.
- Riddick, S.N.; Mauzerall, D.L.; Celia, M.; Allen, G.; Pitt, J.; Kang, M.; Riddick, J.C. The Calibration and Deployment of a Low-Cost Methane Sensor. Atmospheric Environment 2020, 230, 117440. [Google Scholar] [CrossRef]
- Cho, Y.; Smits, K.M.; Riddick, S.N.; Zimmerle, D.J. Calibration and Field Deployment of Low-Cost Sensor Network to Monitor Underground Pipeline Leakage. Sensors and Actuators B: Chemical 2022, 355, 131276. [Google Scholar] [CrossRef]
- Bell, C.; Ilonze, C.; Duggan, A.; Zimmerle, D. Performance of Continuous Emission Monitoring Solutions under a Single-Blind Controlled Testing Protocol. Environ. Sci. Technol. 2023, 57, 5794–5805. [Google Scholar] [CrossRef]
- Bell, C.; Rutherford, J.; Brandt, A.; Sherwin, E.; Vaughn, T.; Zimmerle, D. Single-Blind Determination of Methane Detection Limits and Quantification Accuracy Using Aircraft-Based LiDAR. Elementa: Science of the Anthropocene 2022, 10, 00080. [Google Scholar] [CrossRef]
- Day, R.E.; Emerson, E.; Bell, C.; Zimmerle, D. Point Sensor Networks Struggle to Detect and Quantify Short Controlled Releases at Oil and Gas Sites. Sensors 2024, 24, 2419. [Google Scholar] [CrossRef] [PubMed]
- Allen, D.T.; Cardoso-Saldaña, F.J.; Kimura, Y.; Chen, Q.; Xiang, Z.; Zimmerle, D.; Bell, C.; Lute, C.; Duggan, J.; Harrison, M. A Methane Emission Estimation Tool (MEET) for Predictions of Emissions from Upstream Oil and Gas Well Sites with Fine Scale Temporal and Spatial Resolution: Model Structure and Applications. Science of The Total Environment 2022, 829, 154277. [Google Scholar] [CrossRef]
- Zimmerle, D.; Duggan, G.; Vaughn, T.; Bell, C.; Lute, C.; Bennett, K.; Kimura, Y.; Cardoso-Saldaña, F.J.; Allen, D.T. Modeling Air Emissions from Complex Facilities at Detailed Temporal and Spatial Resolution: The Methane Emission Estimation Tool (MEET). Science of The Total Environment 2022, 824, 153653. [Google Scholar] [CrossRef]
Figure 1.
Location of oil and gas production platforms in the Gulf of Mexico. Type 2 facilities include Spar, Semi-Submersible, Tension leg, Well Protector, Mini Tension Leg, Compliant tower, Floating Production, Storage and Offloading (FPSO) facilities, and Mobile Production Units.
Figure 1.
Location of oil and gas production platforms in the Gulf of Mexico. Type 2 facilities include Spar, Semi-Submersible, Tension leg, Well Protector, Mini Tension Leg, Compliant tower, Floating Production, Storage and Offloading (FPSO) facilities, and Mobile Production Units.
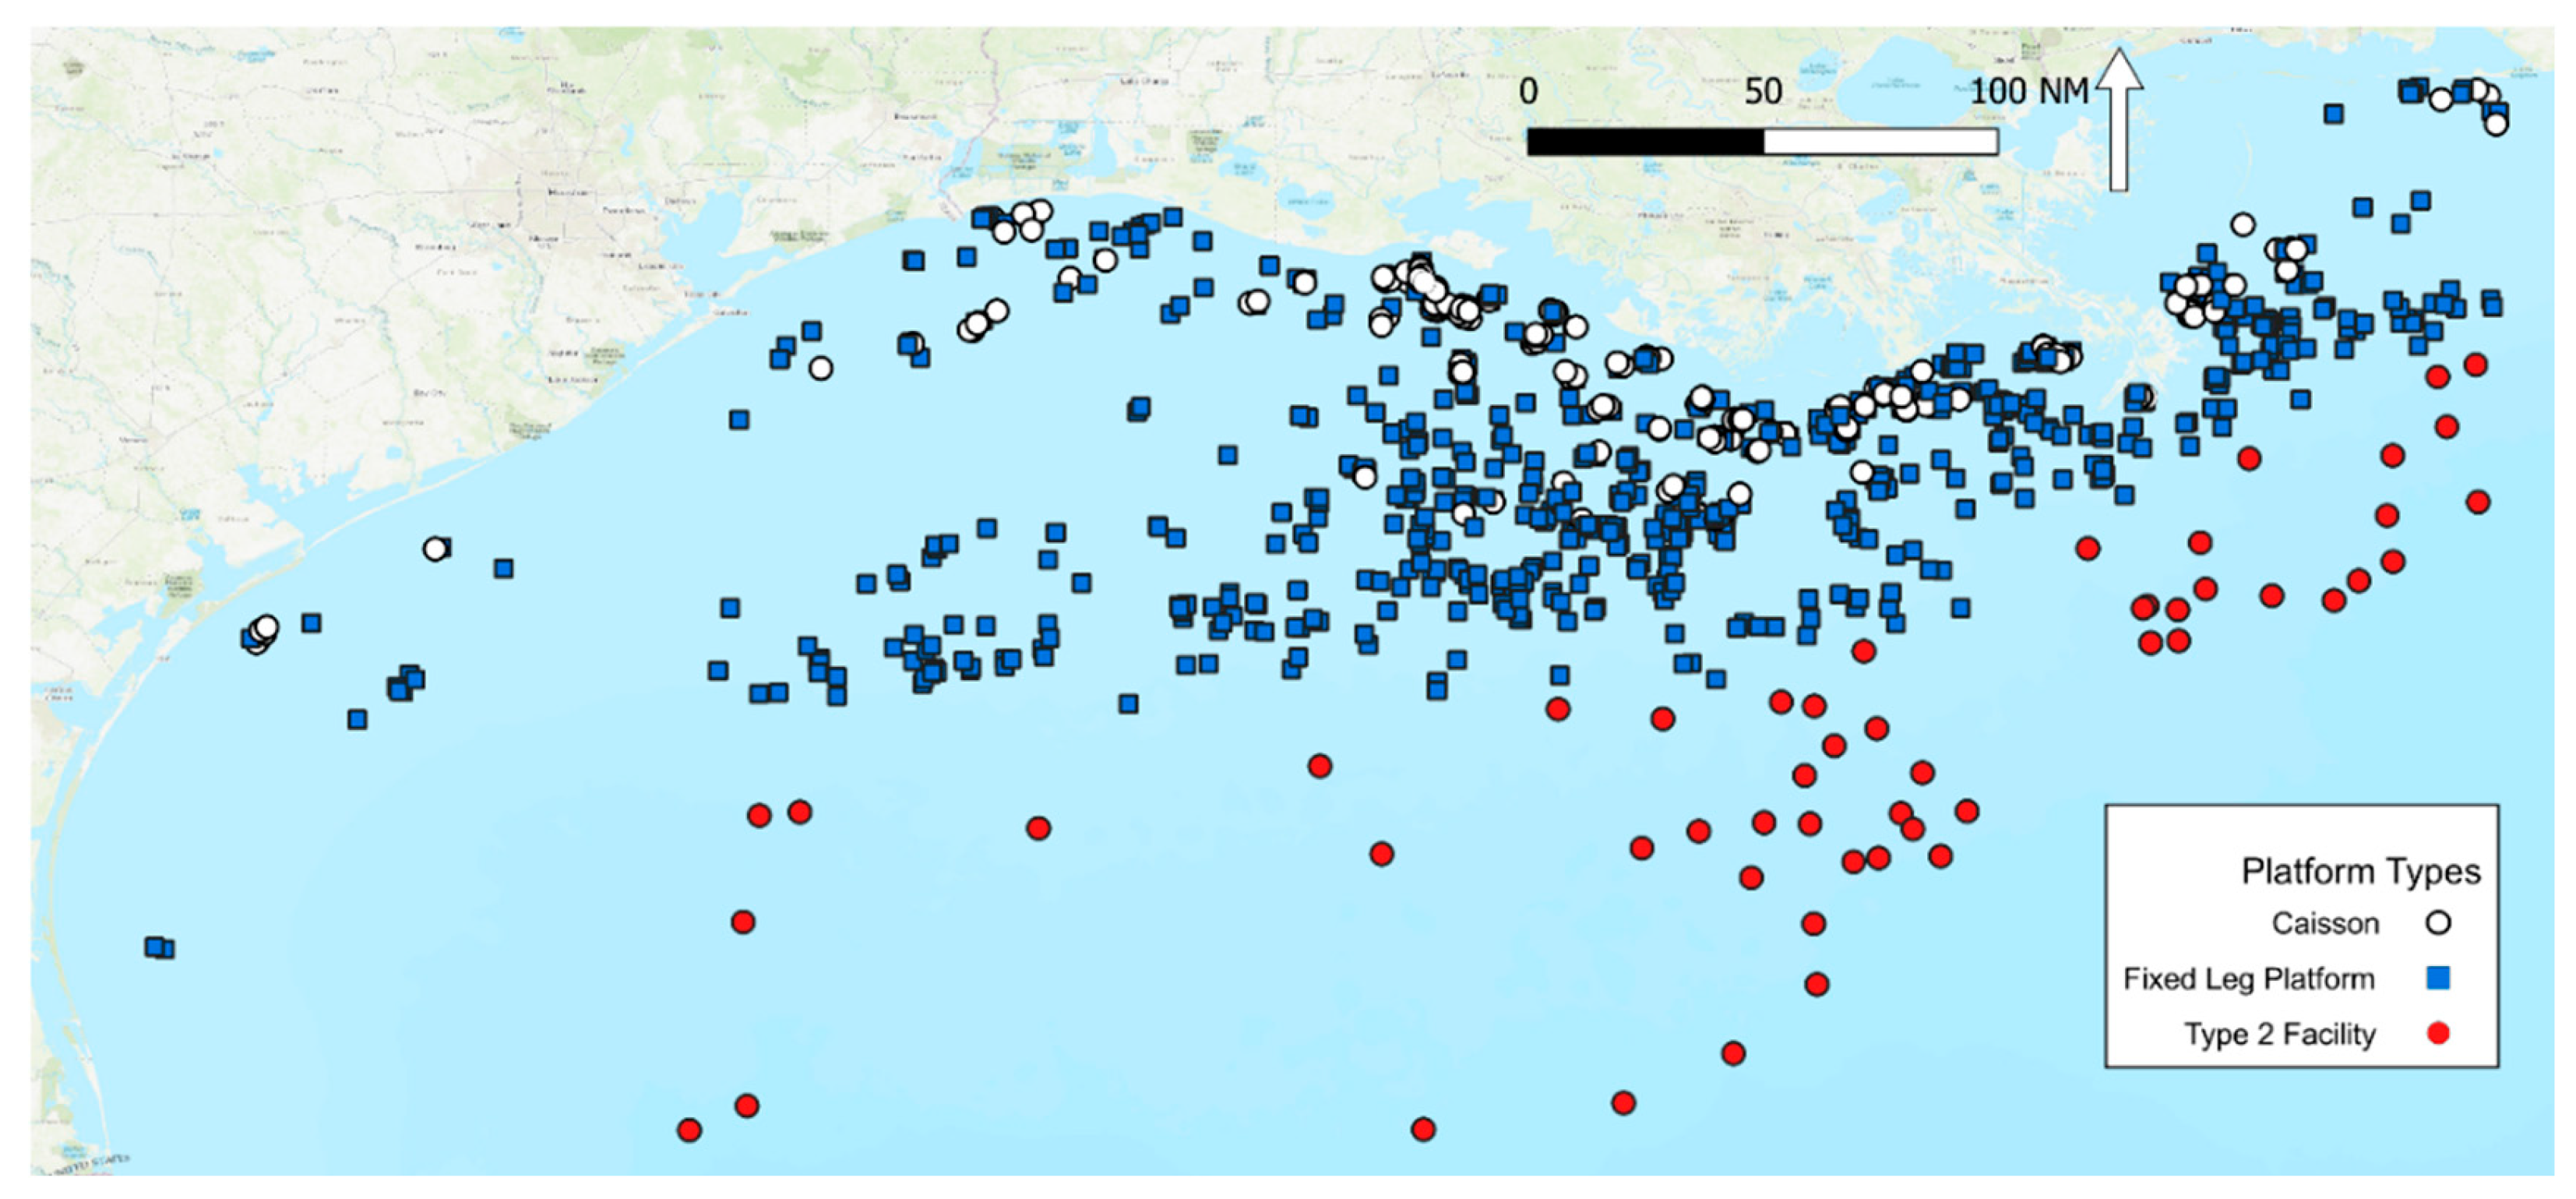
Figure 2.
Blank bars show the calculated wind speeds required to disperse gas from fugitive emission types reported in the BOEM 2017 Gulfwide Emission Inventory Study. Grey bars show the length and width of spaces where methane concentrations from? can build up to LEL during zero wind condition.
Figure 2.
Blank bars show the calculated wind speeds required to disperse gas from fugitive emission types reported in the BOEM 2017 Gulfwide Emission Inventory Study. Grey bars show the length and width of spaces where methane concentrations from? can build up to LEL during zero wind condition.
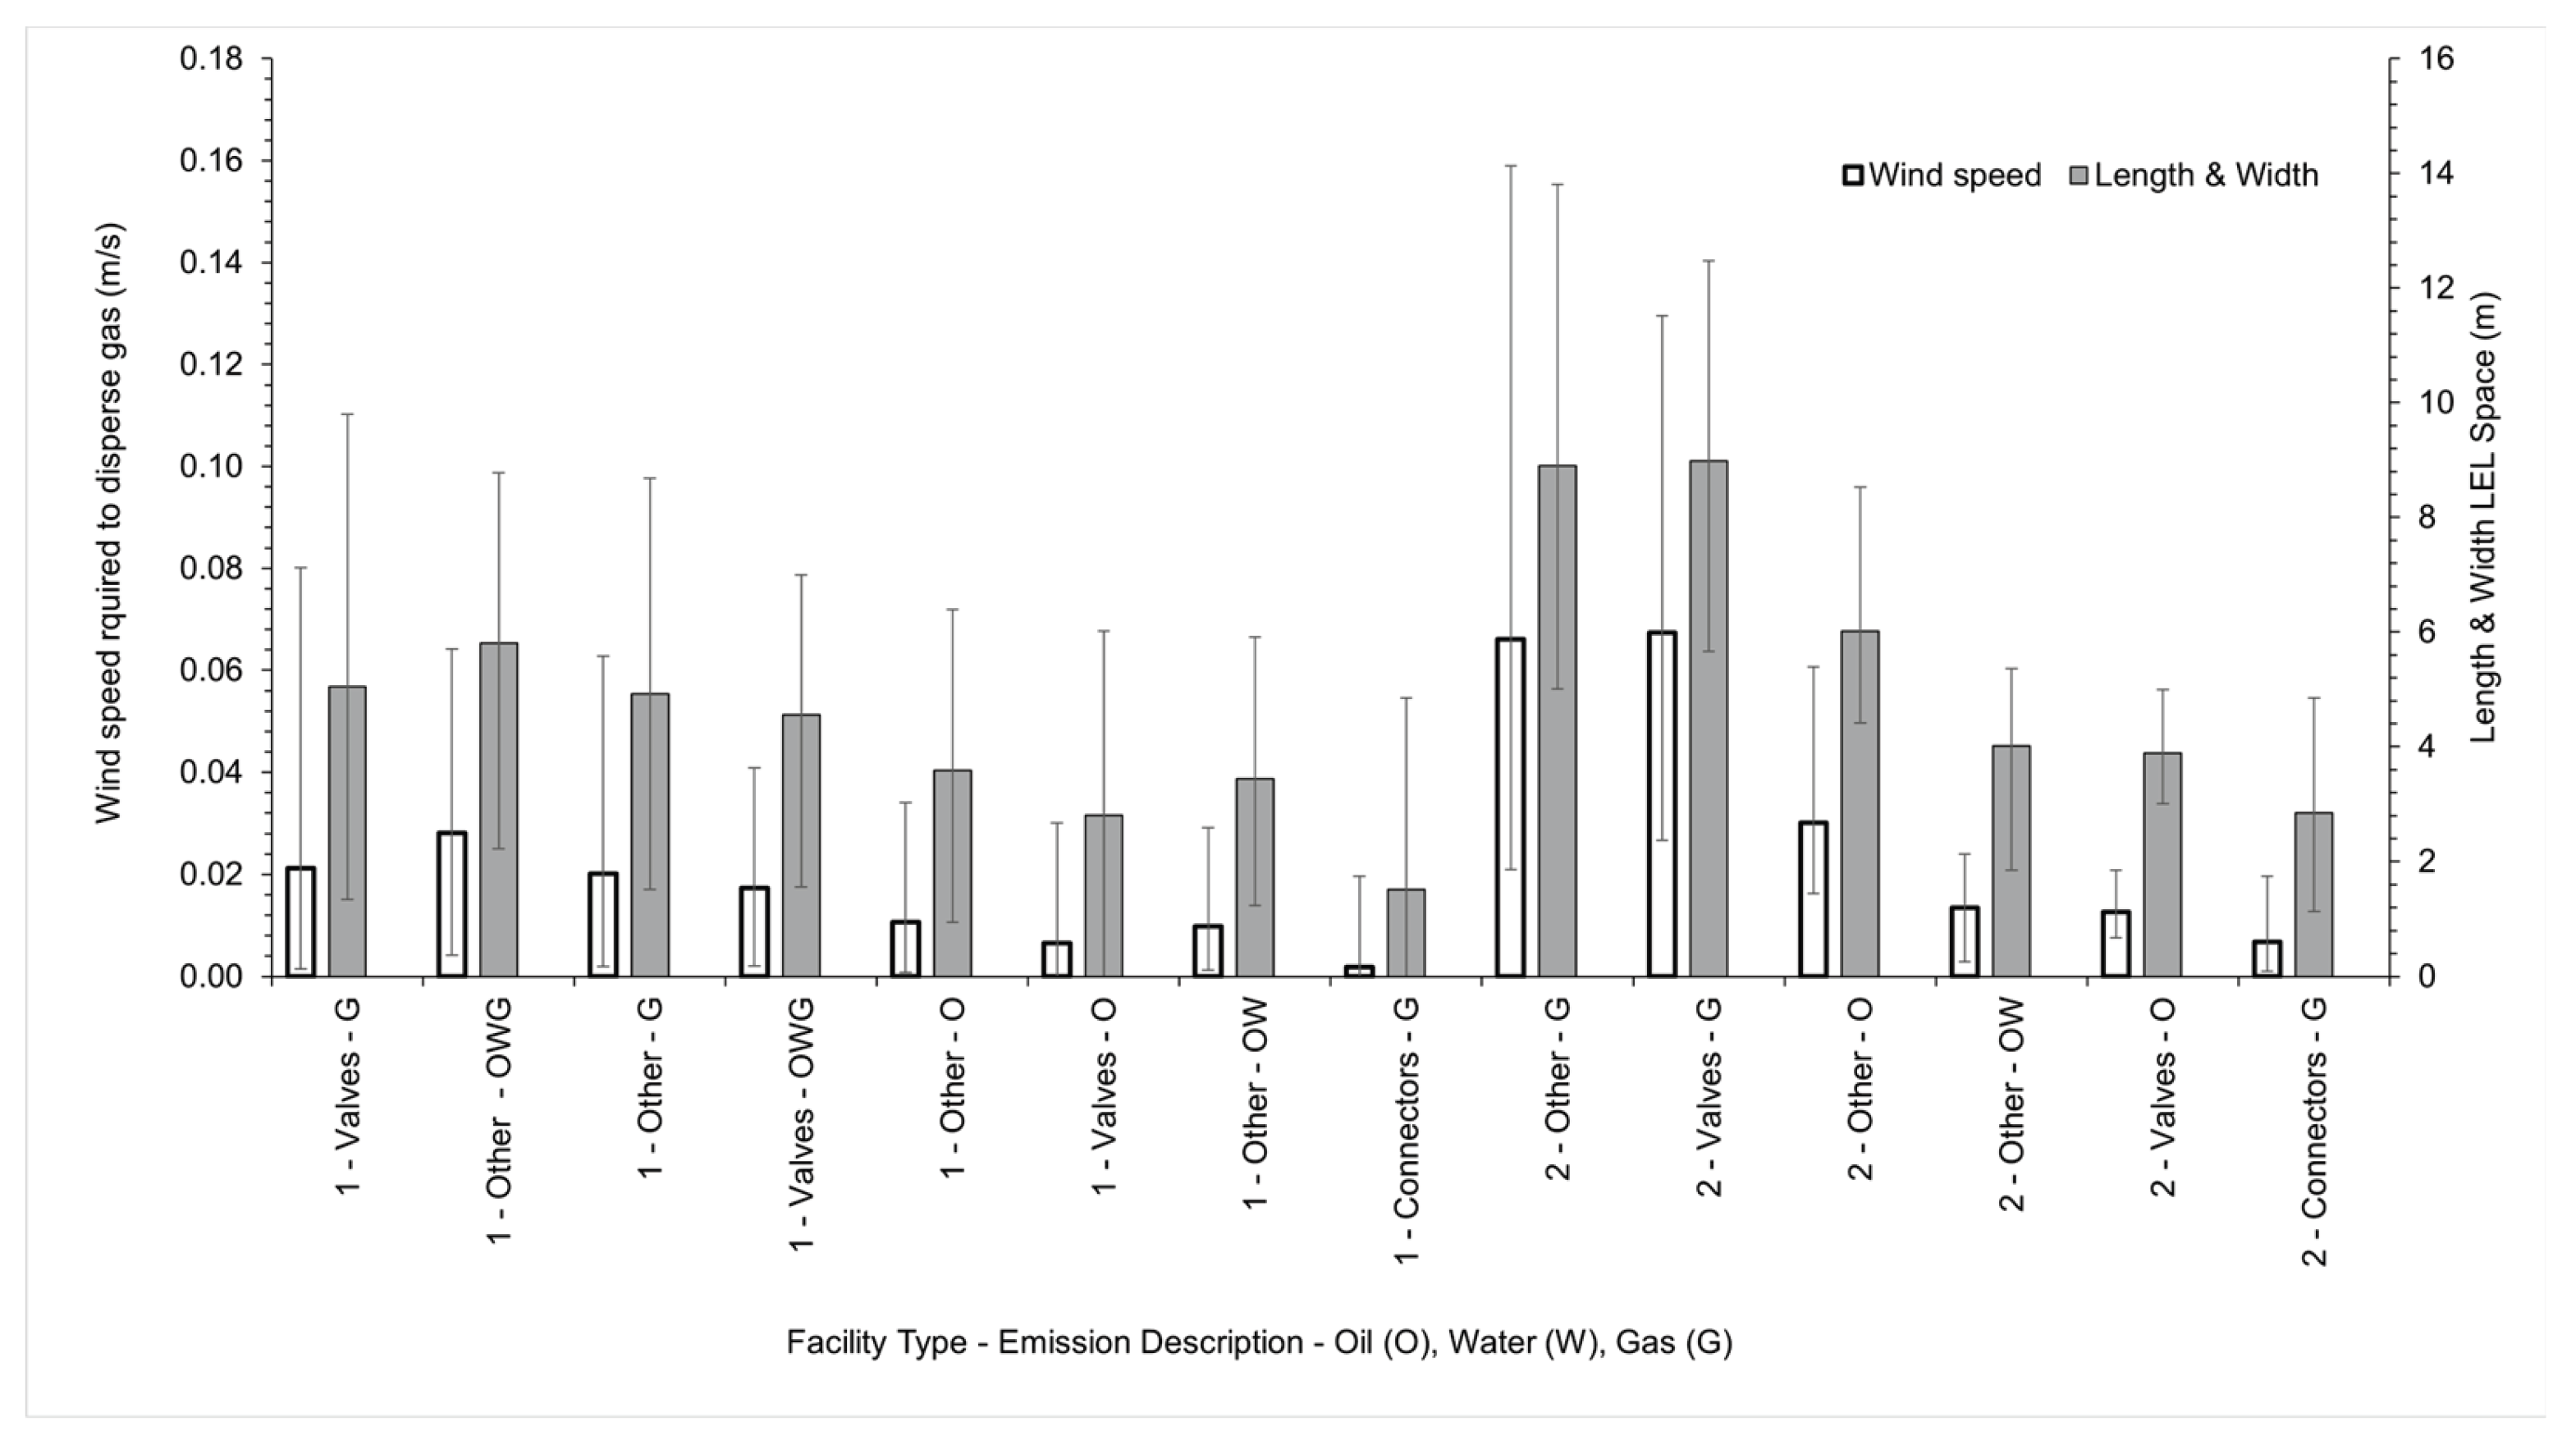

Table 1.
Summary of number of leaks reported to BSEE for each platform type.
| Platform Type | Total number of facilities | Number of manned facilities |
Number of fugitives on unmanned facilities |
Number of fugitives on manned facilities | Number of fugitives per facility |
|---|---|---|---|---|---|
| Caisson | 253 | 2 | 0 | 0 | 0.00 |
| Well protector | 6 | 0 | 0 | N/A | 0.00 |
| Fixed Leg (unmanned) | 618 | 0 | 18 | N/A | 0.03 |
| Fixed Leg (manned) | 188 | 188 | 26 | 26 | 0.14 |
| SPAR | 17 | 16 | 10 | 10 | 0.59 |
| Semi-Submersible | 15 | 14 | 9 | 9 | 0.60 |
| Tension leg | 14 | 14 | 22 | 22 | 1.60 |
| MTL | 3 | 3 | 0 | 0 | 0.00 |
| Compliant tower | 2 | 2 | 6 | 6 | 3.00 |
| FPSO | 2 | 2 | 3 | 3 | 1.50 |
| MPU | 1 | 1 | 0 | 0 | 0.00 |
| PTF 1 | 877 | 2 | 18 | 0 | 0.02 |
| PTF 2 | 242 | 240 | 76 | 76 | 0.31 |
Table 2.
Summary of number of leaks reported to BOEM for each platform type.
| Type | Platforms surveyed | Fugitives detected | Fugitives per facility | Average Emission (kg h-1 facility-1) | Average Emission (kg h-1 fugitive-1) |
|---|---|---|---|---|---|
| Fixed Leg | 43 | 537 | 12 | 7.7 | 0.62 |
| FPSO | 1 | 4 | 4 | 11.9 | 2.99 |
| Semi-Submersible | 3 | 54 | 18 | 28.3 | 1.57 |
| Spar | 3 | 49 | 16 | 20.8 | 1.27 |
| Tension Leg | 4 | 61 | 15 | 21.4 | 1.40 |
| PTF 1 | 43 | 537 | 12 | 7.7 | 0.62 |
| PTF 2 | 11 | 168 | 15 | 22.2 | 1.46 |
Disclaimer/Publisher’s Note: The statements, opinions and data contained in all publications are solely those of the individual author(s) and contributor(s) and not of MDPI and/or the editor(s). MDPI and/or the editor(s) disclaim responsibility for any injury to people or property resulting from any ideas, methods, instructions or products referred to in the content. |
© 2025 by the authors. Licensee MDPI, Basel, Switzerland. This article is an open access article distributed under the terms and conditions of the Creative Commons Attribution (CC BY) license (http://creativecommons.org/licenses/by/4.0/).
Copyright: This open access article is published under a Creative Commons CC BY 4.0 license, which permit the free download, distribution, and reuse, provided that the author and preprint are cited in any reuse.


