
Submitted:
20 June 2025
Posted:
23 June 2025
You are already at the latest version
Abstract
With an increase in methane quantification requirements and recent developments in technology, quantification of methane emissions from offshore oil and gas production infrastructure has become more important, and studies reporting emissions more numerous. While reported emissions range from those below method quantification limits to thousands of tons of methane per hour, there is currently no clear understanding on what expected emission from offshore facilities should be. To investigate if current methods generate realistic emission estimates, we will create bottom-up models that simulate two prototypical facilities operating in the Gulf of Mexico and compare the calculated emissions to actual emissions reported by published studies. Prototypical facility type 1 are those fixed platforms operating closer to shore in shallower water and comprise typically older, lower-producing platforms with less processing equipment, no compressor, the oil is piped to shore and usually unmanned 24 hours per day. Using the bottom-up model, total emissions from a prototypical facility type 1 are estimated at 9.2 kg CH4 h-1, largest emissions from fugitive emissions, pneumatic controllers and chemical injection pumps, and correspond to a loss of 1.9 % of the average facility production of 480 kg CH4 h-1. Prototypical facility type 2 platforms operate in deeper water, farther from shore, are newer, have higher production rates from more well heads, have more processing equipment, oil storage tanks, compressors and power generation, and are usually manned 24 hours per day. Total emissions from prototypical type 2 facilities are estimated at 42.2 kg CH4 h-1 (loss of 1.2 % of the average facility production) with the largest emissions from the liquid storage tanks, water storage tanks, and compressors. Fugitive emissions are estimated at 23.4 kg CH4 h-1 with 13 fugitive emissions per facility with an average emission rate of 1.8 kg CH4 h-1. The measured average emission from 13 type 1 facilities was 17.6 kg CH4 h-1 with a median production loss estimated at 8 %, 76 % higher than this study’s bottom-up estimate. As there are few moving parts and no storage tanks on type 1 facilities, the largest unknown emission source are fugitives and we therefore suggest that 6 % of production is currently lost as fugitive emissions from type 1 facilities. The measured average emission from 20 type 2 facilities was 35.5 kg CH4 h-1 with a median production loss estimated at 2.4 %, 50% higher than the bottom-up estimate. Using emission factors that consider the long-tail emission distribution in part reconciles the difference between modelled and measured emission estimates but we suggest the current the fugitive emission estimate may be an underestimate and more data on the number and size of fugitive emissions would help to reconcile the modelled and measured emission estimate. We suggest a bottom-up approach that uses production data coupled with facility equipment could be used to identify facilities that have unusually large measured emissions, caused by methodological failure or larger than expected fugitive emissions, which should be targeted for further evaluation resulting in remeasurement or identification of source type (maintenance event or fugitive) so that a more accurate estimates can be made on the absolute emission.
Keywords:
Bottom-up
; methane
; emission
; offshore
; production facility
; oil and gas
1. Introduction
Recently, companies with offshore assets are joining international oil and gas reporting frameworks such as the Oil and Gas Methane Partnership (OGMP) 2.0 [1]. OGMP 2.0 member companies target Level 5 reporting (detailed source-level and site-level measurements reconciliation) with benefits such informing methane mitigation opportunities, preparedness for regulations such as the European Union regulation that require external oil and gas producers to report emissions in line with OGMP2.0 Level 5 reporting, reducing revenue loss from wasted methane (leaks), and for market and finance access such as the World Banks’s Global Flaring and Methane Reduction Framework [1]. Similar measurement-based reporting frameworks such as the QMRV (quantification, monitoring, reporting and verification) [2] have emphasized the need for supplementing bottom-up inventories with specific facility measurements to inform methane mitigation and intensity targets. This means that offshore companies are facing similar needs and pressure as onshore companies to accurately report their emissions to adhere to regulatory and market requirements.
With an increase in methane reporting requirements and recent developments in technology (satellite, aircraft, drones), quantification of methane emissions from offshore oil and gas production infrastructure has become more important and studies reporting emissions more numerous. While reported emissions range from those below method quantification limits (i.e., negligible) to thousands of tons of methane per hour, there is currently no clear understanding on what “expected” emission from offshore facilities should be or what is the likely magnitude of emissions from expected vented events or upset conditions. Here, expected vented event emissions are typically short-lived maintenance events, i.e., result from the sub-60 second depressurization (or ‘blow-down’) of a high-pressure gas containing vessel, and upset conditions are longer-term emissions from either fugitives or a result of remediating a safety concern, e.g., where the repair of an export pipeline results in the flaring of all produced gas. Regulations stipulate that operators should record maintenance events and emissions resulting from safety concerns with likely emission rates calculated, therefore, the emissions that are ‘unknown’ are those that arise from equipment on the facility or from fugitives.
In 2022, nearly all US offshore oil and natural gas leasing and development activities happened in the Gulf of Mexico. On average, 1.8 million barrels per day (equivalent to 15% of the total US crude oil) and 0.8 Tcf natural gas (equivalent to 2.3% of the total US natural gas) were produced in the Gulf of Mexico [3,4,5]. The Bureau of Safety and Environmental Enforcement (BSEE) reported 1119 platforms and 147 rigs operating between Texas and Louisiana in the Gulf of Mexico in 2023 (Figure 1) [6]. Of these facilities, 806 were fixed leg platforms, 253 were caisson, 17 spar platforms, 15 semi-submersibles, 17 tension leg facilities, 6 well protectors, 2 compliant tower, 2 FPSOs (floating, production, storage and offloading) and 1 mobile production unit (Figure 1).
Fixed leg, well protector and caisson platforms are held up by legs fixed into the ocean floor and are deployed in water depths up to 1,700 ft [7,8]. In each case, the subsurface infrastructure supports the deck where production, processing, and living facilities are housed. The 1065 fixed facilities are typically older (average install date of fixed leg facilities was 1982), attached to fewer wellheads (average 2.6 well heads per facility), lower-producing (68 bbl oil day-1 wellhead-1; 238 Mscf natural gas day-1 wellhead-1), with a minimum of processing equipment (separators only), no storage tanks for oil or gas (all shipped directly to shore), and usually unmanned [6].
The other platform types are not directly fixed to the ocean floor and can therefore operate in deeper water [8]. Spar platforms work in water up to 10,000 ft and are fixed to a large floating vertical cylinder that is tethered to the seabed. Semi-submersible platforms are attached to submerged horizontal pontoons which are anchored to the seabed in depths up to 10,000 ft. Tension leg platforms also work up to 10,000 ft and comprise of four air-filled pillars connected by a square-shaped pontoon structure that are fastened to the ocean floor using tendons that allows the platform to resist both vertical and rotational forces. Compliant tower platforms are connected to supports fixed to the seabed by a slender tower that absorbs/dissipates energy making them more stable and able to operate in the stronger currents found in deeper water up to 2,750 ft deep. Floating Production Storage and Offloading (FPSO) facilities are designed to process and store produced oil in deep water (up to 8,500 ft) and comprise a vessel that is fitted with all equipment needed to process and store oil and is moored to the seabed while receiving oil and gas from a subsea well. These 54 facilities are typically newer (average install date of 2007), more producing wellheads (average 4.0 well heads per facility), higher-production (1551 bbl oil day-1 wellhead-1; 1127 Mscf natural gas day-1 wellhead-1), more processing equipment (treater, headers, chemical injectors and dehydrators), storage tanks for oil (only gas is shipped directly to shore), and usually manned [6].
In recent years, fourteen studies [9,10,11,12,13,14,15,16,17,18,19,20,21] have used five quantification methods (downwind dispersion, mass balance, tracer flux, aircraft remote sensing, and satellite remote sensing) to measure emissions from 458 facilities in the Gulf of Mexico, the North Sea, Malaysia, Borneo, Canada, and East Africa. Focusing on the Gulf of Mexico, where the majority of measurements have taken place (323 facilities) and where the most is known about the production rates, the average facility emissions are estimated at 658 kg CH4 h-1, which corresponds to 835 Mscf CH4 day-1 [22]. This emission estimate is very much larger than a bottom-up emission estimate for a typical offshore facility in the North Sea of 83 kg CH4 h-1, which includes emissions from combustion (generators, export compressors) and processing (flash from the oil tanks, dehydrators and water treatment) activities [23].
Justification for the emission rates has been presented in individual publications and has been attributed to flaring of all produced gas during export pipeline repairs, venting of methane from storage tanks and the result of poor maintenance coupled with hurricane storm damage. What is currently unclear is whether these reasons can rationally justify the emission rates calculated. To investigate if current methods generate realistic emission estimates, we will create bottom-up models that simulate prototypical facilities operating in the Gulf of Mexico and compare the calculated emissions to actual emissions reported by published studies. Specifically, we aim to 1. Create bottom-up emission models that simulate facilities operating in the Gulf of Mexico; 2. Compare the expected emissions to actual emissions reported by published studies; and 3. Identify if the any discrepancy is real, i.e., within the reasonable expectations of a fugitive emissions, or could be result of quantification method limitation
2. Materials and Methods
2.1. Calculating Emissions from a Facility Operating Normally
To generate an emission estimate for normal operations, we propose two prototypical facility types that are defined using production data and facility equipment data [6]. Prototypical facility type 1 are those fixed platforms operating closer to shore (< 50 nm from shore) in shallower water (< 200 m) that comprise typically older, lower-producing platforms with less processing equipment, no compressor, the oil is piped to shore and those usually unmanned 24 hours per day (Figure 1, Table 1 and Table 2). The second prototypical facility type define those platforms that operate in deeper water (> 200 m), farther from shore (> 50 nm from shore), are newer, have higher production rates from more well heads, have more processing equipment, oil storage tanks, compressors and power generation (Figure 1, Table 1 and Table 2), and are usually manned 24 hours per day. Henceforth, fixed leg, well protector and caisson platforms are defined as type 1 prototypical facilities and all other types of production platforms as type 2. Of note here, annual water, gas and oil production values are taken from published well head specific data, while the average number of producing well heads per facility is taken from facility data [6]. Specific wellhead numbers are not directly linked to specific platforms in the data and the average gas production is a calculated value.
To generate likely average hourly methane emissions from each prototypical facility type, EPA emission factors [24,25,26] coupled with equipment activity data [6] were used. The intention of this is not to generate actual emission estimates from but to calculate what would be the expected emission estimate (in kg CH4 h-1) if emissions from a facility of that type were to be measured using a survey methodology, i.e., satellite, aircraft mass balance or a downwind dispersion approach [22]. As most of the emission sources on oil and gas production facilities work intermittently, e.g., separators and pneumatic controllers, we assume the emission factor is likely a time averaged value and lower than what would be observed during a survey, however, intermittency of emissions likely results in a subset of emissions being observed during the short observational period.
Recent studies have suggested that EPA emission factors could significantly underestimate emissions, by a factor of between 5 and 20 times, and mostly due to the under sampling of the right skewed emission distribution common of oil and gas emission profiles [27,28,29]. To investigate how much changes to emission factors could have on the hourly emission rate, we also include alternate emission factors taken from recent studies that either account for the long-tail distribution [30] or have previously been used to calculate emissions offshore [23].
2.2. Estimating Fugitive Emissions
Unlike process emissions described in Section 2.1, fugitive emissions are unexpected emissions that occur when equipment and gas pathways are damaged due to age or damage. Fugitive emissions are either continuous for sustained pressure vessels, e.g., on an export gas pipeline, or intermittent if the leaking piece of equipment undergoes pressure cycling, e.g., a pressure relief valve or flare on an overpressure relief system. To generate estimates of number of fugitives and expected size of emissions for each prototypical facility type, data were extracted from the 54 leak detection and repair (LDAR) surveys presented in the 2017 Gulf-wide Emission Inventory Study [31] and disaggregated by prototypical facility type. Average number of fugitives per facility and average emission rate per fugitive were calculated.
2.3. Maintenance Emissions
Maintenance emissions like vessel blowdowns can be very large (order of tons per hour) but are generally short duration events (usually sub-minute) depending on the size of vessel being blown down and the pressure of the gas. This means that these are likely only observed during unrepeated, snapshot observations, like satellite measurements. Most other methods will be either time averaged over a longer period, e.g., downwind dispersion, or will repeat observations, e.g., aircraft-based and mass-balance measurements. In this study we will not include maintenance emissions as we assume that either the observer has made repeat measurements of unusually large emissions suspected to be maintenance events or has contacted the operator to identify if a maintenance activity event has taken place during the observation window. In the event of observing a large emission event, we also assume the observer would attempt to reasonably match the reported emission duration to the observation duration. For example, for a single satellite observation lasting 10 seconds, we assume emissions have not been reported or extrapolated for longer time durations (hours, days, years) unless repeat measurements have been conducted or a reasonable attempt has been made to estimate the duration (i.e., how long did the maintenance event last).
2.4. Large Upset Emissions
In addition to maintenance emissions, we will also not include very large upset conditions in our estimate of the emission because we assume that any very large losses will be known to operators and could be determined from facility or pipeline metering. Large upset emissions would include events similar to those observed by Irakulis-Loitxate et al. (2022) [14], where sun-glint methods were used on satellite data to estimate methane emissions from the same facility in the Gulf of Mexico at 99,000 kg CH4 h-1 over a two-week period while flaring at the facility was on hiatus. While these observations are of interest to identify methods’ detection limits in a real-world setting, the emission rate would be known to the operator via pipeline operator, much larger than the current expected emissions from offshore facilities (83 kg CH4 h-1 [23]), and likely the total production of multiple facilities in a higher production area (~30 x total NG production of an average prototypical type 2 facility; Table 1; [14]). To comply with increased scrutiny, e.g., EU methane intensity or EPA superemitter tax requirements, operators need to be confident that methods can detect and quantify emissions at realistic emission rates. Here, we suggest that reported emissions larger than the average prototypical facility type 2 total production rate, i.e., 13,000 kg CH4 h-1, should be considered unrealistic.
2.5. Comparison with Observed Emissions
Recent measurement studies provide emission data from 294 platforms in the Gulf of Mexico. 151 platforms were measured using a shortwave infrared imaging spectrometer mounted on an aircraft to conduct sun-glint observations [9], 52 platforms were measured using an aircraft mass-balance method [11] and 103 measured using a downwind dispersion approach [21]. These data were first filtered to generate emissions from facilities most analogous to the bottom-up model estimate, i.e., no upset conditions or maintenance, and then emission directly compared with equipment known to be on each facility.
Using the emission data from 294 platforms in the Gulf of Mexico, a recent study [22] critically evaluated the measurements and generated four subsets: 1. Measurements that likely violated method assumptions; 2. Emissions that are defined as super emitters following the EPA definition of a facility emitting more than 100 kg CH4 h-1; 3. Those that have emission less than a bottom-up derived minimum and 4. Emission from the remaining facilities. While it is easy to defend the removal of subsets 1 and 3, removing subset 2 includes the largest emissions, with an average emission of 1012 kg CH4 h-1, and more difficult to rationally discount in analysis. Riddick et al. (2025) [22] suggest these large emission may result from making measurement in a decoupled marine boundary layer, where solar heating of clouds can result in stratification and a non-log linear relationship between altitude and wind speed which could result in overestimation by all three methods. For a comparison with our bottom-up model estimate, we only use emissions with an associated high confidence, i.e., subset 4 data. We assume that these are representative of working production facilities (both prototypical type 1 and 2) that are operating in non-upset condition, i.e., no maintenance or very large emission events. The subset 4 dataset includes emissions from 43 facilities with 8 measured using the aircraft spectrometer, 8 from the aircraft mass balance and 27 from downwind dispersion methods.
Data collated from the BSEE Data Center [6] were then used to determine the prototypical facility type based on the facility’s distance to shore, water depth, presence of compressors and the presence of a produced liquid storage tank. Of the 43 facilities in subset 4, 10 of the facilities measured could not be geographically matched to a facility in the BSEE database (Table 6). Of the remaining facilities, 1 was measured using the aircraft spectrometer, 7 from the aircraft mass balance and 25 from downwind dispersion methods. Production data during the time of the measurement were also extracted from the BSEE database and an estimate of the oil/gas production calculated and used to generate an estimate of the percentage of produced gas lost using the measured emission data. This percentage loss is used to evaluate the bottom-up emission estimate calculated for both prototypical facilities.
3. Results
3.1. Emissions from a Facility Operating Normally
For prototypical facility type 1 and prototypical facility type 2 production platforms, a bottom-up model can be generated to estimate the size of expected emissions from process and fugitive emissions using EPA emission factors. As activity data are not available to explicitly estimate emissions from specific facilities, i.e., data matching individual well head production to facilities and equipment types on each facility, the estimates presented here are only to be used as a guide of what emission could be expected. Emissions are calculated from the average amount of produced gas/oil/water (Table 1), and the equipment used to process/store on the facility (Table 2).
3.1.1. Prototypical Facility Type 1
Most prototypical type 1 facilities are unmanned fixed platform producing oil and associated gas in near-shore (< 50 nm), shallow (< 6,000 ft of water) areas (Table 2). It is estimated that average production from each well is 87 MMscf of gas, 25 Mbbls oil and 114 Mbbls water per year from an average of 2.6 well heads per platform (Table 1). Prototypical facility type 1 platforms include all Caisson/Well Protector platforms and Fixed leg facilities that are both less than 50 nm from shore and are in water less than 200 m deep (Figure 1). These facilities have emission sources that are either vented to atmosphere or vented to the flare. Sources vented to the atmosphere include pneumatic controllers, process equipment (chemical injectors and dehydrators), a produced water storage tank, and high pressure 2-phase and low pressure 3-phase separators. Upset conditions, i.e., over pressure in production lines are vented to a flare that is 98% efficient. Total operational emissions from a prototypical facility type 1 are estimated at 1.6 kg CH4 h-1 with the largest emissions from pneumatic controllers (0.5 kg CH4 h-1) and chemical injection pumps (0.5 kg CH4 h-1) (Table 3).
3.1.2. Prototypical Facility Type 2
Even though there are key physical differences between Spar, Semi-Submersible, Tension leg, Compliant tower and FPSO platforms, there are many similarities that likely result in a common emission profile. All facilities have power generation, product storage tanks and compressors (Table 2). It is estimated that each well on this type of facility produces 411 MMscf gas, 556 Mbbls oil and 357 Mbbls water per year from an average of 4 well heads per platform (Table 1).
We will assume a prototypical facility type 2 facility consists of the following emission sources that are vented to the atmosphere: pneumatic controllers; process equipment (treater, headers, chemical injectors and dehydrators); condensate/oil storage tanks; a produced water storage tank; 9 low pressure 3-phase separators; one high pressure 2-phase separator; a glycol dehydrator; and gas turbines driving dry seal centrifugal gas export compressors. The expected average total emissions from processing equipment on deep water, higher production platform facility is estimated at 18.7 kg CH4 h-1 (Table 4). The largest emissions are from the liquid storage tanks (18.7 kg CH4 h-1), water storage tanks (2.1 kg CH4 h-1), and compressors (1.8 kg CH4 h-1).
3.1.3. Note of Caution with Data
We add the caveat here that the numerical values presented above are for illustrative purposes only and give an emission estimate with a large uncertainty. The bottom-up estimates presented in Table 5 and Table 6 do not use the BOEM-approved methodology as many of the variables required to generate a bottom-up method are unavailable to us (run time of equipment, gas to oil ratio values and volumes of vented gas). We also acknowledge many assumptions have been made (and described in Section 3.1.1 and Section 3.1.2) and were made in lieu of data availability.

Table 5.
Average number, total emission and average fugitive emission measured during LDAR surveys.
| Type | Number platforms surveyed | Average # fugitives | Average Total Emission (kg h-1) | Average Emission per Leak (kg h-1) |
| Fixed Leg | 43 | 12 | 7.7 | 0.64 |
| FPSO | 1 | 4 | 11.9 | 2.99 |
| Semi-Submersible | 3 | 18 | 28.3 | 1.57 |
| Spar | 3 | 16 | 20.8 | 1.30 |
| Tension Leg | 4 | 15 | 21.4 | 1.42 |
Table 6.
Data for platforms measured in the Gulf of Mexico [9,11,21] with observations removed for likely violated method assumptions, super emitters (> 100 kg CH4 h-1), or emissions less than 5.3 kg CH4 h-1 [22]. “ID”—platform ID number. “C&P”—facility has both a compressor and power generator. Types include: MTLP—Mini Tension Leg Platform; TLP—Tension Leg Platform. “PFT” –prototypical facility type. “OP”—facility oil production. “GP” the gas production. Study 1 Yacovitch et al. (2020) all measurements made February 2018. Study 2 Ayasse et al. (2022) all measurements made October 2021. Study 3 Gorchov Negron et al. (2023) all measurements made August 2020. “Q”—measured emission. “Loss”—the percentage of produced gas lost.
| ID | Lat (°N) | Lon (°W) | Lease number | Distance (nm) | Depth (ft) | Store Tank | C&P | Type | PTF type | OP (bbl/h) | GP (kg/h) | Study | Q (kg/h) | Loss (%) |
| 20043 | 28.97 | 90.00 | 00128 | 13 | 85 | Y | N | Fixed | 1 | 4 | 256 | 1 | 7.46 | 3 |
| 22486 | 29.15 | 89.90 | N/A* | 7 | 55 | Y | N | Fixed | 1 | 0 | 0 | 1 | 8.25 | - |
| 23103 | 29.14 | 91.17 | G01359 | 5 | 15 | N | N | Caisson | 1 | 0 | 52 | 1 | 8.46 | 18 |
| 22630 | 28.93 | 90.47 | G03236 | 10 | 60 | N | N | Fixed | 1 | 0 | 1819 | 1 | 10.85 | 1 |
| 20035 | 29.01 | 89.84 | G31418 | 19 | 111 | N | N | Fixed | 1 | 53 | 8941 | 1 | 10.97 | 0.1 |
| 1531 | 29.56 | 93.42 | G01240 | 14 | 42 | N | N | Fixed | 1 | 4 | 170 | 1 | 11.46 | 7 |
| 2006 | 28.96 | 90.02 | 00180 | 14 | 92 | N | N | Fixed | 1 | 3 | 176 | 1 | 14.01 | 9 |
| 717 | 29.13 | 91.18 | G23740 | 5 | 12 | N | N | Caisson | 1 | 0 | 218 | 1 | 15.36 | 8 |
| 2275 | 29.34 | 92.99 | 00133 | 23 | 55 | N | N | Fixed | 1 | 4 | 150 | 1 | 17.05 | 12 |
| 10237 | 29.52 | 94.15 | 00346 | 10 | 41 | N | N | Fixed | 1 | 0 | 160 | 1 | 18.22 | 12 |
| 10500 | 29.13 | 94.55 | G25937 | 17 | 58 | N | N | Fixed | 1 | 1 | 2074 | 1 | 25.01 | 1 |
| 31012 | 28.92 | 90.35 | G05006 | 9 | 62 | N | N | Fixed | 1 | 0 | 61 | 1 | 35.06 | 61 |
| 21517 | 29.19 | 91.62 | G06093 | 17 | 22 | N | N | Fixed | 1 | 16 | 261 | 2 | 46.55 | 19 |
| 1088 | 28.74 | 88.83 | G01865 | 30 | 2850 | Y | Y | MTLP | 2 | 1 | 1247 | 1 | 5.83 | 1 |
| 21895 | 29.08 | 88.70 | G23851 | 18 | 340 | Y | Y | Fixed | 2 | 2 | 6405 | 1 | 8.06 | 0.5 |
| 10082 | 29.18 | 94.52 | G19931 | 15 | 54 | N | Y | Fixed | 2 | 28 | 2107 | 1 | 8.94 | 0.1 |
| 2574 | 28.12 | 90.53 | G02445 | 0 | 391 | Y | Y | Fixed | 2 | 247 | 427 | 1 | 9.33 | 2 |
| 22593 | 28.91 | 89.51 | N/A* | 5 | 143 | Y | Y | Fixed | 2 | 0 | 0 | 1 | 12.43 | - |
| 21429 | 28.46 | 91.08 | 00830 | 62 | 130 | Y | Y | Fixed | 2 | 0 | 0 | 3 | 14.00 | - |
| 1899 | 27.30 | 90.14 | G20084 | 175 | 4375 | Y | Y | TLP | 2 | 457 | 3754 | 3 | 15.00 | 0.4 |
| 1482 | 28.94 | 88.91 | G28351 | 30 | 667 | N | Y | Fixed | 2 | 11 | 820 | 1 | 18.43 | 2 |
| 1279 | 28.09 | 90.74 | G22762 | 60 | 447 | N | Y | Fixed | 2 | 4 | 117 | 1 | 21.36 | 20 |
| 1076 | 28.09 | 90.67 | N/A* | 65 | 460 | Y | Y | Fixed | 2 | 0 | 0 | 1 | 22.22 | - |
| 24129 | 28.10 | 90.20 | G12136 | 66 | 775 | Y | Y | Fixed | 2 | 213 | 4403 | 1 | 37.57 | 1 |
| 24209 | 28.83 | 89.56 | N/A* | 6 | 252 | Y | Y | Fixed | 2 | 0 | 0 | 3 | 48.00 | - |
| 22380 | 28.89 | 89.06 | G02177 | 7 | 300 | Y | Y | Fixed | 2 | 30 | 1303 | 1 | 49.36 | 4 |
| 24199 | 28.17 | 89.22 | G07963 | 52 | 2933 | Y | Y | TLP | 2 | 852 | 18916 | 3 | 50.00 | 0.3 |
| 67 | 27.78 | 90.52 | G05911 | 60 | 2590 | Y | Y | Spar | 2 | 49 | 1370 | 3 | 52.00 | 4 |
| 23848 | 28.78 | 89.24 | G05052 | 13 | 467 | Y | N | Fixed | 2 | 0 | 0 | 1 | 57.95 | - |
| 251 | 27.69 | 90.28 | G07049 | 86 | 3294 | Y | Y | MTLP | 2 | 58 | 2616 | 3 | 58.00 | 2 |
| 2103 | 29.38 | 91.75 | G02625 | 7 | 13 | N | Y | Fixed | 2 | 24 | 392 | 3 | 63.00 | 17 |
| 20375 | 29.09 | 88.73 | G01294 | 17 | 325 | Y | Y | Fixed | 2 | 8 | 179 | 1 | 64.29 | 39 |
| 2247 | 28.91 | 90.42 | G24956 | 9 | 60 | Y | Y | Fixed | 2 | 26 | 2695 | 1 | 94.21 | 4 |
| * facility not on active lease. | ||||||||||||||
3.2. Fugitive Emissions
For the 43 Fixed Leg platforms, there was an average 12 fugitive emissions per platform with an average emission rate of 0.64 kg h-1 [31]. There were fewer fugitive emissions found on the FPSOs (12), but more on the Semi-Submersibles (18), Spar platforms (3) and Tension Leg platforms (15). Emission rates from the larger platforms are also larger than the average emissions from the simpler facilities. For the purposes of this study, we will use the Fixed Leg platform data for fugitive emissions from prototypical facility type 1 facilities (12 fugitive emissions per facility with an average emission of 0.64 kg CH4 h-1 leak-1) and the as the average of the larger facilities for prototypical facility type 2 facilities (13 fugitive emissions per facility with an average emission rate of 1.8 kg CH4 h-1). It should be noted that component-based emission estimates for whole sites are inherently biased low as some fugitives can be missed from the survey, therefore, we suggest the average number of fugitives is realistically the lower bound.
3.3. Observed Emissions
3.3.1. Prototypical Type 1 Facilities
Of the remaining 33 facilities measured by either Yacovitch et al. (2020) [21], Ayasse et al. (2022) [9] and Gorchov Negron et al. (2023) [11], 13 were assigned as prototypical type 1 (Table 6). All type 1 facilities were either Fixed leg (11) or Caisson (2) types. Average gas production is estimated at 1103 kg NG h-1 for type 1 facilities, while average measured emissions are 17.6 kg CH4 h-1. Assuming a methane content of natural gas of 93% [24], this corresponds to a median production loss of 8 % and mean production loss of 13 %.
3.3.2. Prototypical Type 2 Facilities
Of the type 2 facilities, 15 were Fixed leg, 2 were Mini Tension Leg platforms, 2 were Tension Leg platforms and one was a Spar platform. From the BSEE production data, we estimate an average oil production at 2414 barrels per day and average gas production at 2338 kg NG h-1 for type 2 facilities. Average measured emissions are 35.5 kg CH4 h-1 which corresponds to a median production loss of 2.4 % and mean production loss of 6 %. Note that the average production losses did not include any of the facilities that were not on active leases or did not report any oil/gas produced during the measurement period. The average emission from non-producing sites was 27 kg CH4 h-1, with 8 kg CH4 h-1 from type 1 facilities and 31 kg CH4 h-1 for type 2 facilities.
4. Discussion and Conclusions
4.1. Calculated Bottom-Up Emission Estimates
Operational emissions from a prototypical facility type 1 are estimated at 1.6 kg CH4 h-1 with the largest emissions from pneumatic controllers (0.5 kg CH4 h-1) and chemical injection pumps (0.5 kg CH4 h-1) (Table 3). Fugitive emissions are estimated at 7.7 kg CH4 h-1 with 12 fugitive emissions per facility with an average emission of 0.64 kg CH4 h-1 leak-1. Total emissions from a prototypical facility type 1 are estimated at 9.2 kg CH4 h-1. An emission of 9.2 kg CH4 h-1 corresponds to a loss of 1.9 % of the average facility production of 480 kg CH4 h-1.
The expected average total emissions from processing equipment on a deep water, higher production platform (prototypical facility type 2) is estimated at 18.7 kg CH4 h-1 (Table 4). The largest emissions are from the liquid storage tanks (18.7 kg CH4 h-1), water storage tanks (2.1 kg CH4 h-1), and compressors (1.8 kg CH4 h-1). Fugitive emissions are estimated at 23.4 kg CH4 h-1 with 13 fugitive emissions per facility with an average emission rate of 1.8 kg CH4 h-1. Total emissions from a prototypical facility type 2 are estimated at 42.2 kg CH4 h-1. An emission of 42.2 kg CH4 h-1 corresponds to a loss of 1.2 % of the average facility production of 3495 kg CH4 h-1.
The prototypical facility type 1 hourly emission calculated using the standard EPA emission factors (9.2 kg CH4 h-1) are very similar to the emission estimate calculated using updated emission factors (10.3 kg CH4 h-1). We suggest this is just simply a function of the facilities’ simplicity where gas is taken onto the facility, split into gas, oil and water, and then exported to the shore. Prototypical facility type 2 are more complex and therefore have the potential to be more emissive. Updating the emission factors suggests the emission from the compressors and the produced liquid tanks could be underestimated and total emissions are 38 % higher than a bottom-up estimate generated using EPA emission factors. However, the increase in emission from 42 to 59 kg CH4 h-1 is relatively small, within the uncertainty of the measurements methods used offshore (between -50% and +100% [21]) and using emission factors that do not account for a long tail emission distribution [27,30,32] cannot be used to explain the very highest emission estimates reported by studies using aircraft methods [9,11]. Note that 48 % of the non-zero emissions measured by the spectrometer/aircraft [9] are larger than the average production of prototypical type 1 facilities and 5 % are larger than the average production of prototypical type 2 facilities.
4.2. Measured Emissions
Of the 13 type 1 facilities that were measured and had production/equipment data, average emissions were 17.6 kg CH4 h-1 and median production loss estimated at 8 % (Table 6). The difference between the measured and modelled are factors of 2 and 4 for the absolute emission (modelled: 9.2 kg CH4 h-1) and percentage of product lost (modelled: 1.9 %), respectively. As mentioned above, there are few moving parts and no storage tanks on Type 1 facilities, so vented emissions are likely a small fraction of the total emission (Table 3). The largest unknown emission source on a Type 1 facility are fugitives (Table 3). Data on the relative size and number of fugitives is meagre with the emission estimate used in this study coming from leak detection and repair (LDAR) surveys of 43 platforms (average number of fugitives is 12 with average size 0.64 kg CH4 h-1). LDAR studies are inherently biased low as they only include leaks found and do not account for any in hard to measure place or intermittent leaks. Type 1 facilities are typically older (average install date of Caisson facilities in 1992 and Fixed Leg 1982) and are largely unoccupied which means fugitives are less likely to be observed and repaired (Table 1). This provides a rationale for the discrepancy between the modelled and measured emission rates, and we therefore suggest that 6 % of production is currently lost as fugitive emissions from Type 1 facilities.
Of the 20 type 2 facilities with data measured, average measured emissions were 35.5 kg CH4 h-1 corresponding to a median production loss of 2.4 % (Table 6). The difference between the measured and modelled are factors of 0.8 and 2 for the absolute emission (modelled: 42.2 kg CH4 h-1) and percentage of product lost (modelled: 1.2 %), respectively. The bottom-up emission calculated using emission factors that consider the long-tail emission distribution (59 kg CH4 h-1; 1.7 %) reconcile the difference between modelled and measured in part suggesting the emission factors may not be adequately tuned for offshore. Also, we must also consider that the fugitive emission estimate may be an underestimate, with LDAR surveys of Type 2 facilities even more difficult than Type 1 and could miss hard to reach leaks.
Despite these differences, we can consider that bottom-up modelling can be used to generate representative emission estimates from operating offshore production facilities if production rates and equipment types are known. We suggest the main weakness in emission quantification is the estimate of the size and number of fugitive emissions on the facility. This could be better calculated using LDAR surveys with either optical gas imaging or spectrometers mounted on drones. Regardless of method, more data would help to reconcile the modelled and measured emission estimate. We must note again here that, short of a catastrophic emission event that is likely to result in a noticeable reduction in gas production rate, emissions are unlikely to exceed the super-emitter threshold (100 kg CH4 h-1) without being caused by the operator (maintenance, oil unloading or vented for safety).
4.3. Recognizing Real Large Emission Events and Quantification Best Practices
While we recognize that bottom-up methods of quantifying methane emissions from oil and gas production infrastructure have many shortcomings, we have shown here that models that incorporate both equipment types and production rates can be used to generate emission estimates representative of measured emissions. We suggest that the main difficulty in reconciling modelled and measured emission estimates is the current understanding of the number and size of fugitive emissions on both the lower and higher production facilities. Currently LDAR survey are conducted through AVO detection, which means that the leaks could remain undetected on unmanned facilities or those that are larger and have more hard-to-reach areas. This could be addressed by conducting more LDAR surveys with a range of methods that can quantify total facility emissions.
Even though the sizes of fugitive emissions are not completely known, they could not be used to account for the very largest disparity between modelled and measured. Some measured emissions presented in publications are larger than the average gas production rates of type 2 facilities (> 3480 kg CH4 h-1), which either means an error in measurement or catastrophic failure of the production equipment. Here we suggest the bottom-up approach presented in this study that includes equipment types and production rates could be used to generate a representative emission rate and used as a metric to identify those measured emissions that should be targeted for further investigation. In the event of a large emission event, operators can be contacted to determine if maintenance is being carried out. If the measurement timing does not coincide with a known event, remeasurements could be made to make sure that atmospheric events, such as the decoupling of the marine boundary layer, have not biased the quantification. In all cases, we suggest that this relatively quick bottom-up approach can be used as a quick validation check on measured values to give more confidence to whole facility quantification.
The rationale for this is to generate a more reasonable time averaged emission estimate. For example, if the emission from a production facility in the Gulf of Mexico is observed to be 1145 kg CH4 h-1 during a 30 second measurement [9], it would be unreasonable to extrapolate this up to an hourly, daily or annual emission without an understanding of the driver of the emission and reasonable assumption made about the duration. It is also possible that the atmospheric conditions, such as the decoupling of the marine boundary layer, could be responsible for the overestimate and a repeat measurement of the facility should be conducted to ensure confidence in the emission estimate.
Our study highlights two important unknowns in quantifying methane emissions from offshore facilities. Firstly, the understanding of the number and range of sizes of fugitive emissions from offshore facilities. Annual measurements are made and reported as part of the US Department of the Interior, Bureau of Ocean Energy Management‘s Gulf of Mexico OCS Region report [31], however, these data are not exhaustive and do not include fugitive emission counts from all facilities operating in the region. Fugitive emissions also present a safety risk particularly on unmanned facilities. Therefore, we suggest in the interests of both safety and improving the understanding of expected emissions LDAR surveys should be carried out on as many facilities as possible.
Secondly, there remains uncertainty over the uncertainty of measurement methods to quantify emissions. This question has been asked by other studies, e.g., Riddick et al. (2025) [22], where it has been suggested that current offshore emission quantification methods are either capable of missing the downwind plume or overestimating the emission by an unreasonable amount. Here we suggest future studies could investigate if measurement methods’ assumptions of a logarithmic wind profile are reasonable and in which atmospheric conditions the assumptions are likely to be violated. In this way, future measurements can be assigned an understanding of how accurate the observer feels the emission are and increase the confidence in the observation.
Author Contributions
SNR: Funding Acquisition, Conceptualization, Investigation, Methodology, Supervision, Writing—original draft preparation, review and editing. MM: Investigation, Writing: original draft preparation. CL: Funding Acquisition, Project Administration, Conceptualization, Supervision, Review and editing. DJZ: Funding Acquisition, Project Administration, Conceptualization, Supervision, Review and editing.
Funding
This project has been funded by the U.S. Department of Energy’s Office of Fossil Energy and Carbon Management (FECM) project # DE-FE0032276 “Capabilities Enhancement for Methane Emissions Technology Evaluation Center (METEC) to Decarbonize Natural Gas Resources”.
Institutional Review Board Statement
Not applicable.
Informed Consent Statement
Not applicable.
Data Availability Statement
No new data were created during this study. Data sharing is not applicable to this article.
Conflicts of Interest
The authors declare no conflicts of interest.
References
- OGMP Oil and Gas Methane Partnership 2.0—Key Benefits. Available online: https://www.ogmpartnership.org/key-benefits (accessed on 17 June 2025).
- Cheniere Converting Measurements Into Measurement Informed Inventories: Lessons from Cheniere’s. QMRV Research Series. Global Methane Initiative, Geneva March 20, 2024. Available online: https://www.globalmethane.org/documents/2024Forum/Oil%20&%20Gas%20Sessions/3%20-%20The%20Role%20of%20Technologies%20in%20Improving%20Measurements%20and%20Enhancing%20Inventories%20to%20Enable%20Faster%20Action/8%20-%20George_MRV_Oil%20&%20Gas.pdf (accessed on 17 June 2025).
- Statistica Number of Offshore Rigs Worldwide as of January 2018 by Region. Available online: Https://Www.Statista.Com/Statistics/279100/Number-of-Offshore-Rigs-Worldwide-by-Region/ (accessed on 28 December 2021).
- EIA Offshore Production Nearly 30% of Global Crude Oil Output in 2015. Available online: https://www.eia.gov/todayinenergy/detail.php?id=28492 (accessed on 28 December 2021).
- EIA Natural Gas Explained. Available online: https://www.eia.gov/energyexplained/natural-gas/use-of-natural-gas.php (accessed on 12 October 2021).
- BSEE Bureau of Safety and Environmental Enforcement (BSEE) Data Center. Available online: https://www.data.bsee.gov/Main/Default.aspx (accessed on 4 February 2025).
- Speight, J. Processing Gas from Tight Formations. In Shale Oil and Gas Production Processes; Elsevier, 2020; pp. 451–518 ISBN 978-0-12-813315-6.
- Standard Handbook of Petroleum and Natural Gas Engineering; Lyons, W.C., Plisga, G.J., Lorenz, M.D., Eds.; Third edition.; Elsevier : GPP: Amsterdam ; Boston, 2016; ISBN 978-0-12-383846-9.
- Ayasse, A.K.; Thorpe, A.K.; Cusworth, D.H.; Kort, E.A.; Negron, A.G.; Heckler, J.; Asner, G.; Duren, R.M. Methane Remote Sensing and Emission Quantification of Offshore Shallow Water Oil and Gas Platforms in the Gulf of Mexico. Environ. Res. Lett. 2022, 17, 084039. [Google Scholar] [CrossRef]
- Foulds, A.; Allen, G.; Shaw, J.T.; Bateson, P.; Barker, P.A.; Huang, L.; Pitt, J.R.; Lee, J.D.; Wilde, S.E.; Dominutti, P.; et al. Quantification and Assessment of Methane Emissions from Offshore Oil and Gas Facilities on the Norwegian Continental Shelf. Atmos. Chem. Phys. 2022, 22, 4303–4322. [Google Scholar] [CrossRef]
- Gorchov Negron, A.M.; Kort, E.A.; Chen, Y.; Brandt, A.R.; Smith, M.L.; Plant, G.; Ayasse, A.K.; Schwietzke, S.; Zavala-Araiza, D.; Hausman, C.; et al. Excess Methane Emissions from Shallow Water Platforms Elevate the Carbon Intensity of US Gulf of Mexico Oil and Gas Production. Proc. Natl. Acad. Sci. U.S.A. 2023, 120, e2215275120. [Google Scholar] [CrossRef] [PubMed]
- Gorchov Negron, A.M.; Kort, E.A.; Conley, S.A.; Smith, M.L. Airborne Assessment of Methane Emissions from Offshore Platforms in the U.S. Gulf of Mexico. Environ. Sci. Technol. 2020, 54, 5112–5120. [Google Scholar] [CrossRef] [PubMed]
- Hensen, A.; Velzeboer, I.; Frumau, K.F.A.; van den Bulk, W.C.M.; van Dinter, D. Methane Emission Measurements of Offshore Oil and Gas Platforms; TNO: Petten, 2019; p. 94. [Google Scholar]
- Irakulis-Loitxate, I.; Gorroño, J.; Zavala-Araiza, D.; Guanter, L. Satellites Detect a Methane Ultra-Emission Event from an Offshore Platform in the Gulf of Mexico. Environ. Sci. Technol. Lett. 2022, 9, 520–525. [Google Scholar] [CrossRef]
- Khaleghi, A.; MacKay, K.; Darlington, A.; James, L.A.; Risk, D. Methane Emission Rate Estimates of Offshore Oil Platforms in Newfoundland and Labrador, Canada. Elem Sci Anth 2024, 12, 00025. [Google Scholar] [CrossRef]
- MacLean, J.-P.W.; Girard, M.; Jervis, D.; Marshall, D.; McKeever, J.; Ramier, A.; Strupler, M.; Tarrant, E.; Young, D. Offshore Methane Detection and Quantification from Space Using Sun Glint Measurements with the GHGSat Constellation. Atmos. Meas. Tech. 2024, 17, 863–874. [Google Scholar] [CrossRef]
- Nara, H.; Tanimoto, H.; Tohjima, Y.; Mukai, H.; Nojiri, Y.; Machida, T. Emissions of Methane from Offshore Oil and Gas Platforms in Southeast Asia. Scientific Reports 2015, 4. [Google Scholar] [CrossRef] [PubMed]
- Pühl, M.; Roiger, A.; Fiehn, A.; Gorchov Negron, A.M.; Kort, E.A.; Schwietzke, S.; Pisso, I.; Foulds, A.; Lee, J.; France, J.L.; et al. Aircraft-Based Mass Balance Estimate of Methane Emissions from Offshore Gas Facilities in the Southern North Sea. Atmos. Chem. Phys. 2024, 24, 1005–1024. [Google Scholar] [CrossRef]
- Riddick, S.N.; Mauzerall, D.L.; Celia, M.; Harris, N.R.P.; Allen, G.; Pitt, J.; Staunton-Sykes, J.; Forster, G.L.; Kang, M.; Lowry, D.; et al. Methane Emissions from Oil and Gas Platforms in the North Sea. Atmospheric Chemistry and Physics 2019, 19, 9787–9796. [Google Scholar] [CrossRef]
- Valverde, A.; Irakulis-Loitxate, I.; Roger, J.; Gorroño, J.; Guanter, L. Satellite Characterization of Methane Point Sources by Offshore Oil and Gas PlatForms. In Proceedings of the IV Conference on Geomatics Engineering; 12 January 2024; MDPI; p. 22. [Google Scholar]
- Yacovitch, T.I.; Daube, C.; Herndon, S.C. Methane Emissions from Offshore Oil and Gas Platforms in the Gulf of Mexico. Environ. Sci. Technol. 2020, 54, 3530–3538. [Google Scholar] [CrossRef] [PubMed]
- Riddick, S.N.; Mbua, M.; Laughery, C.; Zimmerle, D.J. A Review of Offshore Methane Quantification Methodologies. Atmosphere 2025, 16, 626. [Google Scholar] [CrossRef]
- Riddick, S.N.; Mauzerall, D.L. Likely Substantial Underestimation of Reported Methane Emissions from United Kingdom Upstream Oil and Gas Activities. Energy Environ. Sci. 2023, 16, 295–304. [Google Scholar] [CrossRef]
- EPA Inventory of U.S. Greenhouse Gas Emissions and Sinks: 1990-2016. Https://Www.Epa.Gov/Ghgemissions/Inventory-Us-Greenhouse-Gas-Emissions-and-Sinks-1990-2016. Last Accessed 5th May 2023. US EPA 2018.
- US EPA U.S. Environmental Protection Agency, AP-42: Compilation of Air Emissions Factors, 2018. Available online: https://www3.epa.gov/ttn/chief/ap42/ch13/final/C13S05_02-05-18.pdf. (accessed on 25 October 2022).
- US EPA US Environmental Protection Agency. Methane Emissions from the Natural Gas Industry, Volume 3: General Methodology. Available online: https://www.epa.gov/sites/default/files/2016-08/documents/3_generalmeth.pdf (accessed on 6 December 2024).
- Riddick, S.N.; Mbua, M.; Santos, A.; Hartzell, W.; Zimmerle, D.J. Potential Underestimate in Reported Bottom-up Methane Emissions from Oil and Gas Operations in the Delaware Basin. Atmosphere 2024, 15, 202. [Google Scholar] [CrossRef]
- Varon, D.J.; Jacob, D.J.; Hmiel, B.; Gautam, R.; Lyon, D.R.; Omara, M.; Sulprizio, M.; Shen, L.; Pendergrass, D.; Nesser, H.; et al. Continuous Weekly Monitoring of Methane Emissions from the Permian Basin by Inversion of TROPOMI Satellite Observations. Atmos. Chem. Phys. 2023, 23, 7503–7520. [Google Scholar] [CrossRef]
- Riddick, S.N.; Cheptonui, F.; Yuan, K.; Mbua, M.; Day, R.; Vaughn, T.L.; Duggan, A.; Bennett, K.E.; Zimmerle, D.J. Estimating Regional Methane Emission Factors from Energy and Agricultural Sector Sources Using a Portable Measurement System: Case Study of the Denver–Julesburg Basin. Sensors 2022, 22, 7410. [Google Scholar] [CrossRef] [PubMed]
- Zavala-Araiza, D.; Alvarez, R.A.; Lyon, D.R.; Allen, D.T.; Marchese, A.J.; Zimmerle, D.J.; Hamburg, S.P. Super-Emitters in Natural Gas Infrastructure Are Caused by Abnormal Process Conditions. Nat Commun 2017, 8, 14012. [Google Scholar] [CrossRef] [PubMed]
- BOEM Bureau of Ocean Energy Management (BOEM) OCS Emissions Inventory—2017. Available online: https://www.boem.gov/environment/environmental-studies/ocs-emissions-inventory-2017 (accessed on 4 February 2025).
- Vaughn, T.L.; Bell, C.S.; Pickering, C.K.; Schwietzke, S.; Heath, G.A.; Pétron, G.; Zimmerle, D.J.; Schnell, R.C.; Nummedal, D. Temporal Variability Largely Explains Top-down/Bottom-up Difference in Methane Emission Estimates from a Natural Gas Production Region. Proceedings of the National Academy of Sciences 2018, 115, 11712–11717. [Google Scholar] [CrossRef] [PubMed]
Figure 1.
Distribution of the oil and gas production platforms in the Gulf of Mexico in 2022 using data published by BSEE [6]. The dashed line gives a nomial outline of the geographical split between prototypical facility type 1 and 2 fixed platforms. Type 1 prototypical facilities are generally closer to shore and in shallower water.
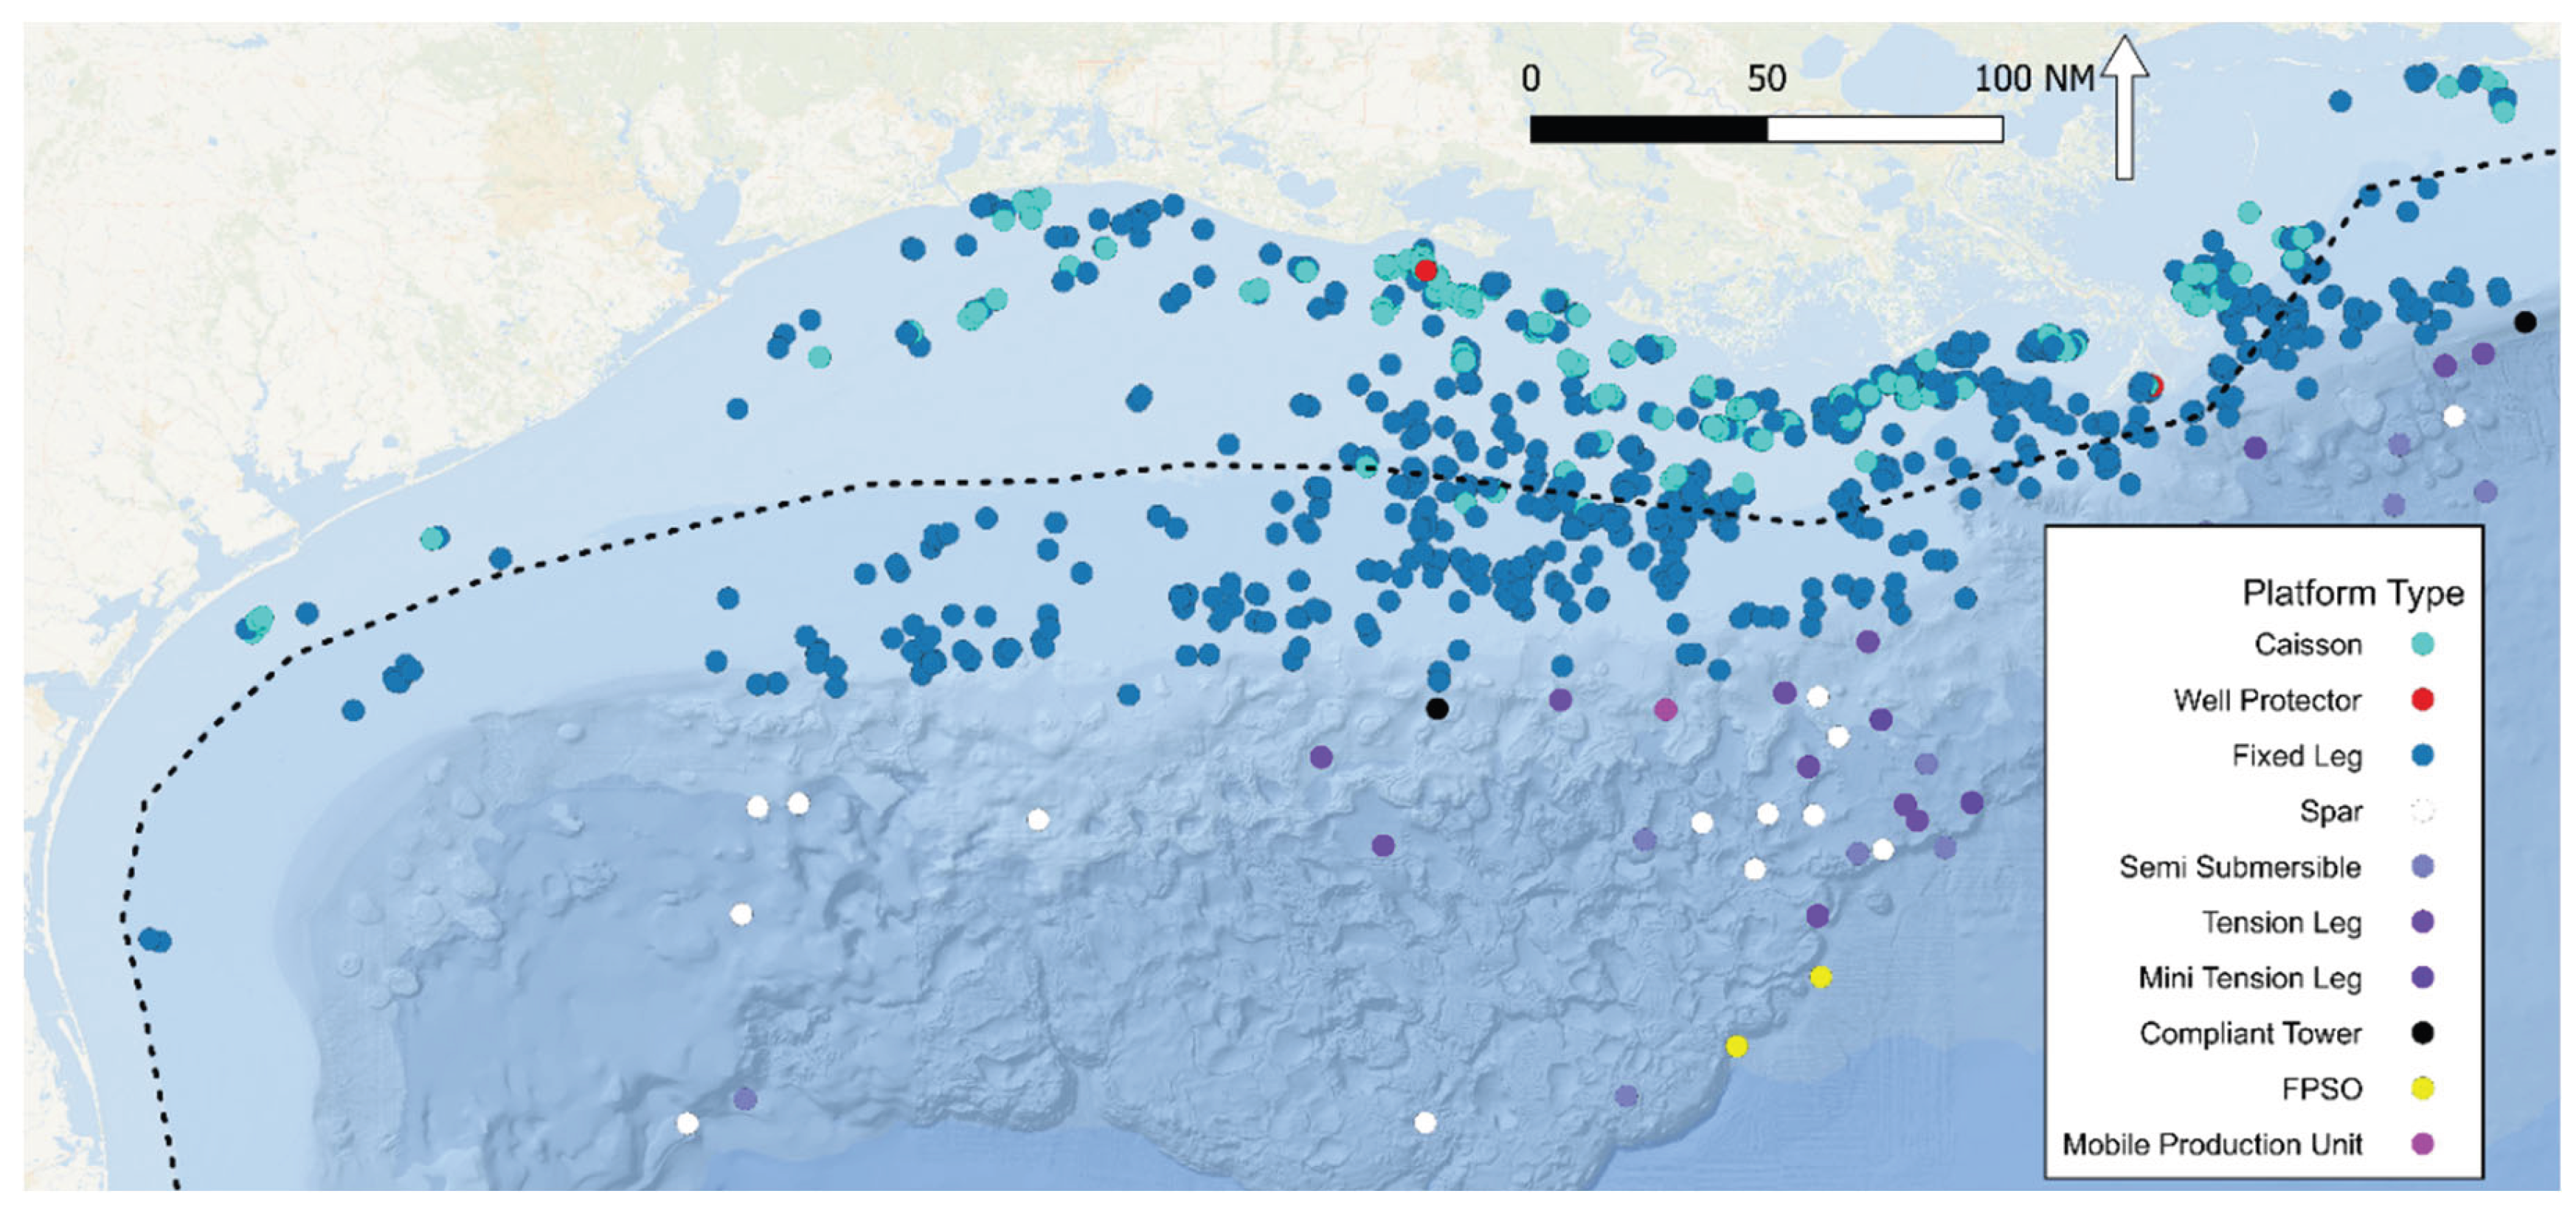
Table 1.
Average production rates from available well data. Prototypical facility type 1 are those fixed platforms operating in shallower water (typically < 50 nm from shore), and prototypical facility type 2 are platforms that operate in deeper water (typically > 50 nm from shore). Annual water, gas and oil production values are taken from published well head specific data, while the average number of producing well heads per facility is taken from facility data [6]. Specific wellhead numbers are not directly linked to specific platforms in the data and the average gas production is a calculated value.
| Prototypical facility type | Average number of producing well heads per facility | Average Water Production (Mbbl y-1 well-1) |
Average Gas Production (MMscf y-1 well-1) |
Average Gas Production (kg h-1 facility-1) |
Average Oil Production (Mbbl y-1 well-1) |
| 1 | 2.6 | 114 | 87 | 480 | 25 |
| 2 | 4.0 | 357 | 411 | 3,495 | 566 |
Table 2.
Typical features of each type of production platform active in the Gulf of Mexico.
| Platform type | Count | Average Install Date | Average Deck Count | Manned 24 Hours per day (%) | With a Compressor (%) | With a Generator (%) | With Production Equipment (%) | With a Storage Tank (%) |
| Caisson | 253 | 1992 | 1.7 | 1 | 2 | 4 | 72 | 2 |
| Well Protector | 6 | 1983 | 1.0 | 0 | 0 | 0 | 50 | 0 |
| Fixed Leg | 806 | 1982 | 2.3 | 23 | 38 | 47 | 84 | 28 |
| Spar Platform | 17 | 2005 | 3.4 | 94 | 100 | 100 | 100 | 65 |
| Semi-Submersible | 15 | 2014 | 1.7 | 93 | 93 | 93 | 93 | 73 |
| Tension leg | 14 | 2003 | 2.5 | 100 | 100 | 100 | 100 | 93 |
| Mini Tension Leg | 3 | 2003 | 3.3 | 100 | 100 | 100 | 100 | 67 |
| Compliant tower | 2 | 1999 | 3.5 | 100 | 100 | 100 | 100 | 100 |
| FPSO | 2 | 2013 | 0.0 | 100 | 100 | 100 | 100 | 100 |
| Mobile Prod. Unit | 1 | 2009 | 3.0 | 100 | 100 | 100 | 100 | 100 |
Table 3.
Estimated emissions from Type 1 platforms during normal operations. Emission factors taken from the EPA emission factor database [24,25]. Assuming an average wind speed in the Gulf of Mexico of 8 m s-1.
| Equipment | Description | EPA Emission factor | Emission (kg h-1) | Updated emission factors from measurement studies | Emission (kg h-1) |
| Gas Outlet | Pipelines to shore | N/A | 0 | 0 | |
| Oil/Condensate | Pipelines to refinery onshore | N/A | 0 | 0 | |
| Separators | 1 high pressure, 2 low pressure | 969 kg/separator/y | 0.3 | 969 kg/separator/y | 0.3 |
| Water Treatment |
Water stored in the gravity base structure. | 51 kg/Mbbls water | 0.1 | 0.415 g CH4 m-3 water[23] | - |
| Gas Flaring | Flaring gas to control emissions from loading operations and emergency releases. Destruction efficiency of 98%. | 5 g bbl-1 | 0.01 | 5.4 g bbl-1 [23] | 0.011 |
| Gas Venting | Vents from Chemical Injector pumps (CI) and dehydrators (D). | CI 1519 kg/pump/y D 0.7 kg MMscf-1 |
0.5 0.01 |
CI 1577 kg pump-1 y-1 [30] D 181 kg CH4 MMm-3 NG [30] |
0.52 0.13 |
| Pneumatic Controllers |
Intermittent bleed | 1,386 kg/controller/y | 0.5 | 4643 kg/controller/y [30] | 1.67 |
| Fugitives | AVO LDAR only, plus methane detectors for manned facilities | 7.7 kg/h | 7.7 | 7.7 kg/h | 7.7 |
| Total | 9.17 | 10.3 |
Table 4.
Estimated emissions from Type 2 facilities during normal operations. Emission factors taken from the EPA emission factor database.
Table 4.
Estimated emissions from Type 2 facilities during normal operations. Emission factors taken from the EPA emission factor database.
| Equipment | Description | Emission factor | Emission (kg h-1) | Updated emission factors | Emission (kg h-1) |
| Gas Outlet | Pipelines transport gas back to shore | N/A | 0 | N/A | 0 |
| Oil/Condensate | Stored in atmospheric tanks inside the vessel hull, usually with vapor recovery. Shuttle/transportation tankers then offload and bring the oil to port. | N/A | 0 | N/A | 0 |
| Separators | 10 separators. High pressure separators, then condensate stabilization. | 968.5 kg/separator/y | 1.1 | 968.5 kg/separator/y | 1.1 |
| Hydrocarbon Storage Tanks | Oil tanks built into hull of vessel. Methane from flashing, working, and standing losses goes to vapor recovery. | 188 kg Mbbl-1 | 11.9 | 0.36 kg CH4 bbl-1 [23] | 23.3 |
| Water Storage Tanks | Water treated and then discharged or reinjected. Methane from flashing, working, and standing losses goes to vapor recovery. | 51 kg/Mbbls water | 2.1 | 0.415 g CH4 m-3 water [23] | 0.03 |
| Gas Flaring | Flare efficiency is assumed to be 98%. | 5 g bbl-1 | 0.3 | 5.4 g bbl-1 [23] | 0.32 |
| Gas Venting | Vents from Chemical Injector pumps (CI) and dehydrators (D). | CI 1519 kg/pump/y D 0.7 kg/MMscf |
0.7 0.03 |
CI 1577 kg pump-1 y-1 [30] D 181 kg CH4 MMm-3 NG [30] |
0.52 0.96 |
| Pneumatic Controllers | Generally, air instruments. | 1,386 kg/controller/y | 0.7 | 4643 kg/controller/y [30] | 2.3 |
| Compressors | Centrifugal. Dry gas seals. Assume similar to midstream compressors. | 16,118 kg/y | 1.8 | 58.3 kg CH4 y-1 [23] | 6.7 |
| Fugitives | AVO LDAR only, plus methane detectors for manned facilities | 23.4 kg/h | 23.4 | 23.4 kg/h | 23.4 |
| Total | 42.2 | 58.6 |
Disclaimer/Publisher’s Note: The statements, opinions and data contained in all publications are solely those of the individual author(s) and contributor(s) and not of MDPI and/or the editor(s). MDPI and/or the editor(s) disclaim responsibility for any injury to people or property resulting from any ideas, methods, instructions or products referred to in the content. |
© 2025 by the authors. Licensee MDPI, Basel, Switzerland. This article is an open access article distributed under the terms and conditions of the Creative Commons Attribution (CC BY) license (http://creativecommons.org/licenses/by/4.0/).
Copyright: This open access article is published under a Creative Commons CC BY 4.0 license, which permit the free download, distribution, and reuse, provided that the author and preprint are cited in any reuse.


