
Submitted:
27 September 2025
Posted:
30 September 2025
You are already at the latest version
Abstract
This study investigated event-related potential (ERP) markers—specifically P3 and Contingent Negative Variation (CNV)—elicited during the mental selection of motivational pictograms representing fundamental human needs, aiming to inform brain–computer interface (BCI) development for individuals with severe motor impairments (locked-in syndrome, LIS) including ocular movements. Methods: Stimuli were drawn from the PAIN Pictionary, an iconographic database designed for non-verbal communication in LIS contexts. Neural activity was recorded using high-density EEG in 30 neurologically healthy right-handed adults who consistently maintained gaze on the central fixation point. They viewed randomized sequences of pictograms representing ten need categories, with one category serving as the target in each sequence. Each pictogram was followed by a visual cue prompting a button press. During training, participants executed actual button presses; in the main task, they engaged in motor imagery, mentally simulating the press while maintaining fixation. Results: ERP analyses revealed a robust P300 over centro-parietal sites following target cues, reflecting attentional allocation and decision-making. Motor-related CNV activity emerged in left premotor regions, indexing anticipatory preparation of the right hand, and a late P600 was observed in response to prompts, consistent with stimulus choice and response monitoring. Conclusions: These findings demonstrate that pattern-onset ERP components can be modulated solely by motor imagery, independent of overt responses or gaze shifts, providing evidence that intentional, need-related communicative states can be decoded from EEG. Source reconstruction revealed that target-related motor imagery recruited a distributed network including prefrontal, premotor, motor, parietal, and limbic regions, integrating attentional, motor, and motivational processes. Collectively, these results establish a neural basis for BCIs enabling thought-driven communication in individuals with profound motor impairments.
Keywords:
EEG
; Brain-Computer Interface
; Motor potential
; Motor preparation
; P300 speller
; Locked-in syndrome
; Pictionary
; Transient Evoked Potential
; ERPs
1. Introduction
Brain–computer interfaces (BCIs) based on ERPs enable direct communication without muscular output [1,2,3,4]. Among these, the P300 speller [5] remains a benchmark paradigm, exploiting the transient parietal positivity elicited by rare, attended stimuli. Unlike steady-state approaches, P300-based spellers rely on brief onset events, most commonly flashes of rows, columns, or symbols, to elicit a discriminable response when the target is attended. Subsequent refinements have focused on optimizing these transient-onset designs to improve accuracy and usability. Variants such as the checkerboard paradigm [6], region-based stimulation [7], and rapid serial visual presentation [8], have reduced spatial confounds, alleviated visual fatigue, and extended applicability to users with restricted gaze control. Manipulations of stimulus salience—through changes in color, shape, or motion—have further enhanced the signal-to-noise ratio of the P300. A graphical interface of the SSVEP-based BCI system usually consists of different commands, e.g. letters or symbols (even faces, e.g., [9]), that flicker at specific frequencies. User pays attention to a particular flickering command, while ignoring others, which induces SSVEP with the corresponding frequency (e.g., [10,11,12]).
One of the unresolved methodological issues in BCI research concerns the role of ocular fixation in stimulus-driven paradigms. In steady-state visual evoked potential (SSVEP)–based BCIs, the absence of strict control over eye position makes it difficult to disentangle whether the elicited responses reflect genuine covert attentional selection or simply overt gaze shifts toward the target. At this regard, an ERP/BCI study was conducted [13] to examine the role of covert vs. overt visual spatial attention, eye gaze, in shaping P300 amplitudes for a BCI speller system. 24 healthy volunteers participated in the study, and their electroencephalogram and eye movements were recorded in three different experimental conditions: overt attention, covert attention, and gaze fixation. Results showed that performance was significantly lower in the covert attention condition (5% median accuracy compared to 90% with overt attention). Gaze fixation without allocation of attention yielded an 80% accuracy. This ambiguity is not trivial: if successful communication relies primarily on residual oculomotor control, such paradigms would be of limited utility for patients with severe motor impairment, particularly those in a locked-in state. In contrast, transient-onset P300 paradigms [14] allow for a more direct assessment of attentional selection mechanisms, independent of sustained fixation, thereby offering a potentially more robust framework for communication in populations with impaired gaze control.
Recently, ERPs have been employed to communicate motivational states through both visual pictograms and verbal commands [15,16,17]. Furthermore, a growing body of evidence indicates that ERPs can reliably reflect category-specific mental representations in immobilized and silent individuals, providing robust markers capable of discriminating between mental representations of multiple object classes. For example, studies have shown discriminable ERP patterns for ten different objects spanning faces, animals, language, and music [18], four objects including dogs, trees, and planes [19], as well as emotional facial expressions, such as happy versus neutral [20]. ERPs have also been shown to accurately predict six distinct visual categories—flowers, airplanes, cars, parks, sun, and old town—from neural responses [21]. In the present study, we implemented a carefully controlled experimental paradigm in which ocular fixation was strictly maintained, requiring participants to covertly select one class of target pictograms among six, each representing a fundamental physiological or psychological need. These targets were presented centrally in a pseudo-randomized sequence alongside distractors spanning ten distinct categories. Selection was carried out solely through cognitive intention, with participants merely imagining the act of pressing a key in response to a visual prompt. This design allowed us to isolate event-related potential (ERP) modulations specifically associated with selective attention, independent of overt eye movements, thereby offering a robust and adaptable framework for probing attentional mechanisms in individuals unable to execute ocular shifts.
2. Materials and Methods
2.1. Participants
Initial recruitment included 30 participants (15 males, 15 females), based on a priori power analysis (G*Power; δ ≥ 0.5, α = 0.05, Power = 0.8). Five were excluded due to incomplete tasks (n = 3) or excessive EEG noise and poor task engagement (n = 2). The final sample comprised twenty-five right-handed, neurotypical university students (14 males, 11 females; mean age = 22.08, SD = 2.49). All participants had completed upper secondary education; 10 held a master’s degree, 15 a bachelor’s degree. The sample was ethnically diverse: Latin American, Iranian (n = 3), Albanian (n = 2), Egyptian (n = 1), and Italian (n = 18). Exclusion criteria included psychiatric, neurological, or neurodevelopmental disorders, left-handedness, uncorrected visual impairments, and psychoactive substance use within 48 hours. Laterality was confirmed via the Salmaso and Longoni (1985) questionnaire (M = 0.815, SD = 0.13). Italian proficiency was not required, allowing participation of international students. The study was approved on February 17 2025 by the Department of Psychology Research Evaluation Committee (CRIP, protocol RM-2025-914) and funded by the Italian Ministry of University and Research (Grant 2023-NAZ-0206, PsyFuture – Department of Excellence 2023–2027).
2.2. Stimuli
Stimuli were selected from the previously validated “Motivational Pictionary” [22] comprising pictograms of young adult males and females expressing ten motivational states across four macrocategories: visceral needs, secondary needs, somatosensory sensations, and affective states. Validation in adults aged 18–33 demonstrated high communicative accuracy (98.4%), assessed via categorization tasks and Likert-scale clarity ratings. Pictograms were equiluminant, confirmed via repeated-measures ANOVA across micro- [F(11,44)=0.41, p=0.94] and macro-categories [F(3,12)=0.21, p=0.89], with mean luminance values (cd/m²) of 71.40, 74.50, 70.25, and 70.27 for visceral needs, secondary needs, somatosensory sensations, and affective states, respectively. Each microcategory comprised five variants illustrating the same motivational state in different ways. Three macrocategories were included in the experimental paradigm: visceral needs (hunger, thirst), somatosensory sensations (cold, pain), and secondary needs (music, movement), chosen for their relevance to homeostasis, basic care, and patient communication, including potential applications in BCI for non-communicative patients. From the affective category, only “fear” was included for its potential communicative value in clinical contexts. All pictograms depicted young adults approximately matched to the participant cohort. Motivational and emotional states were visually cued with small “speech clouds” to enhance interpretability (see Figure 1).
2.3. Procedure
The experimental paradigm consisted of 12 sequences programmed with Gentask for Neuroscan, each comprising 26 pictograms interleaved with a visual prompt—a hand with the index finger extended—serving as a constant reminder of task requirements. Participants were instructed to maintain their right index finger poised on the response pad and to engage in motor imagery of a button press whenever a target stimulus was recognized. Across the task, 312 pictograms (excluding prompts) were presented. Sequences were organized around six motivational states—hunger, thirst, cold, pain, music, and movement—each functioning as a target in two sequences, with 15 target presentations per state. Pictograms depicting heat, play, fear, and sleep served exclusively as additional non-target distractors. Sequence order was individually randomized to minimize habituation and order effects. Each pictogram was presented for 2000 ms, followed by a 750 ms inter-stimulus interval (ISI). Prompts were displayed for 500 ms, with an inter-trial interval (ITI) of 1750 ms. Stimuli subtended a visual angle of 6°47′16′′ × 4°46′37′′ on a monitor positioned 114 cm from the participant, who was instructed to maintain central fixation throughout. To this end, a fixation cross was permanently displayed at the center of the screen. Prior to data collection, a structured training phase was administered. Participants first performed overt responses to designated target states; subsequently, they practiced the required task of vividly imagining the motor response without executing it. Task comprehension was confirmed, and participants were reminded to remain still, comfortable, and to sustain vivid motor imagery in correspondence with the presentation of target-related pictograms. The experimental protocol entailed the presentation of 314 visual stimuli, comprising 90 target instances and 224 non-target instances. Taken together with the corresponding prompts, the paradigm encompassed 628 discrete events. The total duration of the EEG acquisition was approximately 40 minutes.
Following the experimental session, participants completed a subjective questionnaire assessing the vividness and ease of motor imagery and simulation. Specifically, participants were asked to assess both the ease and the perceived effectiveness of performing the simulated key press subsequent to their target choice. Ratings were provided on a 5-point Likert scale (1 = “not at all easy” to 5 = “very easy”). A repeated-measures ANOVA revealed a significant main effect of Need [F(5,145) = 3.463, p = 0.005], indicating that ratings differed across motivational conditions. They were highest for hunger and thirst (p<0.01), and weakly declined across the other conditions, though remaining within the effective range (Figure 2).
2.4. EEG Recordings and Analysis
EEG was acquired with a 128-channel [23] Compumedics Neuroscan system, referenced to linked mastoids and maintained at <5 kΩ. Ocular activity was monitored with horizontal and vertical EOG (bipolar montage, supraorbital and outer canthus). Signals were sampled at 500 Hz, band-pass filtered (0.016–50 Hz), and time-locked to stimulus onset via SynAmps 2/RT and Curry9. Trials exceeding ±50 μV were rejected; blinks were corrected (covariance reduction), and noisy channels (rarely) interpolated from four neighbors. Epochs were segmented into event-specific windows and analyzed in Curry9 and EEProbe. ERPs were derived by offline averaging. Mean area amplitude was computed at electrode clusters of interest, based on topographical maps and previous literature. P300 was quantified at Cz, CPz, Pz, CCPP1h, and CCPP2h (450–650 ms, cue) and at Cz, CPz, and Pz (600–800 ms, prompt). Early CNV to cues was measured at F9, F10, FT9, FT10, F11, F12 (450–750 ms), and late CNV at the same sites (2250–2750 ms). A frontocentral N400 was measured at F3, F4, FC5, FC6 sites in response to prompts. For each component, three-way repeated-measures ANOVAs tested Targetness (target/non-target), Electrode, and Hemisphere (left/right) effects, separately for pictogram and prompt responses.
Tukey post-hoc comparisons were carried out to test differences among means. The effect size for the statistically significant factors was estimated using partial Eta Squared (ηp2) and the Greenhouse-Geisser correction was applied to account for non-sphericity of the data.
2.5. Source Reconstruction
In order to identify the intracranial sources explaining the surface electrical potentials Standardized low-resolution electromagnetic tomography (sLORETA; [24]) was performed on ERP voltages. In particular, LORETA was applied to mean voltages in the 450–750 ms, and in the 2250-2750 ms intervals following target pictogram presentation, to capture the emergence of the contingent negative variation (CNV), and in the 600–800 ms interval following prompt onset, to capture the decision-related P3 response. LORETA is a discrete linear solution to the inverse EEG problem, and it corresponds to the 3D distribution of neural electric activity that maximises similarity (i.e. maximises synchronisation) in terms of orientation and strength between neighbouring neuronal populations (represented by adjacent voxels). In this study, an improved version of standardized weighted low-resolution brain electromagnetic tomography was used (swLORETA, [25]), which incorporates a singular value decomposition-based lead field weighting method. The source space properties included: localization within the grey matter; a grid spacing of 5 points (the distance between 2 calculation points) and an estimated signal-to-noise ratio (SNR) of 3, which defines the regularisation (higher values indicating less regularisation and therefore less blurred results). Using a value of 3-4 for SNR computation in Tikhonov’s regularisation results in superior accuracy for all assessed inverse problems. swLORETA was performed on the grand-averaged data to identify statistically significant electromagnetic dipoles (p < .05) in which larger magnitudes correlated with more significant activation.
The data were automatically re-referenced to the average reference (CAR) as part of the LORETA analysis. A realistic boundary element model (BEM) was derived from a T1-weighted 3D MRI dataset through segmentation of the brain tissue. This BEM model consisted of a homogeneous compartment comprising 3446 vertices and 6888 triangles. Advanced source analysis (ASA) employs a realistic head model of three layers (scalp, skull and brain) created using the boundary element model. This realistic head model comprises a set of irregularly shaped boundaries and the conductivity values for the compartments between them. Each boundary is represented by a series of interconnected points, forming plane triangles to create an approximation. The triangulation leads to a more or less evenly distributed mesh of triangles as a function of the chosen grid value. A smaller value for the grid spacing results in finer meshes and vice versa. With the aforementioned realistic head model of three layers, the segmentation is assumed to include current generators of brain volume, including both grey and white matter. Scalp, skull, and brain region conductivities were assumed to be 0.33, 0.0042 and 0.33, respectively. The source reconstruction solutions were projected onto the 3D MRI of the Collins brain, which was supplied by the Montreal Neurological Institute. The probabilities of source activation based on Fisher’s F test were provided for each independent EEG source, whose values are indicated in a “unit” scale in nA (the larger the value, the more significant the activation). It should be noted, however, that the spatial resolution of swLORETA is somewhat limited compared to other neuroimaging techniques like MEG or fMRI. Both the head model’s segmentation and generation were conducted through the use of Advanced Neuro Technology, a software program developed by ASA [26].
3. Results
3.1. Electrophysiological Results
The P300 component to pictograms was analyzed at centroparietal sites within the 450–650 ms post-stimulus interval. A repeated-measures ANOVA on mean area amplitudes elicited by pictograms revealed a significant main effect of Targetness [F(1,24) = 20.02, p < 0.00016, ε = 1; ηp2 = 0.46] with much larger P300s to target (M = −0.91 μV, SE = 1.48) than non-target cues (M = −3.54 μV, SE = 1.06), as can be appreciated in Figure 3 and Table 1.
The ANOVA performed on CNV negative potential in the time window between 450–750 ms over the fronto-lateral and inferior fronto-temporal regions, the ANOVA revealed a significant main effect of Targetness [F(1,24) = 8.39, p = 0.0079; ε = 1; ηp2 = 0.26], with larger amplitudes to target (–5.27 µV, SE = 0.70) than non-target cues (–4.28 µV, SE = 0.79).
Based on the grand averages, isocolour topographical voltage maps of the Early CNV component were generated, showing a predominantly anterior distribution of the motor readiness potential (see Figure 4B).
A Late negativity was quantified on the same sites within the 2250-2750 ms time window. The ANOVA yielded the significance of Targetness x Hemisphere [F(1,24) = 5.02, p < 0.035, ε = 1; ηp2 = 0.17] with much larger negativity to target than non-target pictograms only over the left hemisphere, as shown by post-hoc comparisons among means (see Table 1 and Figure 4C).
An anterior N400 was quantified over medial prefrontal sites in the 300-500 ms time window in response to prompts. The ANOVA showed no significance of targetness [F(1,24) = 0.006, p= 0.94]. A P600 was quantified over centro/parietal sites in the 600-800 ms time window in response to prompts (Figure 5). The ANOVA showed the significance of targetness [F(1,24) = 4.52, p = 0.0439; ε =1; ηp2 = 0.16], with larger responses to target ( 2.58 μV, SE = 1) than non-target prompts (1.19 μV, SE = 1.2).
3.2. Results – Source Localization (swLORETA)
According to swLORETA the early CNV (450–750 ms) to target pictograms was primarily generated within bilateral frontal cortices, including the superior and middle frontal gyri (BA10, BA46), regions classically implicated in decision-making and selective attention (see Table 2 for a list of active electromagnetic dipoles and Figure 6A for neuroimaging data). Concurrent activation in premotor regions (BA6) of both hemispheres indicated preparatory motor activity linked to imagined button presses. Temporal lobe sources, particularly in the fusiform (BA37), superior (BA38, BA22), and inferior temporal gyri (BA20–21), supported processes of pictogram recognition and selective attention to socially or bodily relevant features. Together, these activations suggest an early integration of attentional selection, semantic/pictorial analysis, and motor readiness during motivational cue processing.
The late CNV (2250–2750 ms) revealed a stronger recruitment of frontal generators, with sustained activation of superior and middle frontal cortices (BA9–10), consolidating decision-making processes (see Table 3 and Figure 6b). Temporal activations (BA20–22, BA38) reflected ongoing pictogram decoding with contributions from regions associated with socio-emotional and motivational content.
Importantly, motor-related sources emerged more prominently at this stage, including premotor (BA6) and primary motor regions (BA4), alongside parietal sites (supramarginal gyrus, BA40) involved in embodiment and mirror neuron mechanisms. These results indicate a transition from attentional and semantic processing toward motor planning and preparation for intentional responses.
Finally, the P600 (600–800 ms) to response prompts engaged medial frontal generators (BA6, BA10), consistent with motor imagery, decision-making, and evaluative processes (see Table 4 and Figure 6c). Subcortical activations, particularly within the globus pallidus, together with limbic regions (uncus, insula), pointed to motivational and reward-related mechanisms. Additional fusiform and parietal activations (BA37, BA40) supported visuomotor embodiment and mirror neuron activity, while inferior frontal (BA47) and superior temporal sources (BA41–22) suggested involvement in motivational drive, craving, and inner speech. Overall, the P600 reflected an integration of decisional, motor, and motivational networks, consolidating the intentional selection of communicative acts.
4. Discussion
The present findings delineate a nuanced neural differentiation between target and non-target pictograms, underscoring the brain’s capacity to modulate attentional and motor preparatory processes in response to behaviorally salient stimuli. The pronounced P300 component observed at centroparietal sites signifies enhanced attentional allocation and context updating mechanisms, aligning with established interpretations of P300 as a marker of cognitive evaluation and resource allocation.
Early CNV amplitudes, recorded between 450-750 ms over fronto-lateral and inferior fronto-temporal regions, were notably augmented for target stimuli, suggesting the engagement of prefrontal and premotor areas in anticipatory motor preparation [27]. This anterior distribution of the early CNV component reflects the brain’s proactive stance in preparing for forthcoming motor actions, consistent with models of motor readiness [2,3,28,29,30,31]. The late CNV, quantified between 2250-2750 ms, exhibited a lateralized pattern, with enhanced negativity for target stimuli predominantly in the left hemisphere, controlling the right responding hand [31]. This lateralization implicates the contralateral motor cortex in the final stages of motor planning, highlighting the embodied nature of motor preparation processes. The P600 component elicited by response prompts further corroborates the integration of motor planning with evaluative and motivational processes. The amplified P600 response to target prompts suggests that motor imagery is intricately coupled with motivational and reward-related circuits, facilitating the translation of cognitive intentions into potential communicative actions.
Collectively, these ERP findings delineate a coherent temporal progression from attentional orienting (P300) and early motor readiness (early CNV) to lateralized motor preparation (late CNV) and evaluative integration (P600). This sequence underscores the sensitivity of ERP components to covert, intentional, and motivationally guided cognitive states, reinforcing their utility in brain-computer interface paradigms where overt motor responses or eye movements are constrained.
Source localization revealed that target pictograms engaged a distributed fronto-temporal network supporting decision-making, selective attention, and motor preparation. Early CNV generators included dorsolateral and superior frontal cortices (BA10, BA46), premotor regions (BA6), and temporal sites involved in pictogram recognition, indicating rapid integration of attentional and motor readiness signals. Late CNV sources extended into primary motor and parietal cortices (BA4, BA40), reflecting embodied motor planning. These circuits are very similar to the ones subtending the generation of CNV signals during overt motor actions [32,33], including the shift toward prefrontal cortex, middle frontal cortex and primary motor cortex for the late CNV stage (e.g. [34]). Critically, the P600 to prompts recruited medial frontal and limbic structures, including the globus pallidus and insula, suggesting that motor imagery was tightly coupled with motivational and reward-related processes. The dorsal premotor cortex (PMd) is pivotal for selecting and preparing movements [35,36]. Functional imaging studies reveal a lateralization of PMd activity: the left PMd is engaged during movements of both hands, whereas the right PMd shows stronger activation predominantly during left-hand movements, with the exact pattern modulated by task demands. Furthermore, a large literature predicts involvement of the superior and medial prefrontal cortex BA10, one of the strongest active source for all ERP components, in higher-order decision-making processes, including choice selection and response initiation [37,38]. It is possible to identify clear distinctions between motor imagery and overt action: empirical evidence indicates that actual movements elicit more focal contralateral M1 activation [39], greater engagement of cerebellar [40] and subcortical circuits supporting coordination and timing, attenuated parietal “mirror-like” activity [41], and a reduced contribution from limbic regions as motivational processes yield to sensorimotor control.
Finally, it is important to emphasize that, within this paradigm, participants maintained strict fixation throughout the task, ensuring that no overt eye movements contributed to the observed effects—unlike in standard P300-speller paradigms, where eye gaze is not systematically controlled. In paradigms where fixation is not enforced, as is typical in SSVEP studies (e.g., [42,43]), a confounding interaction emerges between overt attentional deployment and ocular gaze (see [13,44]), such that the advantages of BCI performance may be restricted to patients capable of executing eye movements. Thus, attentional orienting in this task was purely covert and gaze-independent, demonstrating that intentional, motivationally grounded communicative states can be decoded directly from distributed cortical and subcortical networks without reliance on ocular control.
5. Conclusions
The present study demonstrates that covert, gaze-independent motor imagery elicits a distributed fronto-temporal-parietal network encompassing prefrontal, motor, and limbic regions, reflecting the integration of attentional, motivational, and motor preparation processes. Notably, this paradigm allows for decoding intentional communicative states without reliance on eye movements or overt motor output. In comparison to overt actions, which predominantly activate contralateral M1 and subcortical motor circuits while diminishing limbic contribution, this approach offers a robust and flexible alternative to conventional P300-speller or motor-based BCI paradigms. These findings underscore the potential of utilizing motivationally grounded, covert neural signals for BCI applications, facilitating more natural and efficient communication channels for individuals with severe motor impairments. The high statistical significance of the analysis of variance applied to individual ERP signals reveals a pronounced similarity among the neuroelectrical markers, indicating a promising potential for optimal usability in BCI applications.
Study limitations
Several limitations of the present study should be acknowledged. First, the sample size was relatively small, which may limit the generalizability of the findings. Second, the study focused exclusively on healthy participants, leaving open questions about the applicability of the results to patient populations with neurological impairments. It should also be noted that our sample consisted of university students, who may be cognitively more capable than individuals in a minimally conscious state or with brain lesions—a common characteristic in many BCI studies, which may influence the generalizability of findings to clinical populations. Finally, the study design relied on a single experimental paradigm, and further research is needed to confirm whether the observed neuroelectrical patterns and the associated potential for BCI usability extend across different paradigms and real-world settings.
Author Contributions
Conceptualization, A.M.P.; methodology, A.M.P. and Y.D.; formal analysis, Y.D.; investigation, A.M.P. and Y.D.; resources, A.M.P.; data curation, Y.D. and A.M.P.; writing—original draft preparation, A.M.P. All authors have read and agreed to the published version of the manuscript.”
Funding
This research was funded by the Italian Ministry of University and Research under Grant No. 2023-NAZ-0206, PsyFuture – Dipartimento di Eccellenza 2023-2027, awarded to the Department of Psychology of the University of Milano-Bicocca.
Institutional Review Board Statement
The study was conducted in accordance with the Declaration of Helsinki, and approved by the Department of Psychology Research Evaluation Committee (CRIP, protocol RM-2025-914) for studies involving humans, on February 17 2025.
Informed Consent Statement
Informed written consent was obtained from all subjects involved in the study.
Data Availability Statement
All data supporting the findings of this study are included within the article. Additional information is available from the author upon reasonable request, particularly to support scientific collaboration (e.g., for single-trial P3 or CNV classification, development and implementation of a prototype).
Acknowledgments
We are grateful to Francesca Pischedda, Giulia Gnecchi, Nafiseh Shabani, Pasquale Scognamiglio and Milos Milovanovic for their support.
Conflicts of Interest
The authors declare no conflicts of interest. The funders had no role in the design of the study; in the collection, analyses, or interpretation of data; in the writing of the manuscript; or in the decision to publish the results.
Abbreviations
The following abbreviations were used in this manuscript:
| ANOVA | Analysis of Variance |
| ASA | Advanced Source Analysis |
| BCI | Brain-Computer Interface |
| BEM | Boundary element model |
| CAR | Common Average Reference |
| CNV | Contingent Negative Variation |
| EBL | Emotional Body Language |
| EEG | Electroencephalogram |
| EOG | Electro-oculogram |
| ERP | Event-Related Potential |
| ISI | Inter-stimulus Interval |
| ITI | Inter-trial interval |
| LIS | Locked-in syndrome |
| LORETA | Low-Resolution Electromagnetic Tomography |
| MRI | Magnetic Resonance Imaging |
| SE | Standard Error |
| SSVEP | Steady-state visual evoked potential |
References
- Herbert, C. Analyzing and computing humans by means of the brain using Brain-Computer Interfaces. Front Hum Neurosci. 2024, 17, 1286895. [Google Scholar] [CrossRef]
- Arns, M.; Sokhadze, E.; Birbaumer, N. Neurofeedback and Brain-Machine Interfaces: Where are We Now? Appl Psychophysiol Biofeedback. 2025. [CrossRef] [PubMed]
- Chaudhary, U.; Mrachacz-Kersting, N.; Birbaumer, N. Neuropsychological and neurophysiological aspects of brain-computer-interface (BCI) control in paralysis. J Physiol. 2021, 599, 2351–2359. [Google Scholar] [CrossRef] [PubMed]
- Wolpaw, J.R.; Birbaumer, N.; McFarland, D.J.; Pfurtscheller, G.; Vaughan, T.M. Brain-computer interfaces for communication and control. Clin Neurophysiol. 2002.
- Farwell, L.A.; Donchin, E. Talking off the top of your head: toward a mental prosthesis utilizing event-related brain potentials. Electroencephalography and Clinical Neurophysiology. 1988, 70, 510–523. [Google Scholar] [CrossRef]
- Townsend, G.; LaPallo, B.K.; Boulay, C.B.; Krusienski, D.J.; Frye, G.E.; Hauser, C.K.; Schwartz, N.E.; Vaughan, T.M.; Wolpaw, J.R.; Sellers, E.W. A novel P300-based brain-computer interface stimulus presentation paradigm: moving beyond rows and columns. Clin Neurophysiol. 2010, 121, 1109–20. [Google Scholar] [CrossRef]
- Treder, M.S.; Blankertz, B. (C)overt attention and visual speller design in an ERP-based brain-computer interface. Behav Brain Funct. 2010, 6, 28. [Google Scholar] [CrossRef]
- Acqualagna, L.; Blankertz, B. Gaze-independent BCI-spelling using rapid serial visual presentation (RSVP). Clin Neurophysiol. 2013, 124, 901–8. [Google Scholar] [CrossRef]
- Bakardjian, H.; Tanaka, T.; Cichocki, A. Emotional faces boost up steady-state visual responses for brain-computer interface. Neuroreport. 2011, 22, 121–5. [Google Scholar] [CrossRef]
- Kuś, R.; Duszyk, A.; Milanowski, P.; Łabęcki, M.; Bierzyńska, M.; Radzikowska, Z.; Michalska, M.; Zygierewicz, J.; Suffczyński, P.; Durka, P.J. On the quantification of SSVEP frequency responses in human EEG in realistic BCI conditions. PLoS One. 2013, 8, e77536. [Google Scholar] [CrossRef]
- Pang, Z.; Zhang, R.; Li, M.; Li, Z.; Cui, H.; Chen, X. SSVEP-based BCI using ultra-low-frequency and high-frequency peripheral flickers. J Neural Eng. 2025, 22. [Google Scholar] [CrossRef]
- Siribunyaphat, N.; Tohkhwan, N.; Punsawad, Y. Investigation of Personalized Visual Stimuli via Checkerboard Patterns Using Flickering Circles for SSVEP-Based BCI System. Sensors (Basel). 2025, 25, 4623. [Google Scholar] [CrossRef]
- Pronina, A.; Grigoryan, R.; Makarova, A.; et al. Spatial Attention Effects on P300 BCI Performance: ERP and Eye-Tracking Study. Moscow Univ. Biol.Sci. Bull. 2023, 78, 255–262. [Google Scholar] [CrossRef]
- Leoni, J.; Tanelli, M.; Strada, S.; Brusa, A.; Proverbio, A.M. Single-Trial Stimuli Classification from Detected P300 for Augmented Brain-Computer Interface: a Deep Learning Approach. Machine Learning with Applications. 2022, 2022, 100393. [Google Scholar] [CrossRef]
- Colafiglio, T.; Lombardi, A.; Di Noia, T.; De Bonis, M.L.N.; Narducci, F.; Proverbio, A.M. Machine learning classification of motivational states: Insights from EEG analysis of perception and imagery. Expert Systems with Applications 2025, 275, 127076. [Google Scholar] [CrossRef]
- Della Vedova, G.; Proverbio, A.M. Neural signatures of imaginary motivational states: desire for music, movement and social play. Brain Topography. 2024. [CrossRef] [PubMed]
- Proverbio, A.M.; Pischedda, F. Measuring brain potentials of imagination linked to physiological needs and motivational states. Front. Hum. Neurosci. 2023, 17, 1146789. [Google Scholar] [CrossRef]
- Leoni, J.; Strada, S.C.; Tanelli, M.; Proverbio, A.M. MIRACLE: MInd ReAding CLassification Engine. IEEE Trans Neural Syst Rehabil Eng. 2023, PP. [Google Scholar] [CrossRef]
- Costa, F.R.L.; Iáñez, E.; Azorín, J.M.; et al. Classify four imagined objects with EEG signals. Evol. Intel. 2022, 15, 1657–1666. [Google Scholar] [CrossRef]
- Nemrodov, D.; Niemeier, M.; Patel, A.; Nestor, A. The Neural Dynamics of Facial Identity Processing: Insights from EEG-Based Pattern Analysis and Image Reconstruction. eNeuro. 2018, 5, ENEURO.0358-17.2018. [Google Scholar] [CrossRef]
- Cudlenco, N.; Popescu, N.; Leordeanu, M. Reading into the mind’s eye: Boosting automatic visual recognition with EEG signals. Neurocomputing 2020, 386, 281–292. [Google Scholar] [CrossRef]
- Proverbio, A.M.; Pischedda, F. Validation of a Pictionary-based communication tool for assessing individual needs and motivational states in locked-in patients: P. A.I.N. set. Front. Cogn. Section Percept. 2023. [CrossRef]
- Oostenveld, R.; Praamstra, P. The five percent electrode system for high-resolution EEG and ERP measurements. Clin Neurophysiol. 2001, 112, 713–9. [Google Scholar] [CrossRef]
- Pascual-Marqui, R.D. Standardized low-resolution brain electromagnetic tomography (sLORETA): technical details. Methods Find Exp Clin Pharmacol. 2002, 24 Suppl D, 5–12. [Google Scholar] [PubMed]
- Palmero-Soler, E.; Dolan, K.; Hadamschek, V.; Tass, P.A. swLORETA: a novel approach to robust source localization and synchronization tomography. Phys Med Biol. 2007, 52, 1783–800. [Google Scholar] [CrossRef]
- Zanow, F.; Knösche, T.R. ASA--Advanced Source Analysis of continuous and event-related EEG/MEG signals. Brain Topogr. 2004, 16, 287–90. [Google Scholar] [CrossRef] [PubMed]
- Lamm, C.; Windischberger, C.; Leodolter, U.; Moser, E.; Bauer, H. Evidence for premotor cortex activity during dynamic visuospatial imagery from single-trial functional magnetic resonance imaging and event-related slow cortical potentials. Neuroimage. 2001, 14, 268–83. [Google Scholar] [CrossRef] [PubMed]
- Hinterberger, T.; Schmidt, S.; Neumann, N.; Mellinger, J.; Blankertz, B.; Curio, G.; Birbaumer, N. Brain-computer communication and slow cortical potentials. IEEE Trans Biomed Eng. 2004, 51, 1011–8. [Google Scholar] [CrossRef]
- Birbaumer, N.; Hinterberger, T.; Kübler, A.; Neumann, N. The thought-translation device (TTD): neurobehavioral mechanisms and clinical outcome. IEEE Trans Neural Syst Rehabil Eng. 2003, 11, 120–3. [Google Scholar] [CrossRef]
- Becerra-Casillas, O.A.; Diaz-Lozano, K.A.; Galvan-Guerrero, H.M.; Huidobro, N.; Romo-Vazquez, R.; Treviño, M.; Osuna-Carrasco, P.; Toro-Castillo, M.D.C.; de la Torre-Valdovinos, B. Temporal downscaling of movement reveals duration-dependent modulation of motor preparatory potentials in humans. Neuroscience 2025, 583, 157–170. [Google Scholar] [CrossRef]
- Hirose, S.; Nambu, I.; Naito, E. Cortical activation associated with motor preparation can be used to predict the freely chosen effector of an upcoming movement and reflects response time: An fMRI decoding study. Neuroimage. 2018, 183, 584–596. [Google Scholar] [CrossRef]
- Bares, M.; Nestrasil, I.; Rektor, I. The effect of response type (motor output versus mental counting) on the intracerebral distribution of the slow cortical potentials in an externally cued (CNV) paradigm. Brain Res Bull. 2007, 71, 428–35. [Google Scholar] [CrossRef] [PubMed]
- Gómez, C.M.; Delinte, A.; Vaquero, E.; Cardoso, M.J.; Vázquez, M.; Crommelinck, M.; Roucoux, A. Current source density analysis of CNV during temporal gap paradigm. Brain Topogr. 2001, 13, 149–59. [Google Scholar] [CrossRef] [PubMed]
- Gómez, C.M.; Marco, J.; Grau, C. Preparatory visuo-motor cortical network of the contingent negative variation estimated by current density. Neuroimage. 2003, 20, 216–24. [Google Scholar] [CrossRef] [PubMed]
- Beck, S.; Houdayer, E.; Richardson, S.P.; Hallett, M. The role of inhibition from the left dorsal premotor cortex in right-sided focal hand dystonia. Brain Stimul. 2009, 2, 208–14. [Google Scholar] [CrossRef]
- Rushworth, M.F.; Johansen-Berg, H.; Gobel, S.M.; Devlin, J.T. The left parietal and premotor cortices: motor attention and selection. Neuroimage. 2003, 20 (Suppl S1), S89–100. [Google Scholar] [CrossRef]
- Forstmann, B.U.; Wolfensteller, U.; Derrfuss, J.; Neumann, J.; Brass, M.; Ridderinkhof, K.R.; von Cramon, D.Y. When the choice is ours: context and agency modulate the neural bases of decision-making. PLoS One. 2008, 3, e1899. [Google Scholar] [CrossRef]
- Deppe, M.; Schwindt, W.; Kugel, H.; Plassmann, H.; Kenning, P. Nonlinear responses within the medial prefrontal cortex reveal when specific implicit information influences economic decision making. J Neuroimaging. 2005, 15, 171–82. [Google Scholar] [CrossRef]
- van den Berg, F.E.; Swinnen, S.P.; Wenderoth, N. Involvement of the primary motor cortex in controlling movements executed with the ipsilateral hand differs between left- and right-handers. J Cogn Neurosci. 2011, 23, 3456–69. [Google Scholar] [CrossRef]
- Viaro, R.; Bonazzi, L.; Maggiolini, E.; Franchi, G. Cerebellar Modulation of Cortically Evoked Complex Movements in Rats. Cereb Cortex. 2017, 27, 3525–3541. [Google Scholar] [CrossRef]
- Molenberghs, P.; Cunnington, R.; Mattingley, J.B. Brain regions with mirror properties: a meta-analysis of 125 human fMRI studies. Neurosci Biobehav Rev. 2012, 36, 341–9. [Google Scholar] [CrossRef] [PubMed]
- Friman, O.; Volosyak, I.; Gräser, A. Multiple channel detection of steady-state visual evoked potentials for brain-computer interfaces. IEEE Transactions on Biomedical Engineering 2007, 54, 742–750. [Google Scholar] [CrossRef]
- Volosyak, H.; Cecotti, H.; Valbuena, D.; Gräser, A. (2009). Evaluation of the Bremen SSVEP based BCI in real world conditions. In Proceedings of the 2009 IEEE International Conference on Rehabilitation Robotics (pp. 322–331). IEEE. [CrossRef]
- Allison, B.Z.; Kübler, A.; Jin, J. 30+ years of P300 brain-computer interfaces. Psychophysiology. 2020, 57, e13569. [Google Scholar] [CrossRef]
Figure 1.
Experimental trial structure. Each trial began with the presentation of a pictogram stimulus (2000 ms), followed by an inter-stimulus interval (ISI; 750 ms). A response prompt was then displayed (500 ms), after which an inter-trial interval (ITI; 1750 ms) occurred before the onset of the next trial.
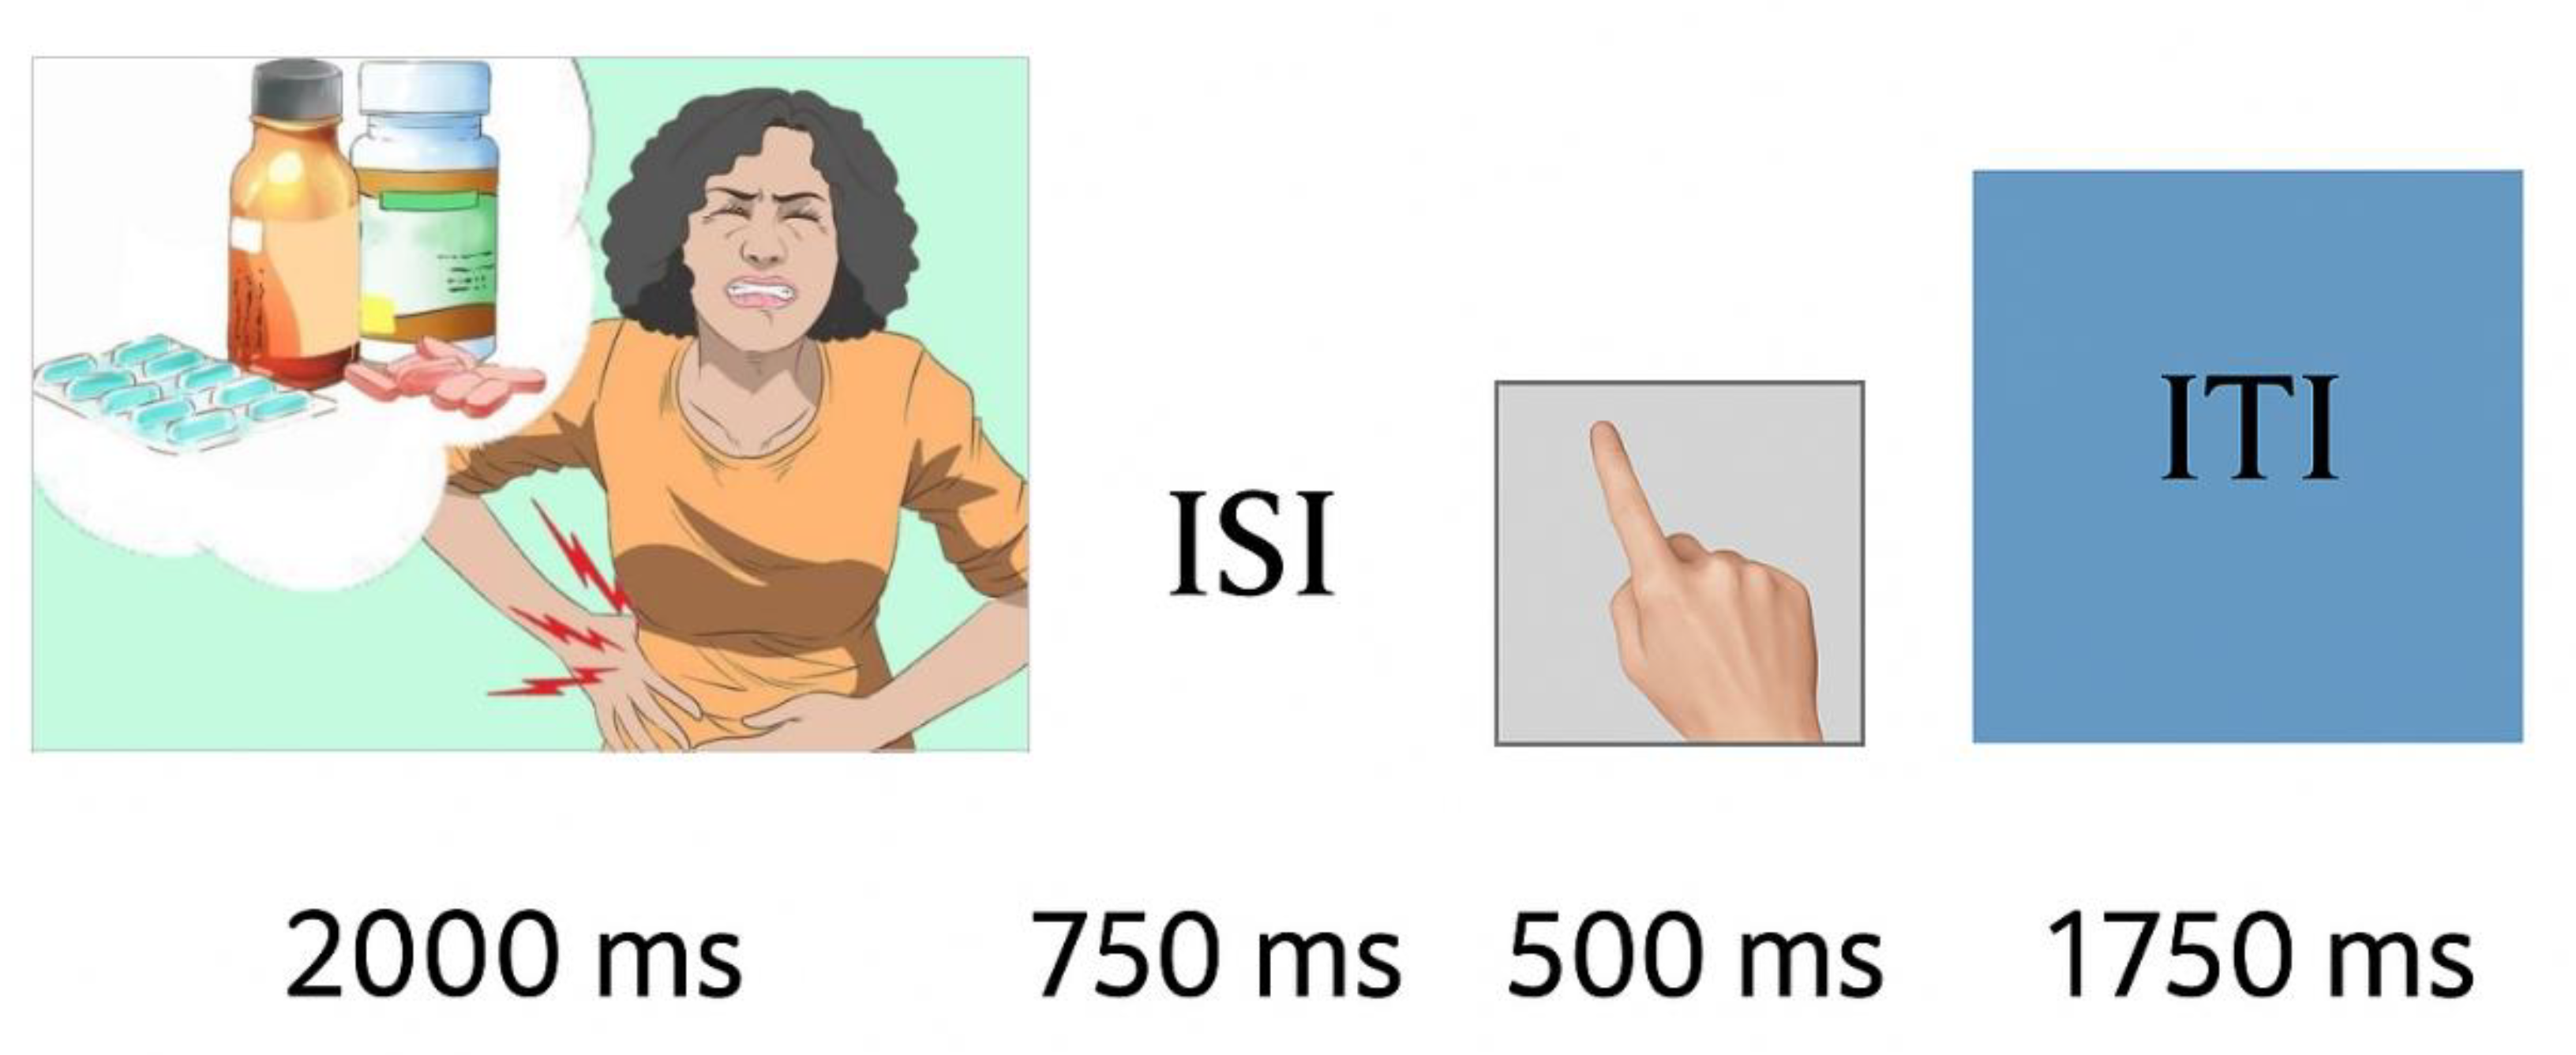
Figure 2.
Perceived task efficacy. Mean ratings of simulation efficacy (y-axis) are shown for six categories of needs (x-axis): food, drink, painkiller, warmth, movement, and music. Data points represent mean values, with error bars indicating standard errors of the mean. Overall, participants judged simulations as moderately to highly effective, with drink and warmth needs rated as relatively more efficacious than painkiller, movement, and music.
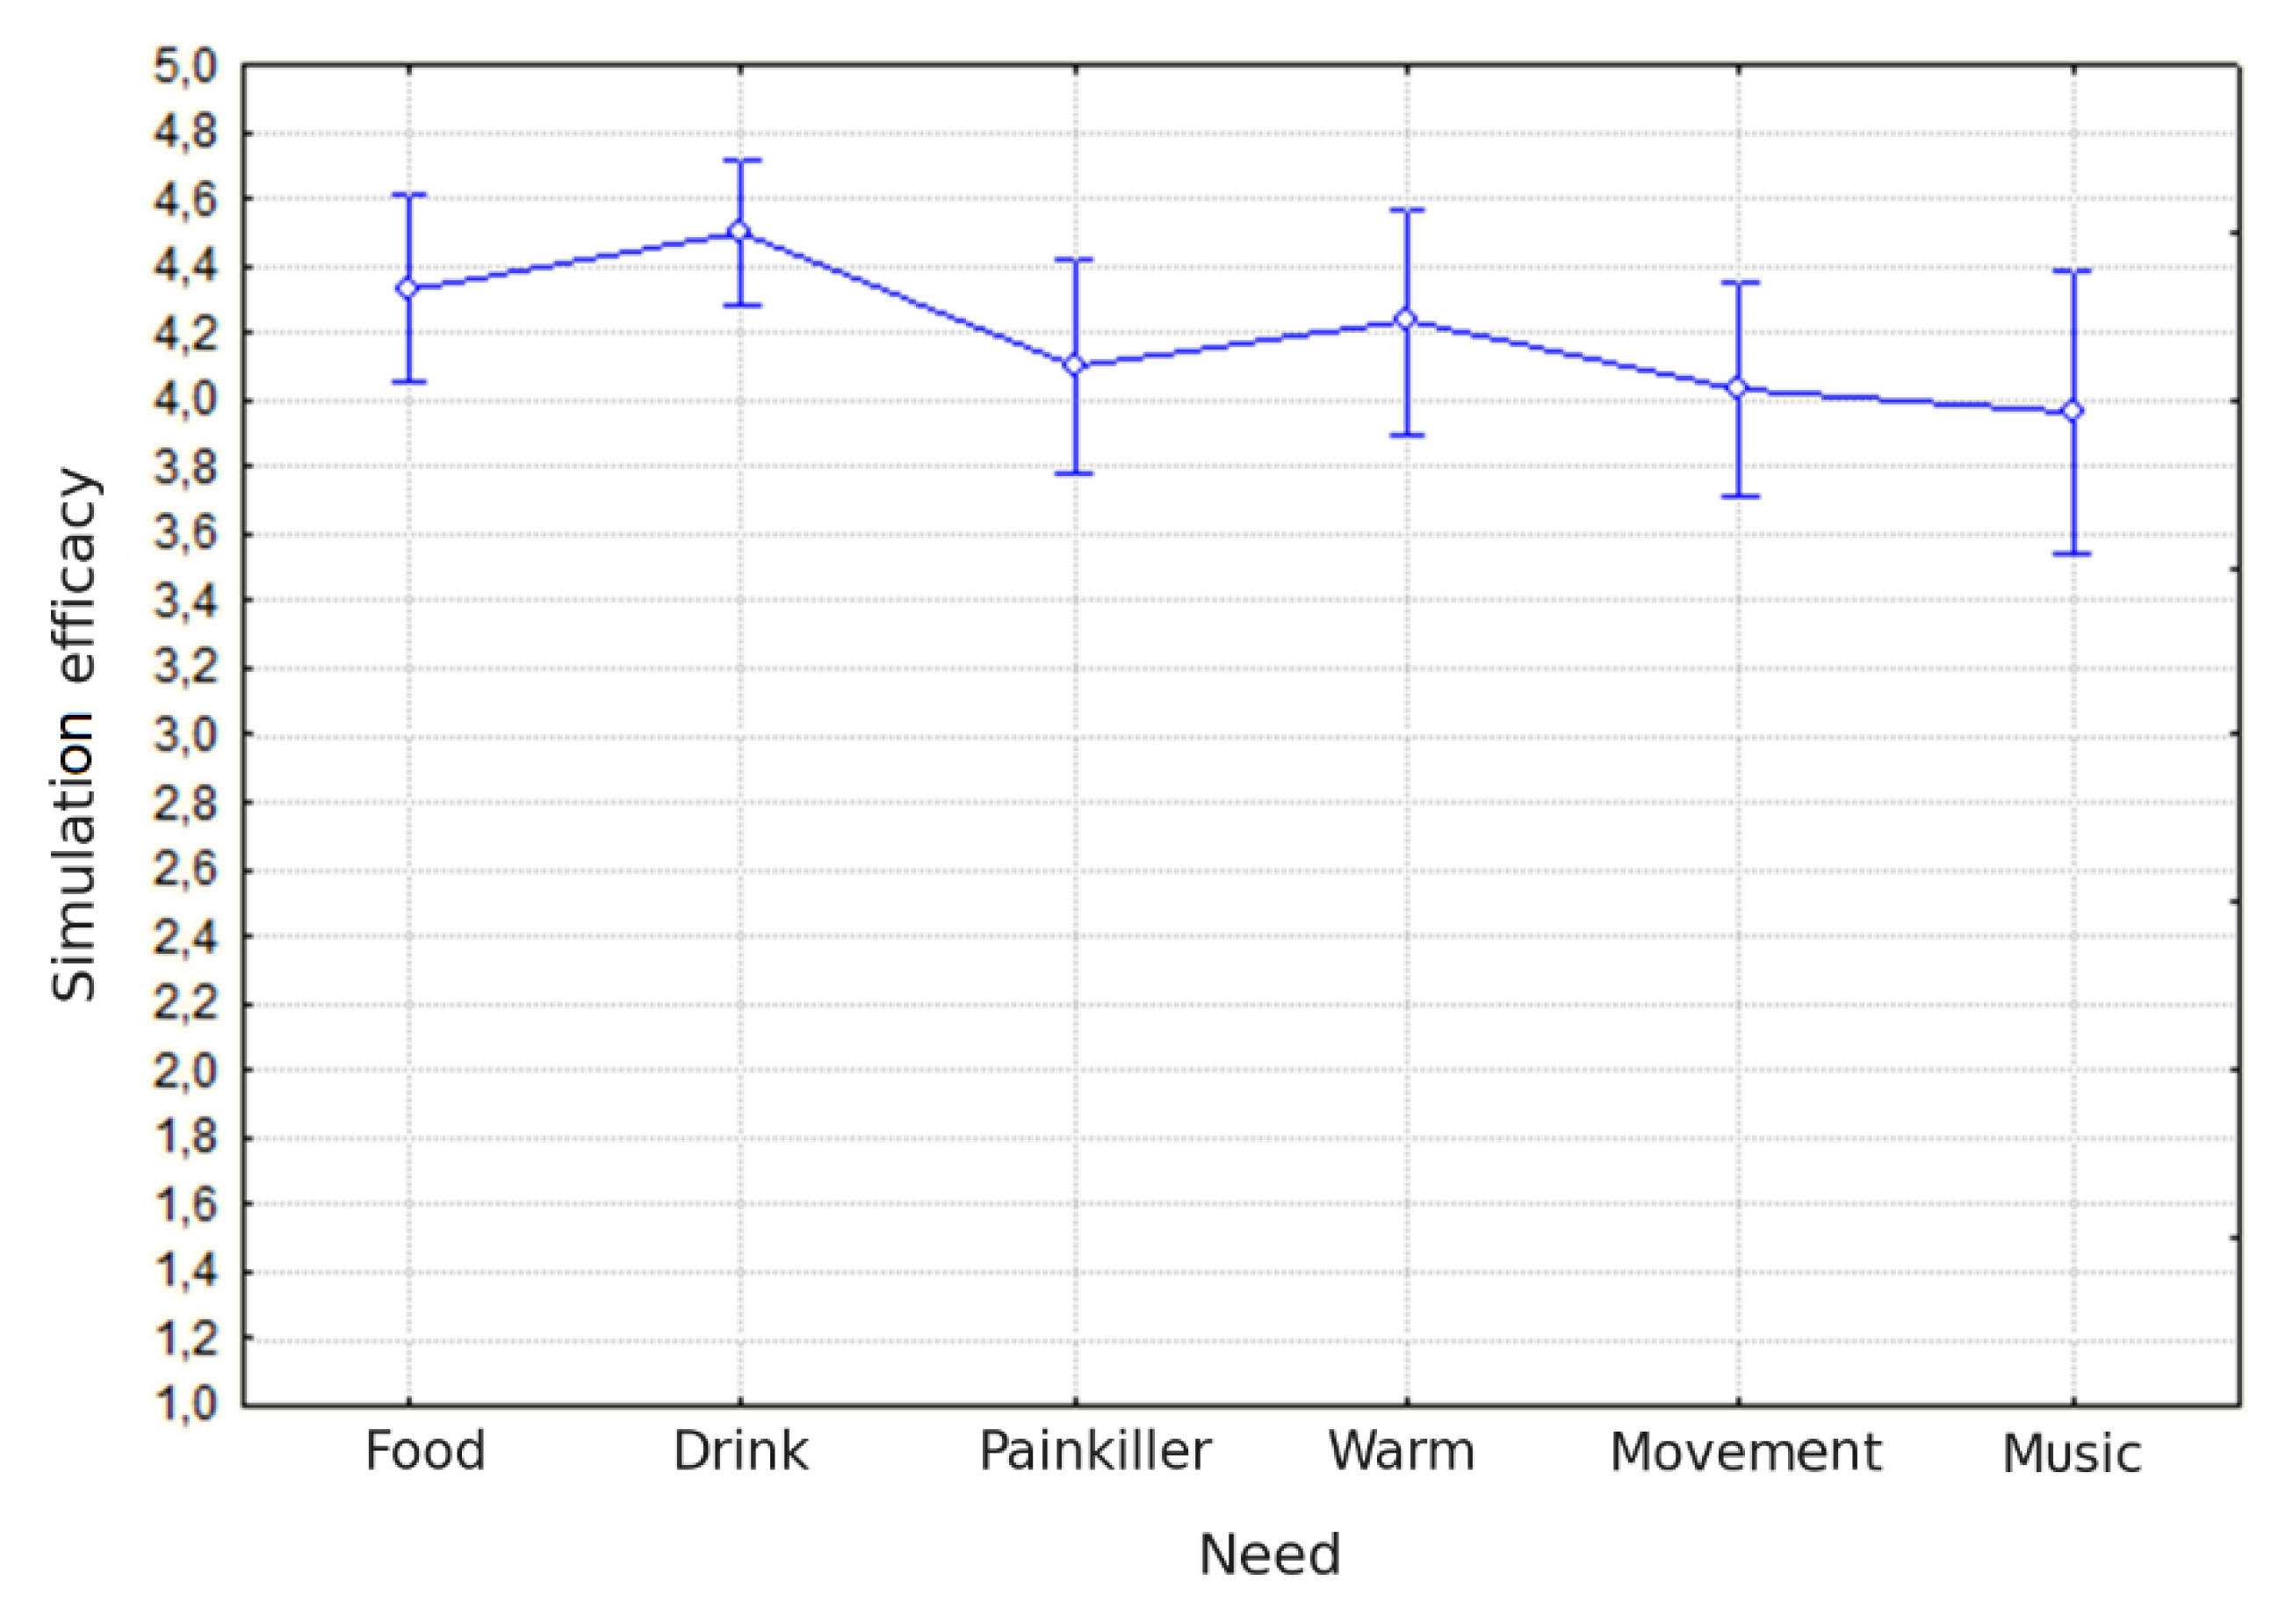
Figure 3.
ERPs to pictograms: P300. (a) Grand-average ERP waveforms are shown for representative centro-parietal and parietal electrodes (C1, Cz, C2, CCP1h, CPz, CCP2h, CP1, Pz, CP2, CPP1h, CPP2h, P1, P2) for target (black) and non-target (red) stimuli. Time (s) is plotted on the x-axis and amplitude (µV) on the y-axis. Robust P300 components are evident at posterior sites for target relative to non-target stimuli. (b) Scalp topographies (right) illustrate the statistical distribution of the target vs. non-target difference between 450–650 ms, with maximal positivity over centro-parietal regions. The color scale represents voltage differences (µV).
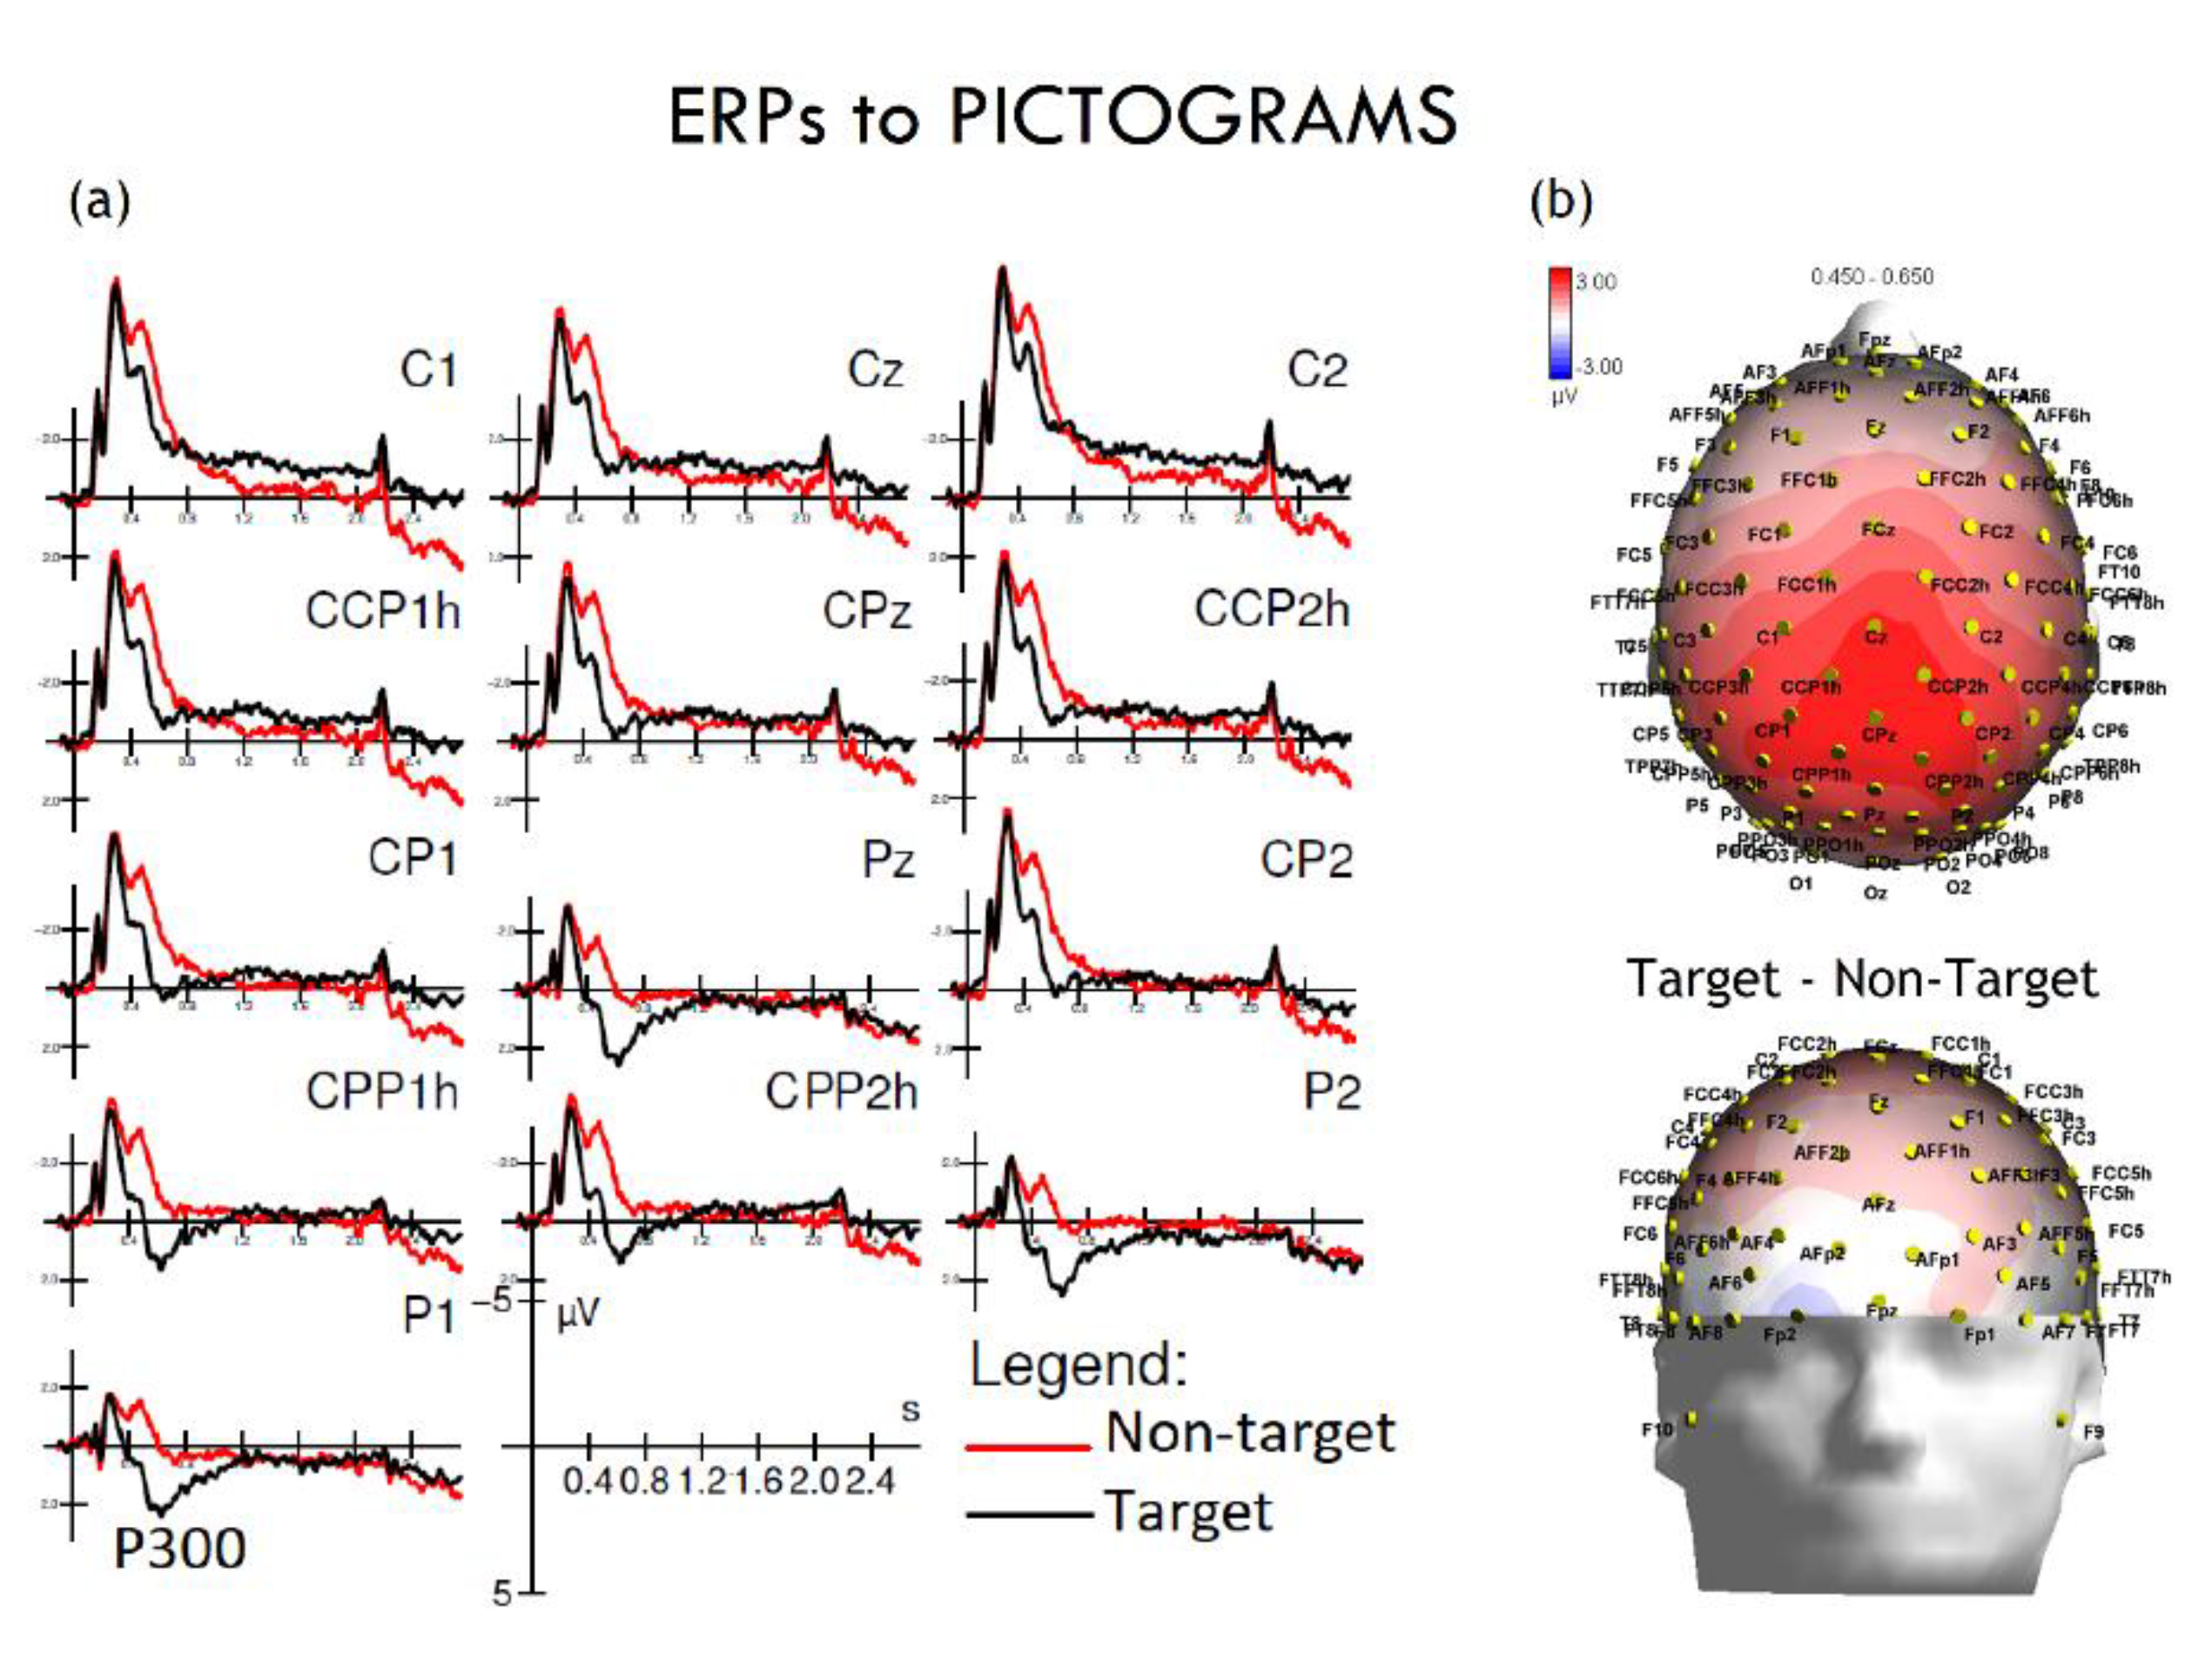
Figure 4.
ERPs to pictograms: CNV (a) Grand-average ERP waveforms show evoked responses to “target” (black line) and “non-target” (red line) pictograms at various electrode sites (e.g., F7, F9, F11). An early and a late-onset CNV negative deflection are evident, which were more pronounced for target pictograms, reflecting preparatory motor and cognitive processing. (b) Topographical maps of potential differences. Topographical maps illustrate the spatial distribution of the early (450–750 ms) and late (2250–2750 ms) CNVs. Potential differences are shown on a color scale from blue (negative potential, indicating greater activity) to red (positive potential). Early CNV maps show a negative potential in the fronto-central region for both target and non-target conditions. (c) The late CNV maps highlight the significant difference between conditions: a more extensive and negative potential is visible for the “target” condition (target minus non-target difference), consistent with motor response preparation.
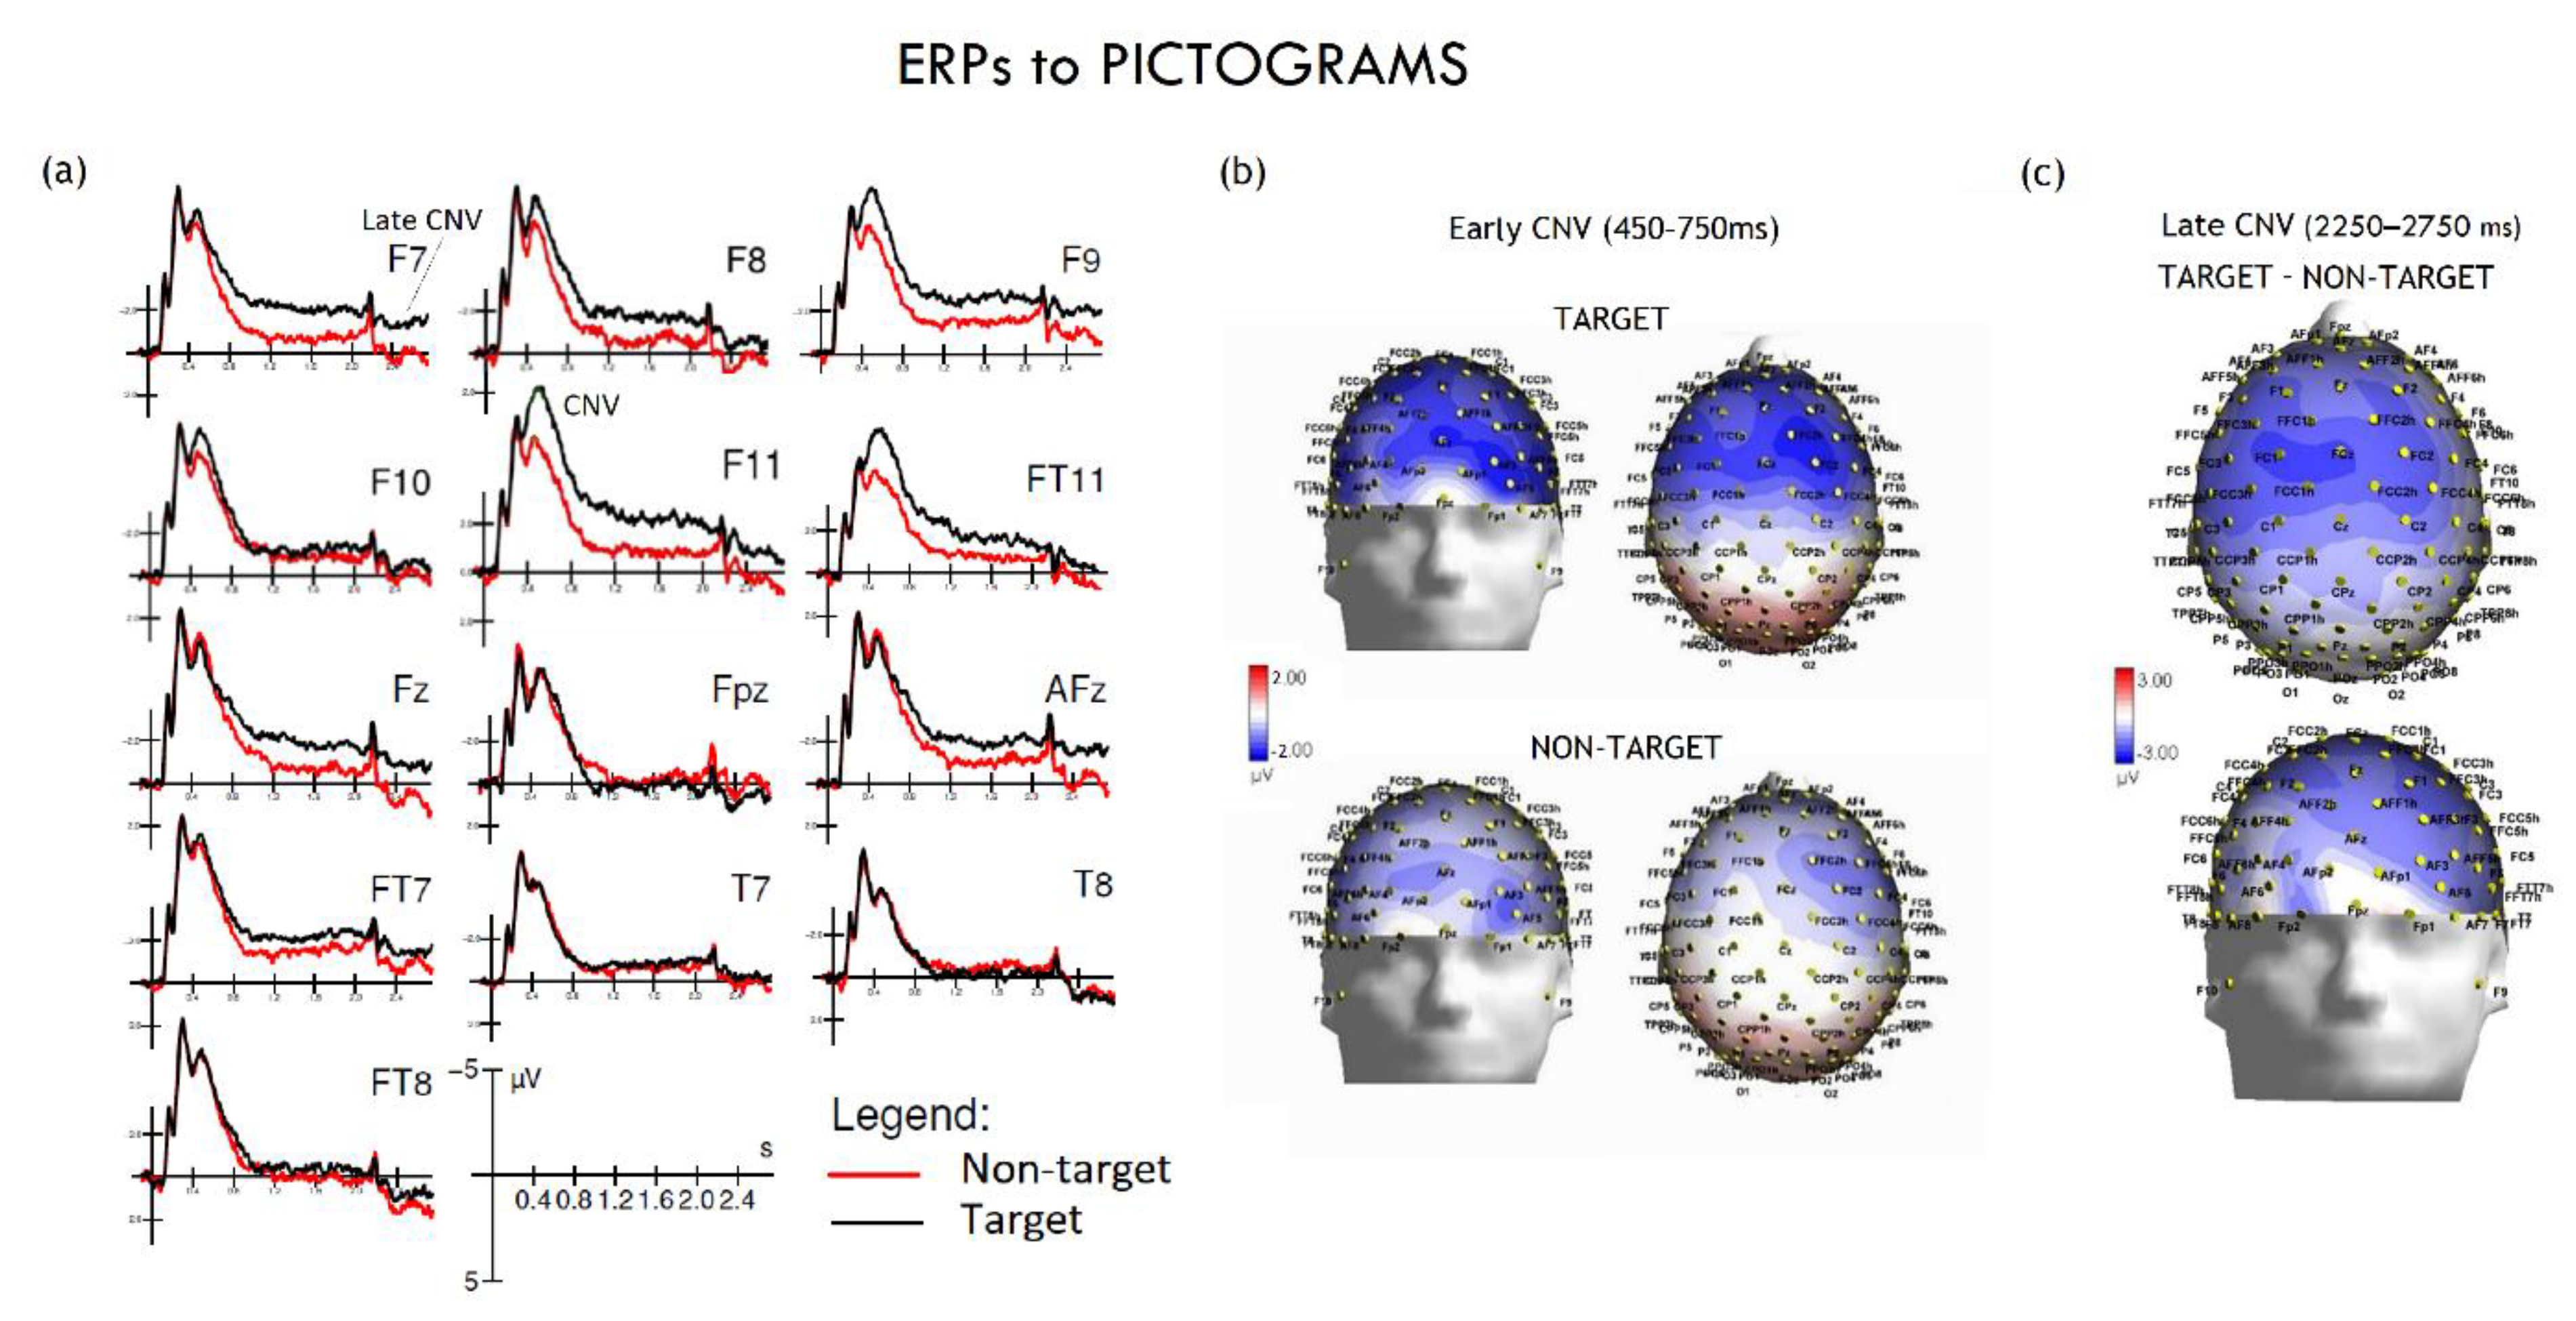
Figure 5.
ERPs to response prompts. (a) ERP grand-average waveforms s show responses evoked by “target” (red line) and “non-target” (black line) prompts at various electrode sites. The traces show two key components: a negative-going deflection around 400 ms post-stimulus, the N400, and a late positive-going wave, the P600. The P600 was notably more pronounced for the target condition, suggesting its role in response evaluation and decision-making processes. (b) The topographical maps illustrates the scalp distribution of the P600 component (600–800 ms) for the target minus non-target condition. It can be appreciated the strong positive potential (red) over the central-parietal region for the target prompts. This widespread positive distribution is characteristic of the P600 and is consistent with its function in response evaluation and execution.
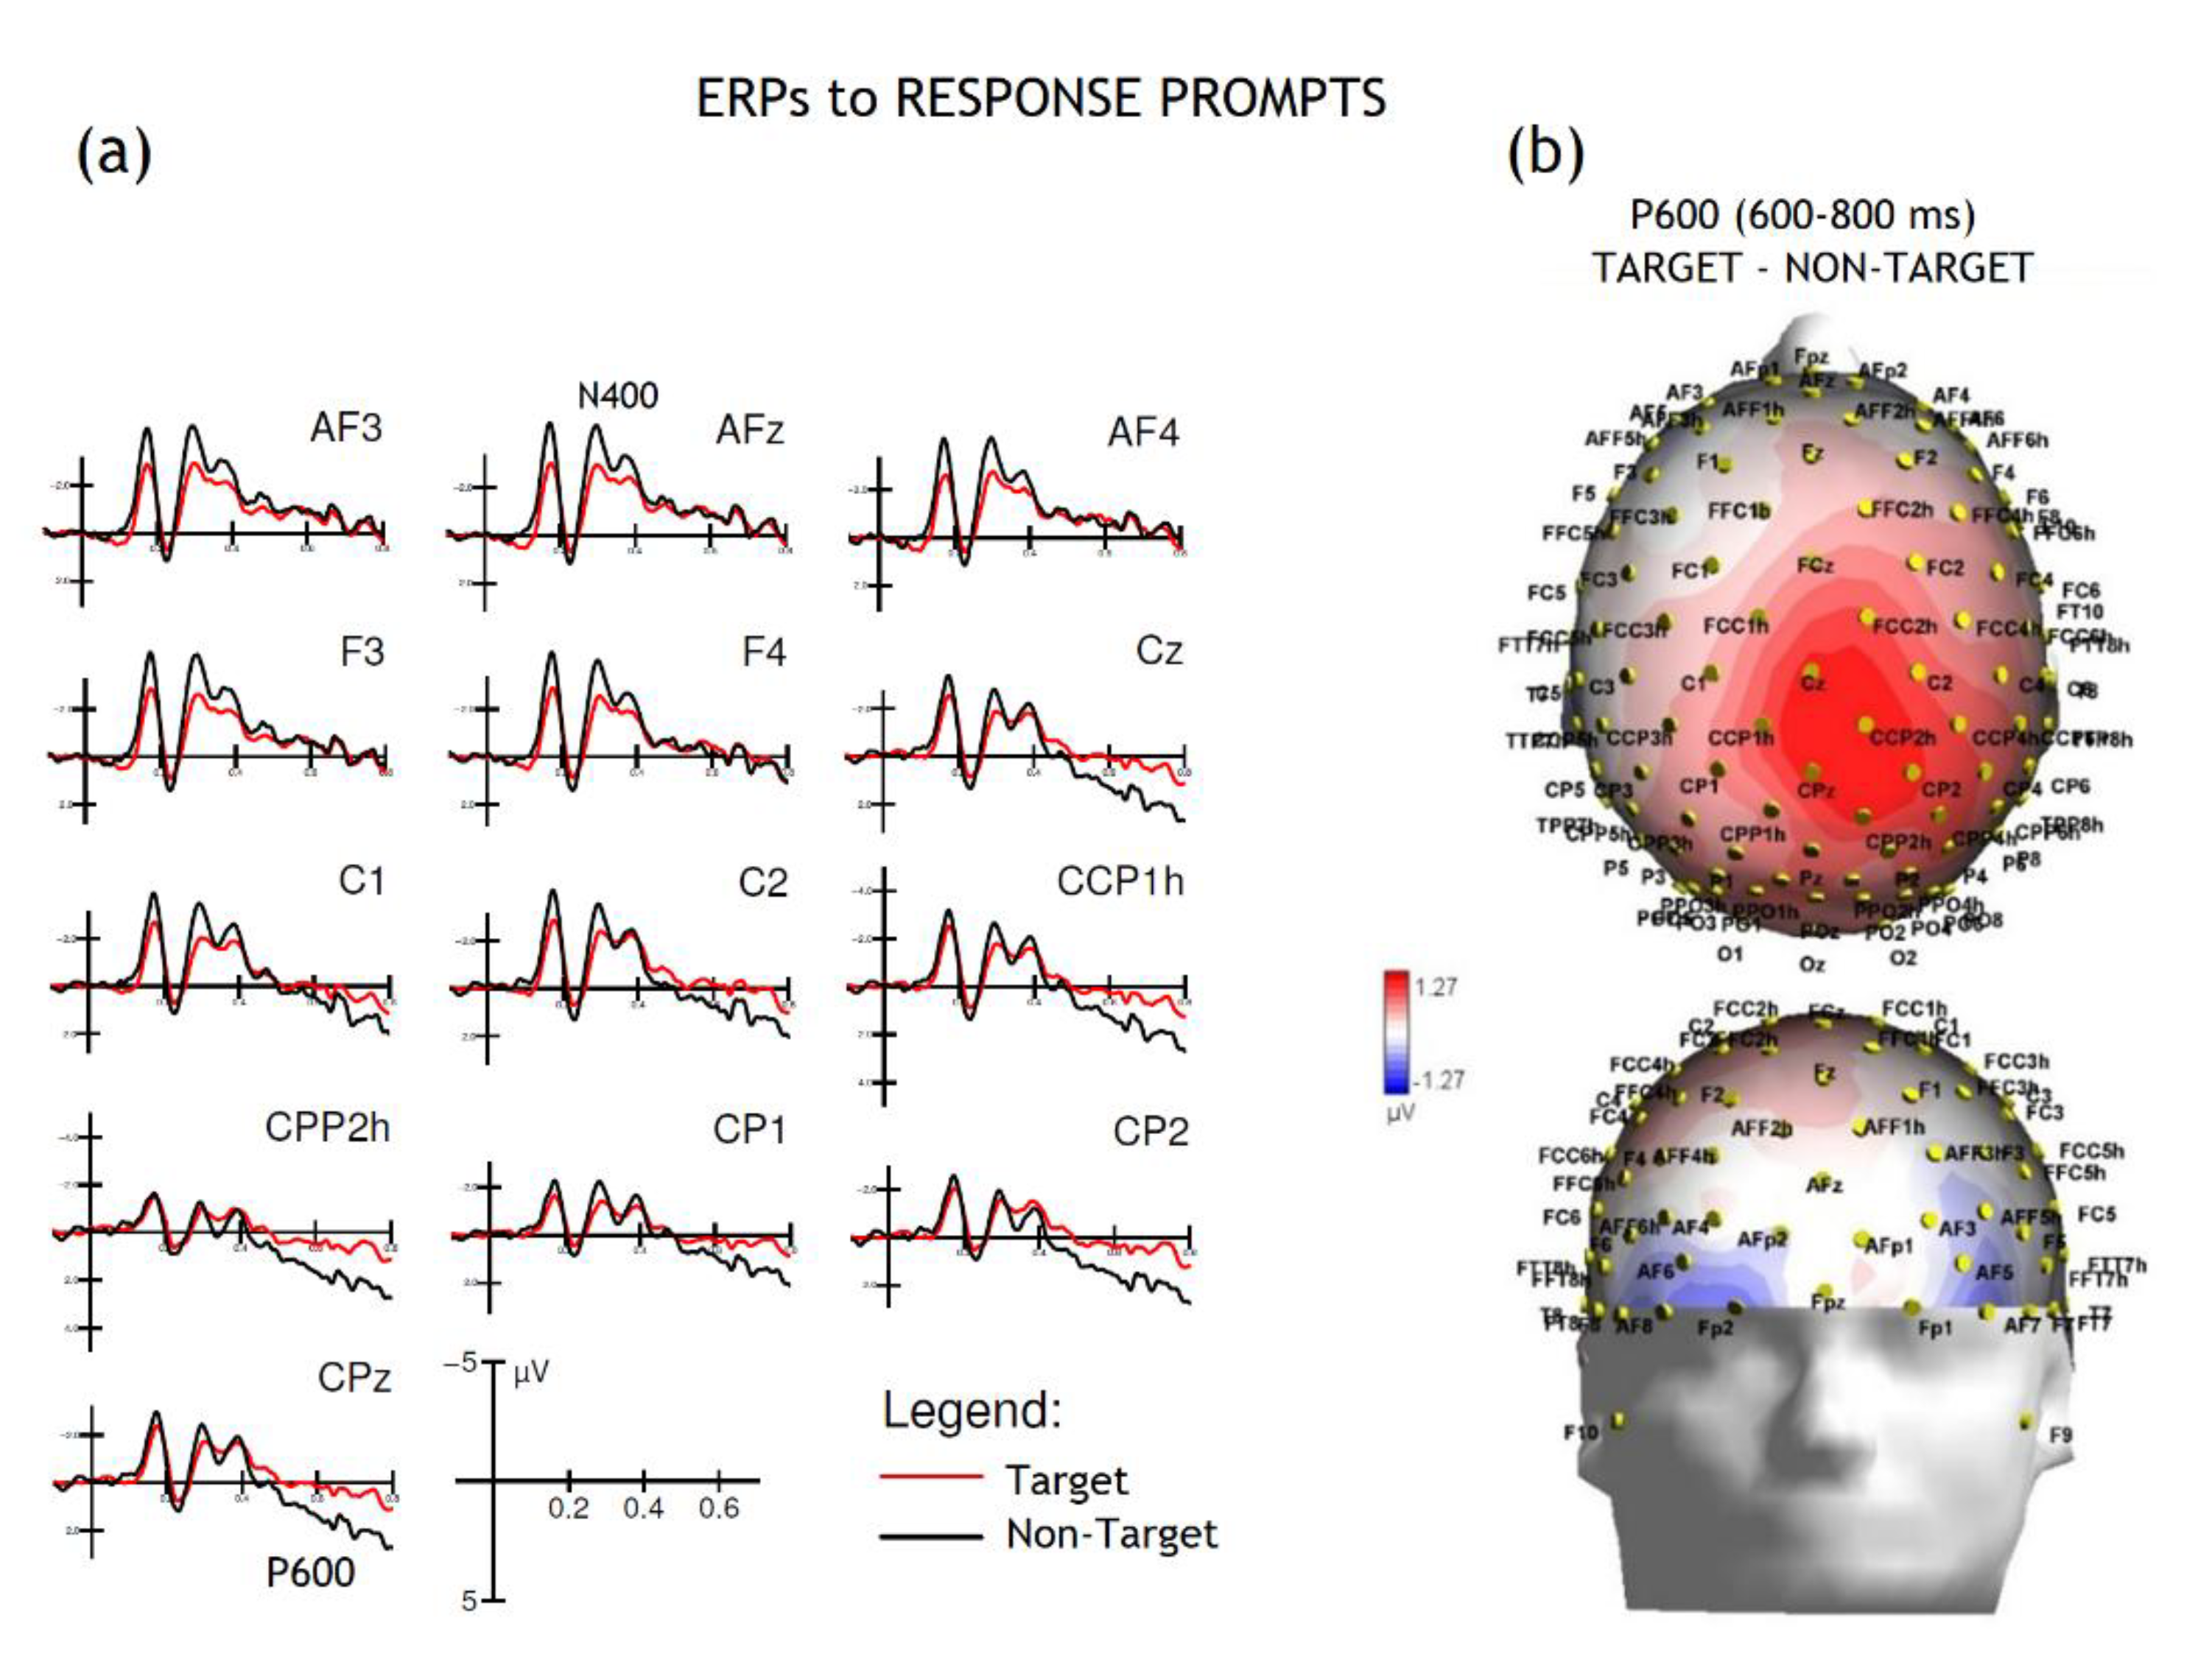
Figure 6.
(a) Coronal, axial and sagittal brain images of swLORETA applied to the early CNV potential and highlighting the active common electromagnetic dipoles elicited by target pictograms in the 450-650 time window. (b) Coronal, axial and sagittal brain images of swLORETA applied to the late CNV potential and highlighting the active common electromagnetic dipoles elicited by target pictograms in the 2250-2750 ms time window. (c) Coronal, axial and sagittal brain images of swLORETA applied to P600 response and highlighting the active common electromagnetic dipoles elicited by target propmpts in the 600-800 ms time window. The different colours represent differences in the magnitude of the electromagnetic signal (in nAm) recorded in the specific time window. Numbers refer to the displayed brain slice in sagittal view: the left section belongs to the right hemisphere and the right one to the left hemisphere. L = Left, R = Right; A = anterior, P = posterior.
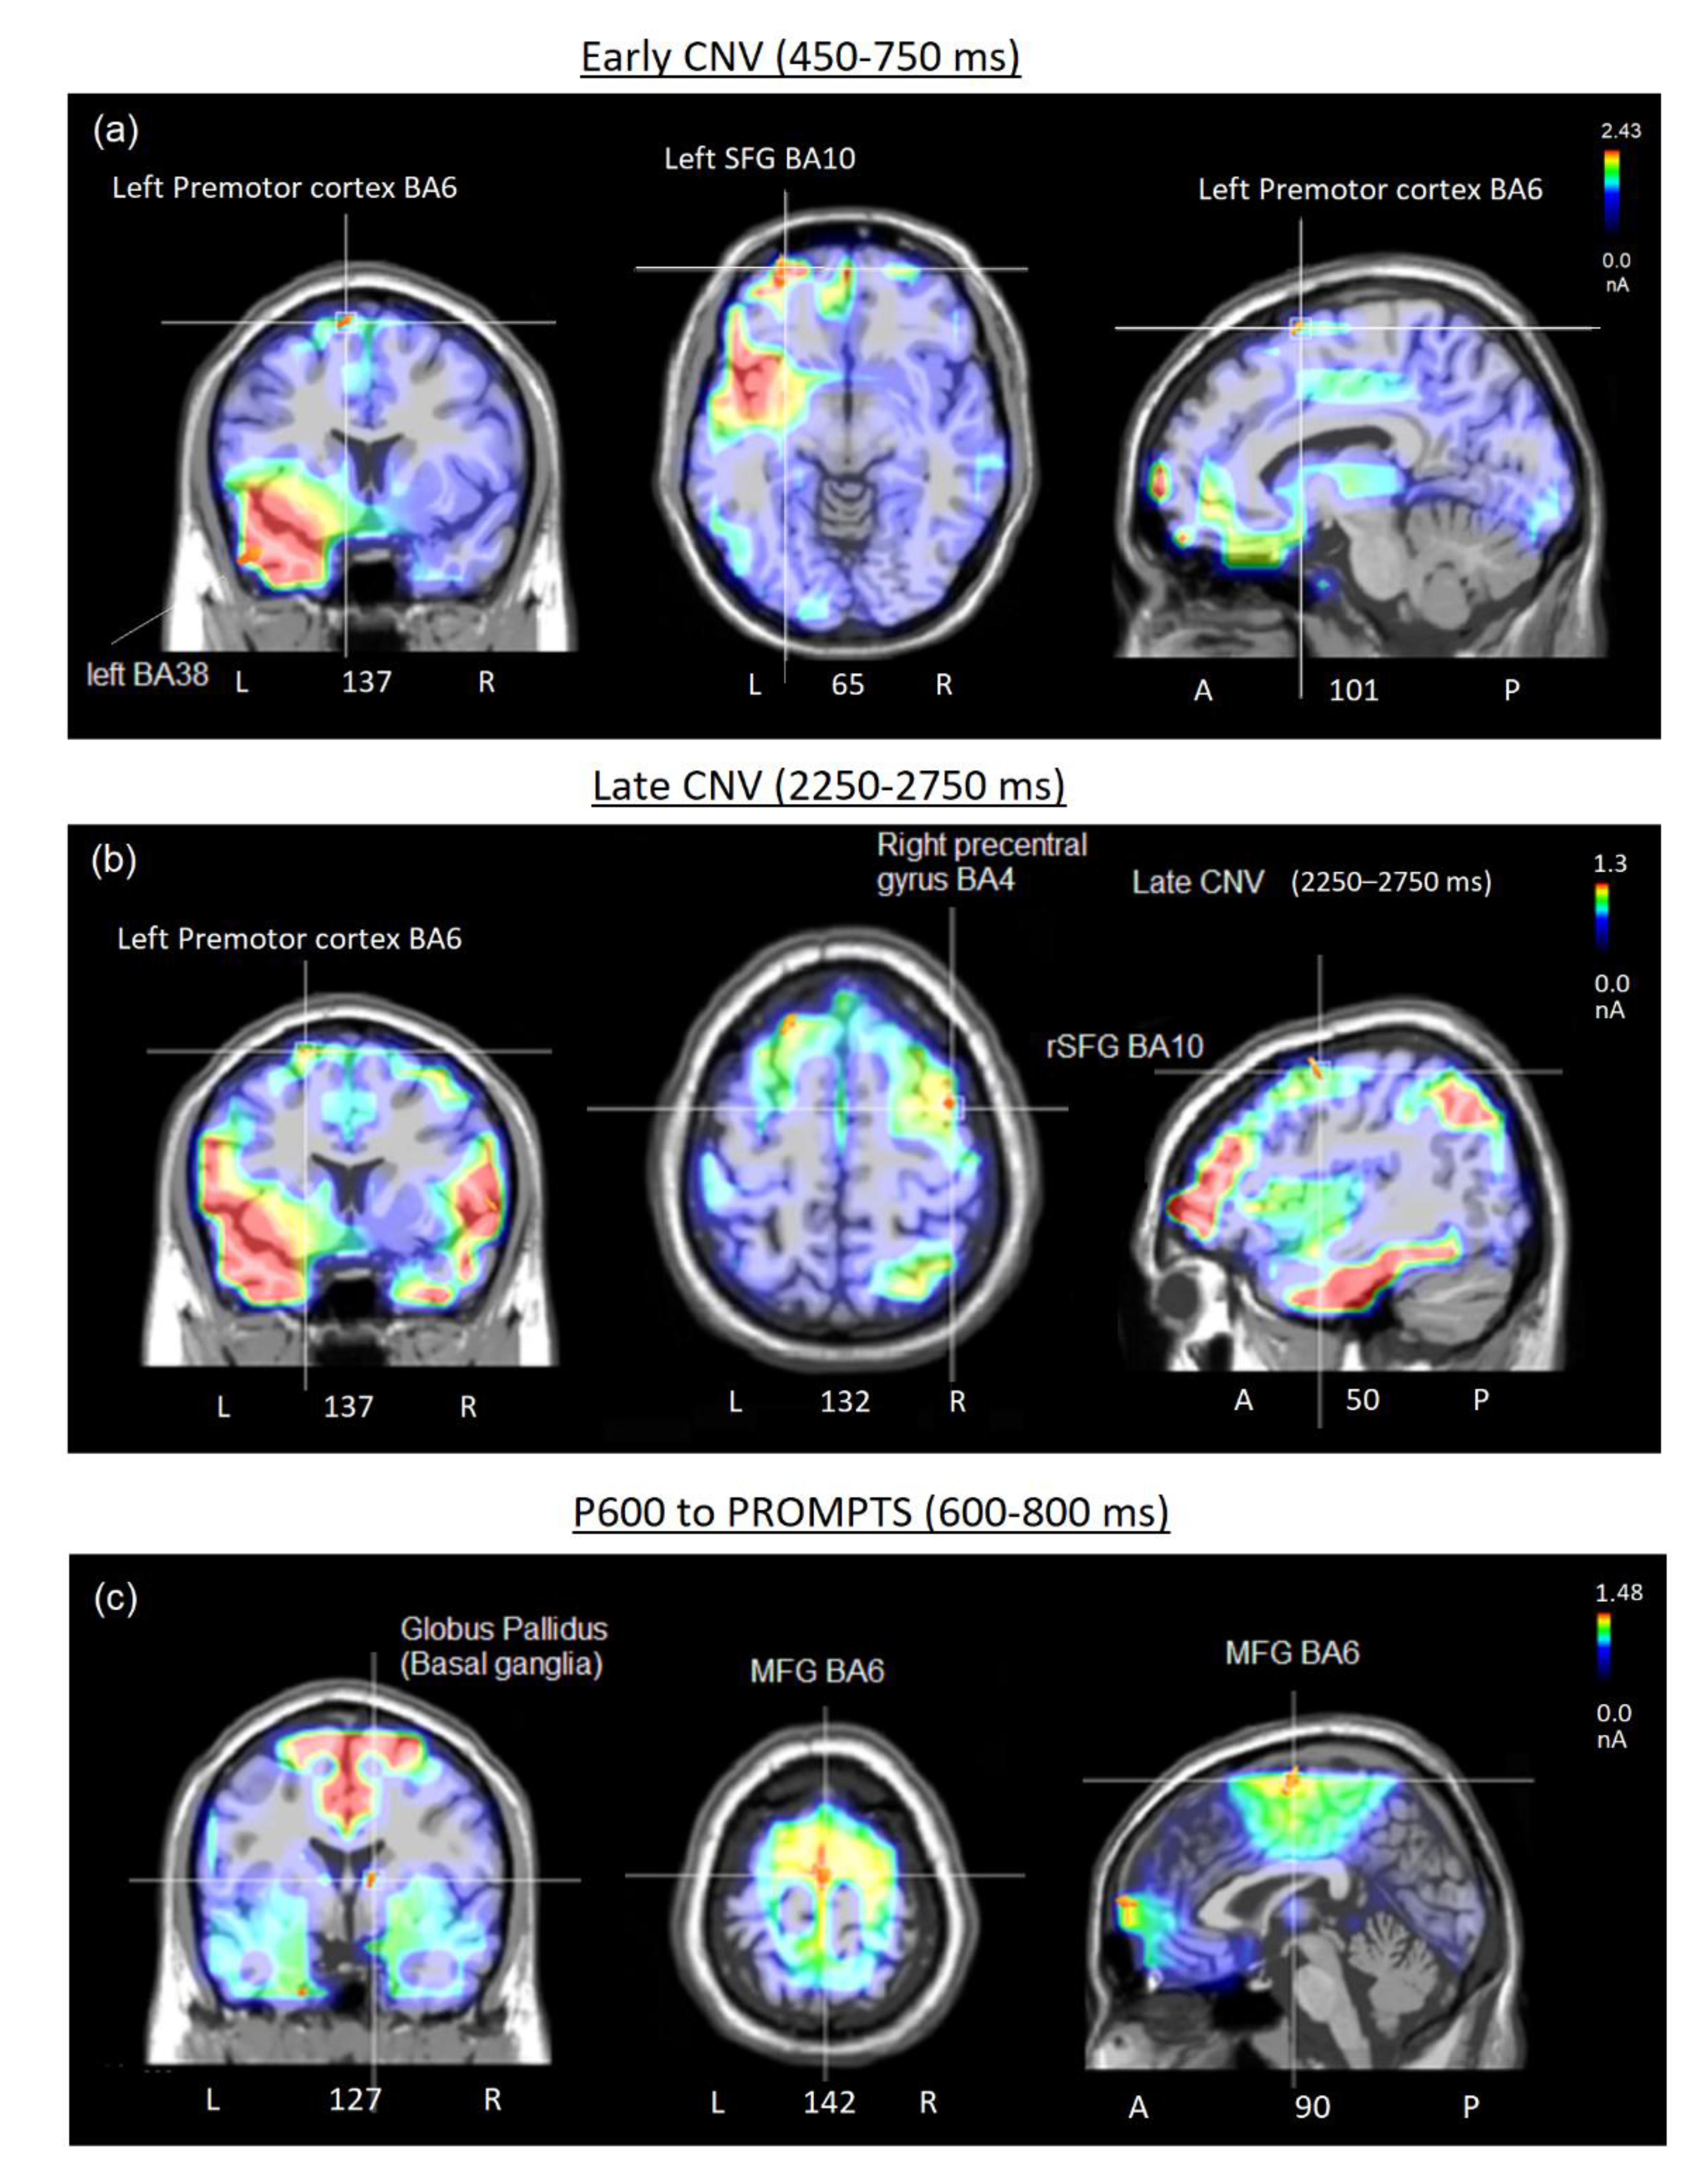

Table 1.
Mean area amplitude values (µV) and standard errors (SE) for ERP components elicited by cues and response prompts. The table reports mean area amplitudes, SE, and 95% confidence intervals (CIs) for target and non-target stimuli across ERP components. The P300 (450–650 ms) showed larger mean amplitudes for target compared to non-target stimuli. The early CNV (450–750 ms) revealed a pronounced negative shift in response to target stimuli. The late CNV (2250–2750 ms) is reported separately for left and right hemispheres, indicating lateralized motor-preparatory activity in favour of the right hand. Finally, the P600 (600–800 ms) to response prompts showed significantly enhanced amplitudes for targets relative to non-targets. Sample size across conditions was N = 25. Hem. = hemisphere.
| ERPs to pictograms - Mean area amplitude values | ||||||
| Category | Hem. | Mean area | SE | -95% | +95% | N |
| P300 (450-650) | ||||||
| Target | -0.913 | 1.476 | -3.960 | 2.134 | 25 | |
| Non Target | -3.543 | 1.057 | -5.724 | -1.362 | 25 | |
| EarlyCNV (450-750 ms) | ||||||
| Target | -5.266 | 0.700 | -6.711 | -3.821 | 25 | |
| Non Target | -4.279 | 0.787 | -5.904 | -2.653 | 25 | |
| Late CNV (2250-2750 ms) | ||||||
| Target | Left | -1.497 | 1.275 | -4.128 | 1.134 | 25 |
| Target | Right | 0.336 | 1.225 | -2.192 | 2.8642 | 25 |
| Non-Target | Left | -0.566 | 1.176 | -2.99 | 1.8616 | 25 |
| Non Target | Right | -0.613 | 1.362 | -3.423 | 2.197 | 25 |
| ERPs to response prompts - Mean area amplitude values | ||||||
| P600 (600-800 ms) | ||||||
| Target Non-Target |
2.585 | 1.017 | 0.486 | 4.684 | 25 | |
| 1.193 | 1.195 | -1.273 | 3.658 | 25 | ||
Table 2.
Electro-magnetic dipoles significantly active during the processing of cues in the early CNV/P300 time window (450-750 ms). Legend: BA = Brodmann Areas; Dip. = Dipole; Magn. = dipole strength; Hem. = hemisphere.
Table 2.
Electro-magnetic dipoles significantly active during the processing of cues in the early CNV/P300 time window (450-750 ms). Legend: BA = Brodmann Areas; Dip. = Dipole; Magn. = dipole strength; Hem. = hemisphere.
|
EARLY CNV TO TARGET PICTOGRAMS (450-750 ms) | ||||||||
| Magn. | T-x [mm] | T-y [mm] | T-z [mm] | Hem. | Lobe | Gyrus | BA | Functional Correlates |
| 2.435 | -28.5 | 56.3 | -1.6 | L | F | Superior Frontal | 10 | Decision making |
| 2.431 | -48.5 | 8.2 | -20 | L | T | Superior Temporal | 38 | Visual attention (Body Parts / Human Figures) |
| 2.417 | -48.5 | -8 | -28.9 | L | T | Inferior Temporal | 20 | |
| 2.158 | 11.3 | 65.3 | 7.9 | R | F | Superior Frontal | 10 | Decision making |
| 1.628 | 50.8 | 33.4 | 23.1 | R | F | Middle Frontal | 46 | Selective attention |
| 1.532 | -58.5 | -55 | -17.6 | L | T | Fusiform | 37 | Visual attention (Body Parts) |
| 1.437 | -8.5 | -1.1 | 65 | L | F | Superior Frontal | 6 | Premotor (Right hand) |
| 1.411 | 21.2 | -15.8 | 63.3 | R | F | Precentral | 6 | Premotor (Left hand) |
| 1.383 | 60.6 | -24.5 | -15.5 | R | T | Inferior Temporal | 20 |
Visual attention (Body Parts / Human Figures) |
| 1.323 | 50.8 | -0.6 | -28.2 | R | T | Middle Temporal | 21 | |
| 1.289 | 60.6 | -55 | -17.6 | R | O | Fusiform | 37 | |
| 1.249 | -58.5 | -58.9 | 14.5 | L | T | Superior Temporal | 22 | |
| 1.02 | -58.5 | -20.3 | 26.8 | L | P | Postcentral | 2 | Somatosensory |
| 0.99 | -18.5 | -90.3 | 20.8 | L | O | Cuneus | 18 | Visual attention |
| 0.95 | 40.9 | -75.2 | -19.1 | R | Cereb | Post. Lobe, Declive | / | Motor preparation |
Table 3.
Electro-magnetic dipoles significantly active during the processing of cues in the late CNV time window (2250-2750 ms). Legend: BA = Brodmann Areas; Dip. = Dipole; Magn. = dipole strength; Hem. = hemisphere; EBL= emotional body-language.
Table 3.
Electro-magnetic dipoles significantly active during the processing of cues in the late CNV time window (2250-2750 ms). Legend: BA = Brodmann Areas; Dip. = Dipole; Magn. = dipole strength; Hem. = hemisphere; EBL= emotional body-language.
|
Late CNV TO TARGET PICTOGRAMS (2250-2750 ms) |
|||||||||
| Magn. | T-x [mm] | T-y [mm] | T-z [mm] |
Hem. |
Lobe |
Gyrus |
BA |
Functional Correlates | |
| 4.787 | 11.3 | 65.3 | 7.9 | R | F | Superior Frontal | 10 | Decision making |
|
| 3.736 | 31 | 55.3 | 7 | R | F | Middle Frontal | 10 | ||
| 2.937 | -68.5 | -36.6 | -1.3 | L | T | Middle Temporal | 21 | Visual attention (Body Parts / Human Figures) | |
| 2.705 | 70.5 | -25.5 | -8.1 | R | T | Middle Temporal | 20/21 | ||
| 2.47 | 70.5 | -27.5 | 8.2 | R | T | Superior Temporal | 22/ 42 | EBL/Motivation | |
| 2.218 | 60.6 | -50.7 | 33.1 | R | P | Supramarginal | 40 | Mirror neuron/embodiment | |
| 1.992 | -48.5 | 22.4 | 31.1 | L | F | Middle Frontal | 9 | Decision making | |
| 1.837 | -18.5 | -98.5 | 2.1 | L | O | Cuneus | 18 | Visual processing Visual attention (Body Parts / Human Figures) |
|
| 1.836 | -38.5 | 18.2 | -19.3 | L | T | Superior Temporal | 38 | ||
| 1.813 | 60.6 | -55 | -17.6 | R | O | Fusiform | 37 | ||
| 1.264 | -18.5 | -1.1 | 65 | L | F | Superior Frontal | 6 | Motor preparation (right hand) | |
| 1.21 | 21.2 | -55.9 | -10.2 | R | Cereb | Post. Lobe, Declive | / | Motor preparation | |
| 1.191 | -18.5 | 19.5 | 57.8 | L | F | Superior Frontal | 6 | Motor preparation (right hand) | |
| 1.173 | 40.9 | -7.8 | 55.2 | R | F | Precentral | 4 | Motor command (BCI) | |
| 1.057 | 1.5 | 40.5 | 50.7 | R | F | Superior Frontal | 8 | Attention (FEF) | |
| 0.878 | 1.5 | -5.6 | 28.5 | R | Limbic | Cingulate | 24 | Empathy, Motivation | |
Table 4.
Electro-magnetic dipoles significantly active during processing of response prompts in the P600 time window (600-800 ms post-stimulus). Legend: BA = Brodmann Areas; Dip. = Dipole; Magn. = dipole strength; Hem. = hemisphere.
Table 4.
Electro-magnetic dipoles significantly active during processing of response prompts in the P600 time window (600-800 ms post-stimulus). Legend: BA = Brodmann Areas; Dip. = Dipole; Magn. = dipole strength; Hem. = hemisphere.
|
P600 TO PROMPTS (600-800 ms) | |||||||||
| Magn. | T-x [mm] | T-y [mm] | T-z [mm] | Hem. | Lobe | Gyrus | BA | Functional Correlates | |
| 1.484 | 1.5 | -15.8 | 63.3 | R | F | Medial Frontal | 6 | MNS - Motor imagery and preparation, embodiment | |
| 1.381 | 1.5 | 64.4 | 16.8 | R | F | Medial Frontal | 10 | Decision making | |
| 1.133 | 60.6 | -55 | -17.6 | R | O | Fusiform | 37 | Occipital body area (Hands) | |
| 1.105 | -48.5 | 33.4 | 23.1 | L | F | Middle Frontal | 46 | Attention | |
| 1.081 | -28.5 | 53.4 | 24.8 | L | F | Superior Frontal | 10 | Decision making | |
| 0.922 | 50.8 | 34.3 | 14.2 | R | F | Middle Frontal | 47 | Motivation/Crave | |
| 0.875 | 11.3 | -4.2 | 10.7 | R | Basal Ganglia | Globus Pallidus | / | Craving; Motivation; Reward | |
| 0.822 | -18.5 | -19.6 | 17.9 | L | Basal Ganglia | Globus Pallidus | / | Craving; Motivation; Reward | |
| 0.809 | -58.5 | -29.4 | 26 | L | P | Inferior Parietal Lobule | 40 | MNS - Motor imagery and preparation, embodiment | |
| 0.793 | -18.5 | -0.6 | -28.2 | L | Limbic | Uncus | 36 | Craving | |
| 0.752 | -38.5 | -28.5 | 17.1 | L | T | Superior Temporal | 41 | Inner speech | |
| 0.727 | -28.5 | 27.2 | -11.2 | L | F | Inferior Frontal | 47 | Motivation & Reward | |
| 0.657 | -48.5 | -58.9 | 14.5 | L | O | Middle Temporal | 22 | EBL/ Motivation | |
| 0.648 | 60.6 | -8.7 | -21.5 | R | T | Inferior Temporal | 20 | Hands Neurons | |
| 0.642 | 60.6 | -30.4 | 34.9 | R | P | Inferior Parietal Lobule | 40 | MNS - Motor imagery and preparation, embodiment | |
| 0.572 | 40.9 | -30.4 | 34.9 | R | P | Inferior Parietal Lobule | 40 | MNS - Motor imagery and preparation, embodiment | |
| 0.543 | 40.9 | -28.5 | 17.1 | R | Sublobar | Insula | 13 | Craving | |
Disclaimer/Publisher’s Note: The statements, opinions and data contained in all publications are solely those of the individual author(s) and contributor(s) and not of MDPI and/or the editor(s). MDPI and/or the editor(s) disclaim responsibility for any injury to people or property resulting from any ideas, methods, instructions or products referred to in the content. |
© 2025 by the authors. Licensee MDPI, Basel, Switzerland. This article is an open access article distributed under the terms and conditions of the Creative Commons Attribution (CC BY) license (http://creativecommons.org/licenses/by/4.0/).
Copyright: This open access article is published under a Creative Commons CC BY 4.0 license, which permit the free download, distribution, and reuse, provided that the author and preprint are cited in any reuse.


