
Submitted:
27 September 2025
Posted:
29 September 2025
You are already at the latest version
Abstract
Cadmium (Cd) is a ubiquitous environmental pollutant with no nutritional value or physiological role in the body. It readily accumulates in various tissues as it is easily absorbed from the diet but only poorly excreted. Due to the widespread contamination of staple foods, exposure to this toxic metal is inevitable for most people. The health risk due to dietary Cd exposure has long been underappreciated. This is primarily due to the use of urinary excretion of β2-microglobulin (β2M) as an indicator of an adverse health effect. Herein, advanced benchmark dose (BMD) modelling is employed to identify the critical Cd exposure levels, based on two toxic endpoints; changes in β2M excretion and the reduction of the estimated glomerular filtration rate (eGFR). Data on Cd excretion, β2M excretion and eGFR were from a Thai cohort of 799 persons without diabetes, aged 18-87 years. The BMD limit (BMDL) value for Cd excretion was 0.17 μg/g creatinine, when eGFR was used as an endpoint. In contrast, the BMDL for Cd excretion could not reliably be estimated, when β2M was used as an endpoint. Given that a reduced eGFR more reliably indicates the development of chronic kidney disease, we recommend the use of the eGFR to derive a meaningful health protective BMDL. This study reveals that the current Cd excretion threshold of 5.24 µg/g creatinine is vastly inadequate to protect human health. We strongly advocate a Cd excretion rate of below 0.20 µg/g creatinine is used to inform future Cd exposure guidelines.
Keywords:
β2-microglobulin
; benchmark dose
; cadmium
; dietary exposure
; eGFR
; health risk
; threshold
1. Introduction
Consumption of rice contaminated with the toxic metal cadmium (Cd) can cause itai-itai disease, marked by loss of kidney mass, osteoporosis and osteomalacia [1,2,3,4]. Based on a lifetime intake of 2 g of Cd, and an excretion of β2-microglobulin (β2M) at a rate above 300 µg/ g creatinine, a tolerable Cd intake level was estimated to be 0.83 µg/kg body weight per day (58 µg/day for a 70 kg person), with a threshold of 5.24 µg/g creatinine [5]. By definition, a threshold level for an adverse effect of any food contaminant reflects the exposure level from a normal diet that can produce an adverse effect in 5% of the general populations [6,7,8,9]. However, many Cd-related health effects, notably chronic kidney disease (CKD), are higher than the acceptable disease prevalence of 5%.
CKD affects 8-13% of the adult population worldwide, and it has now reached epidemic proportions in many parts of the world [10,11,12]. A dose–response relationship between Cd exposure and CKD risk has been reported in a meta-analysis by Doccioli et al. [10]. The urinary Cd excretion levels associated with an increased risk of CKD were below a Cd excretion threshold of 5.24 µg/g creatinine. These human population data imply that current Cd exposure guidelines do not afford an adequate health protection.
The diagnosis of CKD is based on a fall of the estimated glomerular filtration rate (eGFR) to one-third of a normal range (60 mL/min/1.73 m2), and/or the presence of albuminuria for at least 3 months [13,14,15]. It is predicted to be the fifth-leading cause of years of life lost by 2040 [11,12]. Developing strategies to prevent CKD and to reduce its progression to kidney failure is thus of great public health significance.
The present work has three main objectives; firstly, it was to confirm a significant health threat of Cd exposure, especially on CKD risk. We used urinary Cd excretion rate as an indicator of kidney burden, while changes in eGFR and β2M excretion reflected adverse effects on the kidneys. We analyzed data from a Thai cohort of 799 individual, 18-87 years of age who did not have diabetes nor had workplace exposure to metals.
The second objective was to demonstrate that the practice of adjusting urinary concentrations of Cd and β2M to creatinine excretion has obscured Cd effects on kidneys. This phenomenon is described as reverse causality, due to the imprecision in measuring Cd-exposure dose levels and its effects [16]. These biases have led to erroneous conclusions that Cd did not diminish eGFR nor did it promote progressive eGFR reduction toward kidney failure [17,18]. To this end, we present results from adjusting excretion rates of Cd and β2M to creatinine excretion (Ecr) as ECd/Ecr and Eβ2M/Ecr in comparison with those adjusted by creatinine clearance (Ccr) as ECd/Ccr and Eβ2M/Ecr.
The third objective was to apply advanced benchmark dose (BMD) modeling to define the BMDL limit (BMDL) value for urinary Cd excretion, which may carry a negligible impact on the kidneys [19,20,21,22]. The BMDL figure for a health hazardous substance in food has been used as a replacement of the no-observed-adverse-effect level (NOAEL) [21,22].
2. Materials and Methods
2.1. Data Sourcing
Individuals without diabetes were identified from a pre-existing Thai population cohort (n = 1189) which was conducted in compliance with the Declaration of Helsinki [23]. Inclusion/exclusion criteria have been reported previously [23]. In brief, the cohort participants were recruited from three localities; Bangkok, Nakhon–Si–Thammarat Province and the Mae Sot District, Tak Province [23]. The residents of Bangkok and Nakhon–Si–Thammarat Province represented the low-Cd exposure group; the Mae Sot residents represented the moderate-to-high Cd exposure group. Data from 799 individuals were analyzed in the present study, following an exclusion of outliers and those with missing data.
Samples of venous blood and morning voided urine were collected after an overnight fast. Aliquots of urine, whole blood, serum, and plasma were stored at −80 °C for later analysis. An alkaline (NaOH) solution was added to adjust the pH of urine aliquots to > 6 before storage to prevent the degradation of β2M in acidic conditions.
The concentrations of creatinine in urine and plasma samples were determined by alkaline picrate Jaffe’s reaction [24]. The urine concentration of β2M was determined by immunoagglutination method [25] or the human beta-2 microglobulin/β2M ELISA pair set (Sino Biological Inc., Wayne, PA, USA).
Urinary Cd concentration was determined by Graphite Furnace Atomic Absorption Spectrometry [26]. To calibrate the instrument, multielement standards (Merck KGaA, Darmstadt, Germany) were used. Reference urine metal controls (Lyphocheck, Bio-Rad, Hercules, CA, USA) or urine standard reference material No. 2670 (National Institute of Standards, Washington, DC, USA) were used for quality control, accuracy, and precision assurance of Cd analysis.
The limit of detection (LOD) value for urinary Cd was defined as the standard deviation values of at least ten blank sample measurement multiplied by 3. For any urine sample containing Cd below the LOD, the Cd concentration assigned was the LOD value divided by the square root of 2 [27].
2.2. Calculation of eGFR and Normalization of Cd and β2M Excretion Rates
The eGFR was computed with equations of the Chronic Kidney Disease Epidemiology Collaboration (CKD-EPI) [28]. CKD stages 1, 2, 3, 4, and 5 corresponded to eGFR of 90–119, 60–89, 30–59, 15–29, and < 15 mL/min/1.73 m2, respectively [28].
Because urine samples were collected at a single time point (voided urine), a correction for interindividual differences in urine volume (dilution) was undertaken. Accordingly, the excretion of Cd (ECd) and β2M (Eβ2M) were adjusted to creatinine excretion (Ecr) and creatinine clearance (Ccr), using the below equations.
Ex/Ecr = [x]u/[cr]u, where x = Cd or β2M; [x]u = urine concentration of x (mass/volume) and [cr]u = urine creatinine concentration (mg/dL). Ex/Ecr was expressed as an amount of x excreted per g of creatinine.
Ex/Ccr = [x]u[cr]p/[cr]u, where x = Cd or β2M; [x]u = urine concentration of x (mass/volume); [cr]p = plasma creatinine concentration (mg/dL); and [cr]u = urine creatinine concentration (mg/dL). Ex/Ccr was expressed as an amount of x excreted per volume of the glomerular filtrate [29].
2.3. Benchmark Dose Modeling
We used the PROAST software version 71.1 (https://proastweb.rivm.nl) (accessed on 28 May 2025) to estimate benchmark dose limit (BMDL) values for urinary Cd excretion rate associated with two toxic endpoints; eGFR reduction and abnormal β2M excretion rates. The BMD was estimated through fitting an entire exposure–effect dataset using multiple dose-response models with a pre-defined specific effect size, referred to as the benchmark response (BMR) [19,20,21,22].
For continuous endpoints (eGFR reduction and abnormal β2M excretion rates), a lower 95% confidence bound of BMD is referred to as the BMDL value, and the BMDL value derived when BMR is set at 5% can represent the NOAEL equivalent [21,22]. An upper 95% confidence bound of BMD is referred to as BMDU. The BMDU/BMDL ratio informs a degree of uncertainty in BMD estimates [21,22]. The mathematical equations applied to continuous endpoints were inverse exponential, natural logarithmic, exponential, and Hill dose-response models [30,31].
For quantal endpoints (% CKD and % abnormal β2M excretion rates), respective BMDL5 and BMDL10 values are referred to the lower 95% confidence bound of BMD values derived when the prevalence of any outcome is set at 5% and 10% [21,22]. Similarly, respective BMDU5 and BMDU10 are referred to the upper 95% confidence bound of BMD values derived when the prevalence of any outcome (% CKD and % abnormal β2M excretion rates) is set at 5% and 10%. The BMDL5 could be considered as a population exposure threshold level. The mathematical equations applied to quantal endpoints were two-stage, logarithmic logistic, Weibull, logarithmic probability, gamma, exponential, and Hill dose-response models [32,33,34].
For both continuous and quantal response endpoints, we evaluated model performance using the Akaike information criterion (AIC), which balances goodness of fit against model complexity to reduce the risk of overfitting and underfitting. Model weights, reflecting the relative information retained by each model, were higher for models with less information loss, indicating better quality.
2.4. Statistical Analysis
Data were analyzed with IBM SPSS Statistics 21 (IBM Inc., New York, NY, USA). The variability of any continuous variable and differences in percentages across the eGFR groups were assessed by the Kruskal–Wallis’s test and the Pearson chi-squared test, respectively. The one-sample Kolmogorov–Smirnov test was used to assess departure from a normal distribution of any continuous variable. Logarithmic transformation was applied to the excretion rates of Cd and β2M that showed rightward skewing before they were subjected to parametric statistics analyses.
The prevalence odds ratio (POR) values for CKD, abnormal β2M excretion levels 1, 2 and 3 were determined by multivariable logistic regression modeling with adjustment for covariates, namely age, body mass index (BMI), gender, smoking, and hypertension.
3. Results
3.1. Cd, eHGFR and β2M Excretion Levels in Study Subjects
Subjects were grouped according to their eGFR values, where 426, 303 and 70 persons had eGFR ≥ 90, 61-89 and ≤ 60 mL/min/1.73 m2, respectively (Table 1).
The overall mean age was 49.2 years (range: 18−87 years), and the percentages (%) of women, smokers and those with hypertension were 62.5, 32.5 and 42.7, respectively. The low eGFR group was the oldest. It had the highest % of hypertension (42.9), abnormal excretion of β2M; Eβ2M/Ecr ≥ 300 µg/g creatinine (65.7) and (Eβ2M/Ccr) ×100 ≥ 300 µg/L filtrate (70).
Respective arithmetic (geometric) means for ECd/Ecr and (ECd/Ccr) ×100 were 5.24 (2.15) µg/g creatinine and 5.05 (1.82) µg/L filtrate. Mean Eβ2M/Ecr and mean (Eβ2M/Ccr) ×100 values were the highest, middle, and lowest in the groups with the eGFR values ≤ 60, 61-89, and ≥ 90 mL/min/1.73 m2, respectively. The BMI variability in the three eGFR groups did not differ statistically.
3.2. Determinants of the Prevalence Odds for CKD (eGFR ≤ 60 mL/min/1.73 m2)
Logistic regression modeling was employed to assess effects of Cd exposure on the prevalence odds ratio (POR) for CKD (eGFR criterion) with adjustment for covariates; age, BMI, gender, smoking, and hypertension. Two models were constructed; ECd was incorporated in models A and B as ECd/Ecr and ECd/Ccr, respectively. All other independent variables in both models A and B were identical. Results are presented in Table 2.
As shown in model A, POR for CKD was affected by age, BMI ≥ 24 kg/m2 and ECd/Ecr, while an effect of hypertension did not reach statistically significant levels (p = 0.068). The POR for CKD rose 1.98-fold and 4-fold by a two-fold increase in ECd/Ecr and BMI ≥ 24 kg/m2. It rose 7.3% for every one- year increase in age.
As shown in model B, POR for CKD was affected by hypertension, age, BMI ≥ 24 kg/m2 and ECd/Ccr. POR for CKD rose 4.78-fold, 3.13-fold, and 2.66-fold by BMI ≥ 24 kg/m2, doubling ECd/Ccr and hypertension, respectively. It rose 6.8% for every one-year older.
3.3. Incremental β2M Excretion Rates in Relation to Cd Excretion Levels
Additional logistic regression models were conducted to examine whether the incremental levels of β2M excretion could be related to Cd excretion levels in a dose-dependent manner (Table 3).
As shown in Table 3, Cd excretion levels were incorporated in the regression model as categorial independent variable together with CKD (eGFR ≤ 60 mL/min/1.73 m2), age, BMI, gender, hypertension, and smoking. In both models A and B, the POR values for the β2M excretion levels 1, 2 and 3 were more prevalent in those with CKD. As expected, β2M excretion level 3 appeared to occur in the highest frequency in those with CKD in both models.
Notably, however, in model A, a dose-effect relationship could not be established between Cd excretion levels and the graded incremental β2M excretion levels. POR values for β2M excretion levels 1, 2 and 3 in the subjects with the highest Cd exposure category did not differ. Thus, β2M excretion levels 1, 2 and 3 occurred in the same high frequencies as ECd/Ecr rose above 2.50 µg/g creatinine.
In comparison, a dose-effect relationship between of Cd excretion and β2M excretion levels was apparent in model B. POR values for β2M excretion levels 1, 2 and 3 rose 5.8-fold, 6.4-fold, and 15.4−fold in the highest Cd exposure category. Thus, β2M excretion level 3 occurred in the highest frequency in the group with the highest Cd exposure [(ECd/Ccr) ×100 ≥ 5 µg/L filtrate] as did CKD.
3.4. Cd Excretion Benchmarks Derive from Continuous eGFR and β2M Endpoints
Figure 1 presents the BMD modeling of two eGFR/ECd datasets, including bootstrap model averaging curves (Figure 1A,1D), model weights (Figure 1B,1E) and BMDL/BMDL values of ECd (Figure 1C,1F).
For Ecr-adjusted datasets, the inverse exponential model had the highest weight (0.3674), followed by the natural logarithmic model (0.2695) (Figure 1B). In all subjects, ECd/Ecr of 0.17 µg/g creatinine produced a 5% reduction in eGFR (Figure 1C). The BMDL value of ECd/Ecr producing the same BMR in women was 4.8-fold higher than men (1.52 vs 0.32 µg/g creatinine.
For Ccr-adjusted datasets, the weights for the natural logarithmic model (0.2787) and the exponential model (0.2624) were close (Figure 1E). In all subjects, (ECd/Ccr) ×100 of 0.88 µg/L filtrate (Figure 1F) produced a 5% reduction in eGFR. BMDL value of (ECd/Ccr) ×100 for the same BMR was only 21% higher in women, compared to men (0.79 vs 1 µg/L filtrate) (Figure 1F).
Figure 2 presents the BMD modeling of two Eβ2M/ECd datasets, including bootstrap model averaging curves (Figure 2A, 2D), model weights (Figure 2B, 2E) and BMDL/BMDL values of ECd (Figure 2C, 2F).
For Ecr-adjusted datasets, the weights of natural logarithmic model (0.3734) and inverse exponential model (0.3660) were nearly the same (Figure 2B). The estimated BMDL value of ECd/Ecr producing a 5% increment of Eβ2M/Ecr were unreliable because the BMDU/BMDL ratios (an uncertainty index) was higher than 100 (Figure 2C). The uncertainty indices for men, women and all subjects were 154, 112 and 182, respectively.
For Ccr-adjusted datasets, the natural logarithmic model had the highest wight (0.5239), followed by the Hill model (0.1927) (Figure 2B). The BMDL values of (ECd/Ccr) ×100 producing a 5% Eβ2M/Ccr increment in endpoint 0.04, 0.08 and 0.03 µg/ L filtrate in men, women, and all subjects, respectively (Figure 2F). These ECd benchmarks were of a high degree of certainty, reflected by BMDU/BMDL ratios of 12, 11 and 15 for men, women and all subjects, respectively.
3.5. Cd Excretion Benchmarks Derived from CKD and Abnormal β2M Excretion Prevalences
Figure 3 presents the quantal BMD modeling of two CKD prevalence/ECd datasets, including bootstrap model averaging curves (Figure 3A, 3B), model weights (Figure 3C, 3D) and BMDL/BMDL values of ECd (Figure 3E, 3F).
For the Ecr-adjusted datasets, the weight of Hill model (0.3369) was the highest, followed by the logarithmic probability (0.2106) and the logarithmic logistic (0.1440) models (Figure 3C). Respective ECd/Ecr benchmark for a 5% CKD prevalence in men, women and all subjects were 1.76, 2.24 and 2.23 µg/g creatinine (Figure 3E). The uncertainty indices for the ECd/Ecr benchmark estimates for men, women and all subjects were 2.58, 4.15 and 2.82.
For the Ccr-adjusted datasets, the weight of the Gamma model (0.2406) was close to the Weibull model (0.2287) (Figure 3D). Respective ECd/Ecr benchmarks for a 5% CKD prevalence in men, women and all subjects were 3.33, 2.95 and 3.10 µg/g creatinine (Figure 3F). The uncertainty indices for the ECd/Ecr benchmark estimates for men, women and all subjects were 2.03, 2.14 and 2.00.
Figure 4 presents the quantal BMD modeling of two abnormal β2M excretion prevalence/ECd datasets, including bootstrap model averaging curves (Figure 4A, 4B), model weights (Figure 4C, 4D) and BMDL/BMDL values of ECd (Figure 4E, 4F).
For the Ecr-adjusted datasets, the weight of exponential model (0.5679) was the highest, followed by the Hill model (0.3310) (Figure 4C). Respective ECd/Ecr benchmarks for a 5% prevalence of Eβ2M/Ecr values ≥ 300 µg/g creatinine in men, women and all subjects were 0.869, 2.340 and 0.812 µg/g creatinine (Figure 4E). The uncertainty indices for the ECd/Ecr benchmark estimates were 4, 14.3 and 5.51 for men, women, and all subjects, respectively.
For the Ccr-adjusted datasets, the weights of the logarithmic probability model (0.3104) and the logarithmic logistic model (0.2753) were close (Figure 4D). Respective ECd/Ecr benchmarks for a 5% prevalence of (Eβ2M/Ccr ) × 100 values ≥ 300 µg/ L filtrate in men, women and all subjects were 1.10, 2.01 and 1.91 µg/L filtrate (Figure 4F). All estimated benchmarks were of the high statistical certainty, given that the uncertainty indices were as little as 1.10, 2.01 and 1.91 for men, women, and all subjects, respectively.
Equivalent quantal BMD modeling for prevalences of abnormal Eβ2M excretion values were conducted using two additional cut-off values; ≥100 and ≥1000 µg/g creatinine for Ecr-adjusted datasets and ≥100 and ≥1000 µg/ L filtrate for Ccr-adjusted datasets. Complete results are provided in Figures S1 and S2. Cd excretion benchmarks estimated from these cut-off values are displayed in Table 4 in comparison with those reported in Figure 3E, 3F,Figure 4E and 4F
For Ecr-normalized dataset, benchmark Cd excretion rates producing 5% prevalences of low eGFR, Eβ2M/Ecr values ≥ 100, ≥ 300 and 1000 µg/g creatinine were 1.76, 0.640, 0.812 and 2.35 µg/g creatinine, respectively. Notably, the benchmarks Cd excretion for 5% prevalence of Eβ2M/Ecr levels ≥ 1000 µg/g creatinine was higher than the figure for CKD (low eGFR).
For Ccr-normalized dataset, benchmark Cd excretion rates producing 5% prevalences of low eGFR, (Eβ2M/Ccr) ×100 values ≥ 100, ≥ 300 and 1000 µg/ L filtrate were 3.33, 0.93, 1.91 and 3.62 µg/L filtrate, respectively. Similarly, the benchmarks Cd excretion for 5% prevalence of (Eβ2M/Ccr) ×100 values ≥ 1000 µg/ L filtrate was higher than the figure for CKD (low eGFR).
4. Discussion
4.1. Cd Exposure as a Risk Factor for CKD
Consistent with a large body of literature, and a recent meta-analysis evaluating an effect of Cd exposure on CKD risk [10], we found that age, BMI, blood pressure and chronic exposure to Cd independently influenced risk for CKD, defined as eGFR falls to 60 mL/min/1.73 m2 or below. For every one-year older, CKD risk rose 6.8%, while BMI ≥ 24 kg/m2, doubling ECd/Ccr and hypertension raised risk of CKD 4.78-fold, 3.13-fold, and 2.66-fold, respectively (model B, Table 2).
As revealed by model A (Table 2), an independent effect of hypertension on CKD risk was obscure because of adjusting urinary Cd excretion to creatinine excretion (Ecr), denoted as ECd/Ecr. For the same reason, an effect size of Cd on CKD dropped 68%; the POR for CKD rose 1.98 vs. 3.13 by two-fold increments of ECd/Ecr vs. ECd/Ccr.
In addition, we have shown that adjusting ECd and Eβ2M to Ecr abolished a dose-response relationship between Cd exposure and the risk for abnormal β2M excretion (Table 3). The POR for β2M excretion levels 1, 2 and 3 in participants who had ECd/Ecr ≥ 2.50 µg/g creatinine increased 5.3-fold, 3.5-fold and 4.5-fold. In comparison, the POR for β2M excretion levels 1, 2 and 3 rose 5.8-fold, 6.4-fold and 15.4-fold in participants who had (ECd/Ccr) ×100 ≥ 5 µg/L filtrate. Thus, for accurate measurements of Cd exposure levels and kidney effects, urinary concentrations of Cd and biomarkers of kidney effects, e.g., β2M, should be normalized to creatinine clearance (Ccr).
4.2. Reduction in eGFR due to Cd-Induced Neprhon Destruction
Notably, the β2M excretion level 3 was most prevalent in those with low eGFR (CKD) (Table 3), thereby suggesting that a massive β2M excretion could be a consequence of nephron destruction due to the cytotoxicity of cumulative Cd in the proximal tubular cells of the kidneys [35]. A fall in eGFR at a high rate (≥ 3 mL/min/1.73 m2 per year) among cohort participants has been causally linked to Cd excretion in a longitudinal study from Switzerland [36]. In another prospective cohort study from Japan, a large decrease in eGFR was observed among participants who had β2M excretion rates above 300 µg/g creatinine, but an environmental exposure to toxic metals was not investigated [37].
4.3. Urinary Cd Benchmarks for the β2M Excretion and eGFR Reduction Endpoints
Most conventional BMD methods rely on a single dose-response model and arbitrary cut-off values to define departure from normalcy (a point of departure, POD). In toxicological risk assessment, POD represents the dose at which a specific adverse effect is first observed, or at which a response deviates from a baseline or control [21]. It is a starting point to evaluate the potential health impact of exposure to any health hazardous substance. PODs are used to estimate permissible exposure levels for chemicals in both environmental and occupational exposure settings.
Herein, we report, urinary Cd excretion levels that link to the conventional toxic endpoint, an elevation of β2M excretion and a newly proposed toxic endpoint, a reduction in eGFR, through advanced BMD modeling, involving multiple-dose response models, model weighs and averaging (Section 2.3). The use of AIC to assess performance of different models is another advantage of advance BMD modeling. In addition, exposure benchmark levels can be derived for continuous and quantal endpoints.
We were unable to determine urinary Cd excretion benchmarks for the β2M endpoint (Figure 2), but we have found urinary Cd excretion rate of 0.17 µg/g creatinine to be the benchmark level for an early effect of Cd on eGFR (Figure 1). Our findings cast considerable doubts on the use of β2M excretion in the assessment of the health risk from environmental Cd exposure. As discussed above, β2M excretion rates ≥ 300 µg/g creatinine did not appear to be an early effect of the nephrotoxicity of Cd, but a consequence of severe tubular dysfunction leading to nephron destruction and a fall of eGFR. Furthermore, a recent indebt analysis on the homeostasis of β2M has indicated that an elevated urinary excretion β2M is not a reliable indicator of tubular dysfunction [38]. Apparently, it is inappropriate to use β2M excretion rates above 300 µg/g creatinine in the assessment of the health risk from environmental Cd exposure.
We strongly recommend use of eGFR reduction as indicator of an adverse effect of Cd on the kidney. A reduction in eGFR is a clinically relevant outcome, and a Cd excretion benchmark of 0.17 µg/g creatinine could serve as a basis to compute a meaningful dietary exposure limit for Cd. This figure is 3.2 % of the threshold level at 5.24 µg/g creatinine, the JECFA derived from the β2M endpoint. Furthermore, a declining eGFR can be used in predicting outcomes of changes in dietary Cd exposure guidelines on CKD prevalence [9]. To this end urinary Cd excretion quantal benchmarks for 5% prevalence of low eGFR are provided in Table 4 together with 5% prevalence of abnormal β2M excretion rates.
5. Conclusions
Using multiple mathematical dose-response models and Bootstrap model averaging approach, the benchmark of Cd excretion is 0.17 µg/g creatinine, when a reduction in eGFR is used as a toxic endpoint. The Cd excretion benchmark for the conventional β2M endpoint is unreliable because of a high degree of uncertainty around the BMD estimates (BMDU/BMDL >100).
The practice of adjusting urinary Cd and β2M concentrations to creatinine excretion create non-differential errors that bias the dose-response relationships toward the null [16]. Such measurement errors/imprecisions can be attributed to the variation in creatinine excretion because of the differences in muscle mass, especially between men and women. A dose-response relationship could not be established between Cd exposure and the severity of the abnormality in β2M excretion rates (Table 3). Thus, use of β2M excretion at a rate higher than 300 µg/g creatinine in Cd health risk computation is a conceptual flaw.
Excretion of any urinary marker of kidney effects, Cd included, should be adjusted to creatinine clearance. This adjustment is achieved by using a generic mathematical equation; Ex/Ccr = [x]u[cr]p/[cr]u. Hence, a timed urine collection is obliviated. This method of adjusting urinary concentration of excreted substances corrects for interindividual differences in both urine dilution and functioning nephrons, and it is not affected by muscle mass.
Supplementary Materials
The following supporting information can be downloaded at the website of this paper posted on Preprints.org, Figure S1: Cadmium excretion rates associated with 5% prevalence of β2M excretion level 1; Figure S2: Cadmium excretion rates associated with 5% prevalence of β2M excretion level 3.
Author Contributions
Conceptualization, S.S. and D.A.V.; methodology, S.S. and A.B.Đ; formal analysis, S.S. and A.B.Đ.; resources, D.A.V.; data curation, S.S.; writing—original draft preparation, S.S.; writing—review and editing, S.S.; D.A.V. and A.B.Đ. All authors have read and agreed to the published version of the manuscript.
Funding
This research received no external funding.
Institutional Review Board Statement
This study analyzed the archived data, for which the ethical approval was obtained when the original study was conducted, thereby obviating the need for additional ethical approval.
Informed Consent Statement
Not applicable.
Data Availability Statement
The data of this study are available from the corresponding author upon reasonable request.
Acknowledgments
The work was supported with resources from the Centre for Kidney Disease Research, Translational Research Institute, and the Department of Kidney and Transplant Services, Princess Alexandra Hospital, QLD, Australia.
Conflicts of Interest
The authors declare no conflicts of interest.
References
- Aoshima, K. Epidemiology of renal tubular dysfunction in the inhabitants of a cadmium-polluted area in the Jinzu River basin in Toyama Prefecture. Tohoku J. Exp. Med. 1987, 152, 151–172. [Google Scholar] [CrossRef]
- Cai, Y.; Aoshima, K.; Katoh, T.; Teranishi, H.; Kasuya, M. Renal tubular dysfunction in male inhabitants of a cadmium-polluted area in Toyama, Japan - an eleven-year follow-up study. J. Epidemiol. 2001, 11, 180–189. [Google Scholar] [CrossRef]
- Sasaki, T.; Horiguchi, H.; Matsukawa, T.; Kobayashi, M.; Omori, Y.; Oguma, E.; Komatsuda, A. A suspected case of “itai-itai disease” in a cadmium-polluted area in Akita prefecture, Japan. Environ. Health. Prev. Med. 2024, 29, 40. [Google Scholar] [CrossRef] [PubMed]
- Horiguchi, H.; Aoshima, K.; Oguma, E.; Sasaki, S.; Miyamoto, K.; Hosoi, Y.; Katoh, T.; Kayama, F. Latest status of cadmium accumulation and its effects on kidneys, bone, and erythropoiesis in inhabitants of the formerly cadmium-polluted Jinzu River Basin in Toyama, Japan, after restoration of rice paddies. Int. Arch. Occup. Environ. Health 2010, 83, 953–970. [Google Scholar] [CrossRef] [PubMed]
- Joint FAO/WHO Expert Committee on Food Additives (JECFA). Summary and Conclusions. In Proceedings of the Joint FAO/WHO Expert Committee on Food Additives and Contaminants, Seventy-Third Meeting, Geneva, Switzerland, 8–17 June 2010. Available online: https://apps.who.int/iris/handle/10665/44521 (accessed on 25 September 2025).
- Wong, C.; Roberts, S. M.; Saab, I. N. Review of regulatory reference values and background levels for heavy metals in the human diet. Regul. Toxicol. Pharmacol. 2022, 130, 105122. [Google Scholar] [CrossRef]
- Crump, K. S. A new method for determining allowable daily intakes. Fundam. Appl. Toxicol. 1984, 4, 854–871. [Google Scholar] [CrossRef]
- Gaylor, D.; Ryan, L.; Krewski, D.; Zhu, Y. Procedures for calculating benchmark doses for health risk assessment. Regul. Toxicol. Pharmacol. 1998, 28, 150–164. [Google Scholar] [CrossRef]
- Ginsberg, G.L. Cadmium risk assessment in relation to background risk of chronic kidney disease. J. Toxicol. Environ. Health Part A 2012, 75, 374–390. [Google Scholar] [CrossRef]
- Doccioli, C.; Sera, F.; Francavilla, A.; Cupisti, A.; Biggeri, A. Association of cadmium environmental exposure with chronic kidney disease: A systematic review and meta-analysis. Sci. Total Environ. 2024, 906, 167165. [Google Scholar] [CrossRef]
- Foreman, K.J.; Marquez, N.; Dolgert, A.; Fukutaki, K.; Fullman, N.; McGaughey, M.; Pletcher, M.A.; Smith, A.E.; Tang, K.; Yuan, C.W.; et al. Forecasting life expectancy, years of life lost, and all-cause and cause-specific mortality for 250 causes of death: Reference and alternative scenarios for 2016-40 for 195 countries and territories. Lancet 2018, 392, 2052–2090. [Google Scholar] [CrossRef] [PubMed]
- GBD 2021 Forecasting Collaborators. Burden of disease scenarios for 204 countries and territories, 2022-2050: a forecasting analysis for the Global Burden of Disease Study 2021. Lancet 2024, 403, 2204–2256. [Google Scholar] [CrossRef]
- Murton, M.; Goff-Leggett, D.; Bobrowska, A.; Garcia Sanchez, J.J.; James, G.; Wittbrodt, E.; Nolan, S.; Sörstadius, E.; Pecoits-Filho, R.; Tuttle, K. Burden of Chronic Kidney Disease by KDIGO Categories of Glomerular Filtration Rate and Albuminuria: A Systematic Review. Adv. Ther. 2021, 38, 180–200. [Google Scholar] [CrossRef] [PubMed]
- Kalantar-Zadeh, K.; Jafar, T.H.; Nitsch, D.; Neuen, B.L.; Perkovic, V. Chronic kidney disease. Lancet 2021, 398, 786–802. [Google Scholar] [CrossRef]
- Farrell, D.R.; Vassalotti, J.A. Screening, identifying, and treating chronic kidney disease: Why, who, when, how, and what? BMC Nephrol. 2024, 25, 34. [Google Scholar] [CrossRef]
- Grandjean, P.; Budtz-Jørgensen, E. Total imprecision of exposure biomarkers: Implications for calculating exposure limits. Am. J. Ind. Med. 2007, 50, 712–719. [Google Scholar] [CrossRef]
- Byber, K.; Lison, D.; Verougstraete, V.; Dressel, H.; Hotz, P. Cadmium or cadmium compounds and chronic kidney disease in workers and the general population: A systematic review. Crit. Rev. Toxicol. 2016, 46, 191–240. [Google Scholar] [CrossRef]
- Jalili, C.; Kazemi, M.; Cheng, H.; Mohammadi, H.; Babaei, A.; Taheri, E.; Moradi, S. Associations between exposure to heavy metals and the risk of chronic kidney disease: A systematic review and meta-analysis. Crit. Rev. Toxicol. 2021, 51, 165–182. [Google Scholar] [CrossRef]
- Slob, W.; Setzer, R.W. Shape and steepness of toxicological dose-response relationships of continuous endpoints. Crit. Rev. Toxicol. 2014, 44, 270–297. [Google Scholar] [CrossRef] [PubMed]
- Slob, W. A general theory of effect size, and its consequences for defining the benchmark response (BMR) for continuous endpoints. Crit. Rev. Toxicol. 2017, 47, 342–351. [Google Scholar] [CrossRef] [PubMed]
- Moffett, D.B.; Mumtaz, M.M.; Sullivan, D.W., Jr.; Whittaker, M.H. Chapter 13, General Considerations of Dose-Effect and Dose-Response Relationships. In Handbook on the Toxicology of Metals, 5th ed.; Volume I: General, Considerations, Nordberg, G., Costa, M., Eds.; Academic Press: Cambridge, MA, USA, 2022; pp. 299–317. [Google Scholar]
- EFSA Scientific Committee. Update: Use of the benchmark dose approach in risk assessment. EFSA J. 2017, 15, 4658. [Google Scholar] [CrossRef]
- Satarug, S.; Đorđević, A.B.; Yimthiang, S.; Vesey, D.A.; Gobe, G.C. The NOAEL Equivalent of Environmental Cadmium Exposure Associated with GFR Reduction and Chronic Kidney Disease. Toxics 2022, 10, 614. [Google Scholar] [CrossRef] [PubMed]
- Apple, F.; Bandt, C.; Prosch, A.; Erlandson, G.; Holmstrom, V.; Scholen, J.; Googins, M. Creatinine clearance: Enzymatic vs Jaffé determinations of creatinine in plasma and urine. Clin. Chem. 1986, 32, 388–390. [Google Scholar] [CrossRef]
- Bernard, A.M.; Vyskocil, A.; Lauwerys, R.R. Determination of beta 2-microglobulin in human urine and serum by latex immunoassay. Clin. Chem. 1981, 27, 832–837. [Google Scholar] [CrossRef]
- Trzcinka-Ochocka, M.; Brodzka, R.; Janasik, B. Useful and Fast Method for Blood Lead and Cadmium Determination Using ICP-MS and GF-AAS; Validation Parameters. J. Clin. Lab. Anal. 2016, 30, 130–139. [Google Scholar] [CrossRef]
- Hornung, R.W.; Reed, L.D. Estimation of average concentration in the presence of nondetectable values. Appl. Occup. Environ. Hyg. 1990, 5, 46–51. [Google Scholar] [CrossRef]
- Levey, A.S.; Becker, C.; Inker, L.A. Glomerular filtration rate and albuminuria for detection and staging of acute and chronic kidney disease in adults: A systematic review. JAMA 2015, 313, 837–846. [Google Scholar] [CrossRef] [PubMed]
- Phelps, K.R.; Gosmanova, E.O. A generic method for analysis of plasma concentrations. Clin. Nephrol. 2020, 94, 43–49. [Google Scholar] [CrossRef] [PubMed]
- Sand, S. J.; von, Rosen. D.; Filipsson, A. F. Benchmark calculations in risk assessment using continuous dose-response information: the influence of variance and the determination of a cut-off value. Risk. Anal. 2003, 23, 1059-1068.
- Slob, W.; Moerbeek, M.; Rauniomaa, E.; Piersma, A. H. A statistical evaluation of toxicity study designs for the estimation of the benchmark dose in continuous endpoints. Toxicol. Sci. 2005, 84, 167–185. [Google Scholar] [CrossRef]
- Sand, S.; Filipsson, A. F.; Victorin, K. Evaluation of the benchmark dose method for dichotomous data: model dependence and model selection. Regul. Toxicol. Pharmacol. 2002, 36, 184–197. [Google Scholar] [CrossRef]
- Slob, W.; Setzer, R. W. Shape and steepness of toxicological dose-response relationships of continuous endpoints. Crit. Rev. Toxicol. 2014, 44, 270–297. [Google Scholar] [CrossRef]
- Zhu, Y.; Wang, T.; Jelsovsky, J. Z. Bootstrap estimation of benchmark doses and confidence limits with clustered quantal data. Risk. Anal. 2007, 27, 447–465. [Google Scholar] [CrossRef]
- Satarug, S.; Vesey, D.A.; Nishijo, M.; Ruangyuttikarn, W.; Gobe, G.C. The inverse association of glomerular function and urinary β2-MG excretion and its implications for cadmium health risk assessment. Environ. Res. 2019, 173, 40–47. [Google Scholar] [CrossRef] [PubMed]
- Xie, S.; Perrais, M.; Golshayan, D.; Wuerzner, G.; Vaucher, J.; Thomas, A.; Marques-Vidal, P. Association between urinary heavy metal/trace element concentrations and kidney function: A prospective study. Clin. Kidney J. 2024, 18, sfae378. [Google Scholar] [CrossRef] [PubMed]
- Kudo, K.; Konta, T.; Mashima, Y.; Ichikawa, K.; Takasaki, S.; Ikeda, A.; Hoshikawa, M.; Suzuki, K.; Shibata, Y.; Watanabe, T.; et al. The association between renal tubular damage and rapid renal deterioration in the Japanese population: The Takahata study. Clin. Exp. Nephrol. 2011, 15, 235–241. [Google Scholar] [CrossRef]
- Phelps, K. R.; Yimthiang, S.; Pouyfung, P.; Khamphaya, T.; Vesey, D. A.; Satarug, S. Homeostasis of β2-microglobulin in diabetics and non-diabetics with modest cadmium intoxication. J. Environ. Expo. Assess. 2025, 4, 23. [Google Scholar] [CrossRef]
Figure 1.
Cadmium excretion benchmarks for a 5% reduction in eGFR. Bootstrap dose-response model averaging for eGFR-ECd/Ecr (A) and eGFR-ECd/Ccr (C); Model weights for ECd/Ecr (B) and ECd/Ccr (E); BMDL/BMDU values for ECd/Ecr (C) and ECd/Ccr (F). × and △ represent male and female participants, respectively. eGFR: Estimated glomerular filtration rate; Cd: cadmium; Ecr: creatinine excretion; BMDL: benchmark dose limit; ECd: urinary Cd; BMDU: upper 95% confidence bound of BMD.
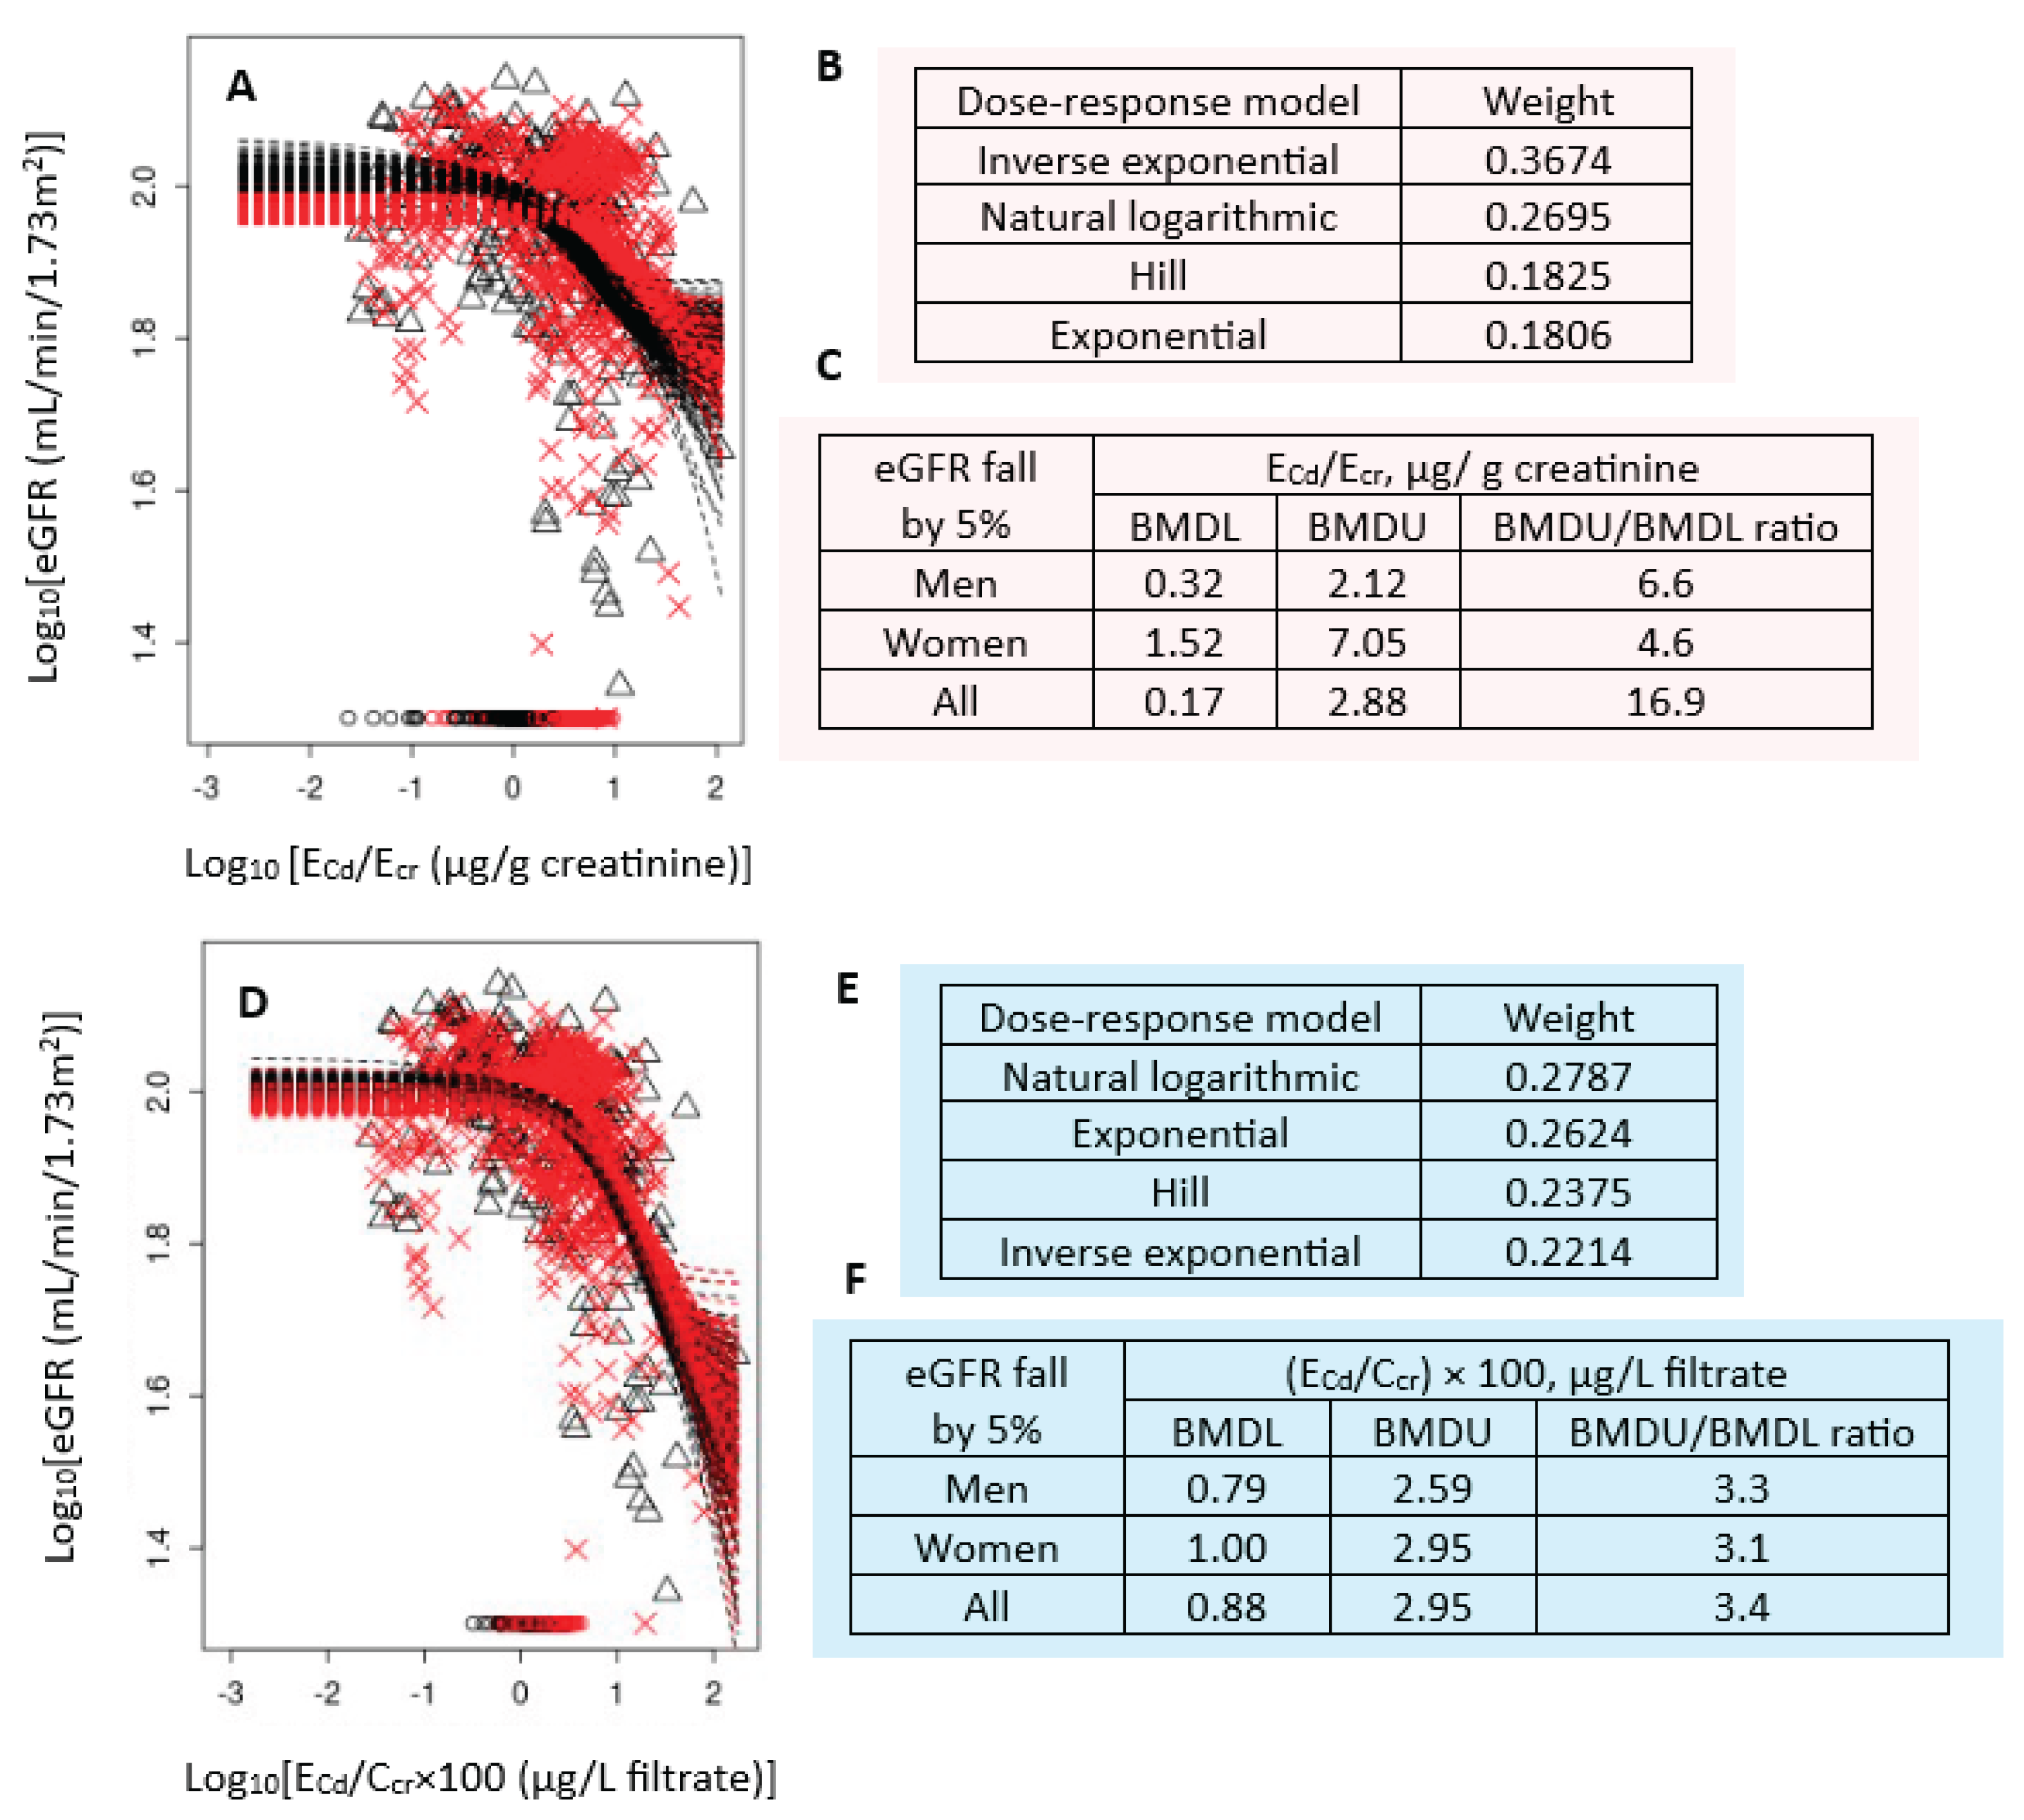
Figure 2.
Cadmium excretion benchmarks for a 5% increase in β2M excretion levels. Bootstrap dose-response model averaging for Eβ2M/Ecr-ECd/Ecr (A) and Eβ2M/Ccr-ECd/Ccr (D); Model weights for Eβ2M/Ecr (B) and Eβ2M/Ccr (E); BMDL/BMDU values ECd/Ecr (C) and ECd/Ccr (F). × and △ represent male and female participants, respectively. β2M: β2-microglobulin; Eβ2M: urinary β2M; Cd: cadmium; Ecr: creatinine excretion; BMDL: benchmark dose limit; ECd: urinary Cd; BMDU: upper 95% confidence bound of BMD.
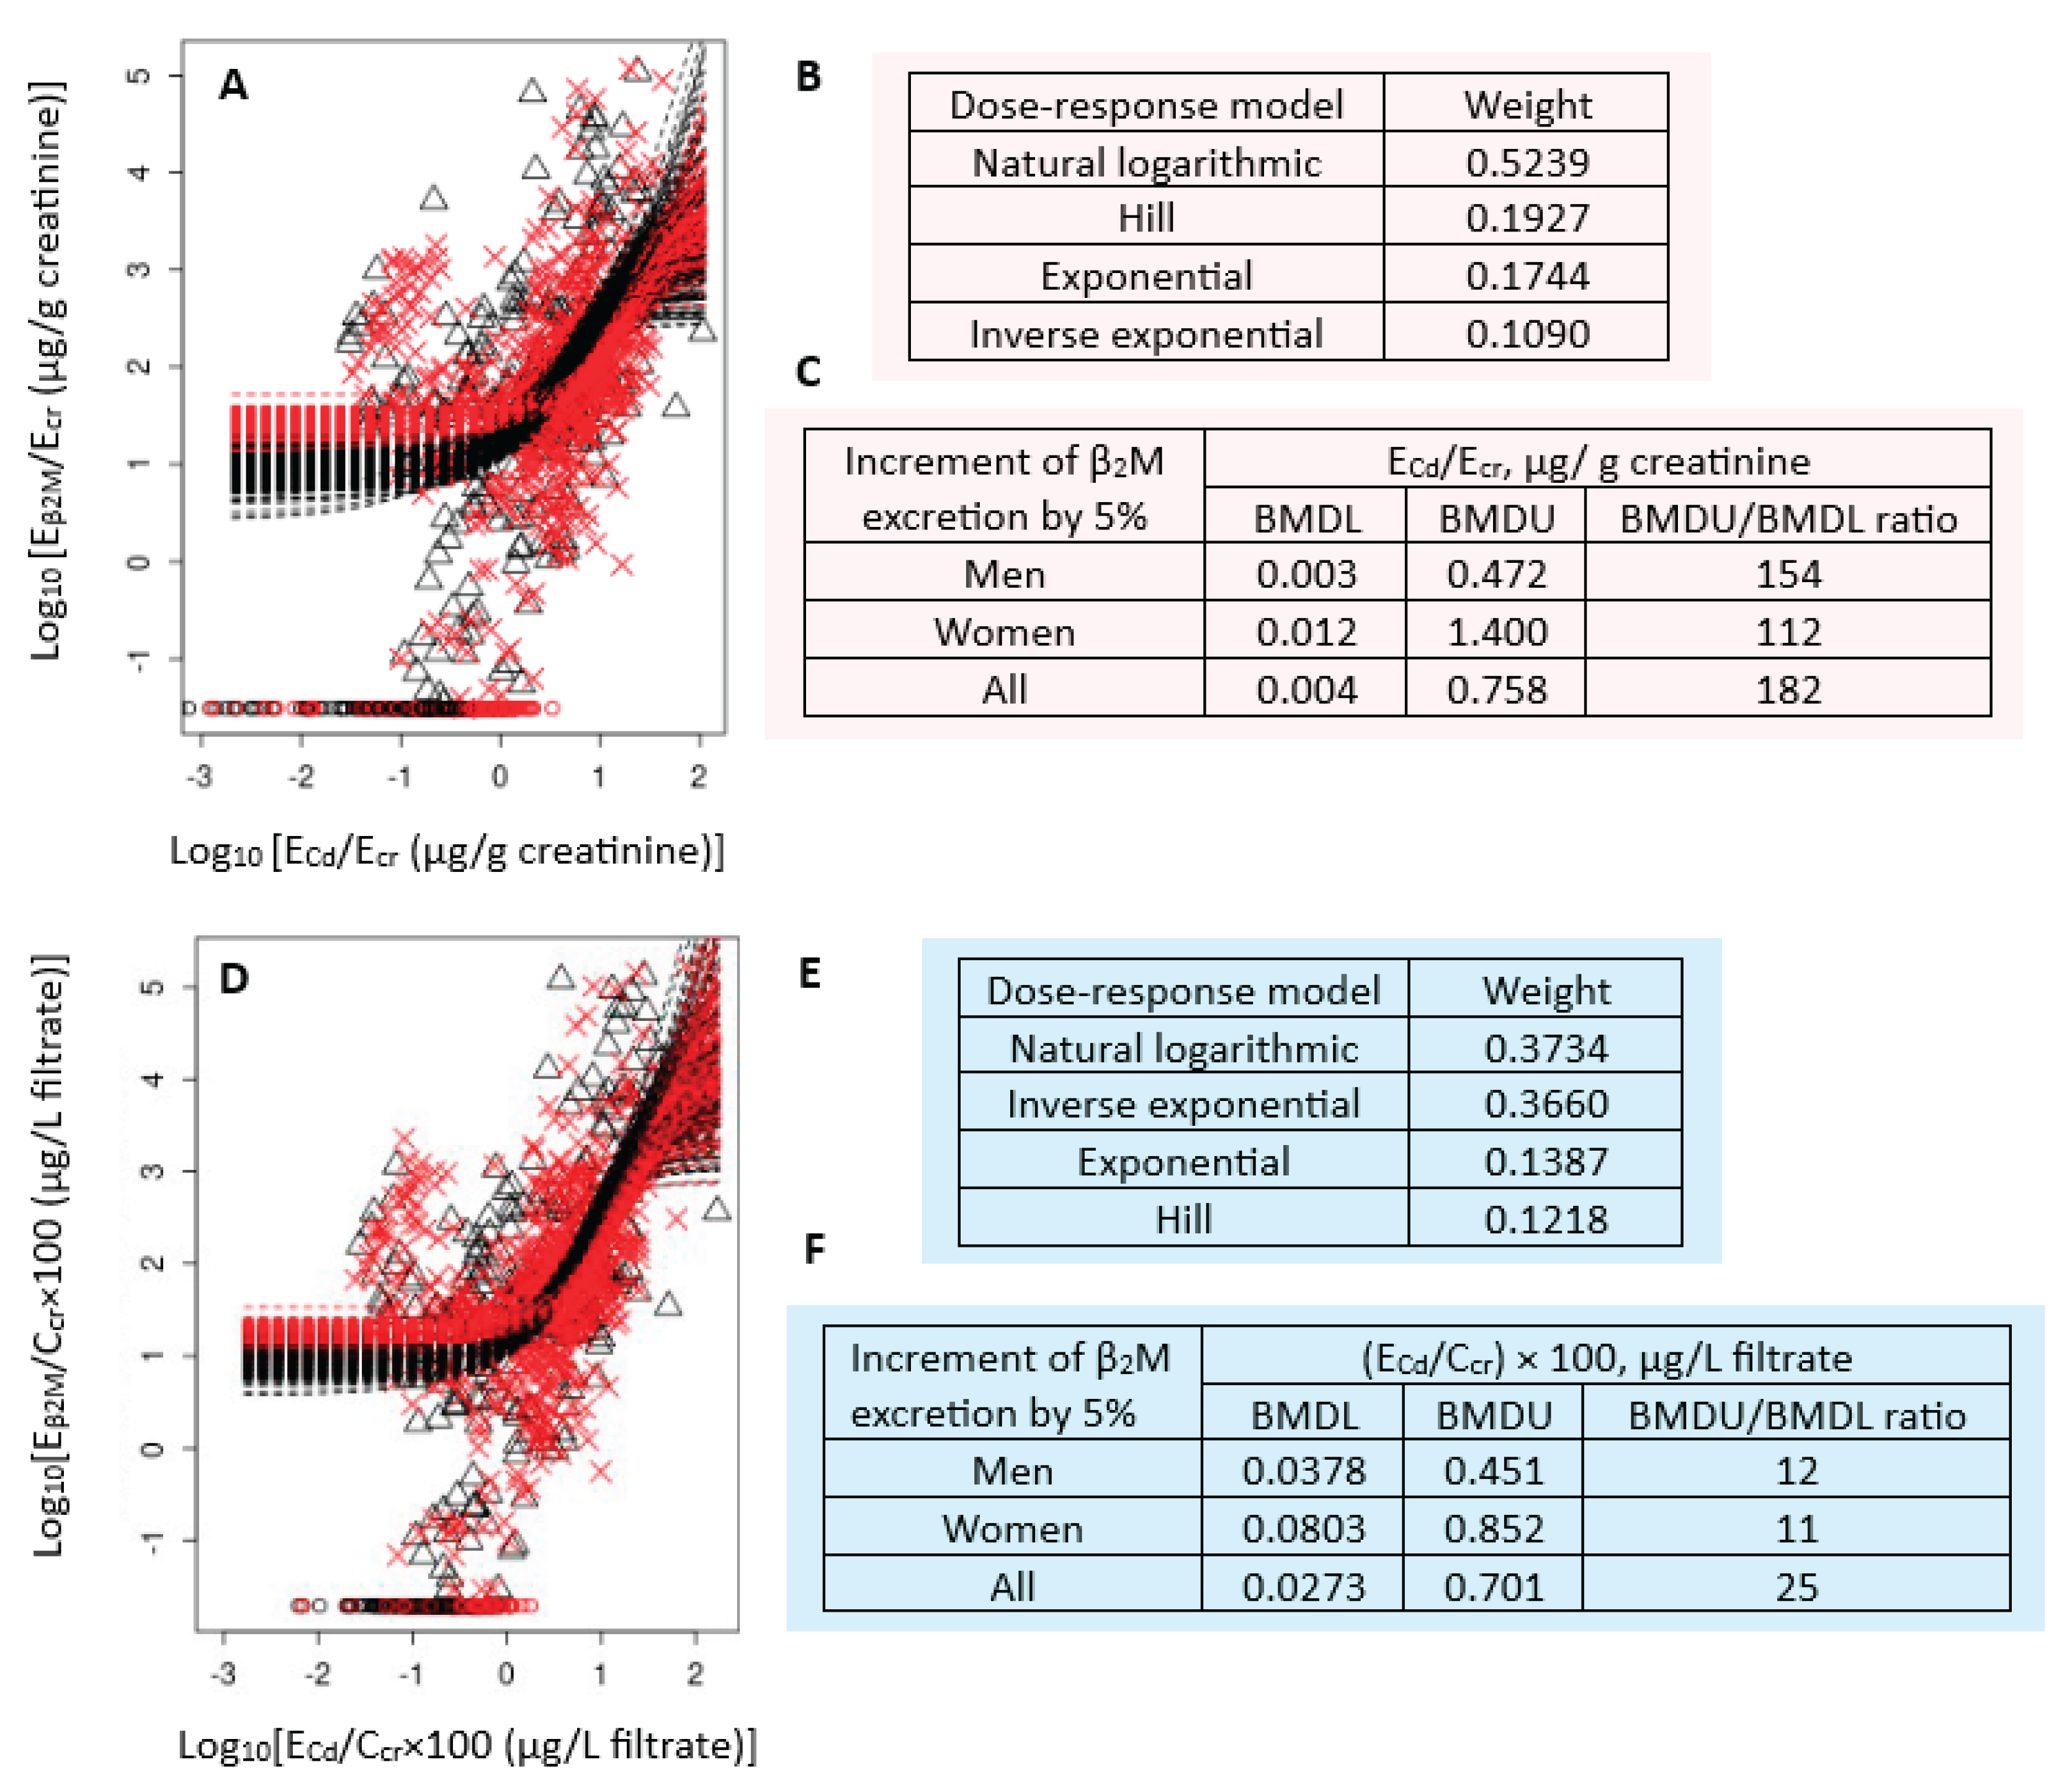
Figure 3.
Cadmium excretion levels associated with 5% prevalences of CKD. Bootstrap dose-effect model averaging for CKD prevalence/ECd/Ecr (A) CKD prevalence/ECd/Ccr (B). Model weights for ECd/Ecr (C) and ECd/Ccr (D). BMDL5/BMDU5 values of ECd/Ecr (E) ECd/Ccr (F). a CKD was defined as eGFR ≤ 60 mL/min/1.73 m2. CKD: chronic kidney disease; Cd: cadmium; ECd: urinary Cd; Ecr: creatinine excretion; BMDL: benchmark dose limit; BMDU: upper 95% confidence bound of BMD.
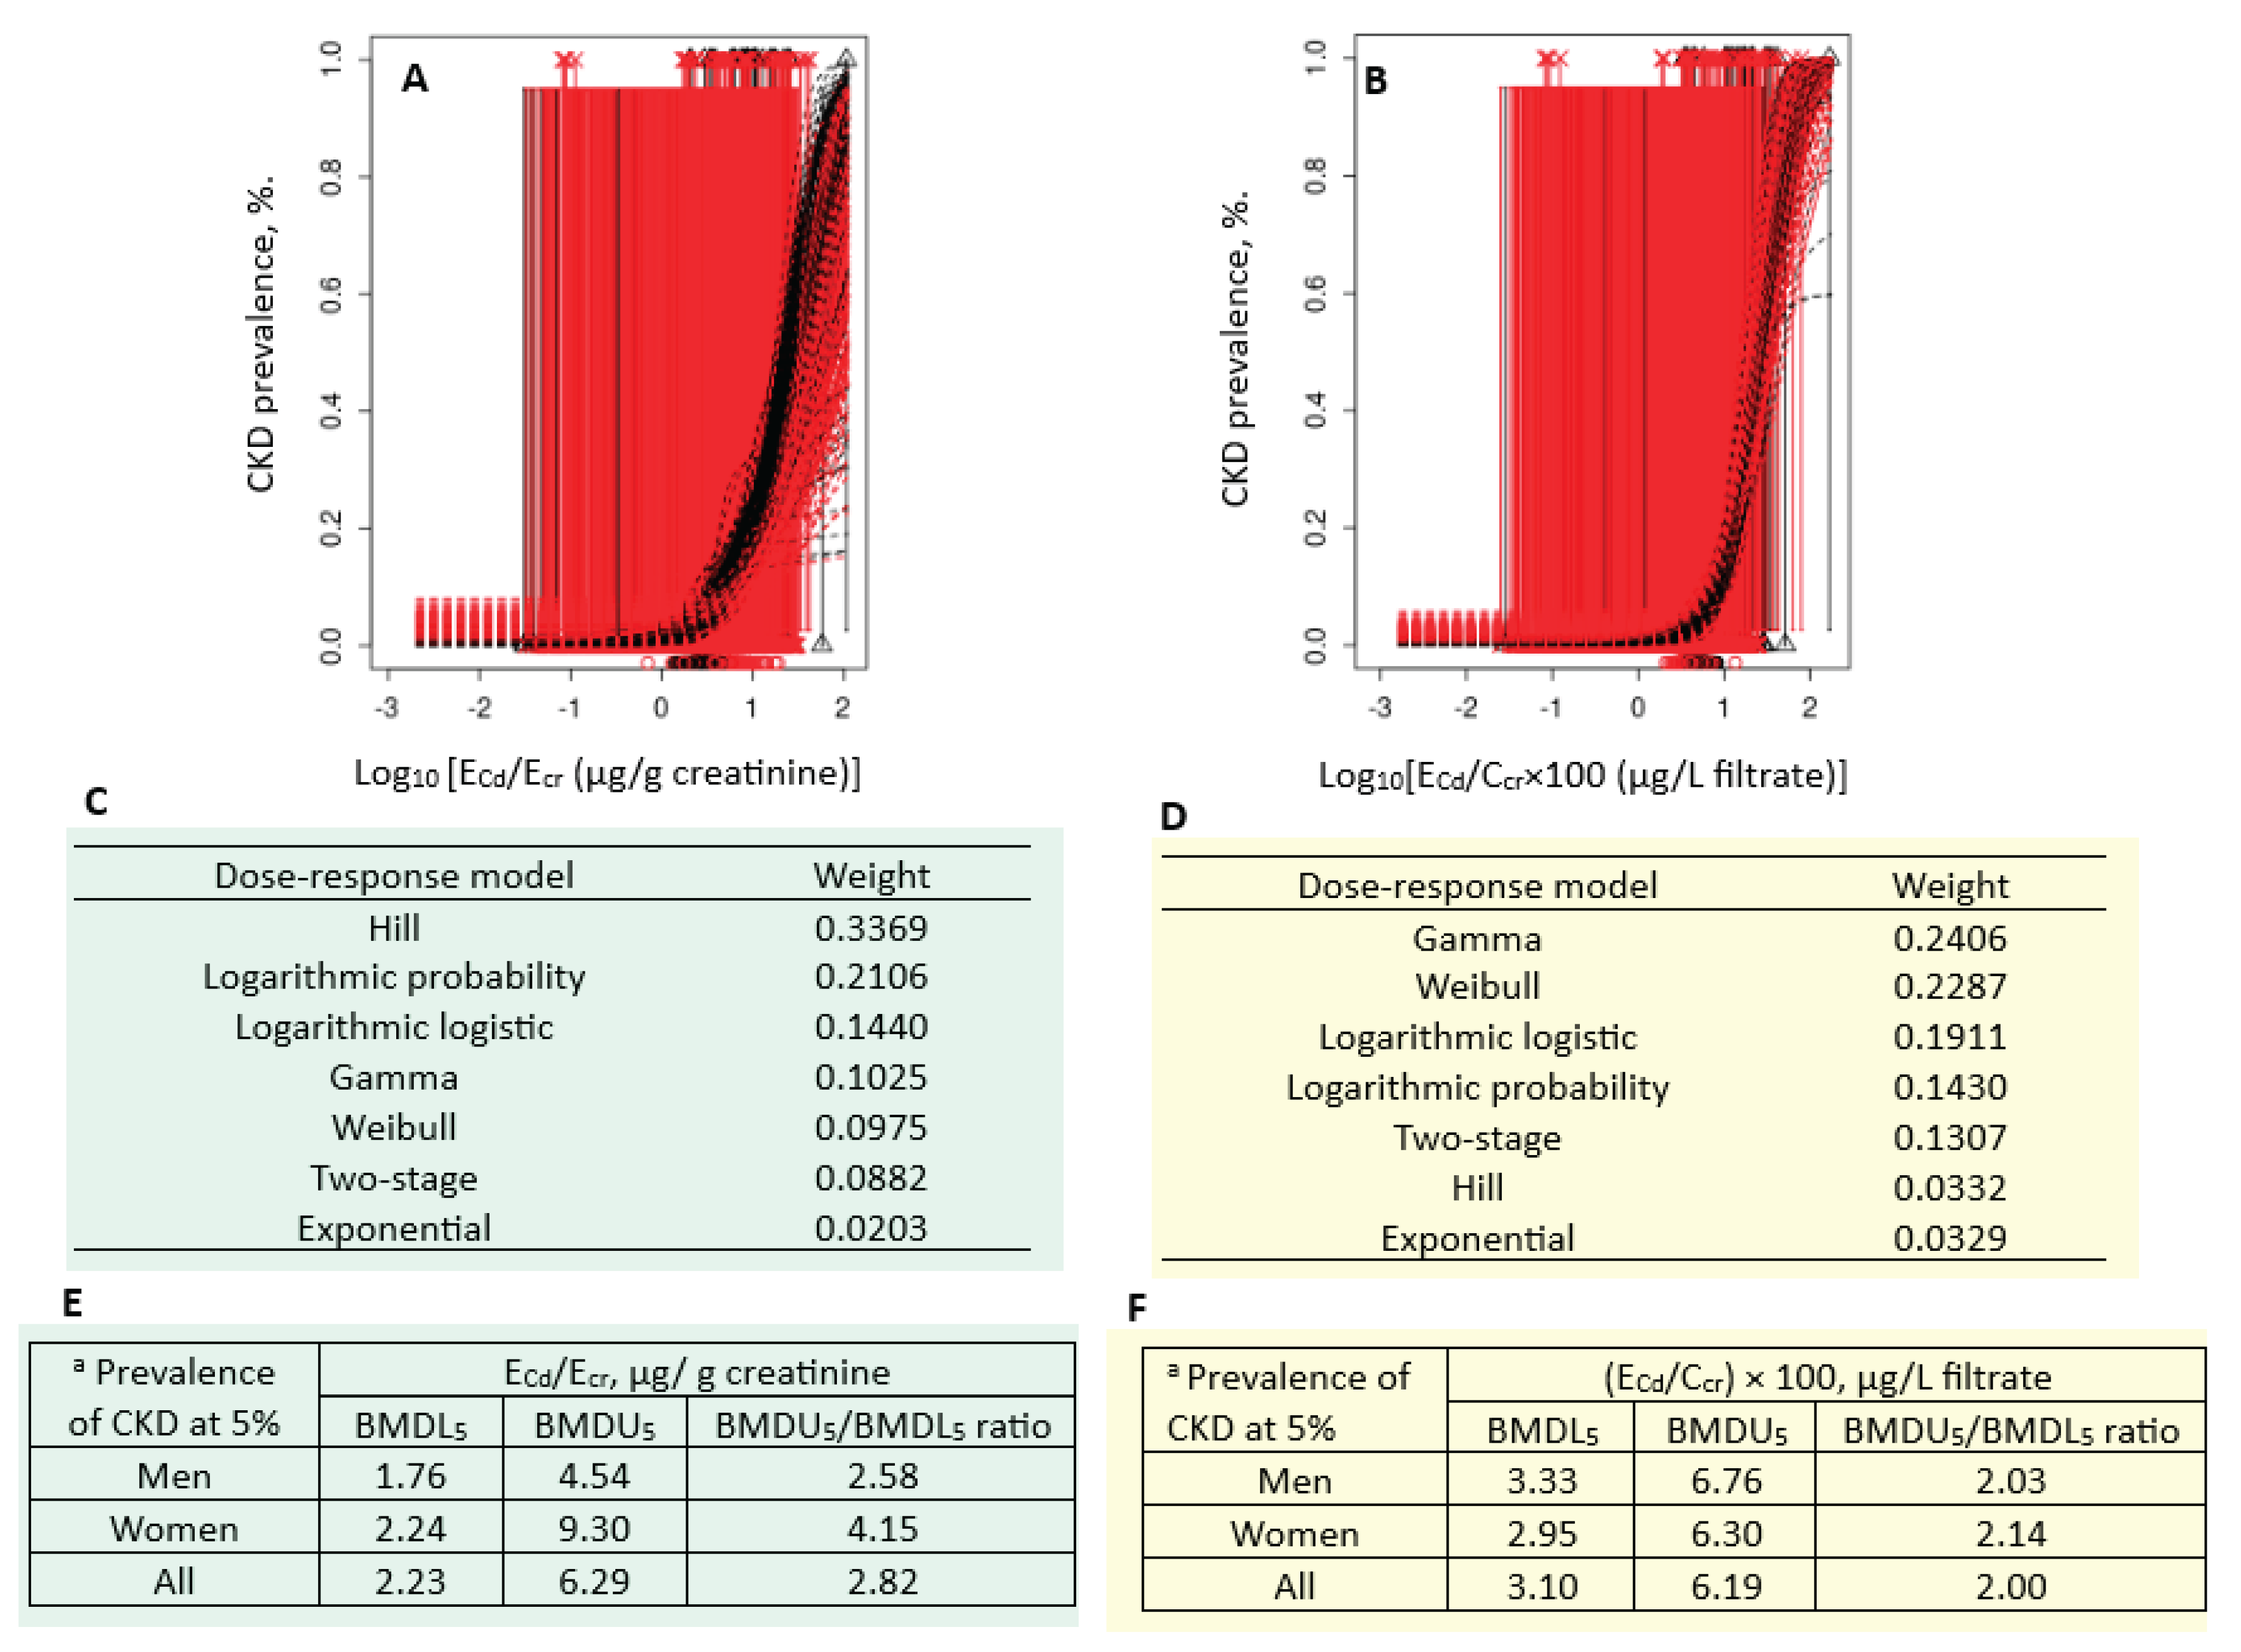
Figure 4.
Cadmium excretion rates associated with 5% prevalence β2M excretion level 2. Bootstrap dose-effect model averaging for Eβ2M/Ecr (A) Eβ2M/Ccr (B). Model weights for Eβ2M/Ecr (C) and Eβ2M/Ccr (D). BMDL5/BMDU5 values of ECd/Ecr (E) and ECd/Ccr (F). a Eβ2M/Ecr level 2 was defined as Eβ2M/Ecr ≥ 300 µg/g creatinine. b Eβ2M/Ccr level 2 was defined as (Eβ2M/Ccr) ×100 ≥ 300 µg/L filtrate. β2M: β2-microglobulin; Eβ2M: urinary β2M; Cd: cadmium; ECd: urinary Cd; Ecr: creatinine excretion; BMDL: benchmark dose limit; BMDU: upper 95% confidence bound of BMD.
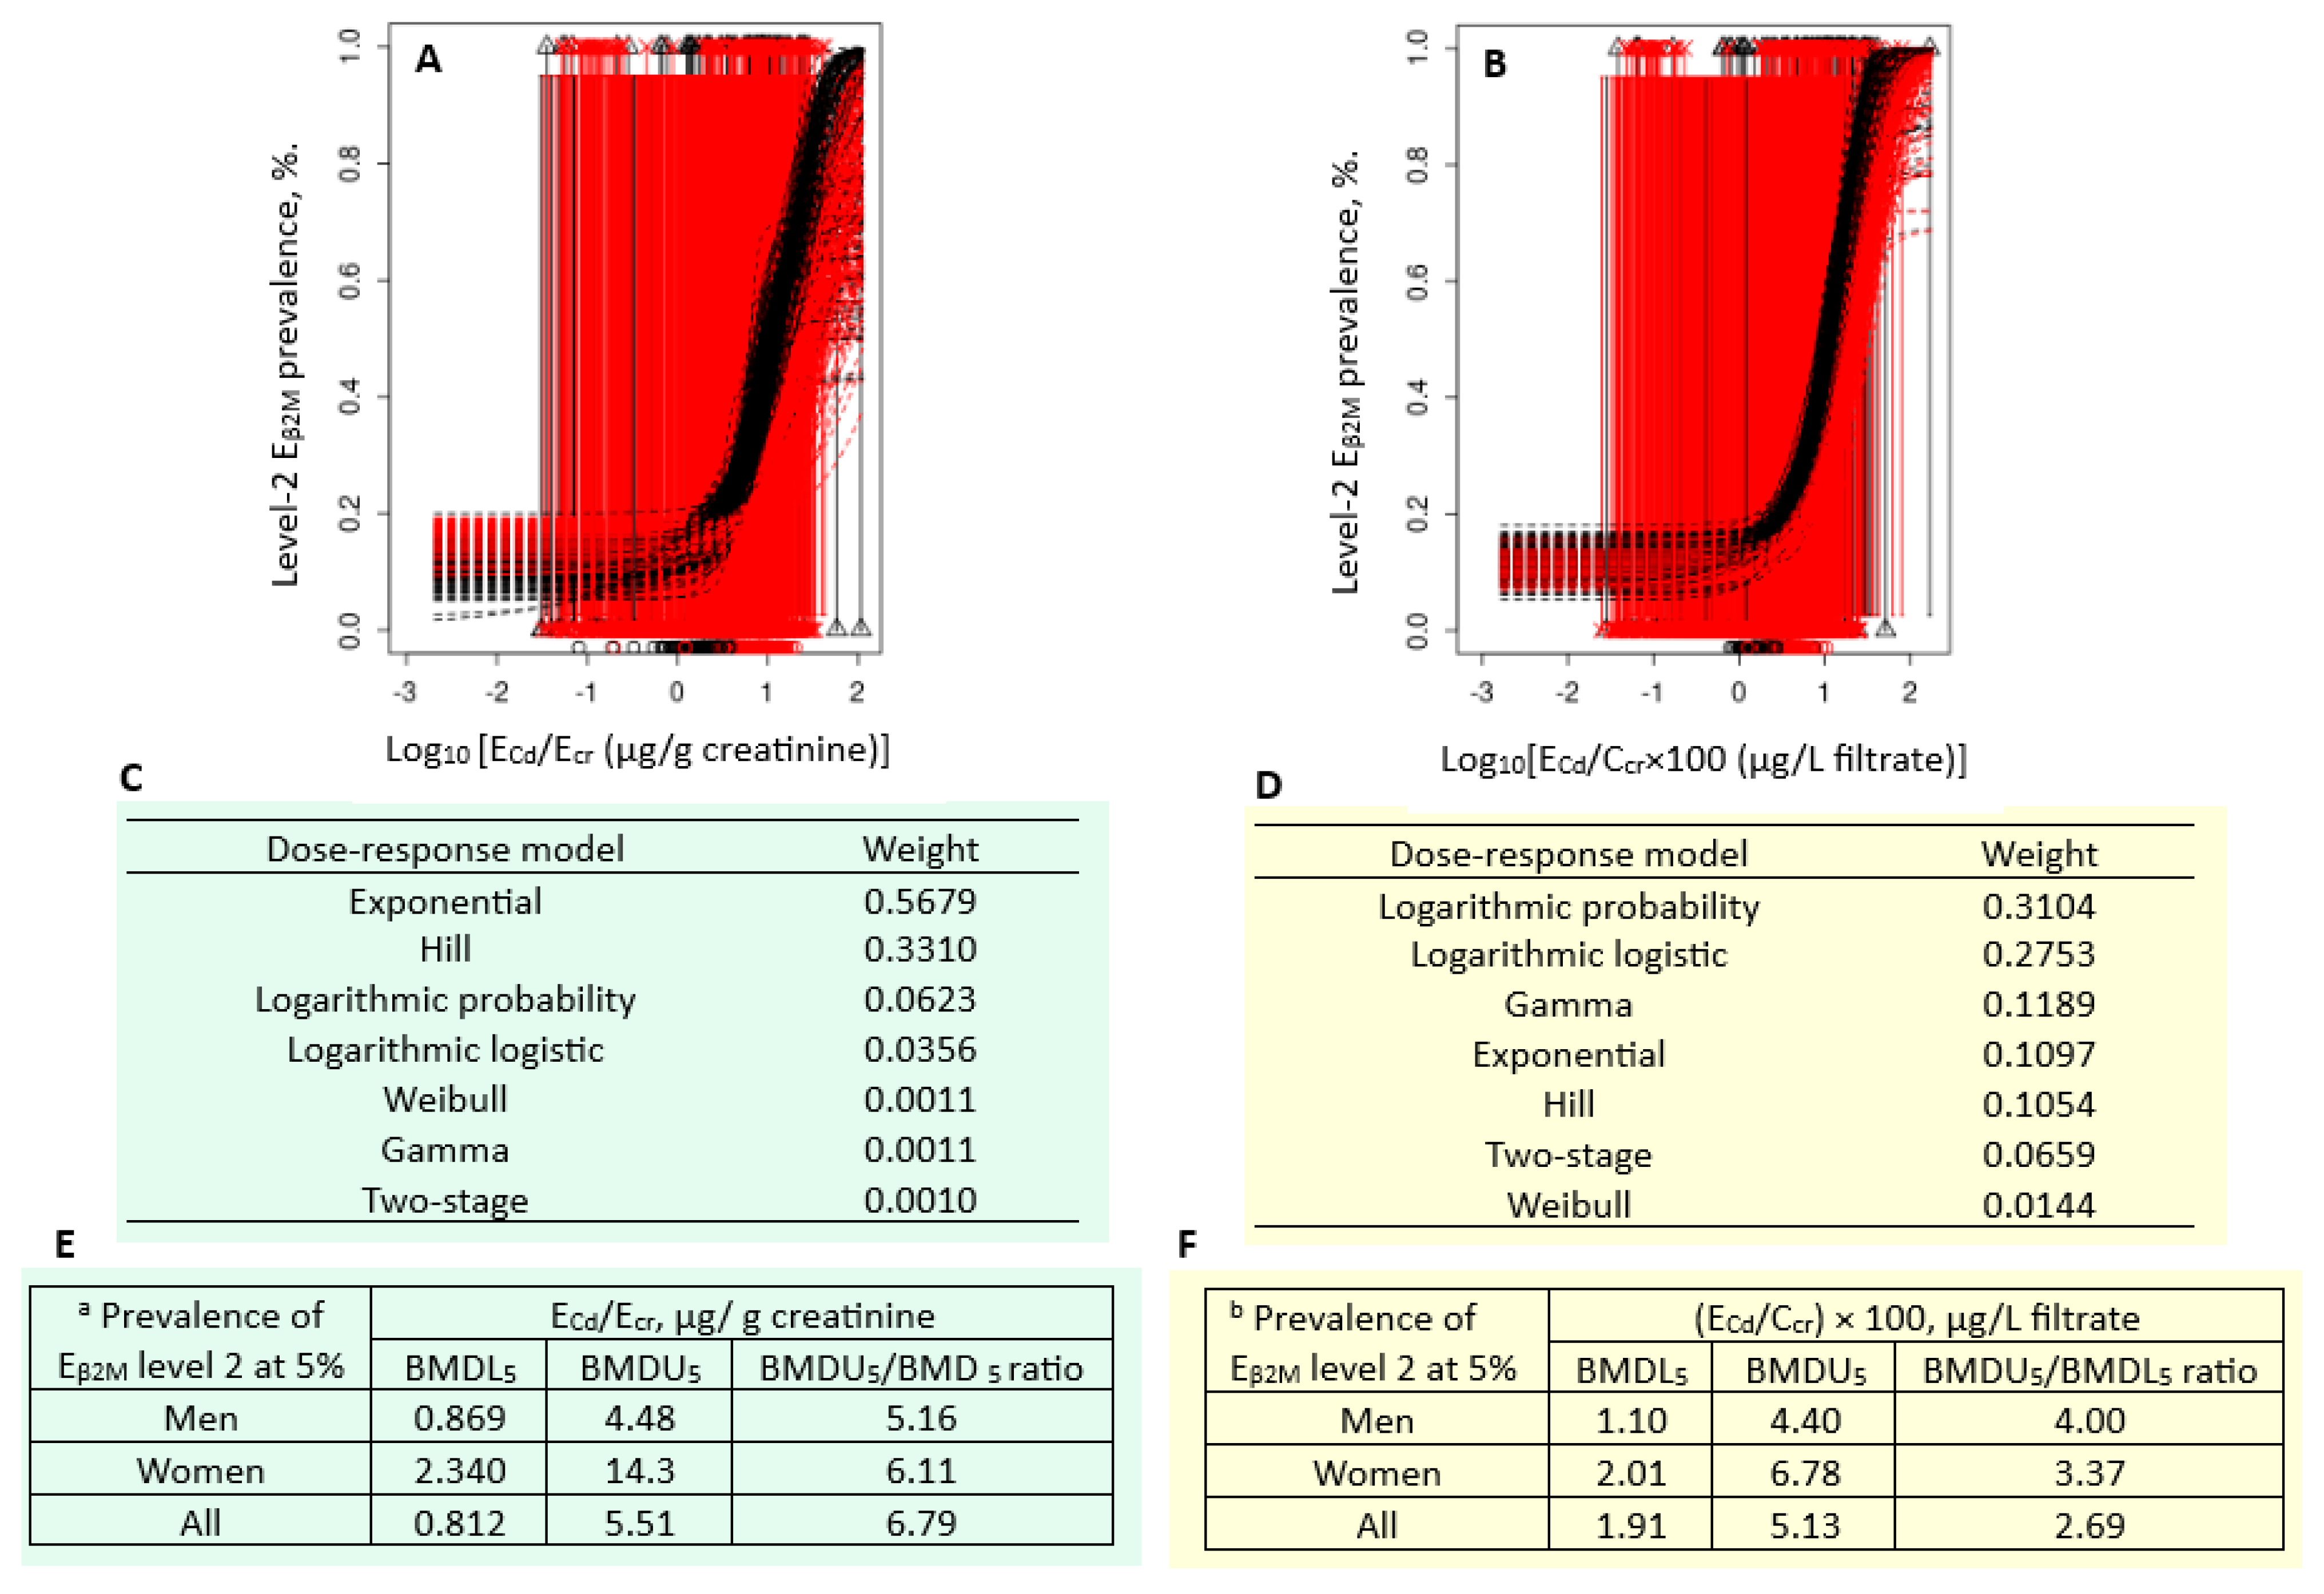

Table 1.
Characteristics of study subjects grouped by eGFR.
| Variables | All Subjects n = 799 |
eGFR, mL/min/1.73 m2 | p | ||
|---|---|---|---|---|---|
| ≥ 90, n = 426 | 61−89, n = 303 | ≤ 60, n = 70 | |||
| Age, years | 49.2 (11.5) | 43.7 (9.5) | 53.5 (8.9) | 63.9 (11.1) | <0.001 |
| Age range, years | 18−87 | 16−73 | 28−80 | 44 −87 | − |
| BMI, kg/m2 | 23.3 (3.9) | 23.6 (3.8) | 23.2 (3.9) | 22.3 (4.3) | 0.088 |
| eGFR, mL/min/1.73 m2 | 90 (21) | 106 (10) | 77 (8) | 47 (11) | <0.001 |
| Women, % | 62.5 | 59.9 | 66.3 | 61.4 | 0.202 |
| Hypertension, % | 32.5 | 30.0 | 34.1 | 42.9 | 0.101 |
| Smoking, % | 42.7 | 34.6 | 50.6 | 63.5 | <0.001 |
| ECd/Ecr, µg/g creatinine | 5.24 (7.31) | 3.74 (5.16) | 5.76 (6.21) | 12.16 (14.89) | <0.001 |
| Eβ2M/Ecr, µg/g creatinine | 1425 (8449) | 88 (176) | 909 (6539) | 11788 (22738) | <0.001 |
| Eβ2M/Ecr, µg/g creatinine, % | |||||
| ≥ 100 | 31.8 | 20.0 | 37.0 | 81.4 | <0.001 |
| ≥ 300 | 16.1 | 6.3 | 18.5 | 65.7 | <0.001 |
| ≥ 1000 | 8.9 | 0.9 | 9.2 | 55.7 | <0.001 |
| (ECd/Ccr) ×100, µg/L filtrate | 5.05 (9.32) | 2.68 (3.99) | 5.47 (5.94) | 17.67 (23.57) | <0.001 |
| (Eβ2M/Ccr) ×100, µg/L filtrate | 2071 (12835) | 67 (140) | 960 (7716) | 19082 (56344) | <0.001 |
| (Eβ2M/Ccr) ×100, µg/L filtrate, % | |||||
| ≥100 | 28.2 | 14.8 | 34.3 | 82.9 | <0.001 |
| ≥300 | 16.0 | 5.2 | 18.8 | 70.0 | <0.001 |
| ≥1000 | 8.6 | 0.5 | 8.9 | 57.1 | <0.001 |
n, sample size; eGFR, estimated glomerular filtration rate; BMI, body mass index; Cd, cadmium; β2M, β2-microglobulin; cr, creatinine; Ccr, creatinine clearance. Data for BMI were from 773 subjects. All other data were from 799 subjects. Continuous variables are expressed as arithmetic mean and standard deviation (SD) values. For all tests, p ≤ 0.05 identifies statistical significance, determined with the Pearson Chi-Square test for differences in percentages and the Kruskal-Wallis test for the variation across the eGFR groups.
Table 2.
Determinants of the prevalence odds ratios for CKD.
| Independent Variables/Factors |
CKD (eGFR ≤ 60 mL/min/1.73 m2) | ||||
|---|---|---|---|---|---|
| β Coefficients | POR | 95% CI | p | ||
| (SE) | Lower | Upper | |||
| Model A | |||||
| Age, years | 0.160 (0.020) | 1.173 | 1.128 | 1.220 | <0.001 |
| Log2[(ECd/Ecr)], µg/g creatinine | 0.684 (0.142) | 1.981 | 1.500 | 2.615 | <0.001 |
| Gender | 0.126 (0.107) | 1.135 | 0.533 | 2.415 | 0.743 |
| Hypertension | 0.659 (0.355) | 1.933 | 0.965 | 3.874 | 0.063 |
| Smoking | 0.131 (0.392) | 1.140 | 0.529 | 2.456 | 0.738 |
| BMI, kg/m2 | |||||
| 12−18 | Referent | ||||
| 19−23 | 0.140 (0.489) | 1.150 | 0.441 | 3.002 | 0.775 |
| ≥ 24 | 1.387 (0.554) | 4.002 | 1.351 | 11.86 | 0.012 |
| Model B | |||||
| Age, years | 0.156 (0.022) | 1.168 | 1.119 | 1.219 | <0.001 |
| Log2[(ECd/Ccr)], µg/L filtrate | 1.142 (0.169) | 3.132 | 2.249 | 4.361 | <0.001 |
| Gender | −0.330 (0.422) | 0.719 | 0.315 | 1.643 | 0.434 |
| Hypertension | 0.977 (0.392) | 2.656 | 1.231 | 5.727 | 0.013 |
| Smoking | 0.098 (0.417) | 1.103 | 0.487 | 2.495 | 0.815 |
| BMI, kg/m2 | |||||
| 12−18 | Referent | ||||
| 19−23 | 0.126 (0.528) | 1.134 | 0.403 | 3.189 | 0.812 |
| ≥ 24 | 1.565 (0.603) | 4.784 | 1.468 | 15.59 | 0.009 |
CKD, chronic kidney disease; POR, prevalence odds ratios; CI, confidence interval; BMI, body mass index; Cd, cadmium; cr, creatinine; Ccr, creatinine clearance. a CKD was defined as eGFR ≤ 60 mL/min/1.73 m 2. Cd excretion rate was normalized to Ecr and Ccr in models A and B, respectively. All other independent variables in the two models were identical. Data were from 691 subjects (420 women, 271 men).
Table 3.
Determinants of the prevalence odds ratios for abnormal β2M excretion rates.
| Independent Variables | a β2M excretion level 1 | β2M excretion level 2 | β2M excretion level 3 | |||
|---|---|---|---|---|---|---|
| POR (95% CI) | p | POR (95% CI) | p | POR (95% CI) | p | |
| Model A | ||||||
| Age, years | 1.045 (1.021,1.070) | <0.001 | 1.044 (1.017,1.073) | 0.002 | 1.035 (1.000,1.071) | 0.049 |
| BMI. kg/m2 | 0.931 (0.880,0.986) | 0.015 | 0.905 (0.842,0.974) | 0.008 | 0.963 (0.878,1.055) | 0.413 |
| Gender | 0.781 (0.501,1.218) | 0.276 | 2.031 (1.192,3.459) | 0.009 | 1.235 (0.624,2.444) | 0.545 |
| Hypertension | 1.353 (0.887,2.065) | 0.161 | 1.399 (0.815,2.401) | 0.223 | 1.436 (0.718,2.874) | 0.306 |
| Smoking | 0.728 (0.470,1.126) | 0.153 | 1.150 (0.662,1.998) | 0.619 | 0.653 (0.313,1.359) | 0.254 |
| CKD b | 4.475 (2.051,9.763) | <0.001 | 8.125 (3.399,16.93) | <0.001 | 12.51 (5.879,26.64) | <0.001 |
| ECd/Ecr, µg/g creatinine | ||||||
| ≤ 0.37 | Referent | |||||
| 0.38−2.49 | 1.976 (1.180,3.308) | 0.010 | 1.163 (0.566,2.390) | 0.680 | 1.419 (0.430,4.688) | 0.566 |
| ≥ 2.50 | 5.285 (2.929,9.536) | <0.001 | 3.470 (1.629,7.394) | 0.001 | 4.540 (1.374,14.99) | 0.013 |
| Model B | POR (95% CI) | p | POR (95% CI) | p | POR (95% CI) | p |
| Age, years | 1.049 (1.023,1.075) | <0.001 | 1.048 (1.018,1.078) | 0.001 | 1.050 (1.013,1.088) | 0.007 |
| BMI. kg/m2 | 0.918 (0.865,0.975) | 0.005 | 0.893 (0.826,0.965) | 0.004 | 0.988 (0.896,1.089) | 0.805 |
| Gender | 1.273 (0.806,2.009) | 0.300 | 2.551 (1.457,4.466) | 0.001 | 1.605 (0.779,3.310) | 0.200 |
| Hypertension | 1.074 (0.699,1.652) | 0.744 | 1.245 (0.721,2.149) | 0.431 | 1.070 (0.519,2.205) | 0.855 |
| Smoking | 0.833 (0.529,1.311) | 0.430 | 1.044 (0.587,1.856) | 0.883 | 0.527 (0.238,1.165) | 0.113 |
| CKD b | 5.823 (2.601,13.04) | <0.001 | 10.07 (4.657,21.78 | <0.001 | 12.13 (5.588,26.35) | <0.001 |
| (ECd/Ccr) ×100, µg/L filtrate | ||||||
| ≤ 1.49 | Referent | |||||
| 1.50−4.99 | 2.740 (1.460,5.143) | 0.002 | 2.296 (0.913,5.774) | 0.077 | 2.606 (0.297,22.85) | 0.387 |
| ≥ 5 | 5.831 (3.095,10.99) | <0.001 | 6.351 (2.617,15.41) | <0.001 | 15.35 (1.976,119.3) | 0.009 |
POR, prevalence odds ratios; CI, confidence interval; BMI, body mass index; Cd, cadmium; cr, creatinine; Ccr, creatinine clearance. a In model A, β2M excretion levels 1, 2 and 3 corresponded to Eβ2M/Ecr ≥ 100, ≥ 300 and ≥ 1000 µg/g creatinine, (Eβ2M/Ccr) × 100 ≥ 100, ≥ 300 and ≥ 1000 µg/L filtrate in model B. b CKD was defined as eGFR ≤ 60 mL/min/1.73 m2.
Table 4.
Quantal Cd excretion benchmarks derived from abnormal eGFR values and abnormal β2M excretion rate.
Table 4.
Quantal Cd excretion benchmarks derived from abnormal eGFR values and abnormal β2M excretion rate.
| Independent Variables | Elevated β2M excretion levels | Low eGFR a | ||
|---|---|---|---|---|
| Level 1: ≥100 | Level 2: ≥ 300 | Level 3: ≥1000 | ||
| Ecr-normalized dataset b | BMDL5(BMDU5) | BMDL5(BMDU5) | BMDL5(BMDU5) | BMDL5(BMDU5) |
| Men | 0.451 (2.65) | 0.869 (4.48) | 1.52 (4.96) | 1.76 (4.54) |
| Women | 0.668 (4.49) | 2.340 (14.3) | 3.11 (13.8) | 2.24 (9.30) |
| All | 0.640 (3.68) | 0.812 (5.51) | 2.35 (6.76) | 2.23 (6.29) |
| Ccr-normalized dataset c | BMDL5(BMDU5) | BMDL5(BMDU5) | BMDL5(BMDU5) | BMDL5(BMDU5) |
| Men | 0.91 (3.58) | 1.11 (4.40) | 2.93 (7.41) | 3.33 (6.76) |
| Women | 0.91 (3.18) | 2.01 (6.78) | 4.50 (9.74) | 2.95 (6.30) |
| All | 0.93 (3.30) | 1.91 (5.13) | 3.62 (7.80) | 3.10 (6.19) |
a Cut-off values for the low eGFR was ≤ 60 mL/min/1.73 m2. b Cut-off values for β2M excretion levels 1, 2 and 3 were Eβ2M/Ecr rates ≥ 100, ≥ 300, and ≥ 1000 µg/g creatinine. c Cut-off values for elevated β2M excretion levels levels 1, 2 and 3 were (Eβ2M/Ccr) × 100 rates ≥100, ≥ 300, and ≥ 1000 µg/L filtrate.
Disclaimer/Publisher’s Note: The statements, opinions and data contained in all publications are solely those of the individual author(s) and contributor(s) and not of MDPI and/or the editor(s). MDPI and/or the editor(s) disclaim responsibility for any injury to people or property resulting from any ideas, methods, instructions or products referred to in the content. |
© 2025 by the authors. Licensee MDPI, Basel, Switzerland. This article is an open access article distributed under the terms and conditions of the Creative Commons Attribution (CC BY) license (http://creativecommons.org/licenses/by/4.0/).
Copyright: This open access article is published under a Creative Commons CC BY 4.0 license, which permit the free download, distribution, and reuse, provided that the author and preprint are cited in any reuse.


