Preprint
Article

This version is not peer-reviewed.

Segmental Phase Angles by Bioimpedance as Predictors of Frailty in Hospitalized Older Adults with Cardiovascular Disease: A Cross-Sectional Observational Study

A peer-reviewed article of this preprint also exists.

Submitted:

29 September 2025

Posted:

30 September 2025

You are already at the latest version

Abstract

Background/Objectives: Whole-body phase angle has been associated with in-hospital morbidity and mortality, although cut-off points vary. Studies on the relationship between segmental phase angles and frailty in patients with cardiovascular disease are limited. Therefore, we aimed to assess the prognostic value of segmental phase angles in detecting frailty in older adults hospitalized with cardiovascular disease. Methods: A cross-sectional observational study was conducted on hospitalized patients aged ≥60 years with cardiovascular disease. Frailty was identified using Fried's five criteria. Biomarkers (CRP, albumin, hemoglobin), anthropometric parameters, and body composition using segmental electrical bioimpedance (phase angles, body fat, body water, and sarcopenia index) were collected. Associations with frailty were analyzed using logistic regression and Receiver Operating Characteristic (ROC) curves. Sensitivity, specificity, and positive likelihood ratio (LR+) were calculated (95% CI; p<0.05). Results: A total of 157 patients (men: 64.24%; women: 33.76%) were included, with a mean age of 73.23 years (SD=7.91). The prevalence of frailty was 28.66%. In men, the phase angles of the left hemisphere (5.15°) and left leg (4.25°) showed good discriminatory capacity (AUC: 0.66–0.71; LR+: >2). In women, the segments with significance did not exceed an LR+ of 2. Frailty was associated with lower phase angle values in all segments and with biomarkers such as hemoglobin <12 g/dL (p=0.011) and CRP >5 mg/L (p=0.030). Conclusions: Segmental phase angles are moderately useful for identifying frailty in hospitalized older men with cardiovascular disease. Further studies are needed to establish clinically useful cutoffs, especially in women.

Keywords: 
;  ;  ;  ;  ;  

1. Introduction

Clinical nutrition is the result of the interaction between food deprivation and the catabolic processes that occur during illness and aging, gaining special importance in those processes in which nutrition plays a significant role, such as in the care of patients with cardiovascular disease (CVD), diabetes mellitus or dyslipidemia, among others [1].
In general, the impact of age from 65 years onwards influences body composition, affecting lean mass, water and bone mineral mass [2], although it is currently estimated that these changes begin at 60 years, significantly affecting the decrease in muscle mass index and strength with the consequent increase in the risk of sarcopenia. In turn, sarcopenic obesity has been associated with an increase in cardiovascular risk, among others [3].
Frailty has been directly linked to aging and is a functional risk factor for cardiovascular morbidity and mortality [4]. Several studies have sought to explore the relationship between nutrition and frailty through the biological processes involved such as oxidative stress or inflammation, among others [5].
Physical frailty in aging is considered a state of dysregulation of the complex homeostasis system in the multifactorial concept of frailty, which includes the musculoskeletal system and is the dynamic result of the transition from a suboptimal state to a high risk of frailty when stress factors occur [6].
It is of special importance in this age group to assess the changes that occur during aging. Currently, there are different methods to assess the degree of obesity, such as determining anthropometric measurements, abdominal circumference, or more specific parameters such as the percentage of fat, water, bone mineral mass, fat mass or fat-free mass, among others, through the use of more complex techniques such as Bone densitometry (DXA) or Bioelectrical impedance (BIA), each having its pros and cons in clinical practice [7]. The latter has the advantage of being a harmless technique for the patient and can be performed in a short space of time [8]. Its theoretical basis is based on the Ohm’s law, obtaining the value of the impedance (Z) through the resistance (R) and the reactance (Xc ) of the passage of a low intensity electric current through the cells (Z2 = R2+Xc2 ) [9].

1.1. Body Composition, Frailty and CVD

Body composition specially compartmental body composition, has been found to have an inverse association with frailty as measured by Fried’s five frailty criteria [10], with muscle mass and muscle mass index (p<0.001). In another study of hemodialysis patients, those identified as frail using the Clinical Frailty Score had a higher body mass index (BMI), lower muscle mass, and a higher percentage of body fat [11].
In terms of cardiovascular disease, muscle mass has been identified as a powerful predictor of risk in patients with coronary artery disease (CAD) undergoing cardiac intervention as well as in heart failure (HF) [12,13]. A reduction in lean body mass (FFM) has been shown to be a progressive indicator of frailty in patients with cardiovascular disease [14]. A low appendicular skeletal mass index (ASMI) could be used as an independent predictor of major adverse cardiac events and mortality in patients with CAD [15]. Additionally, other studies have indirectly linked bone mineral density to cardiovascular risk in older adults [16].

1.2. Phase Angle as a Prognostic Value

In addition to providing compartmental characteristics as described above, Bioelectrical Impedance Analysis (BIA) is able to evaluate the body’s bioelectrical activity, allowing for the interpretation of cell nutrition levels [1]. The determination of the phase angle (ϕ) measures the quality of the cell membrane and is calculated by performing the arctangent of the reactance divided by the resistance, then multiplying by 180° and dividing by π (ϕ= arctangent (Xc/R) x180°/π).
Several studies have linked a decrease in phase angle with syndromes such as geriatric syndrome, frailty, and mortality, in different groups of patients, although there is no consensus on the specific cut-off points (frailty: men 3.1°-5.6°; women 2.7°-5.4°) [17,18]. In older adults, the phase angle has been identified as a modifiable risk factor associated with physical performance, improving the prognostic value when the phase angle value increases [19,20].
In hospitalized patients, a cut-off point for the total body phase angle has been identified as a predictor of malnutrition, with 5.3 ° for women (AUC = 0.815; sensitivity = 0.703; specificity = 0.635) and 5.4 ° for men (AUC = 0.851; sensitivity = 0.821; specificity = 0.779) [21]. Similarly, in a study conducted with patients in an intensive care unit, those who survived the process had a higher mean phase angle value compared to those who died, with a cut-off point of 4.6 ° (AUC = 0.63; 95% CI = 0.58-0.70; sensitivity = 0.080; specificity = 0.049) [22].
The cut-off point identified in a study of hemodialysis patients as a predictive factor for mortality was 4.5 ° (AUC=0.754; 95% CI=0.151-0.346; sensitivity=0.488; specificity=0.901). In this study, the most frequent cause of mortality was CVD, and these patients showed a lower phase angle [23].
The phase angle in patients with CVD is smaller than in patients without CVD [24]. In the study by Langer et al., women who developed CVD showed a smaller phase angle (6.3° vs. 6.0°; p<0.001) [25].
In another study, the cut-off point identified as a predictive factor for mortality in patients with acute decompensated heart failure was ≤ 4.9 ° (AUC=0.68; 95% CI=0.62-0.74; sensitivity=0.75; specificity=0.44) [26]. In patients undergoing cardiac surgery, a phase angle < 4.5 ° behaved as a predictive factor for mortality, morbidity, and fragility [27].
Critical transitions between suboptimal states of frailty and high-risk states may require early interventions before frailty is established [6]. Zanforlini et al. estimated that for every 1° increase in phase angle in older adults, the probability of improvement in the frailty state was 4.53 times (95% CI: 1.18-17.46) [19]. Phase angle in CVD can be useful as a tool for monitoring the physiological state of the body in general; however, the use of electrical bioimpedance for the determination of segmental phase angles can be oriented in clinical practice to those states or diseases that do not influence the body in general but do influence certain organs [28]. The technique is fast, portable, and non-invasive, so it could complement the assessment of hospitalized frail patients with CVD [24].
Although there is evidence linking Phase Angle (PhA) with mortality, malnutrition, and frailty, cutoff points vary significantly across studies and have rarely been explored in specific body segments, especially in older patients with CVD. This particularly vulnerable population could benefit from more precise and localized assessment of functional and nutritional status.
For this reason, our goal was to evaluate the prognostic value of segmental phase angles obtained by electrical bioimpedance in identifying physical frailty in hospitalized older adults with CVD. The specific objectives were to assess the association between segmental phase angles and physical frailty status in hospitalized older adults with CVD. We also aimed to determine segmental phase angle cutoffs that discriminate frailty by sex and to assess the relationship between cachexia biomarkers (CRP, hemoglobin, and albumin) and frailty status.
Therefore, we anticipate that segmental phase angles are inversely associated with frailty status in hospitalized older adults with CVD and that sex-specific cutoff points have diagnostic capacity.

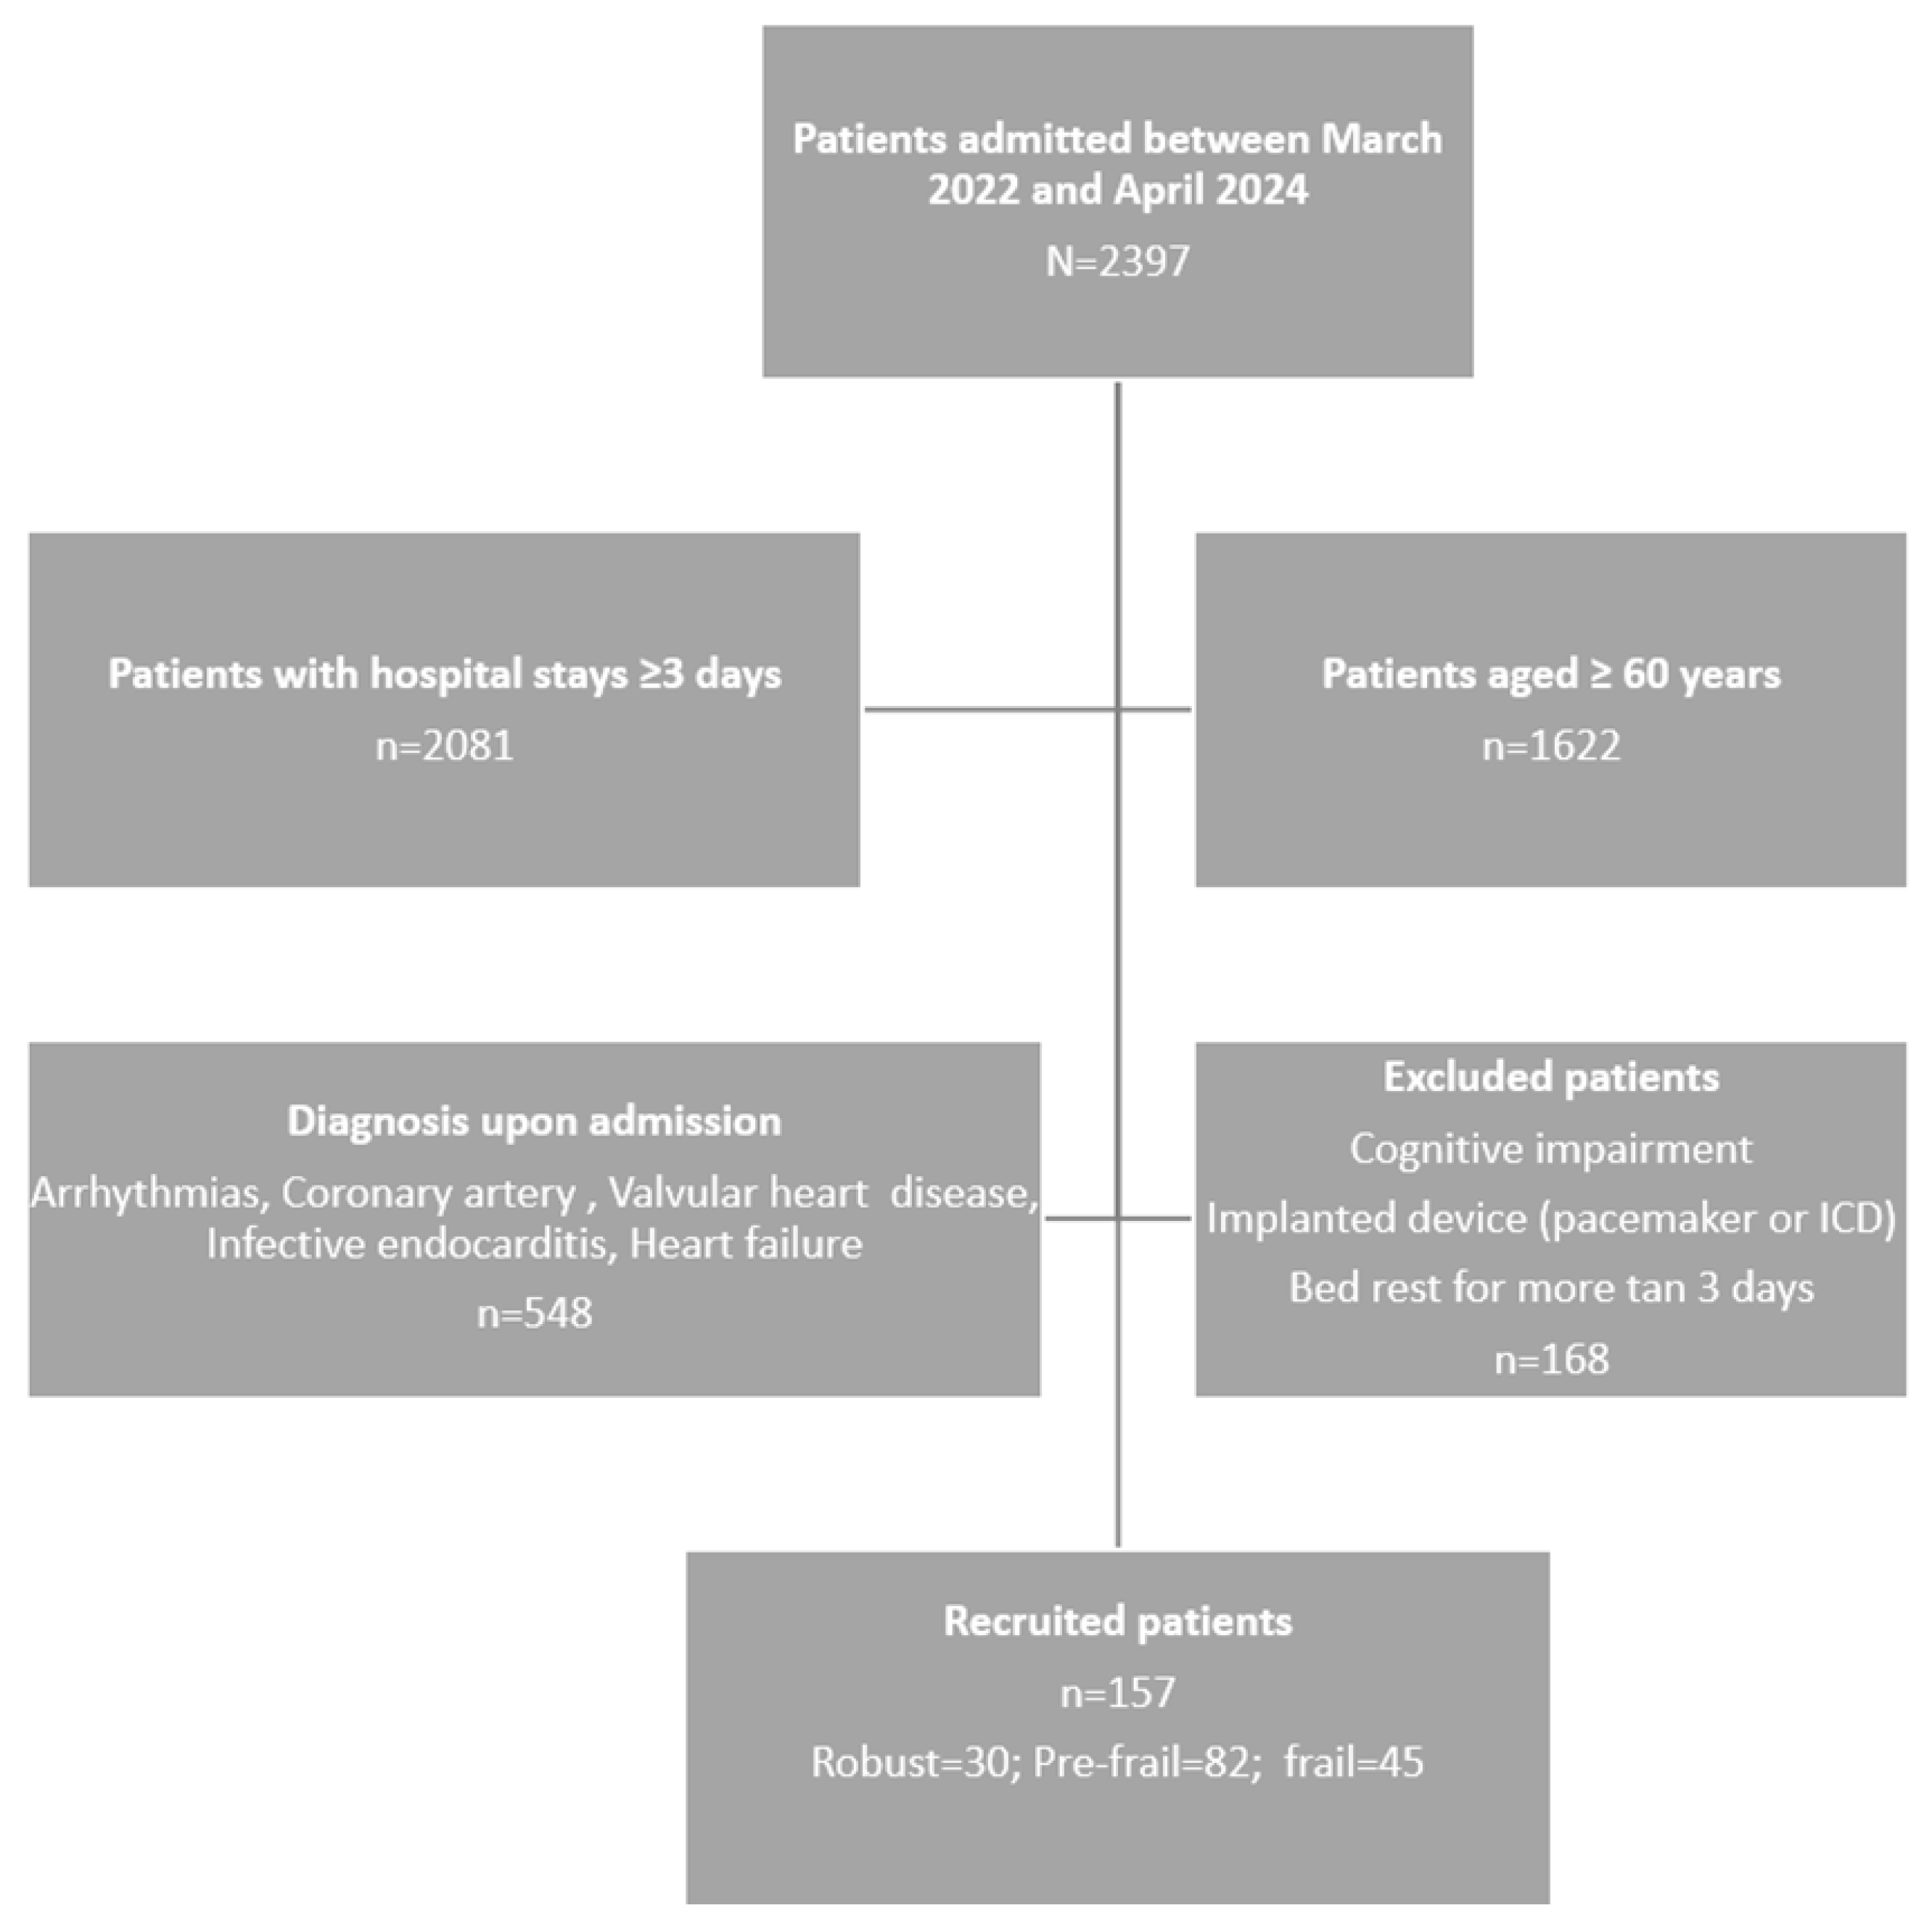
2. Materials and Methods

2.1. Design, Population and Sample

A cross-sectional observational study was conducted in a cohort of patients admitted to a conventional cardiology inpatient unit of a tertiary care hospital in the Spanish public health network in the region of Castilla y León, between March 2022 and April 2024. The study included conscious and oriented individuals aged 60 years or older who had been diagnosed with coronary artery disease, infective endocarditis, heart failure, arrhythmias and valvular heart disease according to the cardiovascular disease models defined by scientific societies [29]. Patients with previously diagnosed cognitive impairment, severe motor disability that prevented them from standing or required prolonged bed rest, wearers of pacemakers and implantable internal defibrillators (ICDs), and those with a hospital stay of less than 3 days were excluded.

2.1.1. Sample Size

The sample size was estimated to assess the predictive capacity of seven segmental phase angles on physical frailty status using binary logistic regression. Considering a 30% proportion of events (frailty) in older adults with CVD [30].
Recent methodological recommendations suggest having between 5 and 9 events per variable (EPV) as a suitable criterion for concise models in observational studies [31]. It was determined that between 117 and 158 subjects would be needed to accommodate a model with seven predictors. With a final sample of 157 patients and 45 events (cases with frailty), an EPV of 6.4 was achieved, falling within an acceptable range to ensure model stability and minimize the risk of overfitting. Additionally, this sample size was adequate to detect associations with a minimum expected odds ratio of 2, at a 95% confidence level, and an 80% statistical power.
Patient recruitment occurred consecutively, with individuals signing informed consent upon admission to the cardiology unit during the study period.
The methodological design and writing of this study followed the recommendations outlined in the STROBE statement for cross-sectional observational studies [32].

2.2. Variables and Measurements

Sociodemographic data were collected, including biological sex defined at birth, age, and primary diagnosis at admission. Clinical information was obtained directly from the patients’ medical records, including systolic blood pressure (BP; mmHg), diastolic blood pressure (SBP; mmHg), and heart rate (HR; beats per minute).
The length of hospital stay was also identified.

2.2.1. Blood Biomarkers

The results of blood tests during the admission period were collected for total cholesterol (mg/dL), HDL cholesterol (mg/dL), LDL cholesterol (mg/dL), glucose (mg/dL), NT-proBNP (N-terminal pro b-type natriuretic peptide: pg/mL), CRP (C-reactive protein: mg/L), hemoglobin (g/dL), and serum albumin (g/dL).

2.2.2. Frailty

Frailty was determined using the five criteria of the Fried scale [10]:
  • Unintentional weight loss of more than 4.5 kg or more than 5.0% in less than one year.
  • Feeling of general exhaustion (low energy and resistance according to the CES-D depression scale) [33].
  • Weakness (measured using a Digital Hand Dynamometer).
  • Slow walking speed (time to cover 4.57m adjusted for gender and height).
  • Weekly physical activity level (Determined using the Minnesota Leisure Time Activity Questionnaire (MLTAQ) stratified by gender; men: 383 kcal/week and women: 270 kcal/week) [34].
According to these criteria, patients were classified as:
  • Frail patients: Three or more of the above criteria were met.
  • Patients with pre-frailty: they met one or two of the above criteria.
  • Patients without frailty: They did not present any of the previous criteria.

2.2.3. Cardiovascular Risk

Cardiovascular risk was assessed using the Framingham Risk Assessment Scale, as recommended by the American Heart Association (AHA). The variables considered included age, sex, smoking status (YES/NO), diabetes mellitus (YES/NO), HDL cholesterol, total cholesterol, and systolic and diastolic blood pressure. High risk was defined as a percentage ≥20 % [35].

2.2.4. Body Composition and Phase Angles

Anthropometric measurements were taken, including height (cm) using a standard stadiometer, body weight (kg) measured with a TANITA MC-780 scale, body mass index (kg/m2), and abdominal perimeter (cm) measured with an ergonomic tape with automatic winding (accuracy 1mm). Body composition was assessed using eight-point bioimpedance analysis (TANITA MC-780). This technique measures the impedance of the arms, legs, right hemisphere, and left hemisphere at six different frequencies (1kHz, 5kHz, 50kHz, 250kHz, 500kHz, and 1000kHz) for each body segment. The frequency used for the analysis in this study was 50kHz.
The results included metabolic age (an estimation based on basal metabolic rate), total body water (kg), intracellular body water (kg), extracellular body water (kg), body fat percentage, skeletal muscle mass (kg), fat-free body mass (kg), segmental fat percentage (right arm, left arm, right leg, left leg, right hemisphere and left hemisphere) and segmental PhAs at 50kHz for the right hemisphere, left hemisphere, right arm, left arm, right leg, left leg, and both legs separately.
The TANITA MC-780 bioimpedance analyser provides PhA values as negative numbers due to its internal software convention. Since the phase angle is defined as a positive parameter, all analyses in this study were conducted using the absolute values of PhA. This approach ensures consistency with existing literature, where PhA is typically reported as a positive value.
Obesity was defined as BMI≥ 27 kg/m2, based on its correlation with body fat percentage [36].
The sarcopenia index was defined as ASM/height2 according to the European Sarcopenia Group (EWGSPO2) (men<7.0 kg/m2; women<5.5 kg/m2) [37], and according to the International Sarcopenia Group (IWGS) (men ≤ 7.23 kg/m; women ≤ 5.67 kg/m2) [38].
Sarcopenic obesity was identified by a high percentage of body fat/low grip strength (men: >31% fat/<27kg strength; women: >43% fat/<16kg strength) [39].

2.3. Procedure

Before beginning data collection, all nurses on the Cardiology Department’s care team underwent specific training in the standardized application of the Fried scale and the data collection protocol to minimize measurement bias. Three nurses received specialized training in using the TANITA MC-780 bioimpedance device. Training took place one week prior to the study’s commencement to promote consistency in data collection and reduce interobserver variability.
Upon identifying eligible patients and obtaining informed consent, nurses assessed frailty status using Fried’s five criteria on the third day of hospitalization. This assessment was supplemented by anthropometric measurements (weight, height, waist circumference) after patients signed the informed consent form. The principal investigator and three trained nurses conducted body composition analysis using multifrequency electrical bioimpedance with patients in a standing position. All bioimpedance measurements were taken under standardized conditions: after at least two hours of fasting following a main meal and without prior physical exercise.
Clinical and analytical data (blood pressure, heart rate, total cholesterol, HDL, LDL, glucose, NT-proBNP, CRP, hemoglobin, and albumin) were gathered from patients’ electronic medical records, documenting the first determination after hospital admission.
Finally, after collecting all clinical, anthropometric, frailty, and body composition variables, each patient’s cardiovascular risk was calculated using the Framingham scale by categories. A value equal to or greater than 20% was considered high risk.
This standardized procedure ensured consistent measurement of all variables over time, guaranteeing that the data accurately reflected the clinical and functional status of patients upon hospital admission.

2.4. Ethical Considerations

All participants signed informed consent in accordance with the Patient Information Sheet template of the Valladolid East Health Area. The anonymity of patients and participant data was maintained at all times using Research Electronic Data Capture (REDCap) software. The researchers affirm that they follow the bioethical standards outlined in the Declaration of Helsinki, the Oviedo Convention on Human Rights and Biomedicine, and Organic Law 3/2018, of December 5, on the Protection of Personal Data and Guarantee of Digital Rights. The study received approval from the Ethics Committee of the Valladolid East Health Area under PI 20-1612.

2.5. Statistical Analysis

All variables described above were analyzed using SPSS 26.0 software (IBM, Armonk, New York, USA). Categorical variables were expressed as absolute values and percentages, while continuous variables were expressed as mean ( X ¯ ) ± standard deviation (SD) and tested for homogeneity using Levene’s test. Normality assumptions for quantitative variables were confirmed through kurtosis and skewness analysis as well as the Kolmogorov-Smirnov test.
Associations between each variable and the dependent variable (frailty) were examined using the Chi-square test and Fisher’s exact test for qualitative variables. For continuous variables, the Student t-test or the Mann-Whitney U test was applied for those not meeting the normality assumption.
Univariate binary logistic regression was conducted to identify prognostic factors for frailty. The final model calculated adjusted odds ratios (ORs) with 95% confidence intervals for variables with a p-value <0.05. A multivariate logistic regression model was then used to control for potential confounders such as age, sex, BMI, hemoglobin, and CRP, reporting adjusted odds ratios (aORs) with their respective 95% CIs.
The model’s goodness of fit was assessed using the Hosmer-Lemeshow test.
Receiver Operating Characteristic (ROC) curves were utilized to determine cut-off points for segmental phase angles, followed by evaluation of the sensitivity, specificity, and likelihood ratio using the Fagan nomogram [40].
No missing data were present for the main variables, and checklists were employed for all analyses.

3. Results

3.1. Characteristics of the Study Participants

Figure 1 displays the flowchart of the patient’s inclusion process. Out of the 794 patients initially evaluated, 157 were ultimately included based on the defined inclusion and exclusion criteria.
This section may be divided by subheadings. It should provide a concise and precise description of the experimental results, their interpretation, and the experimental conclusions that can be drawn.
Figure 1. Patient Selection Flowchart.
Preprints 178707 g001
The mean age of the patients studied was 73.23 years (SD = 7.91); 66.24% were men and 33.76% were women, as shown in Table 1. The majority (75.80%) were between 60 and 79 years old. The overall prevalence of frailty was 28.66%, slightly higher in women (30.19%) than in men (27.88%), although not statistically significant (p = 0.091). The most frequent diagnosis was coronary artery disease (61.15%).
In terms of comorbidities, 35.03% had previous diabetes mellitus, and 19.75% had high cardiovascular risk (≥20% according to Framingham), being more frequent in men (25.00% vs. 9.43%; p = 0.021).
The mean hospital stay was 8.72 days (SD = 5.44), significantly longer in frail patients (p < 0.01) and in men compared to women (9.43 vs. 7.30 days; p = 0.043). Frail men had particularly long stays (p = 0.011).
Regarding nutritional and biochemical indicators, 56.05% were obese (BMI > 27 kg/m2), with no significant differences between sexes. Women showed significantly higher levels of total cholesterol, HDL, and LDL (p < 0.05 in all cases). Mean hemoglobin was lower in frail patients (p = 0.032), with a higher proportion of Hb <12 g/dL. This difference was particularly significant among men with frailty (p = 0.049) but not observed in women. Anemia (Hb <12 g/dL) was present in 16.60% of patients, which was more prevalent in the frail group. CRP was higher in frail patients, although not statistically significant.
Table 1. Clinical and Demographic Characteristics of Participants Were Stratified by Sex and Frailty Status.
Variable Total
(n = 157)
Men
(n = 104)
Women
(n = 53)
Frail
(n = 45)
Pre-frail
(n = 82)
Non-frail
(n = 30)
p-value (frailty) p-value (sex)
Age (years), mean (SD) 73.23 (7.91) 73.42 (7.84) 72.92 (8.10) 77.98 (7.98) 71.32 (7.29) 71.47 (6.54) <0.001 0.691
Fragility (%) 28.66 27.88 30.19 0.741
Coronary heart disease (%) 61.15 62.50 58.49 0.651
Diabetes mellitus (%) 35.03 37.50 30.19 0.355
Cardiovascular risk ≥20% (%) 19.75 25.00 9.43 8.00 16.00 7.00 0.256 0.021
Hospital stays (days), mean (SD) 8.72 (5.44) 9.43 (5.99) 7.30 (3.82) 11.35 (6.82) 7.81 (4.30) 7.30 (4.82) <0.01 0.043
BMI >27 kg/m2 (%) 56.05 58.65 50.94 60.00 56.10 50.00 0.568 0.341
Total cholesterol (mg/dL), mean (SD) 160.59 (44.19) 150.89 (43.21) 179.62 (40.03) 156.53 (45.70) 162.76 (44.34) 160.77 (42.48) 0.608 <0.001
HDL (mg/dL), mean (SD) 45.34 (13.69) 42.53 (11.75) 50.85 (15.57) 42.40 (9.78) 46.49 (15.66) 46.60 (12.64) 0.224 <0.001
LDL (mg/dL), mean (SD) 91.59 (36.51) 85.73 (36.76) 103.08 (33.46) 91.40 (36.85) 91.94 (36.72) 90.90 (36.67) 0.964 <0.01
Hb <12 g/dL (%) 16.56 16.65 16.98 28.89 10.98 13.33 0.032 0.968
Albumin <3.2 g/dL (%) 8.92 11.54 3.77 13.33 7.32 6.67 0.231 0.112
PCR >5 mg/L (%) 48.41 49.04 47.17 62.22 43.90 40.00 0.060 0.833
Notes: Significant differences between groups are indicated in bold (p < 0.05); BMI: body mass index; Hb: hemoglobin; HDL/LDL: lipoproteins; CRP: C-reactive protein. P-value (frailty): comparison between the three frailty groups using ANOVA/Kruskal-Wallis or Chi-square according to the variable. P-value (sex): comparison between men and women.

3.2. Body Composition and Frailty

The average metabolic age of the sample was 63.76 years (SD = 11.14) and was significantly higher in patients with frailty (p = 0.001), for both men and women (p = 0.002). The average percentage of body fat was 27.20% (SD = 7.66), and the sarcopenia index was 8.17 kg/m2 (SD = 1.23). While patients with frailty exhibited higher values of total and segmental fat, these differences did not reach statistical significance overall.
The average waist circumference was 102.64 cm (SD = 13.33). In the analysis by sex and frailty, robust men had a significantly smaller waist circumference (<100 cm) compared to prefrail and frail men (p = 0.029 and p = 0.033).
Analysis by sex revealed that 13.50% of men had a body fat percentage above 31%, while only 3.77% of women had a percentage above 43%. Sarcopenic obesity, defined as an elevated body fat percentage combined with reduced grip strength, was identified in 6.63% of men, but not in women. Additionally, the percentage of segmental fat in the right arm was significantly higher in individuals with frailty (p = 0.018).
The sarcopenia index (ASM/height2) showed values within the normal range in all groups, according to both the EWGSOP2 and IWGS criteria. Although frail patients exhibited slightly higher values than prefrail and robust patients, no clinically relevant sarcopenia was observed.
Handgrip strength in the dominant hand was significantly greater in robust patients compared to pre-frail and frail patients (p < 0.001). This difference was consistent in both men and women (p = 0.000; p = 0.001), confirming the association between functional frailty and decreased muscle strength.
In addition to body fat percentage, other indicators of body composition were evaluated. The average percentage of total body water was 51.78% (SD = 5.79), with lower values in patients with frailty, although without significant differences. Fat-free mass was 54.04 kg (SD = 11.40), and average skeletal muscle mass was 51.32 kg (SD = 10.86), with higher values in men.
Complete data on body composition and frailty-related parameters are presented in Table 2.

3.3. Relationship Between Segmental Phase Angles and Frailty Status

Statistically significant differences were observed between segmental phase angles and clinical diagnoses at admission. The mean of most phase angles was higher in patients with coronary artery disease, except in the left and right hemispheres and both arms, where the highest values were observed in cases of infective endocarditis (p < 0.01) (Table 3).
In the overall sample analysis, segmental phase angles showed mean values greater than 5° on the right and left sides of the body, as well as on both arms. Patients with frailty consistently displayed lower phase angle values in all segments. These differences were statistically significant compared to the pre-frailty group, and in the case of the left arm, also compared to the non-frail group (p = 0.011). However, no significant differences were observed in the phase angle of the right side of the body between the different frailty statuses (Table 4).
Analysis by sex revealed that women consistently had lower phase angle values in both frail and non-frail individuals compared to men. In the male group, statistically significant differences were found between frail and pre-frail individuals in all segments except the right half of the body. In contrast, only in women did this angle show significant differences between frailty groups (p = 0.045) (Table 4).
Table 4. Relationship of Segmental Phase Angles According to Frailty Status and Sex.
Frailty status (Fried)
Segmental phase angles Frail
(a)
Non-frail
(b)
Pre-frail
(c)
Frail
(a)
Non-frail
(b)
Pre-frail
(c)
X ¯
(SD)
X ¯
(SD)
p-value
X ¯
(SD)
p-value
X ¯
(SD)
p-value
Sex X ¯
(SD)
p-value
X ¯
(SD)
p-value
X ¯
(SD)
p-value
PHASE°LBD 5.15
(0.87)
4.82
(0.98)
c (0.009)
5.23
(0.74)
5.30
(0.80)
Male 5.00
(1.06)
c (0.045)
5.34
(0.76)
5.51
(0.82)
Female 4.49
(0.75)
4.80
(0.43)
4.95
(0.65)
PHASE°RRG 4.58
(1.09)
4.13
(1.05)
c (0.002)
4.65
(0.76)
 
4.81
(1.14)
 
Male 4.09
(1.08)
c (0.018)
4.73
(0.77)
4.82
(1.25)
Female 4.20
(1.03)
4.32
(0.65)
4.79
(0.96)
PHASE°LLG 4.53
(1.04)
4.05
(1.00)
c (0.000)
4.56
(0.84)
4.78
(1.06)
Male 4.03
(0.90)
c (0.004)
4.64
(0.88)
4.83
(1.15)
Female 4.09
(1.18)
4.23
(0.58)
4.69
(0.91)
PHASE°RAM 5.71
(0.84)
5.46
(1,12)
c (0.044)
5.77
(0.59)
5.84
(0.72)
Male 5.63
(1.25)
c (0.004)
5.80
(0.61)
6.07
(0.65)
Female 5.14
(0.77)
5.62
(0.50)
5.46
(0.66)
PHASE°LAM 5.57
(0.82)
5.21
(0.76)
b (0.011)
c (0.003)
5.76
(0.80)
5.70
(0.81)
Male 5.38
(0.75)
5.87
(0.82)
5.98
(0.80)
Female 4.91
(0.69)
5.32
(0.53)
5.23
(0.59)
PHASE°WLG 4.65
(1.03)
4.20
(1.00)
c (0.001)
4.77
(0.76)
4.89
(1.07)
Male 4.17
(0.96)
c (0.008)
4.74
(0.79)
4.91
(1.16)
Female 4.24
(1,11)
4.37
(0.60)
4.85
(0.91)
PHASE°RBD 5.22
(0.94)
4.96
(1.27)
5.29
(0.63)
5.34
(0.78)
Male 5.17
(1.46)
5.37
(0.66)
5.49
(0.81)
Female 4.56
(0.71)
c (0.045)
4.98
(0.44)
5.08
(0.67)
Note: X ¯ : Mean; SD: standard deviation; PHASE ° LBD: phase angle of the left half of the body; PHASE ° RRG: phase angle of the right leg; PHASE ° LLG: phase angle of the left leg; PHASE ° RAM: phase angle of the right arm; PHASE ° LAM: phase angle of the left arm; PHASE ° WLG: phase angle of both legs; PHASE ° RBD: phase angle of the right half of the body. Significance level for groups (a, b, and c): p < 0.05. For each pair of significance, the largest proportion of the frailty status group is indicated. Statistically significant values for p < 0.05 are presented in bold.

3.4. Relationship of Segmental Phase Angles and Cachexia Biomarkers with Frailty Status

In univariate logistic regression analysis, all segmental phase angles were significantly associated with frailty status. Each additional degree of phase angle increased the odds of developing frailty, with the left arm phase angle showing the strongest association (OR=2.30; 95% CI: 1.42–3.72; p=0.001), followed by the left leg phase angle (OR=1.95; 95% CI: 1.34–2.83; p=0.001) and the left hemisphere phase angle (OR=2.00; 95% CI: 1.26–3.16; p=0.003). CRP levels greater than 5 mg/L were related to frailty status (p=0.030) as was hemoglobin <12 g/dL (p=0.011) (Table 5).

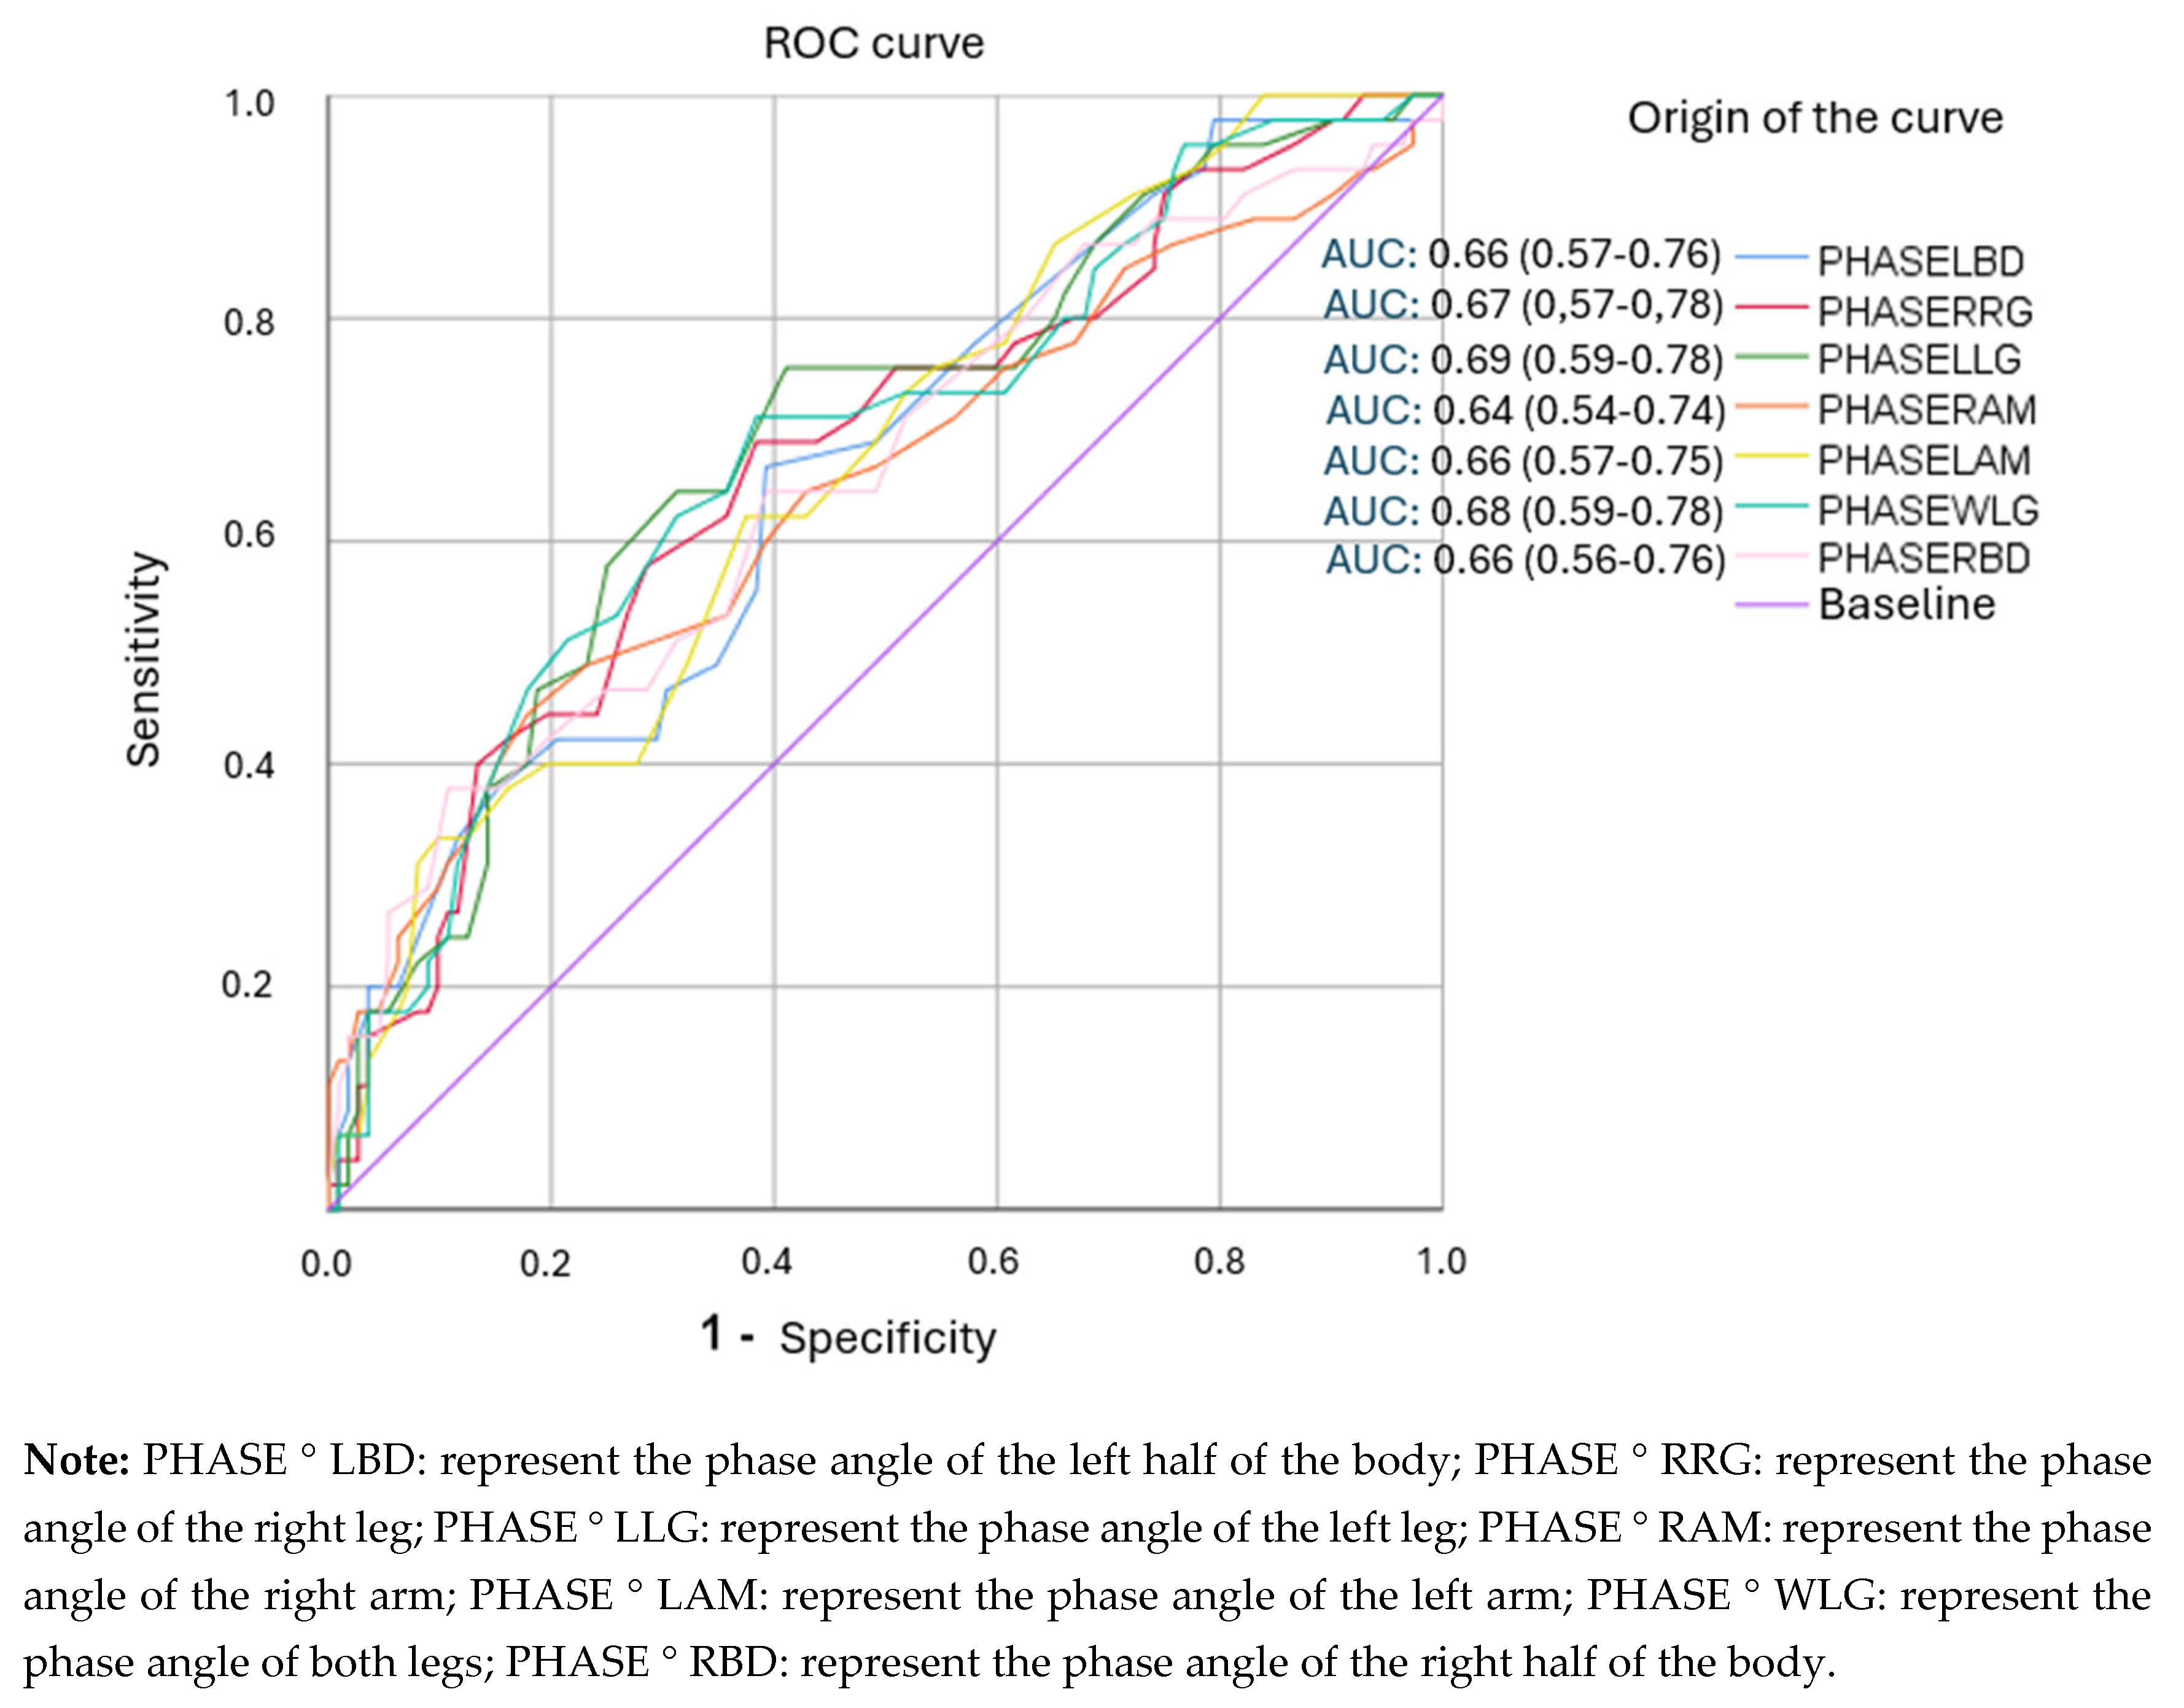
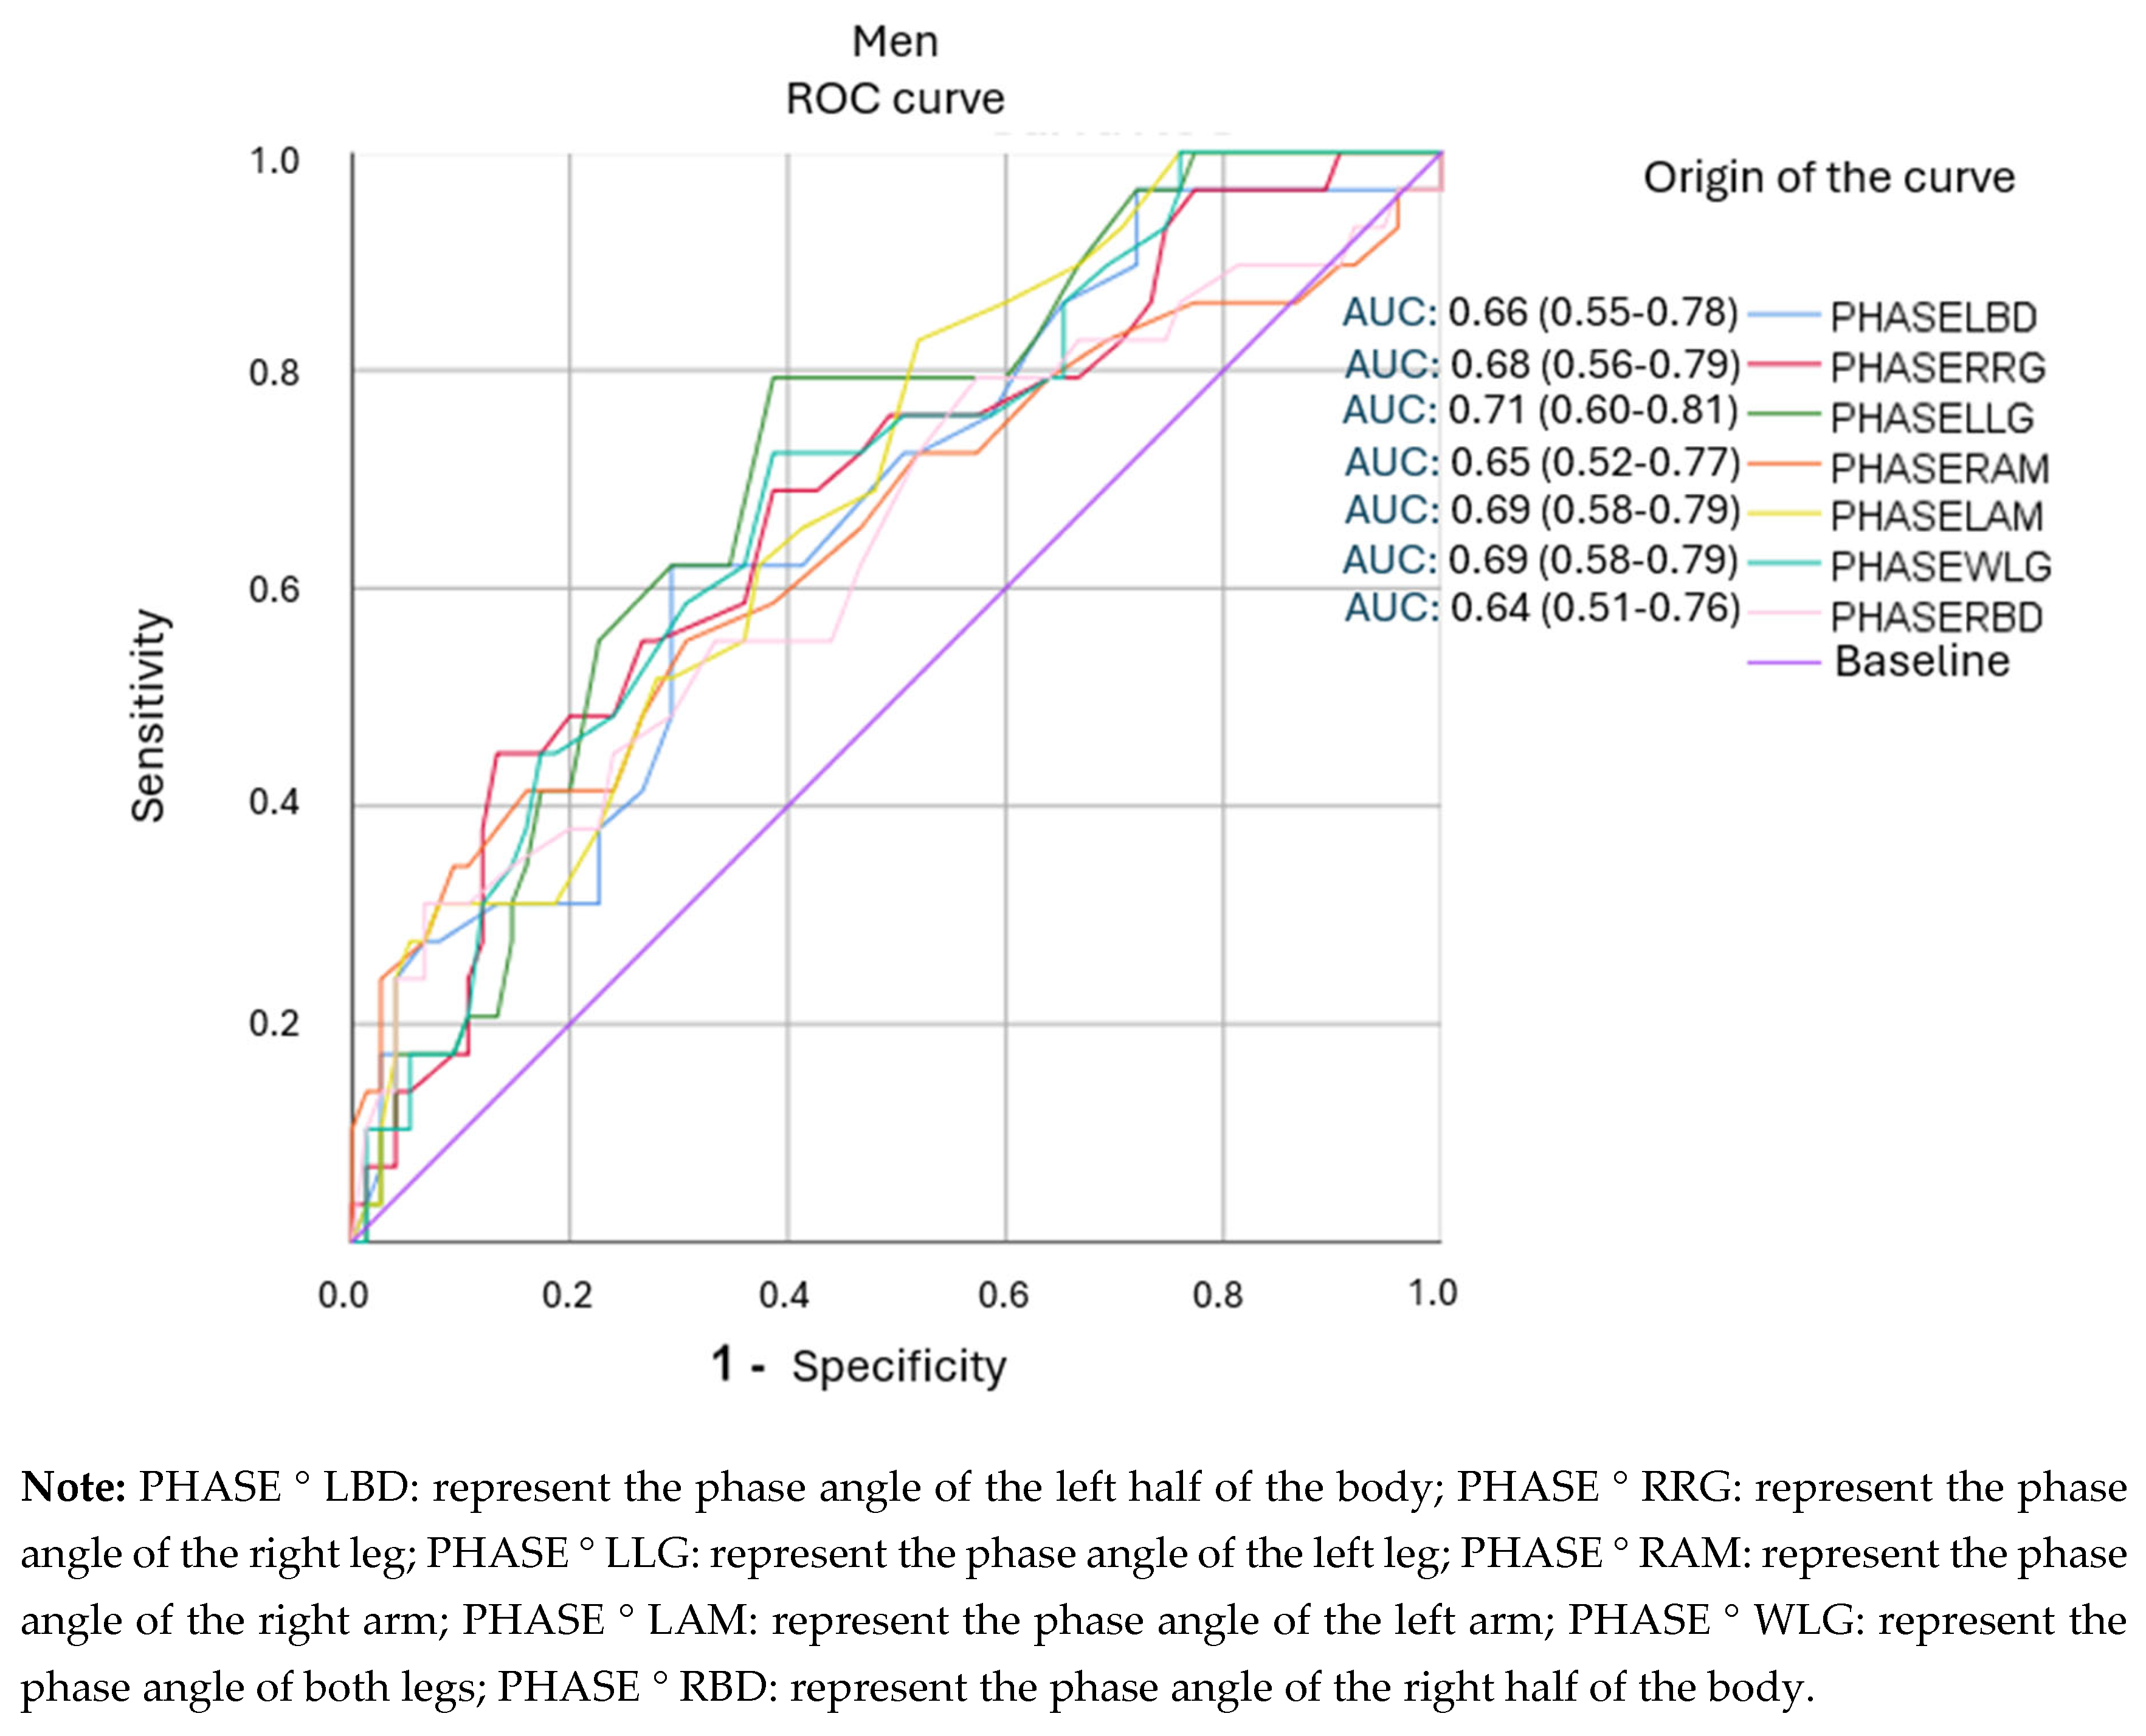
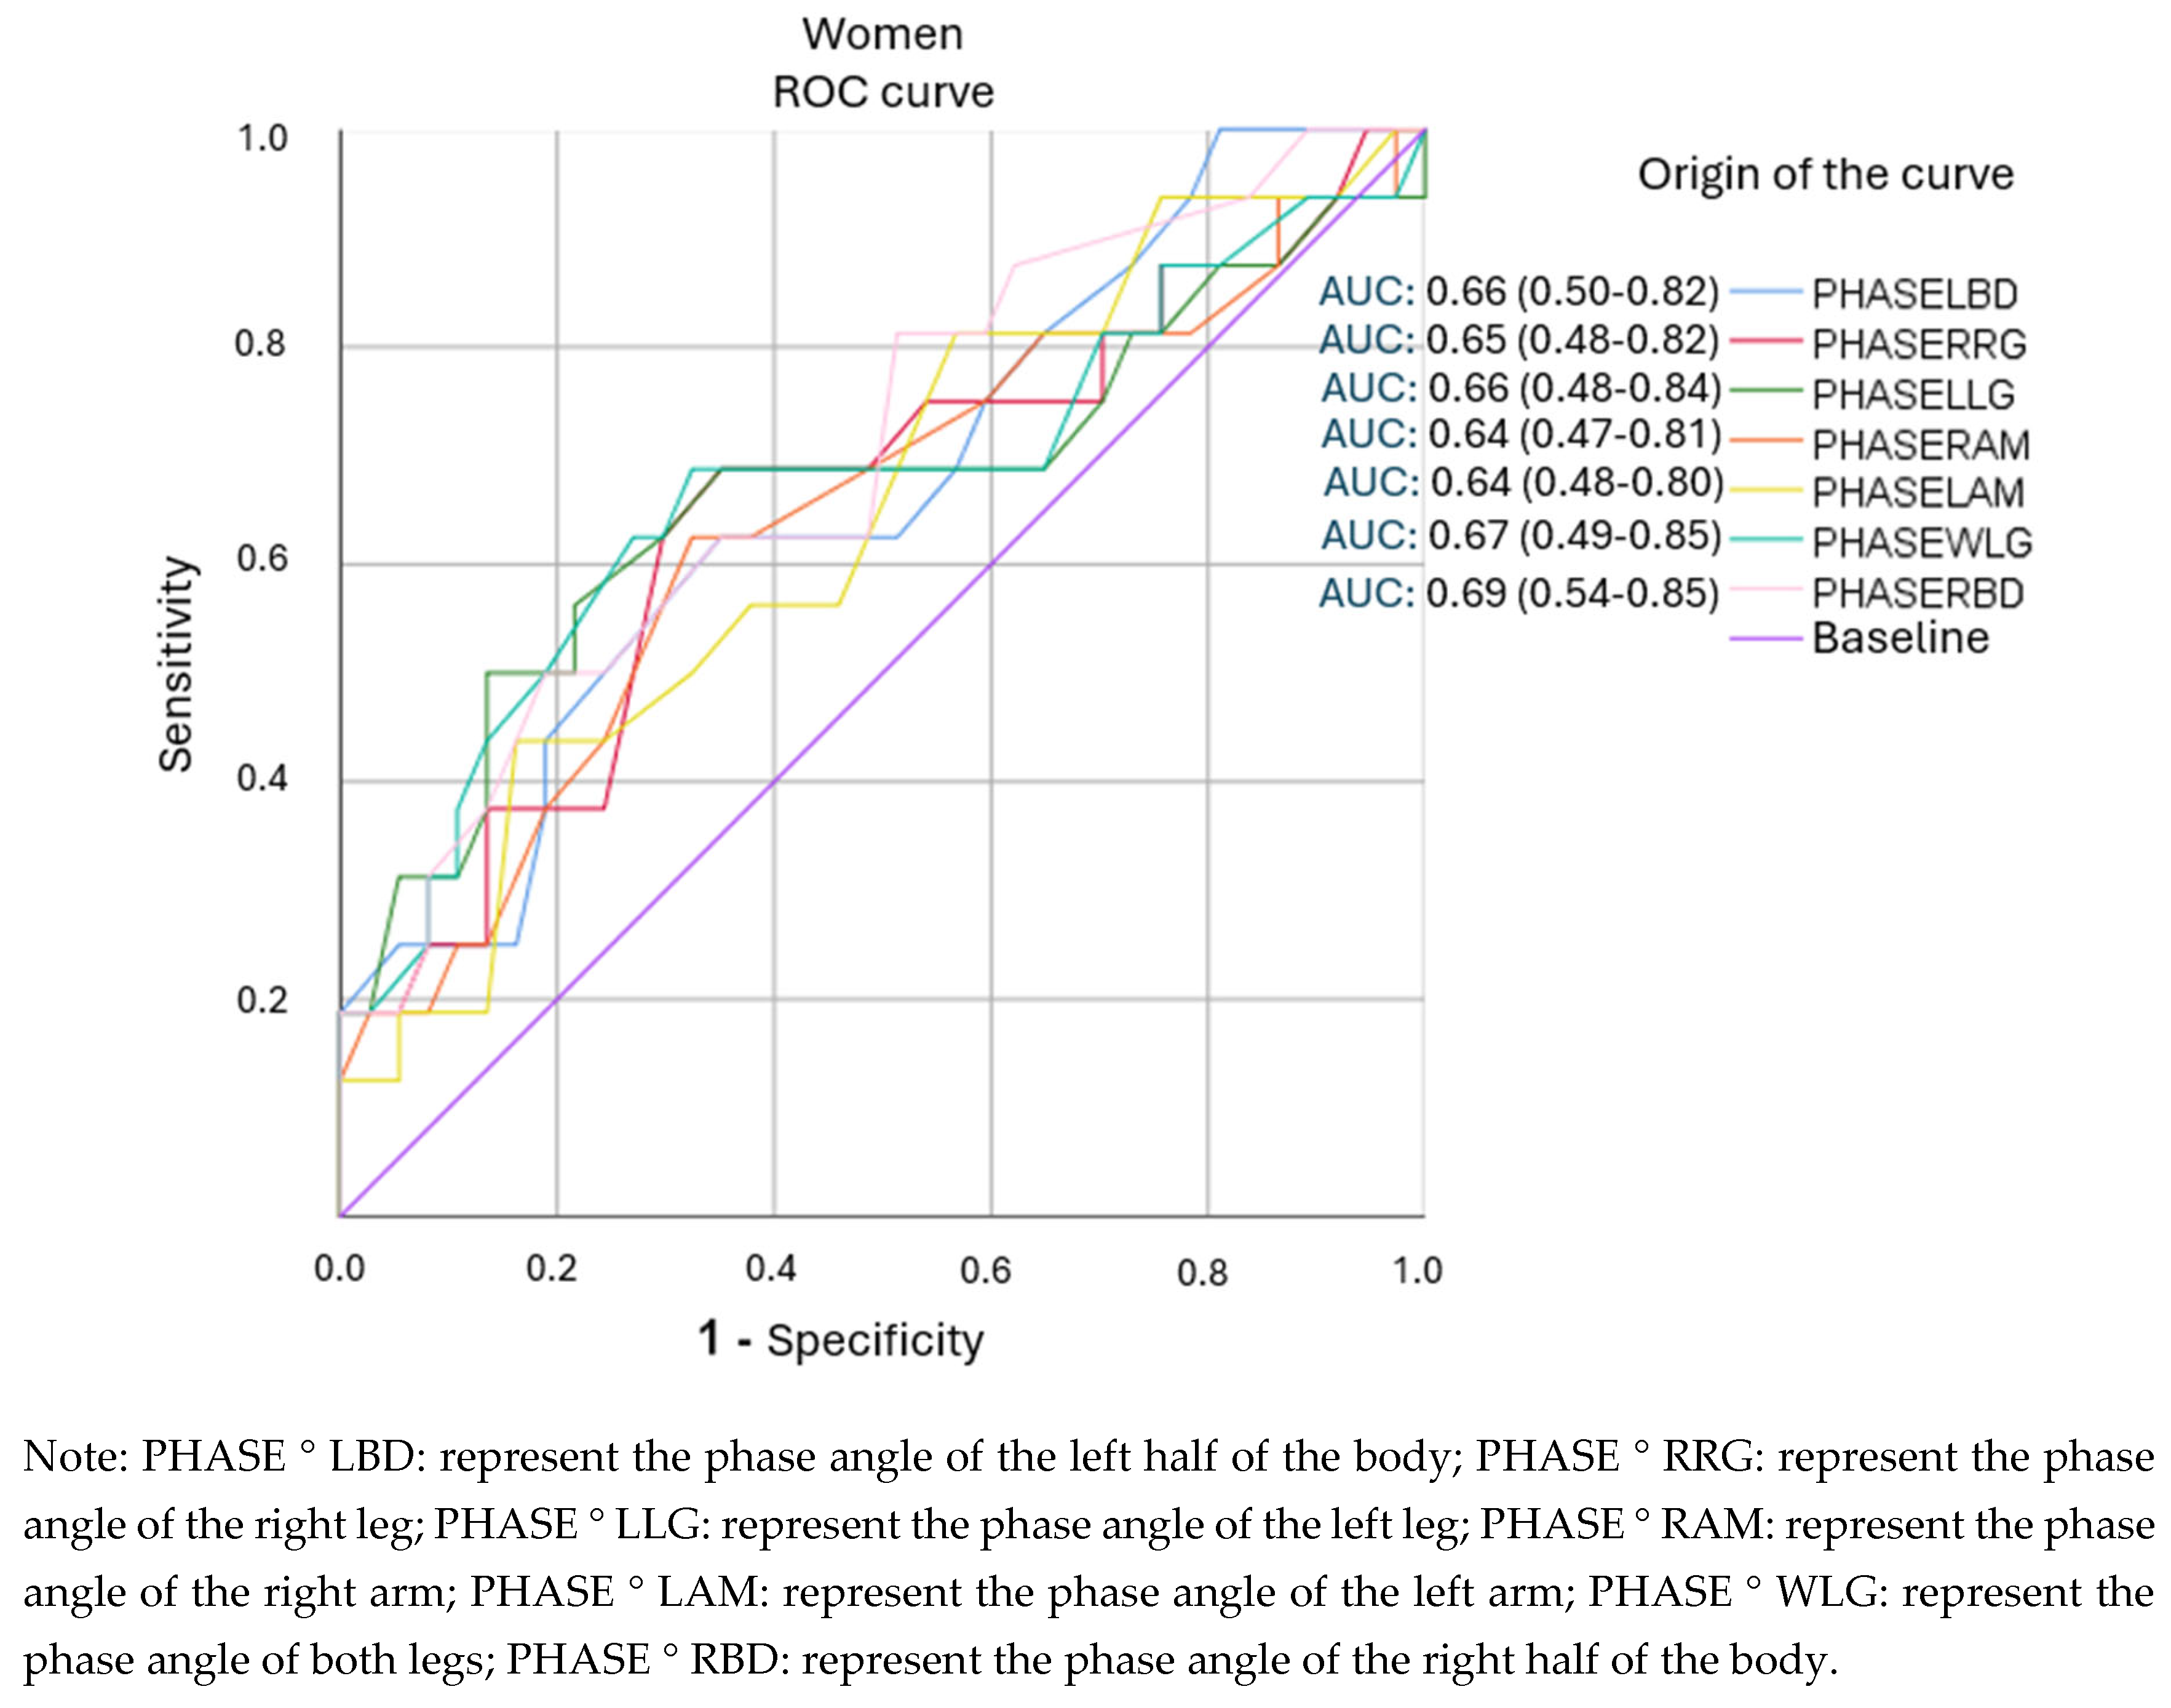
3.4. Analysis of ROC Curves and Cut-Off Points for Segmental Phase Angles.

The analysis of the ROC curve revealed that all segmental phase angles demonstrated statistically significant discriminatory ability in identifying frailty status. Optimal cutoff points were established for each segment, and sensitivity, specificity, and positive likelihood ratio (PLR) values were computed (see Figure 1). Additionally, the posterior probability was determined using the Fagan nomogram.
The phase angle that exhibited the highest sensitivity was found in both legs (0.694), although the positive likelihood ratio was lower compared to the phase angle of the right leg (1.79). The probability of increased frailty following the determination of the phase angle rose from 28.66% to 36% in both legs and to 42% in the right leg (refer to Table 6).
Figure 1. A Comparison of ROC Curves for Segmental Phase Angles Across the Entire Sample in Relation to Frailty Status.
Preprints 178707 g002
In the sex-specific analysis, all segmental phase angles in men showed statistically significant discriminatory ability for frailty status. The left hemisphere phase angle had the highest positive likelihood ratio (LR+ = 2.12; 95% CI: 1.35–3.33), followed by the left leg angle (LR+ = 2.05; 95% CI: 1.46–2.88) (Figure 2 and Table 7).
In the female-specific analysis, several segmental phase angles did not reach statistical significance in relation to frailty status: right leg (p = 0.078), left leg (p = 0.056), right arm (p = 0.108), and left arm (p = 0.106). The cutoff points obtained were lower than those identified in men. None of the evaluated segments showed clinically relevant individual diagnostic utility (LR+ > 2). Detailed results are shown in Table 8 and Figure 3.

4. Discussion

Frailty was present in more than one in four hospitalized older adult patients with CVD. This proportion was higher in women than in men, consistent with previous studies that have shown female sex to be associated with greater functional vulnerability and risk of frailty [41]. This difference may be linked to a higher prevalence of comorbidities, lower relative muscle mass, and lower functional reserve in women. However, these factors should be interpreted cautiously due to the observational design of the present study.
In this study, metabolic age was significantly higher in patients with frailty, mirroring the trend seen in chronological age. This alignment has been noted before [4] and reflects the cumulative functional impact of aging and multimorbidity. Some authors have even suggested that metabolic age could serve as a better indicator of cardiovascular risk than chronological age [42], opening an important avenue for research in the realm of frailty.
Cut-off points were identified for segmental phase angles associated with frailty status. The phase angle of the left hemisphere (5.15°) and the left leg (4.45°) showed the highest diagnostic yield in men, with positive likelihood ratios greater than 2, indicating moderate predictive value. The posterior probability of frailty in these segments was 45%. Similarly, the phase angle of the left leg with a cut-off point of 4.45° also showed fair predictive value, with a probability of 44%. In women, after ROC curve analysis, only the cut-off points for the left hemisphere, both legs, and the right hemisphere were statistically significant enough to establish cut-off points. However, the likelihood ratio for determining prognostic value in none of them exceeded 2 points, limiting its use as the sole discriminant test in this subgroup. The cut-off points identified by other authors are below 5.5° in both men and women, demonstrating the relationship between morbidity and mortality with lower phase angle values [22,23,27]. The disparity observed between sexes could be related to differences in body composition, distribution of muscle and fat mass, or inflammatory response, factors that also influence the measurement of the phase angle.
The association between segmental phase angles and frailty was consistent across all segments analyzed, with lower values in frail patients. Among these, the phase angle of the left arm showed the strongest relationship, with an odds ratio of 2.29 per additional degree, making it the segment with the greatest ability to discriminate frailty status. This association has also been documented in previous studies, which indicated that low phase angle values were significantly associated with a higher risk of frailty in older adults [18]. The present segmental analysis adds a novel perspective, not commonly found in clinical studies, and allows the detection of topographical differences that could reflect regional alterations in active cell mass or tissue fluid balance. This disaggregation could be useful for future individualized functional assessment strategies, especially in patients with cardiovascular disease, in whom the distribution of the inflammatory load or catabolism may not be homogeneous. The differences between bioimpedance models and the segmental approach used in this study may partly explain the variability in cut-off points reported by other authors [17,43].
Regarding body composition, the mean body mass index of the sample was within the overweight range, with a higher percentage in patients with frailty in both sexes. However, when analyzing of the sarcopenia index adjusted by sex, values were within the normal range in all groups, and slightly higher in patients with frailty, according to the cut-off points proposed by the European Group and the International Sarcopenia Group [37,38]. This finding suggests that the loss of muscle mass was not a determining factor in the state of frailty in this hospital cohort, aligning with studies that have described a disconnect between mass and function in acute clinical settings [11]. Additionally, abdominal perimeter was higher in men with frailty and pre-frailty, consistent with the findings of Crow et al. [44], who identified a link between central obesity and frailty in older adults. These results indicate a frailty profile more closely associated with excess adiposity than with loss of lean mass, particularly in men. This reinforces the importance of evaluating body fat distribution as part of the comprehensive assessment of frail patients with CVD.
However, it should be highlighted that although sarcopenia was not prevalent in this sample, its role in patients with CVD is well documented. Several studies have indicated that decreased muscle mass and strength are associated with an increased risk of adverse cardiovascular events and mortality, even in the presence of an apparently normal BMI [3,13]. In patients with heart failure, sarcopenia contributes to functional impairment and exercise intolerance and may coexist with obesity in what has been termed sarcopenic obesity, a condition with a worse prognosis. In this sense, the absence of sarcopenia in the present cohort could reflect a specific clinical selection, the stage of the disease, or even limitations of the bioimpedance-based measurement method, as recently discussed [20]. Therefore, although our data do not show a direct impact of sarcopenia on frailty at admission, its systematic evaluation remains a priority in the care of older patients with CVD.
Regarding body fat, it was observed that patients with frailty had a higher percentage of total and segmental fat, especially in the right arm, where statistically significant differences were found. Although the average percentage of body fat in men was below the threshold proposed by Tanaka et al. as a reference value for the development of frailty [18], in women it exceeded this value (32.15%), without reaching statistical significance. The presence of sarcopenic obesity was low in both sexes, being identified in only 6.63% of men, with no cases in women. This pattern suggests that, in the analyzed sample, fat accumulation may have played a more relevant role than muscle mass loss as a component of frailty, especially in men. These results, however, should be interpreted with caution, since several studies have highlighted the role of the decrease in lean mass in the progression to frailty. In this cohort of hospitalized older adults with CVD, the only significant association was observed with the percentage of segmental fat in the right arm, suggesting a more relevant fat-muscle distribution pattern than the overall loss of lean mass [11].
Current literature supports the role of sarcopenic obesity as a metabolically adverse condition, associated with chronic inflammation, insulin resistance, and increased cardiovascular risk, making it a high-risk clinical phenotype in older adults with CVD [3,39]. Furthermore, it has been noted that body composition in women may be more influenced by hormonal factors and differences in subcutaneous fat distribution, which could explain the lower diagnostic sensitivity of phase angles in this group. The low prevalence of sarcopenic obesity in this cohort could be related to the hospital setting, baseline functionality, or inclusion bias, but its potential clinical impact should not be underestimated, especially in more advanced stages of cardiovascular disease.
In the analysis of clinical biomarkers, a higher proportion of patients with low hemoglobin levels (<12 g/dL) was observed in the frailty group, as well as lower mean values, with statistical significance. This finding is consistent with what has been described in the literature, where anemia has been identified as a functional marker associated with frailty and clinical deterioration in older patients with cardiovascular disease [6]. C-reactive protein, as a marker of systemic inflammation, also showed a significant association with frailty status, in line with the hypothesis that chronic inflammatory processes contribute to progressive functional decline. However, serum albumin levels, although lower in frail patients, did not reach statistical significance, which could be due to the lower sensitivity of this marker in early stages of nutritional deterioration or to the influence of other clinical variables.
These results reinforce the role of frailty as a complex biological state in which low-grade inflammation, hematological dysregulation, and altered body composition coexist and interact with each other. Authors such as Fernández-Jiménez et al. and Korzonek-Szlacheta et al. [14,21] have pointed out that integrating clinical biomarkers with functional and structural parameters, such as segmental phase angles, can enhance the identification of vulnerable patients and predict adverse outcomes. This multidimensional approach is particularly valuable in hospitalized older adults with CVD, where clinical presentations are frequently intricate and dynamic.
Our findings are consistent with previous studies in hospital settings where bioimpedance parameters, such as phase angle, were useful in critically ill patients admitted to intensive care units, supporting their role as prognostic markers beyond nutritional assessment [45]. Similarly, in patients undergoing elective cardiac surgery, lower preoperative phase angles have been independently associated with frailty, impaired cardiac function, increased fluid requirements, and longer ICU stays, highlighting the prognostic value of phase angle in the cardiovascular population [46]. The ability of bioimpedance to detect regional alterations in body composition, acting as a versatile and non-invasive tool, favours its integration into routine hospital protocols, especially in cardiology wards, where early functional decline often goes unnoticed.
The identification of sex-specific segmental cut-off points could help healthcare professionals stratify frailty risk more accurately, tailor discharge planning, and optimize resource allocation. Furthermore, combining segmental phase angle assessment with biomarkers such as hemoglobin or CRP may enhance real-time frailty detection and facilitate timely multidisciplinary interventions. Future studies should confirm these findings in larger samples, incorporate multifactorial predictive models, and explore the longitudinal behavior of segmental phase angles in response to nutritional or physical interventions, as well as their prognostic value for cardiovascular events and clinically relevant outcomes.

4.1. Strengths and Limitations

This study has several strengths, including the standardized application of the measurement protocol by trained personnel, the use of an accessible and reproducible multifrequency segmental bioelectrical impedance technique, and stratified analysis by sex and clinical biomarkers, which allows for a more detailed interpretation.
However, the study’s observational, cross-sectional design prevents the establishment of causal relationships between segmental phase angles and frailty status. Additionally, the study was conducted using a single hospital sample, which was limited in size and representativeness, potentially restricting the generalization of the results to other clinical or population settings.
Furthermore, while multifrequency segmental bioimpedance, a validated, noninvasive technique, was utilized, its accuracy can be influenced by factors such as hydration status, body position, and interdevice variability, especially in patients with cardiovascular comorbidities. Additionally, reference methods like DXA or computed axial tomography were not employed to validate the body composition values obtained.
Similarly, the analysis by sex revealed a lower predictive capacity of phase angles in women, which may be attributed to a smaller sample size in this subgroup and potential uncontrolled physiological differences or measurement biases.
These limitations should be taken into account when extrapolating our findings to broader clinical settings.

5. Conclusions

The results of this study indicate that segmental phase angles obtained through bioimpedance have moderate prognostic value in identifying physical frailty status in hospitalized older adults with cardiovascular disease, particularly in men. The phase angles of the left arm and left leg displayed the highest discriminatory power, with likelihood ratios exceeding 2 and posterior probabilities exceeding 40%. However, in women, diagnostic performance was more limited, suggesting the necessity of utilizing combined approaches.
Segmental analysis offers unique information in comparison to global analysis, enabling the recognition of regional patterns associated with the distribution of active cell mass and body fat. Incorporating segmental analysis into clinical practice, alongside functional tools and biomarkers, has the potential to enhance early detection of frailty and guide personalized interventions for hospitalized older adults with CVD.

Author Contributions

Conceptualization, N. R-G. and M.L; methodology, N.R-G., M.L., M. F-C., B. M-G. and MJ.C; validation, N.R-G., M.L., MJ.C., and JA.SR.; formal analysis, N.R-G., M.L, MJ.C., B. M-G., M. F-C. and JA.SR; investigation, N.R-G; re-sources, N.R-G, M.L., MJ. C.; data curation, N.R-G; writing—original draft preparation, N.R-G; writing—review and editing, N.R-G; M.L., MJ. C., I. A, B. M-G., E. R-G., M. F-C., and JA. SR; visualization, N. R-G., M.L., MJ. C., I. A, B. M-G., E. R-G., M. F-C., JA. SR.; supervision, M.L., MJ.C., and JA.SR.; project administration, M.L., MJ.C., and JA.SR. All authors have read and agreed to the published version of the manuscript.”

Funding

This research received no external funding.

Institutional Review Board Statement

The study was conducted in accordance with the principles set out in the Declaration of Helsinki and approved by the Valladolid Ethics Committee for Research with medicinal products (ECRmp) involving humans under the reference code PI-20-1612 on 23 January 2020.

Informed Consent Statement

Informed consent was obtained from all subjects involved in the study.

Data Availability Statement

The data presented in this study are available upon request from the corresponding author.

Use of Artificial Intelligence

AI or AI-assisted tools were not used in drafting any aspect of this manuscript.

Acknowledgments

In this section, you can acknowledge any support given which is not covered by the author contribution or funding sections. This may include administrative and technical support, or donations in kind (e.g., materials used for experiments). Where GenAI has been used for purposes such as generating text, data, or graphics, or for study design, data collection, analysis, or interpretation of data, please add “During the preparation of this manuscript/study, the author(s) used [tool name, version information] for the purposes of [description of use]. The authors have reviewed and edited the output and take full responsibility for the content of this publication.”

Conflicts of Interest

The authors declare no conflicts of interest.

Guidelines and Standards Statement

This manuscript was drafted in alignment with the STROBE (Strengthening the Reporting of Observational Studies in Epidemiology) guidelines for observational research [32].

Abbreviations

The following abbreviations are used in this manuscript:
ASM Appendicular skeletal mass
BIA Bioelectrical impedance
BMI Body muscular index
CRP C-reactive protein
CVD Cardiovascular disease
DXA Bone densitometry
EWGSOP2 European Working Group on Sarcopenia in Older People (2nd definition)
IWGS International Working Group on Sarcopenia
NT-ProBNP N-terminal pro b-type natriuretic peptide
PhA Phase angle
PHASE ° LBD Phase angle of the left half of the body
PHASE ° RRG Phase angle of the right leg
PHASE ° LLG Phase angle of the left leg
PHASE ° RAM Phase angle of the right arm
PHASE ° LAM Phase angle of the left arm
PHASE ° WLG Phase angle of both legs
PHASE ° RBD Phase angle of the right half of the body

References

  1. Cederholm, T.; Barazzoni, R.; Austin, P.; Ballmer, P.; Biolo, G.; Bischoff, S.C.; Compher, C.; Correia, I.; Higashiguchi, T.; Holst, M.; et al. ESPEN guidelines on definitions and terminology of clinical nutrition. Clin Nutr. 2017, 36, 49-64. [CrossRef]
  2. Baumgartner, R.N.; Stauber, P.M.; Koehler, K.M.; Romero, L.; Garry, P.J. Associations of fat and muscle masses with bone mineral in elderly men and women. Am J Clin Nutr. 1996, 63, 365-72. [CrossRef]
  3. Atkins, J.L.; Wannamathee, S.G. Sarcopenic obesity in ageing: cardiovascular outcomes and mortality. Br J Nutr. 2020, 124, 1102-1113. [CrossRef]
  4. Visseren, F.L.J.; Mach, F.; Smulders, Y.M.; Carballo, D.; Koskinas, K.C.; Bäck, M.; Benetos, A.; Biffi, A.; Boavida, J.M.; Capodanno, D.; et al. 2021 ESC Guidelines on cardiovascular disease prevention in clinical practice. Eur J Prev Cardiol. 2022, 29, 5-115. [CrossRef]
  5. Ni Lochlainn, M.; Cox, N.J.; Wilson, T.; Hayhoe, R.P.G.; Ramsay, S.E.; Granic, A.; Isanejad, M.; Roberts, H.C.; Wilson, D.; Welch, C.; et al. Nutrition and Frailty: Opportunities for Prevention and Treatment. Nutrients 2021, 13, 2349. [CrossRef]
  6. Fried, L.P.; Cohen, A.A.; Xue, Q.L.; Walston, J.; Bandeen-Roche, K.; Varadhan, R. The physical frailty syndrome as a transition from homeostatic symphony to cacophony. Nat Aging. 2021, 1,36-46. Epub 2021 Jan 14. [CrossRef]
  7. Holmes, C.J.; Racette, S.B. The Utility of Body Composition Assessment in Nutrition and Clinical Practice: An Overview of Current Methodology. Nutrients 2021, 13, 2493. [CrossRef]
  8. Ward, L.C. Electrical Bioimpedance: From the Past to the Future. J Electr Bioimpedance. 2021, 12, 1-2. [CrossRef]
  9. Sánchez-Iglesias, A.; Fernández-Lucas, M.; Teruel, J.L. The electrical basis of bioimpedance. Nefrologia 2012, 32, 133-5. English, Spanish. [CrossRef]
  10. Fried, L.P.; Tangen, C.M.; Walston, J.; Newman, A.B.; Hirsch, C.; Gottdiener, J.; Seeman, T.; Tracy, R.; Kop, W.J.; Burke, G.; et al. Frailty in older adults: evidence for a phenotype. J Gerontol A Biol Sci Med Sci. 2001, 56, M146-56. [CrossRef]
  11. Davenport, A. Application of the Clinical Frailty Score and body composition and upper arm strength in haemodialysis patients. Clin Kidney J. 2021, 15, 553-559. [CrossRef]
  12. Kang, D.O.; Park, S.Y.; Choi, B.G.; Na, J.O.; Choi, C.U.; Kim, E.J.; Rha, S.W.; Park, C.G.; Hong, S.J.; Seo, H.S. Prognostic Impact of Low Skeletal Muscle Mass on Major Adverse Cardiovascular Events in Coronary Artery Disease: A Propensity Score-Matched Analysis of a Single Center All-Comer Cohort. J Clin Med. 2019, 8, 712. [CrossRef]
  13. von Haehling, S.; Garfias Macedo, T.; Valentova, M.; Anker, M.S.; Ebner, N.; Bekfani, T.; Haarmann, H.; Schefold, J.C.; Lainscak, M.; Cleland, J.G.F.; Doehner, W.; et al. Muscle wasting as an independent predictor of survival in patients with chronic heart failure. J Cachexia Sarcopenia Muscle. 2020, 11, 1242-1249. Epub 2020 Aug 6. [CrossRef]
  14. Korzonek-Szlacheta, I.; Hudzik, B.; Zubelewicz-Szkodzińska, B.; Czuba, Z.P.; Szlacheta, P.; Tomasik, A. The Association between Circulating Cytokines and Body Composition in Frail Patients with Cardiovascular Disease. Nutrients 2024, 16, 1227. [CrossRef]
  15. Nishio, R.; Dohi, T.; Fukase, T.; Takeuchi, M.; Takahashi, N.; Endo, H.; Doi, S.; Okai, I.; Iwata, H.; Okazaki, S.; et al. Impact of simple equation for estimating appendicular skeletal muscle mass in patients with stable coronary artery disease undergoing percutaneous coronary intervention. Int J Cardiol Heart Vasc. 2022, 44, 101163. [CrossRef]
  16. Yang, Y.; Huang, Y. Association between bone mineral density and cardiovascular disease in older adults. Front Public Health. 2023, 11, 1103403. [CrossRef]
  17. Ko, S.J.; Cho, J.; Choi, S.M.; Park, Y.S.; Lee, C.H.; Lee, S.M.; Yoo, C.G.; Kim, Y.W.; Lee, J. Phase Angle and Frailty Are Important Prognostic Factors in Critically Ill Medical Patients: A Prospective Cohort Study. J Nutr Health Aging. 2021, 25, 218-223. [CrossRef]
  18. Tanaka, S.; Ando, K.; Kobayashi, K.; Seki, T.; Hamada, T.; Machino, M.; Ota, K.; Morozumi, M.; Kanbara, S.; Ito, S.; et al. Low Bioelectrical Impedance Phase Angle Is a Significant Risk Factor for Frailty. Biomed Res Int. 2019, 2019:6283153. [CrossRef]
  19. Zanforlini, B.M.; Trevisan, C.; Bertocco, A.; Piovesan, F.; Dianin, M.; Mazzochin, M.; Alessi, A.; Zoccarato, F.; Manzato, E.; Sergi, G. Phase angle and metabolic equivalents as predictors of frailty transitions in advanced age. Exp Gerontol. 2019, 122, 47-52. [CrossRef]
  20. Norman, K.; Herpich, C.; Müller-Werdan, U. Role of phase angle in older adults with focus on the geriatric syndromes sarcopenia and frailty. Rev Endocr Metab Disord. 2023, 24, 429-437. Epub 2022 Dec 2. [CrossRef]
  21. Fernández-Jiménez, R.; Dalla-Rovere, L.; García-Olivares, M.; Abuín-Fernández, J.; Sánchez-Torralvo, F.J.; Doulatram-Gamgaram, V.K.; Hernández-Sanchez, A.M.; García-Almeida, J.M. Phase Angle and Handgrip Strength as a Predictor of Disease-Related Malnutrition in Admitted Patients: 12-Month Mortality. Nutrients 2022, 14, 1851. [CrossRef]
  22. Stellingwerf, F.; Beumeler, L.F.E.; Rijnhart-de Jong, H.; Boerma, E.C.; Buter, H. The predictive value of phase angle on long-term outcome after ICU admission. Clin Nutr. 2022, 41, 1256-1259. Epub 2022 Apr 6. [CrossRef]
  23. Xu, Y.; Ling, S.; Liu, Z.; Luo, D.; Qi, A.; Zeng, Y. The ability of phase angle and body composition to predict risk of death in maintenance hemodialysis patients. Int Urol Nephrol. 2024, 56, 731-737. Epub 2023 Aug 5. [CrossRef]
  24. de Borba, E.L.; Ceolin, J.; Ziegelmann, P.K.; Bodanese, L.C.; Gonçalves, M.R.; Cañon-Montañez, W.; Mattiello, R. Phase angle of bioimpedance at 50 kHz is associated with cardiovascular diseases: systematic review and meta-analysis. Eur J Clin Nutr. 2022, 76, 1366-137. Epub 2022 Apr 12. [CrossRef]
  25. Langer, R.D.; Larsen, S.C.; Ward, L.C.; Heitmann, B.L. Phase angle measured by bioelectrical impedance analysis and the risk of cardiovascular disease among adult Danes. Nutrition 2021, 89, 111280. Epub 2021 Apr 18. [CrossRef]
  26. Scicchitano, P.; Ciccone, M.M.; Iacoviello, M.; Guida, P.; De Palo, M.; Potenza, A.; Basile, M.; Sasanelli, P.; Trotta, F.; Sanasi, M; et al. Respiratory failure and bioelectrical phase angle are independent predictors for long-term survival in acute heart failure. Scand Cardiovasc J. 2022, 56, 28-34. [CrossRef]
  27. Mullie, L.; Obrand, A.; Bendayan, M.; Trnkus, A.; Ouimet, M.C.; Moss, E.; Chen-Tournoux, A.; Rudski, L.G.; Afilalo, J. Phase Angle as a Biomarker for Frailty and Postoperative Mortality: The BICS Study. J Am Heart Assoc. 2018, 7, e008721. [CrossRef]
  28. Ward, L.C. Editorial Comment: Phase angle from bioimpedance measurements as a surrogate of cardiovascular disease. Eur J Clin Nutr. 2022, 76, 1364-1365. Epub 2022 Jul 8. [CrossRef]
  29. Richter, D.; Guasti, L.; Walker, D.; Lambrinou, E.; Lionis, C.; Abreu, A.; Savelieva, I.; Fumagalli, S.; Bo, M.; Rocca, B.; et al. Frailty in cardiology: definition, assessment and clinical implications for general cardiology. A consensus document of the Council for Cardiology Practice (CCP), Association for Acute Cardio Vascular Care (ACVC), Association of Cardiovascular Nursing and Allied Professions (ACNAP), European Association of Preventive Cardiology (EAPC), European Heart Rhythm Association (EHRA), Council on Valvular Heart Diseases (VHD), Council on Hypertension (CHT), Council of Cardio-Oncology (CCO), Working Group (WG) Aorta and Peripheral Vascular Diseases, WG e-Cardiology, WG Thrombosis, of the European Society of Cardiology, European Primary Care Cardiology Society (EPCCS). Eur J Prev Cardiol. 2022, 29, 216-227. [CrossRef]
  30. James, K.; Jamil, Y.; Kumar, M.; Kwak, M.J.; Nanna, M.G.; Qazi, S.; Troy, A.L.; Butt, J.H.; Damluji, A.A.; Forman, D.E.; et al. Frailty and Cardiovascular Health. J Am Heart Assoc. 2024, 13, e031736. Epub 2024 Jul 26. [CrossRef]
  31. van Smeden, M.; de Groot, J.A.; Moons, K.G.; Collins, G.S.; Altman, D.G.; Eijkemans, M.J.; Reitsma, J.B. No rationale for 1 variable per 10 events criterion for binary logistic regression analysis. BMC Med Res Methodol. 2016, 16,163. [CrossRef]
  32. von Elm, E.; Altman, D.G.; Egger, M.; Pocock, S.J.; Gøtzsche, P.C.; Vandenbroucke, J.P.; STROBE Initiative. The Strengthening the Reporting of Observational Studies in Epidemiology (STROBE) statement: guidelines for reporting observational studies. Bull World Health Organ. 2007, 85, 867-72. [CrossRef]
  33. Radloff, L.S. TheCES-DScale:ASelf-ReportDepressionScaleforResearchintheGeneralPopulation. Appl Psychol Meas 1977, 1, 385–401.
  34. Ruiz Comellas, A.; Pera, G.; Baena Diez, J.M.; et al. [Validation of a Spanish Short Version of the Minnesota Leisure Time Physical Activity Questionnaire (VREM)]. Rev Esp Public Health 2012, 86, 495–508.
  35. Wilson, P.W.; D’Agostino, R.B.; Levy, D.; Belanger, A.M.; Silbershatz, H.; Kannel, W.B. Prediction of coronary heart disease using risk factor categories. Circulation. 1998, 97, 1837-47. [CrossRef]
  36. Meeuwsen, S.; Horgan, G.W.; Elia, M. The relationship between BMI and percent body fat, measured by bioelectrical impedance, in a large adult sample is curvilinear and influenced by age and sex. Clin Nutr. 2010, 29,560-6. Epub 2010 Mar 31. [CrossRef]
  37. Cruz-Jentoft, A.J.; Bahat, G.; Bauer, J.; Boirie, Y.; Bruyère, O.; Cederholm, T.; Cooper, C.; Landi, F.; Rolland, Y.; Sayer, A.A.; et al. Sarcopenia: revised European consensus on definition and diagnosis. Age Ageing 2019, 48, 601. Erratum for: Age Ageing. 2019, 48, 16-31. https://doi.org/10.1093/ageing/afy169. [CrossRef]
  38. Fielding, R.A.; Vellas, B.; Evans, W.J.; Bhasin, S.; Morley, J.E.; Newman, A.B.; Abellan van Kan, G.; Andrieu, S.; Bauer, J.; Breuille, D.; et al. Sarcopenia: an undiagnosed condition in older adults. Current consensus definition: prevalence, etiology, and consequences. International working group on sarcopenia. J Am Med Dir Assoc. 2011, 12, 249-56. Epub 2011 Mar 4. [CrossRef]
  39. Benz, E.; Pinel, A.; Guillet, C.; Capel, F.; Pereira, B.; De Antonio, M.; Pouget, M.; Cruz-Jentoft, A.J.; Eglseer, D.; Topinkova, E.; et al. Sarcopenia and Sarcopenic Obesity and Mortality Among Older People. JAMA Netw Open. 2024, 7,e243604. [CrossRef]
  40. Fagan, T.J. Letter: Nomogram for Bayes’s theorem. N Engl J Med. 1975, 293, 257. [CrossRef]
  41. Pérez-Ros, P.; Vila-Candel, R.; López-Hernández, L.; Martínez-Arnau, F.M. Nutritional Status and Risk Factors for Frailty in Community-Dwelling Older People: A Cross-Sectional Study. Nutrients 2020, 12,1041. [CrossRef]
  42. Elguezabal-Rodelo, R.; Ochoa-Précoma, R.; Vazquez-Marroquin, G.; Porchia, L.M.; Montes-Arana, I.; Torres-Rasgado, E.; Méndez-Fernández, E.; Pérez-Fuentes, R.; Gonzalez-Mejia, M.E. Metabolic age correlates better than chronological age with waist-to-height ratio, a cardiovascular risk index. Med Clin (Barc). 2021, 157, 409-417. English, Spanish. Epub 2020 Oct 13. [CrossRef]
  43. Wilhelm-Leen, E.R.; Hall, Y.N.; Horwitz, R.I.; Chertow, G.M. Phase angle, frailty and mortality in older adults. J Gen Intern Med. 2014, 29, 147-54. [CrossRef]
  44. Crow, R.S.; Lohman, M.C.; Titus, A.J.; Cook, S.B.; Bruce, M.L.; Mackenzie, T.A.; Bartels, S.J.; Batsis, J.A. Association of Obesity and Frailty in Older Adults: NHANES 1999-2004. J Nutr Health Aging. 2019, 23, 138-144. [CrossRef]
  45. Papanastasiou, P; Chaloulakou, S.; Karayiannis D.; Almperti A.; Poupouzas, G.; Vrettou, C.S.; Issaris, V.; Jahaj, E.; Vassiliou, A.G., Dimopoulou, I. Phase Angle Trajectory Among Critical Care Patients: Longitudinal Decline Predicts Mortality Independent of Clinical Severity Scores. Healthcare (Basel). 2025, 13(12):1463. [CrossRef]
  46. Ryz, S.; Nixdorf, L.; Puchinger, J.; Lassnigg, A.; Wiedemann, D.; Bernardi, M.H. Preoperative Phase Angle as a Risk Indicator in Cardiac Surgery-A Prospective Observational Study. Nutrients. 2022, 14(12):2491. [CrossRef]
Figure 2. A Comparison of ROC Curves of Segmental Phase Angles in The Overall Sample Versus Frailty Status in Men.
Preprints 178707 g003
Figure 3. A Comparison of ROC Curves of Segmental Phase Angles in The Overall Sample Versus Frailty Status in Women.
Preprints 178707 g004
Table 2. Body Composition, Sarcopenia, and Sarcopenic Obesity Vary According to Sex and Frailty Status.
Variable Total
(n = 157)
Male
(n = 104)
Female
(n = 53)
Frail
(n = 45)
Pre-frail
(n = 82)
Non-frail
(n = 30)
p-value (frailty) p-value (sex)
Metabolic age (years),
mean (SD)
63.76 (11.14) 62.91 (11.59) 65.45 (10.16) 69.42 (9.44) 62.15 (10.56) 59.66 (8.96) 0.001 0.102
% Body fat, mean (SD) 27.20 (7.66) 25.72 (6.63) 30.28 (8.73) 29.81 (6.98) 26.89 (8.01) 25.27 (6.93) 0.068 <0.01
Abdominal perimeter (cm), mean (SD) 102.64 (13.33) 104.83 (13.27) 98.49 (12.36) 106.52 (12.91) 103.12 (13.31) 96.90 (11.12) 0.027 0.003
% Total Body Water,
mean (SD)
51.78 (5.79) 52.84 (5.43) 49.67 (5.96) 49.74 (6.21) 52.12 (5.38) 53.04 (5.36) 0.062 <0.01
Fat-free mass (kg),
mean (SD)
54.04 (11.40) 59.80 (8.74) 42.17 (7.19) 50.94 (10.73) 54.46 (11.35) 57.13 (10.63) 0.075 <0.001
Muscle mass (kg),
mean (SD)
51.32 (10.86) 56.79 (8.32) 39.75 (6.79) 48.25 (10.12) 51.79 (10.89) 54.56 (10.02) 0.082 <0.001
ASM/height2 (kg/m2),
mean (SD)
8.17 (1.23) 8.61 (1.09) 7.33 (1.00) 8.31 (1.17) 8.10 (1.27) 8.17 (1.18) 0.404 <0.001
% ASM/body weight,
mean (SD)
17.13 (2.80) 17.56 (2.41) 16.24 (3.36) 16.85 (2.75) 17.13 (2.87) 17.66 (2.64) 0.339 <0.05
% Right arm fat, mean (SD) 31.42 (7.84) 29.84 (6.90) 34.63 (8.45) 33.91 (7.45) 31.03 (7.96) 29.63 (7.31) 0.018 <0.01
Grip strength (kg),
mean (SD)
25.34 (9.72) 29.04 (8.45) 17.70 (6.20) 20.05 (8.09) 26.25 (9.70) 31.53 (7.59) <0.001 <0.001
Sarcopenic obesity (%) 4.46 6.63 0.00 8.89 2.44 0.00 0.047 0.041
Notes: ASM, appendicular skeletal mass; Sarcopenic obesity is defined as a combination of high % segmental fat + and low grip strength (Benz et al., 2024). The p-value for frailty indicates a comparison between frail, pre-frail, and non-frail patients. The p-value for sex indicates a comparison between men and women. Values with statistically significant differences (p < 0.05) are highlighted in bold.
Table 3. Relationship Between Segmental Phase Angles and Clinical Diagnosis on Admission.
Phase angle Diagnosis
Arrhythmias
n=16
(a)
Infective endocarditis
n=2
(b)
Heart failure
n=34
(c)
Coronary artery disease
n=96
(d)
Valvopathies
n=9
(e)
X ¯
(SD)
X ¯
(SD)
X ¯
(SD)
X ¯
(SD)
X ¯
(SD)
PHASE°LBD 5.13 b
(0.82)
7.10
(2.55)
4.81 b,d
(0.83)
5.32 b
(0.73)
4.21 a,b,c,d
(0.78)
PHASE°RRG 4.30 d
(1,10)
4.00
(0.57)
4.13 d
(1.23)
4.88
(0.97)
3.78 d
(0.60)
PHASE°LLG 4.38
(1.19)
4.00
(0.14)
4.11 d
(1.20)
4.80
(0.90)
3.62 d
(0.65)
PHASE°RAM 5.54 b
(0.84)
8.10
(2.97)
5.34 b,d
(0.69)
5.88 b
(0.71)
5.17 b,d
(0.91)
PHASE°LAM -5.63
(0.98)
6.25
(0.07)
5.34 d
(0.91)
5.71
(0.71)
4.74 a,b,c,d
(0.80)
PHASE°WLG 4.44
(1,10)
4.30
(0.00)
4.20 d
(1.19)
4.93
(0.90)
3.76 d
(0.62)
PHASE°RBD 4.99 b
(0.79)
8.30
(4,10)
4.82 b,d
(0.81)
5.40 b
(0.73)
4.49 b,d
(0.77)
Note:  X ¯ : Mean; SD: standard deviation; PHASE ° LBD: phase angle of the left half of the body; PHASE ° RRG: phase angle of the right leg; PHASE ° LLG: phase angle of the left leg; PHASE ° RAM: phase angle of the right arm; PHASE ° LAM: phase angle of the left arm; PHASE ° WLG: phase angle of both legs; PHASE ° RBD: phase angle of the right half of the body. Superscript letters indicate significance level for groups (a, b, c, and e): p < 0.05. For each pair of significance, the highest mean is shown in subscript.
Table 5. Relationship of Segmental Phase Angles and Cachexia Biomarkers with Frailty Status.
Standard
error
df p-value Odds ratio 95% CI
Lower Superior
PHASE ° LBD 0.24 1 0.003 2.00 1.26 3.16
PHASE ° RRG 0.18 1 0.001 1.78 1.25 2.54
PHASE ° LLG 0.19 1 0.001 1.95 1.34 2.83
PHASE ° RAM 0.23 1 0.015 1.76 1.12 2.78
PHASE ° LAM 0.25 1 0.001 2.30 1.42 3.78
PHASE ° WLG 0.19 1 0.001 1.90 1.30 2.76
PHASE ° RBD 0.22 1 0.025 1.65 1.07 2.56
CRP>5mg/L 0.36 1 0.030 0.46 0.22 0.93
Albumin<3.2 g/dL 0.57 1 0.232 0.51 0.17 1.55
Hemoglobin <12g/dL 0.44 1 0.011 0.32 0.14 0.77
Note: PHASE ° LBD: phase angle of the left half of the body; PHASE ° RRG: phase angle of the right leg; PHASE ° LLG: phase angle of the left leg; PHASE ° RAM: phase angle of the right arm; PHASE ° LAM: phase angle of the left arm; PHASE ° WLG: phase angle of both legs; PHASE ° RBD: phase angle of the right half of the body; CRP: C-reactive protein. OR: odds ratio; CI: confidence interval. Univariate analysis with frailty as the dependent variable (binary logistic model). Statistically significant associations (p < 0.05) are highlighted in bold within the text.
Table 6. The Prognostic Value of Segmental Phase Angles for Frailty Status Based on Cut-Off Points in The Total Sample.
Segmental phase angle
(Cut-off point) °
Sensitivity Specificity LR+ (95%CI) Post-test probability %
(95% CI)
PHASE°LBD (5.15) 0.667 0.607 1.70 (1.25-2.31) 41 (33-48)
PHASE°RRG (4.45) 0.689 0.616 1.79 (1.32-2.44) 42(35-50)
PHASE°LLG (4.25) 0.644 0.688 2.06 (1.45-2.93) 45(37-54)
PHASE°RAM (5.75) 0.644 0.571 1.50(1.11-2.04) 38(31-45)
PHASE°LAM (5.65) 0.689 0.509 1.40 (1.07-1.84) 36(30-43)
PHASE°WLG (4.45) 0.694 0.536 1.39 (1.03-1.86) 36(29-43)
PHASE°RBD (5.25) 0.644 0.536 1.39(1.03-1.86) 36(29-43)
Note: PHASE ° LBD: left half-body phase angle; PHASE ° RRG: right leg phase angle; PHASE ° LLG: left leg phase angle; PHASE ° RAM: right arm phase angle; PHASE ° LAM: left arm phase angle; PHASE ° WLG: both legs phase angle; PHASE ° RBD: right half-body phase angle. LR+: positive likelihood ratio. Posterior probability calculated with a prior prevalence of 28.66% using the Fagan nomogram.
Table 7. Prognostic Value of Segmental Phase Angles for Frailty Status According to Cut-Off Points in Men.
Segmental phase angle
(Cut-off point) °
Male
Sensitivity Specificity LR + (95%CI) Post-test probability % (95% CI)
PHASE°LBD (5.15) 0.621 0.707 2,12(1,35-3,33) 45(34-56)
PHASE°RRG (4.45) 0.690 0.573 1.62(1.13-2.31) 39(30-47)
PHASE°LLG (4.45) 0.793 0.613 2.05(1.46-2.88) 44(36-53)
PHASE°RAM (5.95) 0.655 0.533 1.40 (0.98-2.01) 35(27-44)
PHASE°LAM (6.05) 0.828 0.480 1.59(1.21-2.09) 38(32-45)
PHASE°WLG (4.55) 0.724 0.613 1.87 (1.30-2.69) 42(33-51)
PHASE°RBD (5.65) 0.793 0.427 1.38 (1.06-1.81) 35(29-41)
Note: PHASE ° LBD: phase angle of the left half of the body; PHASE ° RRG: phase angle of the right leg; PHASE ° LLG: phase angle of the left leg; PHASE ° RAM: phase angle of the right arm; PHASE ° LAM: phase angle of the left arm; PHASE ° WLG: phase angle of both legs; PHASE ° RBD: phase angle of the right half of the body. LR+: positive likelihood ratio. Posterior probability calculated according to the prevalence of frailty in men.
Table 8. Prognostic Value of Segmental Phase Angles for Frailty Status Based on Cut-Off Points in Women.
Segmental phase angle
(Cut-off point) °
Female
Sensitivity Specificity LR + (95%CI) Post-test probability % (95% CI)
PHASE°LBD (4.65) 0.625 0.649 1.78 (1.00-3.18) 43(30-58)
PHASE°WLG (4.55) 0.668 0.622 1.82 (1.07-3.08) 44(32-57)
PHASE°RBD (5.15) 0.812 0.486 1.58 (1.07-2.34) 41(32-50)
Note: PHASE ° LBD: represent the phase angle of the left half of the body; PHASE ° RRG: represent the phase angle of the right leg; PHASE ° LLG: represent the phase angle of the left leg; PHASE ° RAM: represent the phase angle of the right arm; PHASE ° LAM: represent the phase angle of the left arm; PHASE ° WLG: represent the phase angle of both legs; PHASE ° RBD: represent the phase angle of the right half of the body. LR+: stands for positive likelihood ratio. The posterior probability is calculated based on the prevalence of frailty in women.
Disclaimer/Publisher’s Note: The statements, opinions and data contained in all publications are solely those of the individual author(s) and contributor(s) and not of MDPI and/or the editor(s). MDPI and/or the editor(s) disclaim responsibility for any injury to people or property resulting from any ideas, methods, instructions or products referred to in the content.
Copyright: This open access article is published under a Creative Commons CC BY 4.0 license, which permit the free download, distribution, and reuse, provided that the author and preprint are cited in any reuse.
Prerpints.org logo

Preprints.org is a free preprint server supported by MDPI in Basel, Switzerland.

Subscribe

Disclaimer

Terms of Use

Privacy Policy

Privacy Settings

© 2025 MDPI (Basel, Switzerland) unless otherwise stated