
Submitted:
26 September 2025
Posted:
29 September 2025
You are already at the latest version
Abstract
Background: Billing codes often underestimate the prevalence of intimate partner violence (IPV)- related injuries in Emergency Department (ED) visits, because they are not specific to IPV. Limited data exists on how EDs address IPV, especially the documentation of IPV incidents in patient records. Methods: We analyzed NEISS data from 2013–2024, identifying IPV cases through a systematic review of narrative text using a rule-based natural language processing approach. All cases involving detected IPV were included, whether the patient’s injury resulted from direct victimization or object-directed aggression. Survey weights generated national estimates, and logistic regression models assessed demographic predictors of head/neck injuries and hospital admissions. Results: From 2013–2024, an estimated 41,214 IPV-related ED visits occurred nationally (mean = 3,400; .025%). Fractures occurred in 12.2% (5,029) of incidents, commonly involving the upper extremities; head/neck fractures were less frequent but more severe. Males accounted for the majority of extremity injuries; females were disproportionately represented among head/neck fractures. Adults over the age of 45 had over fivefold higher odds of hospital admission compared to persons under 30. Alcohol involvement was associated with a 70% increase in the odds of head/neck injury, and differences were observed by patient sex. Narrative review indicated that females’ injuries frequently occurred in defensive or self-directed contexts, whereas males’ injuries more often reflected object-directed aggression and commonly co-occurred with alcohol use. Conclusion: Narrative-based surveillance of ED event descriptions captures IPV-related visits regardless of who was injured and can be used to inform ED screenings, safety planning, and targeted prevention.
Keywords:
intimate partner violence
; NEISS
; emergency department
; narrative data
; fractures
; alcohol use
1. Introduction
Intimate Partner Violence (IPV) that causes severe injury is a major public health issue with wide-ranging social, economic, and health impacts [1,2]. Emergency departments (EDs) play a central role in responding to IPV-related injuries, as they are often the primary point of contact for victims and provide 24-hour access to care [1,2]. National estimates suggest that although IPV accounts for less than 1% of all ED visits, comprising approximately 28,000 visits annually, the associated costs are disproportionate, exceeding $300 million [3,4]. However, screening for IPV occurs in only 30.3% of visits, with a detection rate of just 5.8% [5]. Even among repeat visits, IPV is identified in fewer than one-quarter of cases [2,5]. These gaps highlight how, despite the significant burden of IPV-related injuries, detection in EDs remains low due to inconsistent or inadequately implemented screening protocols.
Evidence on IPV in ED settings has primarily relied on billing records and International Classification of Diseases (ICD) codes [3,4,6]. While valuable for surveillance, this approach is limited because accurate coding requires both provider recognition of IPV and patient willingness to disclose that a partner caused the injury [2,5]. However, both victims and aggressors underreport victimization due to shame, fear, vulnerability, or concern about being misidentified as the aggressor [4,5,7]. Further complications arise from the underuse of external cause of injury codes (e-codes), which are not required for reimbursement and are therefore applied inconsistently [3,5]. In addition, broad coding categories such as “adult physical abuse” obscure the defining feature of IPV, the nature of the relationship, and fail to capture the mechanism or context of the injury [3]. Combined with prevailing stereotypes that depict males as perpetrators and females as victims [8], the full spectrum of IPV-related injury patterns in ED settings remains poorly understood [3,4].
To address gaps in extant research, we utilized narrative text fields from the National Electronic Injury Surveillance System (NEISS) [9], which provide brief, narrative descriptions of the circumstances surrounding each ED visit, including the mechanism, context, and contributing factors of injury. Unlike billing codes, narratives include contextual information about events, such as patient sex, age, mechanism of injury or action, product(s) involved, if any, and the outcome or diagnosis. Using a rule-based natural language processing (NLP) approach, we identified IPV cases not recorded in structured codes and extracted contextual features that clarify injury mechanisms. Combined with the structured data collected by the NEISS, we address three questions: (1) What are the national estimates of ED visits for IPV-related injuries and related fractures between 2013 and 2024? (2) How do demographic and clinical factors influence injury type and subsequent ED admissions? and (3) What insights do narrative features provide about injury mechanisms and contexts? By focusing on narrative data, this study provides national estimates of IPV-related injuries and describes the circumstances surrounding them.
2. Methods
2.1. Study Design & Setting
We conducted a retrospective, longitudinal study of U.S. ED visits recorded in the NEISS from 2013–2024.
2.2. Participants/Data Source
The NEISS [9] samples approximately 100 hospitals by size, type, and region to represent more than 5,000 EDs nationally. Each record carries a survey weight for national estimation and includes demographics, diagnosis, injured body part, disposition, location, products, and a description of the incident.
We used a rule-based NLP approach applied to the text for IPV case ascertainment (Figure 1). First, we screened for domestic-conflict terms (e.g., “domestic,” “argument,” “fight,” “assault”) using case-insensitive regular expressions. Within that subset, we flagged intimate-partner terms (e.g., “partner,” “boyfriend,” “girlfriend,” “spouse,” “husband,” “wife,” “fiancé/fiancée”). Exclusion rules removed narratives clearly unrelated to IPV (e.g., martial arts, animal bites, play fighting) or accidental self-injury. This yielded three mutually exclusive groups: IPV, non-IPV domestic violence, and non-DV. The co-authors audited random samples from IPV and non-IPV sets across iterative refinements; any disagreements were adjudicated, and the rules were updated accordingly.
2.3. Variables
Sex at birth was recorded in NEISS as a binary variable with the categories "male" and "female". Because the NEISS database does not collect information on gender identity, all analyses are restricted to sex, and gender is not considered in this study. Age was categorized into four groups to capture meaningful life-course differences: 18–29 years, 30–44 years, 45–64 years, and ≥65 years. Race and ethnicity were recoded into four mutually exclusive categories: non-Hispanic White, non-Hispanic Black, Hispanic, and Other/Unknown.
Head/neck injuries were identified using NEISS body-part codes, including 75 (head), 76 (face), 77 (eye), 79 (mouth), 80 (ear), and 81 (neck). Fractures were defined as cases with a primary diagnosis of fracture. Head/neck fractures required the presence of both a fracture diagnosis and one of the head/neck body-part codes listed above. Alcohol involvement was coded as present if the injury narrative contained the terms “alcohol,” “ETOH,” “intox,” or “drunk” (case-insensitive), or if a structured indicator for alcohol was positive. Disposition was dichotomized into admission (treated and admitted or transferred) versus non-admission (treated and released). Cases with other or unknown dispositions were excluded from admission models, as were records with sex coded as “unknown.”
2.4. Statistical Analysis
We first reported unweighted sample counts and percentages. For national estimates and inferential analyses, we accounted for the NEISS complex survey design using Taylor linearization, incorporating sampling weights, stratification, and Primary Sampling Units (PSUs). We calculated survey-weighted proportions and fitted survey-weighted logistic regression models to identify predictors of two binary outcomes: (1) head/neck injury and (2) hospital admission.
Models included covariates for age group, sex, race/ethnicity, survey year, and alcohol involvement. The admissions regression also included injury type (head/neck versus other). Analyses were based on complete cases for each model. To characterize narrative content, we applied natural language processing techniques to the NEISS narrative text. Narratives were thoroughly cleaned, tokenized into unigrams, and common stop words and non-informative tokens were removed. We then computed survey-weighted term frequencies and visualized the most prevalent terms overall, as well as stratified by sex and injury context.
2.5. Ethics
3. Results
Trends. Figure 2 illustrates national estimates of IPV-related ED visits identified through NEISS narratives from 2013 to 2024. Estimates increased from 2,634 visits in 2013 to 5,708 visits in 2024, representing a more than doubling of visits over the study period. The lowest point was in 2014 with 2,176 visits, followed by steady growth through 2019. After a slight decline in 2020, the numbers rebounded, peaking in 2021 and again in 2024.
Demographic and clinical characteristics. Table 1 displays characteristics by sex. Weighted national estimates indicate a relatively even distribution, with males comprising a slight majority. About one in five visits (20.8%) involved a head/neck injury. Females were more likely than males to sustain a head/neck injury (23.8% vs. 18.5%). Nearly 60% of injuries happened at home. Most patients were treated and released (83.3%), while smaller percentages were transferred to another hospital (2.8%), another facility (8.9%), admitted (2.4%), or observed (2.4%), with less than 1% leaving without being seen. Non-Hispanic Whites comprised the largest share of patients (65.1%), followed by non-Hispanic Black (18.2%) and Hispanic (11.5%). The median age was 30 years (interquartile range [IQR]: 24–42). No significant differences were observed across the demographic and clinical characteristics.
Age and Sex Distribution. Figure 3 displays the prevalence of injuries by age and sex. Adults aged 20–29 had the highest rates, with 37.2% of females and 42.9% of males experiencing injuries, followed by persons aged 30–39 (24.6% of females and 22.7% of males). The prevalence of injuries decreased with age, reaching its lowest point among adults aged 60–69, at 3.7% of females and 4.2% of males. Among individuals over 70, females had a higher rate of injuries (8.1% vs. 5.5%). Males aged 20–29 had significantly higher rates of injuries than females (p < 0.05).
Fractures. Approximately 5,029 IPV-related ED visits involved fractures (Table 2). The overwhelming majority of these were located in the upper extremities (92.8%), with hand and finger bones accounting for nearly all cases in this region (Table 3). Fractures of the head/neck were less frequent (5.3%), while lower extremity fractures were rare (1.8%). Males accounted for 71.6% of all fracture-related visits and comprised the majority of upper extremity fractures (75.4%). In contrast, females represented the majority of head/neck fractures (78.3%) and lower extremity fractures (78.8%). Age patterns also varied, with patients sustaining head/neck fractures being the oldest on average (48.6 years), those with upper extremity fractures aligning closely with the overall mean (34.1 years vs. 34.7 years overall), and those with lower extremity fractures being the youngest (24.2 years). A notable subset of 783 fractures could not be assigned to a specific body region and were categorized as unknown (Table 3).
Predictors of Head and Neck Injury. In the logistic regression (Table 4, top), alcohol involvement was a significant predictor of head/neck injury, nearly doubling the odds (OR = 1.81; 95% CI: 1.10–2.96; p = 0.020). Age was also associated with elevated risk: individuals aged 65 years and older had almost three times the odds of sustaining a head/neck injury compared with those aged 18–29 (OR = 2.80; 95% CI: 1.56–5.02; p < 0.001). Each year was associated with an 11% increase in the odds of head/neck injury (OR = 1.11; 95% CI: 1.05–1.17; p < 0.001). Sex, race/ethnicity, and location were not statistically significant predictors. Effect moderation for alcohol showed that when alcohol was involved in the incident, the likelihood of injury nearly doubled for males (0.39) while it did not increase the probability of a head/neck injury for females (Figure 4).
Predictors of admission. In the admission model (Table 4, bottom), age was the strongest and most consistent predictor of hospitalization. Compared with patients aged 18–29, those aged 45–64 had more than twice the odds of admission (OR = 2.64; 95% CI: 1.40–4.95; p = 0.003), and patients aged 65 years and older had more than fifteen times the odds (OR = 15.11; 95% CI: 6.94–32.92; p < 0.001). Alcohol involvement was also a significant predictor, associated with more than a twofold increase in odds of admission (OR = 2.33; 95% CI: 1.29–4.21; p = 0.005). Sex, race/ethnicity, location, and year were not significant predictors in the multivariable model, and no interactions achieved statistical significance.
Narrative language patterns. Figure 5 shows the most distinctive words by sex after text cleaning. Among females, the strongest terms were “boyfriend” and “husband,” which also served as the foundation for our regular expression (regex) rules. Other frequent words included context terms (“vehicle,” “driving,” “running”) and mechanism terms (“pull,” “grab,” “amputation”). Words like “dogs,” “scissors,” and “intentionally” reflected varied circumstances. Among males, the strongest terms were “wife” and “girlfriend.” Substance and object terms (“shots,” “beers,” “whiskey,” “pills,” “cup”), household items (“television,” “dresser,” “carpeted,” “telephone”), and actions like “punched” appeared more often.
To contextualize the quantitative results, we reviewed full narratives containing these terms. Female narratives often described direct assaults or defensive actions (e.g., cutting with scissors, running from a partner, being cut while a husband pulled a knife). Male narratives more often described object-directed aggression or substance-related incidents (e.g., punching a wall, smashing a television after drinking, cutting a hand while breaking a cup) with a corresponding upper extremity injury (e.g., to the hand or finger). Table 5 provides representative examples.
4. Discussion
IPV-related ED visits accounted for approximately 0.025% of all ED visits nationally between 2013 and 2024 (41,214 cases, averaging about 3,400 annually). This estimate is consistent with Davidov et al.’s earlier finding of approximately 0.02% of ED visits involving IPV from 2006–2009, despite differences in data sources and case definitions (NEISS narratives vs. billing e-codes) [3]. Davidov and colleagues relied on the ICD-9 external-cause code E967.3 (“battering by spouse or partner”), which provides high specificity but undercounts cases when the perpetrator’s relationship is not recorded, similar to the present analysis. By contrast, studies using broader coding definitions identify far more IPV-related visits, often 80,000–120,000 per year, yielding higher prevalence estimates. However, these studies capture suspected abuse more generally, and often include cases of non-partner violence, older adult abuse, or child maltreatment. As noted by Rebbe et al. [14], commonly applied categories such as “adult physical abuse” or “unspecified adult maltreatment” frequently lack perpetrator identification, while codes that do specify perpetrator relationship are rarely used, and vary substantially across studies.
On average, patients seeking ED care following IPV were approximately 35 years old. Older adults represented a smaller proportion of visits but tended to present with more serious injuries [3,4]. Black patients and individuals from lower-income communities were disproportionately represented [3,5,6]. Most IPV-related visits in this study involved male patients, which contrasts with prior studies reporting that the vast majority of IPV cases involve women, with prevalence estimates ranging from 82.8–93%. Our findings align more closely with studies that included representative male samples, which reported higher levels of male involvement, ranging from 6.7% to 17.2% [3,4]. Greater male representation in IPV-related ED narratives likely reflects two factors. Whereas males are less likely to disclose an IPV-related injury compared to females due to the stigma [15], many male-coded cases suggest that either they are harming themselves during an argument or they are actually the perpetrators rather than victims of IPV, which is likely not coded as IPV victimization. Taken together, these findings highlight the complexity of how IPV is defined, recorded and classified in surveillance systems.
Roughly one in five IPV-coded ED visits involved head/neck trauma, which was more common among females, contrary to findings from one of the few prior studies on this topic [15]. Most injuries occurred at home, and most ED visits ended in discharge. Slightly more than one in ten visits involved a fracture, most often affecting the upper extremities, particularly the hands and fingers. Females were more likely to present with head/neck fractures, while males more often presented with upper extremity fractures. This pattern aligns with previous research indicating that male patients sustain more injuries to the upper extremities, fewer contusions and abrasions, and are significantly less likely to present with a head/neck injury [15]. Based on such findings, Khurana et al. (2022) suggest that lacerations, rather than contusions, may be a potential marker for IPV in males. Their study, however, lacked information on the severity or mechanism of injury, the directionality of IPV (victimization vs. perpetration), and whether events were isolated or recurrent.
Our study addressed this gap by analyzing ED visit narratives, which offered additional context not captured by billing codes. We observed a notable sex-based pattern in the narratives: females often described defensive actions, such as running from a partner, or emotionally reactive behaviors, like self-inflicted harm to gain attention. Conversely, male narratives more frequently involved object-directed aggression, such as punching walls or kicking furniture. These accounts suggest that many male IPV-related ED visits may reflect perpetrator-related injuries rather than victimization, a distinction that billing codes fail to capture. Though preliminary, the pattern we identified is important because target injuries, such as those to the face and neck, often come from blunt trauma or strangulation, while defensive injuries are more likely to affect any extremity [16]. Furthermore, defensive injuries are linked to a defensive stance similar to what happens during an assault, but little is known about defensive injuries in males. Additionally, evidence suggests that defensive injuries are not thoroughly analyzed by professionals. For example, males who present to the police with defensive injuries often fail to fully assess the situation and default to issuing a Family Violence Intervention Order (FVIO) against the female [17].
Logistic regression models identified age, alcohol use, and year of visit as significant predictors of craniofacial injury. Older patients were more likely to sustain a head/neck injury compared with those who are younger, and the probability of detecting a head/neck injury in an IPV-related incident increased over the study period. Alcohol involvement also increased the likelihood of head/neck injury, and the effect was particularly strong among males. For admission, older age was the strongest predictor of hospital admission. Alcohol involvement also significantly increased admission risk, more than doubling the odds of hospitalization. By contrast, sex, race/ethnicity, location, year, and head/neck designation were not significant after adjustment, and no interactions were found to be significant.
Limitations
This study has several limitations. Our analysis of text narratives was descriptive, and NEISS data do not capture IPV-related incidents that never result in an ED visit. Even among cases that reach the ED, narrative content is subject to site- and coder-level variation despite narrative standardization. Like Davidov et al., our study employed a narrow definition of IPV, focusing only on cases identified incidents involving an intimate partner, excluding other types of abuse involving children or older adults, as well as violence between non-partners. To improve accuracy, we analyzed the narrative text from each case using a regular expression (regex) pipeline that identified only intentional injuries caused by a partner. Whereas this approach reduces false positives, it does not identify incidents where the relationship is not documented. Nevertheless, our approach enabled us to distinguish between aggressive and reactive behavior, as well as other key details, including the reason for the visit, the specific type of injury, and whether alcohol or drugs were involved.
Results related to race/ethnicity should be interpreted with caution because these fields are incomplete prior to 2019. A notable proportion of fracture cases could not be assigned due to missingness. Finally, our study focused on injury patterns from a public health perspective and did not classify cases by victimization or perpetration, which precludes comparisons with other studies.
Conclusions
IPV-related ED visits are rare as a proportion of all ED encounters but carry a substantial burden of injury, including head/neck trauma that disproportionately affects females. Age and alcohol substantially change the risk of serious injury. Future research should aim to replicate our findings across various contexts.
5. CRediT Author Statement
Conceptualization: [GEBS, AWG] Methodology: [GEBS] Software: [GEBS] Validation: [GEBS] Formal analysis: [GEBS] Investigation: [GEBS] Resources: [GEBS] Data curation: [GEBS] Writing – original draft: [GEBS, AWG, TRH, KSM] Writing – review & editing: [ GEBS, AWG, TRH, KSM] Visualization: [GEBS] Supervision: [GEBS, KSM] Project administration: [GEBS, KSM]
Acknowledgments
The authors would like to thank members of the ISSUES lab for their thoughtful input and feedback.
Data Availability
All data are publicly available from the National Electronic Injury Surveillance System (NEISS), which is maintained by the U.S. Consumer Product Safety Commission (CPSC). The data are available for download at https://www.cpsc.gov/Research--Statistics/NEISS-Injury-Data. Access requires acceptance of CPSC’s data use agreement. Due to federal policy, we cannot redistribute individual-level records; researchers can obtain the narratives directly from the CPSC portal.
Declaration of Competing Interests
All authors declare no competing interests.
Declaration of Generative AI and AI-Assisted Technologies in the Writing Process
No generative AI or AI-assisted technologies were used in the writing process.
References
- Bazargan-Hejazi S, Kim E, Lin J, Ahmadi A, Khamesi MT, Teruya S. Risk factors associated with different types of intimate partner violence (IPV): an emergency department study. J Emerg Med. Elsevier; 2014;47:710–20.
- Ahmad I, Ali PA, Rehman S, Talpur A, Dhingra K. Intimate partner violence screening in emergency department: a rapid review of the literature. J Clin Nurs. 2017;26:3271–85. [CrossRef]
- Davidov DM, Larrabee H, Davis SM. United States Emergency Department Visits Coded for Intimate Partner Violence. J Emerg Med. 2015;48:94–100. [CrossRef]
- Khurana B, Hines DA, Johnson BA, Bates EA, Graham-Kevan N, Loder RT. Injury patterns and associated demographics of intimate partner violence in men presenting to U.S. emergency departments. Aggress Behav. 2022;48:298–308. [CrossRef]
- Kothari CL, Rhodes KV. Missed opportunities: emergency department visits by police-identified victims of intimate partner violence. Ann Emerg Med. Elsevier; 2006;47:190–9.
- Loder RT, Momper L. Demographics and fracture patterns of patients presenting to US emergency departments for intimate partner violence. JAAOS Glob Res Rev. LWW; 2020;4:e20.
- Khurana B, Prakash J, Loder RT. Holiday effect on injuries sustained by assault victims seen in US emergency departments. Emerg Radiol. 2022;30:133–42. [CrossRef]
- Bates EA, Kaye LK, Pennington CR, Hamlin I. What about the Male Victims? Exploring the Impact of Gender Stereotyping on Implicit Attitudes and Behavioural Intentions Associated with Intimate Partner Violence. Sex Roles. 2019;81:1–15. [CrossRef]
- U.S. Consumer Product Safety Commission. National electronic injury surveillance system (NEISS) [Internet]. U.S. Consumer Product Safety Commission; 2025 [cited 2025 Sept 25]. https://www.cpsc.gov/cgibin/NEISSQuery/home.aspx. Accessed 25 Sept 2025.
- R Core Team. R: a language and environment for statistical computing [Internet]. Vienna, Austria: R Foundation for Statistical Computing; 2023. https://www.R-project.org/.
- Lumley T. survey: analysis of complex survey samples. 2023.
- Wickham H, Averick M, Bryan J, Chang W, McGowan LD, François R, et al. Welcome to the tidyverse. J Open Source Softw. 2019;4:1686. [CrossRef]
- Wickham H. stringr: Simple, consistent wrappers for common string operations [Internet]. 2023. https://CRAN.R-project.org/package=stringr.
- Rebbe R, Adhia A, Eastman AL, Chen M, Winn J. The Measurement of Intimate Partner Violence Using International Classification of Diseases Diagnostic Codes: A Systematic Review. Trauma Violence Abuse. 2023;24:2165–80. [CrossRef]
- Khurana B, Hines DA, Johnson BA, Bates EA, Graham-Kevan PhD N, Loder RT. Injury patterns and associated demographics of intimate partner violence in men presenting to U.S. emergency departments. Aggress Behav. 2022;48:298–308. [CrossRef]
- Tang A, Wong A, Khurana B. Imaging of Intimate Partner Violence, From the AJR Special Series on Emergency Radiology. Am J Roentgenol. 2023;220:476–85. [CrossRef]
- Reeves E. Family violence, protection orders and systems abuse: views of legal practitioners. Curr Issues Crim Justice. 2020;32:91–110. [CrossRef]
Figure 1.
Case selection flow diagram for IPV-related ED visits (NEISS, 2013–2024). This figure depicts the process of deriving the analytic sample from the full National Electronic Injury Surveillance System (NEISS) dataset. Between 2013–2024, NEISS captured 4,259,120 emergency department visits. Of these, 99.5% (n = 4,238,433) were not domestic violence (DV)-related, while 0.5% (n = 20,687) contained evidence of DV in the narrative text. Among DV-related cases, 94.9% (n = 19,624) were classified as non-intimate partner violence (non-IPV) incidents, such as altercations involving family members, housemates, or other non-partner conflicts. The remaining 5.1% (n = 1,063) were identified as intimate partner violence (IPV)-related ED visits, constituting the final analytic sample for this study.
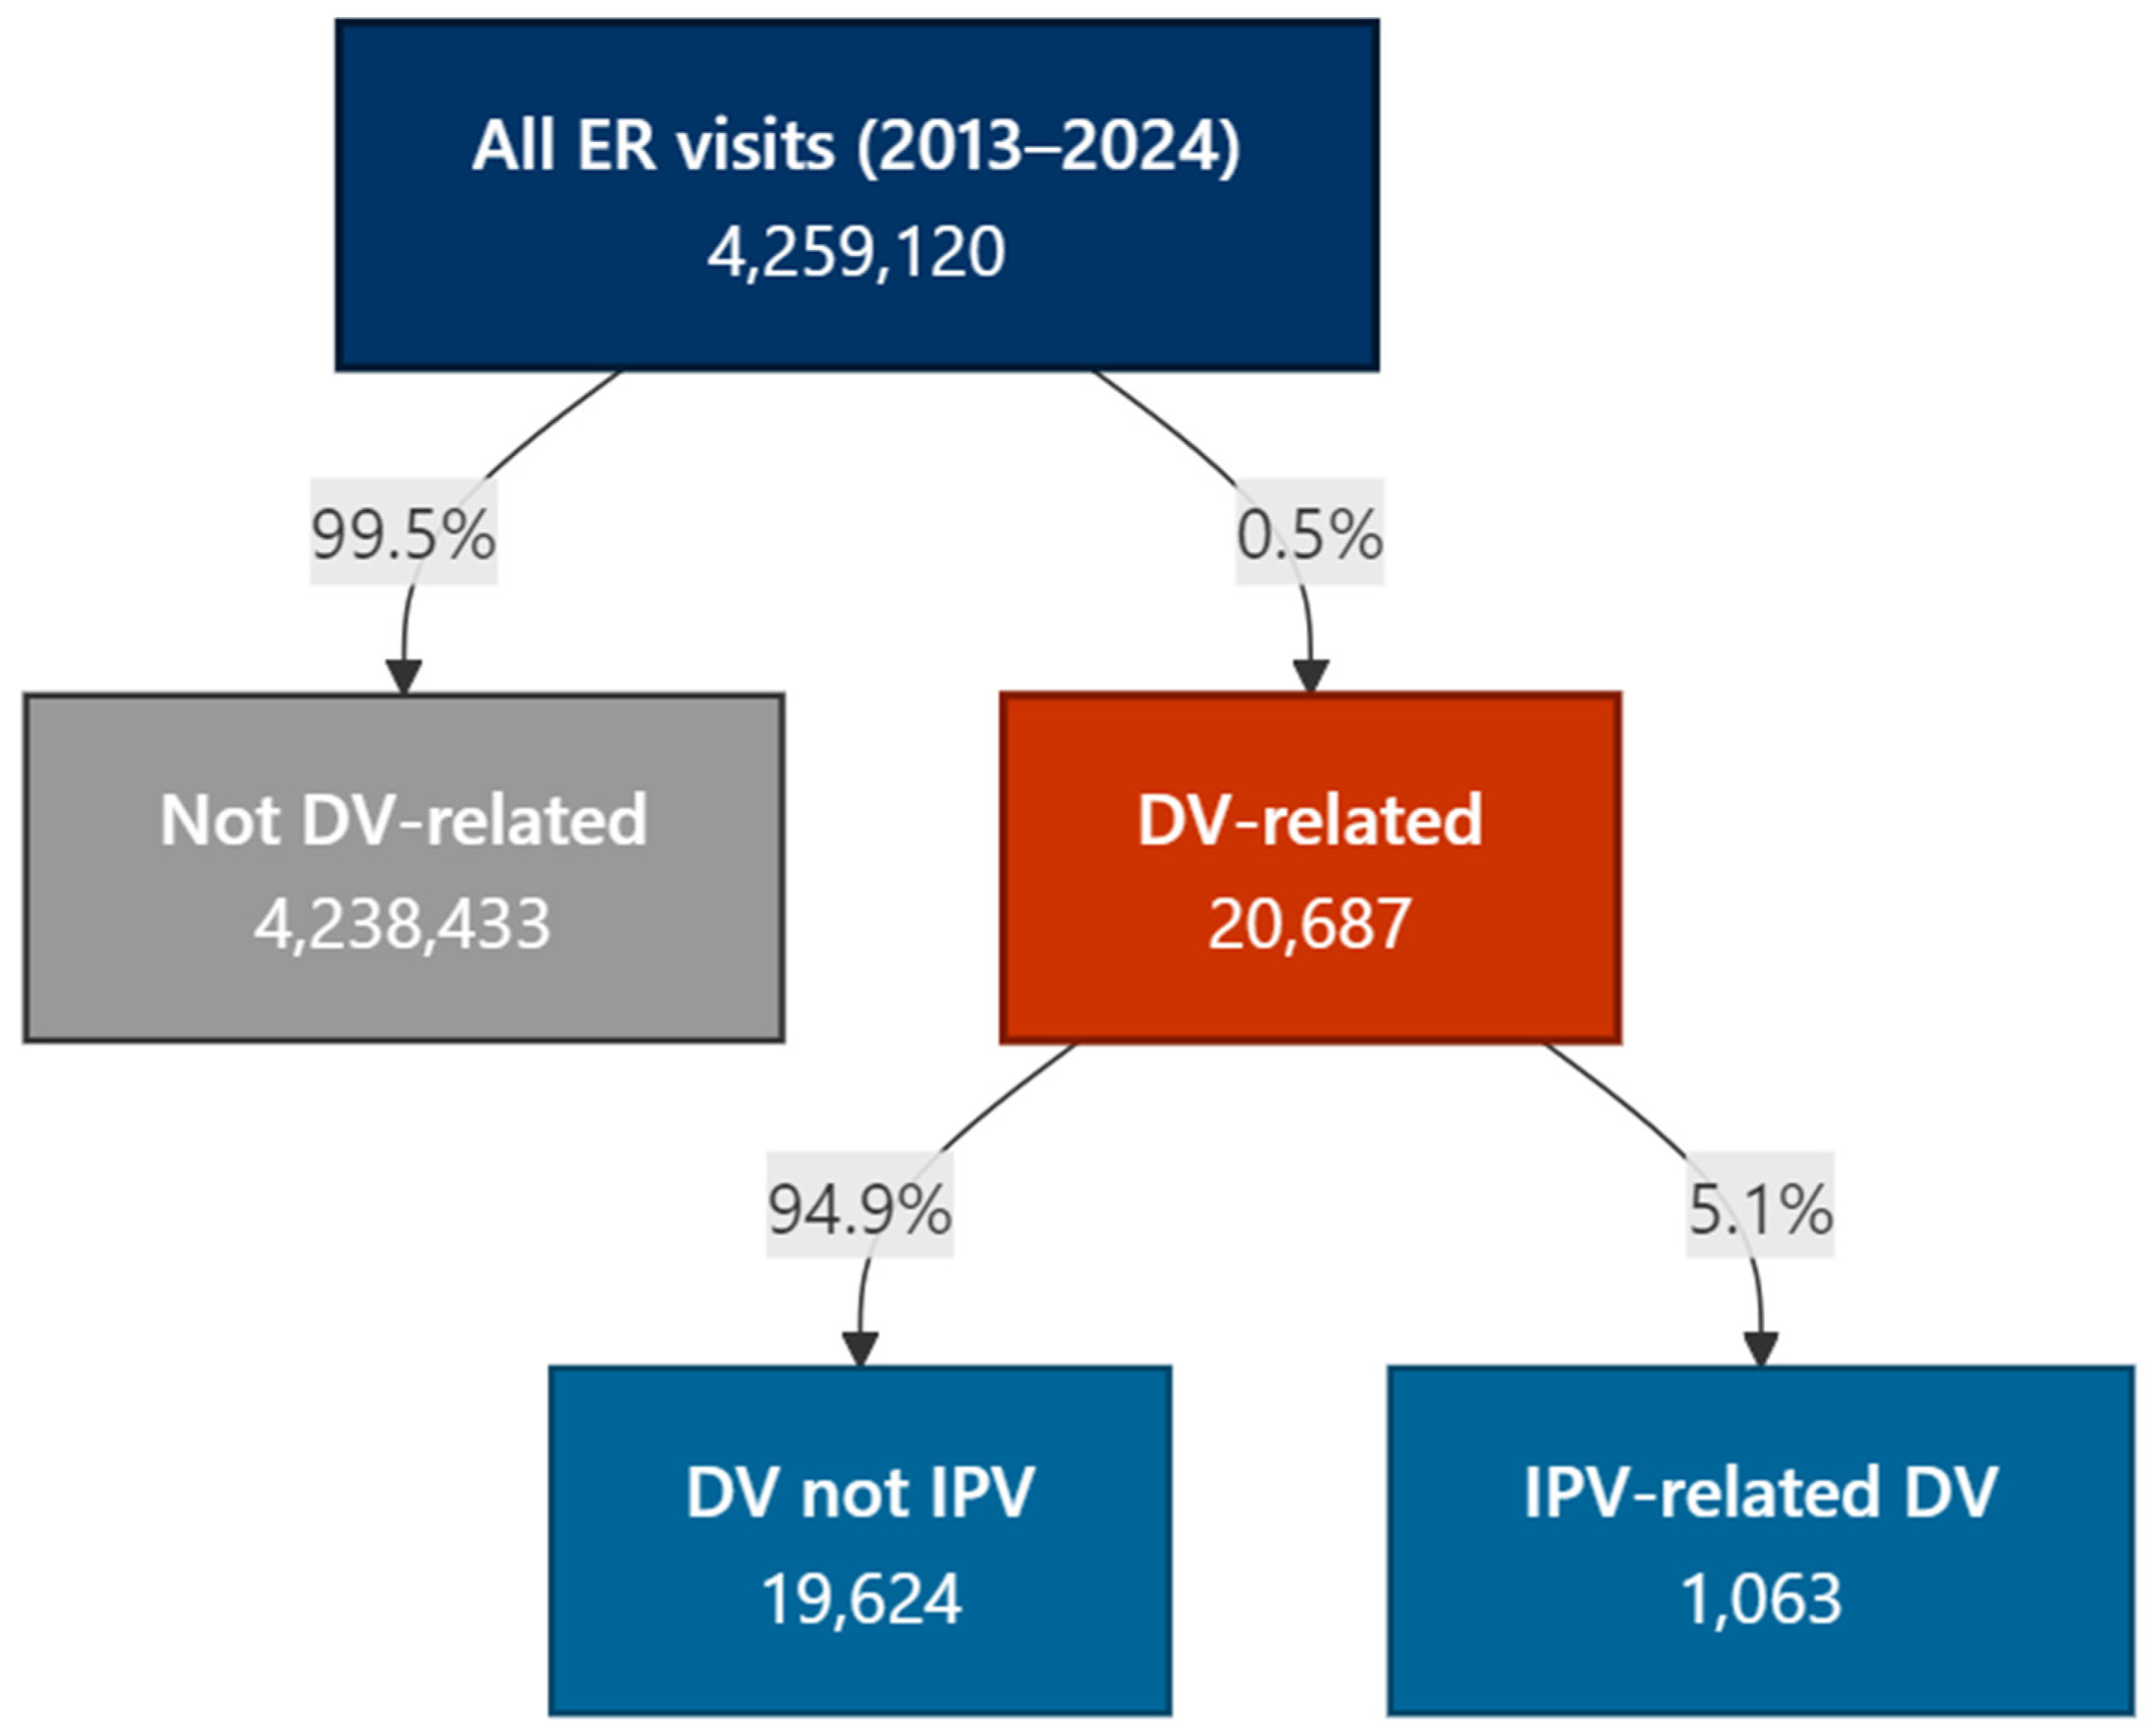
Figure 2.
National Trends in Emergency Department Visits for Intimate Partner Violence (IPV) Injuries, NEISS 2013–2024.
Figure 2.
National Trends in Emergency Department Visits for Intimate Partner Violence (IPV) Injuries, NEISS 2013–2024.
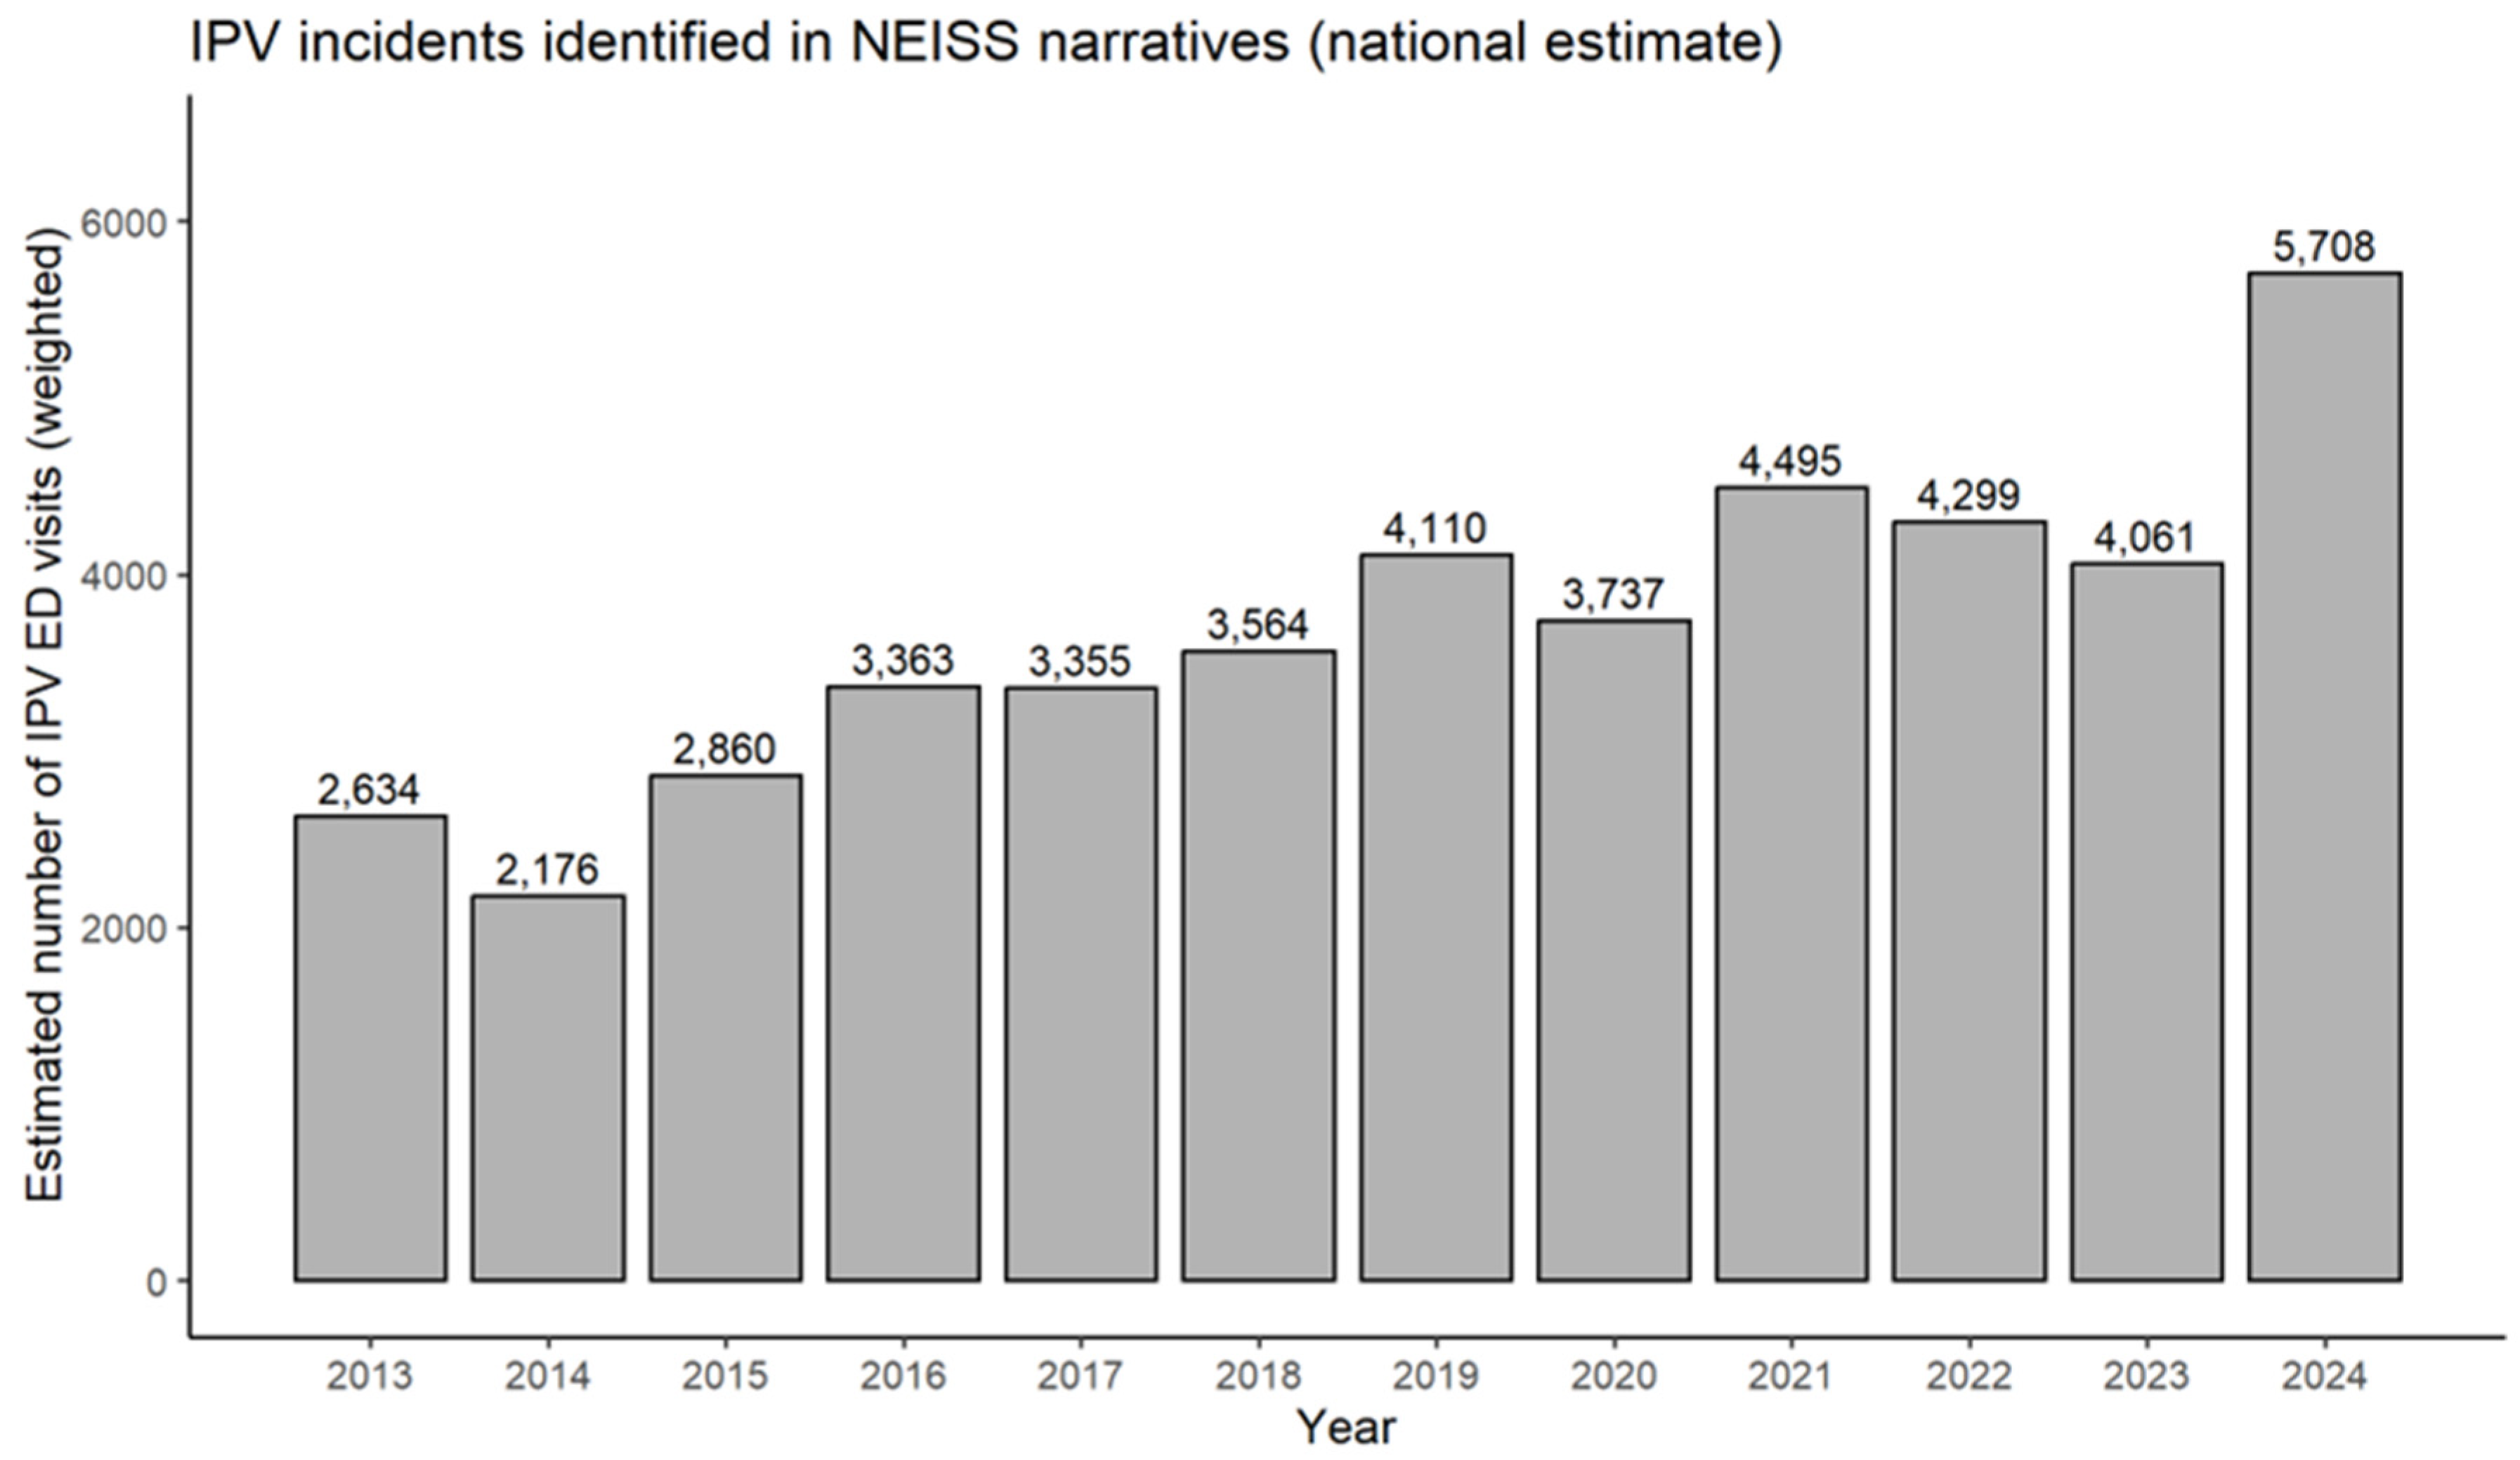
Figure 3.
Prevalence of Intimate Partner Violence (IPV)-Coded Emergency Department Visits by Age Group and Sex, NEISS 2013–2024.
Figure 3.
Prevalence of Intimate Partner Violence (IPV)-Coded Emergency Department Visits by Age Group and Sex, NEISS 2013–2024.
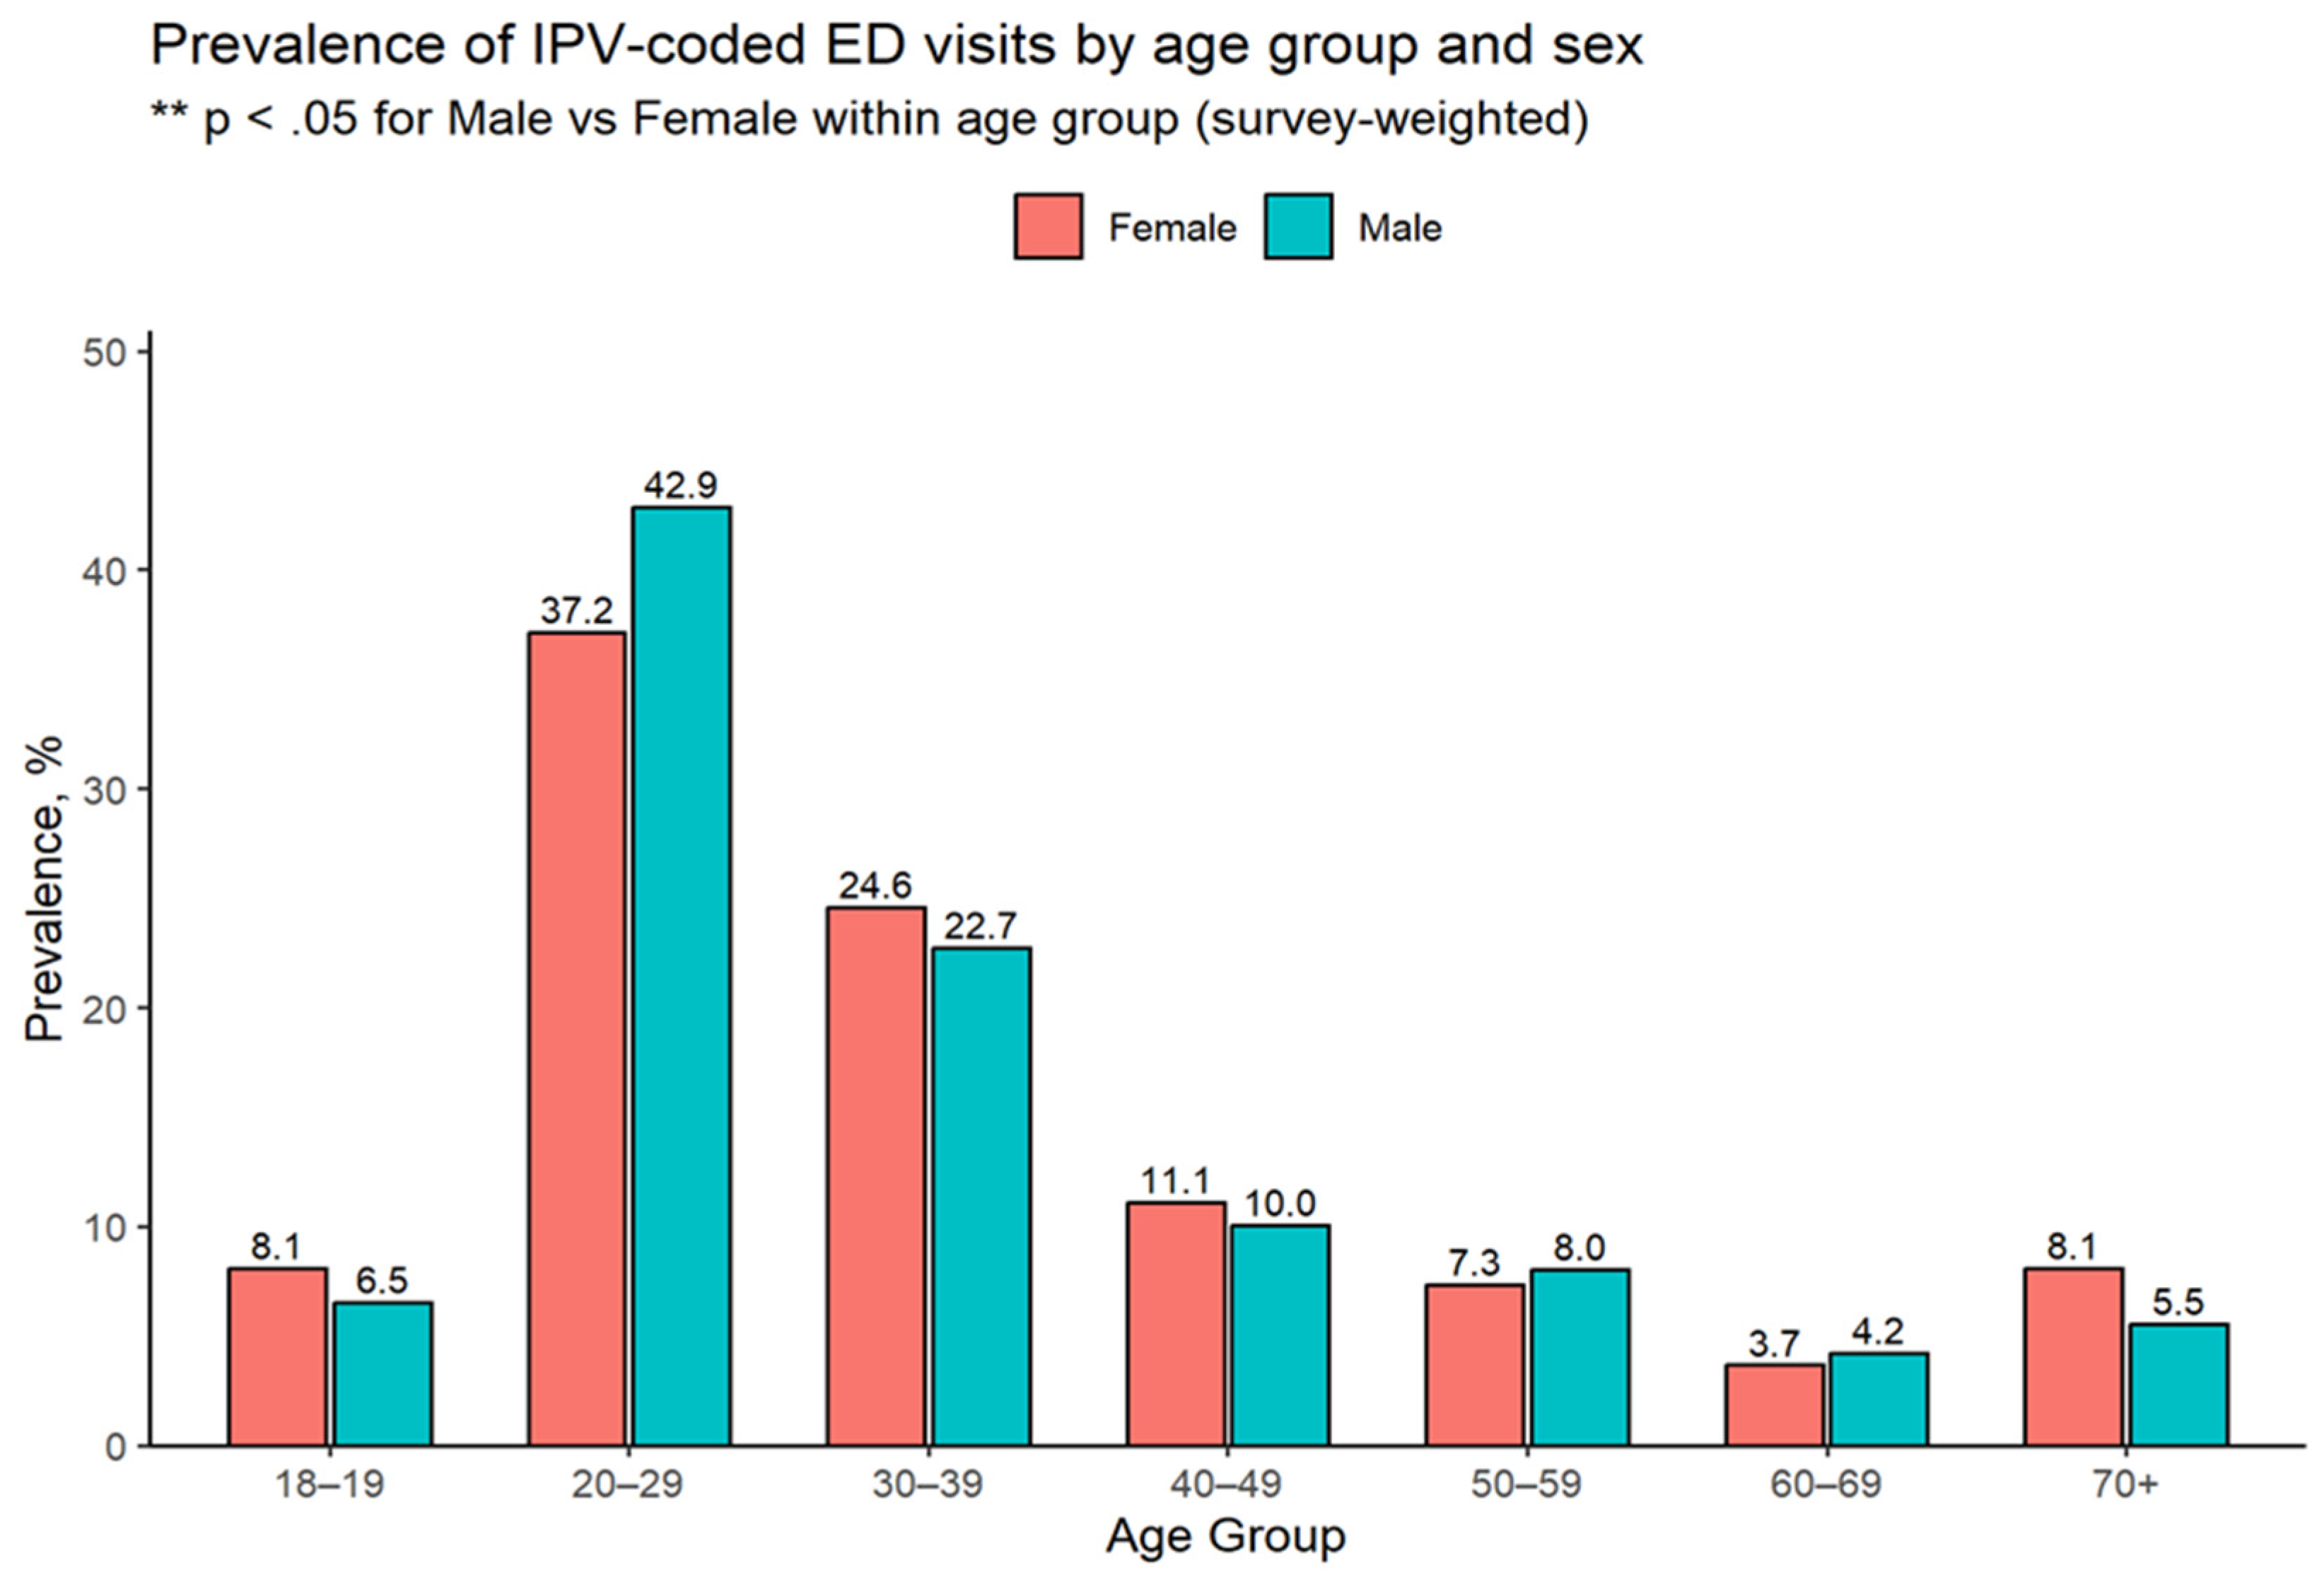
Figure 4.
Effect moderation of alcohol use by sex on the likelihood of an ER visit due to an injury to the head or neck.
Figure 4.
Effect moderation of alcohol use by sex on the likelihood of an ER visit due to an injury to the head or neck.
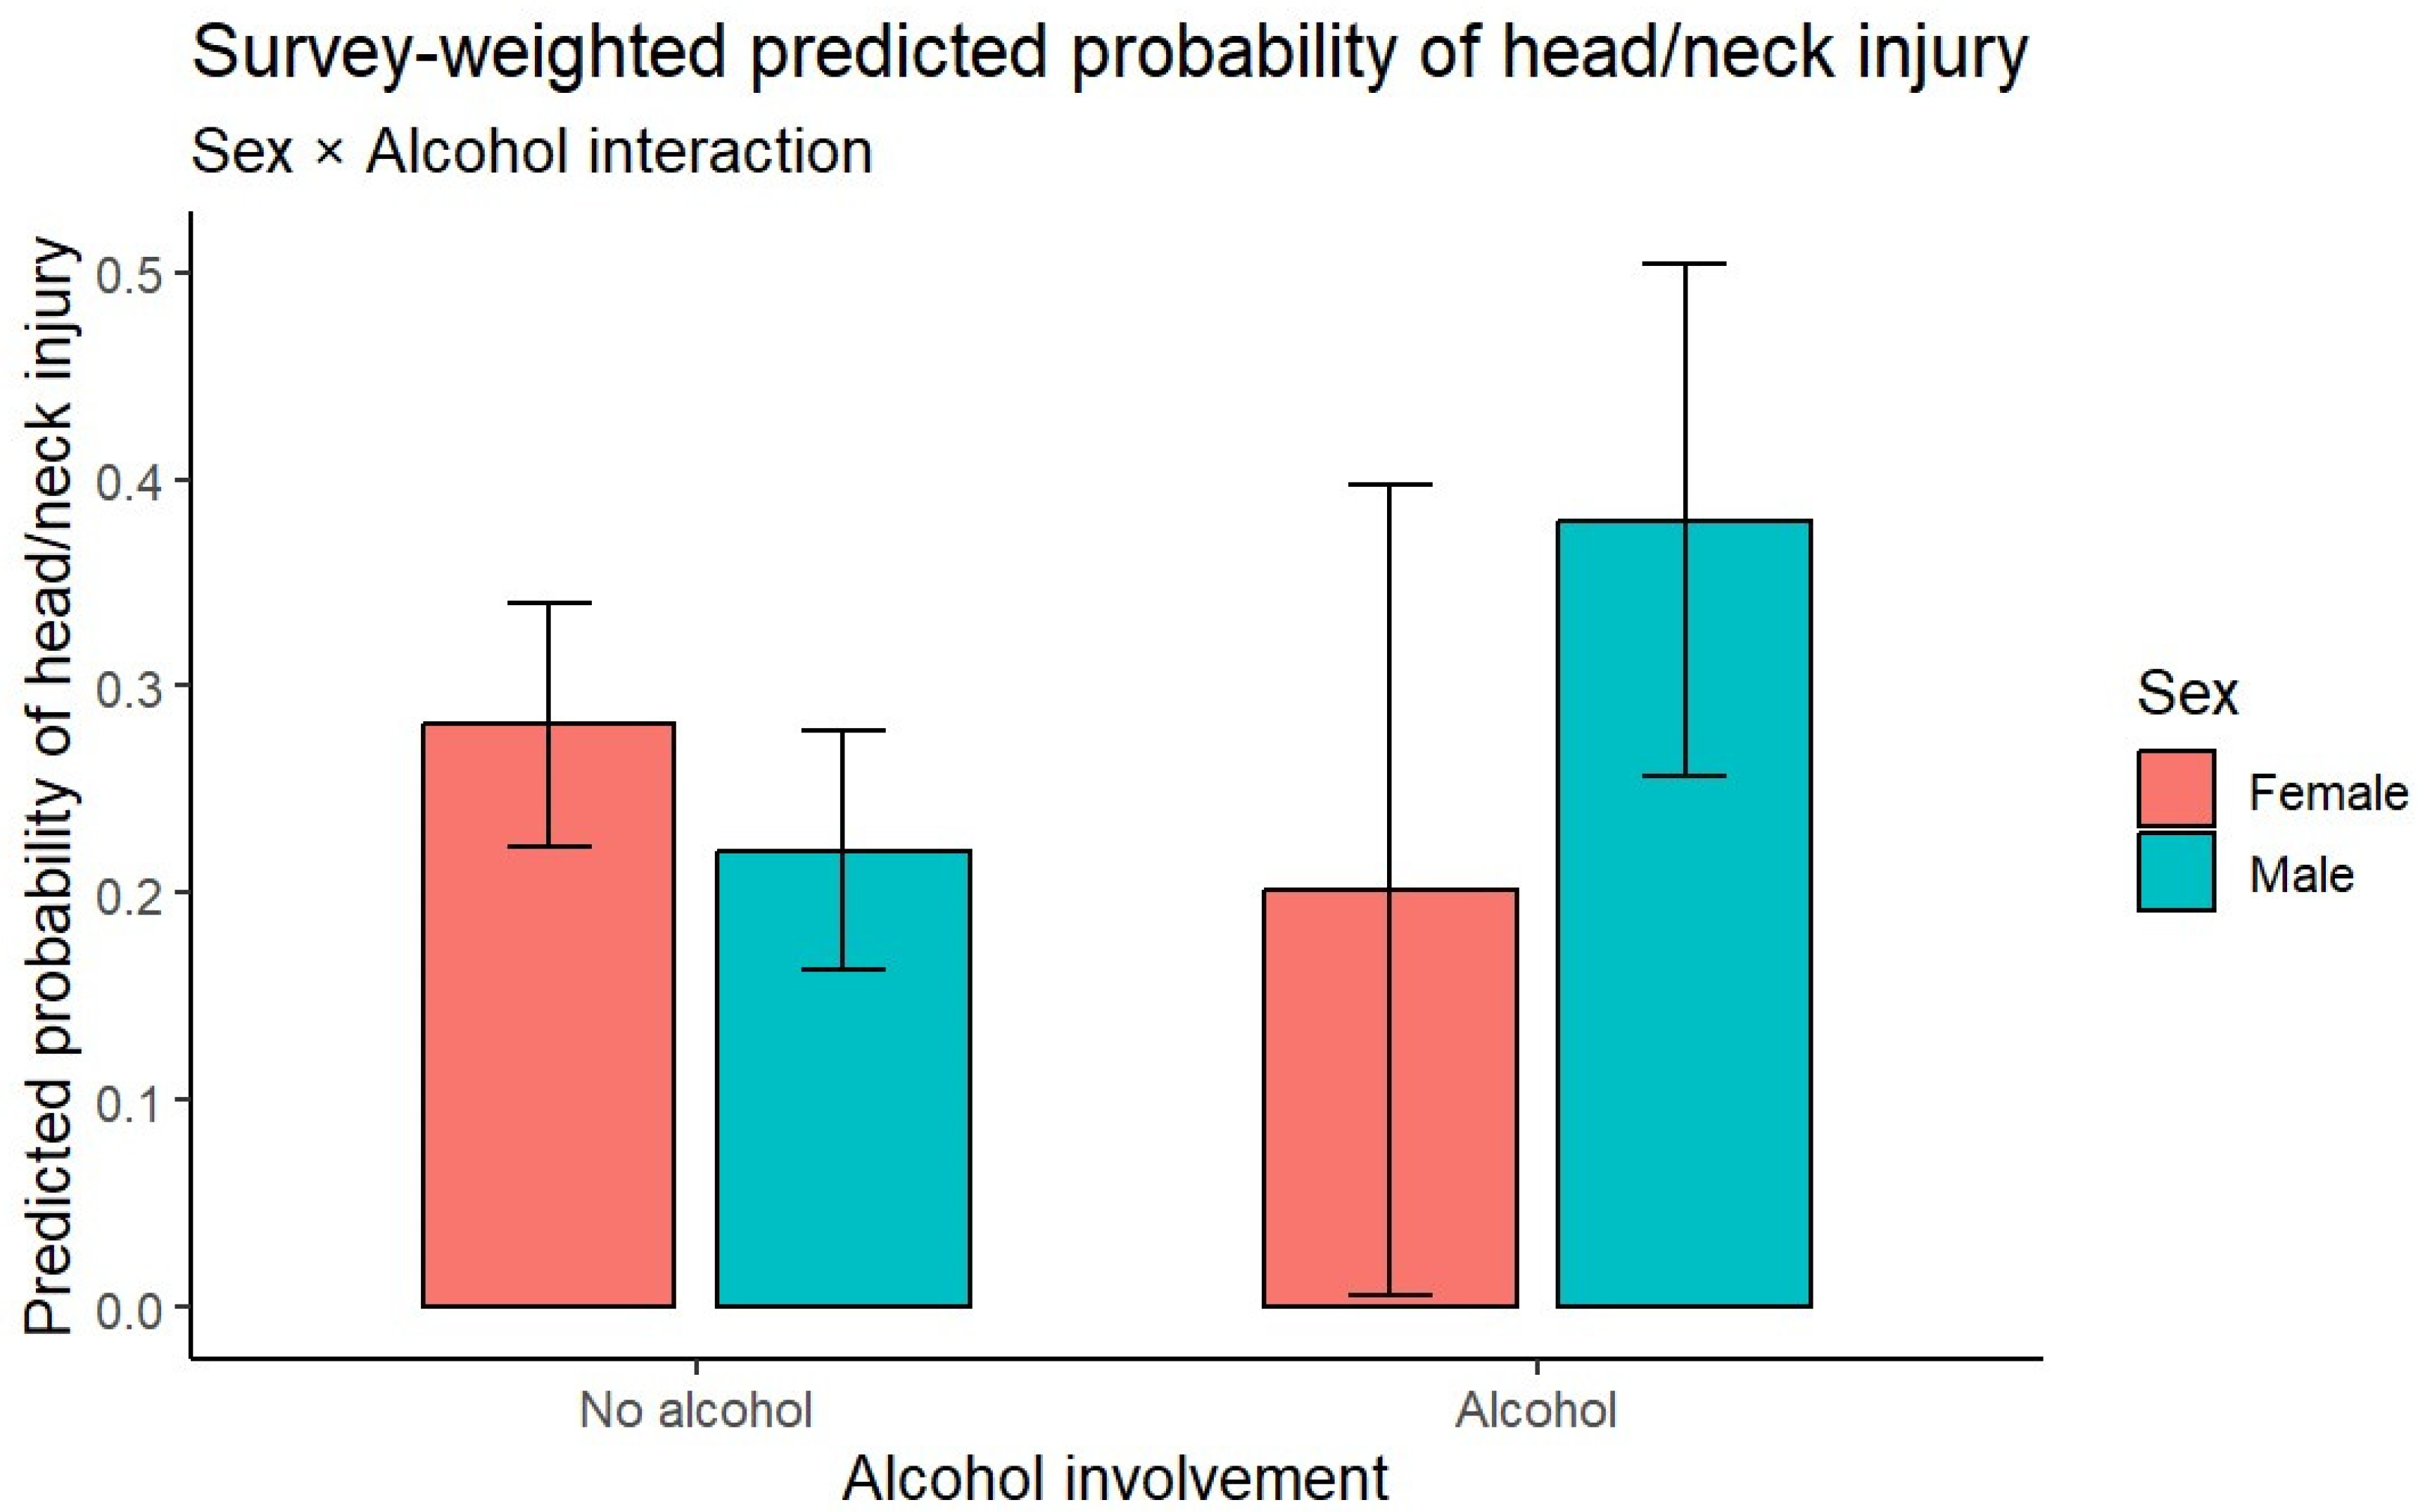
Figure 5.
Distinctive (i.e., non-overlapping) Words in IPV Narratives by Sex, NEISS 2013–2024.
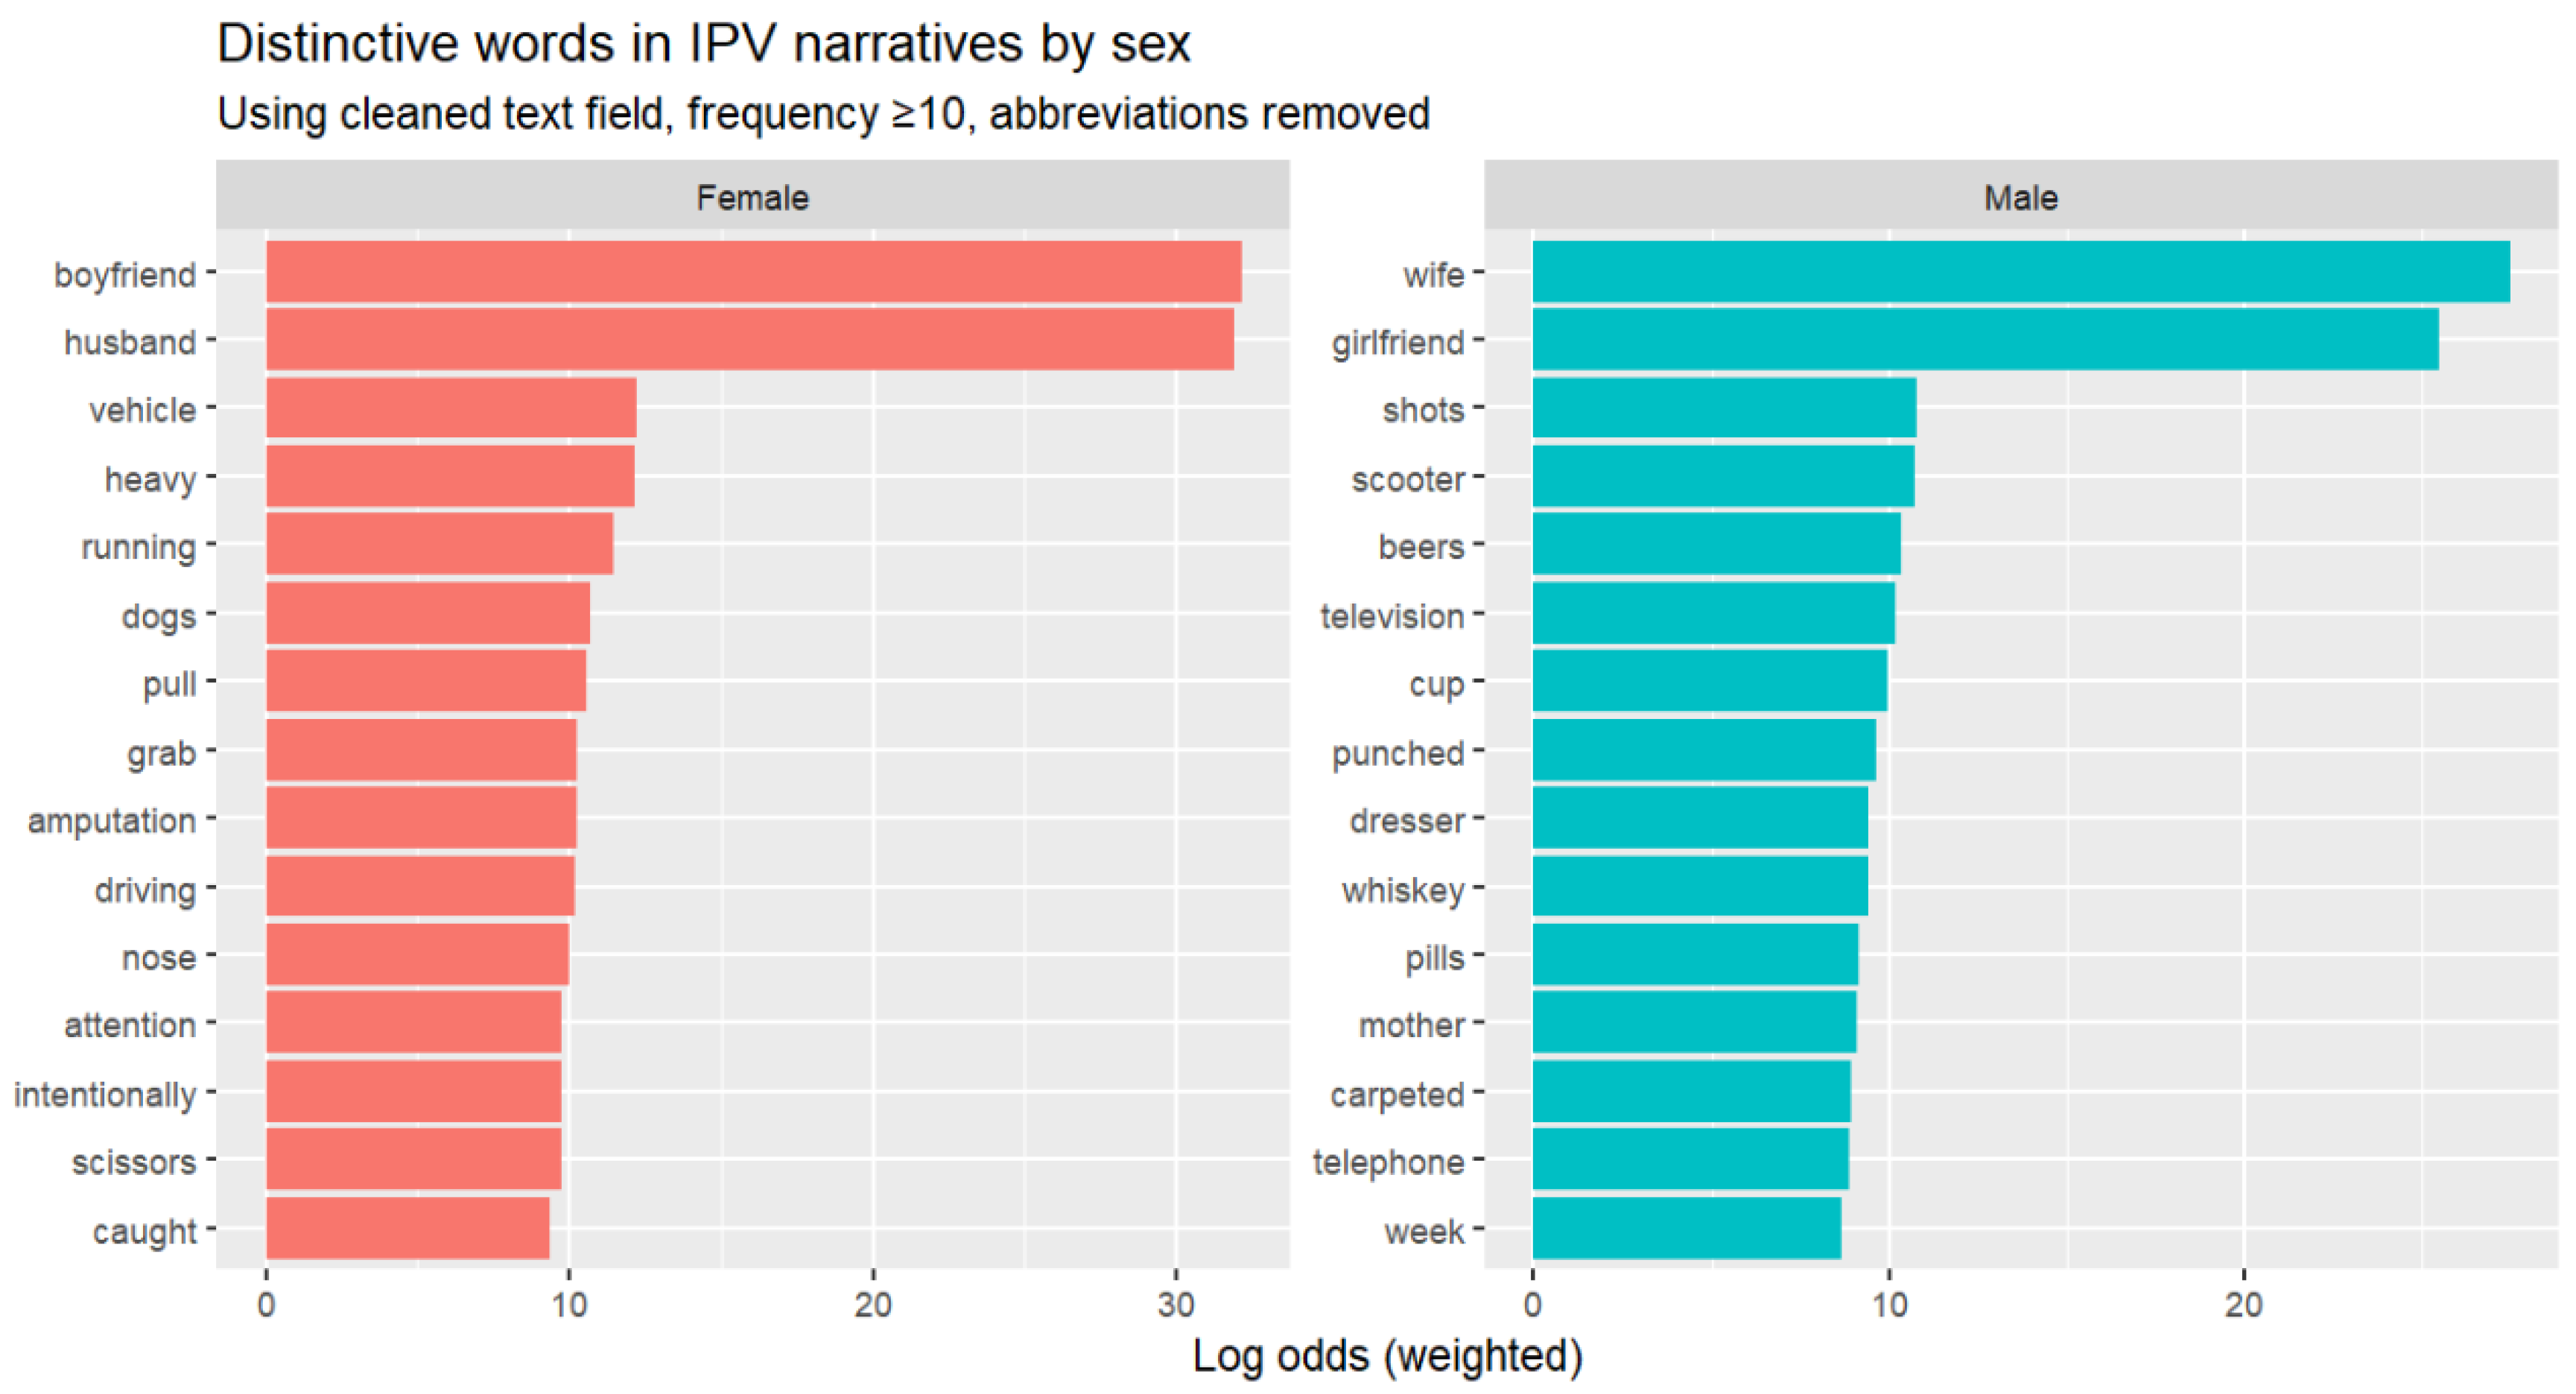

Table 1.
Demographic Characteristics of IPV-related ED patients.
| Variable / Category | Female n (%) | Male n (%) | Total n (%) | p |
| Head/neck injury | ||||
| No | 13,440 (76.2) | 19,206 (81.5) | 32,645 (79.2) | 0.111 |
| Yes | 4,206 (23.8) | 4,363 (18.5) | 8,569 (20.8) | |
| Location | ||||
| Home (1) | 10,883 (61.7) | 13,655 (57.9) | 24,538 (59.5) | 0.304 |
| Other (0) | 6,762 (38.3) | 9,914 (42.1) | 16,676 (40.5) | |
| Disposition | ||||
| Treated/released (1) | 15,064 (85.4) | 19,262 (81.7) | 34,327 (83.3) | 0.613 |
| Transferred: hospital (2) | 350 (2.0) | 796 (3.4) | 1,146 (2.8) | |
| Transferred: other facility (4) | 1,408 (8.0) | 2,244 (9.5) | 3,652 (8.9) | |
| Admitted (5) | 412 (2.3) | 595 (2.5) | 1,007 (2.4) | |
| Observed (6) | 411 (2.3) | 565 (2.4) | 977 (2.4) | |
| Left without being seen (8) | 0 (0.0) | 106 (0.4) | 106 (0.3) | |
| Race/ethnicity* | ||||
| Non-Hispanic White | 6,120 (68.2) | 6,624 (62.5) | 12,744 (65.1) | 0.266 |
| Non-Hispanic Black | 1,378 (15.4) | 2,174 (20.5) | 3,552 (18.2) | |
| Hispanic (any race) | 1,140 (12.7) | 1,109 (10.5) | 2,249 (11.5) | |
| Non-Hispanic Other | 232 (2.6) | 263 (2.5) | 495 (2.5) | |
| Age | ||||
| Age, Median (IQR) | 31.0 (24.0–44.0) | 30.0 (24.0–41.0) | 30.0 (24.0–42.0) | 0.556 |
Note: Race/ethnicity is available in NEISS only from 2019 onward. “Unknown” category was omitted and percentages recalculated.
Table 2.
Fracture characteristics by body region among IPV-coded adult ED visits (survey-weighted).
| Body Region | Fractures (n, %) |
Female Patients n (%) |
Male Patients n (%) |
Patient Age, y (mean +/- SD) |
| Head/neck | 268 (5.3) | 210 (78.3) | 58 (21.7) | 48.6 +/- 17.02 |
| Lower extremity | 92 (1.8) | 72 (78.8) | 20 (21.2) | 24.2 +/- 0.47 |
| Upper extremity | 4669 (92.8) | 1148 (24.6) | 3521 (75.4) | 34.1 +/- 15.51 |
| Total | 5029 (100.0) | 1430 (28.4) | 3599 (71.6) | 34.7 +/- 15.80 |
Table 3.
Number of fractures with associated bones by body region among IPV-coded ED visits.
| Body Region | Subregion | Associated Bones | No. of Fractures |
| Upper extremity (n = 4797) | Shoulder girdle | Clavicle/shoulder girdle; Scapula/shoulder girdle | 572 |
| Upper arm | Humerus | 16 | |
| Forearm | Radius, Ulna | 229 | |
| Hand | Carpal/wrist, Finger (NOS), Hand (NOS), Phalanges (finger), Thumb | 3980 | |
| Head/neck (n = 197) | Head | Skull | 16 |
| Neck | Cervical spine | 14 | |
| Face | Orbit | 167 | |
| Lower extremity (n = 108) | Foot | Toes | 108 |
| Unknown (n = 783) | Unknown | Unknown | 783 |
Table 4.
Logistic regression analysis of factors associated with head/neck injury and IPV-related ED admissions by demographic characteristics and alcohol use involvement.
Table 4.
Logistic regression analysis of factors associated with head/neck injury and IPV-related ED admissions by demographic characteristics and alcohol use involvement.
| Craniofacial injury | |||
| Variable | Level | OR (95% CI) | P |
| Sex | Female | Reference | - |
| Male | 0.72 (0.49–1.07) | 0.103 | |
| Age (years) | 18–29 | Reference | - |
| 30–44 | 1.14 (0.75–1.75) | 0.531 | |
| 45–64 | 1.29 (0.79–2.12) | 0.302 | |
| ≥65 | 2.80 (1.56–5.02) | <.001 | |
| Race/Ethnicity | NH White | Reference | - |
| race4NH Black | 0.70 (0.42–1.16) | 0.16 | |
| race4Hispanic | 1.10 (0.59–2.05) | 0.773 | |
| race4Other/Unknown | 0.83 (0.52–1.30) | 0.408 | |
| Alcohol involved | No | Reference | - |
| Yes | 1.81 (1.10–2.96) | 0.02 | |
| Location | Not home | Reference | - |
| Home | 0.94 (0.61–1.44) | 0.771 | |
| Year (continuous) | (1 year) | 1.11 (1.05–1.17) | <.001 |
| Admissions (Admitted/Transferred vs Treated/Released) | |||
| Variable | Level | OR (95% CI) | P |
| Injury type | Other | Reference | - |
| Head/neck | 1.84 (1.10–3.07) | 0.021 | |
| Sex | Female | Reference | - |
| Male | 1.35 (0.80–2.28) | 0.255 | |
| Age (years) | 18–29 | Reference | - |
| 30–44 | 1.67 (0.82–3.44) | 0.158 | |
| 45–64 | 2.64 (1.40–4.95) | 0.003 | |
| ≥65 | 15.11 (6.94–32.92) | <.001 | |
| Race/Ethnicity | NH White | Reference | - |
| race4NH Black | 0.82 (0.31–2.18) | 0.69 | |
| race4Hispanic | 0.77 (0.29–2.05) | 0.591 | |
| race4Other/Unknown | 0.71 (0.38–1.32) | 0.275 | |
| Alcohol involved | No | Reference | - |
| Yes | 2.33 (1.29–4.21) | 0.005 | |
| Location | Not home | Reference | - |
| Home | 1.43 (0.90–2.26) | 0.124 | |
| Year (continuous) | (1 year) | 1.12 (1.03–1.22) | 0.008 |
Table 5.
Representative narratives for distinctive (non-relational) words by sex.
| Sex | Word | Representative narrative |
| Female | amputation | A 24-year-old female was in a verbal argument with her boyfriend as he was leaving. She slammed the screen door, then punched at the glass, which shattered and cut her arm. She has a partial amputation between the wrist and elbow. Diagnosis: Partial traumatic amputation of the right arm between the elbow and wrist, initial encounter. |
| attention | A 40-year-old female was placed on a 5150 psychiatric hold due to concern for potential self-harm. She had been involved in an argument with her husband and banged her head against a wall. The patient stated that she had no intention of harming herself or committing suicide and that she only wanted to get her husband’s attention. A urine drug screen was positive for marijuana, benzodiazepines, tricyclic antidepressants, and opiates. Diagnosis: Acute stress reaction. |
|
| scissors | A 49-year-old female, intoxicated, with a blood alcohol concentration of 134, was involved in a verbal altercation with her husband. In frustration, she took a pair of scissors and stabbed herself in the thigh. She reported she was angry at her husband and wanted him to take her more seriously, and denied any intention to harm herself. Diagnosis: Alcohol intoxication; laceration of lower extremity, unspecified. |
|
| pull | A 52-year-old female, during an argument with her husband, was cut when he tried to pull a knife out of her hand. She had been drinking. Diagnosis: Laceration of palm; mood disorder; alcohol use disorder. |
|
| nose | A 36-year-old female was arguing with her boyfriend, who tripped and fell into a glass window. The glass cut the patient’s nose. Diagnosis: Nasal laceration. |
|
| running | A 53-year-old female with left toe pain after hitting her toe on a cabinet while running from her husband during an altercation. Diagnosis: Contusion of the left great toe. |
|
| Male | cup | A 24-year-old male stated he was angry with his girlfriend and picked up a porcelain cup, smashed it into her cell phone, and the cup broke. Diagnosis: Laceration of the right hand. |
| dresser | A 33-year-old male complained of right foot pain for 2 hours after getting into a fight with his wife and kicking a wooden dresser while wearing sneakers. Diagnosis: Foot sprain. |
|
| punched | 23-year-old male, angry at his girlfriend, punched a glass window and sustained a hand laceration. Diagnosis: Laceration of the hand. |
|
| shots | The male patient got into an argument with his wife, became angry, and punched the walls at home. He stated he had been drinking seven or eight shots of whiskey and eight or nine shots of tequila. No blood alcohol level was obtained. Diagnosis: Hand injury, alcohol intoxication |
|
| telephone | The male patient was angry at his girlfriend and smashed her telephone, which shattered, causing a finger laceration. Diagnosis: Laceration of the finger |
|
| television | The male patient was angry at his wife and punched a flat-screen television, injuring his hand. Diagnosis: Hand injury. |
Disclaimer/Publisher’s Note: The statements, opinions and data contained in all publications are solely those of the individual author(s) and contributor(s) and not of MDPI and/or the editor(s). MDPI and/or the editor(s) disclaim responsibility for any injury to people or property resulting from any ideas, methods, instructions or products referred to in the content. |
© 2025 by the authors. Licensee MDPI, Basel, Switzerland. This article is an open access article distributed under the terms and conditions of the Creative Commons Attribution (CC BY) license (http://creativecommons.org/licenses/by/4.0/).
Copyright: This open access article is published under a Creative Commons CC BY 4.0 license, which permit the free download, distribution, and reuse, provided that the author and preprint are cited in any reuse.


