
Submitted:
26 September 2025
Posted:
30 September 2025
You are already at the latest version
Abstract
To clarify the heat and moisture regulation mechanism of deep-buried underground air tunnels and address the research gaps in the heat and moisture coupling between airflow and surrounding rock. This paper established a 560 m-deep ventilation shaft with a diameter of 5 m focused on the heat and moisture transfer of "surrounding rock - air tunnel - airflow" to investigate the airflow characteristics, analyzed the heat and moisture changes of the tunnel surface, airflow, as well as the energy storage characteristics of the surrounding rock, and compare the induced airflow characteristics across four typical cities in China. The results show that: there is an "inlet effect" in the deep-buried air tunnel; the wall temperature becomes basically stable after 200 m from the entrance, while a greater depth is required for the stable section of humidity; in summer, the airflow temperature decreases by more than 1℃ and the enthalpy decreases by 3.5 kJ/kg; in addition, the ground temperature in Guangzhou is relatively high, resulting in a limited effect on adjusting the intake airflow. This study aims to provide support for the energy-saving design of fresh air systems in deep-buried underground buildings.
Keywords:
underground air tunnel
; heat and moisture transfer
; fresh air regulation
; air tunnel energy storage
1. Introduction
As the urbanization process advances in-depth toward underground space, deep-buried underground buildings have become a crucial carrier for alleviating the shortage of urban land resources and expanding urban functions. They are widely applied in key fields such as underground transportation hubs, deep laboratories, and underground complexes [1]. As a core facility for ensuring indoor air quality and thermal comfort in deep-buried underground buildings, the fresh air system exhibits energy efficiency in its pre-treatment stage that directly impacts the overall energy-saving performance of the system. Serving as a key channel for fresh air supply, underground air tunnels can be regarded as a type of Earth-Air tunnel heat exchanger, which regulates incoming fresh air by utilizing the heat and moisture storage properties of surrounding soil: cooling outdoor air in summer and warming it in winter to deliver fresh air at a suitable temperature to the underground building, thereby reducing the energy consumption of air conditioning systems. Presently, this technology has been widely applied in applications including cagricultural greenhouses, deep-buried workshops, and emerging nearly zero-energy buildings (nZEBs) [2,3,4,5,6].
In recent years, a large number of researchers have developed various numerical models to characterize the heat transfer performance of Earth–air tunnel heat exchangers (EATHEs). For example, Al-Ajmi et al. [7] proposed a theoretical model that can predict the outlet air temperature in hot and arid climatic regions.; Liu et al. [8] developed a numerical model for heat transfer calculation targeting underground vertical U-tubes with a length of less than 16.5 m. However, these models only consider the sensible heat transfer process and do not involve moisture-related heat transfer phenomena.
Heat and moisture transfer in deep-buried underground air tunnels exhibits distinct multi-physics coupling characteristics, with its regulatory effect on fresh air dependent on the dynamic heat and moisture exchange mechanism among the surrounding rock, air tunnel wall, and airflow. Existing studies, through the establishment of mathematical models for the moisture and heat balance of surrounding rock, have identified that this complex heat-moisture coupled transfer process is jointly driven by: (1) the seepage of liquid water in the surrounding rock under capillary force; (2) the diffusion of water vapor under a water vapor partial pressure gradient; (3) heat conduction through the solid skeleton of the surrounding rock; and (4) latent heat release and absorption during moisture phase change [9,10].
Currently, Studies on heat and moisture transfer in surrounding rock primarily focus on surrounding rock in engineering settings such as tunnels, underground hydropower stations, and roadways, encompassing two key research directions: surrounding rock heat transfer and its heat-moisture coupled transfer. Liu [11] investigated the thermal accumulation effect of tunnel surrounding rock induced by periodic variations in outdoor air temperature and its propagation law in the surrounding rock. The study found that the tunnel wall temperature changes periodically with outdoor air temperature, exhibiting amplitude attenuation and phase delay relative to the air temperature; additionally, the amplitude of temperature waves within the surrounding rock attenuates exponentially with increasing depth. Qin et al. [12,13] focused on the temperature field of roadway surrounding rock, established a one-dimensional unsteady heat conduction governing equation under periodic boundary conditions, introduced dimensionless criterion numbers to conduct dimensionless analysis of the mathematical model, and derived prediction formulas for roadway wall heat flux and surrounding rock temperature. Wang et al. [14] investigated the evolution characteristics of heat storage in subway tunnel surrounding rock under periodic dynamic variations in air temperature by constructing a scaled-down test bench.
Regarding research on heat-moisture coupled transfer in surrounding rock, Liu et al. [15,16] classified hydropower station underground caverns into two categories: narrow and long caverns, and large-space caverns. By adopting Whitaker's volume-averaging theory, taking temperature and moisture content as the driving potentials, and accounting for wall condensation, they investigated the dynamic heat and moisture adsorption-desorption characteristics of surrounding rock. Zhang [17] adopted relative humidity and temperature as the driving potentials, considered latent heat, established a mathematical model for heat-moisture coupled transfer in surrounding rock, proposed a method for calculating the far-boundary thickness of surrounding rock in underground space, and calculated the hourly heat and moisture adsorption-desorption of the wall as well as the temperature and humidity distribution of surrounding rock via numerical methods. Xiang [18], building on the heat-moisture coupled transfer theoretical model for surrounding rock in hydropower station underground workshops, integrated numerical simulation, experimental research, and data regression analysis to investigate the factors influencing the heat and moisture adsorption-desorption of the surrounding rock wall.
In summary, existing theories regarding heat-moisture coupled transfer in surrounding rock are relatively mature. However, a gap remains in targeted studies on heat-moisture coupled transfer between tunnel airflow and surrounding rock during the air induction process of underground air tunnels. Against this backdrop, this study focuses on the effects of deep-buried underground air tunnels on the heat-moisture state and enthalpy of intake fresh air, and conducts research in three key aspects: First, analyze the dynamic variation characteristics of fresh air temperature and humidity along the tunnel, and quantify the intensity of heat-moisture exchange at different locations and in different seasons; Second, reveal the mechanism by which the tunnel regulates the enthalpy of fresh air, and clarify the regulatory contributions of summer enthalpy reduction and winter enthalpy increase; Third, by incorporating the characteristics of typical climate zones, evaluate the differences in the regulatory effects of underground air tunnels on fresh air heat, moisture, and enthalpy levels under different meteorological conditions.
2. Mathematical-Physical Model
2.1. Physical Model
Figure 1 illustrates an engineering case where the ventilation shaft of an underground building has a depth of approximately 560 m and a diameter of 5 m. This dimensional design balances fresh air supply volume and air tunnel resistance: it not only meets the fresh air requirements for both underground personnel’s respiration and equipment heat dissipation, but also avoids unduly high airflow resistance from an unduly small shaft diameter and increased construction costs from an unduly large one. The shaft’s fresh air supply is sourced from a ground-based air induction station. Notably, in typical engineering scenarios, the ground-based air station serves solely for "power-driven air transportation" and is not equipped with additional air treatment equipment (e.g., heating, cooling, humidification, or dehumidification devices). Thus, the state properties (e.g., temperature, humidity) of the fresh air entering the shaft are fully consistent with real-time outdoor meteorological conditions.
As shown in Figure 2, the geometric model of the underground building and the heat and moisture coupled transfer process are presented. Since the fresh air tunnel has a regular circular cross-section, its heat and moisture transfer characteristics in the circumferential direction are uniform (that is, the heat transfer and mass transfer capabilities between the air tunnel wall and the surrounding rock are consistent at any circumferential position). Thus, there is no need to construct a complex 3D geometric model; instead, only a 2D longitudinal cross-sectional model along the air tunnel axis needs to be established. In this model, the fresh air flow flows stably inside the air tunnel, and at the same time, continuously undergoes heat and moisture coupled transfer with the surrounding underground rock through the air tunnel wall — this includes both heat exchange (e.g., high-temperature outdoor fresh air releases heat to low-temperature surrounding rock in summer, and low-temperature outdoor fresh air absorbs heat from high-temperature surrounding rock in winter) and moisture migration (e.g., soil moisture in the surrounding rock diffuses into dry fresh air, or water vapor in high-humidity fresh air permeates into dry surrounding rock). This coupling process directly determines the final state of the fresh air when it reaches the entrance of the underground building, and it is not only a key consideration factor in the environmental control design of underground buildings, but also the core content of this study.
2.2. Mathematic Model
The surrounding rock of the underground air tunnel focused on in this study is an unsaturated porous medium. Moisture in its internal pores mainly exists in two forms: liquid water and water vapor, and both forms undergo internal migration. Among them, the migration of liquid water is primarily driven by the dual forces of gravitational potential and matric potential: gravitational potential promotes the directional migration of moisture along the gravitational field direction, while capillary potential (a component of matric potential) drives the seepage of liquid water from areas with lower capillary pressure to those with higher capillary pressure. However, considering the calculation context and accuracy requirements of this study, the effect of gravity on liquid water migration can be neglected.
From the perspective of moisture content thresholds: when the surrounding rock’s moisture content exceeds its maximum hygroscopic moisture content, internal moisture primarily exists as free water. In this case, liquid water seeps and diffuses from areas of higher moisture content to those of lower content under capillary force; conversely, if the moisture content is below this threshold, moisture is mainly retained in the rock as adsorbed water. In this state, the dominant form of moisture migration is water vapor diffusion.
Notably, the heat-moisture coupled transfer process within the surrounding rock is highly complex. Its transfer behavior is governed not only by the rock’s own thermo-hygroscopic properties (e.g., thermal conductivity, porosity, water-holding capacity, among others) but also significantly influenced by indoor environmental parameters of the underground building (e.g., temperature, humidity, airflow conditions). To simplify subsequent mathematical model development and calculations, the following assumptions are made regarding the surrounding rock’s characteristics prior to model establishment:
(1) The surrounding rock medium is assumed to be uniform, continuous, and isotropic, with its physical properties (e.g., thermal conductivity, permeability) remaining consistent across all spatial positions and directions;
(2) Moisture within the surrounding rock is restricted to two phases: gas (water vapor) and liquid (liquid water), with moisture freezing in low-temperature environments neglected for the present;
(3) Water vapor is treated as an ideal gas, with its state changes adhering to the ideal gas law. Intermolecular forces and molecular volume of real gases are neglected;
(4) Any micro-region (i.e., local point) within the surrounding rock is assumed to satisfy heat and moisture balance conditions, without instantaneous drastic fluctuations in temperature or humidity parameters;
(5) Given the regular shape of the surrounding rock, its heat-moisture transfer is assumed to occur solely along its thickness direction (exhibiting one-dimensional transfer), with heat and moisture exchange in other directions neglected;
(6) Under isothermal conditions, capillary hysteresis during moisture adsorption-desorption in the surrounding rock is neglected to simplify the computational complexity of moisture migration;
(7) The surrounding rock is assumed to lie within the underground constant temperature zone, where seasonal atmospheric temperature fluctuations do not affect its initial temperature, ensuring stable initial temperature conditions for the model.
(1) Governing Equations of Surrounding Rock
(1.1). Moisture transfer
Moisture in the surrounding rock exists in two phases: liquid (liquid water) and vapor (water vapor). Liquid water undergoes mass transfer driven by capillary force, with its seepage and migration behavior characterized and solved using Darcy’s law; water vapor, meanwhile, undergoes mass transfer driven by water vapor partial pressure, and its diffusion and migration behavior can be described via Fick’s law. Based on the law of mass conservation, the moisture balance equation for the surrounding rock can be derived as follows:
where denotes the moisture content of the materials,; is the liquid water transfer,; is the water vapor transfer, .
According to Darcy's law, the calculation formula for the migration amount of liquid water is as follows:
where denotes the conductivity of liquid water,; is the capillary pressure, .
The liquid water conductivity of the material is difficult to obtain directly. It can be calculated using the following formula:
where gas constant of water vapor, which is about 462 ; is the temperature, ; is the density of liquid water, which is 1000 。
The capillary force can be converted into a more easily obtainable volumetric moisture content and relative humidity based on the isothermal moisture absorption equilibrium curve of the material. That is, the capillary force gradient is transformed into a relative humidity gradient. The formula is as follows:
where is the relative humidity; represents the slope of the isothermal moisture absorption equilibrium curve of the material. Then, the formula for calculating the amount of liquid water migration is ultimately expressed as the following equation:
where , which is the diffusion coefficient of liquid water, .
According to Fick's law, the calculation formula for the migration amount of water vapor is as follows:
where is the water vapor permeability coefficient, ; is the vapor pressure, ; is the saturation vapor pressure, .
Since the saturated vapor pressure is directly related only to temperature, it can be calculated using the following formula:
Convert the water vapor partial pressure gradient into the relative humidity gradient and temperature gradient. The formula is as follows:
The formula for calculating the amount of water vapor migration is ultimately expressed as follows:
Therefore:
The final moisture balance equation for the surrounding rock can be simplified as follows:
where is the mass transfer coefficient caused by the gradient of relative humidity, ; is the mass transfer coefficient caused by temperature gradient, .
(1.2) Heat transfer
The heat transfer process of the surrounding rock not only involves the heat transfer during the migration of moisture, but also may include the latent heat generated during the phase change of moisture. Therefore, the heat transfer of the surrounding rock mainly includes heat conduction of the surroundings, the energy carried during the migration of moisture, and the heat generated by the phase change of moisture. Thus, the total heat flow formula is as follows:
where is the heat flow, ; is the effective thermal conductivity of the material, ; is the specific heat capacity of water vapor, ; is the specific heat capacity of liquid water, which is approximately 4200; is the latent heat of evaporation.
Since the latent heat of evaporation is directly related only to temperature, the calculation formula is as follows:
Since the sensible heat component of moisture is much smaller than the latent heat component, when calculating the heat flow of the surrounding rock, the heat migration caused by the migration of liquid water and water vapor can be ignored. Thus, the formula can be simplified to the following form.:
According to the law of conservation of energy, the thermal equilibrium equation of the surrounding rock is as follows:
where is the density of surrounding rock, ; is the constant-pressure specific heat capacity of the rock in a dry state, .
Therefore:
The final thermal balance equation of the surrounding rock can be simplified as follows:
where the , is the effective thermal conductivity of the surrounding rock, ; is the heat transfer coefficient caused by the gradient of relative humidity。
(2) Governing Equations of Surrounding Rock
The equation for describing the transfer of moisture in humid air is as follows:
where is the density of water vapor in the airflow, ; is the relative molecular mass; is the diffusion coefficient, ; is the moisture source, . The calculation formula is as follows:
The heat balance equation is as follows:
where is the air flow velocity,; is the heat conductivity coefficient,; is the heat source, . The calculation formula is as follows:
where is the diameter, ; is the wall temperature, ; is the air temperature, ; is the convective heat transfer coefficient, .
2.3. Material properties
By consulting the relevant literature, the thermal and moisture physical parameters of the materials studied in this paper are obtained as shown in Table 1:
2.4. Model Validation
To verify the reliability of the numerical model’s calculation results, this study selected field test data from Liu et al. [19], which was obtained from a 305-meter-long hydropower air tunnel near Xichang City, Sichuan Province, China, and compared them with the model’s predictions. As shown in Figure 3, there is good agreement between the numerical calculation results and the field test results, with a maximum temperature difference of 0.4 °C and a maximum relative humidity difference of 6%. Thus, it can be concluded that the calculation results of the numerical model established in this study are reliable, and its errors fall within an acceptable range.
3. Results and Discussions
3.1. Heat and Moisture Coupling Transfer Characteristics of Underground Air Tunnel
To analyze the fundamental characteristics of heat-moisture coupled transfer behavior in deep-buried underground air tunnels, this section examines multiple aspects: changes in the heat-moisture state of the air tunnel wall, variations in wall heat-moisture flux, and shifts in the heat-moisture state of airflow. It also conducts statistical analysis on the annual heat storage characteristics of the tunnel’s surrounding rock. For the analyses in this section, the following parameters are set: the fresh air supply rate of the underground air tunnel is 12,000 m³/h; the tunnel’s initial relative humidity is 80%, and its initial temperature is 11.2 °C. Outdoor fresh air meteorological parameters adopt 2016 test data from Chengdu Shuangliu Meteorological Station (Sichuan Province, China), with a one-year numerical simulation conducted starting from January 1, 2016.
3.1.1. Variation of Heat and Humid Characteristics of the Tunnel Surface
When a deep-buried underground air tunnel delivers outdoor fresh air to underground buildings, the heat-moisture state of the airflow within the tunnel varies along the tunnel length. As shown in Figure 4, five time points across the year are selected to illustrate the temperature distribution along the tunnel. It can be observed that the air entering from the left inlet exerts a slight heating effect on the tunnel’s inlet section; however, as the airflow travels further along the tunnel, the airflow temperature change becomes minimal. This is because as the airflow travels further, its temperature gradually approaches equilibrium with the temperature of the tunnel wall’s boundary layer, thereby minimizing heat transfer between the airflow and the wall.
Figure 5 illustrates the trend of temperature variation on the tunnel wall. It can be observed that the wall temperature in the tunnel’s rear section remains relatively stable, while the temperature in the front section fluctuates notably due to changes in outdoor meteorological temperature. The front section is hereafter referred to as the "inlet effect section." Similarly, Figure 6 illustrates the trend of relative humidity variation on the tunnel wall. Here, it is observed that the variation trend of relative humidity along the tunnel length is consistent with that of temperature: it remains relatively stable in the tunnel’s rear section and fluctuates notably in the front section. Notably, the transition point for relative humidity stabilization is located further along the tunnel than that for temperature stabilization.
As observed from the figures, after the airflow travels approximately 200 m from the inlet, the tunnel wall temperature remains stable across all operating time points; in contrast, the relative humidity continues to decrease slowly even beyond 200 m and only stabilizes at a greater distance along the tunnel. This phenomenon can be attributed to the fact that while the wall temperature tends toward stabilization, moisture transfer between the tunnel wall and the deeper regions of the surrounding rock persists: Moisture in the airflow is transferred to the tunnel wall, and moisture on the wall is further transported to the deeper regions of the surrounding rock. The energy variations caused by these two moisture transfer processes reach equilibrium at the wall, resulting in no observable change in wall temperature, only changes in relative humidity observed.
3.1.2. Variation of Heat and Moisture Flux of the Tunnel Wall Surface
The heat-moisture state of the air tunnel wall directly influences the variation of heat-moisture flux. As shown in Figure 7, the variation trend of heat flux along the tunnel wall is consistent with that of the wall’s heat-moisture state. Within the inlet effect section, the wall boundary heat flux can reach up to ±4 W/m², indicating a significant temperature difference between the airflow and the tunnel wall in this region, with the heat exchange process being particularly pronounced.
Figure 8 illustrates the variation of the boundary moisture transfer flux. In terms of temporal variation, the maximum boundary moisture transfer mass flux reaches a value of -4.5×10⁻⁶ kg/(m²·s) in winter, while in summer, this maximum value is approximately 3×10⁻⁶ kg/(m²·s). Specifically, the negative flux in winter indicates that moisture in the tunnel’s surrounding rock is transferred to the airflow, whereas the positive flux in summer means the tunnel’s surrounding rock absorbs some of the moisture from the airflow.
Figure 9 and Figure 10 illustrate the variations of the average heat-moisture flux on the air tunnel wall. It can be observed that in summer, the maximum average heat flux exceeds 0.9 W/m², while in winter, that maximum is approximately -0.5 W/m². From this, it can be inferred that the heat absorbed by the underground air tunnel in summer is greater than the heat released in winter. Similarly, in summer, the maximum average moisture transfer flux exceeds 6.5×10⁻⁷ kg/(m²·s), whereas in winter, that maximum is approximately -1.8×10⁻⁷ kg/(m²·s). On an annual basis, the amount of moisture absorbed by the underground air tunnel from the airflow exceeds that released.
3.1.3. Coupled Heat and Moisture Transfer Characteristics of Airflow
From the above research, it is evident that underground air tunnels exert a heat-moisture regulation effect on moist airflow, with heat-moisture changes on the airflow side primarily reflected in variations in temperature and humidity. As shown in Figure 11 and Figure 12, under the current calculation conditions, the tunnel’s maximum cooling effect on airflow in summer exceeds 1 °C, while its heating effect on airflow in winter is relatively weak—with a maximum value of approximately -0.6 °C (Note: The negative value here indicates a temperature rise trend, consistent with the "heating effect" described). Notably, the air inlet-outlet relative humidity difference exhibits a decreasing trend throughout the year. Only during the initial operation stage does this inlet-outlet relative humidity difference exceed approximately 2.5%; however, it gradually decreases to 0 as the operation period extends.
This phenomenon can be attributed to two primary factors: First, the tunnel’s surrounding rock gradually absorbs moisture until it approaches saturation, rendering it incapable of absorbing additional moisture from the airflow in the later operation stage. Second, the change in airflow relative humidity is influenced not only by moisture content but also by airflow temperature. The mechanism by which temperature and moisture content interact to alter air relative humidity is relatively complex—it is not a monotonic "one increases as the other decreases" relationship. For instance, this leads to phenomena such as increased relative humidity occurring when both moisture content and temperature decrease simultaneously. Ultimately, this results in a minimal inlet-outlet relative humidity difference.
To further illustrate the underground air tunnel’s regulation effect on airflow, enthalpy—a parameter that simultaneously reflects the combined effects of air moisture content and temperature—was used for analysis, as shown in Figure 13. It can be observed that in summer, the tunnel achieves the greatest enthalpy reduction for the airflow, with a maximum reduction of approximately 3.5 kJ/kg. In winter, the tunnel exerts an enthalpy-increasing effect on the airflow, with a maximum enthalpy rise of around 1 kJ/kg. This finding indicates that the tunnel’s precooling effect on fresh air in summer can reduce the fresh air heat gain load of underground buildings, while its enthalpy-increasing effect in winter can enhance the airflow’s energy content—also reducing the fresh air heat loss load of underground buildings. Both effects offer potential benefits for underground buildings.
3.1.4. Energy Storage of the Air Tunnel Surroundings
The energy storage characteristics of underground air tunnel surrounding rock under winter and summer conditions can be used to evaluate its annual energy performance. As shown in Figure 14, over the annual operation period, the energy variation of the surrounding rock exhibits a sine wave pattern that correlates with changes in outdoor meteorological parameters. In winter, the maximum energy variation does not exceed -800 W (the negative value indicates the surrounding rock releases energy to the airflow); in summer, the maximum energy variation exceeds 800 W (indicating the surrounding rock absorbs energy from the airflow).
This energy variation directly reflects the preconditioning effect of the tunnel surrounding rock on the incoming fresh air—and to a certain extent, this preconditioning effect benefits underground buildings. Figure 15 illustrates statistics on the surrounding rock’s energy variation during winter and summer operating periods. It can be observed that the surrounding rock’s heat storage capacity in summer is greater than its heat release capacity in winter. The total annual energy regulation capacities are approximately as follows: the summer heat storage capacity is around 2.25×10³ (kW·h), and the winter heat release capacity is around 1.75×10³ (kW·h). Notably, this result is based solely on the performance characteristics under the current calculation parameters.
3.2. The Ventilation Characteristics of Underground Air Tunnel in Cities of Different Climate Zones of China
From the above research, it is established that the preconditioning effect of underground air tunnels on fresh air varies with operating conditions. Given China’s extensive geographical area, to examine the operating characteristics of deep-buried underground air tunnels during the air supply process across different climate zones, this section selects four typical cities (Harbin, Nanjing, Beijing, and Guangzhou) for comparative analysis. In the calculations, the ground temperature for each of the four cities is set to their respective annual average temperatures, with values of approximately 5.38 °C, 21.4 °C, 13.7 °C, and 24.6 °C [20].
Figure 16 illustrates the calculation results of the fresh air inlet-outlet enthalpy difference. It can be observed that the preconditioning effect of underground air tunnels in Guangzhou is significantly weaker than that in the other three cities: the maximum summer inlet-outlet enthalpy difference does not exceed 6 kJ/kg, and the maximum winter inlet-outlet enthalpy difference does not exceed 4 kJ/kg. In contrast, for the other three cities under summer conditions, the maximum inlet-outlet enthalpy difference exceeds 8 kJ/kg.
This phenomenon can be primarily attributed to Guangzhou’s relatively high ground temperature, which results in weak heat interaction between the ground and fresh air—thus limiting the tunnel’s preconditioning effect on fresh air. Furthermore, for the other three cities, their preconditioning effects exhibit minimal differences in the later stage of annual operation, particularly between Beijing and Harbin. This is because the heat-moisture interaction between the tunnel’s surrounding rock and fresh air depends not only on temperature but also on the air’s moisture content. Although the annual average ground temperatures of these two cities differ by approximately 8.32 °C, the difference in outdoor air humidity may offset the impact of this temperature difference—resulting in minimal differences in their preconditioning effects.
4. Conclusions
Based on the research on heat-moisture coupled transfer in deep-buried underground air tunnels, this paper draws the following conclusions:
Deep-buried underground air tunnels exhibit a significant "inlet effect" in heat-moisture transfer: Within the first 200 m along the tunnel length, the wall temperature and humidity fluctuate notably under the influence of outdoor meteorological parameters. Beyond 200 m, the wall temperature stabilizes, while the relative humidity only stabilizes at a greater distance along the tunnel. Under the calculation conditions of this study, the heat-moisture exchange intensity in the inlet effect section is the highest, with the boundary heat flux reaching ±4 W/m². Specifically, the surrounding rock releases moisture to the airflow in winter (with a maximum moisture transfer flux of -4.5×10⁻⁶ kg/(m²·s)) and absorbs moisture from the airflow in summer (with a maximum moisture transfer flux of 3×10⁻⁶ kg/(m²·s)).
Underground air tunnels show seasonal differences in regulating the heat, moisture, and enthalpy of fresh air: Under the current calculation conditions, the tunnel achieves airflow cooling (with a maximum cooling effect exceeding 1 °C) and enthalpy reduction (with a maximum reduction of 3.5 kJ/kg) in summer, thereby reducing the fresh air heat gain load of underground buildings. In winter, it realizes airflow heating (with a maximum heating effect of approximately -0.6 °C, where negative values indicate temperature rise) and enthalpy increase (with a maximum increase of 1 kJ/kg). Furthermore, the annual energy storage of the surrounding rock exhibits a "summer storage and winter release" characteristic: the heat storage capacity in summer is about 2.25×10³ (kW·h), and the heat release capacity in winter is about 1.75×10³ (kW·h), reflecting the tunnel’s advantage in passive fresh air preconditioning.
Climate zone differences significantly impact the tunnel’s fresh air preconditioning effect: Among the four selected cities, Guangzhou has the highest annual average ground temperature (24.6 °C), leading to the weakest heat interaction with fresh air. Its maximum inlet-outlet enthalpy difference is only approximately 6 kJ/kg in summer and 4 kJ/kg in winter, resulting in a preconditioning capacity much lower than that of the other three cities. Although the annual average ground temperature difference between Harbin and Beijing reaches 8.32 °C, the difference in outdoor air moisture content between the two cities may offset the impact of this temperature difference, leading to similar fresh air preconditioning effects in the later stage of annual operation. Nanjing’s preconditioning effect falls between the above-mentioned cities, which further confirms that ground temperature and outdoor air moisture content jointly dominate the heat-moisture regulation capacity of underground air tunnels.
Author Contributions
Conceptualization, J.M; methodology, X.Z.; software, L.H 1; validation, B.D.; formal analysis, L.H 2.; writing—original draft preparation, X.C. and S.Q; writing—review and editing, J.M, X.Z. and L.H 2.; supervision, L.H 1., X.C. All authors have read and agreed to the published version of the manuscript.
Funding
The authors appreciate the financial support from the Research on Thermal and Humid Environment Protection and Flue Gas Control Technology in Deep Space (No.2021KY23ZD(JMRH)-02PT), and the Research on the Development and Design Method of Capillary Energy Wall of Subway Station in Loess Area (No.2023-YBSF-382).
Data Availability Statement
No new data were created or analyzed in this study.
Conflicts of Interest
The authors declare that there are no financial and personal relationships with other people or organizations that can inappropriately influence this work, there is no professional or other personal interest of any nature or kind in any product, service and/or company that could be construed as influencing the position presented in, or the review of, the manuscript entitled, “Study on Heat and Moisture Transfer Characteristics During Fresh Air Introduction in Deep Underground Engineering”.
References
- Underground Space Branch of Chin. Soc. Rock Mech. Eng. White Paper on the Development of Urban Underground Space in China (2014). Shanghai, China: Tongji Univ. Press, 2015. (in Chinese).
- Ghosal M.K., Tiwari G.N., Srivastava N.S.L. Thermal modeling of a greenhouse with an integrated earth to air heat exchanger: An experimental validation. Energy Build. 2004, 36(3): 219–227. [CrossRef]
- Ozgener O., Ozgener L. Determining the optimal design of a closed loop earth to air heat exchanger for greenhouse heating by using exergoeconomics. Energy Build. 2011, 43(4): 960–965. [CrossRef]
- Yu J., Kang Y., Zhai Z. Advances in research for underground buildings: Energy, thermal comfort and indoor air quality. Energy Build. 2020, 215: 109916. [CrossRef]
- Gao X., Qu Y., Xiao Y. A numerical method for cooling and dehumidifying process of air flowing through a deeply buried underground tunnel with unsaturated condensation model. Appl. Therm. Eng. 2019, 159: 113891. [CrossRef]
- Gao X., Zhang Z., Xiao Y. Modelling and thermo-hygrometric performance study of an underground chamber with a long vertical earth-air heat exchanger system. Appl. Therm. Eng. 2020, 180: 115773. [CrossRef]
- Al-Ajmi F., Loveday D.L., Hanby V.I. The cooling potential of earth-air heat exchangers for domestic buildings in a desert climate. Build. Environ. 2006, 41(3): 235–244. [CrossRef]
- Liu Z., Yu Z., Yang T., et al. Numerical modeling and parametric study of a vertical earth-to-air heat exchanger system. Energy 2019, 172: 220–231. [CrossRef]
- Wang Y.Y., Tian Y., Zhao Z.J., et al. Effect of Moisture Transfer on Heat Transfer through Exterior Corners of Cooled Buildings in Hot and Humid Areas. J. Build. Eng. 2021, 43: 103160.
- Tariku F., Kumaran K., Fazio P. Transient Model for Coupled Heat, Air and Moisture Transfer through Multilayered Porous Media. Int. J. Heat Mass Transf. 2010, 53(15–16): 3035–3044.
- Liu Y.J. Research on the Heat Sink of Subway Tunnel—Heat Sink Effects Caused by the Periodic Change of the Ambient Temperature. J. Railway Eng. Soc. 2018, 35: 92–96. (in Chinese).
- Qin Y.P., Wang H., Guo K.Y., Xue P.F., Wang J.W., Wu J.S. Simulation of finite volume method and experimental analysis for temperature field of roadway surrounding rock. J. China Coal Soc. 2017, 42(12): 3166–3175. (in Chinese).
- Qin Y.P., Song H.T., Wu J.S., et al. Numerical analysis of temperature field of surrounding rock under periodic boundary using Finite Volume Method. J. China Coal Soc. 2015, 40(7): 1541–1549. (in Chinese).
- Wang L.H., Zou X.C., Tao H. Experimental Study on Evolution Characteristics of the Heat Storage of Surrounding Soil in Subway Tunnels. Procedia Eng. 2017, 205: 2728–2735.
- Liu X.C., Xiao Y.M., Inthavong K., et al. A Fast and Simple Numerical Model for a Deeply Buried Underground Tunnel in Heating and Cooling Applications. Appl. Therm. Eng. 2014, 62(2): 545–552.
- Liu X.C. Formation Mechanism of Heat and Moisture Environment in Underground Hydropower Station and Its Energy-Saving Control Strategy (in Chinese). Thesis. Chongqing Univ., Chongqing, China, 2014.
- Zhang H.L. Study on the Thermal and Humid Environment in Hydroelectric Station Underground Plants (in Chinese). Thesis. Chongqing Univ., Chongqing, China, 2007.
- Xiang N. The Study of Measuring Method for Moisture Absorption and Discharge of Concrete Structures in Underground Hydropower Station (in Chinese). Thesis. Chongqing Univ., Chongqing, China, 2013.
- Liu Y., Xiao Y., Chen J., et al. A network model for natural ventilation simulation in deep buried underground structures. Build. Environ. 2019, 153: 288–301.
- Zeng C. Research on the Performance of Water-Phase Change Material Tank Auxiliary Ground Source Heat Pump System in Underground Shelter (in Chinese). Thesis. Southwest Jiaotong Univ., Chengdu, China, 2021.
Figure 1.
Case of underground building ventilation shaft project.
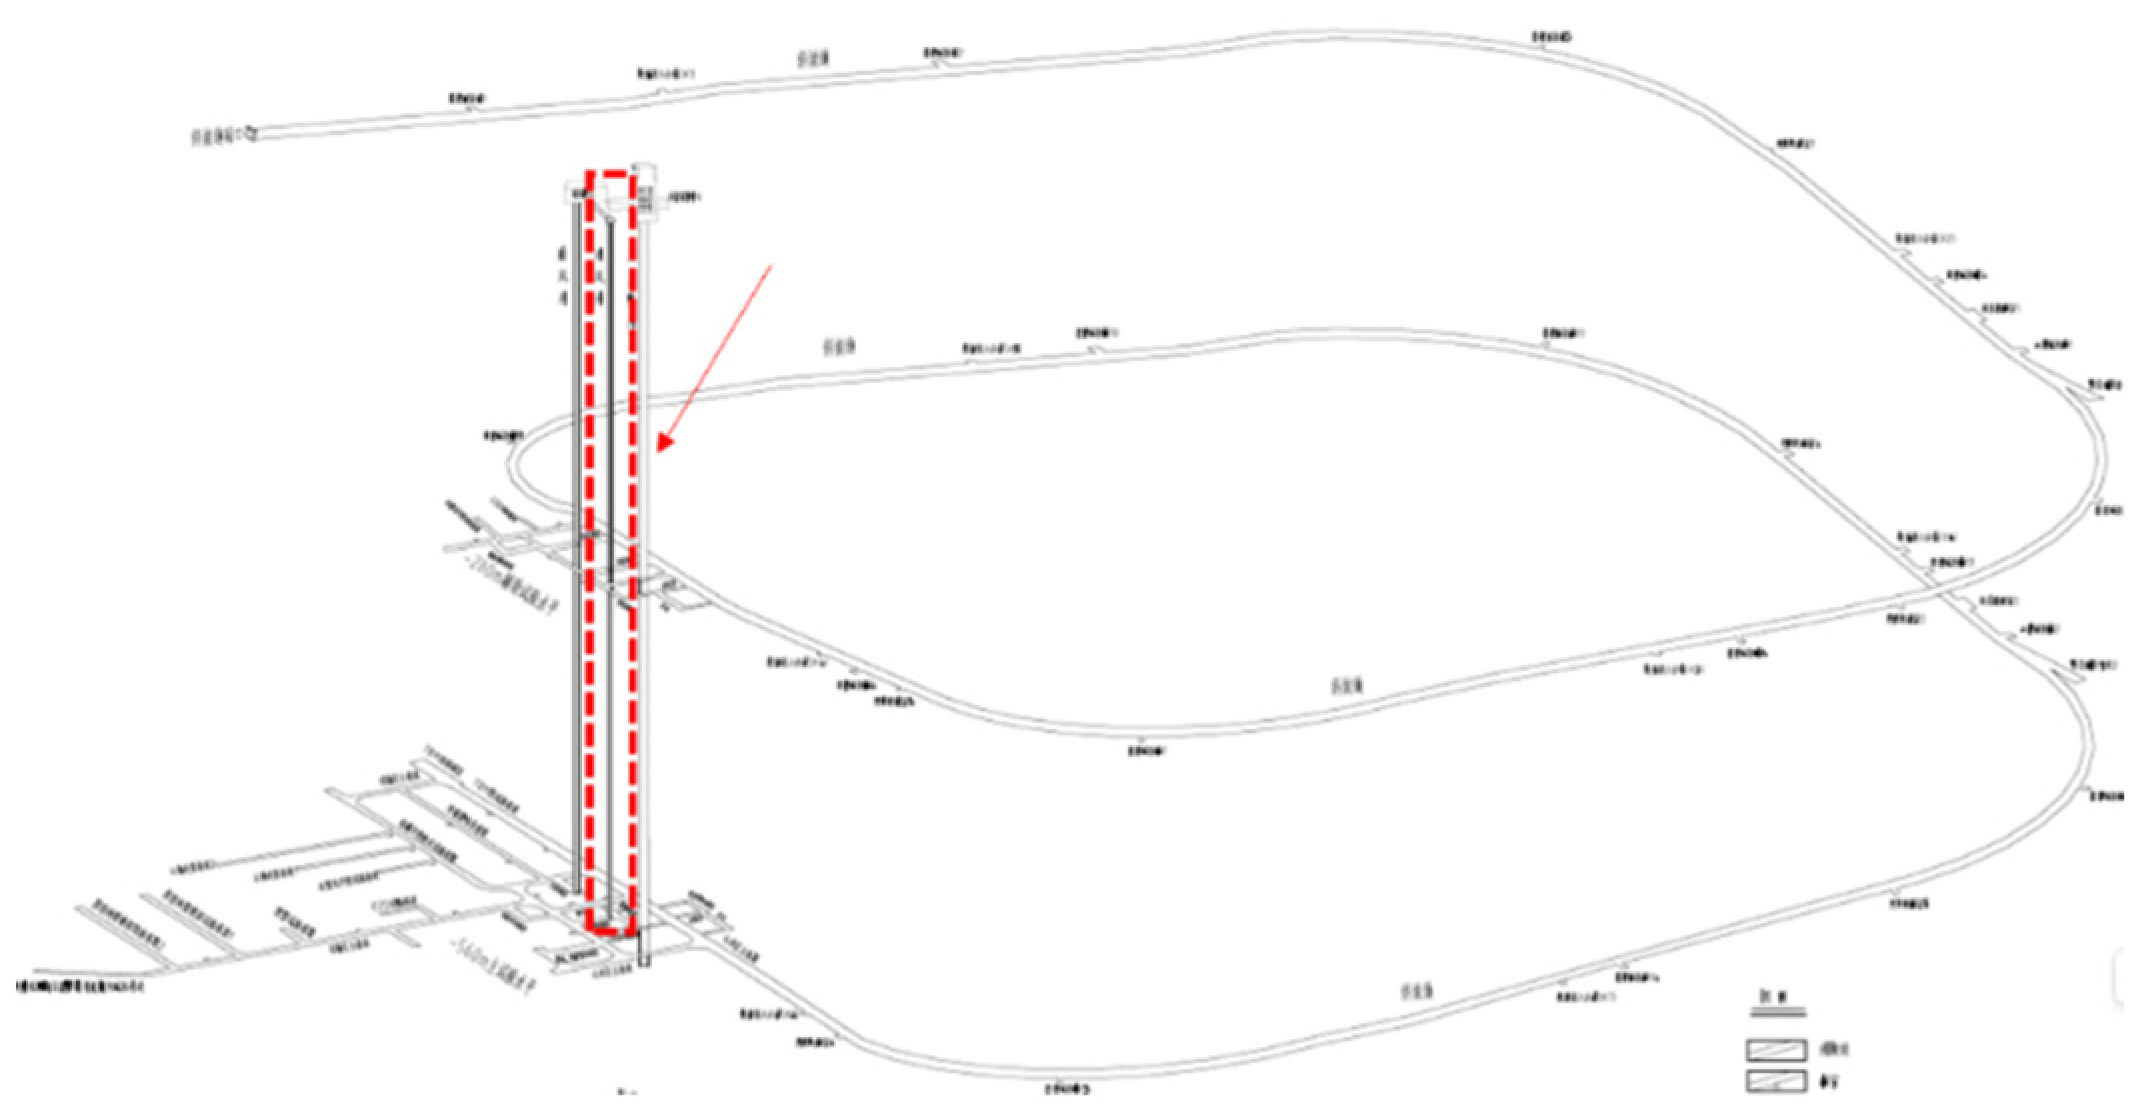
Figure 2.
Geometric model of underground ventilation shaft and schematic diagram of heat-moisture coupled transfer.
Figure 2.
Geometric model of underground ventilation shaft and schematic diagram of heat-moisture coupled transfer.
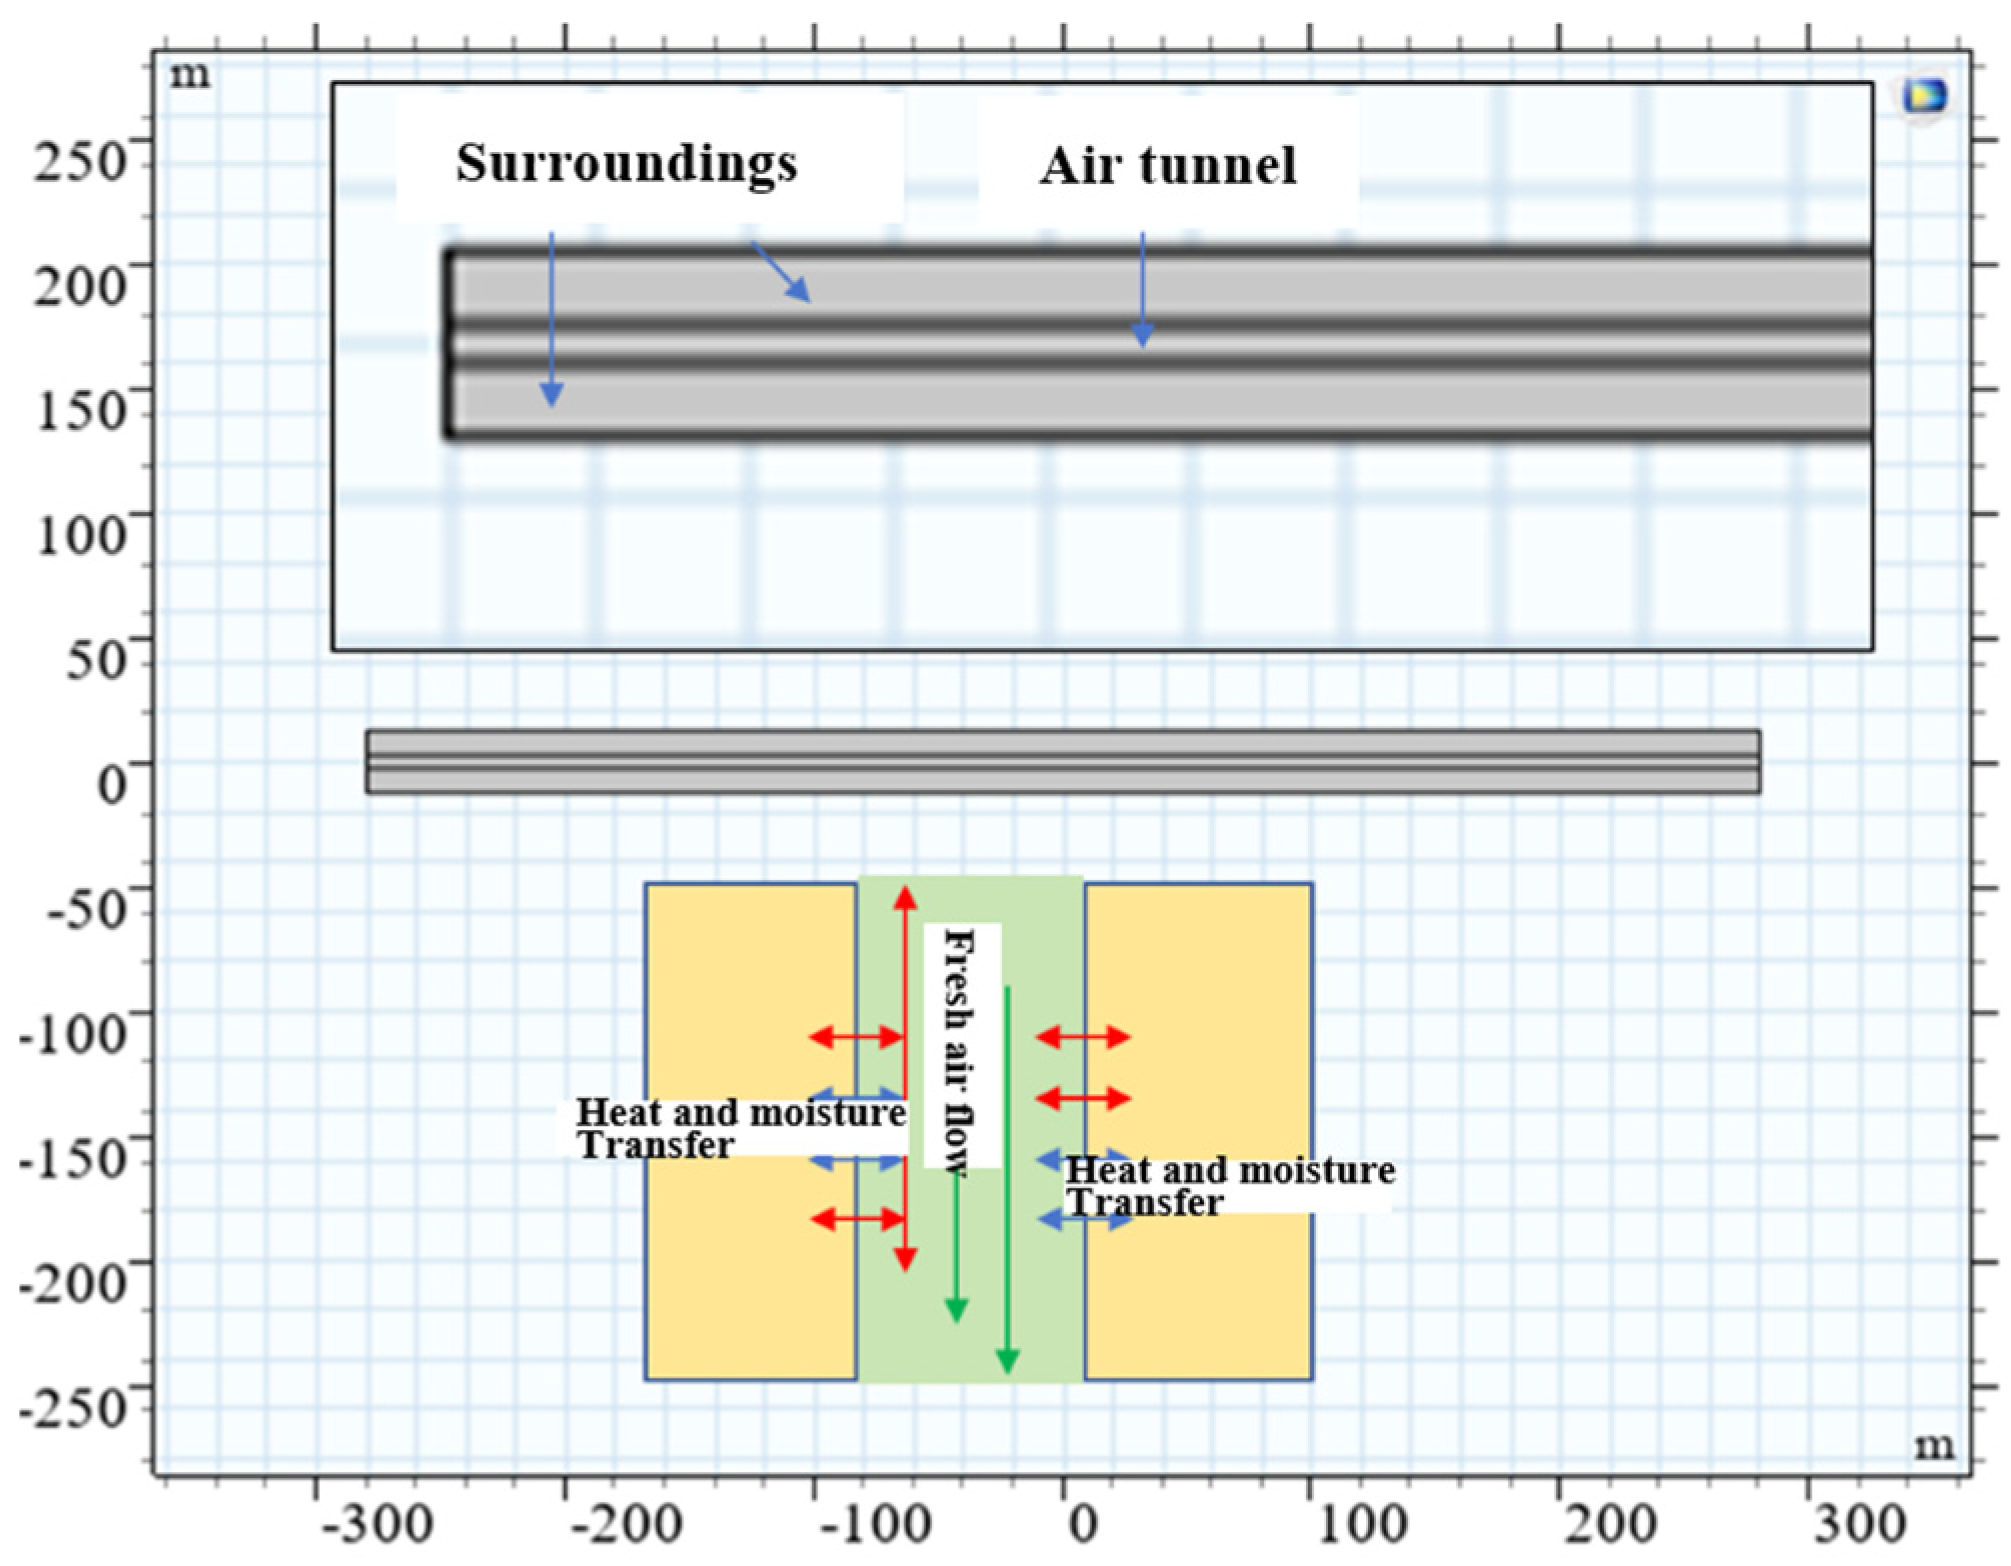
Figure 3.
At a distance of 180 meters from the entrance, the numerical results are compared with the field test results: (a) air temperature; (b) air relative humidity.
Figure 3.
At a distance of 180 meters from the entrance, the numerical results are compared with the field test results: (a) air temperature; (b) air relative humidity.
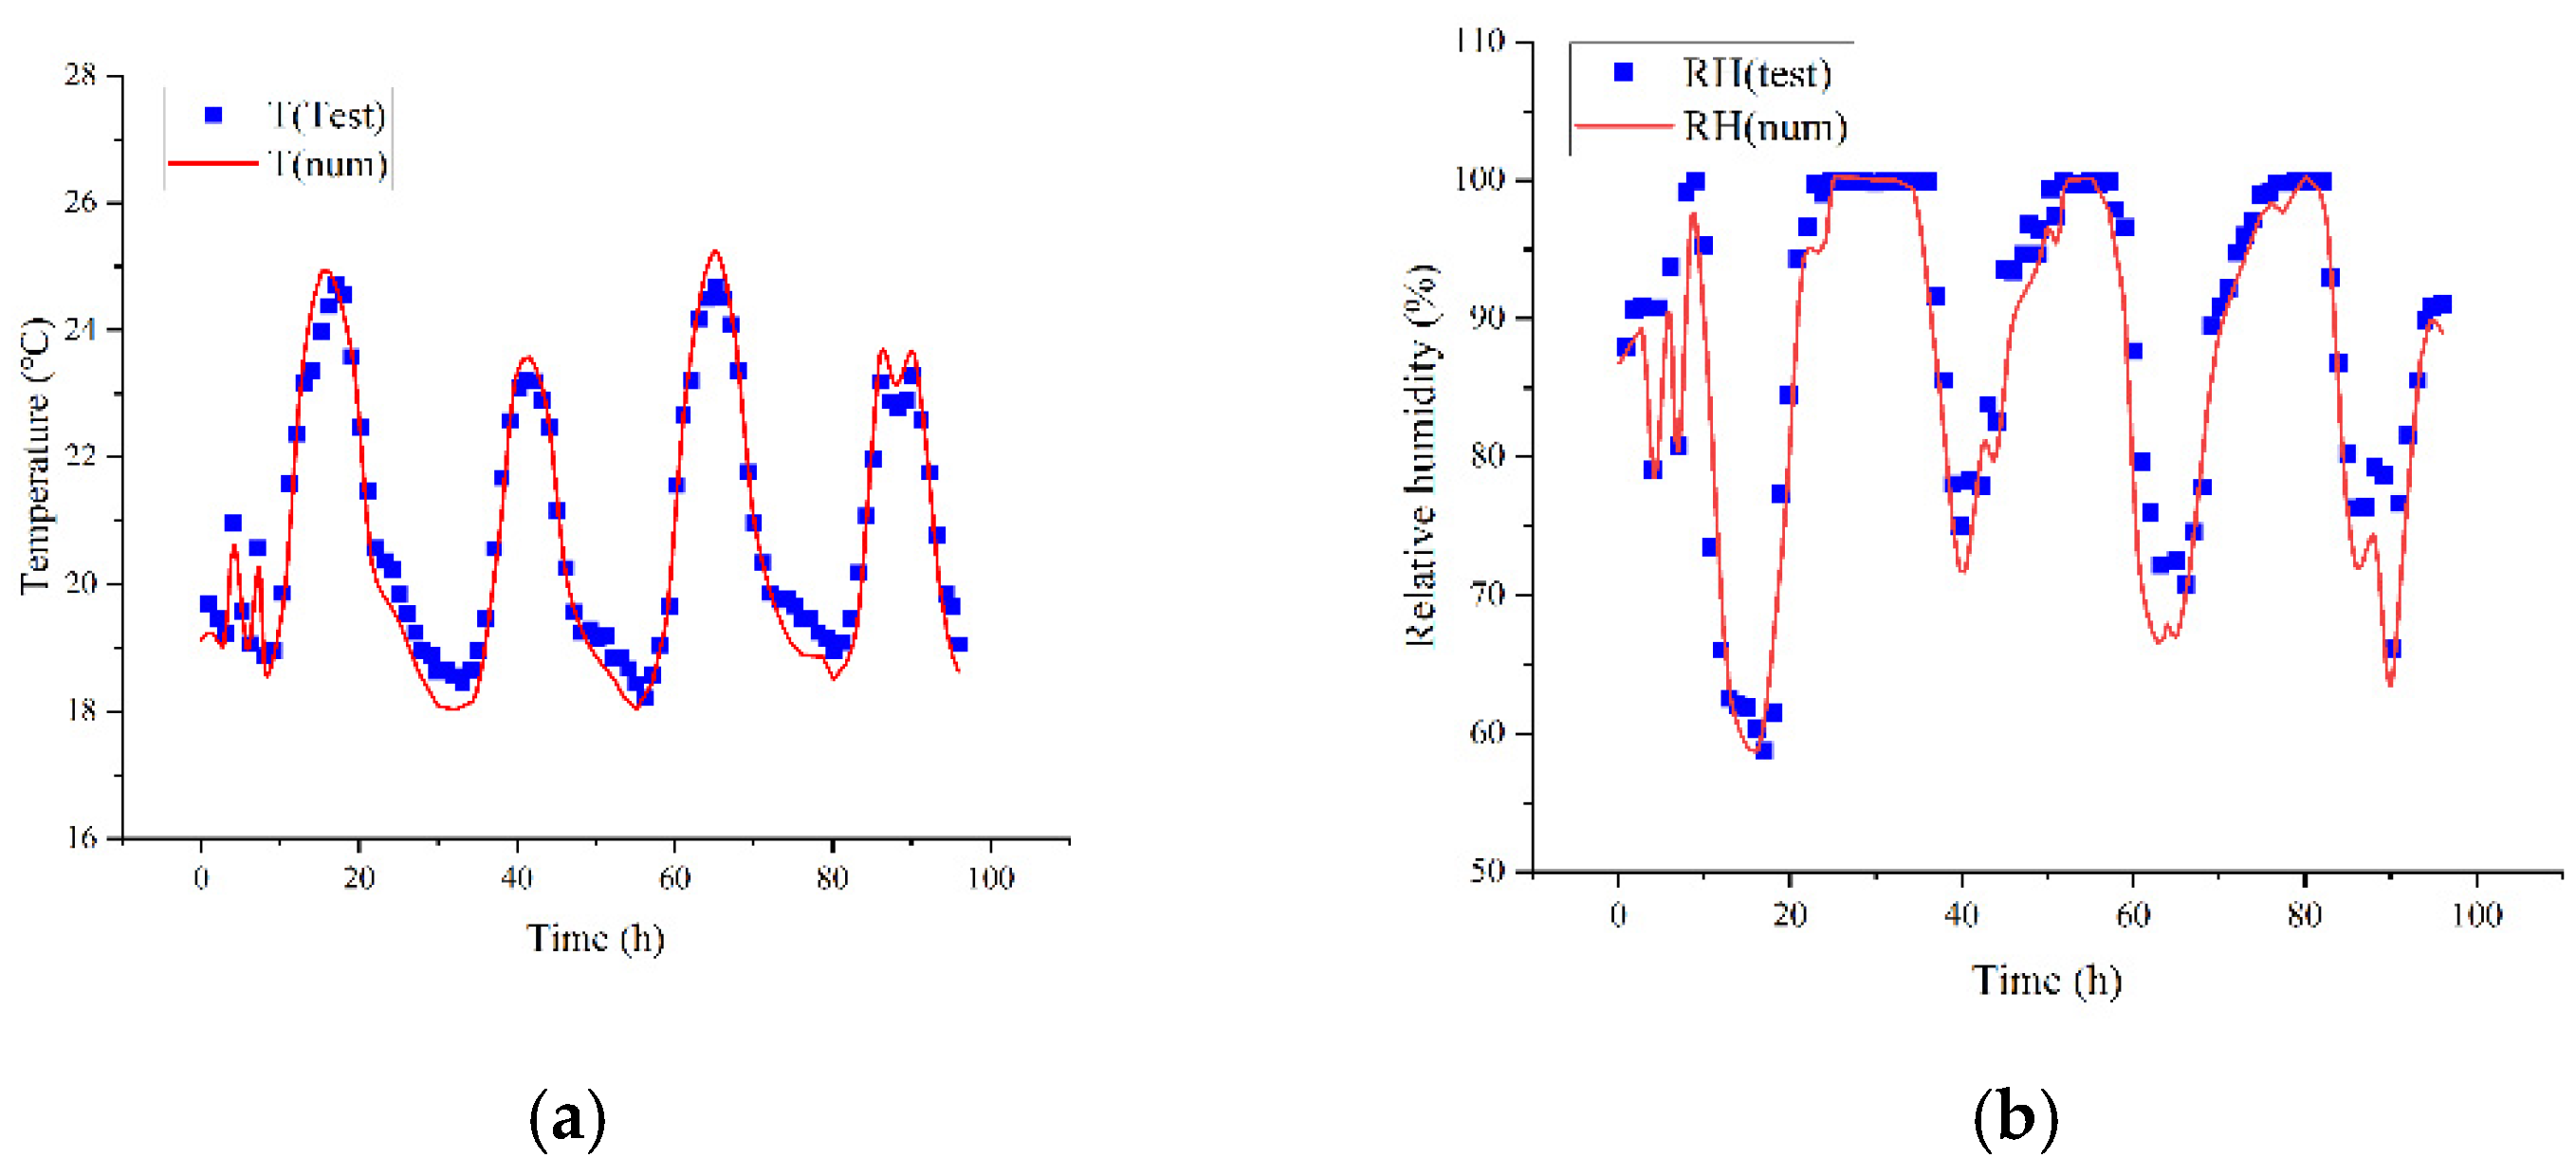
Figure 4.
Temperature distribution map along the underground air tunnel.
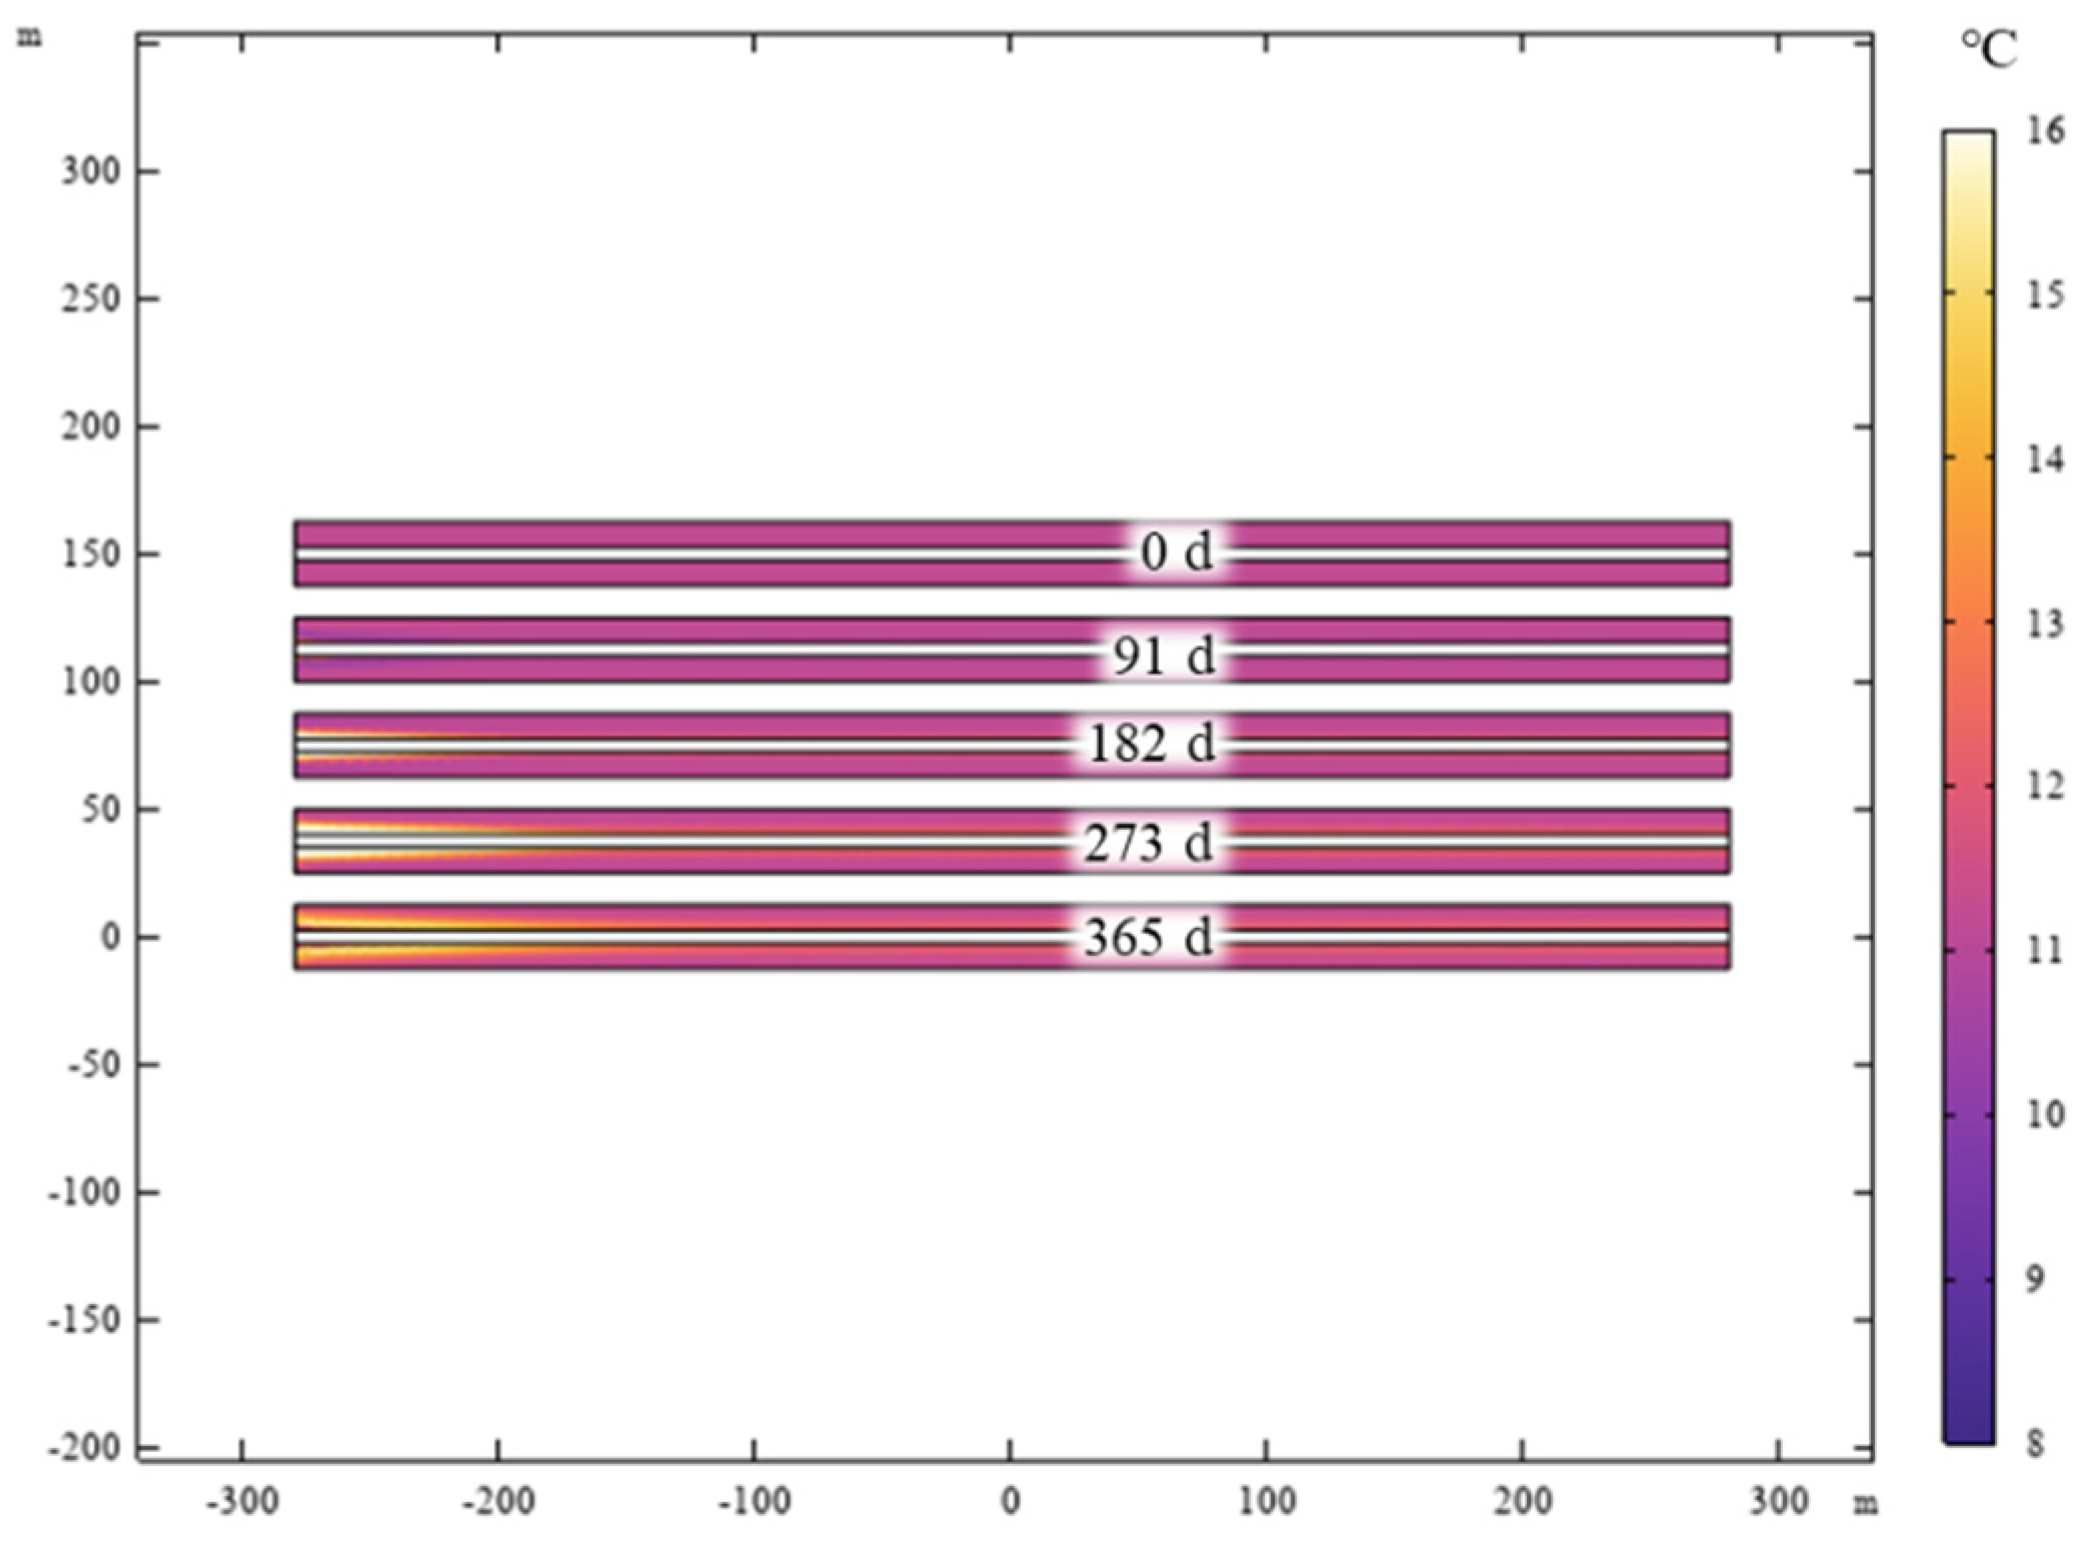
Figure 5.
Temperature distribution along the underground air tunnel.
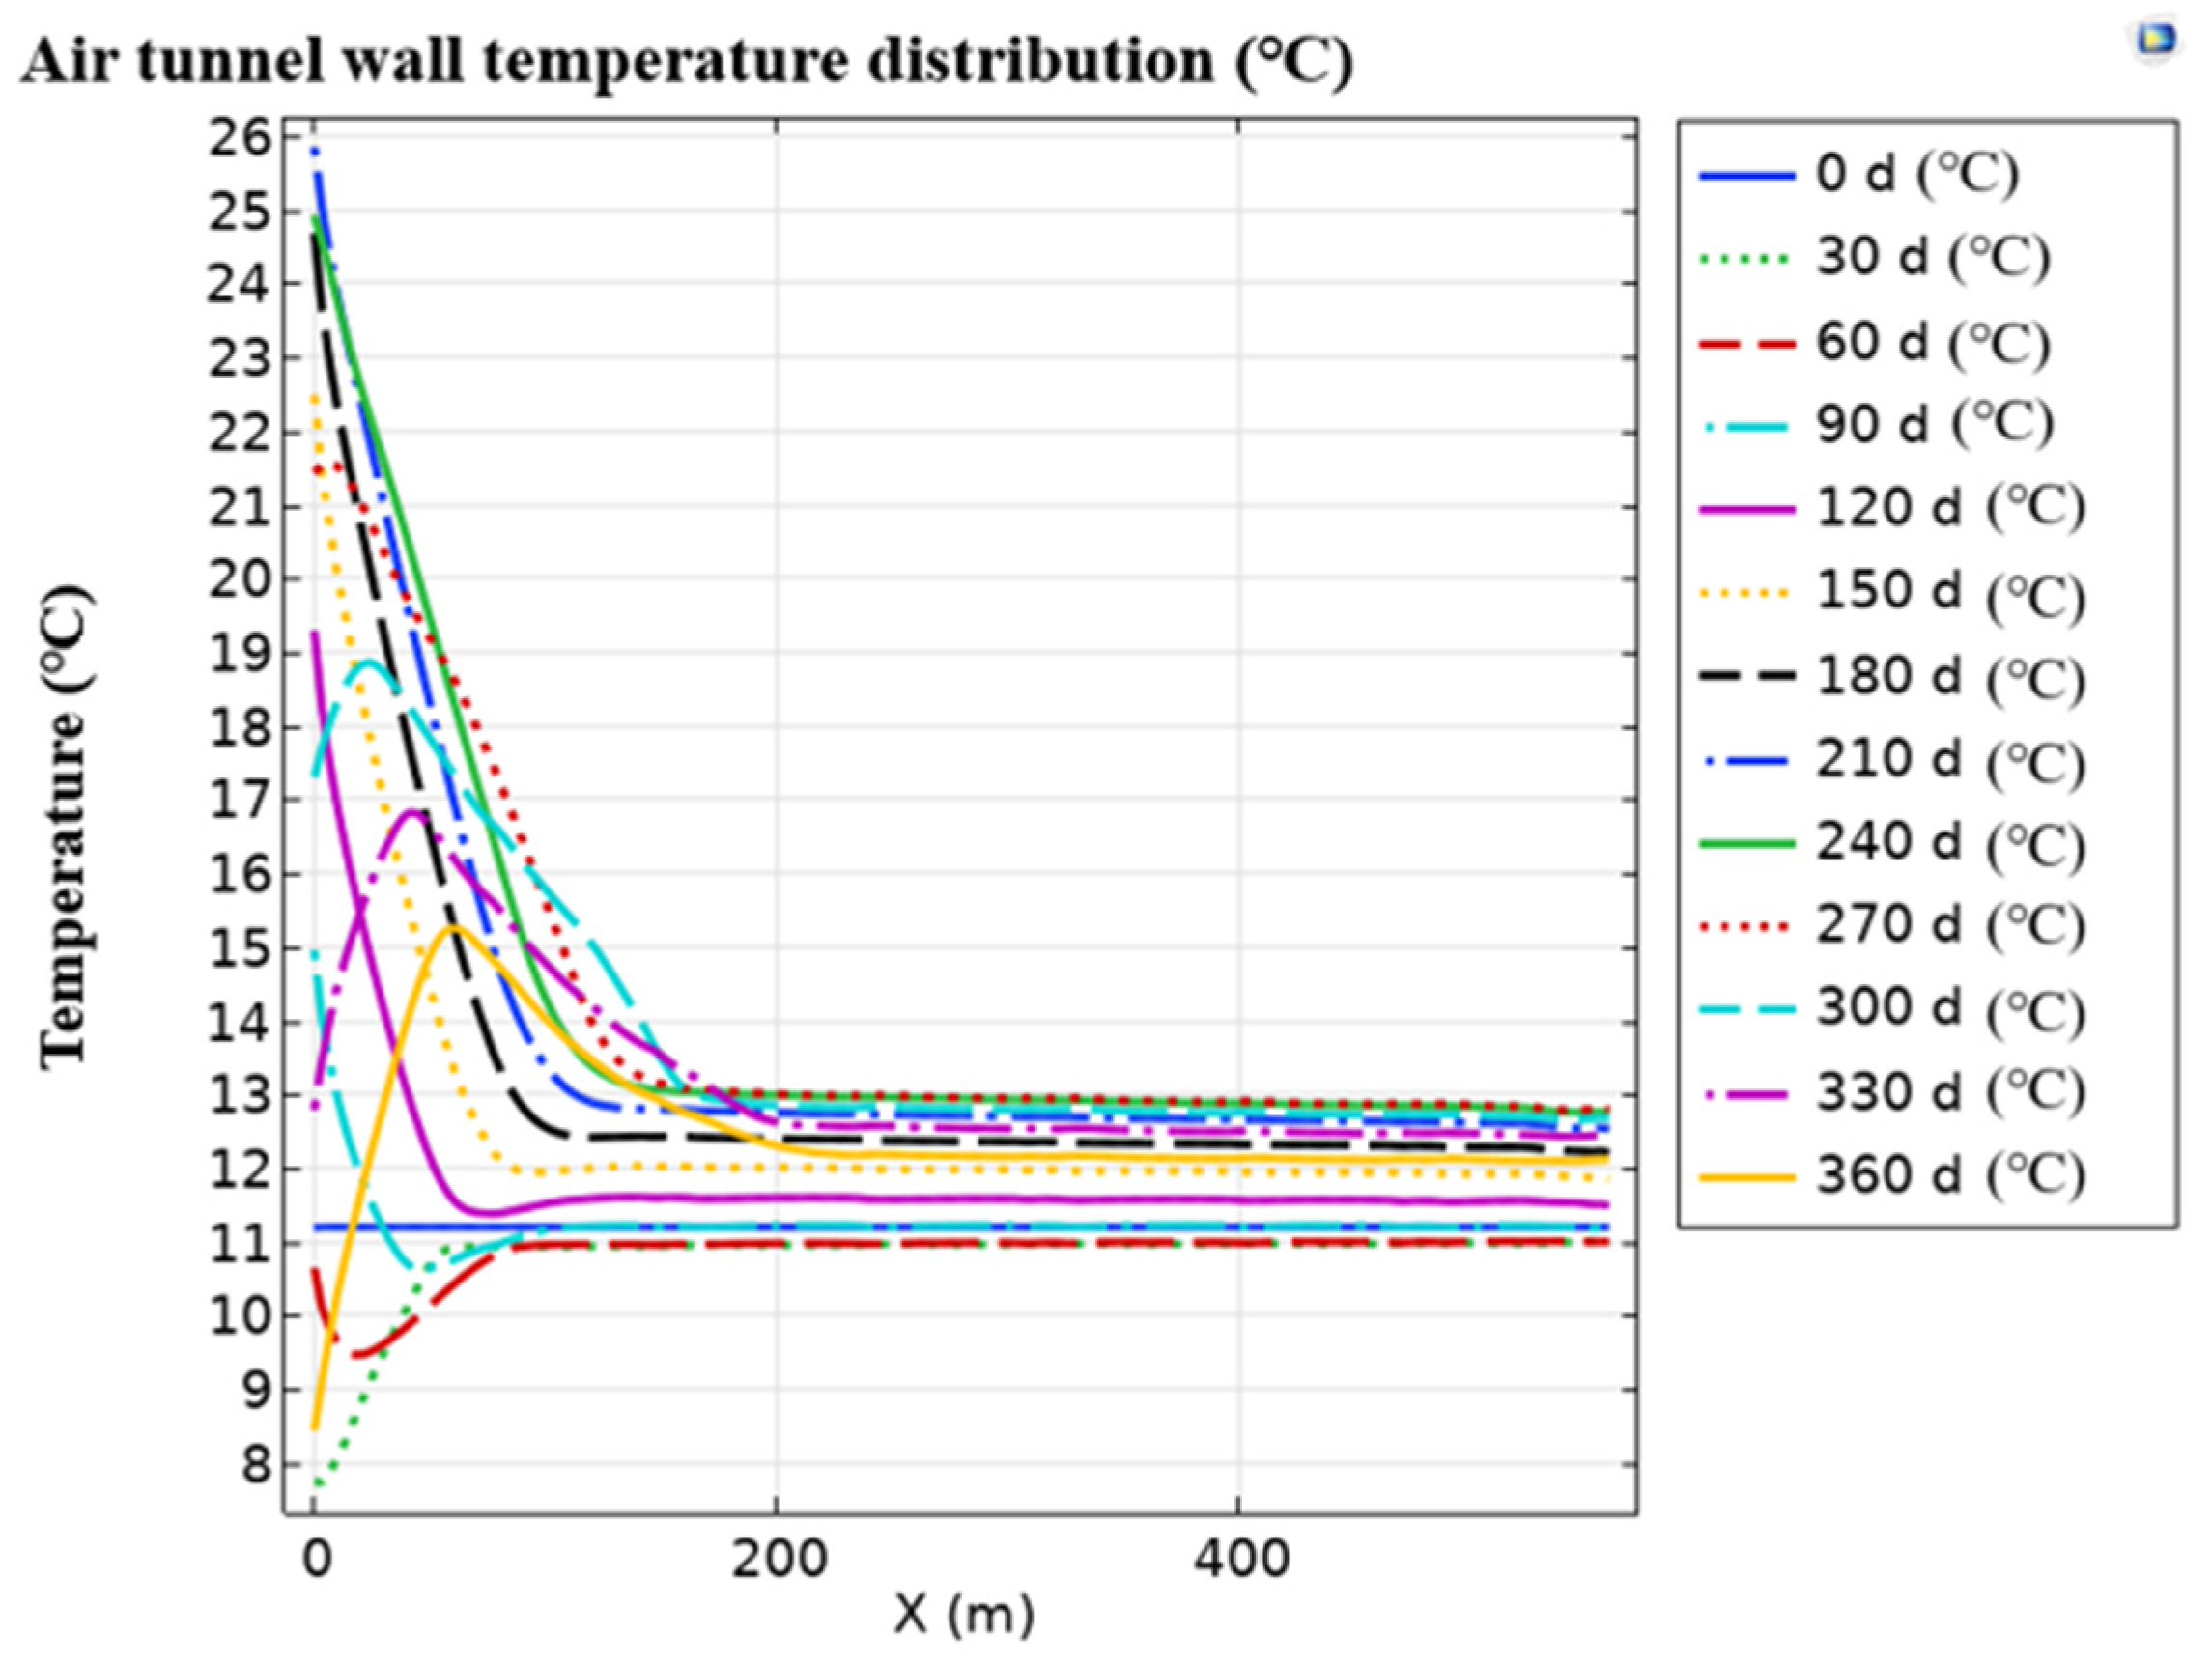
Figure 6.
Distribution of relative humidity along the underground air tunnel.
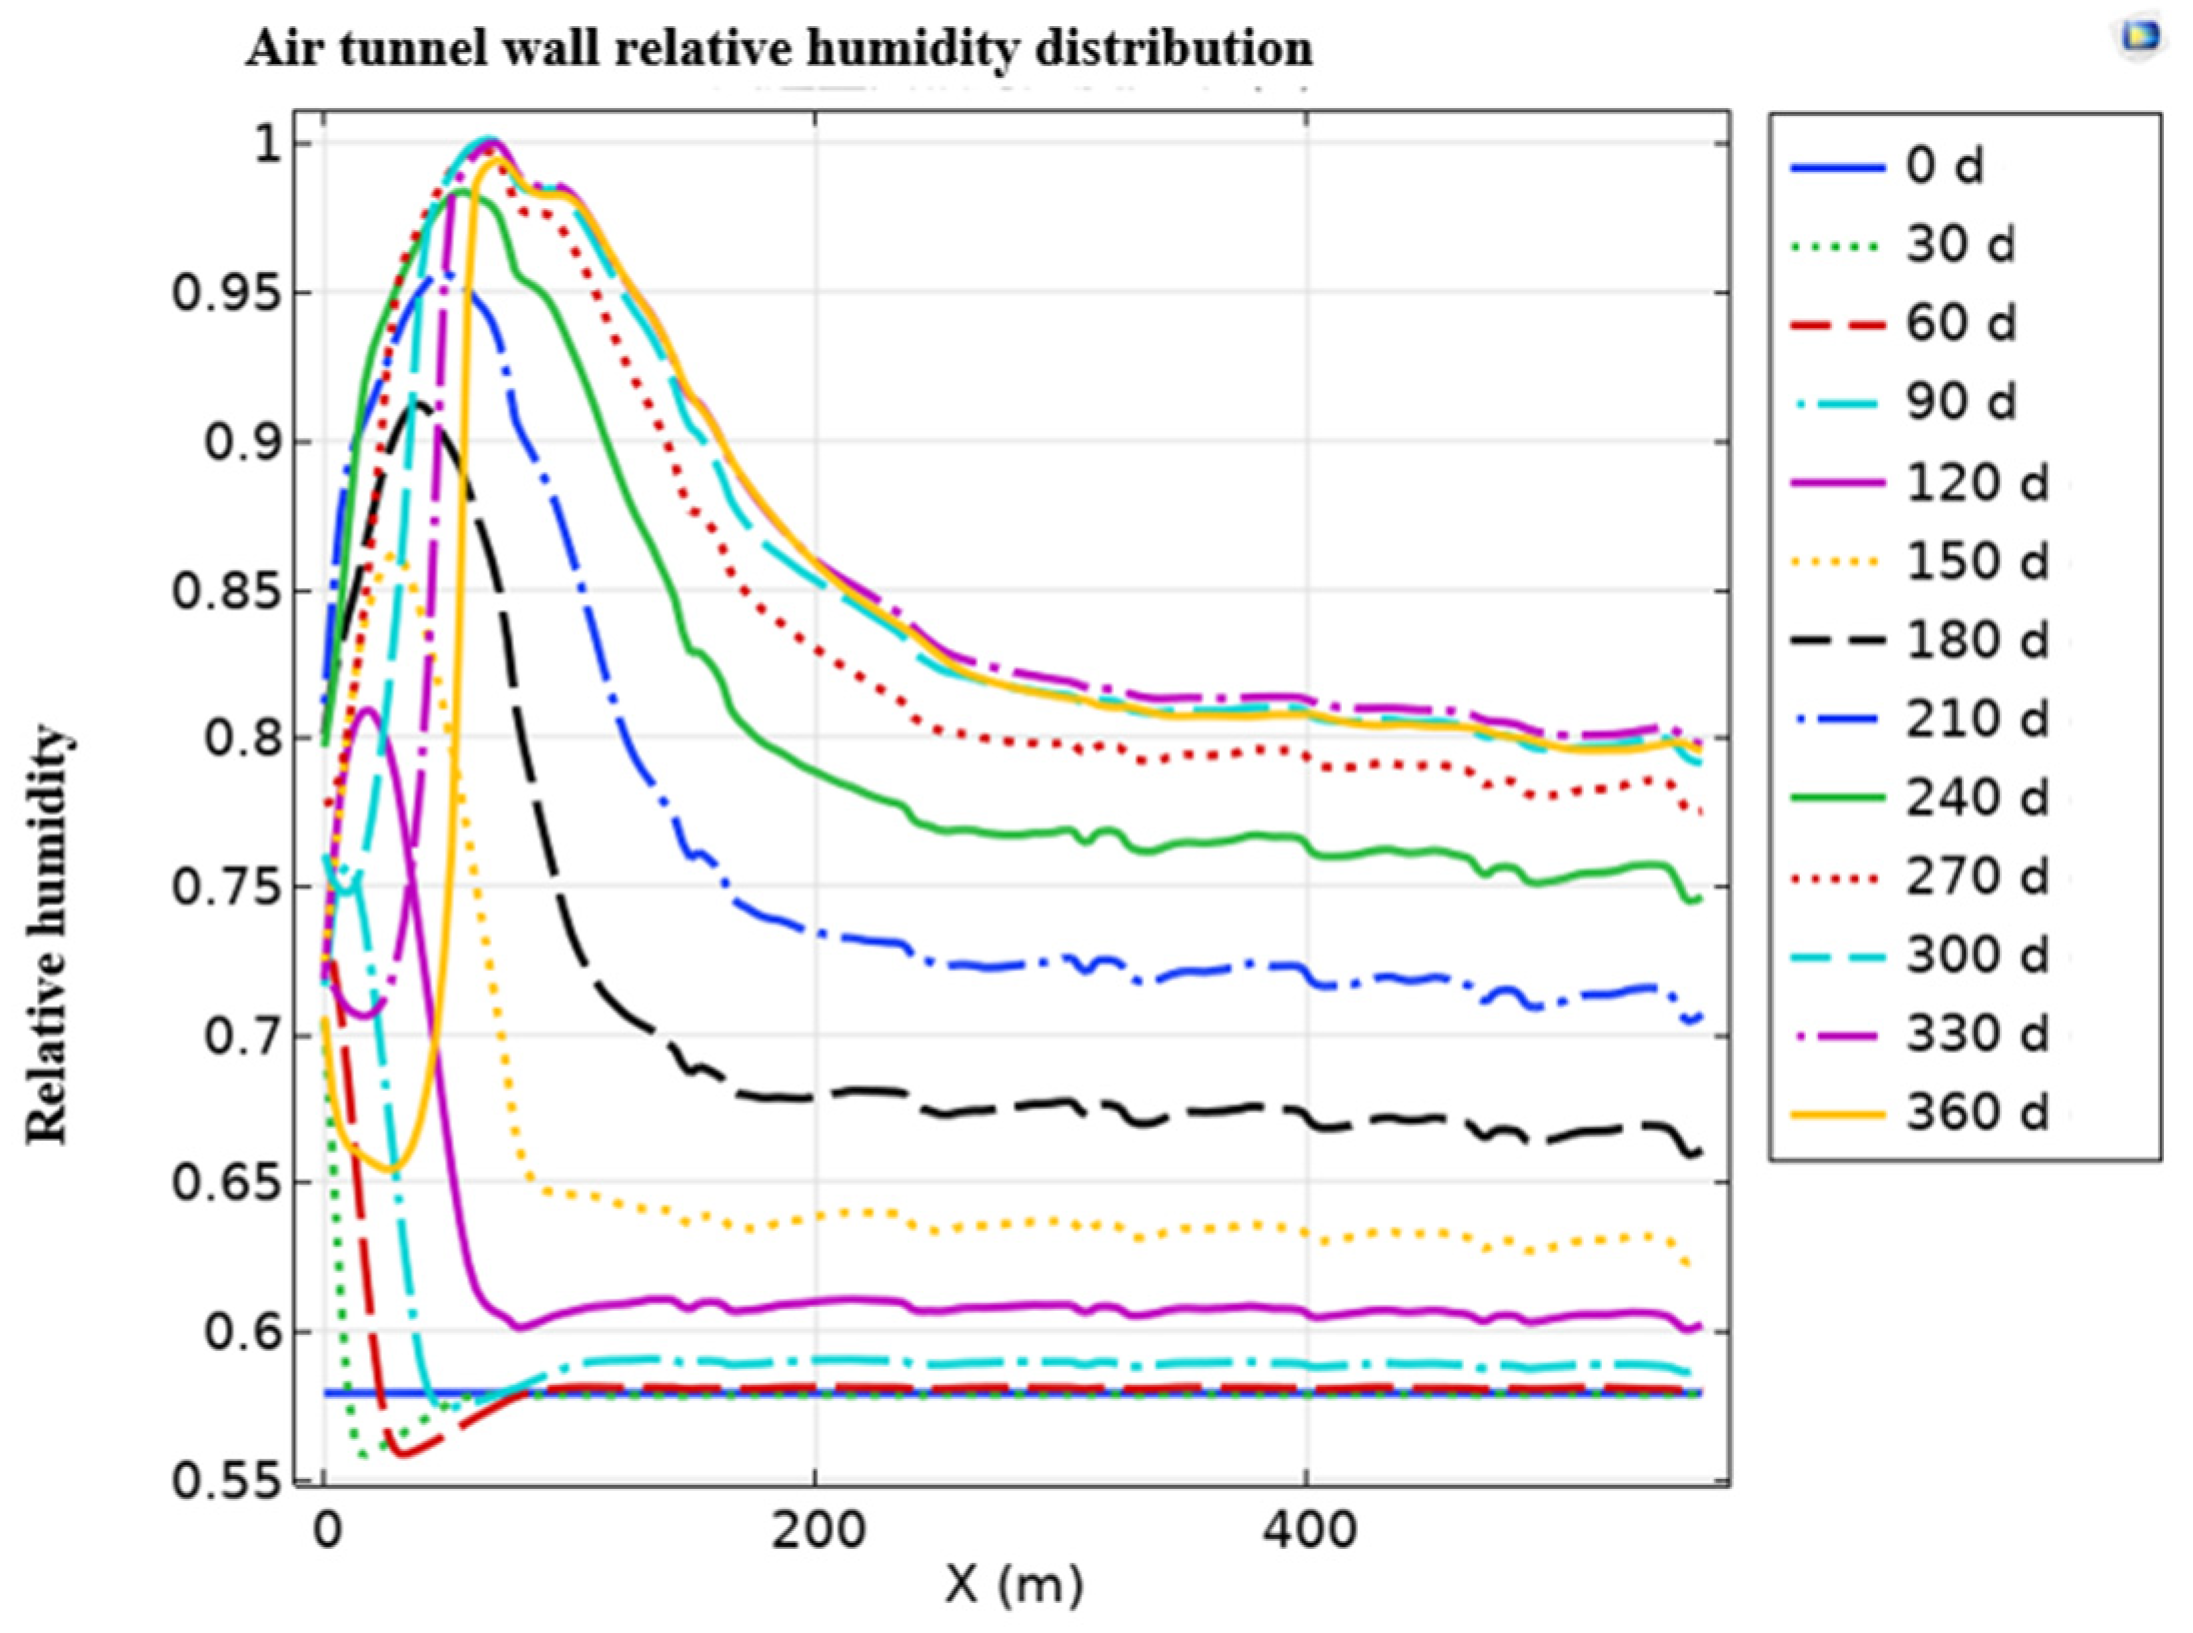
Figure 7.
Variation of heat flux along the underground air tunnel.
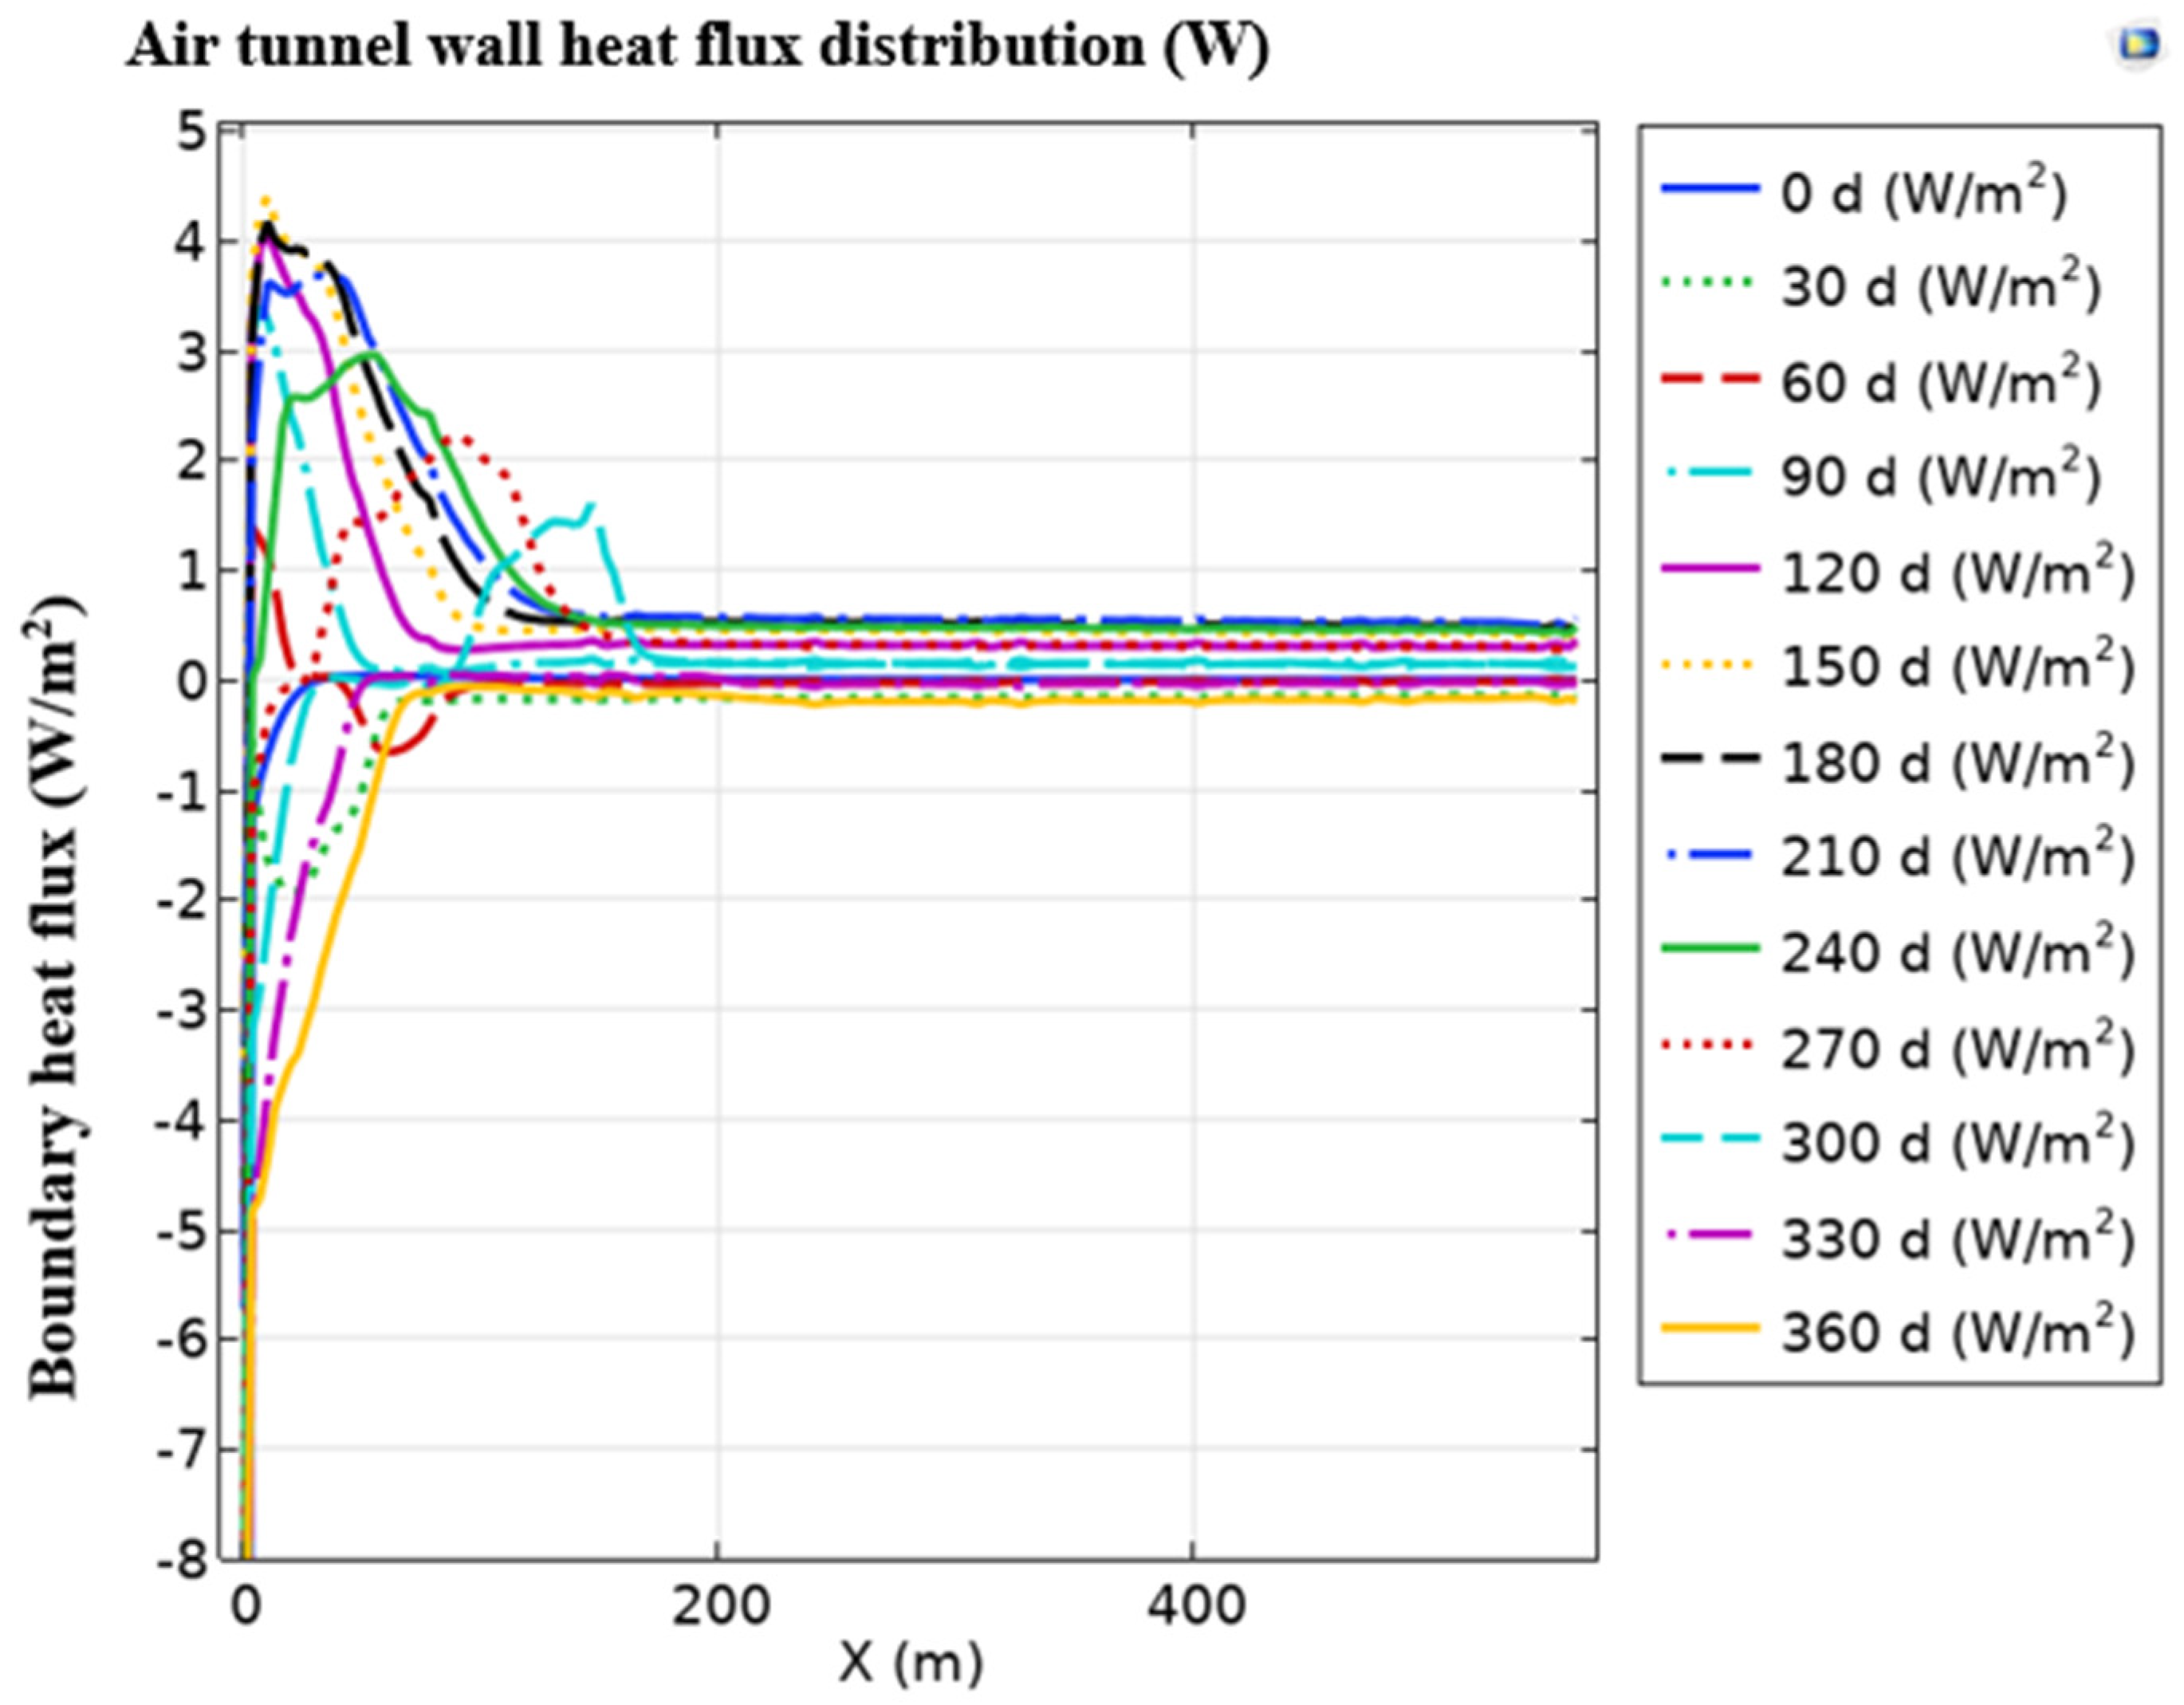
Figure 8.
Variation of moisture flux along the underground air tunnel.
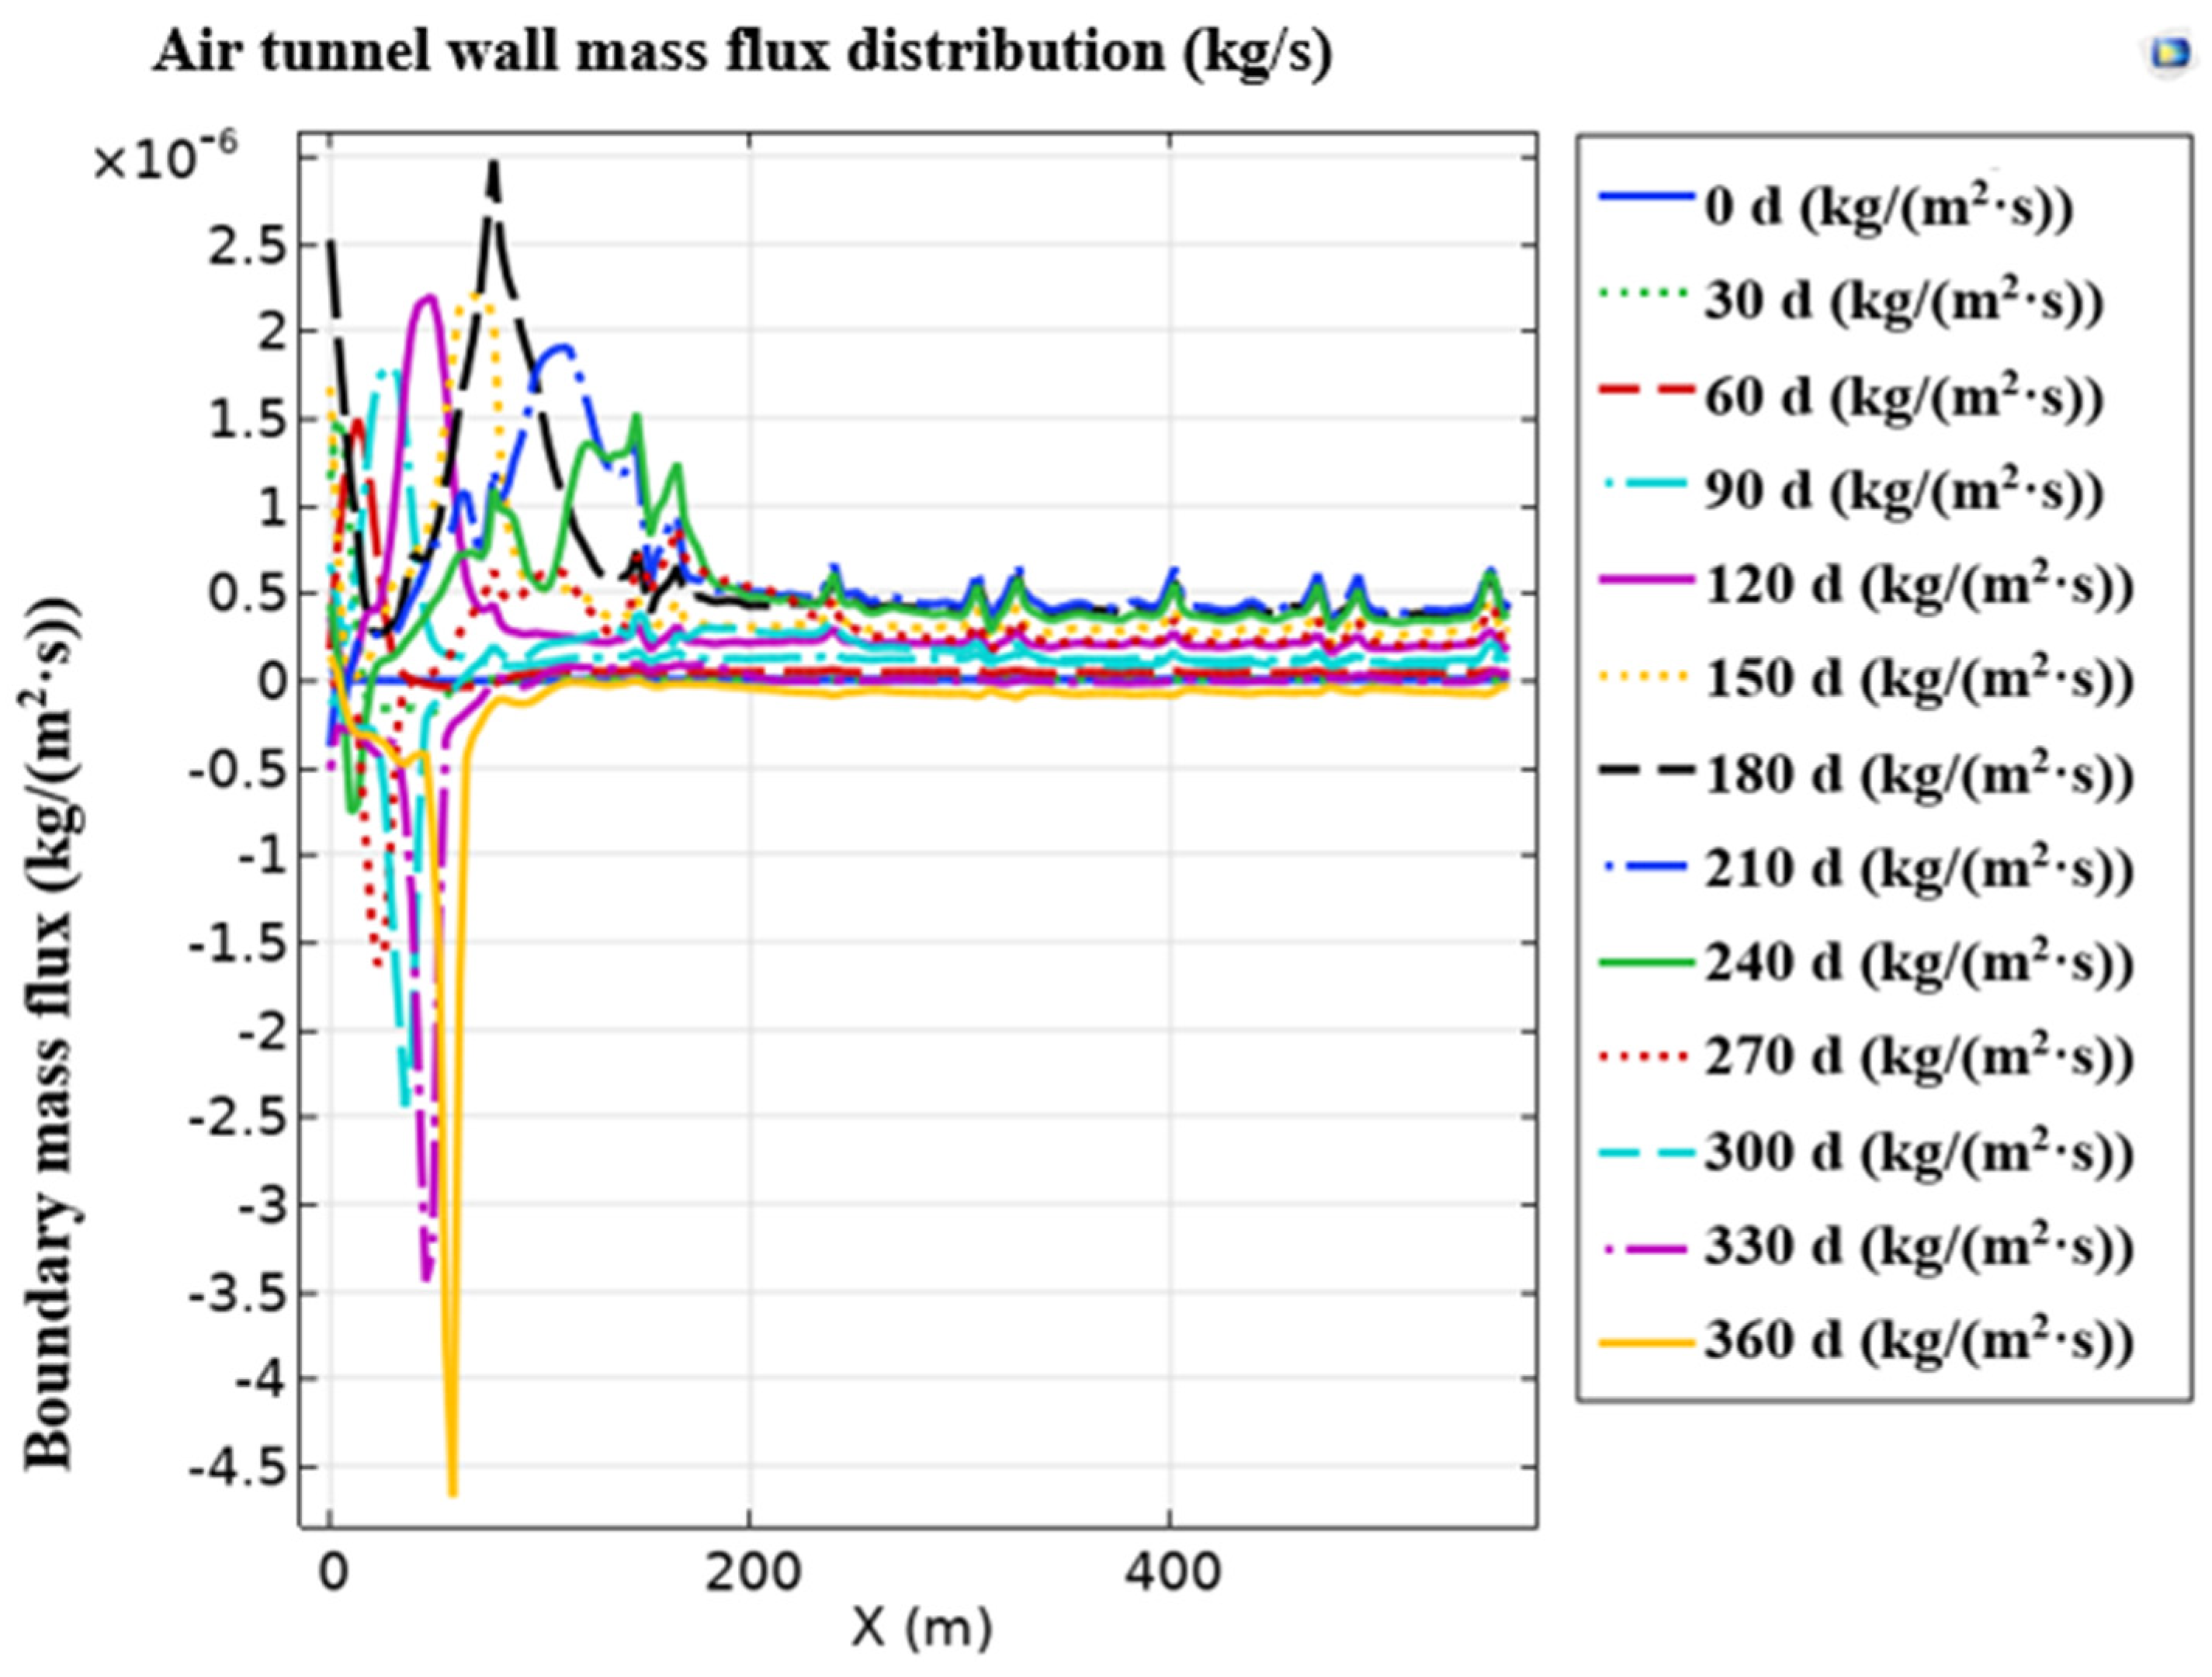
Figure 9.
Interannual variation of the average heat flux on the underground air tunnel wall surface.
Figure 9.
Interannual variation of the average heat flux on the underground air tunnel wall surface.
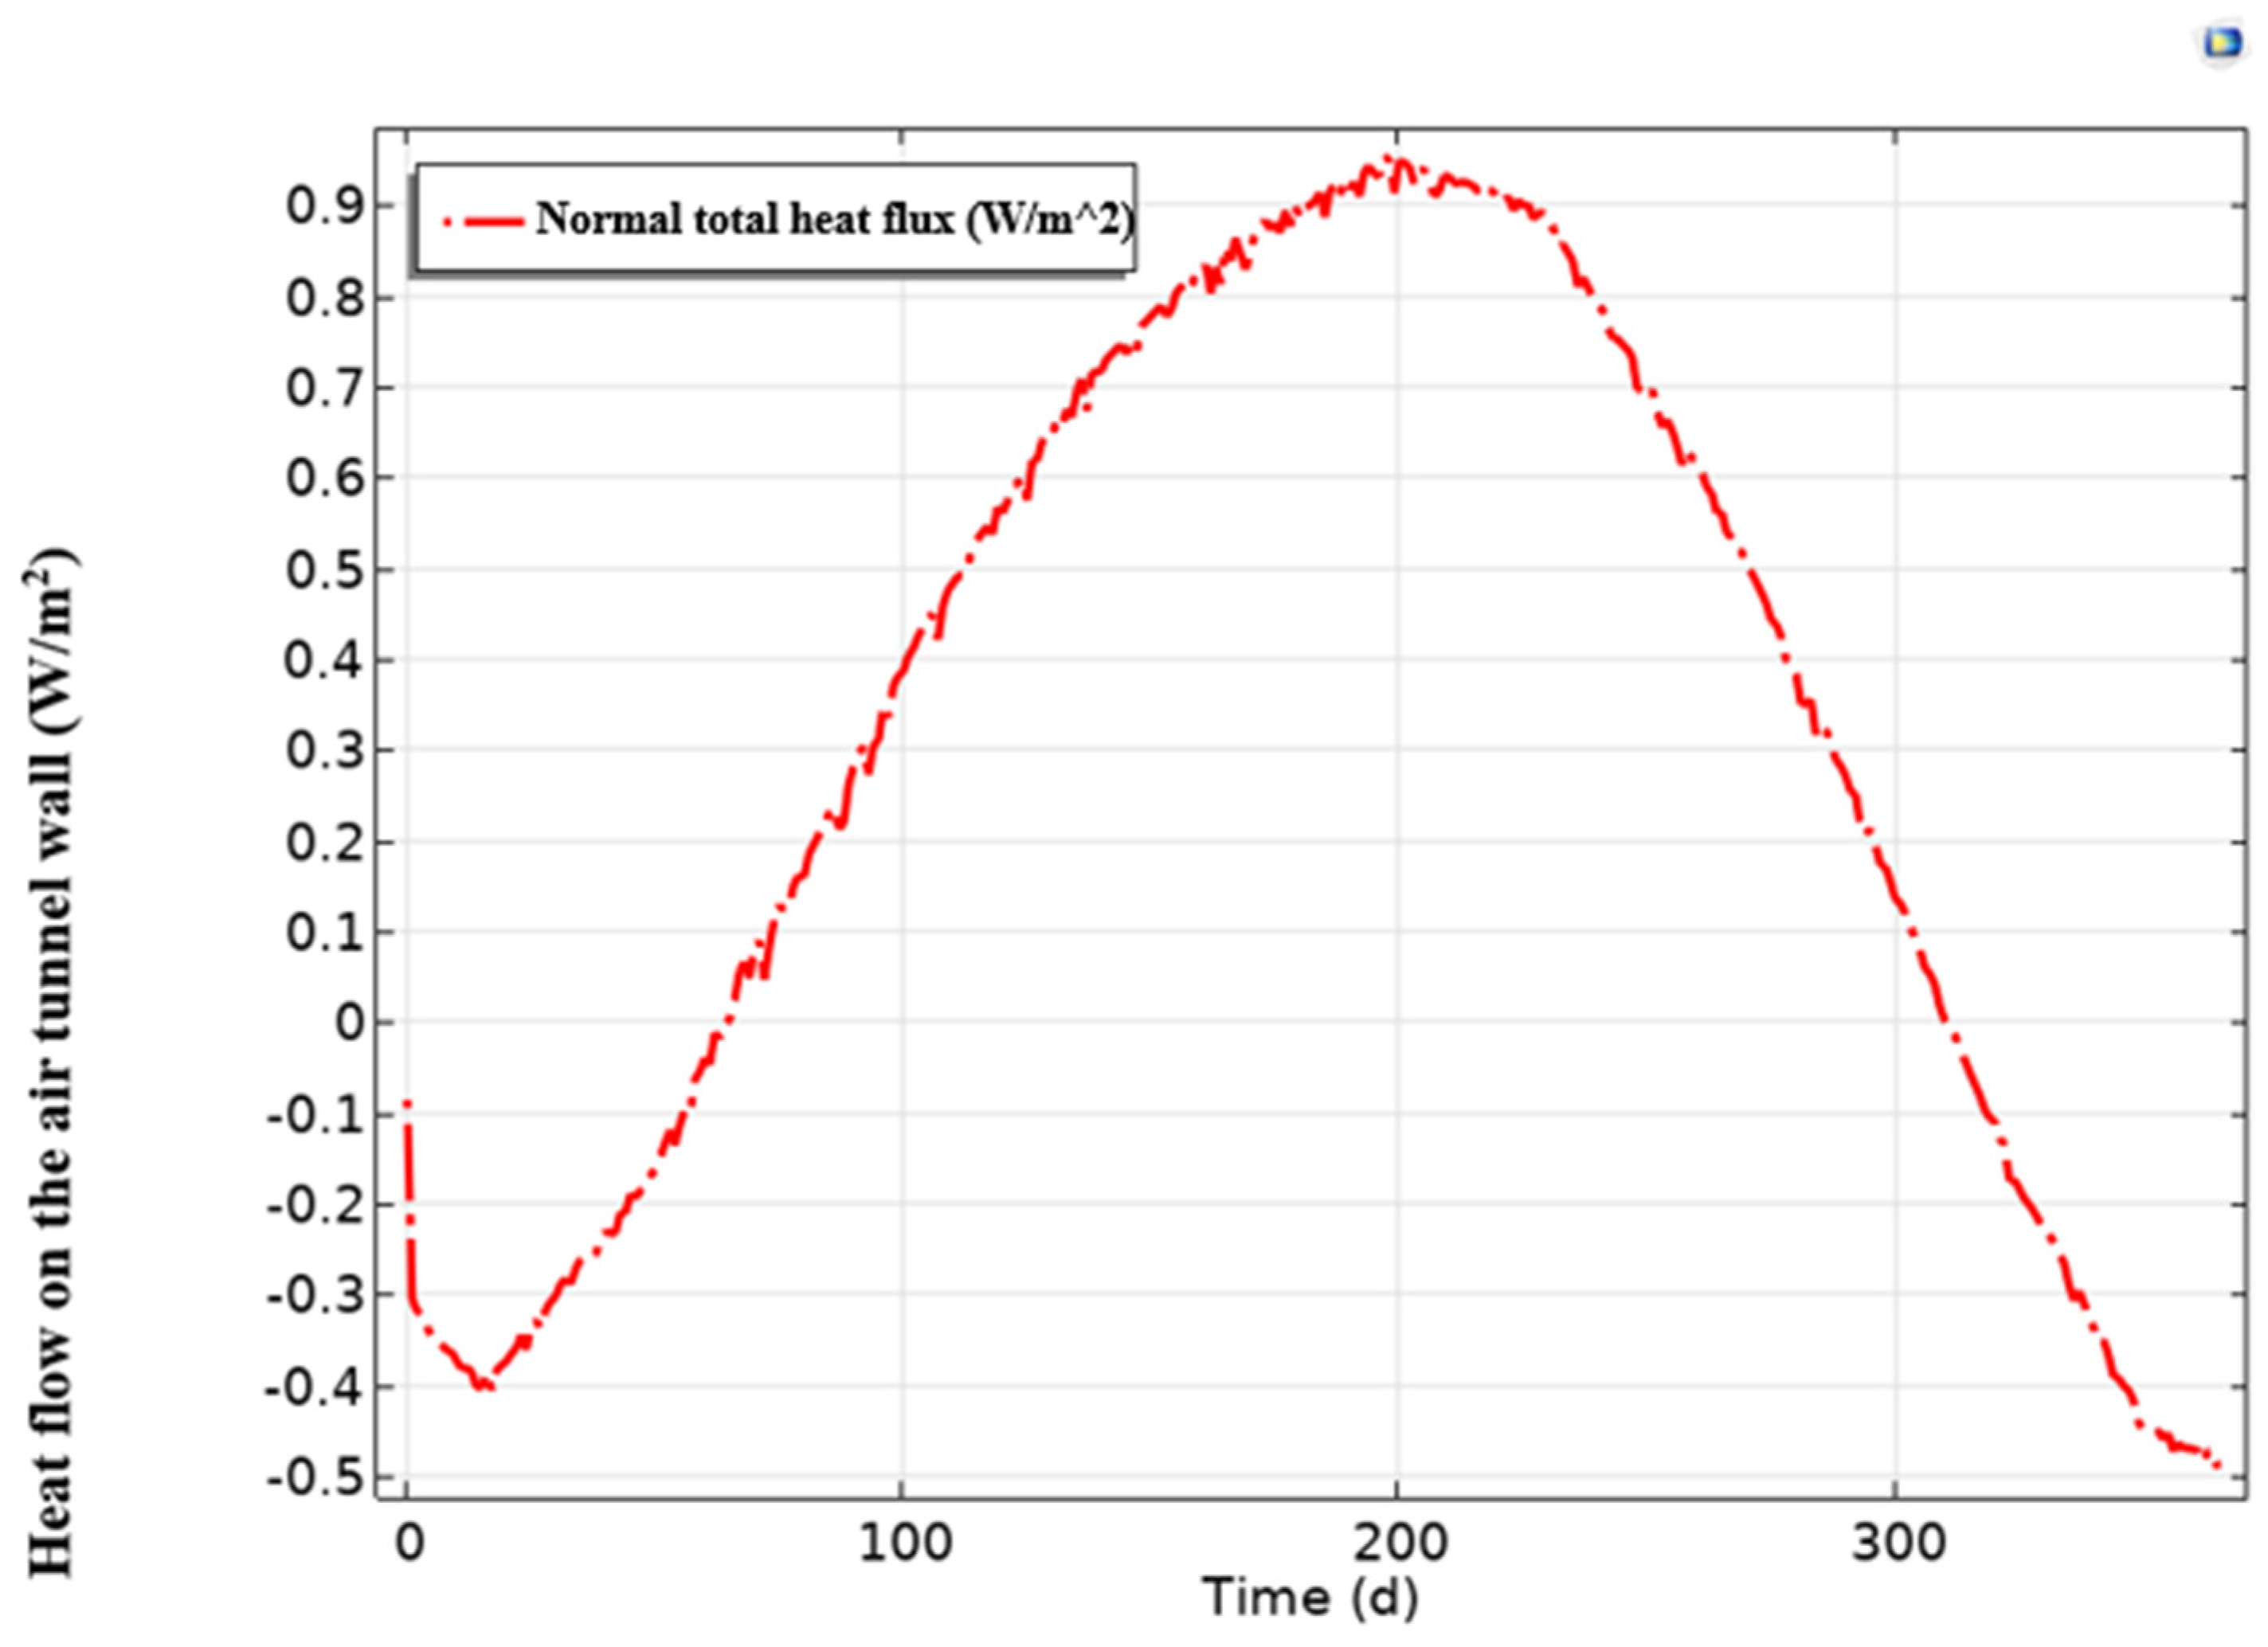
Figure 10.
Interannual variation of the average water vapor flux on the underground air tunnel wall surface.
Figure 10.
Interannual variation of the average water vapor flux on the underground air tunnel wall surface.
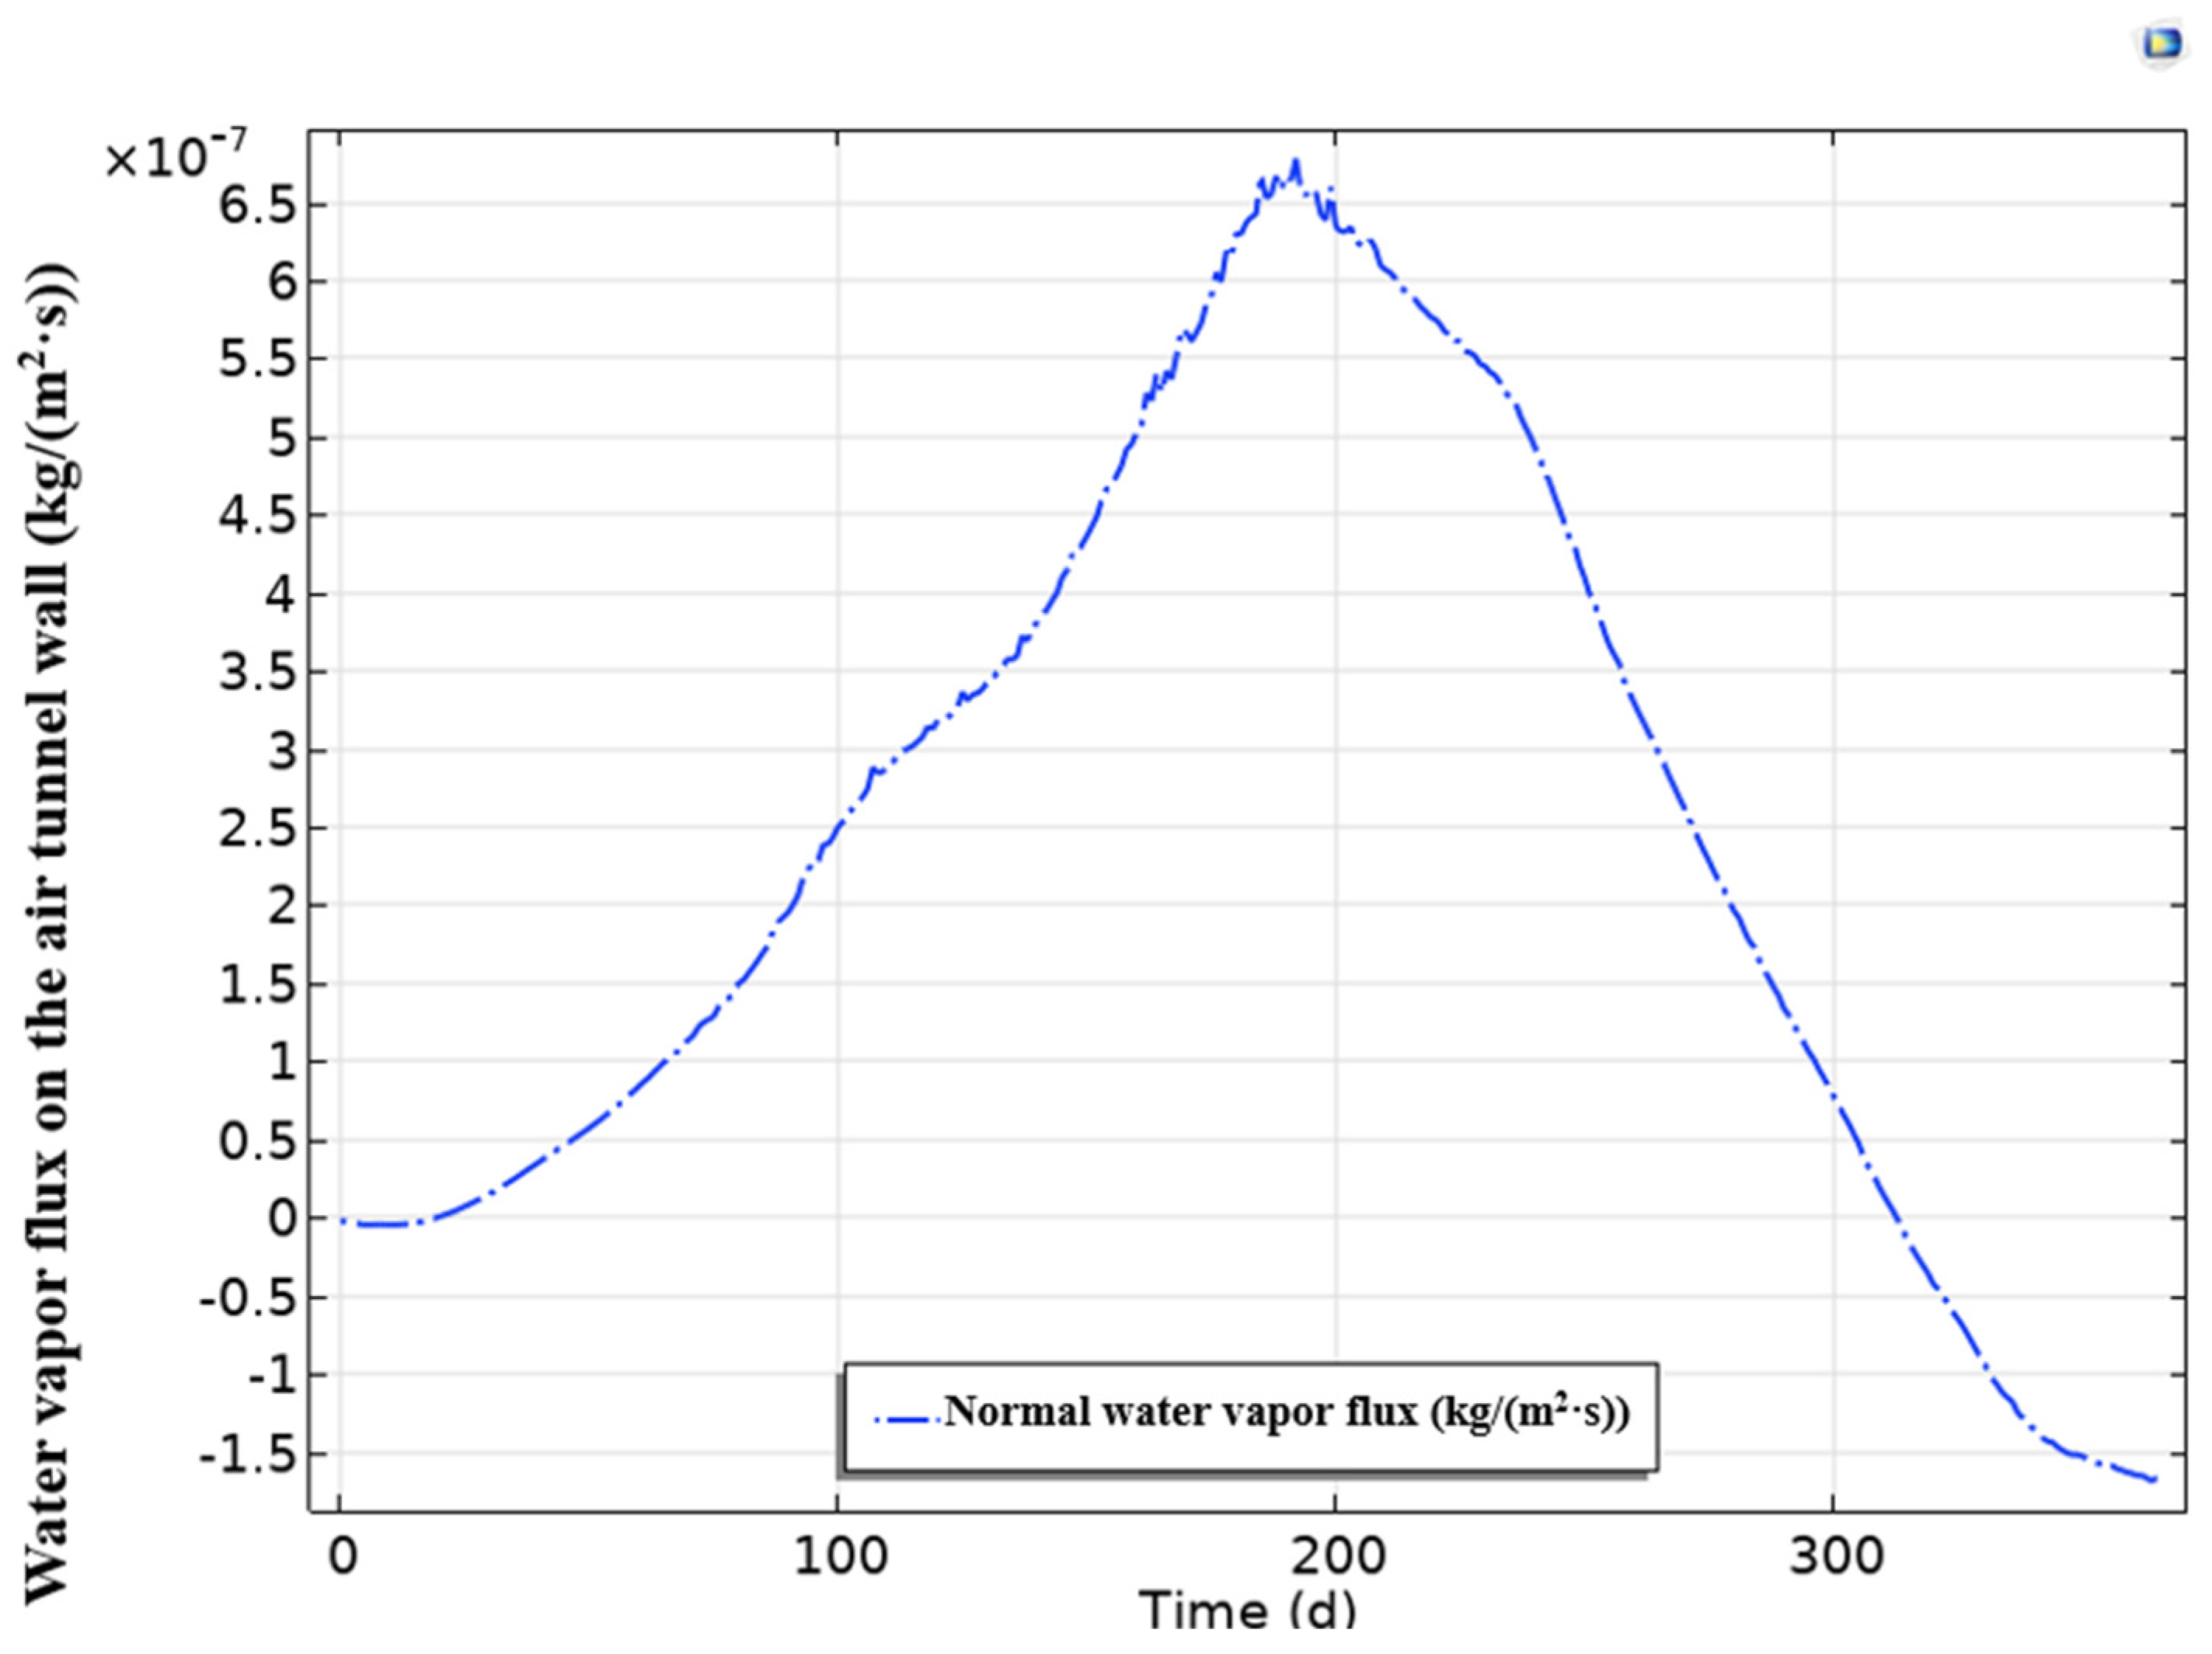
Figure 11.
Annual variation of inlet and outlet air temperature and temperature difference.
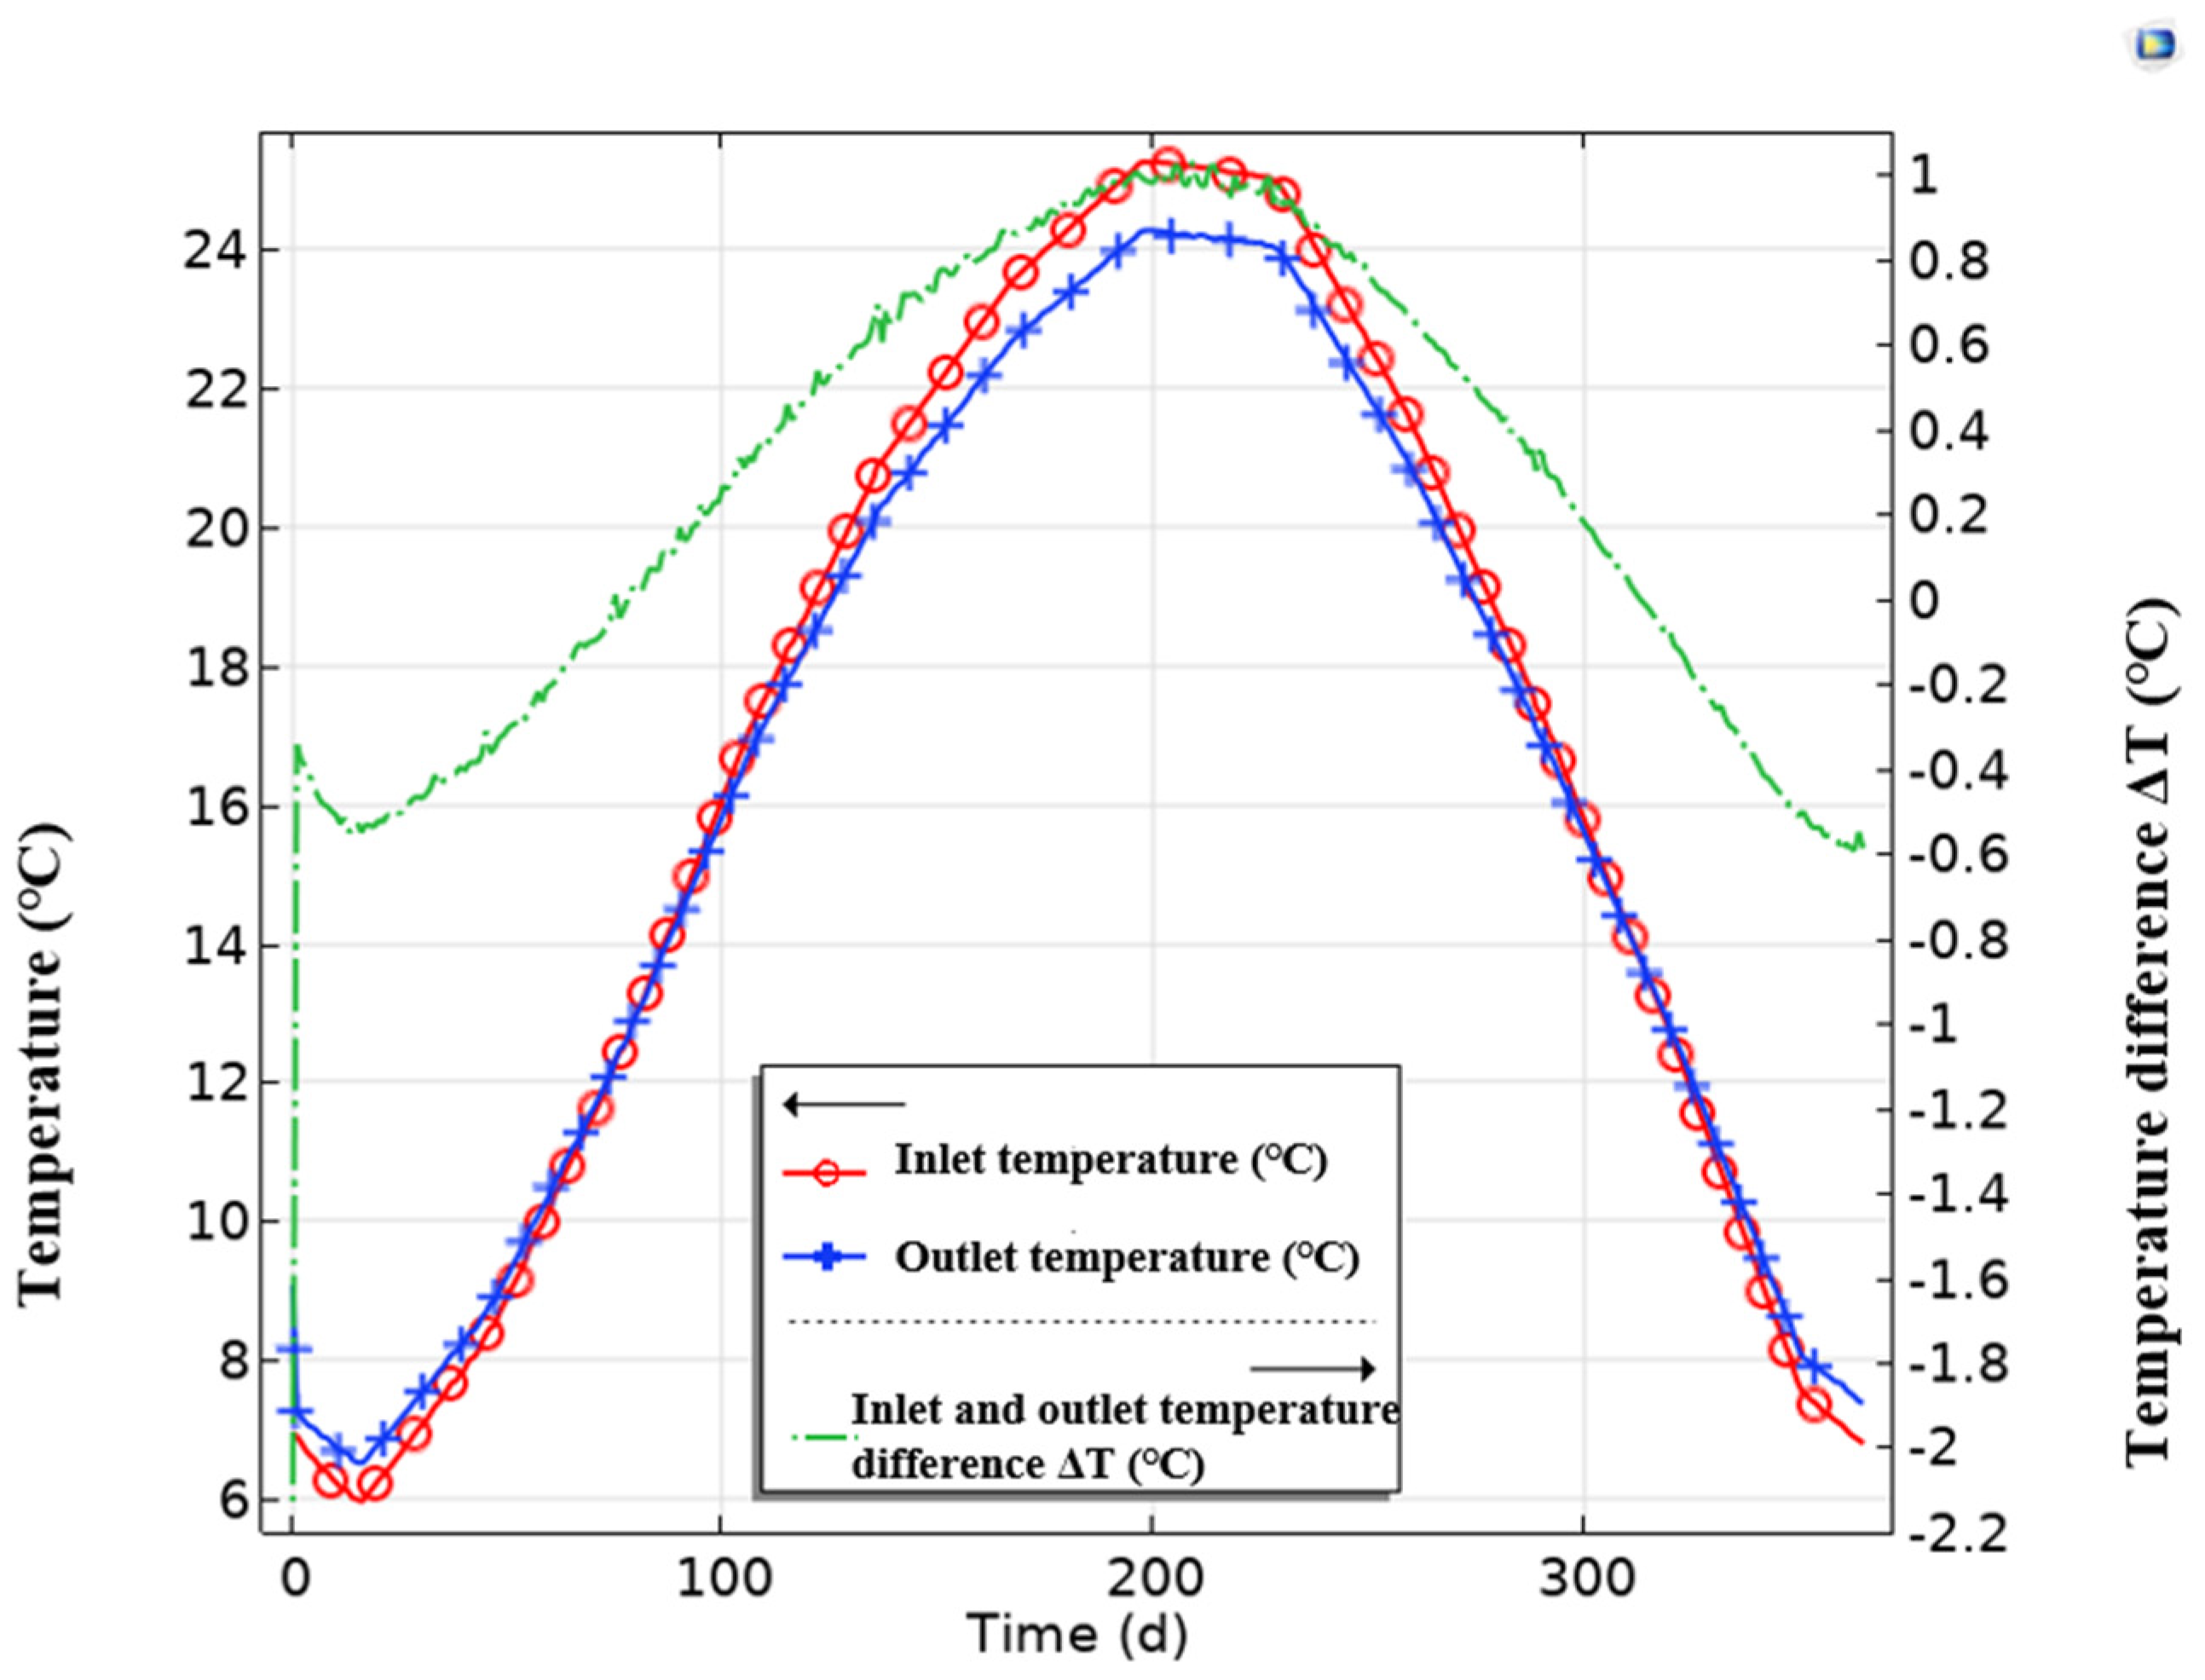
Figure 12.
Interannual variation of relative humidity and humidity difference of inlet and outlet.
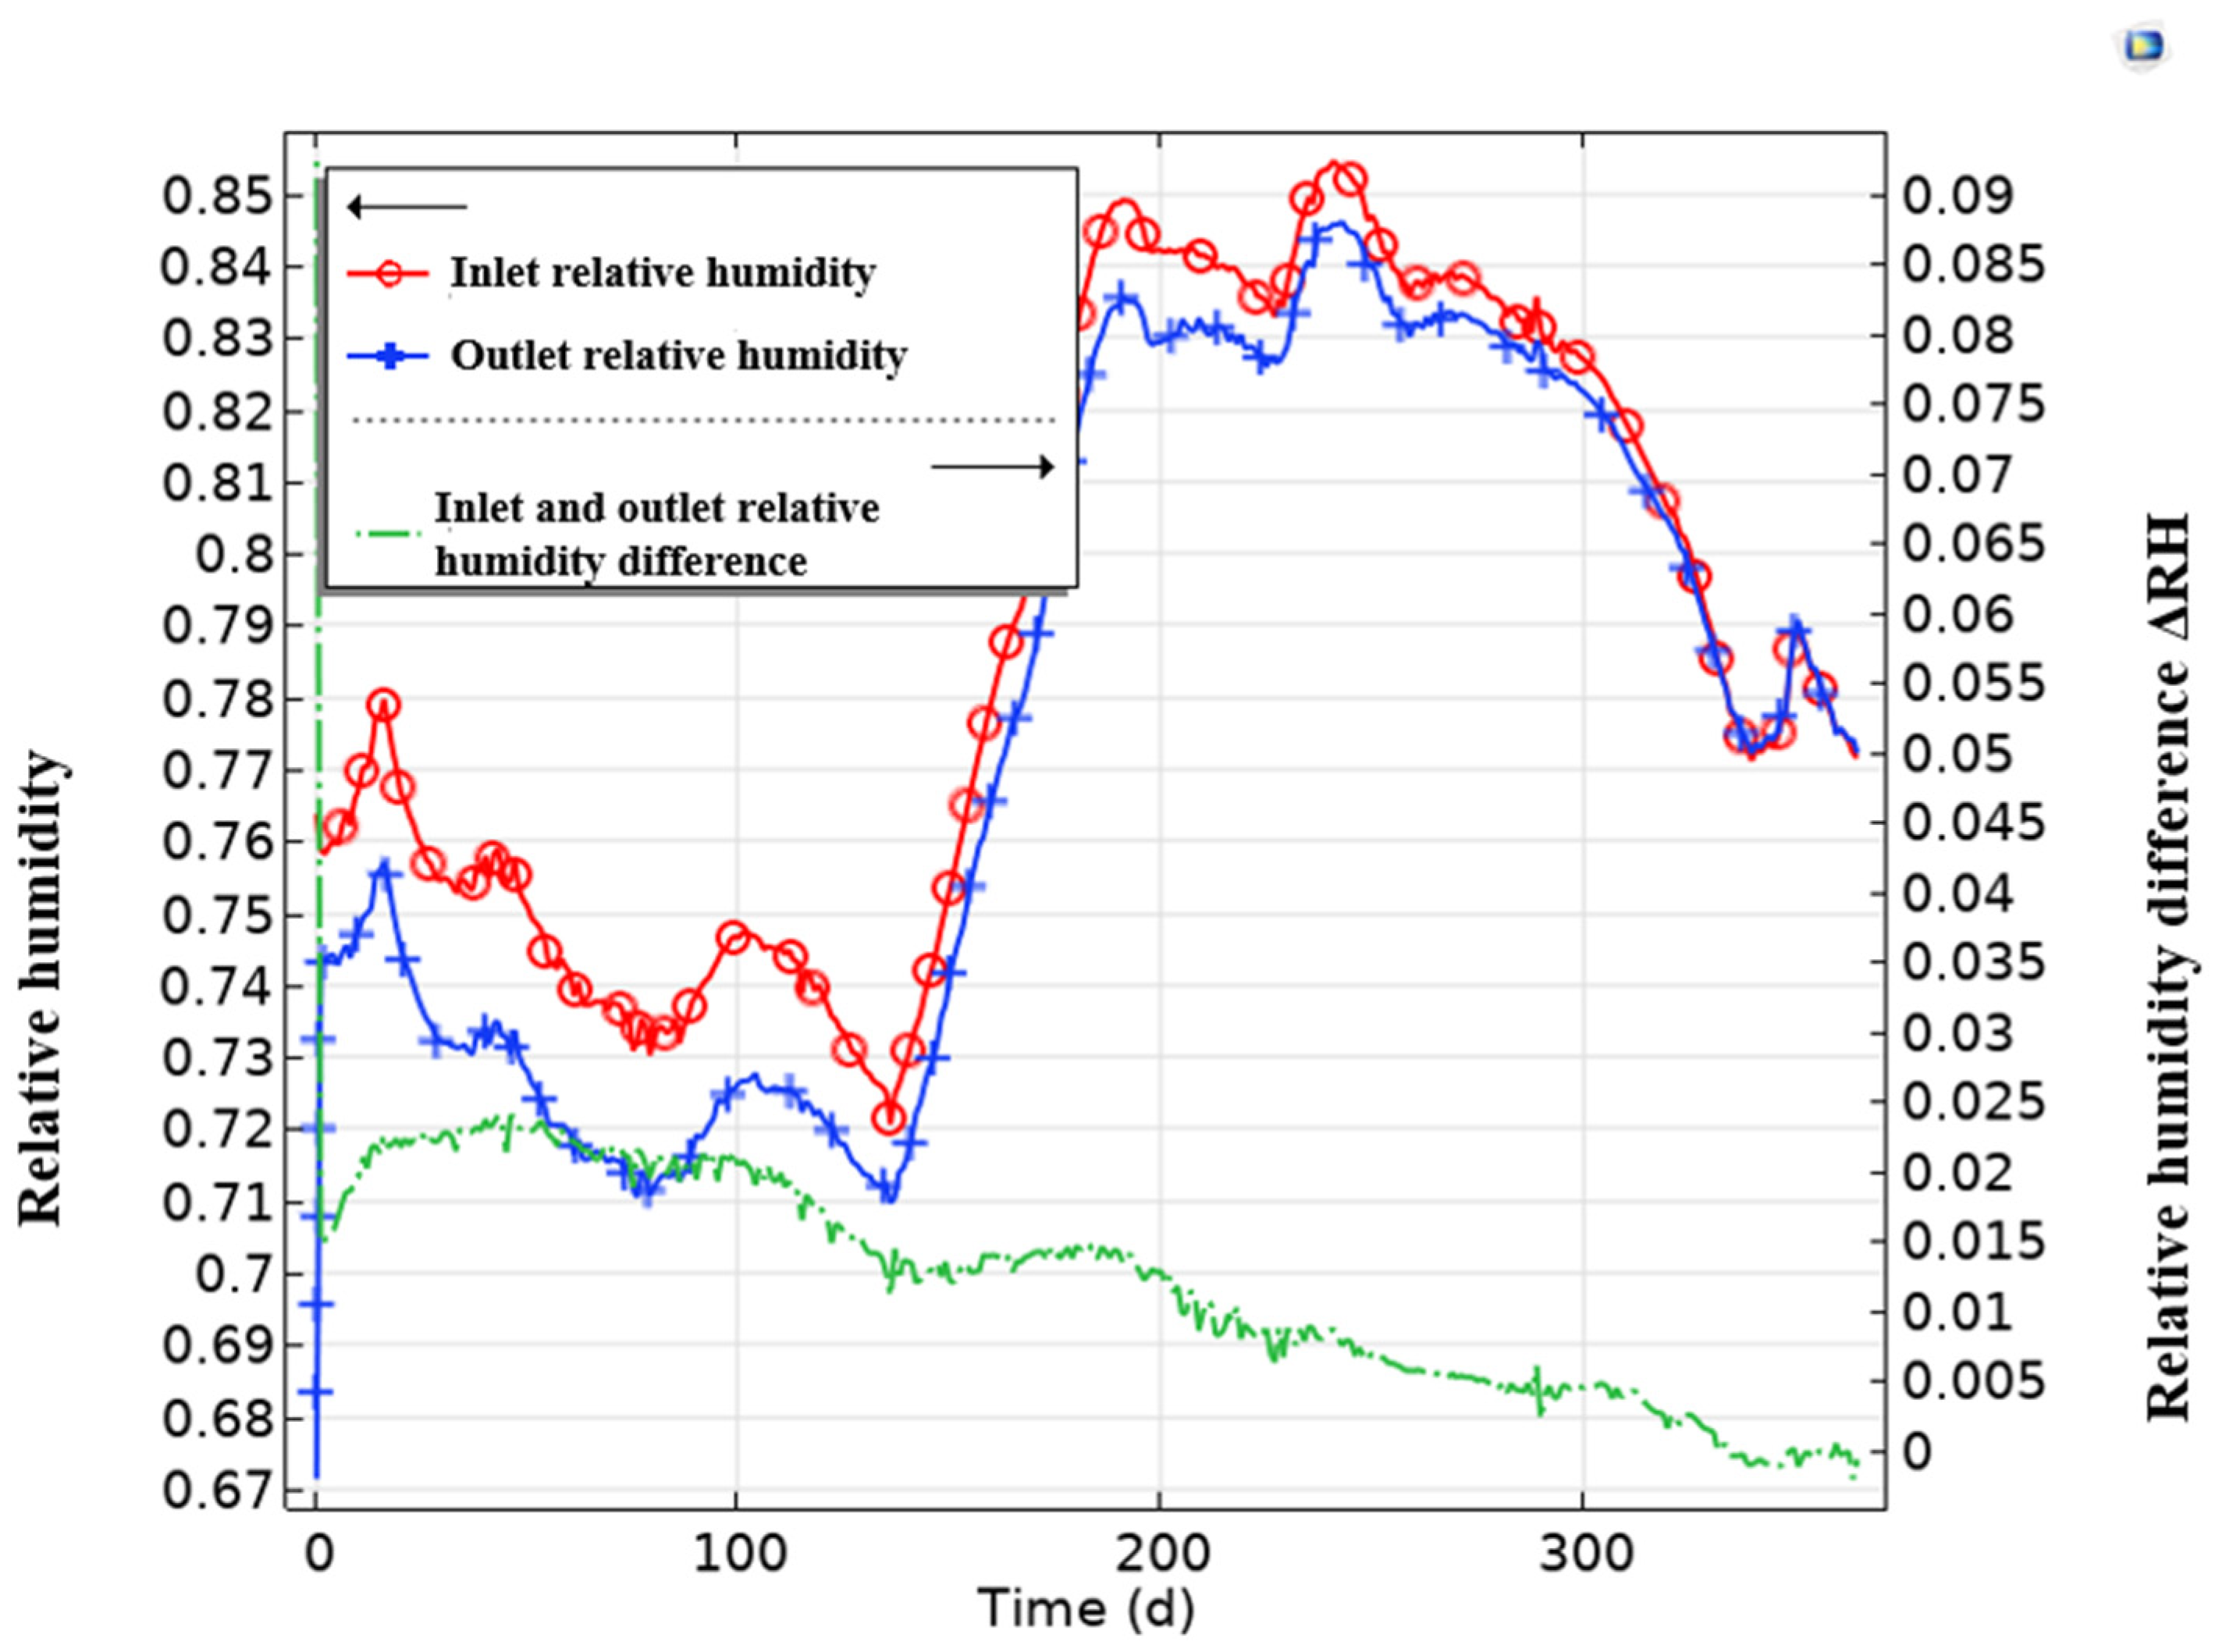
Figure 13.
Interannual variations of inlet and outlet air enthalpy and enthalpy difference.
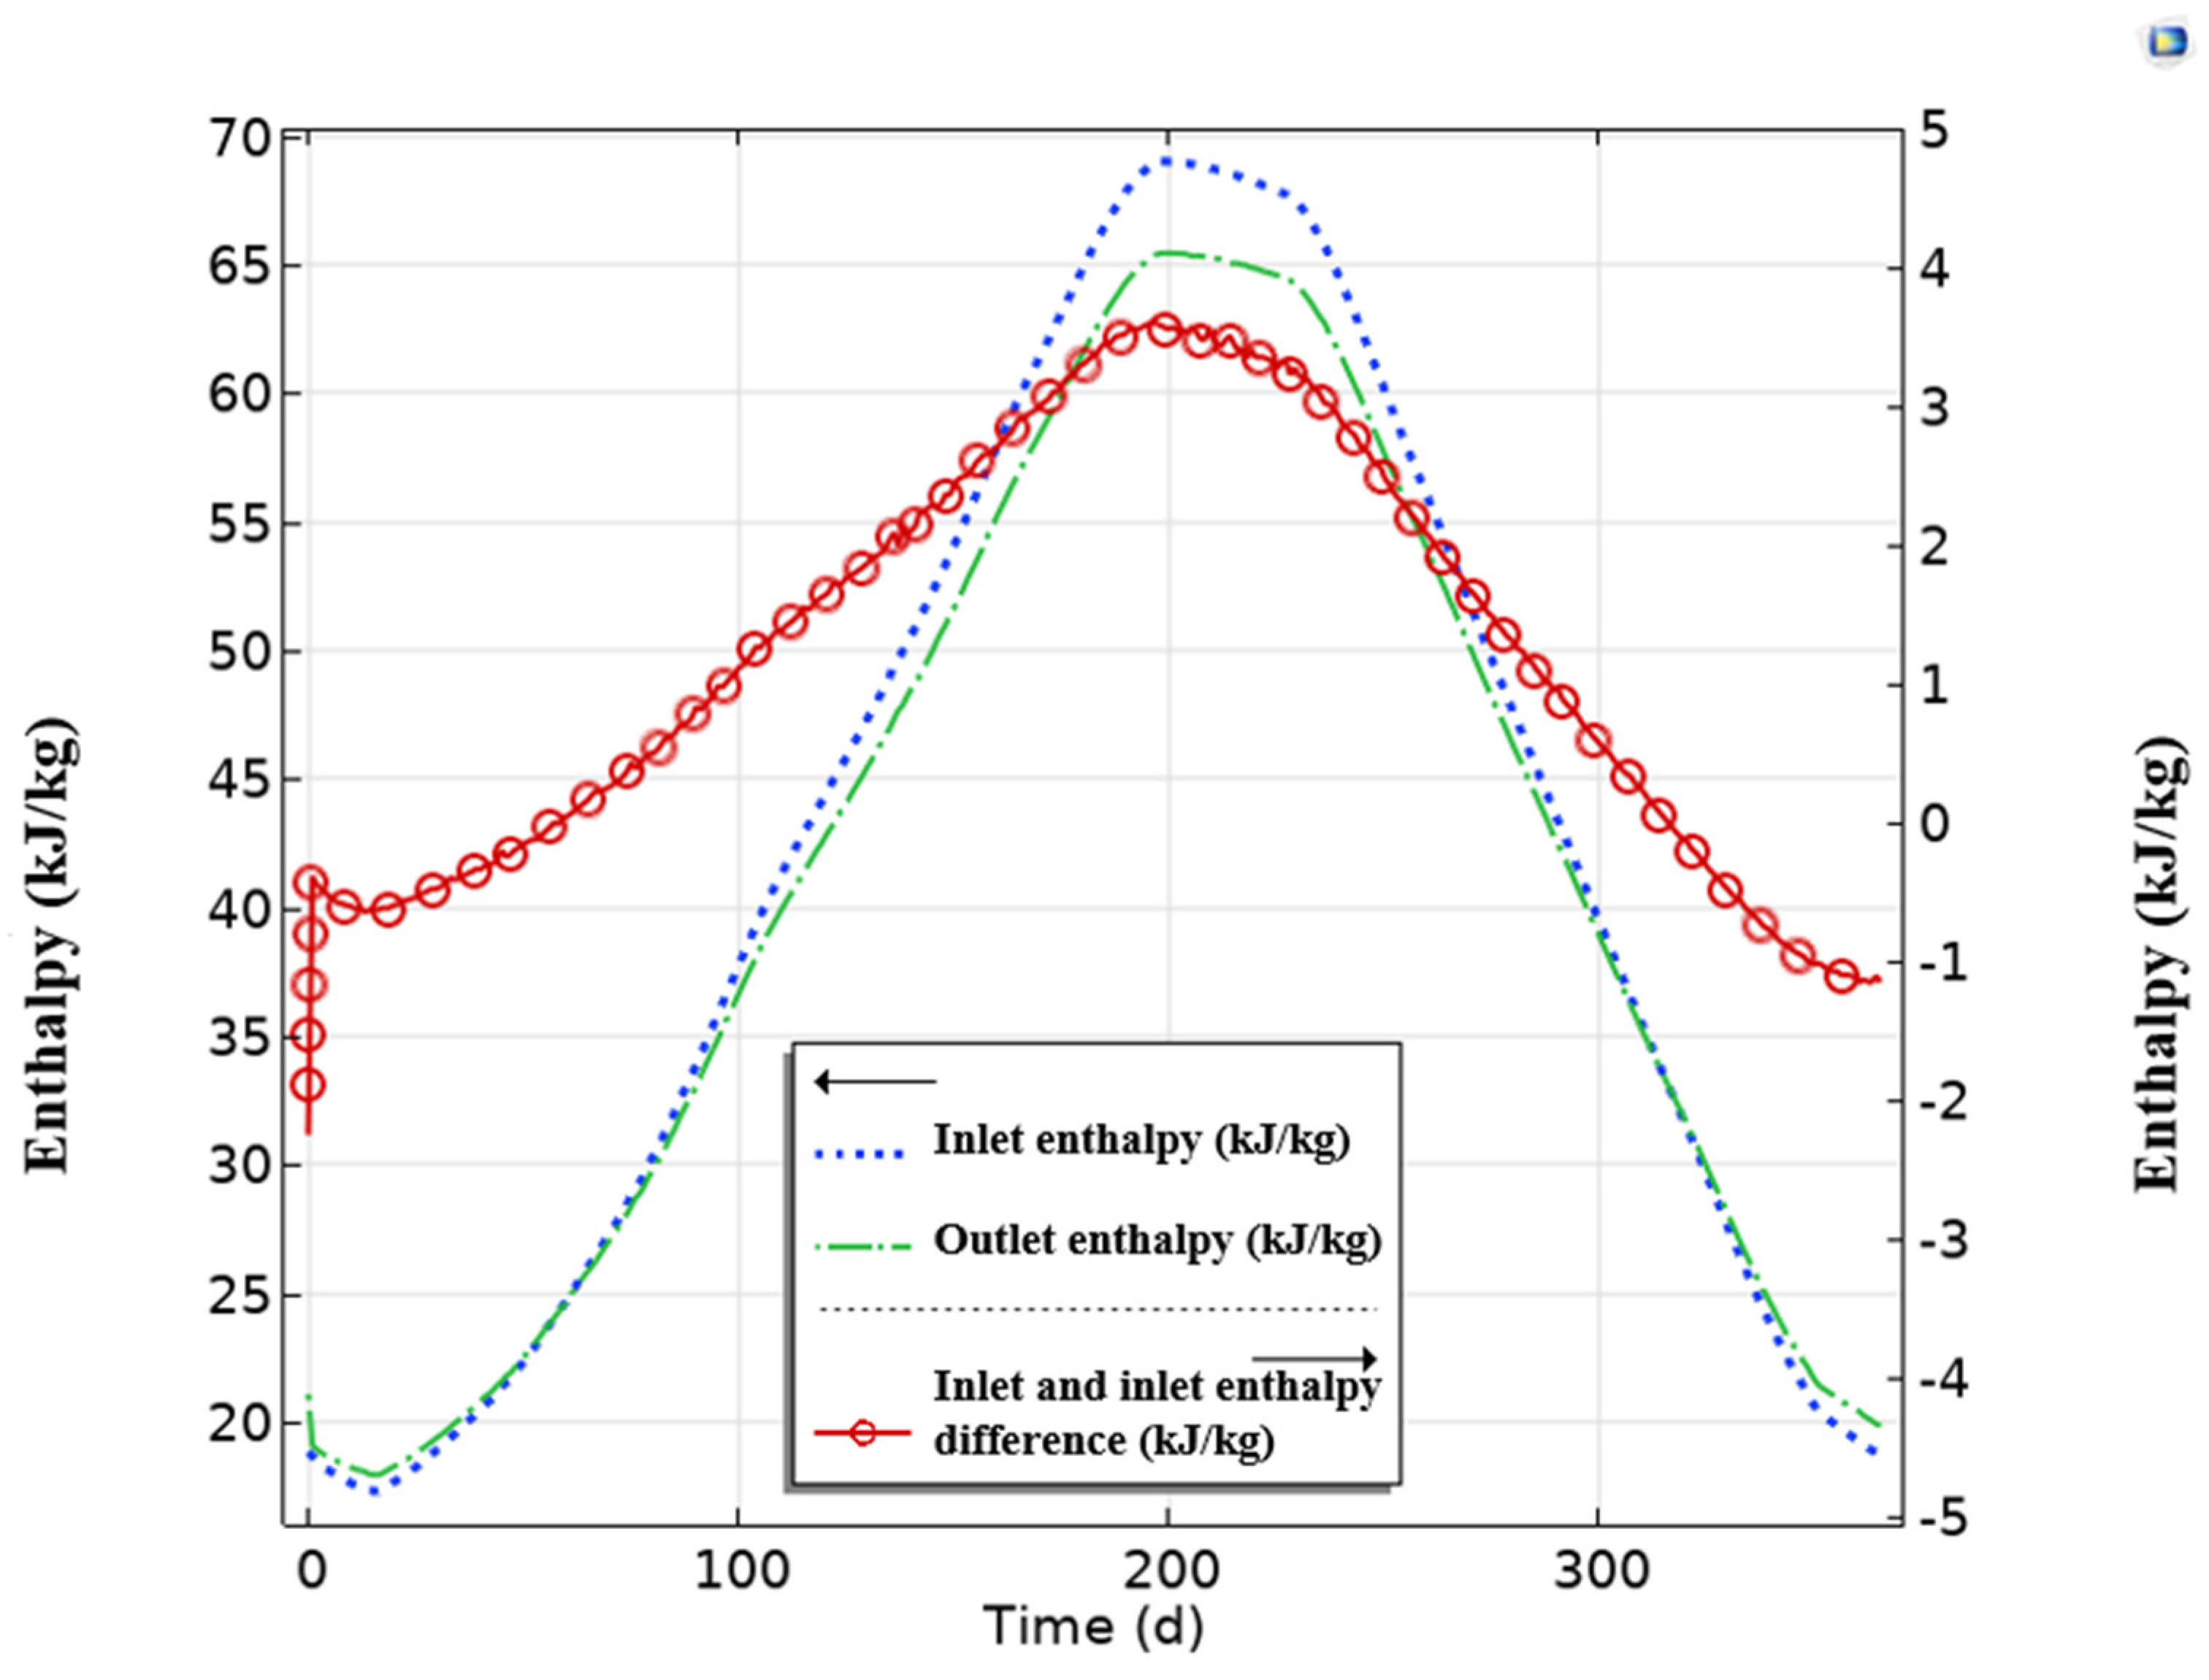
Figure 14.
Energy changes of surrounding rock in underground air tunnel surroundings.
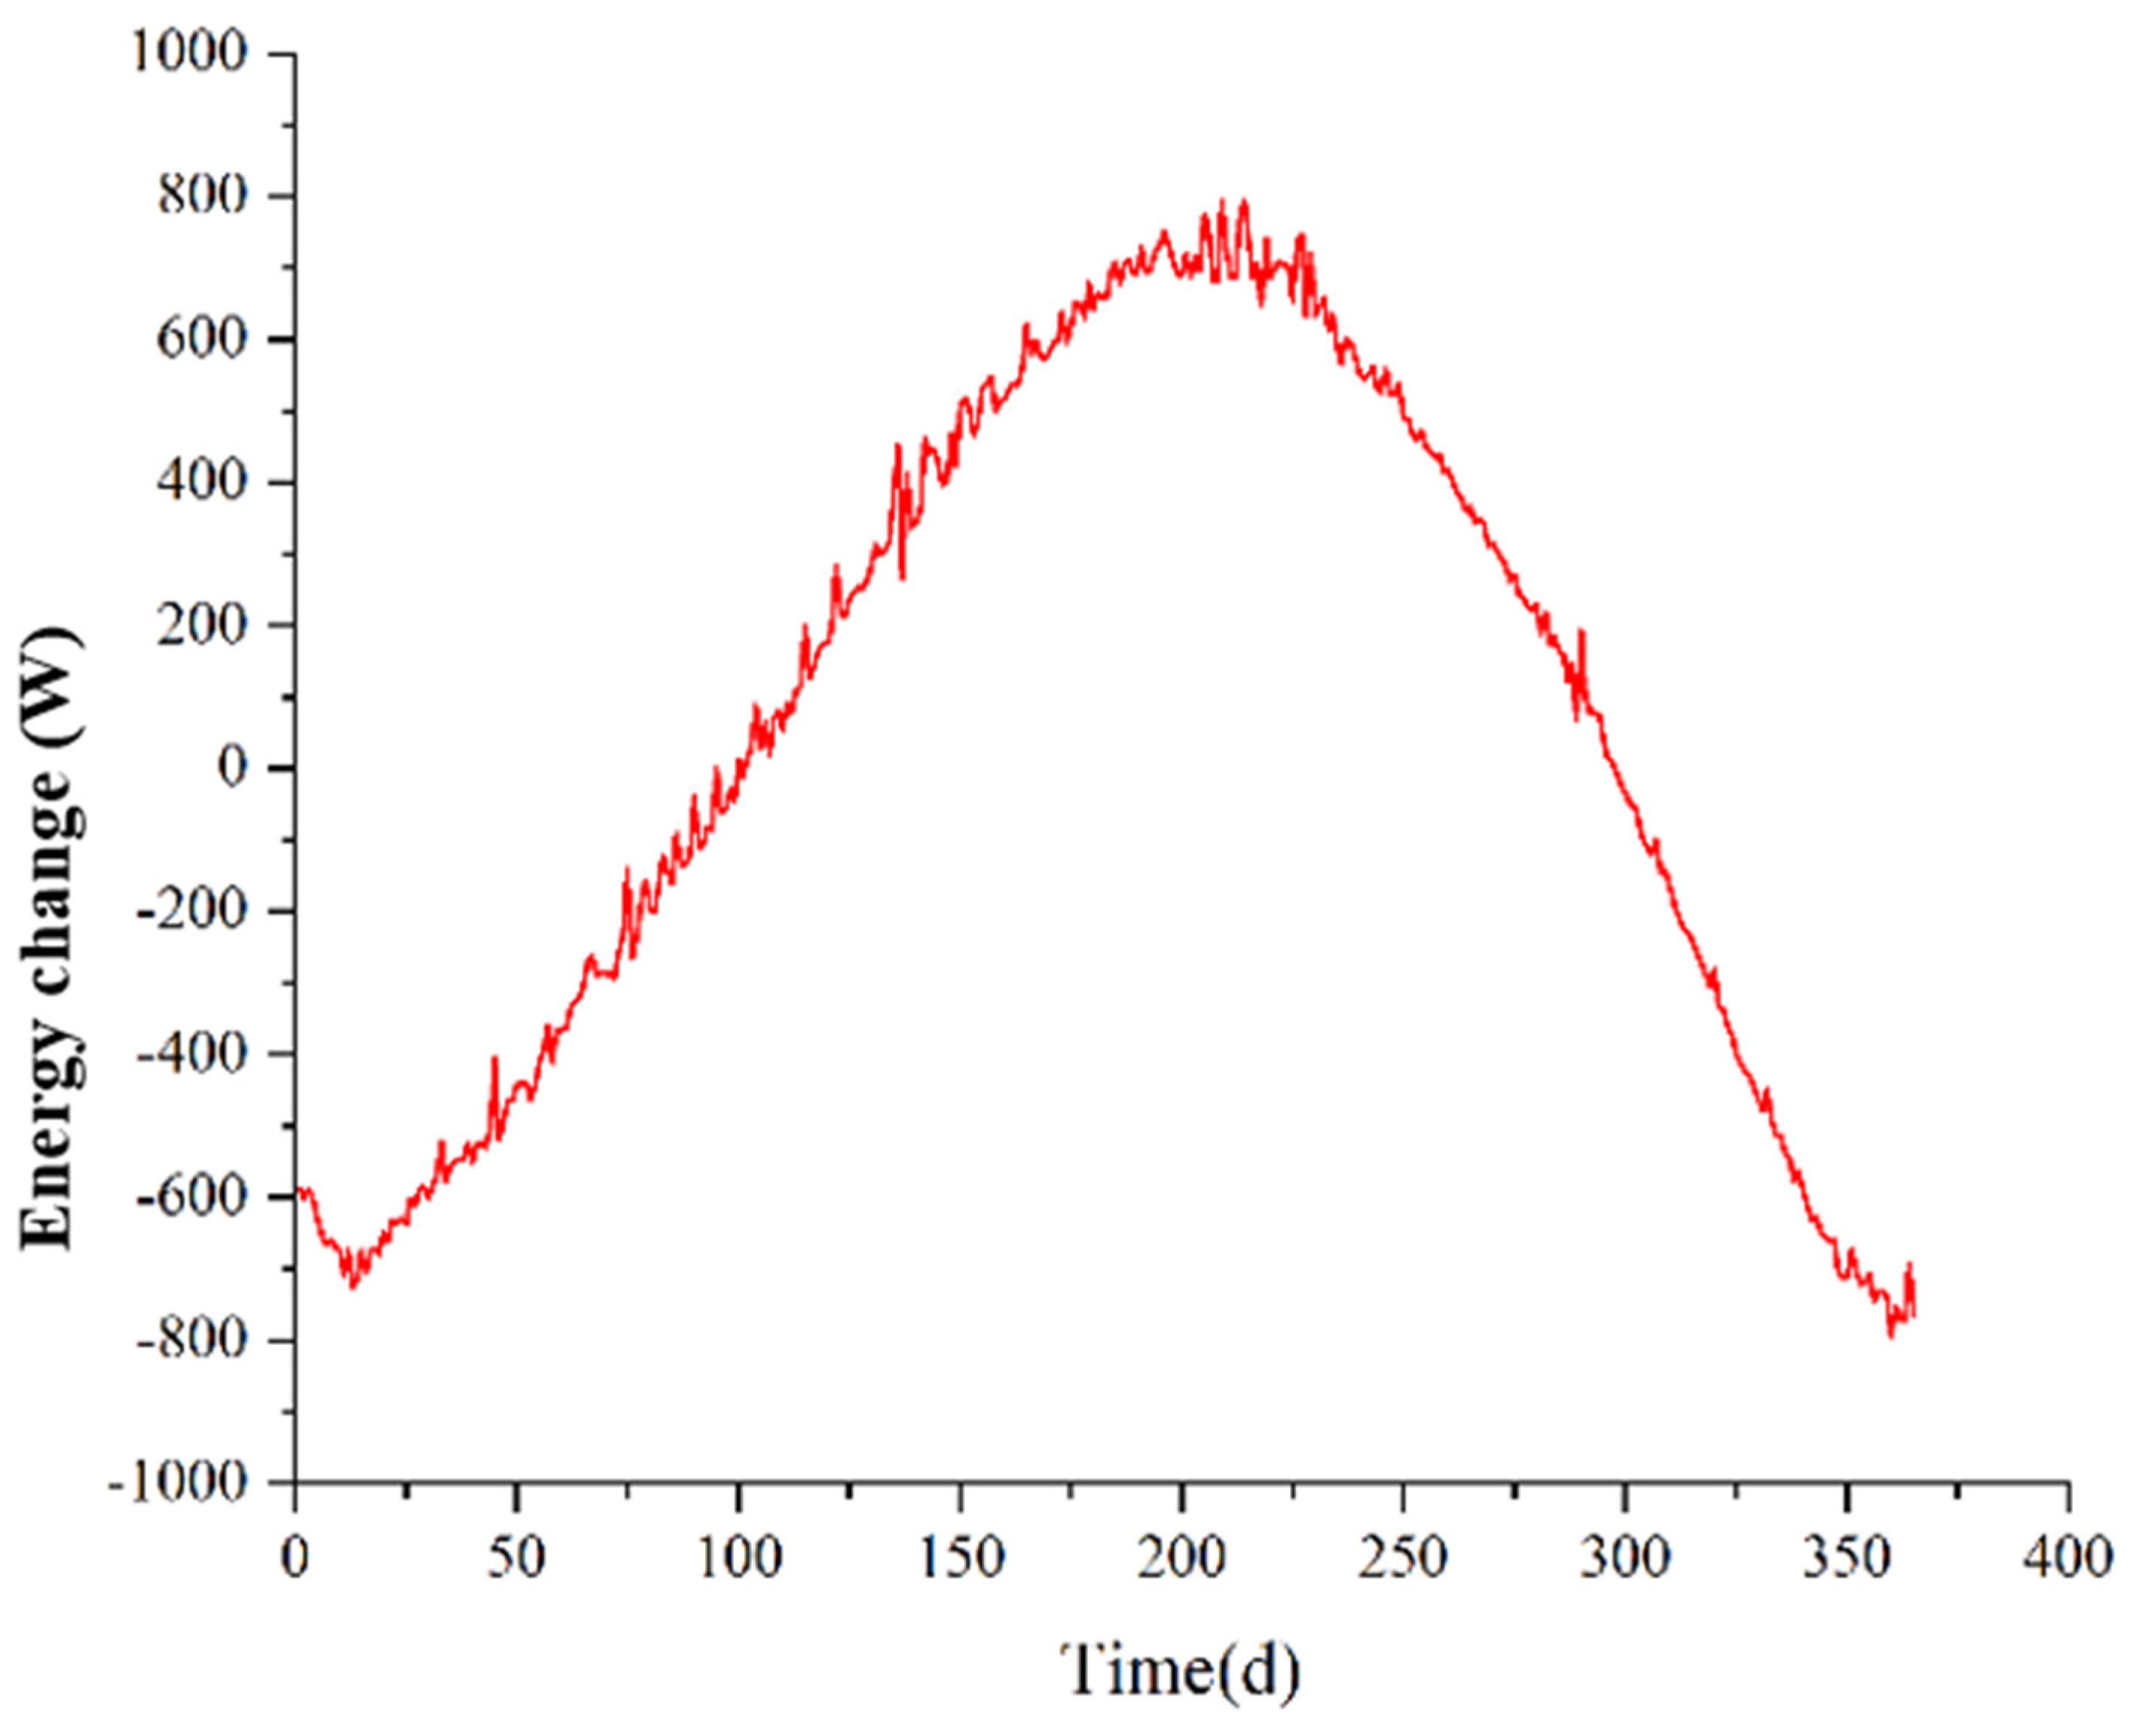
Figure 15.
Cumulative energy changes of the surrounding rock in the underground air tunnel under winter and summer cases.
Figure 15.
Cumulative energy changes of the surrounding rock in the underground air tunnel under winter and summer cases.
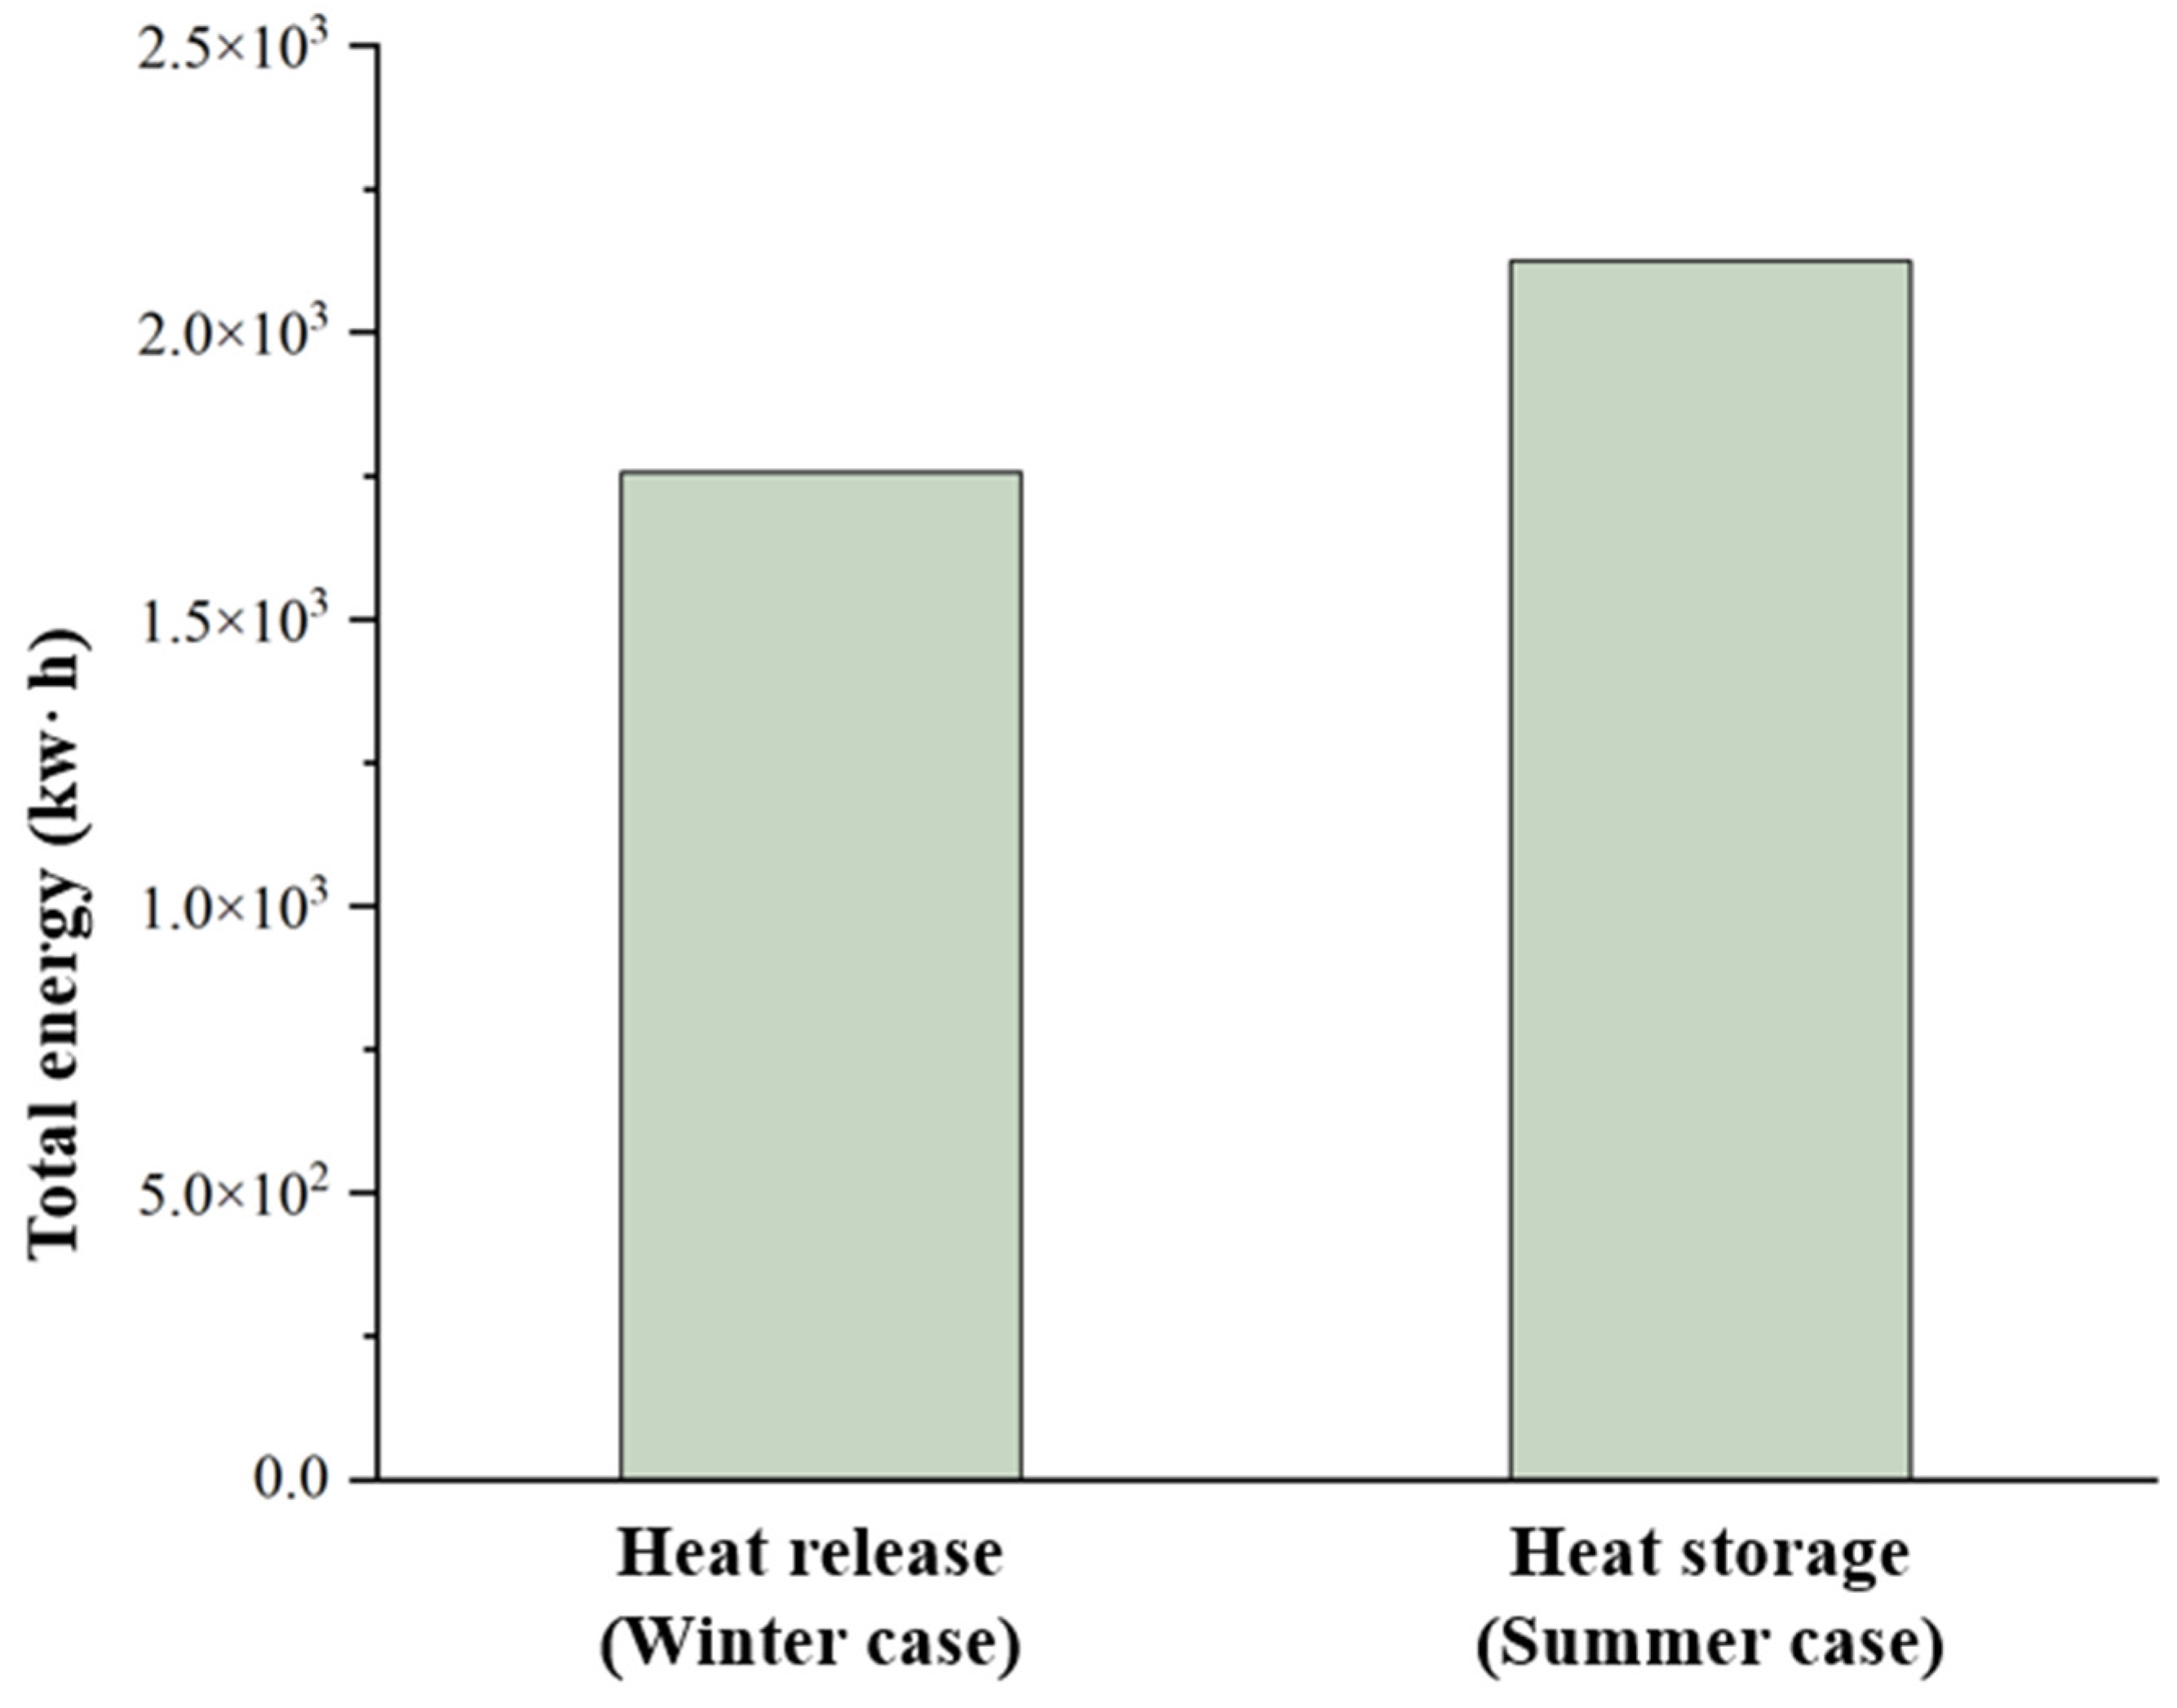
Figure 16.
Enthalpy difference between the inlet and outlet in typical cities in China.
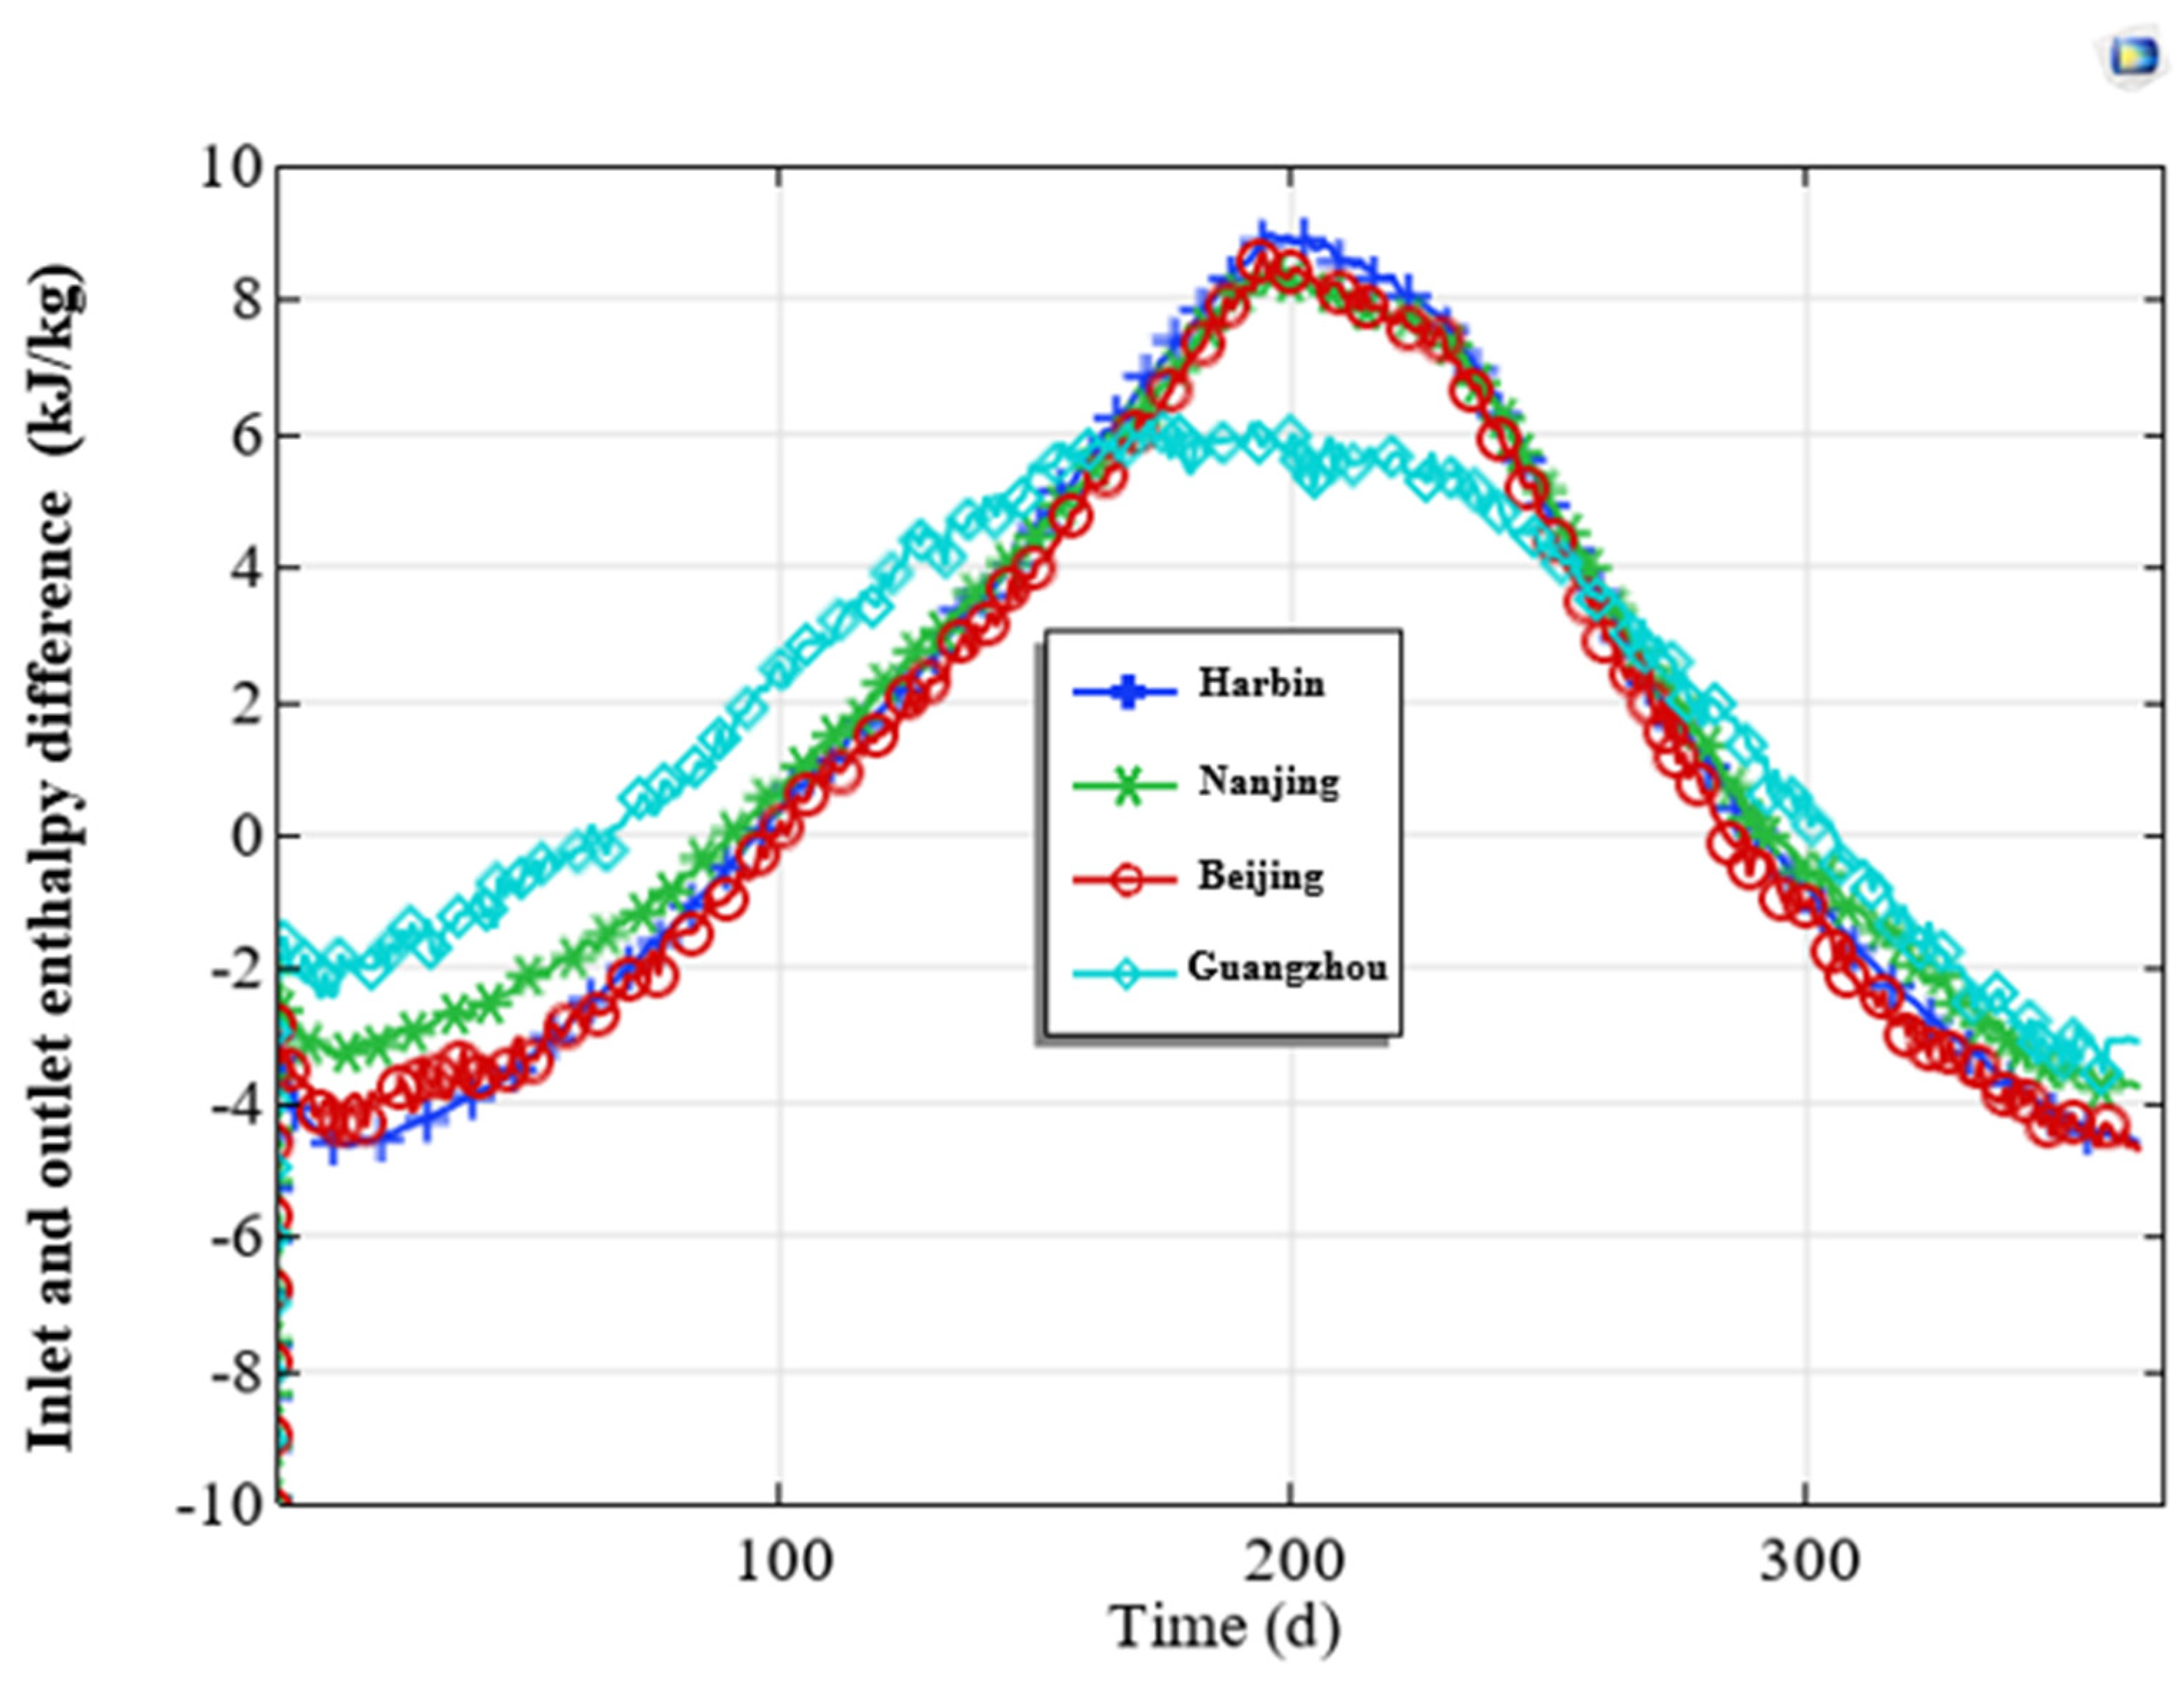

Table 1.
Material properties.
| Volumetric moisture content (kg/m3) |
Thermal conductivity (W/(m·K)) |
Water vapor permeability coefficient (kg/(m·s·Pa)) |
Liquid water transfer coefficient (kg/(m·s·Pa)) |
Disclaimer/Publisher’s Note: The statements, opinions and data contained in all publications are solely those of the individual author(s) and contributor(s) and not of MDPI and/or the editor(s). MDPI and/or the editor(s) disclaim responsibility for any injury to people or property resulting from any ideas, methods, instructions or products referred to in the content. |
© 2025 by the authors. Licensee MDPI, Basel, Switzerland. This article is an open access article distributed under the terms and conditions of the Creative Commons Attribution (CC BY) license (http://creativecommons.org/licenses/by/4.0/).
Copyright: This open access article is published under a Creative Commons CC BY 4.0 license, which permit the free download, distribution, and reuse, provided that the author and preprint are cited in any reuse.


