
Submitted:
26 September 2025
Posted:
28 September 2025
You are already at the latest version
Abstract
The Hidden Value Zone (HVZ) is a novel concept in stock valuation derived from the Potential Payback Period (PPP). It highlights the divergence between the linear, simplistic approach of the PEG ratio and the logarithmic, financially consistent framework of the PPP. The HVZ identifies stocks that are dismissed as overvalued by PEG but that, under PPP, reveal strong earning power and are therefore undervalued. This article develops the theoretical foundations of the HVZ, provides a graphical representation, and validates its relevance through the exceptional performances of NVIDIA and Palantir Technologies from early 2024 to September 2025. The HVZ thus emerges as a powerful tool for detecting undervaluation overlooked by traditional metrics.
Keywords:
Hidden Value Zone (HVZ)
; Potential Payback Period (PPP)
; price-to-earnings ratio (P/E)
; PEG ratio
; stock valuation
; NVIDIA
; Palantir Technologies
; growth stocks
Introduction
Valuation metrics are central to investment decision-making, yet traditional tools often prove inadequate in the context of rapidly growing companies. The Price-to-Earnings (P/E) ratio, though widely used, fails to account for growth, interest rates, and risk, while the PEG ratio attempts to integrate earnings growth but does so in a simplistic linear fashion. To address these limitations, the Potential Payback Period (PPP) provides a more comprehensive framework by incorporating growth logarithmically and adjusting for interest rates and risk.
The Hidden Value Zone (HVZ) emerges from the graphical comparison of PEG and PPP: it identifies stocks that are dismissed by PEG (PEG > 1) but remain attractive under PPP (PPP < 10). This conceptual innovation offers investors a way to uncover undervalued high-growth opportunities that conventional metrics systematically overlook.
The purpose of this article is threefold: (i) to introduce the theoretical basis of the HVZ, (ii) to demonstrate its graphical representation, and (iii) to validate its relevance through the real-world performances of NVIDIA and Palantir Technologies over the period February 2024 to September 2025.
I. PEG vs. PPP—Foundations
1). PEG Ratio (Price-to-Earnings-to-Growth)
The PEG ratio linearly adjusts the P/E ratio by growth g. The conventional threshold PEG = 1 implicitly assumes a simple linear trade-off between valuation and growth, which tends to exclude many high-growth firms.
2). Potential Payback Period (PPP)
The general PPP formula is:
where:
- P/E: price-to-earnings ratio,
- g: earnings growth rate,
- r: discount rate (reflecting interest rate and risk).
Interpretation: PPP is the (theoretical) number of years needed for the discounted stream of future earnings to potentially match the share price. It generalizes the P/E ratio: in a static world with no growth and no discounting (g = 0, r = 0), PPP reduces to the P/E ratio.
Thus, the P/E ratio is a special case of the PPP, which can therefore be regarded as a Dynamic P/E Ratio.
Why set r = 0 for the HVZ?
In the case of the HVZ, r is deliberately set to zero in order to isolate the impact of growth (g) and to enable a clear comparison between the linear PEG, which does not include r, and the logarithmic PPP. Under this assumption, the working formula for PPP simplifies to:
Why PPP < 10 is Attractive
A threshold of PPP < 10 years corresponds to a Stock
Internal Rate of Return (SIRR) exceeding 7.18 percent. This level of return is
considered attractive:
- In absolute terms, it represents a robust annualized return.
- In relative terms, it is well above prevailing risk-free interest rates (~4%).
- Importantly, only a few stocks present PPP < 10 when r = 0, because this condition represents a strict optimization of the P/E–growth relationship.
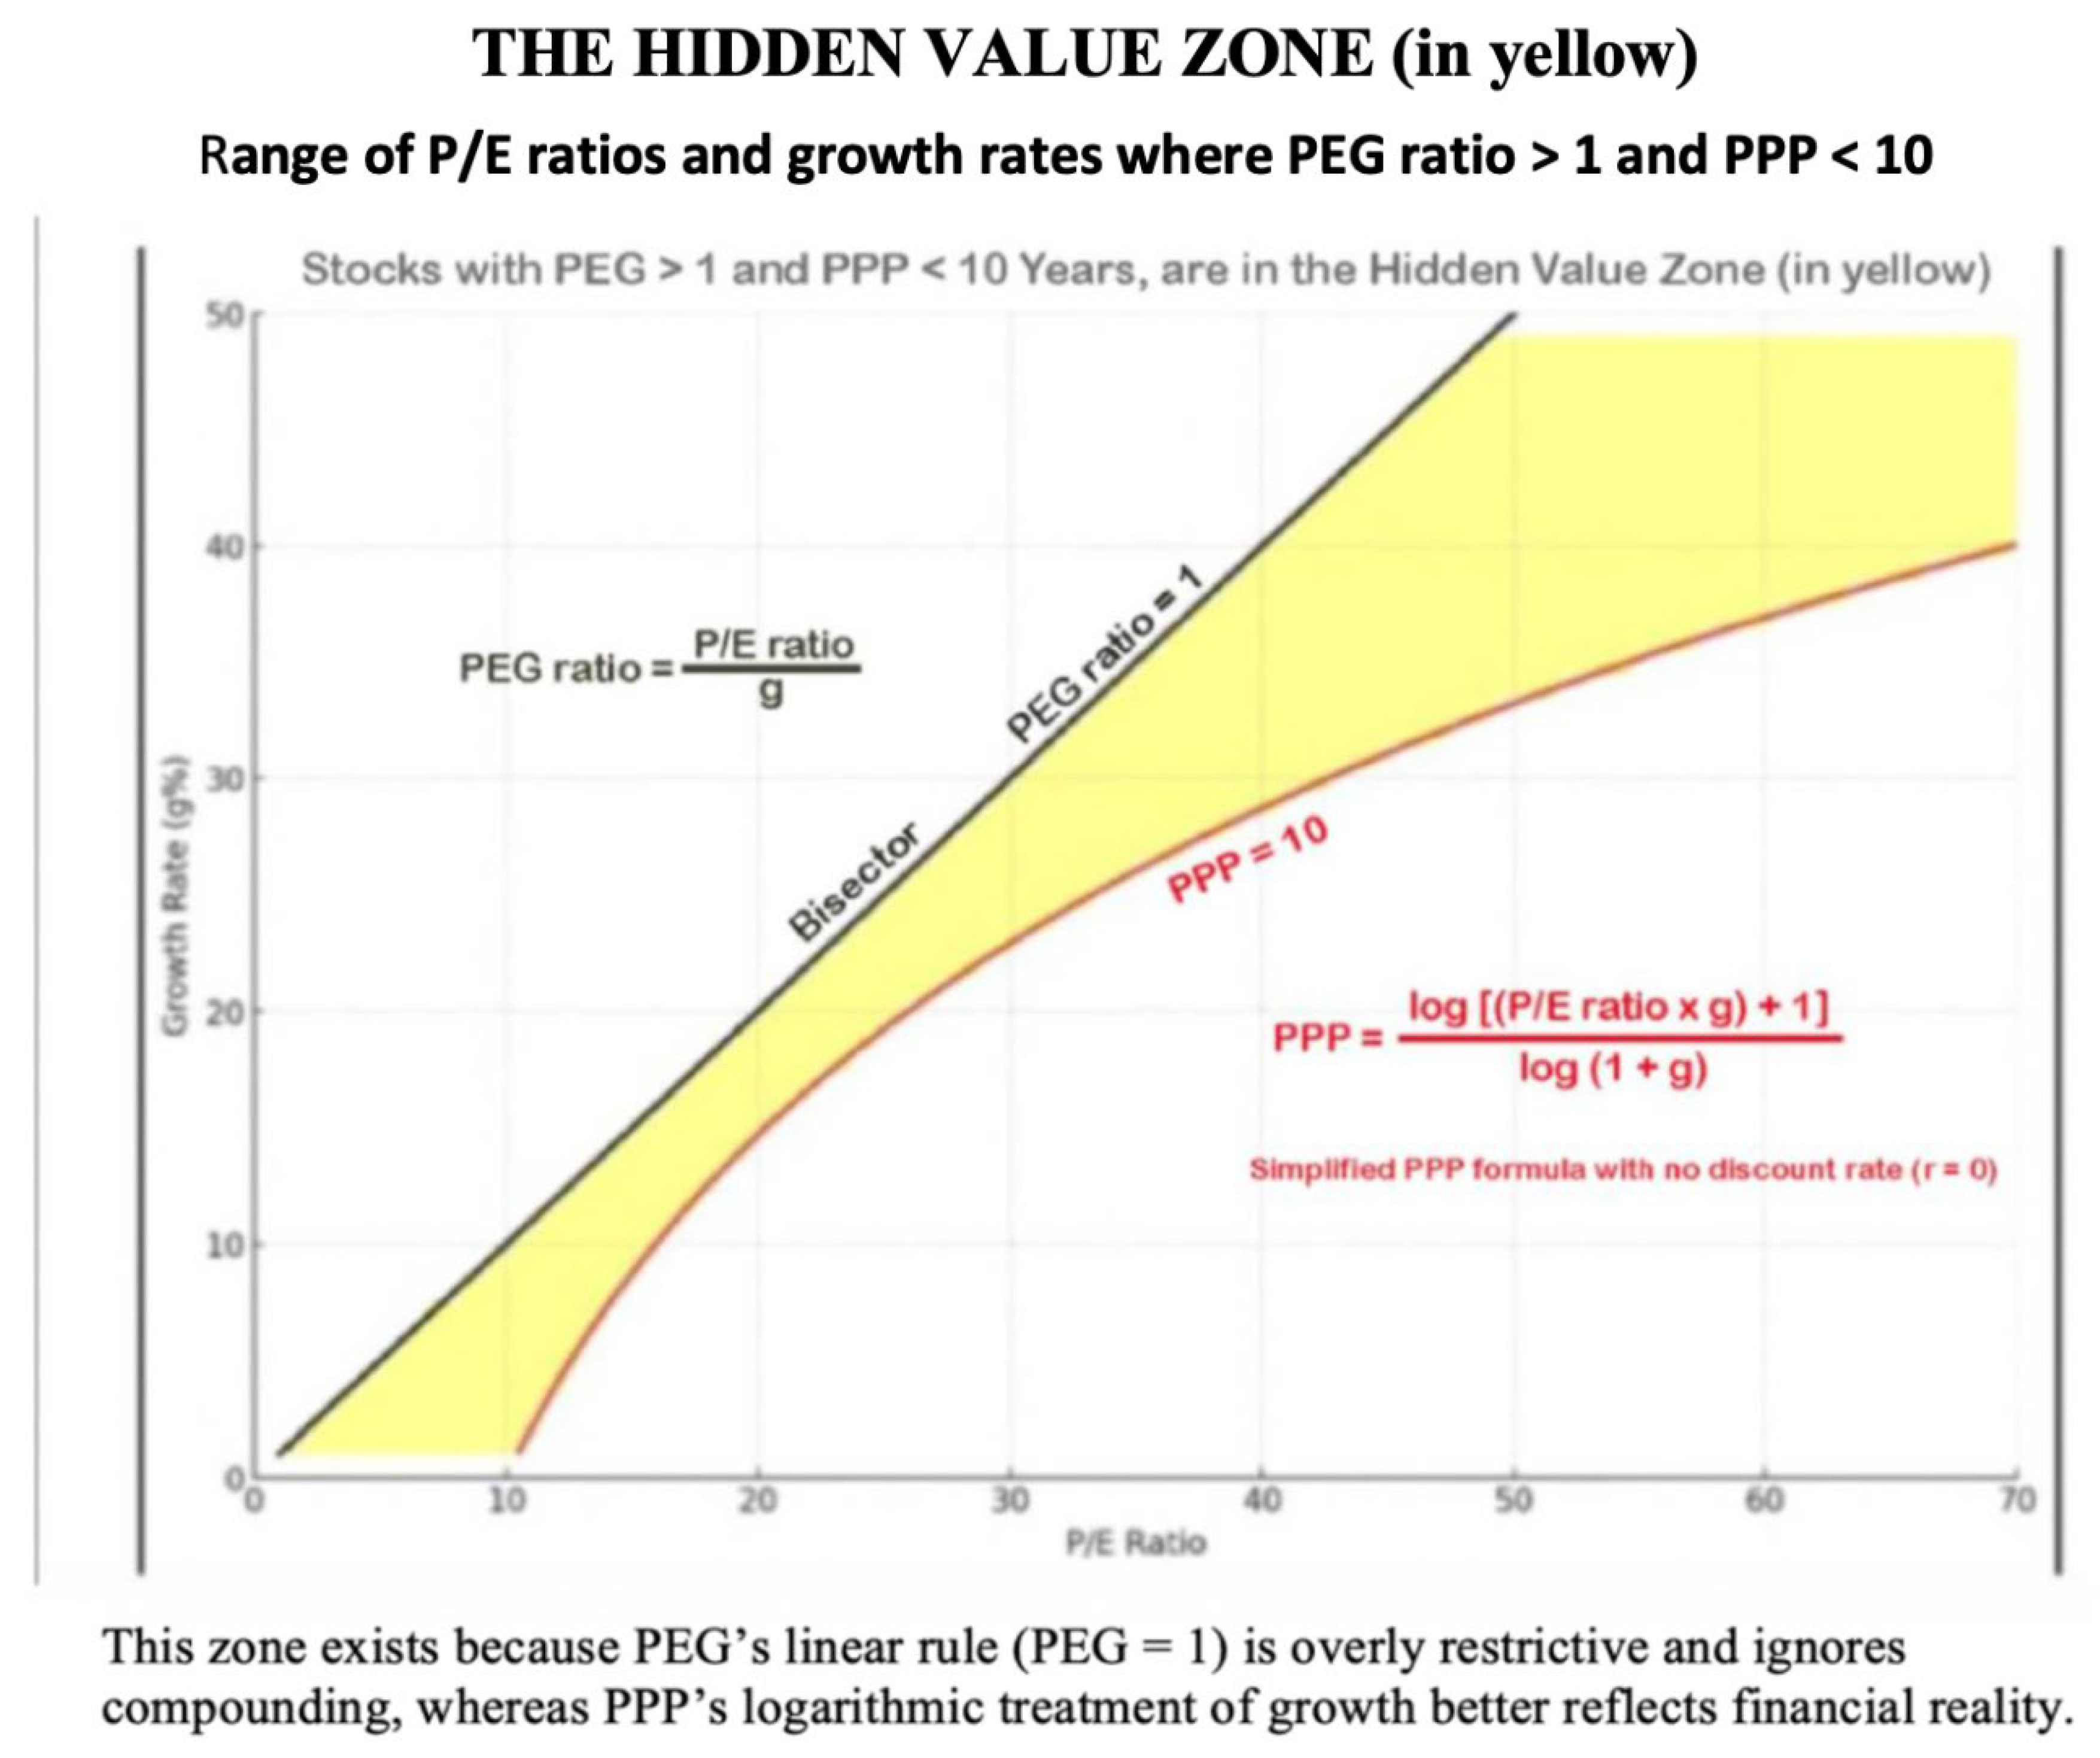
II. The HVZ—Graphical Definition
The HVZ is the yellow region on the P/E–growth plane
that lies:
- Below the PEG = 1 line (i.e., PEG > 1), and
- Above the PPP = 10 curve (i.e., PPP < 10).
In words, HVZ stocks are excluded by PEG but included by
PPP.
Figure 1.
General definition of the Hidden Value Zone (HVZ). The yellow region lies below the PEG = 1 line (black) and above the PPP = 10 isoline (red), which represents all combinations of P/E and g yielding PPP = 10.
Figure 1.
General definition of the Hidden Value Zone (HVZ). The yellow region lies below the PEG = 1 line (black) and above the PPP = 10 isoline (red), which represents all combinations of P/E and g yielding PPP = 10.
III. Initial Identification of HVZ Stocks (February 2024)
On February 11, 2024, analysis of leading U.S.
technology stocks identified only two companies in the HVZ:

Table 1.
NVIDIA and Palantir identified in the HVZ (February 11, 2024). Both NVIDIA and Palantir had PEG > 1 but PPP < 10, placing them firmly in the HVZ.
Table 1.
NVIDIA and Palantir identified in the HVZ (February 11, 2024). Both NVIDIA and Palantir had PEG > 1 but PPP < 10, placing them firmly in the HVZ.
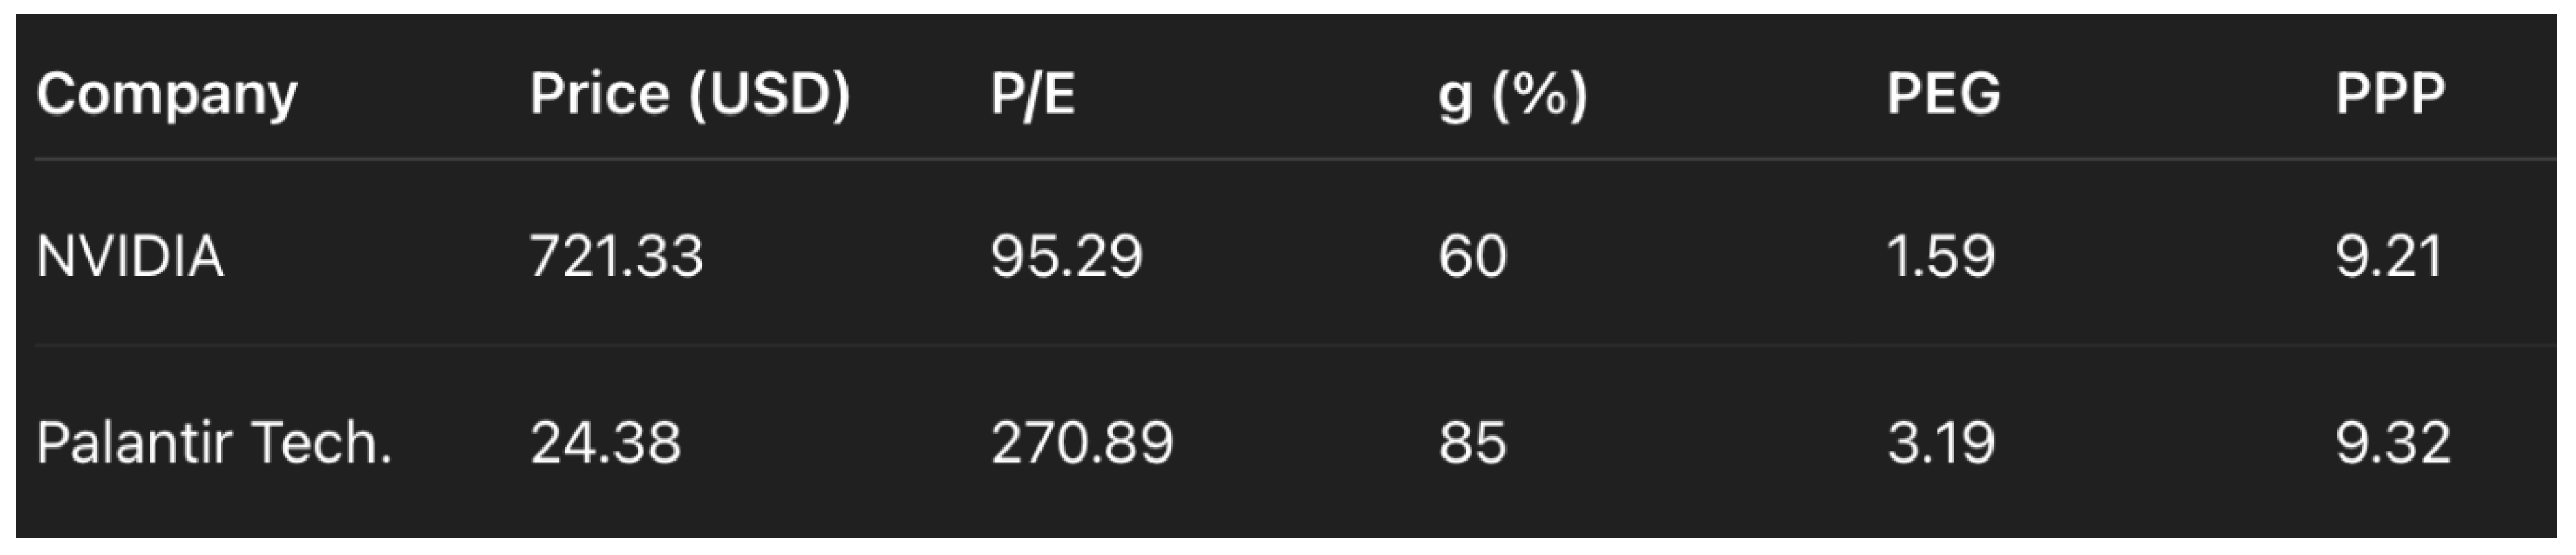 |
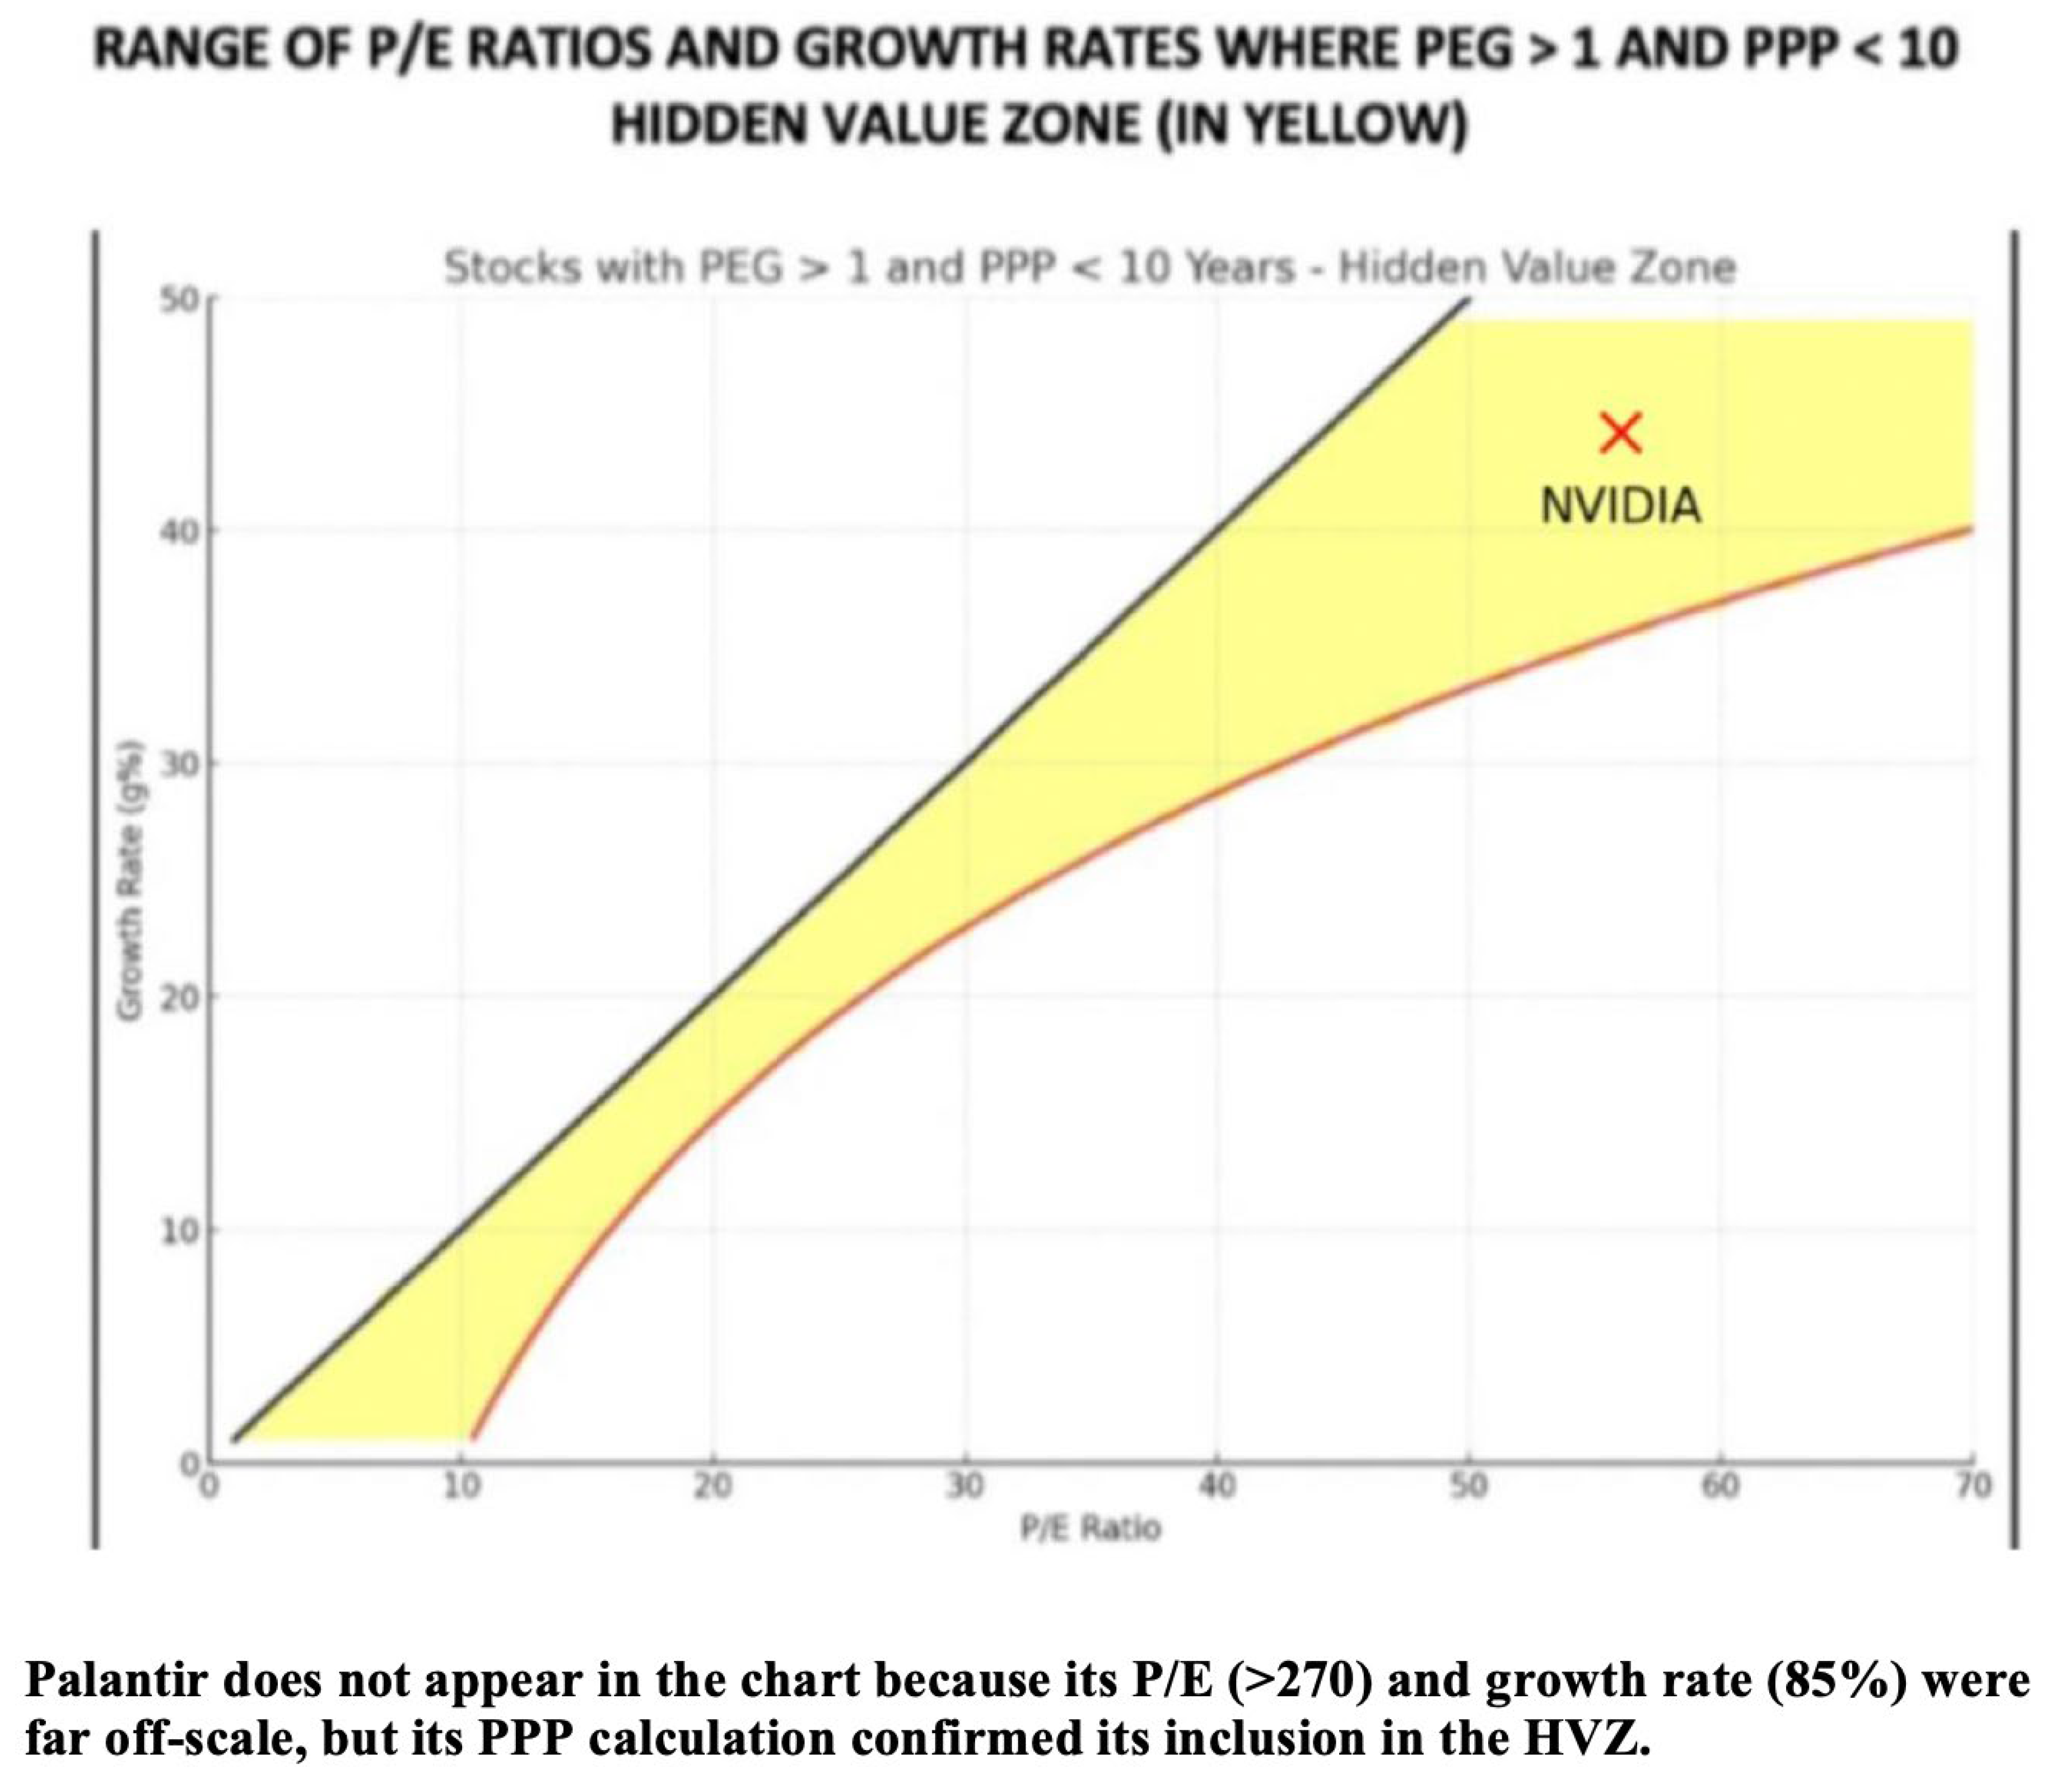
Figure 2.
NVIDIA and Palantir plotted in the Hidden Value Zone (HVZ). The red curve is the PPP = 10 isoline, while the black line represents PEG = 1. NVIDIA and Palantir are located within the yellow HVZ, the area defined by PEG values greater than 1 and PPP values below 10.
Figure 2.
NVIDIA and Palantir plotted in the Hidden Value Zone (HVZ). The red curve is the PPP = 10 isoline, while the black line represents PEG = 1. NVIDIA and Palantir are located within the yellow HVZ, the area defined by PEG values greater than 1 and PPP values below 10.
IV. Proof Through Performance (Feb 2024 – Sept 2025)
NVIDIA (NVDA)
- Baseline (9 Feb 2024): USD 721.33
- Split adjustment (10-for-1, June 2024): USD 72.13
- Price (24 Sep 2025): USD 176.97
- Performance: +145%
Palantir Technologies (PLTR)
- Baseline (9 Feb 2024): USD 24.38
- Price (24 Sep 2025): USD 179.56
- Performance: +636%
Benchmark: S&P 500
- Performance (same period): +21.93%
Both HVZ-identified stocks significantly outperformed the
index.
V. Literature Context
The development of the Hidden Value Zone (HVZ) and its
reliance on the Potential Payback Period (PPP) builds upon, and extends,
earlier contributions in the field of stock valuation.
- Basu (1977). In one of the earliest empirical studies on the Price-to-Earnings ratio, Basu demonstrated that stocks with low P/E ratios tended to outperform those with high P/E ratios, challenging the efficient market hypothesis. While his work confirmed the usefulness of valuation multiples, it also underscored the limitations of P/E as a static measure. The PPP framework expands on this insight by generalizing P/E into a dynamic construct that incorporates growth, interest rates, and risk, thereby extending and overcoming the limitations of Basu’s static formulation. [1]
- Graham and Dodd (2008). Their seminal work on Security Analysis established the foundation for value investing by emphasizing intrinsic value, earnings power, and the margin of safety. The PPP aligns with this tradition by quantifying intrinsic value through the theoretical recovery of stock price from discounted future earnings. The HVZ can thus be understood as a contemporary extension of Graham and Dodd’s principles, adapted to account for compounding growth and modern capital market conditions. [2]
- Lynch (2000). Peter Lynch popularized the PEG ratio as a quick heuristic for incorporating growth into valuation, suggesting that a PEG of 1 represented fair value. However, the PEG ratio’s reliance on a linear formulation of the relationship between P/E and growth is overly simplistic. The PPP provides a more financially consistent logarithmic approach, and the HVZ specifically emerges from the divergence between PEG and PPP. In this sense, the HVZ highlights opportunities that the PEG ratio prematurely excludes but that remain attractive under PPP. [3]
Together, these foundational works establish the
intellectual backdrop against which the HVZ and PPP are positioned. By
subsuming the static P/E ratio (Basu), modernizing intrinsic value analysis
(Graham and Dodd), and addressing the shortcomings of PEG (Lynch), the HVZ
emerges as a comprehensive and more accurate framework for identifying
undervalued high-growth stocks.
VI. Discussion and Implications
- Methodological. The PEG ratio is based on a linear trade-off between valuation and earnings growth, whereas the PPP incorporates compounding effects through a logarithmic formulation and explicitly accounts for growth, interest rates, and risk.
- Conceptual. The PPP generalizes the traditional P/E ratio. In fact, the P/E ratio can be understood as a degenerate case of the PPP that arises when both growth (g) and the discount rate (r) are set to zero.
- Practical. When setting r = 0, the condition PPP < 10 corresponds to a Stock Internal Rate of Return (SIRR) exceeding 7.18 percent, which represents a demanding threshold that relatively few stocks are able to surpass. Those that do, while still being excluded under the PEG criterion, fall within the Hidden Value Zone.
- Empirical. NVIDIA and Palantir, both identified as HVZ stocks as of February 2024, subsequently recorded exceptional performances: NVIDIA appreciated by +145 percent and Palantir by +636 percent by September 2025, compared with a gain of only +21.93 percent for the S&P 500 index over the same period.
VII. Conclusion
The Hidden Value Zone is the graphical
representation of the clash between PEG’s linear framework and PPP’s
logarithmic framework. By focusing on the region below the PEG = 1 line
and above the PPP = 10 curve, investors can identify opportunities that
PEG considers overpriced but that PPP reveals as attractively valued.
The cases of NVIDIA and Palantir Technologies provide
compelling empirical proof. Both stocks, excluded by PEG but included by PPP,
went on to deliver exceptional returns relative to the market.
The HVZ thus emerges as a powerful analytical framework
for identifying undervalued high-growth companies that traditional valuation
tools fail to capture.
References
- Basu, S. Investment performance of common stocks in relation to their price-earnings ratios: A test of the efficient market hypothesis. The Journal of Finance, 1977, 32, 663–682. [Google Scholar]
- Graham, B., & Dodd, D. (2008). Security Analysis: Sixth Edition. McGraw-Hill Education.
- Lynch, P. (2000). One Up on Wall Street: How to Use What You Already Know to Make Money in the Market. Simon & Schuster.
Disclaimer/Publisher’s Note: The statements, opinions and data contained in all publications are solely those of the individual author(s) and contributor(s) and not of MDPI and/or the editor(s). MDPI and/or the editor(s) disclaim responsibility for any injury to people or property resulting from any ideas, methods, instructions or products referred to in the content. |
© 2025 by the authors. Licensee MDPI, Basel, Switzerland. This article is an open access article distributed under the terms and conditions of the Creative Commons Attribution (CC BY) license (http://creativecommons.org/licenses/by/4.0/).
Copyright: This open access article is published under a Creative Commons CC BY 4.0 license, which permit the free download, distribution, and reuse, provided that the author and preprint are cited in any reuse.


