
Submitted:
25 September 2025
Posted:
29 September 2025
You are already at the latest version
Abstract
I studied the flowering phenology, floral visitors, and breeding system of the threatened Texas endemic Hibiscus dasycalyx in natural (Houston County) and experimental (Walker County) populations during 2024 and 2025. Flowering spanned May to August in the natural population but was largely confined to June in the experimental population. Breeding trials showed the species is self-compatible but not autogamous: fruit set was highest in outcrossed flowers, lower in hand-selfed flowers, and absent in bagged flowers, with no differences in seed set, seed weight or seed germination among self vs crossed treatments. Pollinator activity was abundant in the natural population, producing high fruit set, but much lower in the experimental population, resulting in very low fruit set. Bees and butterflies were the dominant visitors, with the bee Ptilothrix bombiformis accounting for >98% of visits, including pollen collection. Pollen receipt on stigmas also differed significantly between the natural and experimental populations and between periods of high P. bombiformis abundance and absence. These results indicate that pollinator absence constrains reproduction in experimental populations, whereas natural populations benefit from consistent pollination by a specialized bee. However, this opens the potential for hybridization with other co-flowering Hibiscus species.
Keywords:
Hibiscus dasycalyx
; Texas endemic
; flowering phenology
; breeding system
; self-compatibility
; pollination biology
; floral visitors
; Ptilothrix bombiformis
; pollen receipt
; reproductive ecology
1. Introduction
Understanding flowering phenology, floral visitation, and breeding systems is fundamental to conserving endangered plants, particularly those dependent on pollinators for reproduction. Phenological traits such as the timing, duration, and synchrony of flowering strongly influence reproductive success by affecting pollinator visitation and conspecific pollen transfer [1,2]. These traits are often shaped by local conditions and may differ between natural and restored populations, especially in species with small or fragmented ranges [3]. Created populations may exhibit altered flowering schedules, reduced synchrony, or lower floral output due to demographic immaturity, altered microclimates, or genetic bottlenecks [4,5]. Such deviations may reduce pollination success, particularly in obligately outcrossing species, where flowering synchrony is critical for genetic diversity and population viability [6]. Restoration sites may also differ in pollinator abundance, visitation rates, or network structure, further influencing reproductive outcomes [7,8]. Comparative studies of natural versus created populations are therefore essential for evaluating conservation success.
Hibiscus dasycalyx (Neches River rose-mallow) is a federally threatened, state-endangered perennial endemic to eastern Texas, restricted to seasonally inundated riparian habitats [9]. The species has declined due to habitat loss, hydrological alteration, invasive species, and fragmentation [10,11]. Hybridization with congeners such as H. laevis and H. moscheutos poses an additional genetic threat [12]. Evidence from hand-pollination, allozyme, and phylogenomic studies indicates that H. dasycalyx and H. laevis are closely related and readily hybridize, whereas H. moscheutos is more divergent and hybridizes mainly under artificial conditions [12,13,14,15,16,17]. Thus, H. laevis represents the greater risk to genetic integrity in sympatric settings.
Shared pollinators may further facilitate hybridization. The hibiscus bee Ptilothrix bombiformis is an oligolectic specialist on Malvaceae and a highly effective pollinator of Hibiscus species [18]. Its fidelity to Hibiscus and visitation across H. dasycalyx, H. laevis, and H. moscheutos make it a likely vector for interspecific pollen transfer [9-10,12]. While this specialization promotes conspecific pollination, it also increases the risk of hybridization when congeners co-flower. The goal of this study is to compare flowering phenology, synchrony, and floral visitor composition between a natural and an outplanted population of H. dasycalyx, and to evaluate its breeding system through controlled pollination experiments. Results from studies of hybridization interactions will be presented separately in a future paper. These analyses assess how altered flowering and pollinator limitation may influence reproductive success and conservation outcomes for this threatened species.
2. Materials and Methods
2.1. Study Species
The Neches River rose-mallow (Hibiscus dasycalyx, HD) is a federally threatened, state-endangered perennial wetland plant endemic to four counties in southeastern Texas [9-10, 17]. Two congeners, the swamp rose-mallow (Hibiscus moscheutos, HM) and halberd-leaf rose-mallow (Hibiscus laevis, HL), are widespread across the eastern United States and frequently co-occur with H. dasycalyx [12-17]. Although H. dasycalyx had been considered a potential subspecies of H. laevis [12], molecular evidence supports its recognition as a distinct species [15].
2.2. Site and Plant Characteristics
The natural population (LL) was located on a conservation property near Lovelady, Houston County, Texas (67 m elevation; coordinates restricted for conservation purposes) (Figure S1). The experimental population was established at the Sam Houston State University Piney Woods Environmental Research Laboratory (PERL), Walker County, Texas (30.748593° N, 95.475422° W; 76 m elevation), approximately 39.6 km south of LL and outside the natural range of H. dasycalyx (Figure S2). Seeds collected from LL in August 2019 were germinated in the PERL greenhouse in 2020 and planted in spring 2021 in an abandoned fishpond (HPS14). At LL, I randomly selected 10 plants in each of three subareas (30 total), while at PERL the entire population of nine plants was studied. For each plant, for all stems >1m in height, I recorded the number of stems, stem diameter at soil level, and stem height. Plants with more than 1 stem have summed diameter and average height values. Environmental variables recorded at each site were soil temperature, soil pH, soil moisture, and canopy openness measured using a digital soil thermometer and canopy densiometer.
2.3. Flowering Phenology
At LL, censuses were conducted approximately every two weeks from June through August in 2024; at PERL, more frequent censuses were conducted due to easier access in 2024 and 2025. For each plant, I counted flower buds, open flowers, young fruits (green, indehiscent), and mature fruits (brown, dehiscent). Natural fruit set was calculated as the number of mature fruits divided by the number of flowers.
2.4. Floral Visitors and Pollen Loads
2.4.1. Floral Visitors
At both sites, floral visitors were observed during 10-min periods on randomly selected flowering Hibiscus plants, supplemented with digital camera video recordings. I noted visitor behavior (fly-by, nectaring, or pollen collection). (Figures S3, S4).
2.4.2. Pollen Receipt and Removal
At LL (2024), I randomly harvested 10 flowers on 15 June after flower dehiscence and stigma pollen loads were counted directly using a Keyence digital microscope. In 2025 at PERL, 54 flowers from selfed, crossed, and open treatments were categorized for pollen deposition on the stigmas and pollen removal from the anthers. For each flower, pollen deposition was recorded separately on all five stigma lobes. At PERL (2025), stigma lobes were scored categorically:
0 = no grains
1 = <10 grains
2 = 10–50 grains
3 = 50–100 grains
4 = >100 grains
For analysis, these categorical scores were converted into estimated pollen grain counts using midpoints: 0 = 0, 1 = 5, 2 = 30, 3 = 75, 4 = 150. Scores across all five lobes were summed to produce an estimated total pollen deposition per flower. This approach provides a conservative estimate and enabled comparisons between PERL and LL populations.
To quantify pollen removal, each flower’s anthers (typically >30 per flower) were scored individually along the staminal column: 1 = full (pollen abundant), 2 = sparse (partially depleted), or 3 = empty (depleted. Anthers were grouped into three zones: basal (positions 1–2), middle (3–8), and apical (9–10). For analysis, scores were converted to estimated removal percentages (full = 0%, sparse = 50%, empty = 100%) and averaged across all anthers per flower to obtain a whole-flower pollen removal index.
Pollen deposition and removal were summarized as medians, means, and ranges. Non-parametric Mann–Whitney U tests were used to compare distributions between populations (LL vs. PERL), pollination treatments, and bee-active vs. post-bee periods at PERL in 2025. Correlations between stigma pollen deposition and anther removal were assessed using Pearson’s correlation coefficient. For biological interpretation, a threshold of ~60 grains per flower was used, corresponding to the approximate number of ovules per fruit in H. dasycalyx.
2.5. Breeding System, Fruit Set, Seed Set, and Seed Germination
2.5.1. Breeding System Study Design, Fruit Set, and Seed Set
Breeding system experiments were conducted on seven flowering plants at PERL in 2024 and five flowering plants in 2025. Data was summed across both years. All flower buds were bagged with a fine mesh pollination bag and then assigned randomly to four treatments: (1) bagged to test autogamy, (2) open to test natural pollination, (3) hand-pollinated with self-pollen from the same flower, or (4) hand-pollinated with cross-pollen from another plant. Standardized pollen loads were applied across all five stigma lobes using toothpicks (see Figure 8A, 3.3.2 for data on pollen loads in hand-pollinated flowers). Self- and cross-pollinated flowers were bagged immediately after pollination to prevent visitation. Fruits were harvested when the ovary and calyx turned brown. All seeds were counted and weighed and scored as good, bad, or ovules not fertilized. Any fruits attacked by herbivores were scored as successful if they contained seeds. Seed set was not calculated for herbivore attacked fruits due to consumption of seeds. At LL in 2024, flowers were sampled only under open pollination, reflecting natural conditions. I compared fruit set among pollination treatments using pairwise analyses with 2 × 2 contingency tables. For each treatment pair (Autogamy, Hand Self-Pollination, Hand Outcross-Pollination, and Open Pollination), I calculated odds ratios (ORs), 95% confidence intervals (CIs), and p-values. I compared average number of good seeds and average seed weight per fruit by treatment between selfed and outcrossed fruits using a t-test.
2.5.2. Seed Germination
In 2025, I evaluated germination outcomes for seeds derived from three breeding treatments—Control, Selfed, and Outcrossed—in a randomized blocked greenhouse experiment. Each replicate consisted of one fruit containing 20 seeds, and trays served as blocks in the experimental design. Using fruits from one maternal plant with >40 seeds from each treatment, 10 fruits were randomly picked and used to test for germination. Twenty randomly picked seeds were nicked with a scalpel, soaked in distilled water for 24 hours and planted in a randomized block design in four trays in Miracle Gro Potting Soil in the Sam Houston State University Life Sciences Building greenhouse (temperature range 21.1 °C -35.6 °C). Seeds were misted twice daily, and germination was monitored daily until no germination was noted for seven days. Cumulative germination and germination speed were analyzed using ANOVA and mixed-effects models. Treatment was included as a fixed effect, and tray was modeled as a random effect to account for block-level variation. Germination speed was assessed using the day of first germination per seed.
2.6. Statistical Analysis and Visualization
All analyses were conducted in Minitab 21.4.3 (2024) [19]. Data were tested for normality and homogeneity of variances prior to analysis. ANOVA with Tukey’s HSD post hoc tests was used to compare treatment means at α = 0.05. During the preparation of this manuscript/study, I used ChatGpt Version 5 and Microsoft CoPilot GPT-5 for creating visuals for the purposes of figure creation. The author has reviewed and edited the output and takes full responsibility for the content of this publication.
3. Results
3.1. Site and Plant Characteristics
While both sites have standing water after heavy rains and during the winter, there were significant differences in soil pH, soil temperature, soil moisture, light levels, and canopy openness (Table 1). PERL was more acidic, had cooler soil temperatures, and higher categorical light levels, although the quantitative canopy openness score was higher but not significantly different. The categorical soil moisture meter showed normal soil moisture levels at both sites, likely reflective of early summer precipitation.
Plant size traits differed significantly between the natural (LL) and experimental (PERL) populations of Hibiscus dasycalyx (Figure 1). Plants at LL were taller (F = 9.65, p = 0.004) and had greater stem diameters (F = 7.19, p = 0.012) than those at PERL. These differences reflect the older age and greater structural development of individuals at LL compared to the younger, planted cohort at PERL. The number of stems per plant did not differ significantly between sites (F = 3.27, p = 0.08), although PERL plants showed a trend toward increased ramification and multi-stem growth, suggesting early stages of clonal spread.
3.2. Flowering Phenology
3.2.1. Flowering Duration and Total Flower Production
Flowering phenology varied across sites and years (Table 2). At LL in 2024, 20 of the 30 monitored plants (66%) flowered, producing a total of 335 flowers. At PERL, 5 of 9 plants (56%) flowered in 2024, producing only 35 flowers, whereas in 2025, 4 of 7 plants (57%) produced 150 flowers. At PERL in 2024, buds were first noted on 29 May, flowering began in early June, peaked in mid-June, and ceased by 27 June. In 2025, flowering began at a similar date but extended longer, ending on 23 July. In contrast, LL exhibited an earlier and much longer flowering season in 2024, beginning in mid-May and continuing into early August (Figure 2 and Figure 3).
Flowering duration and total flower production were significantly greater at PERL in 2025 than in 2024 (mean duration increase = +15.86 days, 95% CI = [0.86, 31.29], p = 0.036; flower output increase = +24.94 flowers, 95% CI = [1.31, 66.06], p = 0.015). LL in 2024 showed consistent, moderate output (mean = 16.9 flowers) and a longer phenological spread. Reproductive effort (flowers/day) did not differ significantly between LL and PERL (p = 0.923), although the most productive plants at PERL in 2025 exceeded those at LL.
3.2.2. Flowering Synchrony
Flowering synchrony—defined as the overlap in flowering among individuals—was consistently higher at LL than at PERL (Table 2). LL exhibited high synchrony in 2024 (0.650), whereas synchrony at PERL was substantially lower in 2024 (0.375) and improved only modestly in 2025 (0.419). Bootstrapped comparisons confirmed significantly greater synchrony at LL relative to PERL in both years (mean differences = +0.275 and +0.231, p < 0.001), while the slight increase at PERL between years was not significant (p = 0.132). These results indicate that restored populations may experience shorter and less coordinated flowering periods compared to natural populations, even as overall flowering duration and output increase with time since establishment.
3.3. Floral Visitors and Pollen Receipt and Removal
3.3.1. Floral Visitors
LL Floral Visitors
Floral visitors included bees, butterflies, flies, and beetles. At the natural population (LL) in 2024, floral visitation was abundant throughout the flowering season except in mid–late August as flowering declined (Table 3). Across four census dates totaling 1,285 minutes of observation, 509 visits were recorded to 151 flowers, averaging 0.40 visits per flower per minute. Ptilothrix bombiformis dominated the community, accounting for 97.8% of all visits (Figure 4). On three of the four census dates, over 95% of visits were made by P. bombiformis, and on 13 July all visits were by this species. Species richness of floral visitors ranged from 1 to 8 species per census, with lower diversity later in the season. Visits per flower per minute peaked on August 5, but few flowers were open on this date. During the core flowering period, peak rates were noted on June 29th just past the median flowering date (Figure 3).

Table 4.
Behavioral observations of Ptilothrix bombiformis visitors to Hibiscus dasycalyx flowers at the LL site during the 2024 flowering season. Values represent the percentage of individuals engaged in flyby, nectaring, or pollen-gathering behaviors during each census date.
Table 4.
Behavioral observations of Ptilothrix bombiformis visitors to Hibiscus dasycalyx flowers at the LL site during the 2024 flowering season. Values represent the percentage of individuals engaged in flyby, nectaring, or pollen-gathering behaviors during each census date.
| Date | Flyby (%) | Nectaring (%) | Pollen Gathering (%) |
| 15 Jun | 37.0 | 62.3 | 0.7 |
| 29 Jun | 54.8 | 26.6 | 18.6 |
| 13 Jul | 9.7 | 12.9 | 77.4 |
| 5 Aug | 0.0 | 11.8 | 88.2 |
Figure 4.
Proportion of floral visitors to Hibiscus dasycalyx at the LL site during the 2024 flowering season. Of the 509 total recorded visits across all census dates, 98% were by the specialist bee Ptilothrix bombiformis, while only 2% were attributed to other bee and insect visitors. The dominance of P. bombiformis highlights its ecological importance as the primary pollinator in this natural population.
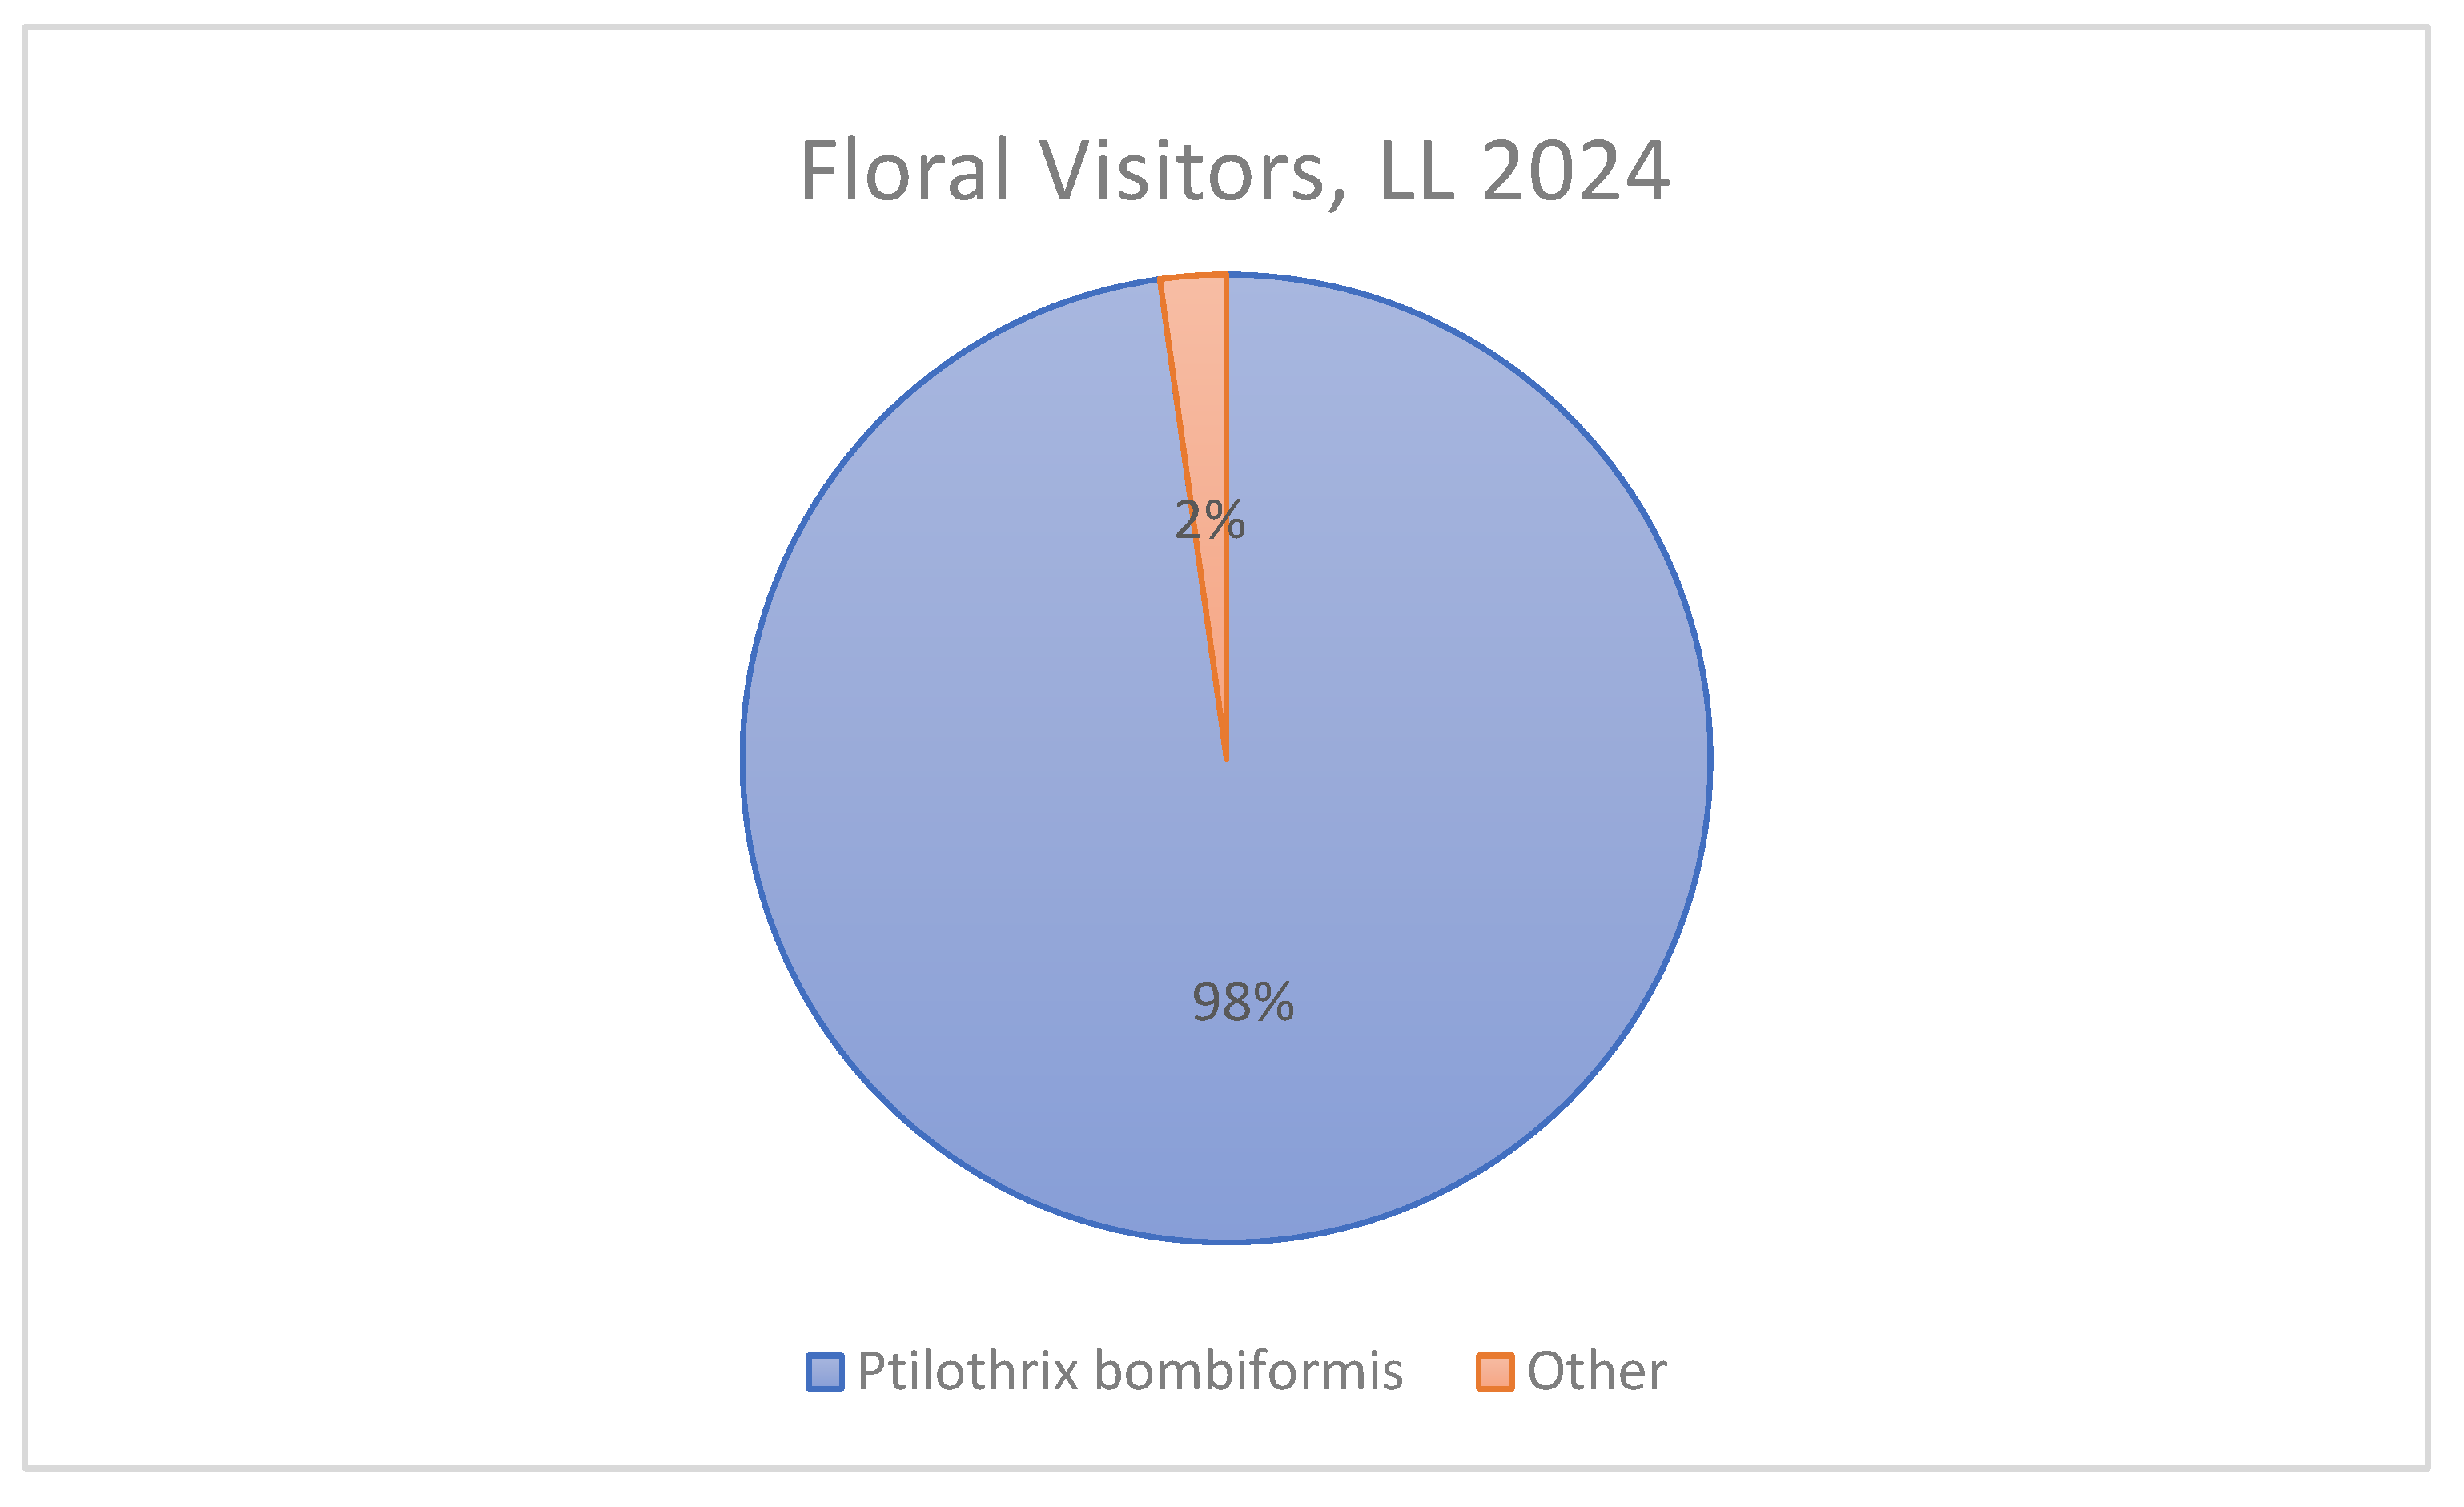
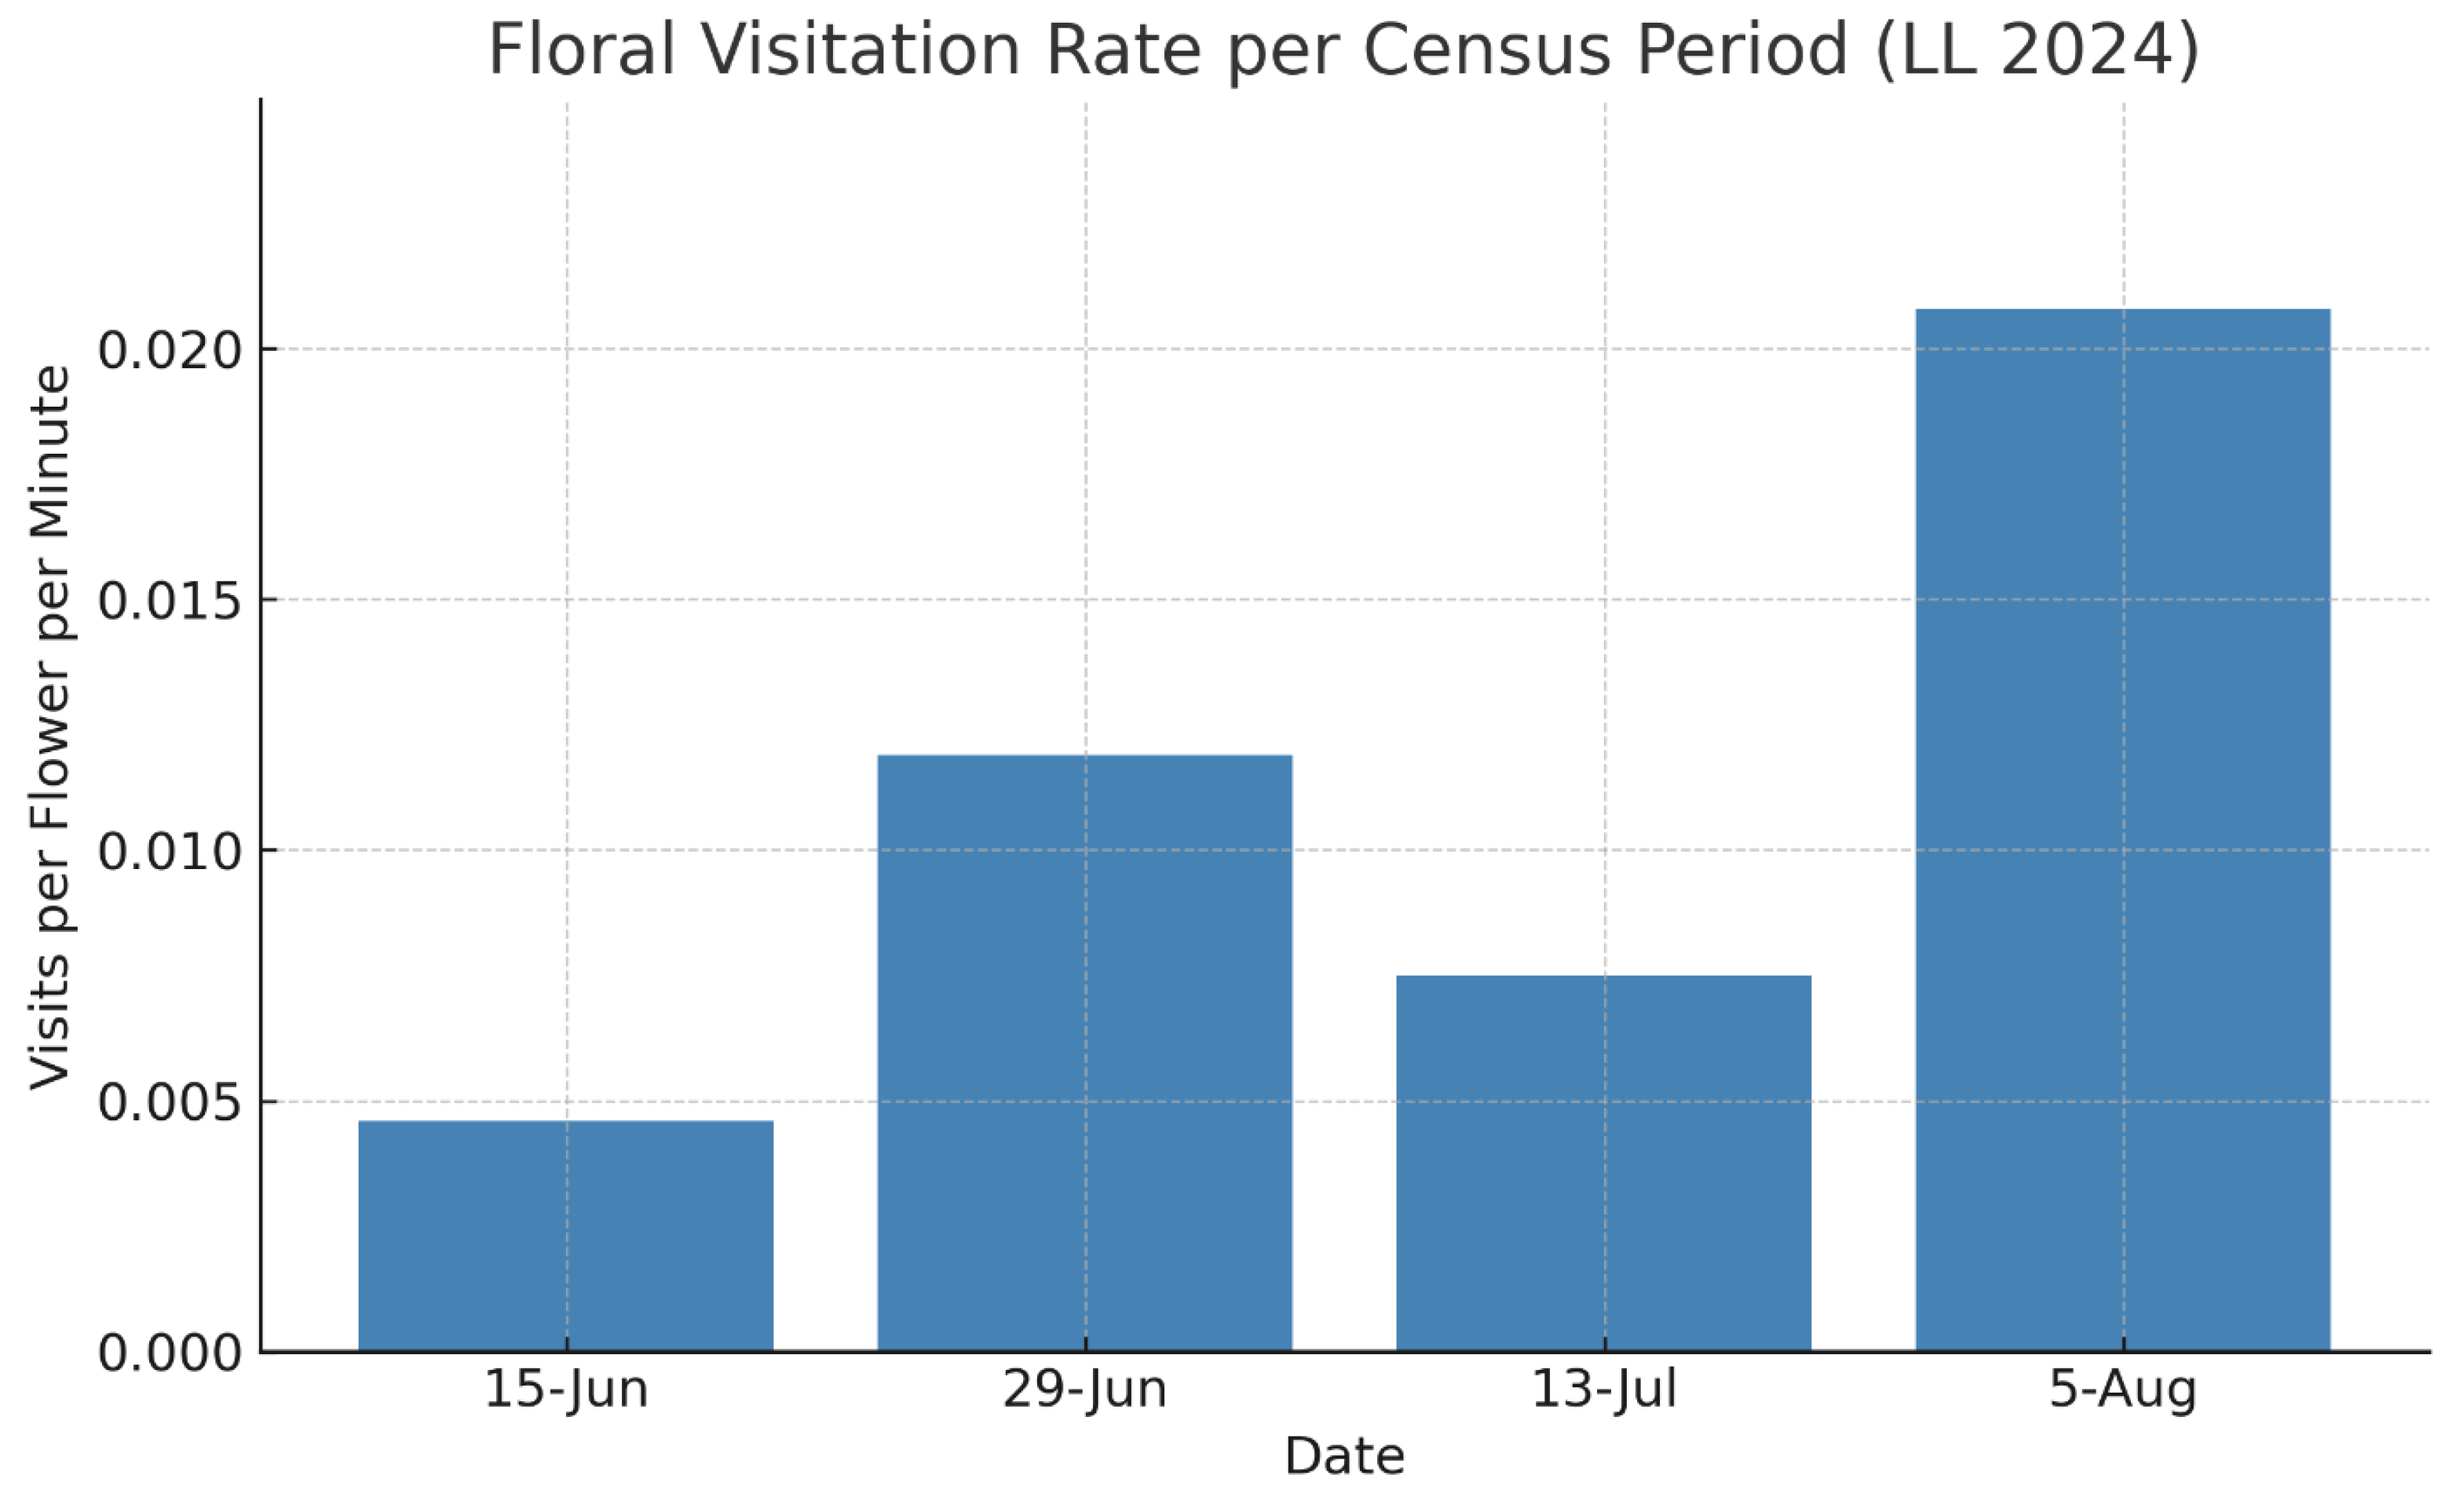
Figure 5.
Floral visitation rate per census period at the LL population of Hibiscus dasycalyx in 2024, expressed as the number of visits per flower per minute. Rates were calculated by dividing total visits by the product of census duration (in minutes) and number of open flowers observed. The highest visitation rate occurred on June 29, coinciding with peak flower production and activity of the specialist bee Ptilothrix bombiformis. Visitation declined sharply later in the season except for August 5 when few flowers were open. Visitor behavior shifted seasonally—from male-dominated nectar visits early in the season to female-dominated pollen collection later.
PERL Floral Visitors
In contrast to the natural site LL, floral visitation was nearly absent at PERL in 2024. Despite 515 minutes of observation across 12 flowers, only two visits were recorded, both by Melissodes bimaculatus (Table 5). No P. bombiformis were observed visiting flowers, although they were collected in passive traps within 600 m of the site, suggesting that the species was present in the broader landscape but did not utilize the restored population.
In 2025, however, visitation at PERL increased substantially (Table 6). During 3,726 minutes of observation across 48 flowers, 271 visits were recorded. P. bombiformis dominated early in the flowering season (10–14 June), while secondary visitors included Melissodes communis, Agapostemon splendens, and several skipper butterflies. Later in the season, floral visitation declined sharply, with only butterflies recorded after 15 June. As a result, visitation rates were strongly concentrated in early June, coinciding with peak activity of P. bombiformis, and declined thereafter (Figure 6).
Figure 6.
Proportional distribution of floral visits to Hibiscus dasycalyx by insect taxa at the PERL site in 2025. The specialist bee Ptilothrix bombiformis accounted for the majority of visits, while other floral visitors included Melissodes communis, Agapostemon splendens, and several skipper butterflies. The dominance of P. bombiformis highlights its central role in pollination at this site, despite the presence of a diverse secondary pollinator community.
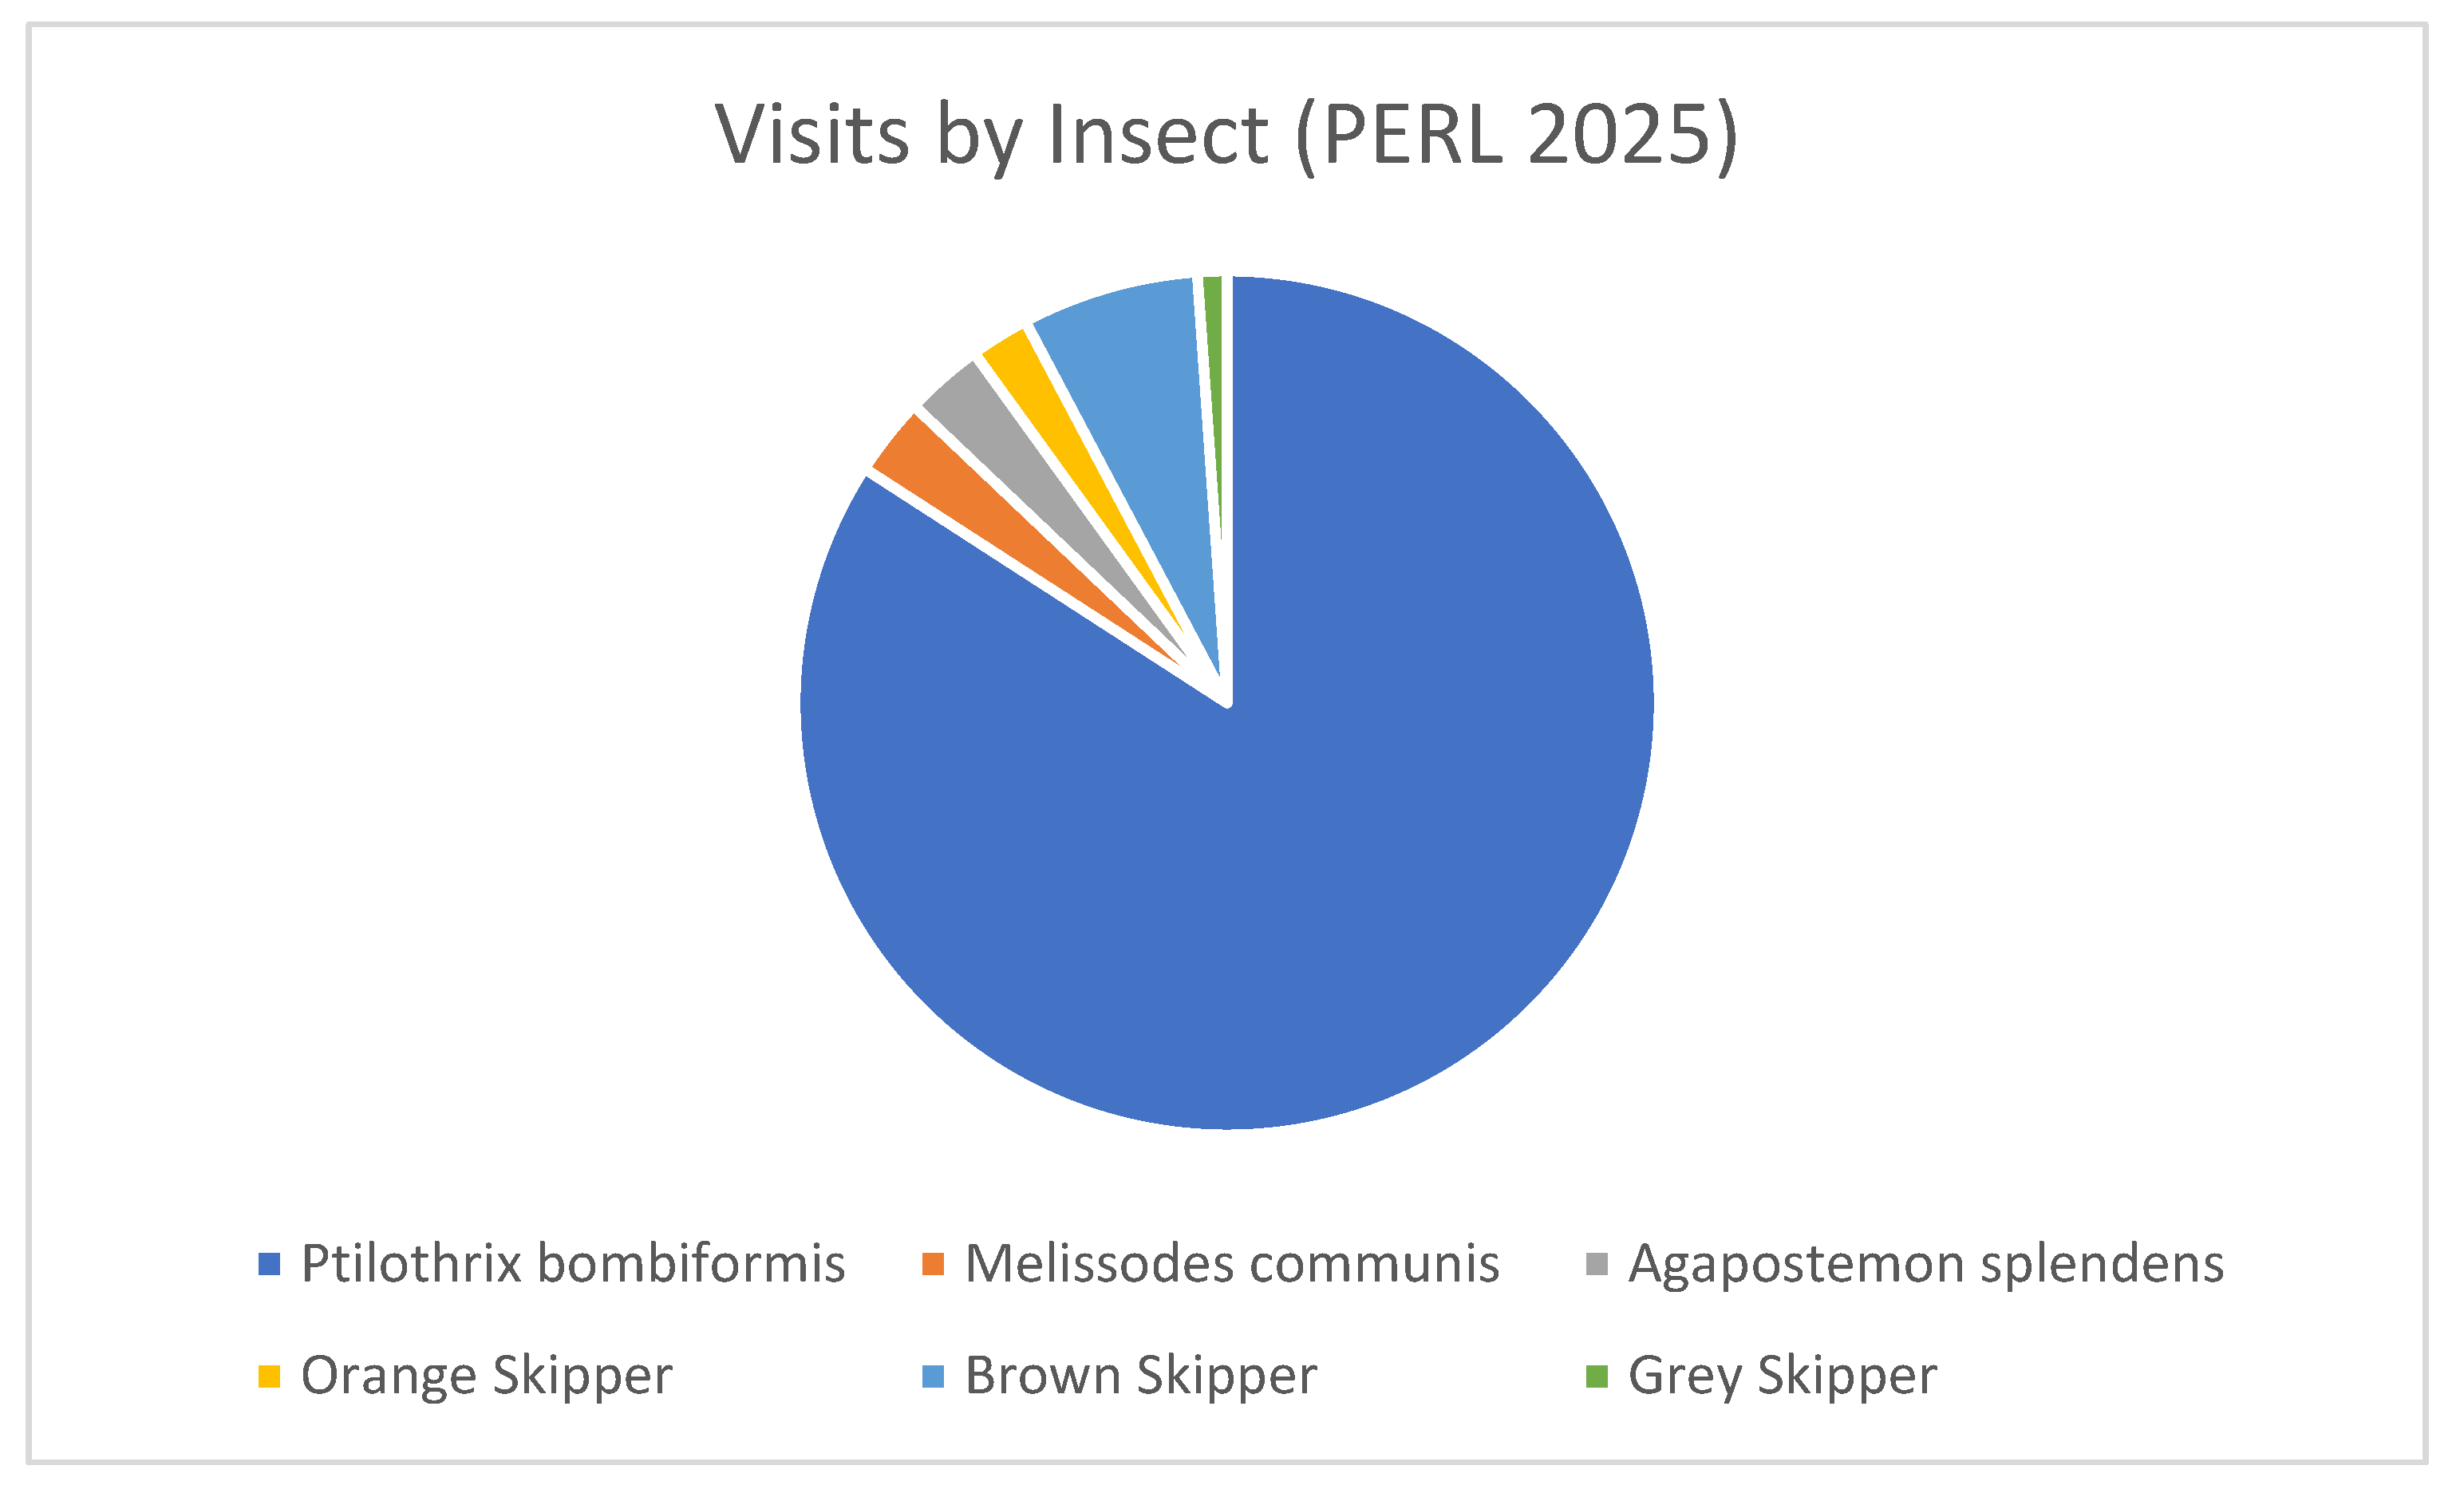
Table 6.
Floral visitation observations for Hibiscus dasycalyx at PERL from 10–27 June 2025. Counts represent the number of visits per taxon during timed floral observation periods. The specialist bee Ptilothrix bombiformis dominated early in the season, while skipper butterflies were the primary visitors later in June.
| Date | Ptilothrix bombiformis | Melissodes communis | Agapostemon splendens | Skippers | Total Visits | % Bees |
| 10 Jun | 110 | 2 | 5 | 0 | 117 | 100 |
| 11 Jun | 11 | 6 | 3 | 5 | 25 | 80.0 |
| 14 Jun | 107 | 0 | 0 | 4 | 111 | 96.4 |
| 16 Jun | 0 | 0 | 0 | 1 | 1 | 0 |
| 17 Jun | 0 | 0 | 0 | 1 | 1 | 0 |
| 19 Jun | 0 | 0 | 0 | 13 | 13 | 0 |
| 20 Jun | 0 | 0 | 0 | 3 | 3 | 0 |
| 27 Jun | 0 | 0 | 0 | 0 | 0 | 0 |
| Totals | 228 | 8 | 8 | 26 | 271 | 234 |
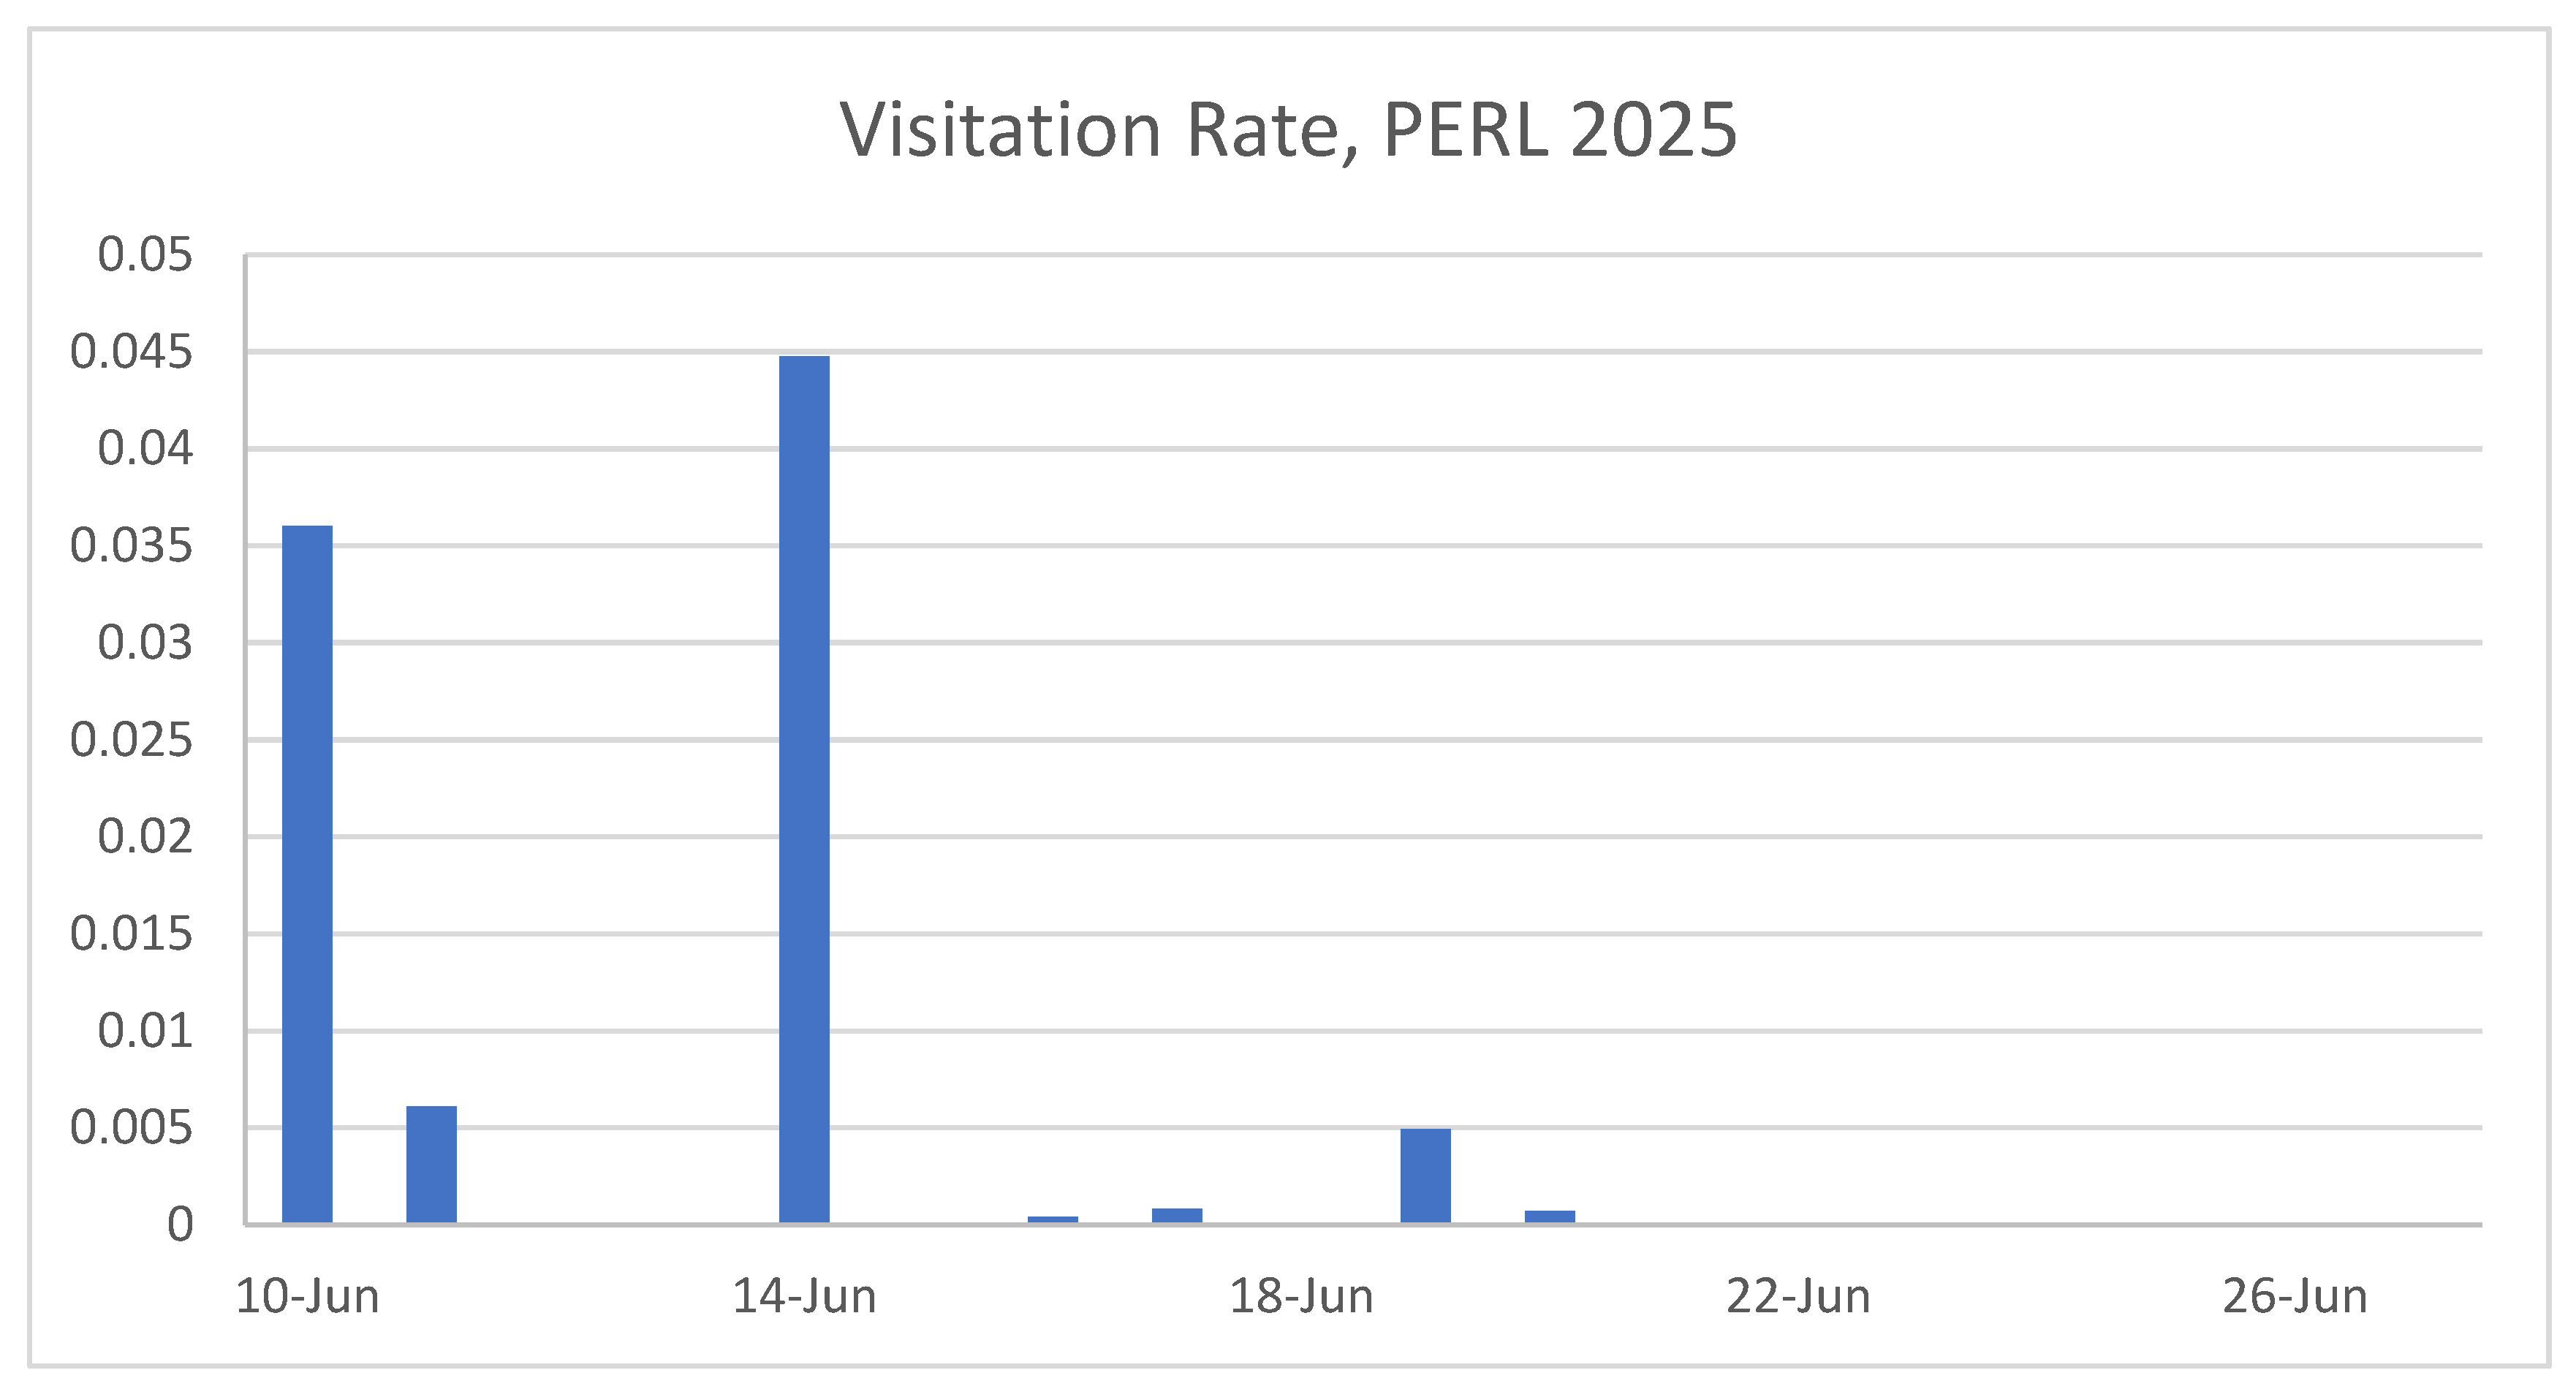
Figure 7.
Floral visitation rate per census period at the PERL population of Hibiscus dasycalyx in 2025, expressed as the number of visits per flower per minute. Visitation rates peaked sharply on June 14, driven primarily by activity of the specialist bee Ptilothrix bombiformis, and declined thereafter. Very low or no visitation was recorded during later observation dates, despite the presence of open flowers, highlighting a potential temporal mismatch between pollinator availability and floral display.
Time spent on flowers varied significantly among the three most common bee visitors (Agapostemon splendens, Melissodes communis, and Ptilothrix bombiformis) with ≥4 observations (H = 16.17, p < 0.001). Agapostemon splendens spent the longest time per visit, followed by Melissodes communis, and Ptilothrix bombiformis (Table 7). Post hoc tests indicated that Agapostemon splendens visits were significantly longer than those of Ptilothrix bombiformis (p = 0.00032), whereas differences involving Melissodes communis were not significant. These results highlight striking interspecific differences in handling times, with A. splendens exhibiting prolonged floral visits compared to the more rapid foraging behavior of P. bombiformis.
Within Ptilothrix, handling time differed strongly by foraging behavior (Table 8). Pollen-collecting visits (mean = 14.4 s ± 17.6 SD, n = 106) were substantially longer than nectaring visits (mean = 5.0 s ± 4.5 SD, n = 7). Statistical tests confirmed this difference (Welch’s t = 3.89, p < 0.001; Mann–Whitney U = 604.0, p = 0.0055). Thus, pollen foraging is associated with considerably longer floral handling times compared to nectar foraging. These differences highlight the efficiency of Ptilothrix in rapid nectar foraging and its effectiveness in pollen collection through extended contact with anthers and stigmas, supporting its role as the principal pollinator of Hibiscus dasycalyx.
Community overlap analyses confirmed these contrasts between LL and PERL as well as between 2024 and 2025 at PERL. The natural LL population in 2024 and PERL in 2025 were highly similar in floral visitor composition (Pianka’s index = 0.9915), reflecting the dominance of P. bombiformis in both. By contrast, LL 2024 and PERL 2024 exhibited almost no overlap (index = 0.0097), and PERL 2024 and 2025 also showed low overlap (index = 0.1385). These results indicate that PERL only intermittently supports a pollinator community resembling natural populations and that pollinator presence, particularly of P. bombiformis, may vary strongly across years.
3.3.2. Pollen Receipt and Removal
Pollen Receipt
Stigma pollen loads differed strongly among controlled treatments (Figure 8A). Autogamy flowers (n = 4) received no pollen grains (all stigma lobe scores = 0), confirming that Hibiscus dasycalyx is not autogamous. In contrast, hand self-pollinations (n = 1) and hand cross-pollinations (n = 7) each saturated stigmas with more than 500 grains per flower, equivalent to all five lobes receiving the maximum score (20). These results demonstrate that H. dasycalyx is fully self-compatible and has high outcrossing capacity but requires pollen transfer by pollinators or manual deposition to achieve fruit and seed set.
Open-pollinated flowers in the PERL experimental population (n = 43) exhibited highly variable stigma pollen loads (Figure 8B). Median deposition was only 10 grains, with a range from 0 to 750 grains. Approximately 26% of flowers received no pollen, and fewer than one-third (28%) exceeded the ~60-grain threshold required to fertilize the ~60 ovules typically present per fruit. Comparison with the natural source population at LL in 2024, where over 30 plants flowered, revealed a striking difference. Flowers at LL (n = 10) had a median stigma load of 91 grains (range: 9–268), and 80% of flowers exceeded the 60-grain threshold. A Mann–Whitney U test confirmed that deposition in the source population was significantly higher than in the experimental population (U = 314.0, p = 0.024) (Figure 8C). These results indicate that the larger, denser floral display in the LL population attracted pollinators and ensured higher pollen transfer, while the small and sparse PERL stand experienced severe pollinator limitation.
Pollen Removal
In the experimental PERL population (2025), open-pollinated flowers showed a pronounced mismatch between pollen removal from anthers and pollen receipt on stigmas (Figure 9). On average, only ~29% of anthers per flower were depleted, indicating that pollen remained abundant and largely unexported. Yet stigma deposition was highly variable and generally low (median = 10 grains, range = 0–750), with most flowers receiving fewer than the ~60 grains required to fertilize all ovules. Across flowers, pollen removal and receipt were only weakly correlated (r ≈ 0.25), demonstrating that pollen export from anthers did not consistently translate into deposition on conspecific stigmas. This mismatch suggests that pollinator activity, not pollen supply, limited reproductive success in the small experimental stand, where low floral density reduced visitation and effective pollen transfer.
Field observations at PERL in 2025 indicated that the specialist hibiscus bee Ptilothrix bombiformis was abundant from 10–14 June and present through 18 June but disappeared thereafter. This temporal shift in the pollinator community corresponded closely with patterns of pollen receipt and removal (Figure 10). Flowers observed before and during Ptilothrix activity (≤18 June, n = 20) received significantly more pollen (median = 65 grains per flower) than those sampled afterward (>18 June, n = 23; median = 5 grains; Mann–Whitney U = 339.0, p = 0.007). In addition, anther pollen removal was greater during the period of bee activity (median = 50%) than after (median = 10%), although this difference was not statistically significant (U = 286.5, p = 0.155). These results demonstrate that high pollen deposition and anther depletion were concentrated during the brief window of Ptilothrix abundance, whereas flowers sampled later, when only butterflies and non-hibiscus bees were present, showed little pollen removal and negligible stigma deposition.
3.4. Breeding System Study
3.4.1. Fruit Set
Breeding experiments demonstrated that Hibiscus dasycalyx is self-compatible but not autogamous (Table 9). Bagged flowers, which excluded pollinators, produced no fruits (0% fruit set) (Figure 11). Hand-pollinated flowers set the highest numbers of fruits when outcrossed (76.9%), followed by selfed flowers (57.1%) (Figure 11). Open-pollinated flowers at the experimental site set very few fruits (3.5%) in 2024, reflecting the absence of effective floral visitors. Open-pollinated flowers in 2025 had higher fruit set than in 2024 (Figure 11).
Because of small sample sizes in 2024, the data was combined for statistical analysis. In the combined data, fruit set differed significantly among pollination treatments (Figure 11, Figure 12). Autogamy resulted in no fruit set and was significantly less effective than hand self-pollination (odds ratio = 0.01, 95% CI: [0.00–0.17], p = 0.0016), hand cross-pollination (OR = 0.00, 95% CI: [0.00–0.05], p = 0.00007), and open pollination (OR = 0.04, 95% CI: [0.00–0.65], p = 0.0239). Hand self-pollination produced significantly higher fruit set than open pollination (OR = 3.94, 95% CI: [1.92–8.06], p = 0.00018) but was less effective than hand cross-pollination (OR = 0.26, 95% CI: [0.08–0.79], p = 0.0176). Hand cross-pollination was the most effective treatment overall, with fruit set odds over 15 times greater than under open pollination (OR = 15.40, 95% CI: [5.62–42.18], p < 0.000001). In contrast to fruit set, the mean number of seeds per fruit and mean seed weight per fruit did not differ significantly between selfed and outcrossed treatments.
3.4.2. Seed Germination
Total Germination Percentage
By Day 9 after planting, all treatments approached saturation, with estimated asymptotic germination near 100% (Figure 13A) (Control = 96%, Selfed = 95.5%, Outcross = 91.5%, total of 566 seeds germinated). A one-way ANOVA revealed no statistically significant differences in cumulative germination among treatments F(2, 597) = 1.327, p = 0.266. A two-way ANOVA including Tray as a blocking factor confirmed that neither treatment nor tray significantly influenced total germination; Treatment: F(2, 597) = 1.343, p = 0.262; Tray: F(3, 597) = 0.317, p = 0.813. A mixed-effects model with Tray as a random effect and Treatment as a fixed effect further supported these findings, with negligible block-level variation and no significant treatment effects.
Germination Speed
A one-way ANOVA comparing mean germination day across treatments showed no significant differences F(2, 597) = 1.474, p = 0.230 (Figure 13 B). This indicates that the timing of germination onset was consistent across breeding treatments.
4. Discussion
4.1. Differences Between Natural and Outplanted Sites
The selection of sites for creating new populations balances ecological comparability with long-term protection [9-10]. The two sites studied—a natural stand at LL and a created stand at PERL—were broadly similar in environmental conditions, though PERL is an artificial wetland (a former fish hatchery pond). Environmental and structural contrasts reflect their histories: LL plants experienced slightly higher soil pH and warmer soils, conditions that likely promoted faster growth and greater structural development. PERL, by contrast, had lower pH, cooler soils, and higher light availability, features typical of a more open canopy in an artificial pond setting. These conditions did not prevent survival but may have constrained growth, as PERL plants were smaller in height and stem diameter.
The greater stature and thicker stems at LL likely reflect both plant age and site stability, with individuals benefitting from years of favorable hydrological conditions. At PERL, established only in 2021, plants remain in earlier developmental stages. Their higher stem counts may represent vegetative proliferation rather than true clonal spread. These structural contrasts shaped phenological patterns: LL exhibited an extended, evenly distributed flowering season with high synchrony, maximizing pollinator visitation and conspecific pollen exchange. In contrast, PERL in 2024 flowered over a short, highly concentrated, and poorly synchronized period, limiting overlap among individuals and reducing opportunities for cross-pollination. By 2025, flowering duration and output increased at PERL, but synchrony remained lower than LL, suggesting continued constraints for an preferentially outcrossing species such as H. dasycalyx [1,2,3,4,5].
These findings underscore that both environmental conditions and demographic maturity determine reproductive performance. While restored populations can establish and persist under altered conditions, their structural and phenological differences may reduce pollination success and long-term viability. Continued monitoring is needed to assess whether restored populations eventually converge toward the phenology of natural stands or remain limited by site-specific factors.
4.2. Floral Visitors, Behavior, and Pollination Efficiency
Handling time varied strongly among floral visitors. Generalist bees (Agapostemon splendens) and skipper butterflies often remained for extended periods (sometimes >15 min), while Melissodes communis showed intermediate and highly variable visit lengths. By contrast, the specialist Ptilothrix bombiformis [18,20,21,22,23] exhibited short, stereotyped visits. Within Ptilothrix, visit length depended on behavior: nectaring bouts lasted only a few seconds, whereas pollen-collecting bouts ranged from 10–90 s. These pollen-collecting visits consistently involved stigma contact and efficient pollen removal, confirming Ptilothrix as the most effective pollinator. The extended visits of generalists and butterflies occasionally resulted in deposition but contributed less consistently to reproduction. Thus, pollinator identity and behavior strongly influence reproductive success, with H. dasycalyx disproportionately dependent on its specialist.
4.3. Breeding System
These findings confirm that H. dasycalyx is self-compatible but not autogamous, consistent with prior greenhouse studies [12]. Hand pollinations (self and cross) saturated stigmas and produced well-seeded fruits, showing that ovules are readily fertilized once pollen is delivered. However, autogamy produced no fruit in either year, confirming reliance on pollinators.
The breeding system closely parallels that of H. laevis, that is also incapable of autonomous self-pollination [12,24-26]. In this study, hand selfing yielded moderate fruit set (67%) but remained significantly lower than outcrossing (86%), indicating reduced effectiveness of selfing. This partial self-incompatibility echoes results in H. laevis [2]. By contrast, H. moscheutos is more self-compatible and capable of autogamy [25,26]. The complete absence of autogamous fruit set in H. dasycalyx highlights divergence within the genus, possibly shaped by habitat context: H. moscheutos occupies wetter, disturbed sites where reproductive assurance is advantageous, while H. dasycalyx persists in isolated, hydrologically variable habitats where outcrossing may be favored. These findings emphasize the species’ vulnerability to pollinator limitation and the importance of maintaining effective pollinator communities for conservation.
4.4. Pollinator Limitation in Small Experimental Populations
At PERL in 2025, only six of seven plants flowered, and most open-pollinated flowers received insufficient pollen. This reflects pollinator-mediated Allee effects typical of sparse populations, where small floral displays attract fewer visitors [6,8]. In contrast, LL flowers received significantly more pollen, consistent with higher success in large, dense populations. Recognizing this limitation, additional individuals have now been planted at PERL, boosting the population from <10 to >150 plants.
4.5. Pollen Removal–Receipt Mismatch
Patterns of pollen removal and receipt further explain seed set outcomes. Although anthers were rarely depleted, stigmas usually received fewer grains than needed to fertilize ~60 ovules. This mismatch explains the low and variable seed set in open-pollinated flowers, where many fruits aborted or contained few seeds. In contrast, controlled pollinations deposited >500 grains per stigma, saturating ovules and producing full capsules. At LL, most flowers naturally exceeded the 60-grain threshold, explaining higher seed set.
Thus, reproduction in Hibiscus dasycalyx is limited not by pollen availability but by transfer efficiency. Although pollen was abundant, low visitation and inefficient deposition left many ovules unfertilized. This mismatch highlights a key conservation challenge: small, recently established populations are especially prone to reproductive failure unless floral density is sufficient to attract and retain effective pollinators [27,28]. The weak correlation between pollen removal and stigma deposition further suggests substantial pollen wastage, likely due to provisioning behavior or transfer to heterospecific flowers [29,30].
4.6. The Role of Ptilothrix bombiformis
At PERL, successful pollination was tightly linked to Ptilothrix presence. Before 18 June, stigmas received significantly more pollen and anthers were depleted, reflecting effective transfer. After Ptilothrix disappeared, stigmas received negligible pollen despite visits from butterflies and non-hibiscus bees. These results confirm Ptilothrix as a keystone pollinator of H. dasycalyx [12,21,22,23]. With the recent expansion of additional plants at PERL, nesting by Ptilothrix near the host plants may increase, potentially restoring pollination services in future years.
4.7. Implications for Conservation and Restoration
These results underscore the vulnerability of small or experimental populations of Hibiscus dasycalyx to pollinator limitation [27-28]. Successful reintroductions will require establishing populations of sufficient size and floral density to attract and retain Ptilothrix bombiformis. Monitoring stigmatic pollen deposition alongside fruit and seed set offers a practical means of diagnosing reproductive constraints [29]. More broadly, the persistence of rare plants depends not only on habitat protection and plant survival but also on sustaining the functional pollinator interactions necessary to ensure long-term viability [30].
4.8. Seed Germination
Breeding system variation can affect early seed performance, with implications for restoration. In this study, seeds from selfed, outcrossed, and control pollinations showed no significant differences in total germination or germination speed under greenhouse conditions. This contrasts with patterns reported in many other taxa, where selfing often reduces germination through inbreeding depression, and outcrossing among genetically divergent individuals can result in outbreeding depression [31]. The absence of such effects here may reflect limited genetic divergence or strong maternal provisioning.
Encouragingly, this suggests that even populations experiencing limited pollinator services can produce viable seed cohorts. High germination percentages ensure strong recruitment potential, buffering against demographic stochasticity. As selfed seeds germinate as reliably as outcrossed seeds, they may still contribute meaningfully to persistence, particularly in small or isolated populations. However, long-term monitoring of survival, growth, and reproduction remains essential to determine whether differences emerge later in the life cycle. Ongoing tracking of these seedlings will help clarify whether early germination success translates into sustainable population growth.
5. Conclusions
This study demonstrates that while restored populations of Hibiscus dasycalyx can establish and reproduce under novel environmental conditions, their reproductive success remains constrained by limited flowering synchrony, small population size, and dependence on the specialist pollinator Ptilothrix bombiformis. Differences in plant structure, phenology, and pollination efficiency between natural and created sites underscore the challenges of reintroduction for this species. Although seeds from selfed and outcrossed pollinations germinated equally well under greenhouse conditions, sustained population viability will ultimately depend on ensuring adequate pollinator services and sufficient floral density to promote effective cross-pollination. Conservation strategies should therefore prioritize not only habitat protection and population augmentation but also the maintenance of functional pollinator interactions that secure long-term reproductive success and recovery of this rare species.
Supplementary Materials
The following supporting information can be downloaded at the website of this paper posted on Preprints.org. Figure S1: View of the natural population near Lovelady Texas (Houston County, Texas). Figure S2: View of the experimental population at the SHSU Piney Woods Lab (Walker County, Texas); Figure S3: View of digital cameras recording flower visitors at PERL in 2025; Figure S4: Behavior of the dominant flower visitor at LL (Hibiscus Bee, Ptilothrix bombiformis); Figure S5: Female hibiscus bee (Ptilothrix bombiformis) collecting pollen from Hibiscus dasycalyx flowers at the LL site; Video S1: Video of female Ptilothrix bombiformis harvesting pollen in ritualized behavior.
Author Contributions
This work is the sole product of the author.
Funding
We thank the Sam Houston State University College of Science and Engineering Technology 2024 Summer Undergraduate Research Program for funding this research.
Institutional Review Board Statement
Not applicable.
Informed Consent Statement
Not applicable.
Data Availability Statement
Data available upon request.
Acknowledgments
The author thanks Jamie Hooker of the Texas Land Conservancy for permission to study the Lovelady population, Alan Byboth of the Sam Houston State University Piney Woods Environmental Research Lab (PERL) and Dan Jones of the Texas Parks and Wildlife Department for starting the experimental population at PERL, Amber Bearb of the U.S. Fish and Wildlife Service for assistance, and Haley Posey, Gabrielle Almaraz, and Patrick Jordan for assistance with field work in 2024 at LL and PERL, Rebeka Garcia for greenhouse assistance for the germination study, and Sandra Pierre-Jules for assistance with the 2025 breeding system study. During the preparation of this manuscript/study, the author(s) used ChatGpt Version 5 and Microsoft CoPilot GPT-5 for the purposes of figure creation. The author has reviewed and edited the output and takes full responsibility for the content of this publication.
Conflicts of Interest
The author declares no conflicts of interest. The funders had no role in the design of the study; in the collection, analyses, or interpretation of data; in the writing of the manuscript; or in the decision to publish the results
References
- Rathcke, B.; Lacey, E.P. Phenological patterns of terrestrial plants. Annu. Rev. Ecol. Syst. 1985, 16, 179–214. [Google Scholar] [CrossRef]
- Forrest, J.; Miller-Rushing, A.J. Toward a synthetic understanding of the role of phenology in ecology and evolution. Philos. Trans. R. Soc. B Biol. Sci. 2010, 365, 3101–3112. [Google Scholar] [CrossRef] [PubMed]
- Menz, M.H.M.; Phillips, R.D.; Winfree, R.; Kremen, C.; Aizen, M.A.; Johnson, S.D.; Dixon, K.W. Reconnecting plants and pollinators: Challenges in the restoration of pollination mutualisms. Trends Plant Sci. 2011, 16, 4–12. [Google Scholar] [CrossRef] [PubMed]
- Bischoff, A.; Steinger, T.; Müller-Schärer, H. The importance of plant provenance and genotypic diversity of seed material used for ecological restoration. Restor. Ecol. 2010, 18, 338–348. [Google Scholar] [CrossRef]
- Breed, M.F.; Harrison, P.A.; Blyth, C.; Byrne, M.; Gaget, V.; Gellie, N.J.C.; et al. The potential of genomics for restoring ecosystems and biodiversity. Nat. Rev. Genet. 2019, 20, 615–628. [Google Scholar] [CrossRef]
- Sipes, S.D.; Tepedino, V.J. Reproductive biology of the rare orchid Spiranthes diluvialis: Breeding system, pollination and implications for conservation. Conservation Biology 1995, 9, 929–938. [Google Scholar] [CrossRef]
- Kremen, C.; M’Gonigle, L.K. Small-scale restoration in intensive agricultural landscapes supports more specialized and less mobile pollinator species. J. Appl. Ecol. 2015, 52, 602–610. [Google Scholar] [CrossRef]
- Buisson, E.; Alvarado, S.T.; LeStredic, S.; Morellato, L.P.C. Plant phenological research enhances ecological restoration. Restoration Ecology 2017, 2017. 25, 164–171. [Google Scholar] [CrossRef]
- U.S. Fish and Wildlife Service (USFWS). Neches River Rose-Mallow (Hibiscus dasycalyx) Recovery Plan; U.S. Department of the Interior: Albuquerque, NM, USA, 2013.
- Center for Plant Conservation. Hibiscus dasycalyx. 2024. Available online: https://saveplants.org (accessed on 25 July 2025).
- Poole, J.M.; Carr, W.R.; Price, D.M.; Singhurst, J.R. Rare Plants of Texas; Texas A&M University Press: College Station, TX, USA, 2008, 650p.
- Klips, R.A. Genetic affinity of the rate eastern Texas endemic Hibiscus dasycalyx (Malvaceae). American Journal of Botany, 1995, 82(11), 1463-1472.
- Blanchard, O.J. Morphological and hybridization studies in Hibiscus sect. Muenchhusia. Ph.D. Thesis, Cornell University, Ithaca, NY, USA, 1976. [Google Scholar]
- Wise, D.A.; Menzel, M.Y. Genetic affinities of the North American species of Hibiscus sect Trioner. Brittonia, 1977, 23, 425–437. [Google Scholar] [CrossRef]
- Sain, M.P.; Norrell-Tober, J.; Barthel, K.; Seawright, M.; Blanton, A.; Hertweck, K.L.; et al. Multiple complementary studies clarify which co-occurring congener presents the greatest hybridization threat to a rare Texas endemic wildflower (Hibiscus dasycalyx: Malvaceae). J. Bot. Res. Inst. Tex. 2021, 15, 283–308. [Google Scholar] [CrossRef]
- Small, R.L. Phylogeny of Hibiscus sect. Muenchhusia (Malvaceae) based on chloroplast rpl16 and ndhF, and nuclear ITS and GBSSI sequences. Syst. Bot. 2004, 29, 385–392.Simpson, M.D. 2009. An evaluation of Hibiscus moscheutos ssp. lasiocarpos and Ipomoea pandurata as host plants of the specialist bee Ptilothrix bombiformis (Apoidea: Emphorini) and the role of floral scent chemistry in host-plant selection. MS Thesis, Paper 107. Southern Illinois University, Carbondale, IL.
- Kartesz, J.T. Biota of North America Program (BONAP). 2014. Available online: http://bonap.org (accessed on 3 November 2024).
- Rust, R.W. The biology of Ptilothrix bombiformis (Hymenoptera: Anthophoridae). J. Kans. Entomol. Soc. 1980, 53, 427–436. [Google Scholar]
- Minitab. Minitab Statistical Software, Version 21.4.3; Minitab LLC: State College, PA, USA, 2024. [Google Scholar]
- Cane, J.H.; Sipes, S. Characterizing floral specialization by bees: Analytical methods and a revised lexicon for oligolecty. In Plant–Pollinator Interactions: From Specialization to Generalization; Waser, N.M., Ollerton, J., Eds.; University of Chicago Press: Chicago, IL, USA, 2006; pp. 99–122. [Google Scholar]
- Pascarella, J.B. An annotated checklist of the bee (Hymenoptera: Apoidea) faunal diversity in southeastern forest ecosystems of the USA. Trends Entomol. 2023, 19, 113–127. [Google Scholar]
- Rust, R.W. The biology of Ptilothrix bombiformis (Hymenoptera: Anthophoridae). J. Kans. Entomol. Soc. 1980, 53, 427–436. [Google Scholar]
- Flórez-Gómez, N.; Danforth, B. The North American bees of the genus Ptilothrix Cresson, 1878 (Hymenoptera, Apidae, Emphorini), with the description of two new species. J. Hymenopt. Res. 2023, 95, 275–293. [Google Scholar] [CrossRef]
- 24. Klips, R. A., Snow. A.A. Delayed autonomous self-pollination in Hibiscus leavis (Malvaceae). Am. J. Bot. 1997, 84, 48-53.
- Klips, R.A. Pollen competition as a reproductive isolating mechanism between two sympatric Hibiscus species (Malvaceae). Am. J. Bot. 1999, 86, 269–272. [Google Scholar] [CrossRef]
- Snow, A. A. , & Spira, T. P. Differential pollen-tube growh rates and nonrandom fertilization in Hibiscus moscheutos. Am. J. Bot. 1991, 78, 1419–1426. [Google Scholar]
- Knight, T.M.; Steets, J.A.; Vamosi, J.C.; Mazer, S.J.; Burd, M.; Campbell, D.R.; Dudash, M.R.; Johnston, M.O.; Mitchell, R.J.; Ashman, T.L. Pollen limitation of plant reproduction: Pattern and process. Annu. Rev. Ecol. Evol. Syst. 2005, 36, 467–497. [Google Scholar] [CrossRef]
- Gascoigne, J.; Berec, L.; Gregory, S.; Courchamp, F. Dangerously few liaisons: A review of mate-finding Allee effects. Popul. Ecol. 2009, 51, 355–372. [Google Scholar] [CrossRef]
- Kearns, C.A.; Inouye, D.W. Pollinators, flowering plants, and conservation biology. BioScience 1997, 47, 297–307. [Google Scholar] [CrossRef]
- Aguilar, R.; Ashworth, L.; Galetto, L.; Aizen, M.A. Plant reproductive susceptibility to habitat fragmentation: Review and synthesis through a meta-analysis. Ecol. Lett. 2006, 9, 968–980. [Google Scholar] [CrossRef]
- Charlesworth, D. , & Willis, J. H. The genetics of inbreeding depression. Nat. Rev. Genet. 2009, 10, 783–796. [Google Scholar] [CrossRef]
Figure 1.
Comparison of plant size traits between the natural population (LL) and experimental population (PERL) of Hibiscus dasycalyx. (A) Number of stems per plant, (B) plant height, and (C) stem diameter. Boxplots show medians, interquartile ranges, and individual data points. Different letters above boxes indicate significant differences between populations based on Tukey HSD tests (p < 0.05).
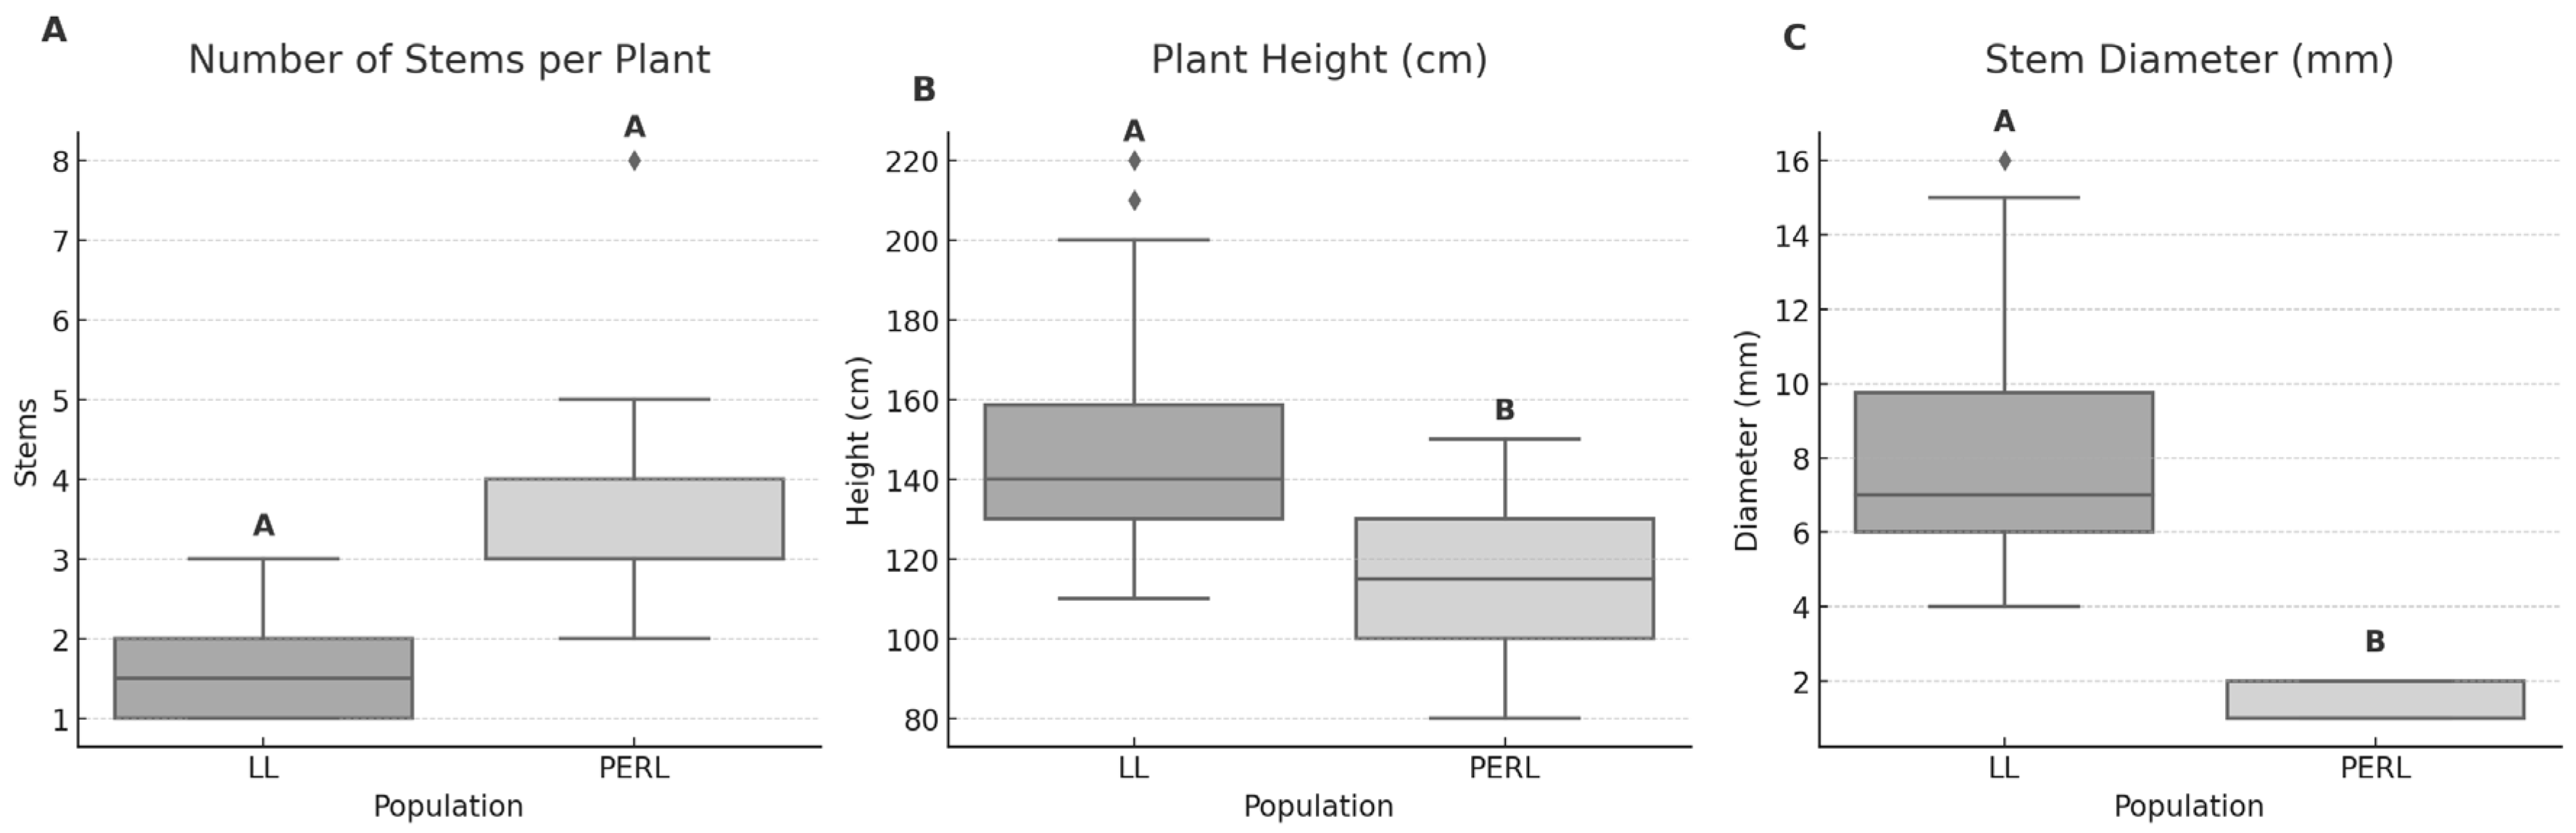
Figure 2.
Relative flowering intensity of Hibiscus dasycalyx at LL (2024) and PERL (2024, 2025). Flowering is expressed as the proportion of total flowers produced in one-week bins beginning 15 May. LL 2024 (blue, solid line) showed a broad distribution of flowering, PERL 2024 (red, dashed line) had a sharp early peak, and PERL 2025 (red, solid line) displayed an intermediate, extended pattern.
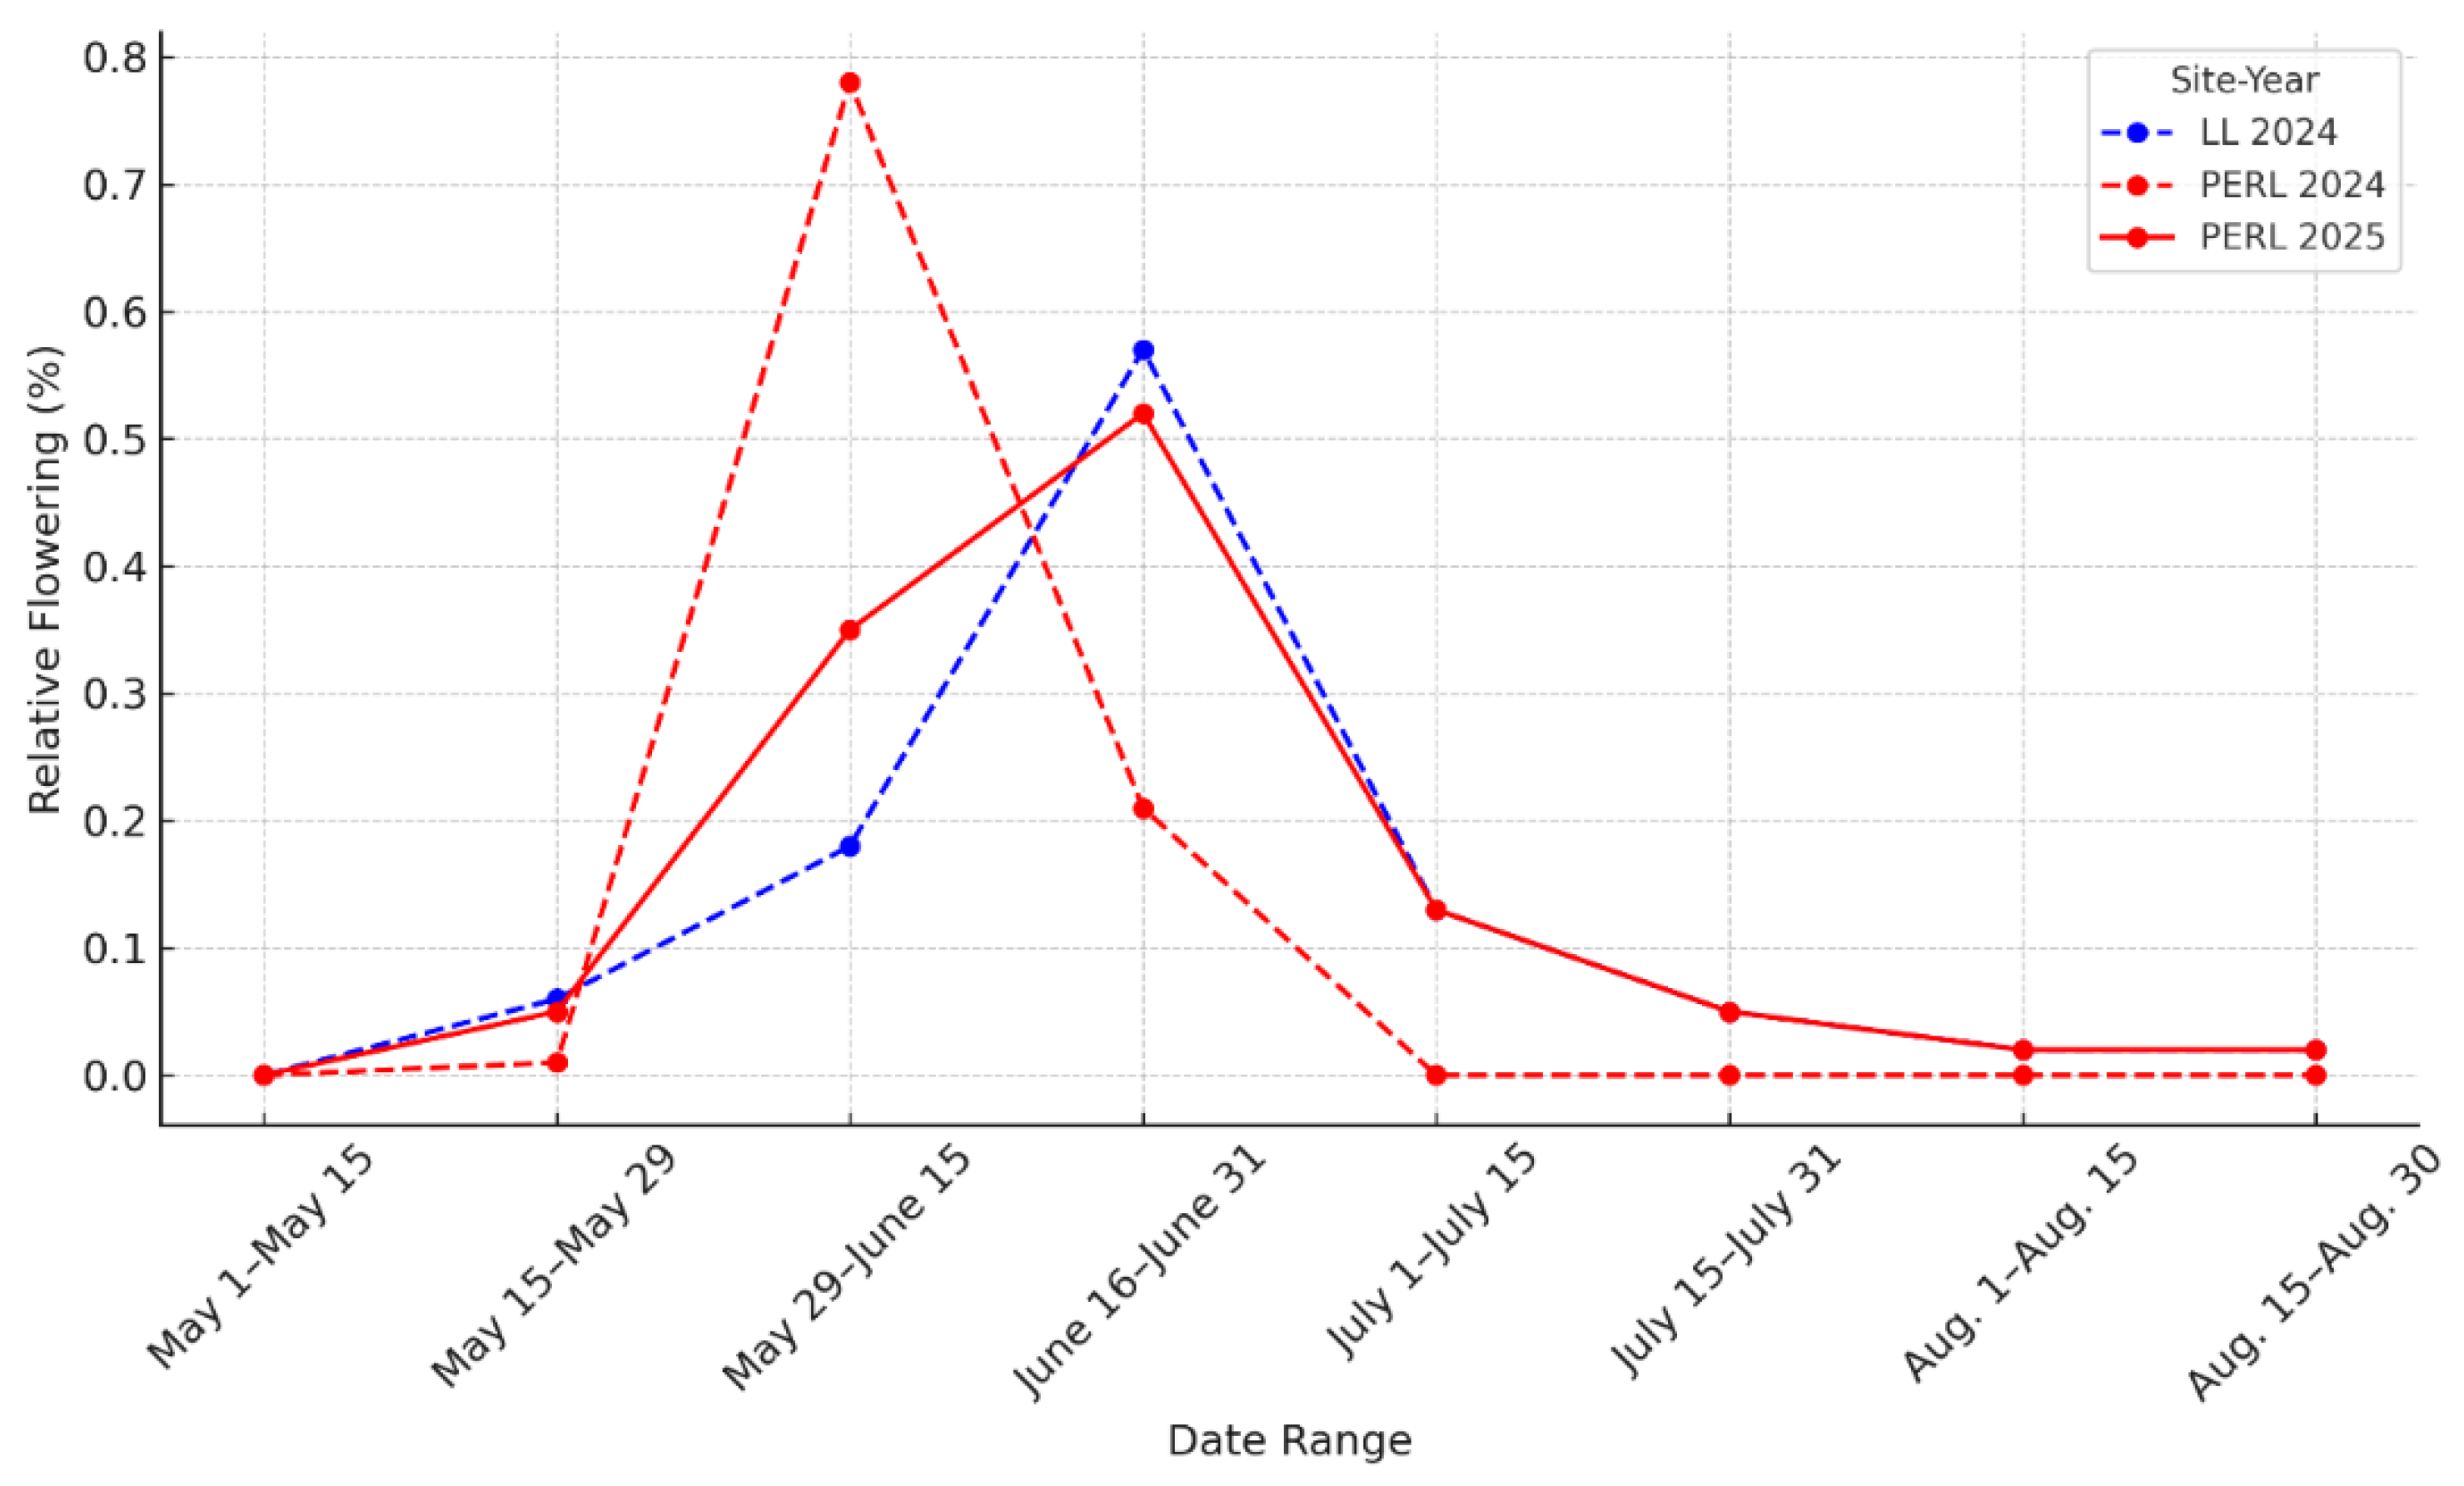
Figure 3.
Cumulative proportion of flowering of Hibiscus dasycalyx at LL (2024) and PERL (2024, 2025). Cumulative flowering curves for Hibiscus dasycalyx across three site-years (LL 2024, PERL 2024, PERL 2025), showing the proportion of flowers produced from May 15 to August 1. The 50% flowering threshold (grey dashed line) was reached on June 10 (PERL 2024), June 13 (LL 2024), and June 18 (PERL 2025). These patterns reflect temporal variation in phenology across sites and years, with implications for pollinator interactions, seed production, and conservation planning.
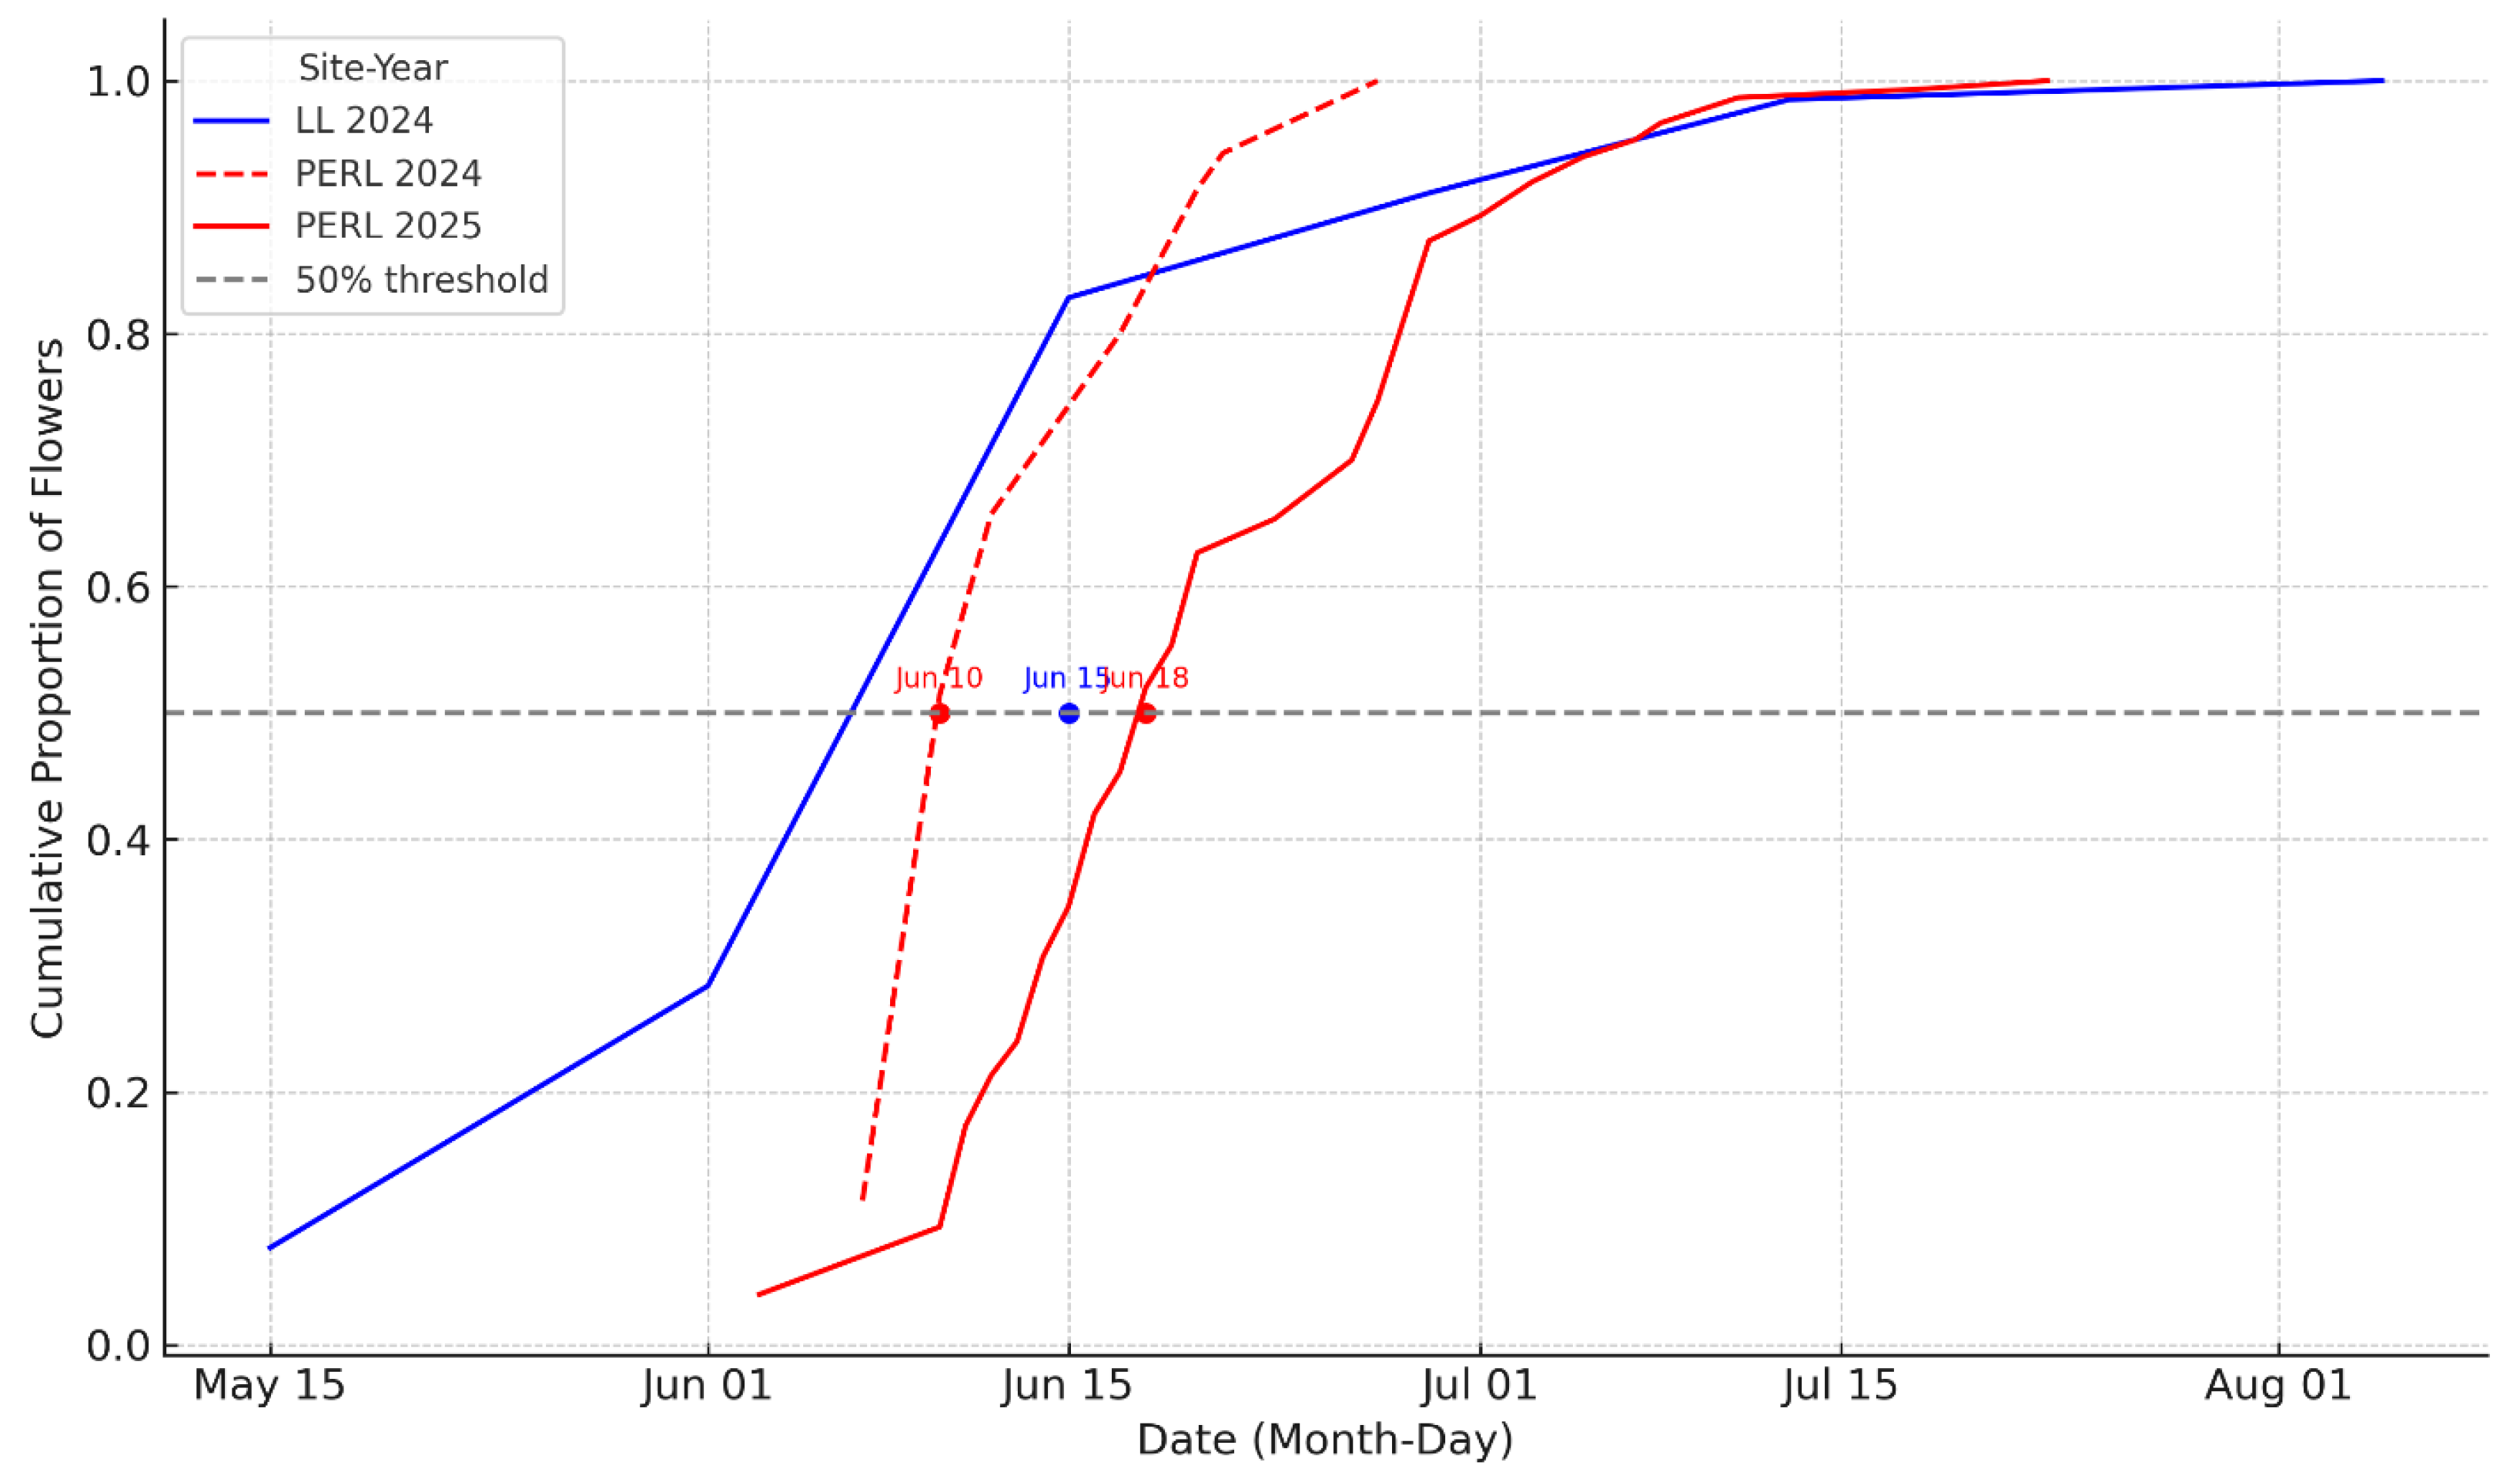
Figure 8.
Stigma pollen deposition in Hibiscus dasycalyx under controlled and natural pollination treatments. (A) Boxplots of estimated pollen grains per flower in the experimental PERL population (2025) for autogamy, selfed, crossed, and open-pollinated treatments. Hand self- and cross-pollinations saturated stigmas with >500 grains, while autogamy flowers received no pollen; open-pollinated flowers showed highly variable deposition. The red dashed line indicates ~60 grains, the approximate threshold required to fertilize ~60 ovules per fruit. (B) Histogram of estimated pollen grains in open-pollinated flowers at PERL, illustrating that most flowers received <30 grains, with only a minority surpassing the 60-grain threshold. (C) Boxplot comparison of total stigma pollen grains per flower in open-pollinated flowers at the experimental PERL population (2025, 6 of 7 plants flowering) versus the natural LL source population (2024, ~200 plants, >30 flowering). Flowers in the dense source population received significantly greater pollen deposition (median = 91 grains, 80% ≥ 60 grains) compared to the sparse experimental population (median = 10 grains, 28% ≥ 60 grains; Mann–Whitney U = 314.0, p = 0.024).
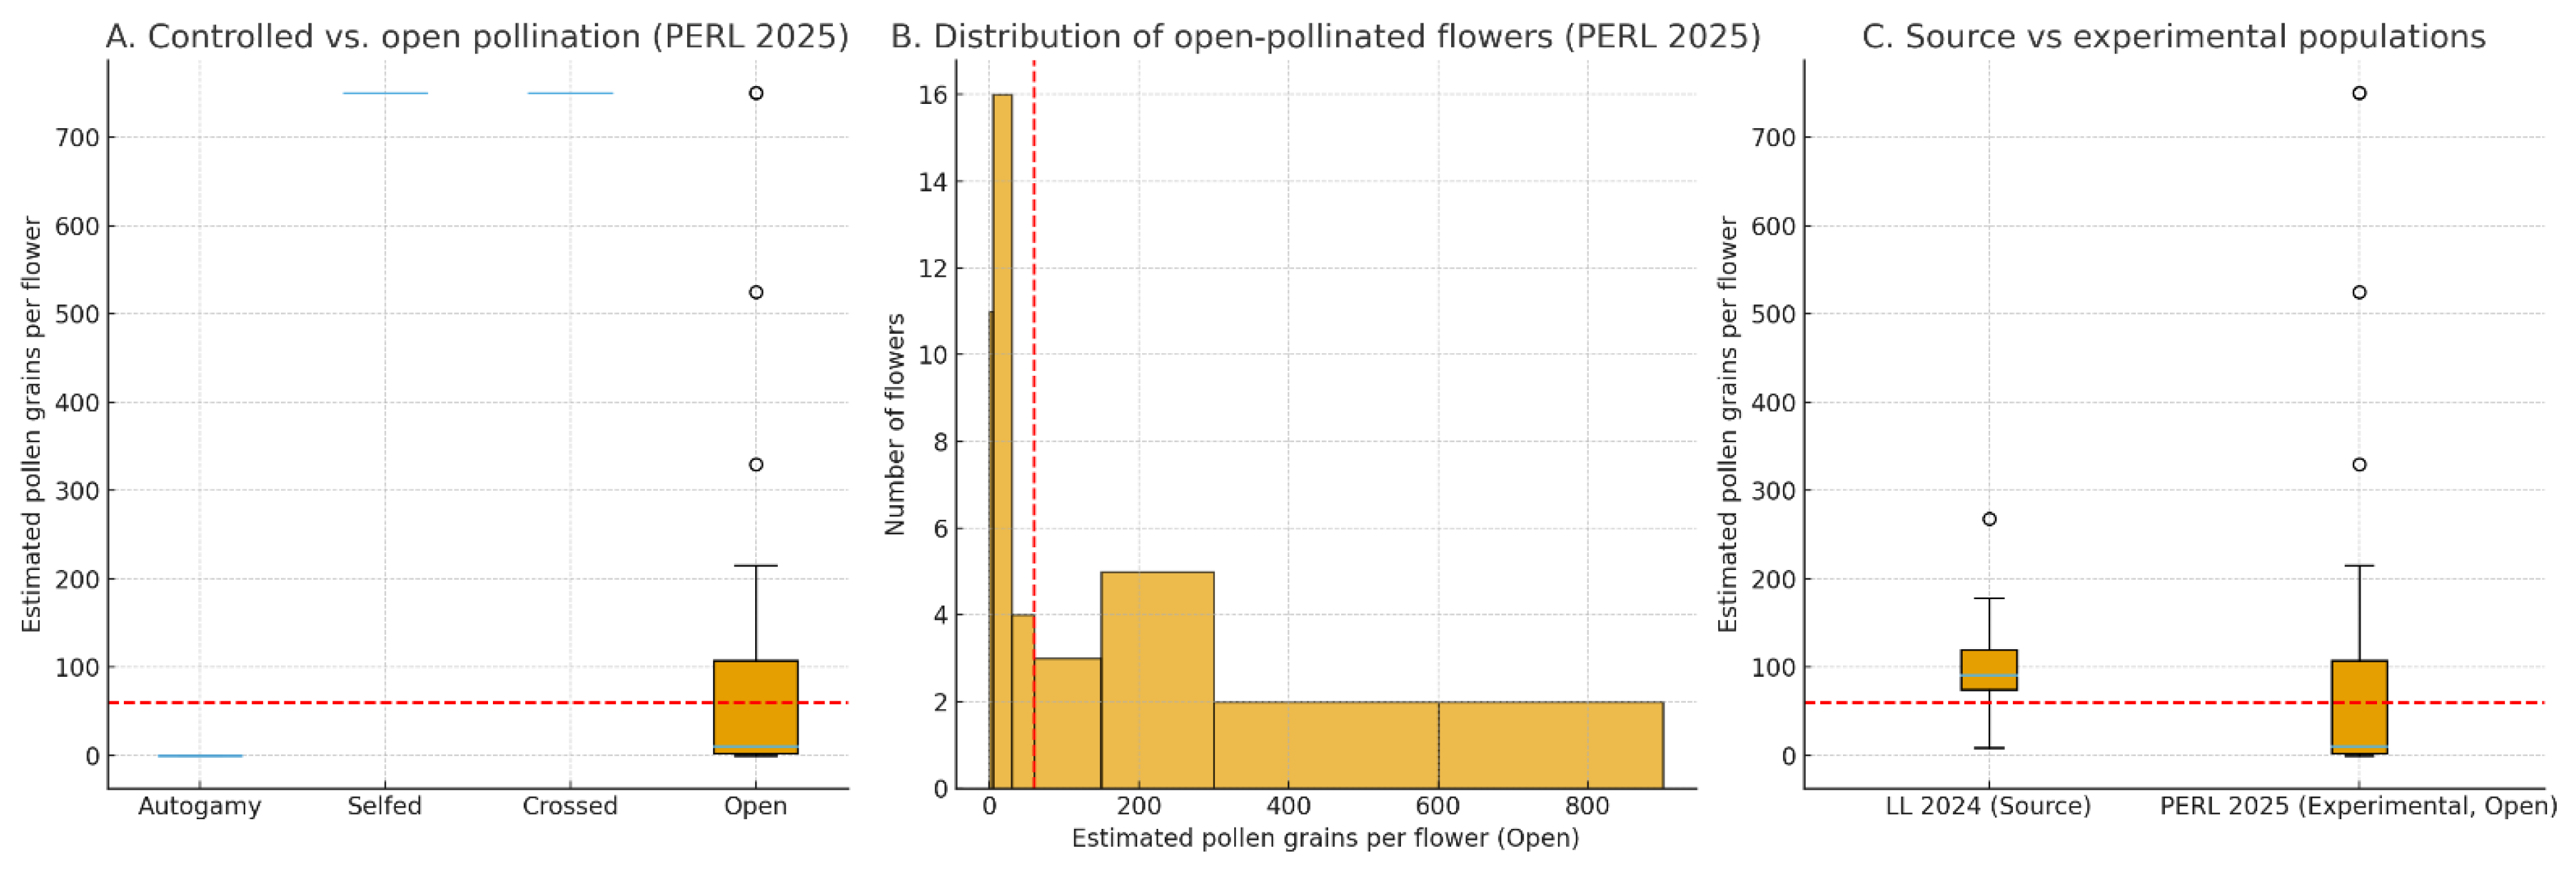
Figure 9.
Relationship between pollen removal and pollen receipt in open-pollinated flowers of Hibiscus dasycalyx at the PERL experimental population in 2025. Pollen removal is expressed as the percentage of anthers depleted (1 = full, 2 = sparse, 3 = empty, converted to 0, 50, and 100% respectively), while pollen receipt is estimated from stigma lobe scores (0–4) converted to grain count midpoints (0, 5, 30, 75, 150) and summed across five lobes. Each point represents a single flower (n = 43). The dashed line indicates the fitted linear trend (r ≈ 0.25), showing a weak positive association between pollen removal and stigma deposition. Despite pollen remaining abundant in many anthers, stigmatic pollen receipt was frequently low, indicating that pollinator limitation rather than pollen supply constrained reproduction in this experimental stand.
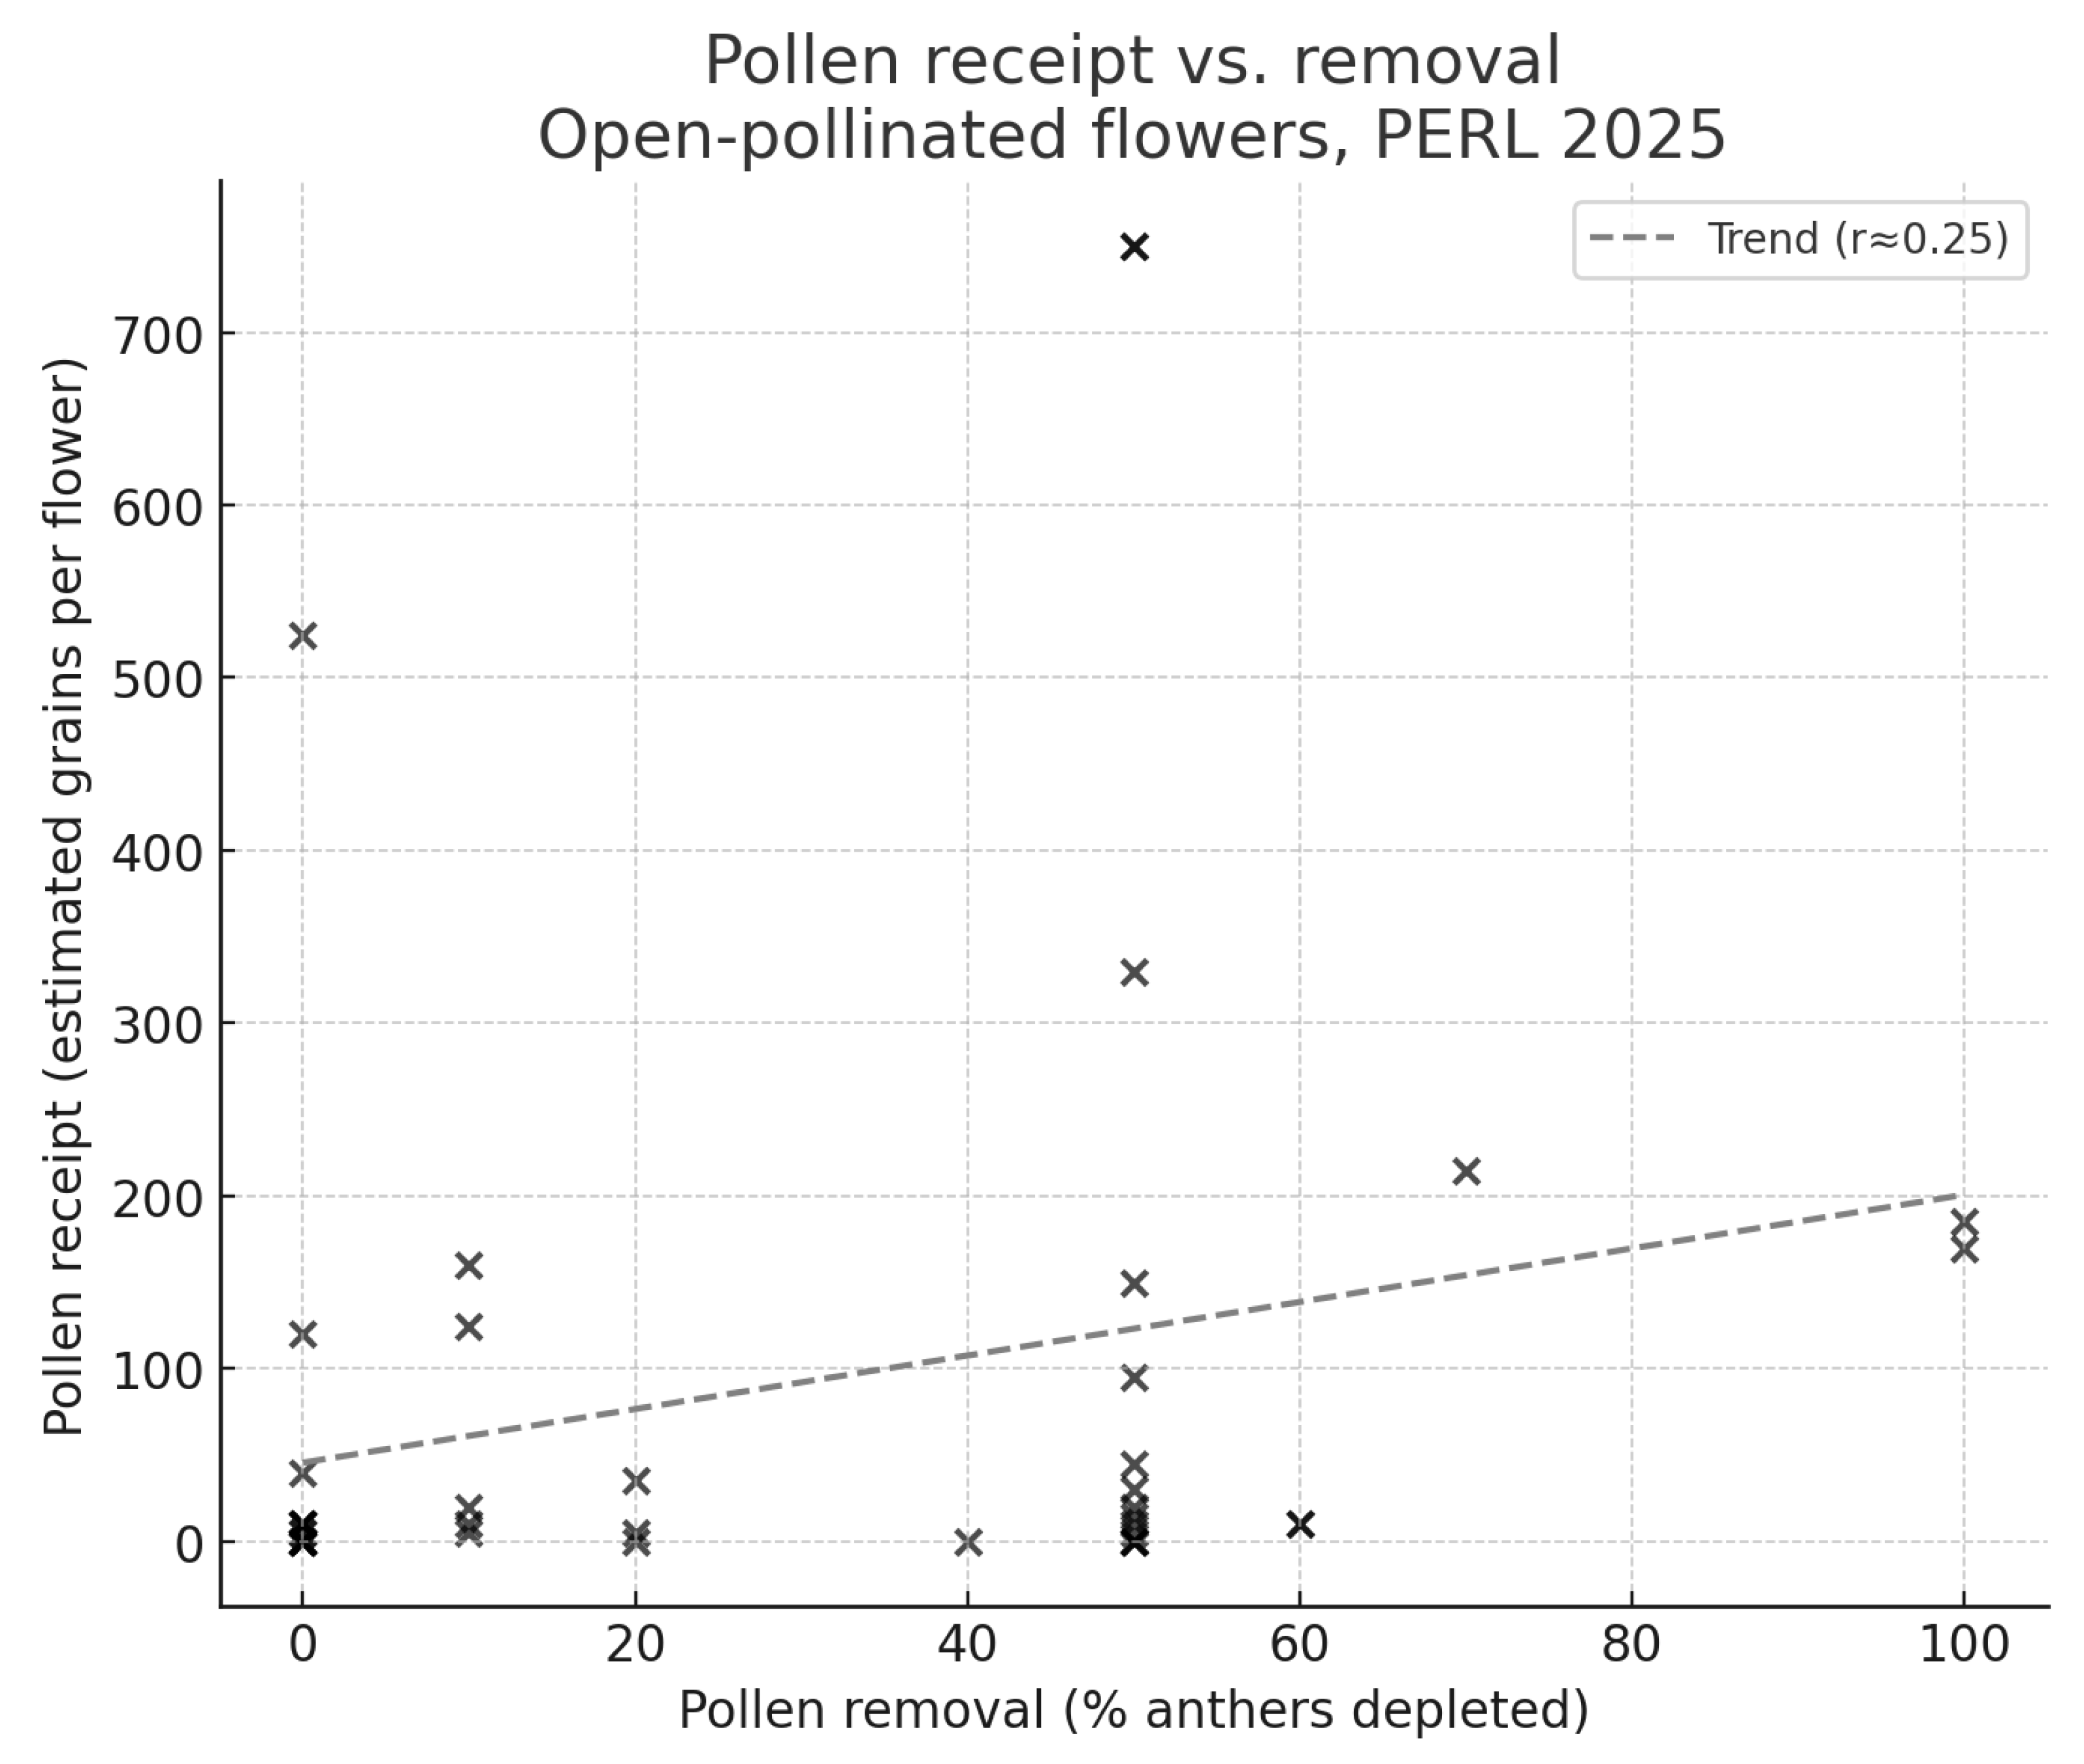
Figure 10.
Pollen receipt and removal in open-pollinated flowers of Hibiscus dasycalyx at the PERL experimental population in 2025, before and after the disappearance of specialist pollinators (Ptilothrix bombiformis). (Left) Stigma pollen receipt (estimated grains per flower) was significantly higher when Ptilothrix bees were present (≤18 June; median = 65 grains) than after they disappeared (>18 June; median = 5 grains; Mann–Whitney U = 339.0, p = 0.007). The red dashed line indicates the approximate ~60-grain threshold required to fertilize all ovules. (Right) Anther pollen removal (% of anthers depleted) tended to be greater when Ptilothrix were present (median = 50%) than after they disappeared (median = 10%), although this difference was not statistically significant (Mann–Whitney U = 286.5, p = 0.155). These results indicate that Ptilothrix bees were the primary effective pollinators, while butterflies and non-Hibiscus bees contributed little to pollen transfer.
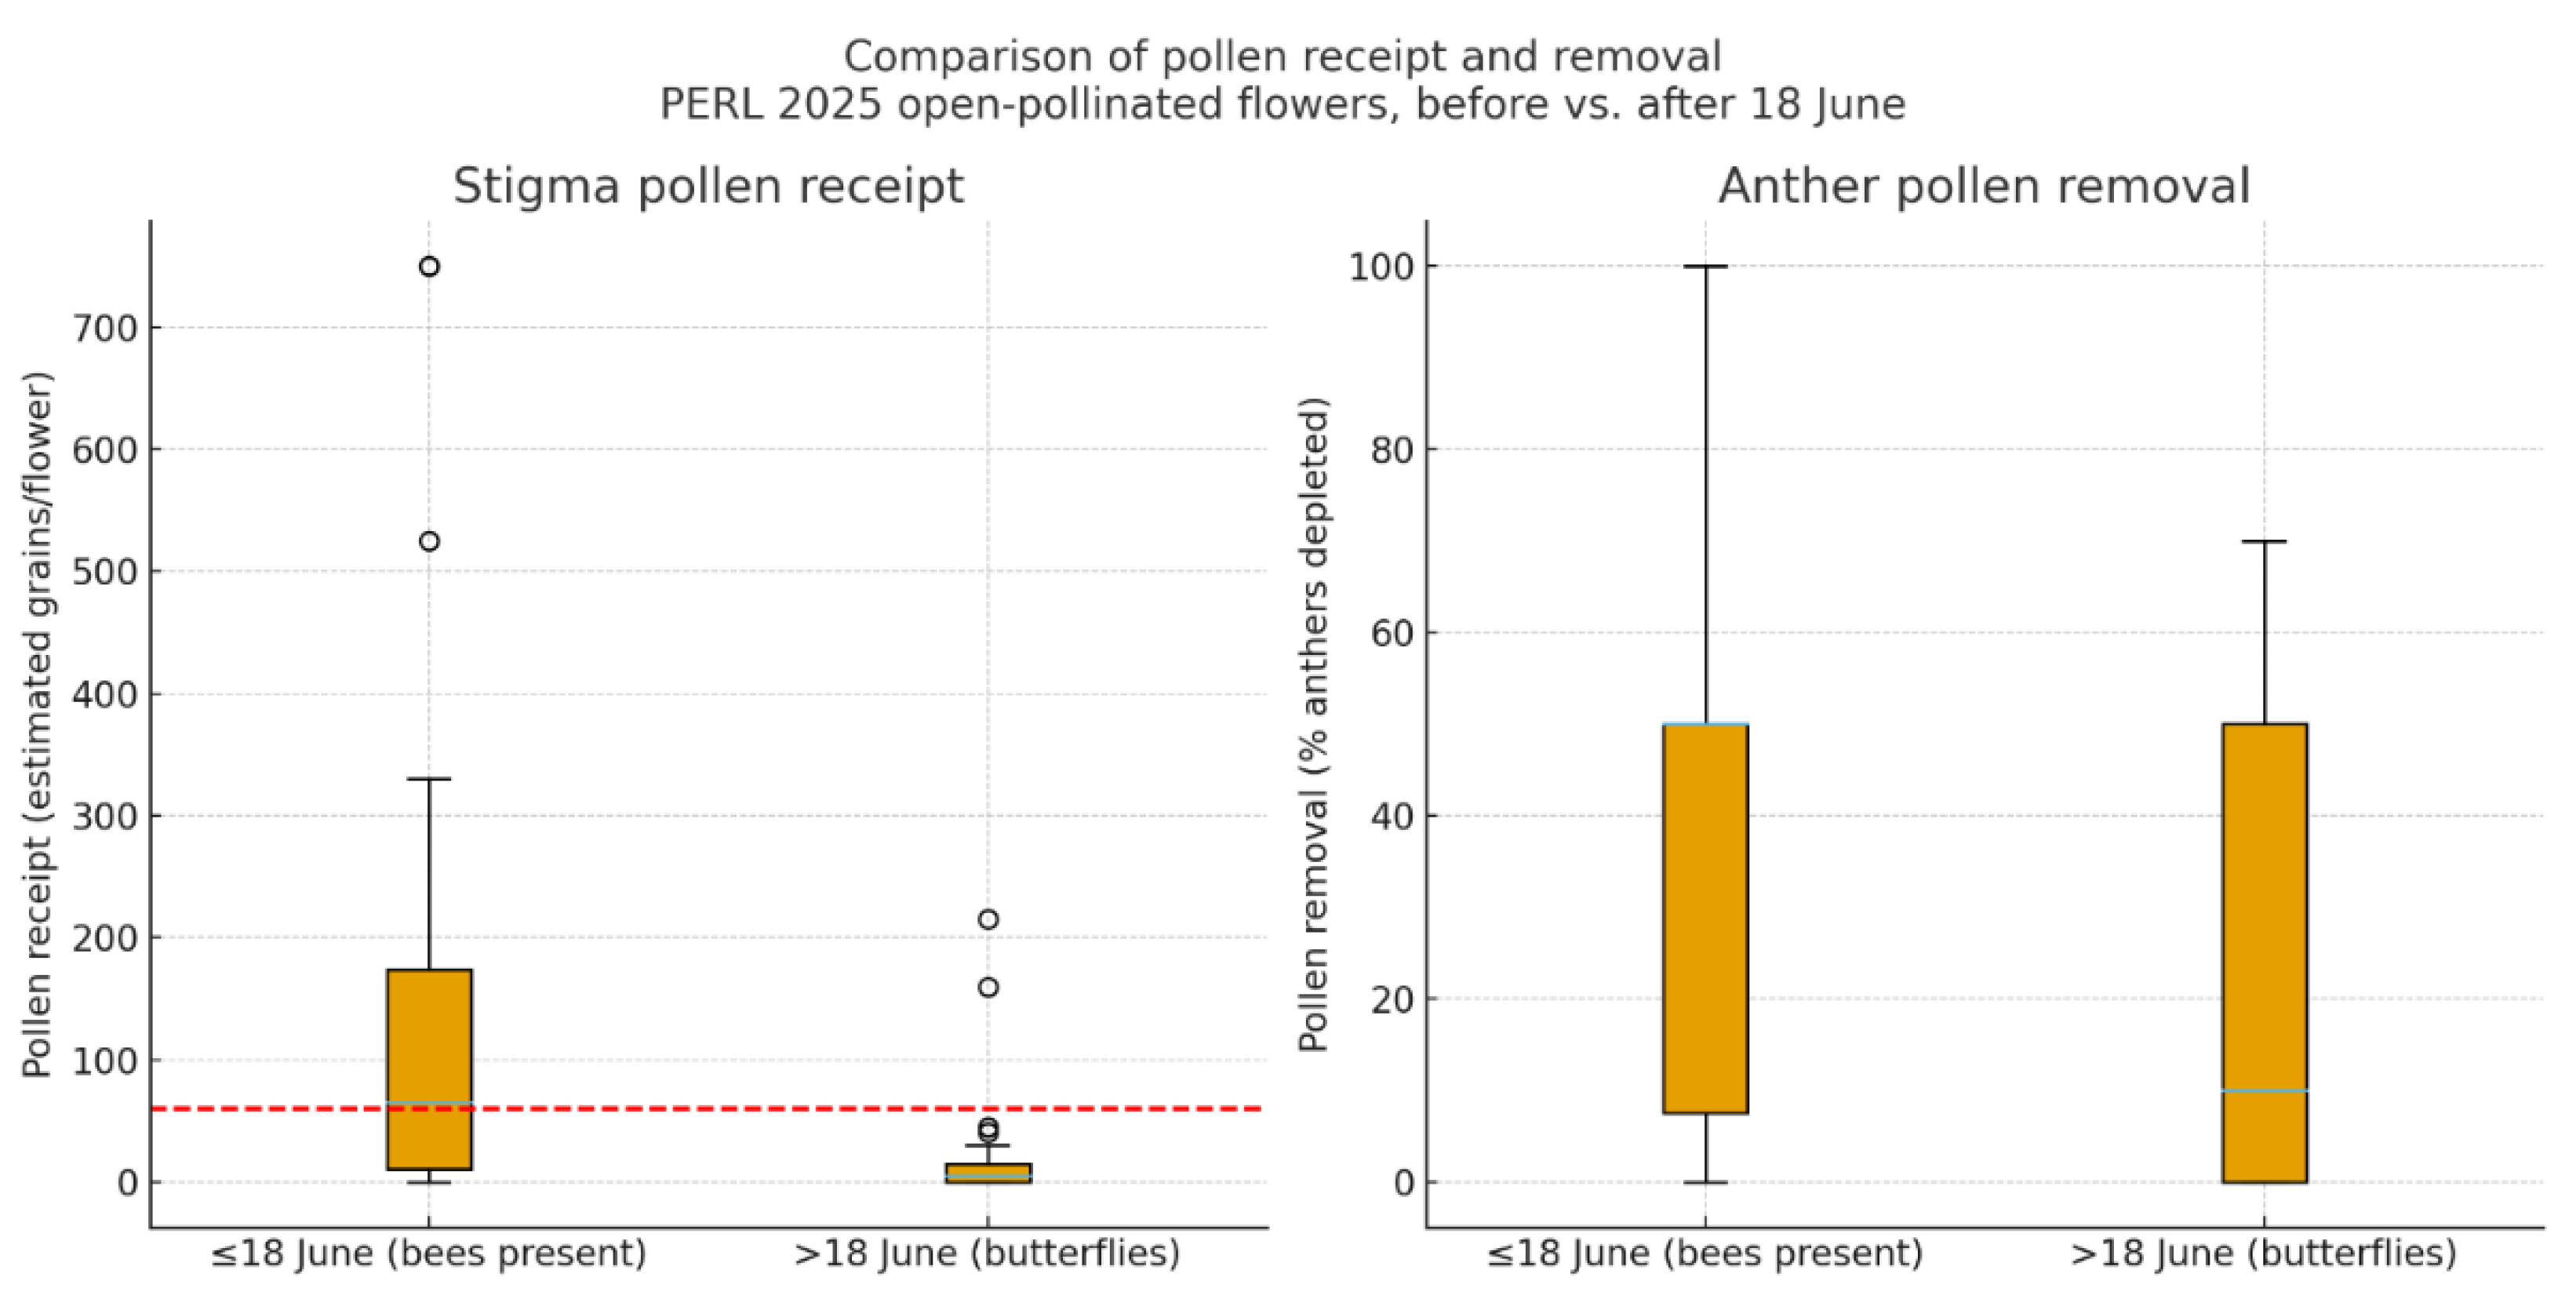
Figure 11.
Fruit set proportion by pollination treatment in 2024, 2025, and the combined dataset. Bars represent the mean proportion of flowers that set fruit for each treatment: Autogamy, Open Pollination, Hand Self-Pollination, and Hand Outcross-Pollination. Error bars indicate 95% confidence intervals calculated using the Wilson method. Hand cross-pollination consistently yielded the highest fruit set across years, while autogamy resulted in no fruit production in either year.
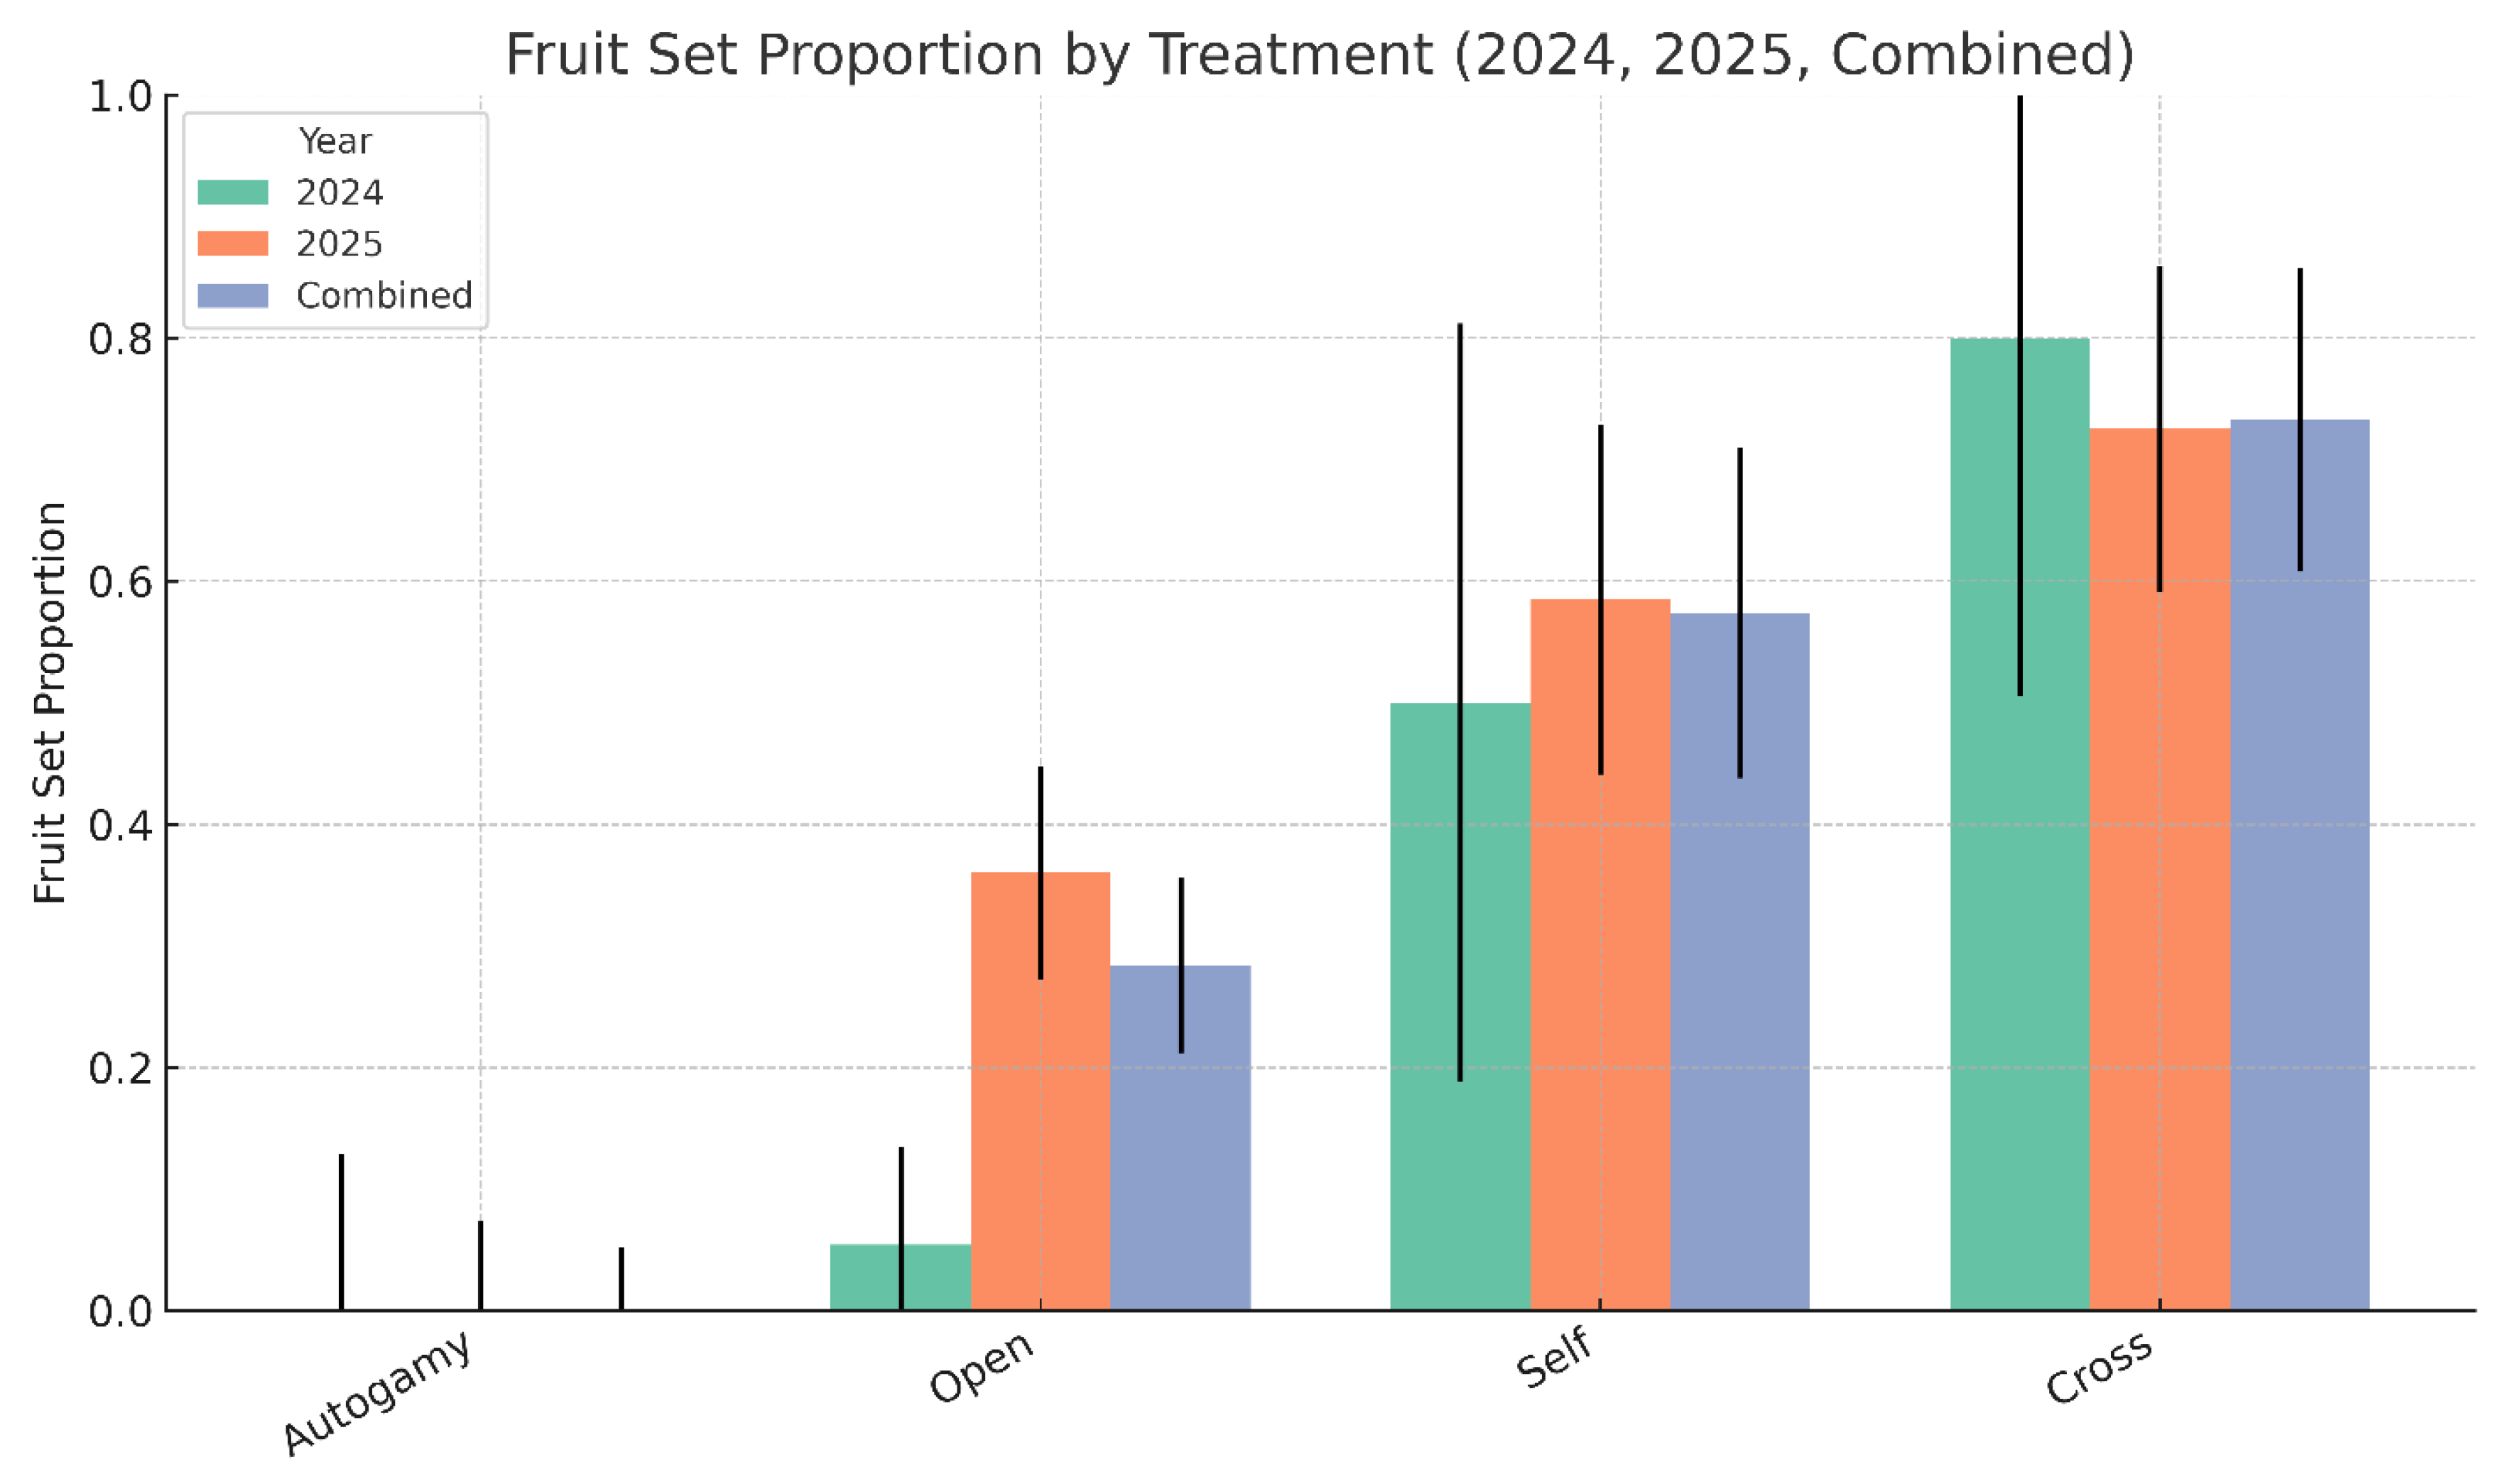
Figure 12.
Pairwise odds ratios comparing fruit set success among pollination treatments using combined data from 2024 and 2025. Odds ratios were calculated using 2 × 2 contingency tables with Wilson 95% confidence intervals. Values greater than 1 indicate that the first treatment listed had higher odds of fruit set than the second. A red dashed line at odds ratio = 1 denotes no difference between treatments. Autogamy consistently underperformed all other treatments, while hand cross-pollination showed significantly greater odds of fruit set compared to both open and self-pollination.
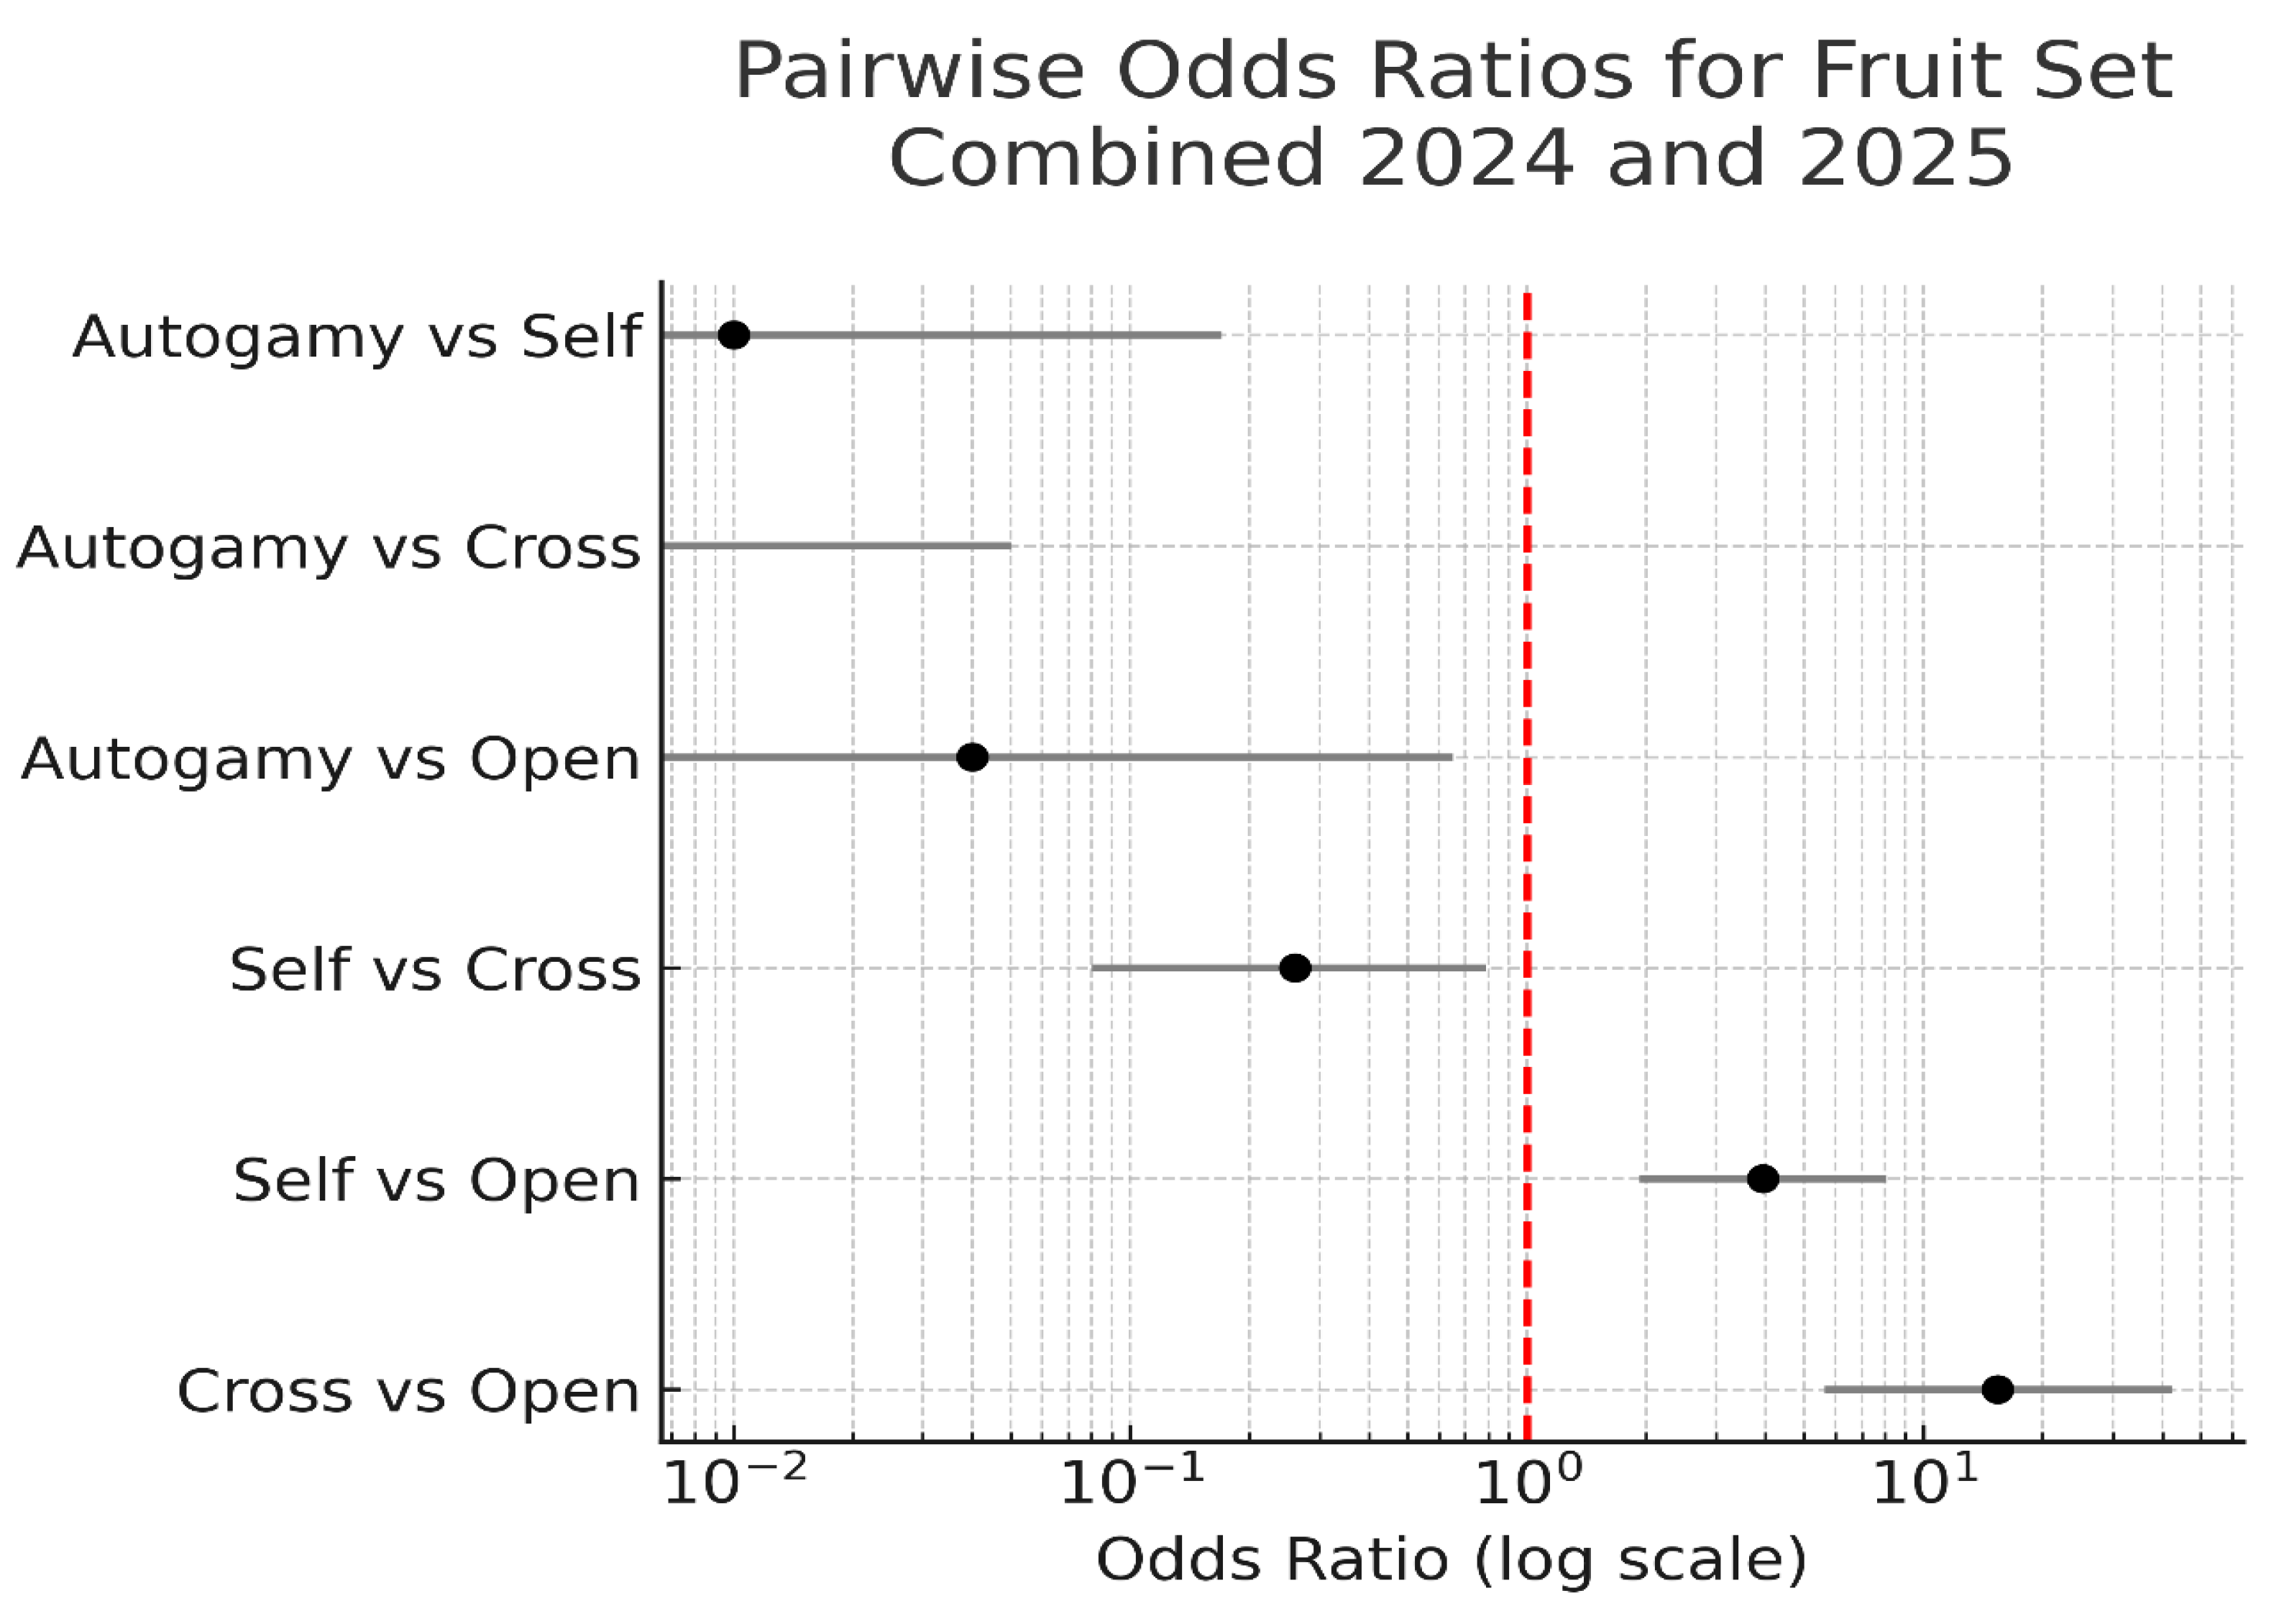
Figure 13.
Germination of Hibiscus dasycalyx seeds across pollination treatments. (A) Cumulative germination expressed as percentage of total seeds (n = 200 per treatment) over a 9-day period. (B) Timing of first germination by treatment, shown as boxplots with median, interquartile range, and minimum–maximum values. Treatments included control (open-pollinated), selfed, and outcrossed flowers.
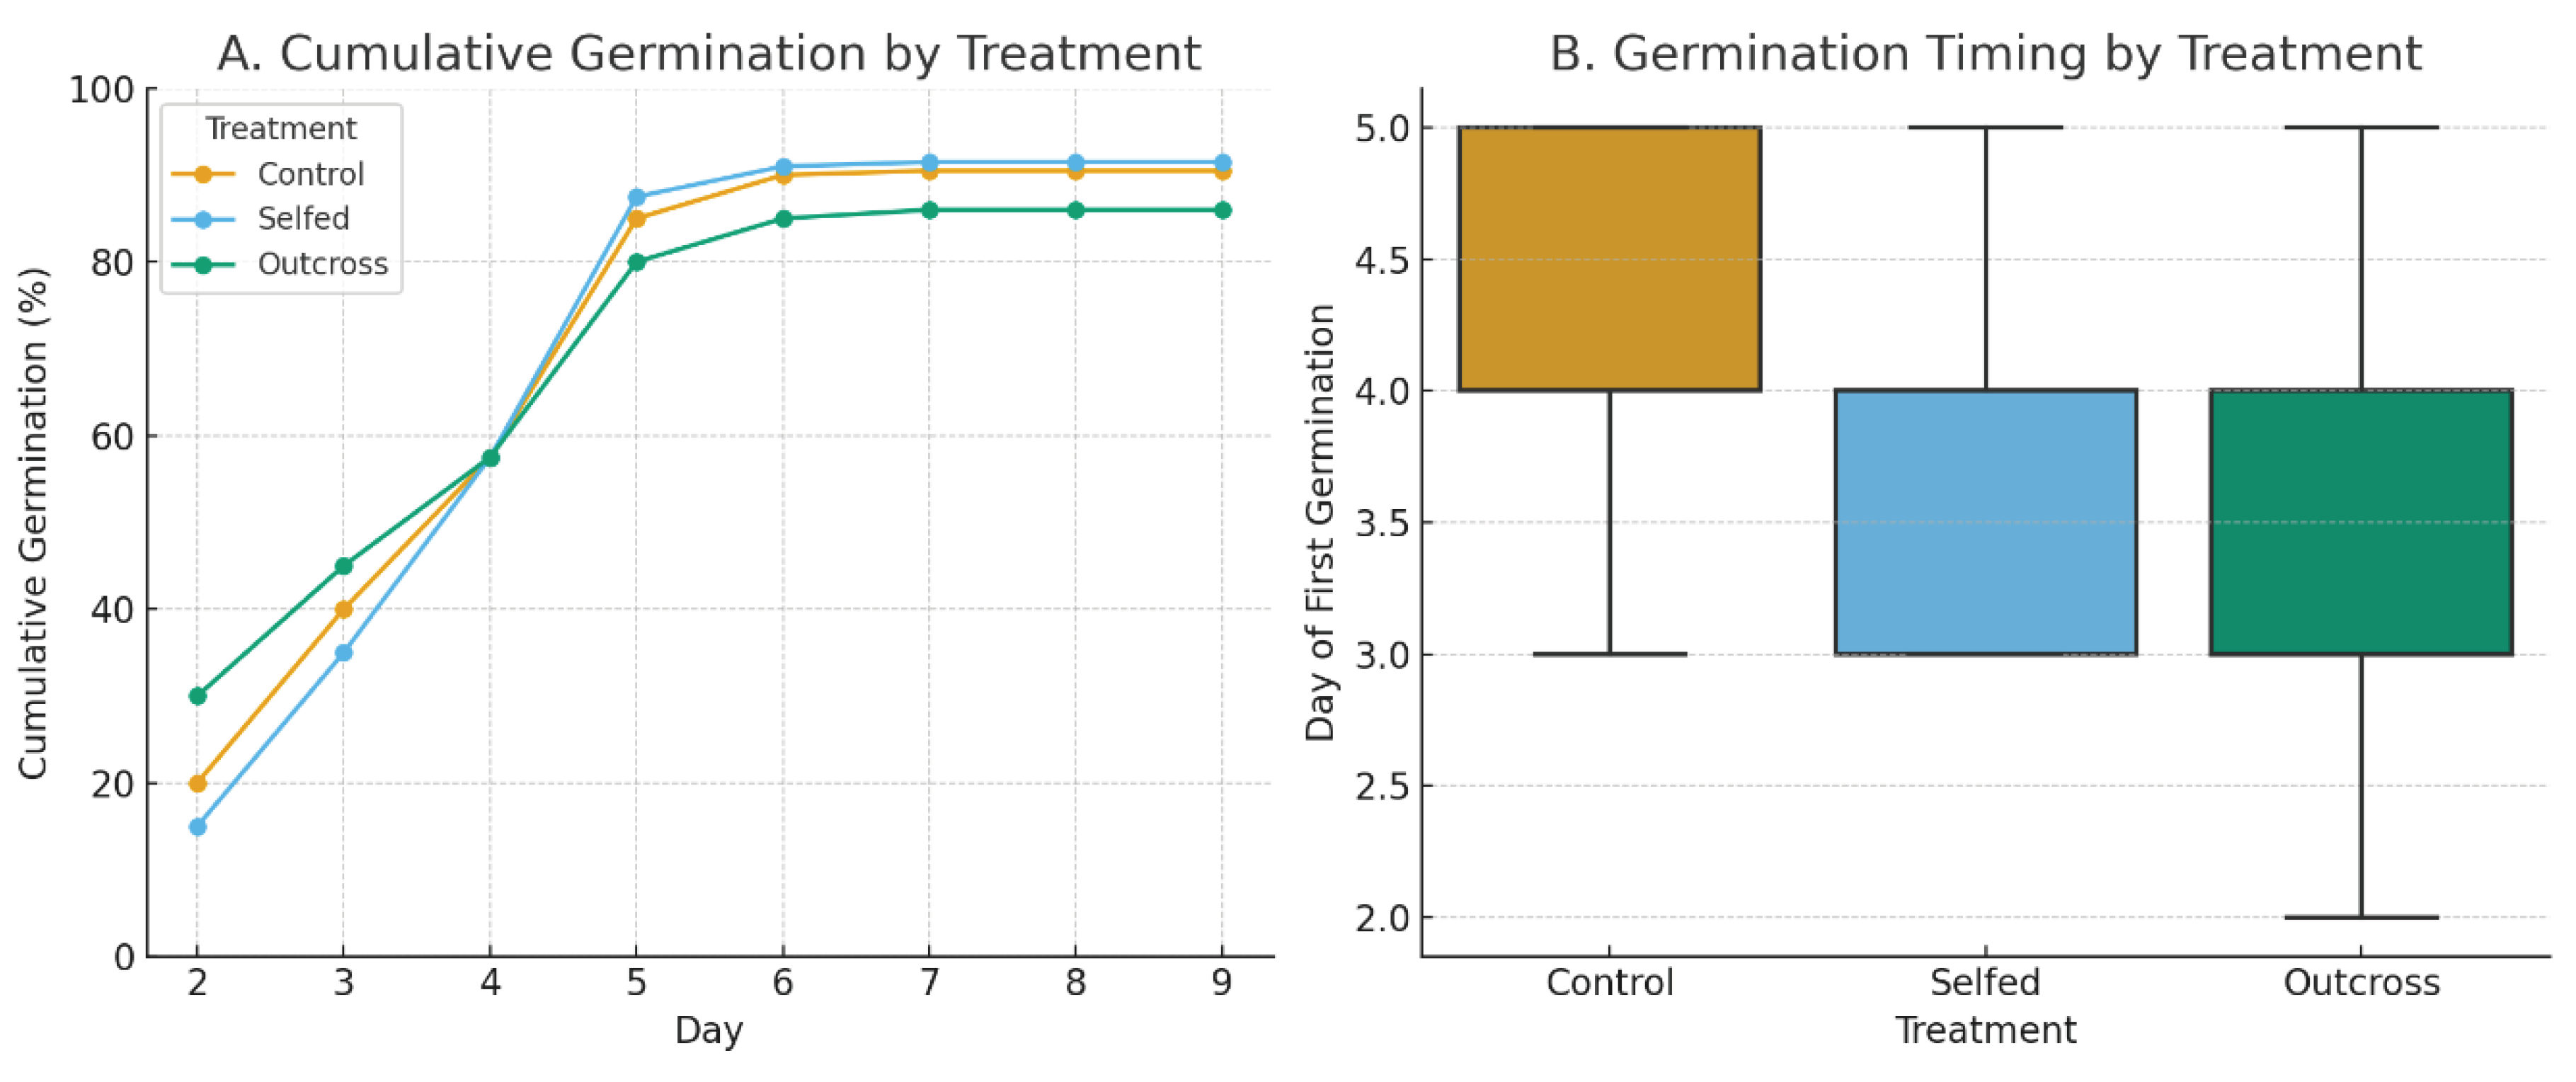
Table 1.
Comparison of environmental variables between LL (natural population) and PERL (experimental population) sites, reported as mean ± standard error (SE). Two-sample t-tests were used to evaluate site differences. Soil moisture scores were identical between sites and could not be tested.
Table 1.
Comparison of environmental variables between LL (natural population) and PERL (experimental population) sites, reported as mean ± standard error (SE). Two-sample t-tests were used to evaluate site differences. Soil moisture scores were identical between sites and could not be tested.
| Variable | LL Mean ± SE | PERL Mean ± SE | t-statistic | p-value |
| Soil pH | 5.92 ± 0.09 | 5.50 ± 0.00 | 4.499 | 0.0003 |
| Soil Temperature (°C) | 24.78 ± 0.13 | 24.00 ± 0.00 | 6.018 | <0.0001 |
| Soil Moisture (score) | 4.00 ± 0.00 | 4.00 ± 0.00 | — | — |
| Light (score) | 5.20 ± 0.20 | 6.00 ± 0.00 | 4 | 0.0161 |
| Canopy Openness (%) | 88.19 ± 3.29 | 96.17 ± 3.83 | 1.578 | 0.1308 |
Table 2.
Site, year, number of flowering plants, total number of flowers produced, duration of population flowering, synchrony of flowering within population, and mean ± SE flower production per flowering plant.
Table 2.
Site, year, number of flowering plants, total number of flowers produced, duration of population flowering, synchrony of flowering within population, and mean ± SE flower production per flowering plant.
| Site | Year | Plants Flowering | Flowers Produced | Duration of Flowering (Dates, Days) | Synchrony | Flowers/Flowering Plant (Mean ± SE) |
| LL | 2024 | 20 | 335 | 15 May–4 Aug (82 days) | 0.650 | 16.75 ± 3.54 |
| PERL | 2024 | 5 | 35 | 7–27 Jun (20 days) | 0.375 | 5.00 ± 1.27 |
| PERL | 2025 | 4 | 150 | 3 Jun–23 Jul (50 days) | 0.419 | 30.0 ± 20.34 |
Table 3.
Floral visitation data for Hibiscus dasycalyx at the LL site during the 2024 flowering season. Observations summarize flower abundance, visitation frequency, and pollinator composition across four census dates. Ptilothrix bombiformis dominated the floral visitor community.
Table 3.
Floral visitation data for Hibiscus dasycalyx at the LL site during the 2024 flowering season. Observations summarize flower abundance, visitation frequency, and pollinator composition across four census dates. Ptilothrix bombiformis dominated the floral visitor community.
| Date | Flowers Observed | Observation Time (min) | Total Visits |
% Visits by Ptilothrix bombiformis |
Visitor Species Richness |
| 15 Jun | 73 | 435 | 145 | 95.2% | 8 |
| 29 Jun | 62 | 423 | 313 | 99.7% | 2 |
| 13 Jul | 22 | 187 | 31 | 100% | 1 |
| 5 Aug | 4 | 240 | 20 | 85.0% | 4 |
| Total | 151 | 1285 | 509 | 97.8% |
Visitor behavior of P. bombiformis shifted over time (Table 4). Early-season visits consisted primarily of nectaring or brief flybys, whereas by mid- and late-season most visits involved pollen collection (Figure S4 A,B, and C). Female bees exhibited stereotyped foraging behavior: landing at the base of the staminal column, spiraling upward while gleaning pollen, and making repeated contact with stigmas (Figure S5A,B; Video S1). Visits for nectar lasted only a few seconds, while pollen-collecting bouts lasted 10–90 seconds. Other occasional visitors included Bombus pennsylvanicus, Xylocopa micans, Strymon melinus, skipper butterflies, and several pollen-feeding beetles, although these accounted for <3% of total visits and were unlikely to provide substantial pollination services.
Table 5.
Floral visitation observations for Hibiscus dasycalyx at PERL in June 2024. Flowers were observed on multiple dates for a total of 515 minutes. Only two visits, both by Melissodes bimaculatus, were recorded.
Table 5.
Floral visitation observations for Hibiscus dasycalyx at PERL in June 2024. Flowers were observed on multiple dates for a total of 515 minutes. Only two visits, both by Melissodes bimaculatus, were recorded.
| Date | Observation Time | # Flowers | Total Visits | Floral Visitor |
| 7 Jun 2024 | 14:00–14:30 | 2 | 0 | — |
| 10 Jun 2024 | 14:50–15:30 | 2 | 0 | — |
| 12 Jun 2024 | 14:45–15:30 | 2 | 0 | — |
| 13 Jun 2024 | 09:00–10:40 | 7 | 2 | Melissodes bimaculatus |
| 12 Jun 2024 | 15:00–15:30 | 2 | 0 | — |
| 17 Jun 2024 | 15:15–15:45 | 4 | 0 | — |
| Total | 515 min | 12 | 2 | 1 species |
Table 7.
Handling time (seconds) of 139 floral visits to Hibiscus dasycalyx at PERL in 2025 for species with at least ≥4 observations. Values are means ± SE, with ranges in parentheses. A Kruskal-Wallis test across species found significant differences in foraging time (H = 16.17, p = 0.00031).
Table 7.
Handling time (seconds) of 139 floral visits to Hibiscus dasycalyx at PERL in 2025 for species with at least ≥4 observations. Values are means ± SE, with ranges in parentheses. A Kruskal-Wallis test across species found significant differences in foraging time (H = 16.17, p = 0.00031).
| Species | n | Handling Time (s) (Mean ± SE, Range) |
| Agapostemon splendens | 8 | 73.5 ± 25.6 (16–229) |
| Melissodes communis | 9 | 26.2. ± 7.26. (1–56) |
| Ptilothrix bombiformis | 122 | 14.1 ± 1.68 (1-134) |
Table 8.
Handling time (seconds) of Ptilothrix bombiformis by behavior. Values are means ± SE, with ranges in parentheses. Welch’s t-test (unequal variance) was highly significant (t = 3.89, p = 0.00075). Not recorded are mixed foraging bouts and fly-by’s.
Table 8.
Handling time (seconds) of Ptilothrix bombiformis by behavior. Values are means ± SE, with ranges in parentheses. Welch’s t-test (unequal variance) was highly significant (t = 3.89, p = 0.00075). Not recorded are mixed foraging bouts and fly-by’s.
| Behavior | n | Handling Time (s) (Mean ± SE, Range) |
| Nectaring | 7 | 5 (2-14) |
| Pollen gathering | 107 | 14.4 ± 1.81 (1–134) |
Table 9.
Results of pollination treatments in Hibiscus dasycalyx at LL, 2024–2025. Values are number of flowers, fruits, and percentage fruit set.
Table 9.
Results of pollination treatments in Hibiscus dasycalyx at LL, 2024–2025. Values are number of flowers, fruits, and percentage fruit set.
| Year | Plants Used (Tag ID)* | Treatment | Flowers (N) | Fruits | Fruit Set (%) |
| 2024 | 1, 2, 3, 4, 5, 7, 9 | Autogamy | 11 | 0 | 0 |
| Open (Control) | 37 | 2 | 3.5 | ||
| Selfed | 6 | 3 | 50 | ||
| Crossed | 5 | 4 | 80 | ||
| 2025 | 2, 3, 5, 6, 9 | Autogamy | 22 | 0 | 0 |
| Open (Control) | 108 | 41 | 38 | ||
| Selfed | 41 | 28 | 68 | ||
| Crossed | 39 | 34 | 87 |
* Tag IDs indicate individual plants used in hand-pollination experiments.
Disclaimer/Publisher’s Note: The statements, opinions and data contained in all publications are solely those of the individual author(s) and contributor(s) and not of MDPI and/or the editor(s). MDPI and/or the editor(s) disclaim responsibility for any injury to people or property resulting from any ideas, methods, instructions or products referred to in the content. |
© 2025 by the authors. Licensee MDPI, Basel, Switzerland. This article is an open access article distributed under the terms and conditions of the Creative Commons Attribution (CC BY) license (http://creativecommons.org/licenses/by/4.0/).
Copyright: This open access article is published under a Creative Commons CC BY 4.0 license, which permit the free download, distribution, and reuse, provided that the author and preprint are cited in any reuse.


