1. Introduction
Clostridioides difficile, (
C. difficile), is a species of bacteria that is the world's leading cause of antibiotic-associated diarrhea [
1].
C. difficile infection (CDI) is mainly spread in health-care settings; however, community spread of CDI is increasing [
1,
2,
3]. About 500,000 people are infected with
C. difficile every year, with an almost 6% mortality rate [
1,
2,
3].
CDI symptoms range from mild diarrhea to deadly colitis with the variable symptomatology being attributed to individual susceptibility and complex antibiotic regimes [
4]. Primary CDI is mainly treated with vancomycin or fidaxomicin, but up to 20% of patients experience relapses [
5].
C. difficile is spread by spores, which are dormant and resistant structures that allow
C. difficile to survive harsh conditions for long periods.
C. difficile spores germinate in the colon of susceptible patients, a process required to initiate CDI [
1,
2,
3]. Once spores germinate in the antibiotic-altered gut of patients, they generate toxin-producing vegetative cells [
4]. Given the risk of antibiotic resistance and treatment-induced dysbiosis of the gut microbiota, there is an urgent need to discover new therapeutics to treat CDI.
The germination of
C. difficile spores is mediated by several factors including the composition of bile acids in the gut. Taurocholate (TCA), a conjugated primary bile acid, facilitates germination while chenodeoxycholate (CDCA), an unconjugated primary bile acid, inhibits it [
6,
7]. Bile acids are synthesized in the liver and secreted into the intestines where their primary function is to emulsify and facilitate the absorption of fats and vitamins [
8,
9]. Bile acids synthesized endogenously in the liver are classified as primary bile acids. In humans, these are cholic acid (CA) and chenodeoxycholic acid (CDCA) [
8,
9]. Mice have 3 additional endogenous bile acids: ursodeoxycholic acid (UDCA), alpha-muricholic acid (αMCA), and beta-muricholic acid (βMCA) [
8]. Once primary bile acids are synthesized in hepatocytes, either taurine (T) or glycine (G) are attached to the carboxylic acid to form conjugated bile acids which require specific transporters to move across the canalicular membranes [
8,
9]. Once bile acids reach the intestinal ileal lumen, bacteria can deconjugate and dehydroxylate them into secondary bile acids lithocholic acid (LCA) and deoxycholic acid (DCA), respectively [
8,
9]. By the time they reach the end of the ileum, about 95% of the bile acids are reabsorbed by enterocytes and transported back to the liver through the enterohepatic circulation (EHC), which continuously recycles bile acids between the intestines and the liver [
8,
9]. Secondary bile acids are absorbed from the intestine and reconjugated in the liver before re-entering the EHC [
9].
Since bile-acid-mediated spore germination is required for CDI, we expect that anti-germination therapy will prevent CDI and its relapse [
10]. We have tested synthetic bile salt (SBS) libraries and found analogs that inhibit
C. difficile spore germination [
11,
12,
13,
14]. More importantly, SBS anti-germinants also prevented CDI in rodents [
15,
16,
17,
18] without any overt toxicity seen after a 30-day treatment. More specifically, we found that cholates like cholan-24-amide containing
m-sulfanillic acid (CamSA) [
19,
20] and quinazoline cholate analog (CA-Quin), inhibit
C. difficile spore germination at micromolar concentrations even in the presence of saturating millimolar levels of the germinant taurocholate germinant is present. Given that CamSA was the first CDI prophylactic discovered in our group, it has been extensively characterized both in vitro and in vivo [
15,
16,
17,
18,
21,
22,
23].
One surprising finding was that a single dose of CamSA was sufficient to protect mice from CDI. To study this intriguing pattern, we examined the pharmacokinetics of CamSA [
21]. Our data suggests that CamSA undergoes EHC. We hypothesize that the cycling of CamSA between the liver and intestines serves as a slow-release mechanism that allows CamSA to be retained in the gastrointestinal tract for days. This model explains how a single CamSA dose can provide multi-day protection against murine CDI [
18]. Although CA-Quin also protects mice from CDI, we have not determined whether it enters the EHC.
Given the involvement of CamSA in the EHC and the fact that these agents are bile salt analogs, it is unclear whether they affect regular circulation or metabolism of natural bile acids. It also remains to be further assessed whether CamSA and CA-Quin have toxicological impacts on the liver. In this study, we treated mice with CamSA, CA-Quin, or vehicle control for 7 days. The liver histology, transcriptome, and bile acids profiles of the liver, ileum, chyme, and feces samples were analyzed and compared. In conjunction with previous studies, the present study indicates that the two bile acid analogs are safe and alter bile acids profile in a manner benefiting C. difficile inhibition. These findings warrant further investigation into their potential for the clinical treatment of CDI.
2. Materials and Methods
2.2. Synthesis of CamSA and CA-Quin:
The synthesis of CamSA[
19] and CA-Quin[
24] were done according to previously published methods by the Dr. Firestine lab at Wayne State University.
2.3. Animals
Animal protocols were performed in accordance with the Guide for Care and Use of Laboratory Animals outlined by the National Institutes of Health. Protocols were reviewed and approved by the Institutional Animal Care and Use Committee (IACUC) at the University of Nevada, Las Vegas (Permit Number: R0914-297, approval date: June 20th, 2025). Weaned male C57BL/6J mice were obtained from Jackson Labs, Jax west (Bar Harbor, ME). Mice were housed in groups of five mice per cage at the University of Nevada, Las Vegas animal care facility. Upon arrival at the facility, mice were quarantined and allowed to acclimate for at least one week prior to experimentation. Animals were 5-8 weeks old and were between 20-25 g. Tissue samples were collected after euthanasia. Therefore, no anesthesia was utilized. Drugs were administered by oral gavage and dissections were conducted after euthanasia.
2.4. Anti-germinant treatment and organ harvest
Male mice (n=4 per group) were be treated with a once daily dose of DMSO, 50 mg/kg CamSA or 50 mg/kg CA-Quin for 7 consecutive days. Feces were collected from individual animals after 3 days and 7 days of treatment. On day 7, all animals were euthanized with CO2 and organs were harvested as follows.
Livers from each animal were harvested and weighted. A liver slice (not wider than 0.5 cm) was stored in cold RNAprotect Tissue Reagent. A second part (200-300 mg) was chopped, placed into aluminum foil, and flash frozen. Foils were then transferred into pre-cooled Eppendorf tubes and stored at – 80 C.
A 15-cm segment of the ileum proximal to the ileocecal valve was cut from each animal and flushed with extraction buffer (0.1 M Tris-buffered saline with 0.3% bovine serum albumin, 0.01% sodium azide, and 0.002% Tween). The resulting intestinal content suspensions (chyme) were flash frozen and stored at – 80 C. The cleaned ileums were sliced lengthwise and cut into equal sized pieces. One piece was stored in cold RNAprotect Tissue Reagent. Three other ileum pieces were put into foil, as above.
RNA Extraction: Frozen liver samples stored in Qiagen RNAprotect Tissue Reagent were homogenized and RNA was extracted utilizing the Qiagen RNeasy Kit by following the manufacturer’s protocol. Additional flash frozen liver and ileum samples were homogenized in ThermoFisher Scientific TriZol and extracted by following manufacturer’s protocol.
Sequencing: RNA sequencing was performed by the Wayne State Genomics Core. Briefly, total RNA was extracted from frozen liver and ileum samples using TRIzol reagent (Thermo Fisher Scientific) followed by purification steps as detailed by the manufacturer. RNA purity and quantity were assessed via spectrophotometer (NanoDrop 8000, Thermo-Fisher Scientific). Single end RNA sequencing was performed by the Wayne State University Genome Sciences Core. The mRNA-seq library was prepared using the QuantSeq 3’ mRNA-Seq Library Prep Kit FWD (Lexogen). Libraries were assessed by the High Sensitivity D1000 (HS D1000) ScreenTape Assay (Agilent). Samples were sequenced on the NovaSeq system (Illumina).
2.5. RT-PCR and qPCR
Extracted RNA from frozen tissue was utilized for RT-PCR which was performed utilizing ThermoFisher High-Capacity cDNA Revere-Transcription kit. qPCR was conducted utilizing the ThermoFisher PowerUp SYBR Green Master Mix for qPCR for the liver samples and ileum samples (in technical triplicates) in a QuantStudio qPCR machine utilizing manufacturer’s protocol. Primer sequences are included in
Supplementary Table S2.
2.6. LC-MS of bile species
LCMS was performed by the Zhou lab at the Medical College of Virginia. Serum and liver bile acids were extracted and quantified by LC-MS/MS as previously described [
25,
26]. The following bile acids were measured (in nmol/g): 12-keto-lithocholic acid (12-keto-LCA), 3-keto-7α,12α-dihydroxy-5β-cholan-24-oic acid (3-keto,7α,12α(OH)₂), 3-keto-lithocholic acid (3-keto-LCA), 7-keto-deoxycholic acid (7-keto-DCA), 7-keto-lithocholic acid (7-keto-LCA), allo-isolithocholic acid (allo-isoLCA), alpha-muricholic acid (α-MCA), beta-muricholic acid (β-MCA), 7α-hydroxy-4-cholesten-3-one (C4), cholic acid (CA), cholic acid-3-sulfate (CA-3-S), cholic acid-7-sulfate (CA-7-S), chenodeoxycholic acid (CDCA), chenodeoxycholic acid-3-sulfate (CDCA-3-S), deoxycholic acid (DCA), deoxycholic acid-3-sulfate (DCA-3-S), glyco-beta-muricholic acid (Gβ-MCA), glycocholic acid (GCA), glycochenodeoxycholic acid (GCDCA), glycodeoxycholic acid (GDCA), glycohyocholic acid (GHCA), glycohyodeoxycholic acid (GHDCA), glycolithocholic acid (GLCA), glycoursodeoxycholic acid (GUDCA), hyocholic acid (HCA), hyodeoxycholic acid (HDCA), isodeoxycholic acid (isoDCA), isolithocholic acid (isoLCA), lithocholic acid (LCA), lithocholic acid-3-sulfate (LCA-3-S), murideoxycholic acid (MDCA), tauro-alpha-muricholic acid (Tα-MCA), tauro-beta-muricholic acid (Tβ-MCA), taurocholic acid (TCA), taurochenodeoxycholic acid (TCDCA), taurodeoxycholic acid (TDCA), taurohyodeoxycholic acid (THDCA), taurolithocholic acid (TLCA), tauroursodeoxycholic acid (TUDCA), tauro-omega-muricholic acid (Tω-MCA), ursodeoxycholic acid (UDCA), ursodeoxycholic acid-3-sulfate (UDCA-3-S), omega-muricholic acid (ω-MCA). Samples were filtered (0.2 µm PTFE) and analyzed using a Shimadzu LCMS-8600 system.
2.7. Differential gene expression analysis
Sequencing data from the WSU Genomics Core was analyzed for quality by FastQC[
27] and then trimmed by Trimmomatic [
28] and rechecked for quality. RNA reads were mapped to the mouse genome utilizing Hisat2[
29]. Gene counts were collected utilizing HTSeq[
30,
31] and then the data was analyzed in R[
32] utilizing RStudio[
33]. In R, DESeq2[
34] was utilized to perform differential gene expression and obtain normalized counts. Ggplot2[
35] was utilized to generate the principal component analysis and volcano plots. Venn diagram plotted using ggvenn[
36]. Complex heatmap[
37,
38] was utilized for the heatmaps. Additional packages utilized for intermediary steps necessary for analysis, data handling, data annotation, and figure adjustments include: KEGGREST, biomaRt[
39,
40], dplyr[
41], ggrepel[
42], AnnotationDbi[
43], org.Mm.eg.db[
44], ggfortify[
45,
46], patchwork[
47], and openxlsx[
48].
2.8. Enrichment analysis
For enrichment analysis, genes were filtered based off a p value of 0.05. These genes were then run in Metascape [
49] for each treatment and the GO, KEGG, and Reactome databases were selected for the custom analysis. The enrichment analysis parameters were a p value of less than 0.01 and the minimal overlap was 3 genes.
2.9. Statistical analysis
Bile acids concentration data were log2 transformed. For bile acid ratio, data were log 2 transformed before calculating the ratio. Percent composition was calculated by diving the concentration of individual species by the total concentration quantified in a sample. 2-ΔΔCT was quantified utilizing Microsoft Excel (Version 16.94 (25020927), 2025 Microsoft) before transferring data for statistical analysis. One way ANOVA and data visualization were conducted utilizing GraphPad Prism (Version 10.4.1(532), GraphPad Software, LLC). No corrections were applied to p values for t tests. (**** p<0.0001, *** p<0.001, ** p<0.01, *p<0.05). Detailed statistics include mean, standard deviation, and statistical significance of bile salt level comparison are available upon request.
3. Results
To investigate the effects of the bile acid analogs on the EHC, mice were treated with either DMSO, CamSA, or CA-Quin for seven consecutive days. Bile acid species (n=43) of the liver (n=4) and chyme (n=4) were profiled on day 7 utilizing LC-MS/MS. Additionally, feces from days 3 (n=4) and 7 (CamSA n=3, CA-Quin n=4, and DMSO n=4) of treatment were also analyzed. A total of 42 bile acids were quantified of those there were 5 primary bile acids, 9 conjugated primary bile acids, 20 secondary bile acids, and 8 conjugated secondary bile acids. The categorization of the bile acids detected by LC-MS is indicated in the
Supplementary Table S3.
In addition to the 42 bile acids, 1 bile acid precursor was also quantified, 7-α-hydroxy-4-cholesten-3-one
(C4). The bile acids were divided according to where or how they are made. Primary bile acids are produced in the liver and then conjugated with either taurine or glycine to form the conjugated primary bile acids. The secondary bile acids are derived from primary bile acids by bacterial biotransformation. For analysis of the bile acids, only bile salts that were quantified in at least 3 samples of one treatment group were included for analysis. In the
Supplementary Table S4, we have indicated how many bile acids were at quantifiable levels for each treatment.
3.1. Overall alterations of bile acids by CamSA and CA-Quin in the liver, chyme, and fecal samples
A principal component analysis (PCA) plot of the BA profile data shows a trend of separation between the two treatments groups and the DMSO control group in the liver and feces, but not in chyme, while the overall variability between the two treatment groups is less noticeable (
Figure 1).
Neither CamSA nor CA-Quin altered the total level of bile acids compared to the DMSO-treated group among the liver, chyme, and the feces collected on day 3. However, total BA content significantly increases in the feces collected on day 7 of both treatment groups (
Figure 2A). When comparing the ratio of total unconjugated and conjugated BAs, both treatment groups demonstrated a significant trend towards lower ratios of unconjugated:conjugated BAs in the liver whereas higher ratios of unconjugated:conjugated BAs in the feces, compared to the control group (
Figure 2B).
When analyzing the changes of BA categories (primary, primary conjugated, secondary, and secondary conjugated), CamSA or CA-Quin treatments did not significantly change the total BA levels of each category in the liver or chyme (
Figure 3A-B). In contrast, both unconjugated primary and secondary BAs are significantly increased in the feces (both day 3 and day 7) of both treatment groups compared to the control group (
Figure 3C-D). In the feces collected on day 7, the conjugated primary BAs are significantly underrepresented in the CamSA-treated group and overrepresented in the CA-Quin treated group (
Figure 3D).
3.1.1. Alternation of individual BA levels by CamSA and CA-Quin treatment
Analysis of individual bile acid concentration changes showed that the major significant changes in the level of BAs are in the fecal samples of animals treated with the two compounds, with fewer significant changes observed in the liver or chyme samples (
Figure 4). Nearly all five primary BAs demonstrated an increased level in the feces (both day 3 and day 7) of both CamSA and CA-Quin-treated mice, compared to the DMSO-treated control group. In contrast, only CDCA increases in the liver of CamSA-treated mice, while both CA and CDCA increased in the chyme of CA-Quin-treated mice (
Figure 4).
No significant change was observed for conjugated BAs in the liver tissue for any of the treatment groups compared with the DMSO group. In feces samples, all conjugated BAs showed some decrease in both CamSA and CA-Quin-treated mice on day 3, but only TCA showed a statistical significance in the CamSA group. On day 7, feces showed that more species (TCA, TCDCA, TaMCA, and TUDCA) had a statistical significance decrease in the CamSA-treated (but not the CA-Quin-treated group) mice (
Figure 4).
Among the 14 secondary BAs that were examined, 7-keto-DCA and 7-keto-LCA levels showed a significant decrease in the liver tissue of mice treated with CA-Quin. The same group also demonstrated a significantly increased level of DCA and 7-keto-DCA in the chyme. In contrast, most of the detectable secondary BAs in feces showed a statistical increase on day 3 and day 7 in both the CamSA and CA-Quin-treated group (
Figure 4).
Only a few conjugated secondary BAs demonstrated statistically significant changes. TDCA levels in the liver and chyme of the CA-Quin group are significantly increased, while THDCA levels significantly decreased in day 3 fecal samples of the CamSA group and in day 7 fecal samples of the CA-Quin group.
Besides the absolute concentration as demonstrated above, we also further examine the relative composition of individual BAs among the samples (
Supplementary Figure S1). While the pattern of relative level of BAs largely resembles that of the absolute BA concentration shown in Fig 4, several BAs demonstrated stronger association with the two treatments. For example, compared to the control group, the relative TCA level in both treatment groups is significantly increased and decreased in the liver and fecal samples, respectively (
Supplementary Figure S1).
3.2. Liver Transcriptomics
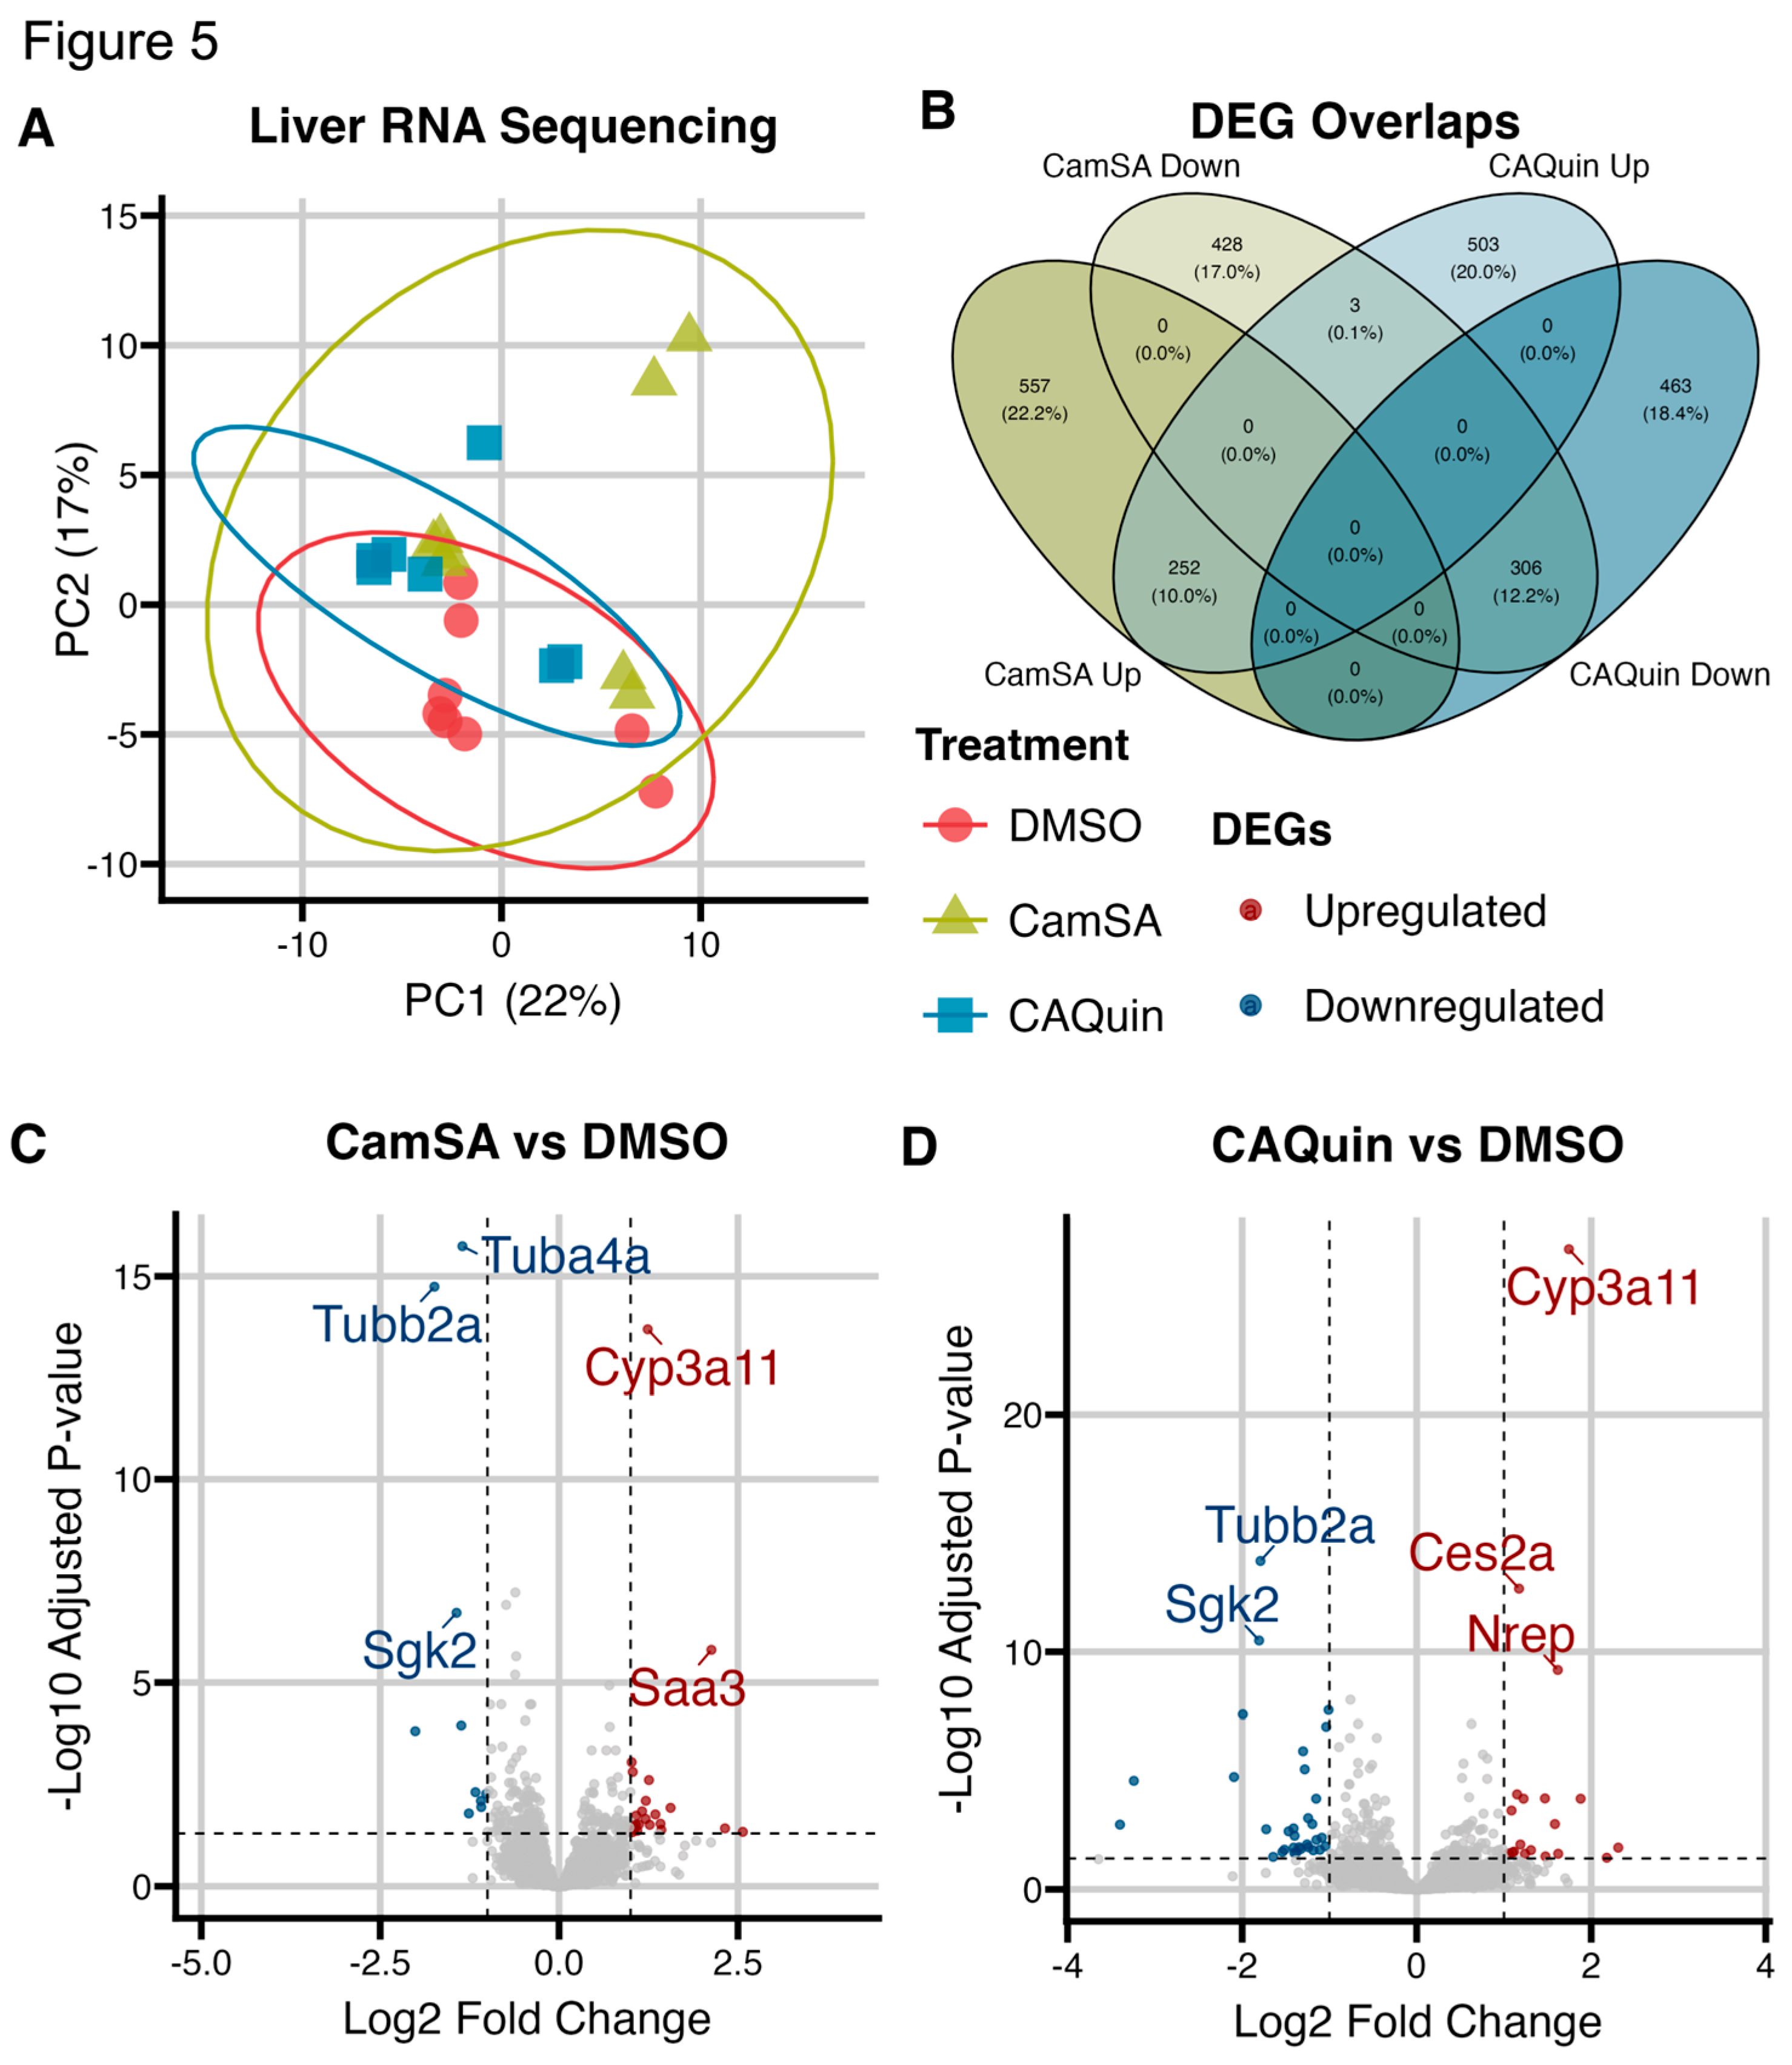
To examine the impact of CamSA and CA-Quin treatments on the murine liver transcriptome, RNA sequencing was performed [DMSO (n=8), CamSA (n=8), CA-Quin (n=7)]. PCA plots showed overall minimal significant changes in the hepatic transcriptome program due to CamSA or CA-Quin treatments (
Figure 5A).
3.2.1. Genes and transcriptome patterns associated with drug treatments
While there was minimal difference in overall toxicogenomic effects due to anti-germinant treatments, we further examined the subset of genes that demonstrated statistically significance (unadjusted p<0.05) changes in their transcription levels between each of the treatment group and the control group. A total of 809 and 758 genes are significantly upregulated in the CamSA and CA-Quin-treated groups compared to the control. Among these, 252 (>30% of significantly upregulated differentially expressed genes (DEGs) in either treatment group vs the control group) genes are shared between the two treatment groups. Similarly, a total of 737 and 769 genes, respectfully, are significantly downregulated in the CamSA and CA-Quin-treated groups compared to the control. Among these, 306 (~40% of significantly downregulated DEGs) genes are shared between the two treatment groups. Only 3 genes that are downregulated in the CamSA group were upregulated in the CA-Quin treatment, while no genes upregulated in the CamSA group are downregulated in the CA-Quin treatment (
Figure 5B).
Volcano plots (
Figure 5C and
Figure 5D) showed that in the CamSA-treatment the 5 most differentially expressed genes (adjusted p<0.05, |log fold change| >1.5) were
Tuba4a,
Tubb2a,
Cyp3a11,
Sgk2, and
Saa3. Of those,
Tuba4a,
Tubb2a, and
Sgk2 were downregulated while
Cyp3a11 and
Saa3 were upregulated. In the CA-Quin-treated group, the 5 most differentially expressed genes were
Cyp3a11,
Tubb2a,
Ces2a,
Sgk2, and
Nrep. Of those,
Tubb2a and
Sgk2 were downregulated while
Cyp3a11,
Ces2a, and
Nrep were upregulated.
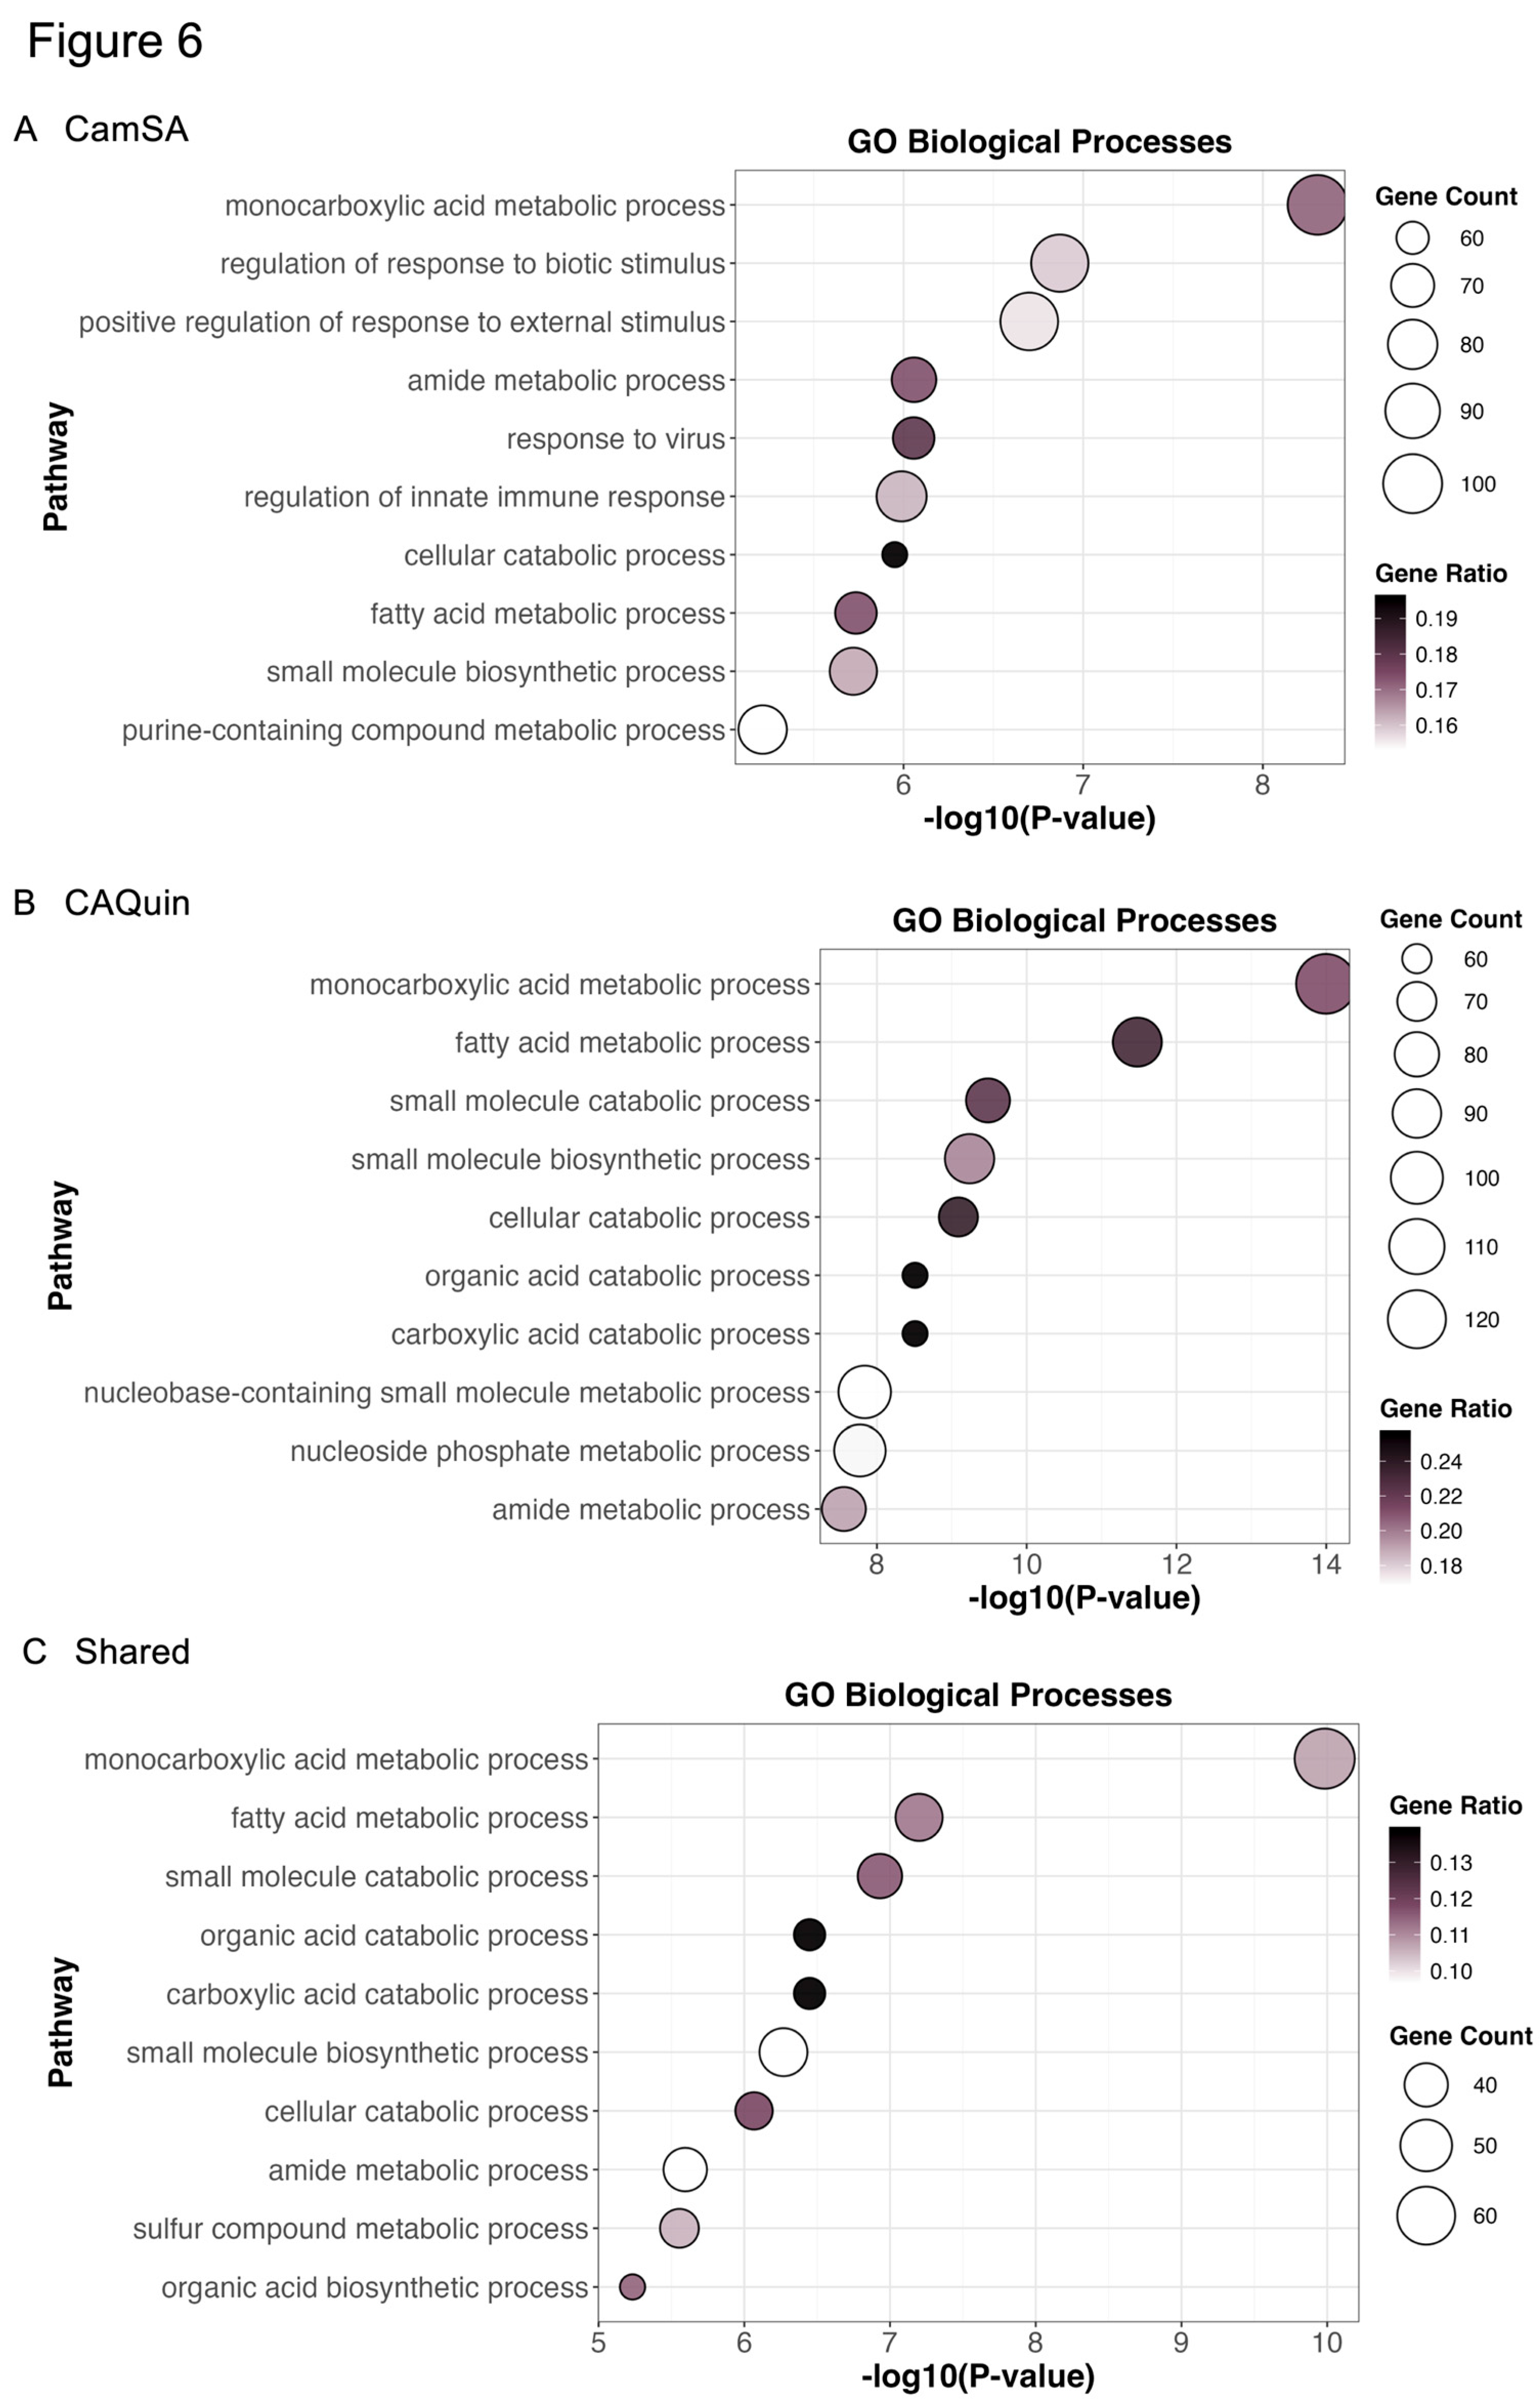
To further explore insights into the potential pharmacological effects related to the two treatments, we performed pathway enrichment analyses by focusing on all genes whose expression was significantly (unadjusted p<0.05) altered as compared to the control group, regardless of their fold change. The Metascape [
49] enrichment analysis (
Figure 6) showed the top gene ontology (GO) pathways enriched in the CamSA-related DEGs include
monocarboxylic acid metabolism,
neutrophil degranulation, and
regulation of response to biotic stimulus (
Figure 6A). The top GO pathways enriched in CA-Quin-related DEGs are
monocarboxylic acid metabolism,
small molecule biosynthetic process, and
nucleobase-containing small molecule metabolic process (
Figure 6B). Shared pathways between the two groups include
monocarboxylic acid metabolism,
protein processing in the endoplasmic reticulum, and
small molecule catabolic process (
Figure 6C).
In addition to GO pathways, the KEGG and Reactome were investigated during the Metascape enrichment analysis as seen in
Supplementary Figures S2-4. From the CamSA-related DEGs, the
protein processing endoplasmic reticulum,
peroxisome, and
prion disease KEGG pathways were the most enriched. The Reactome pathways most enriched from the CamSA-related DEGs were
neutrophil degranulation,
antigen processing-cross presentation, and
metabolism of lipids. The top KEGG pathways enriched from CA-Quin-related DEGs were protein processing in
endoplasmic reticulum,
peroxisome, and
biosynthesis of cofactors. The Reactome pathways most enriched were
metabolism of lipids,
fatty acid metabolism, and
protein localization. When looking at the shared DEGs, the most enriched KEGG pathways include
protein processing in endoplasmic reticulum,
peroxisome, and
prion disease. The most enriched Reactome pathways were
metabolism of amino acids and derivatives,
metabolism of lipids, and
fatty acid metabolism.
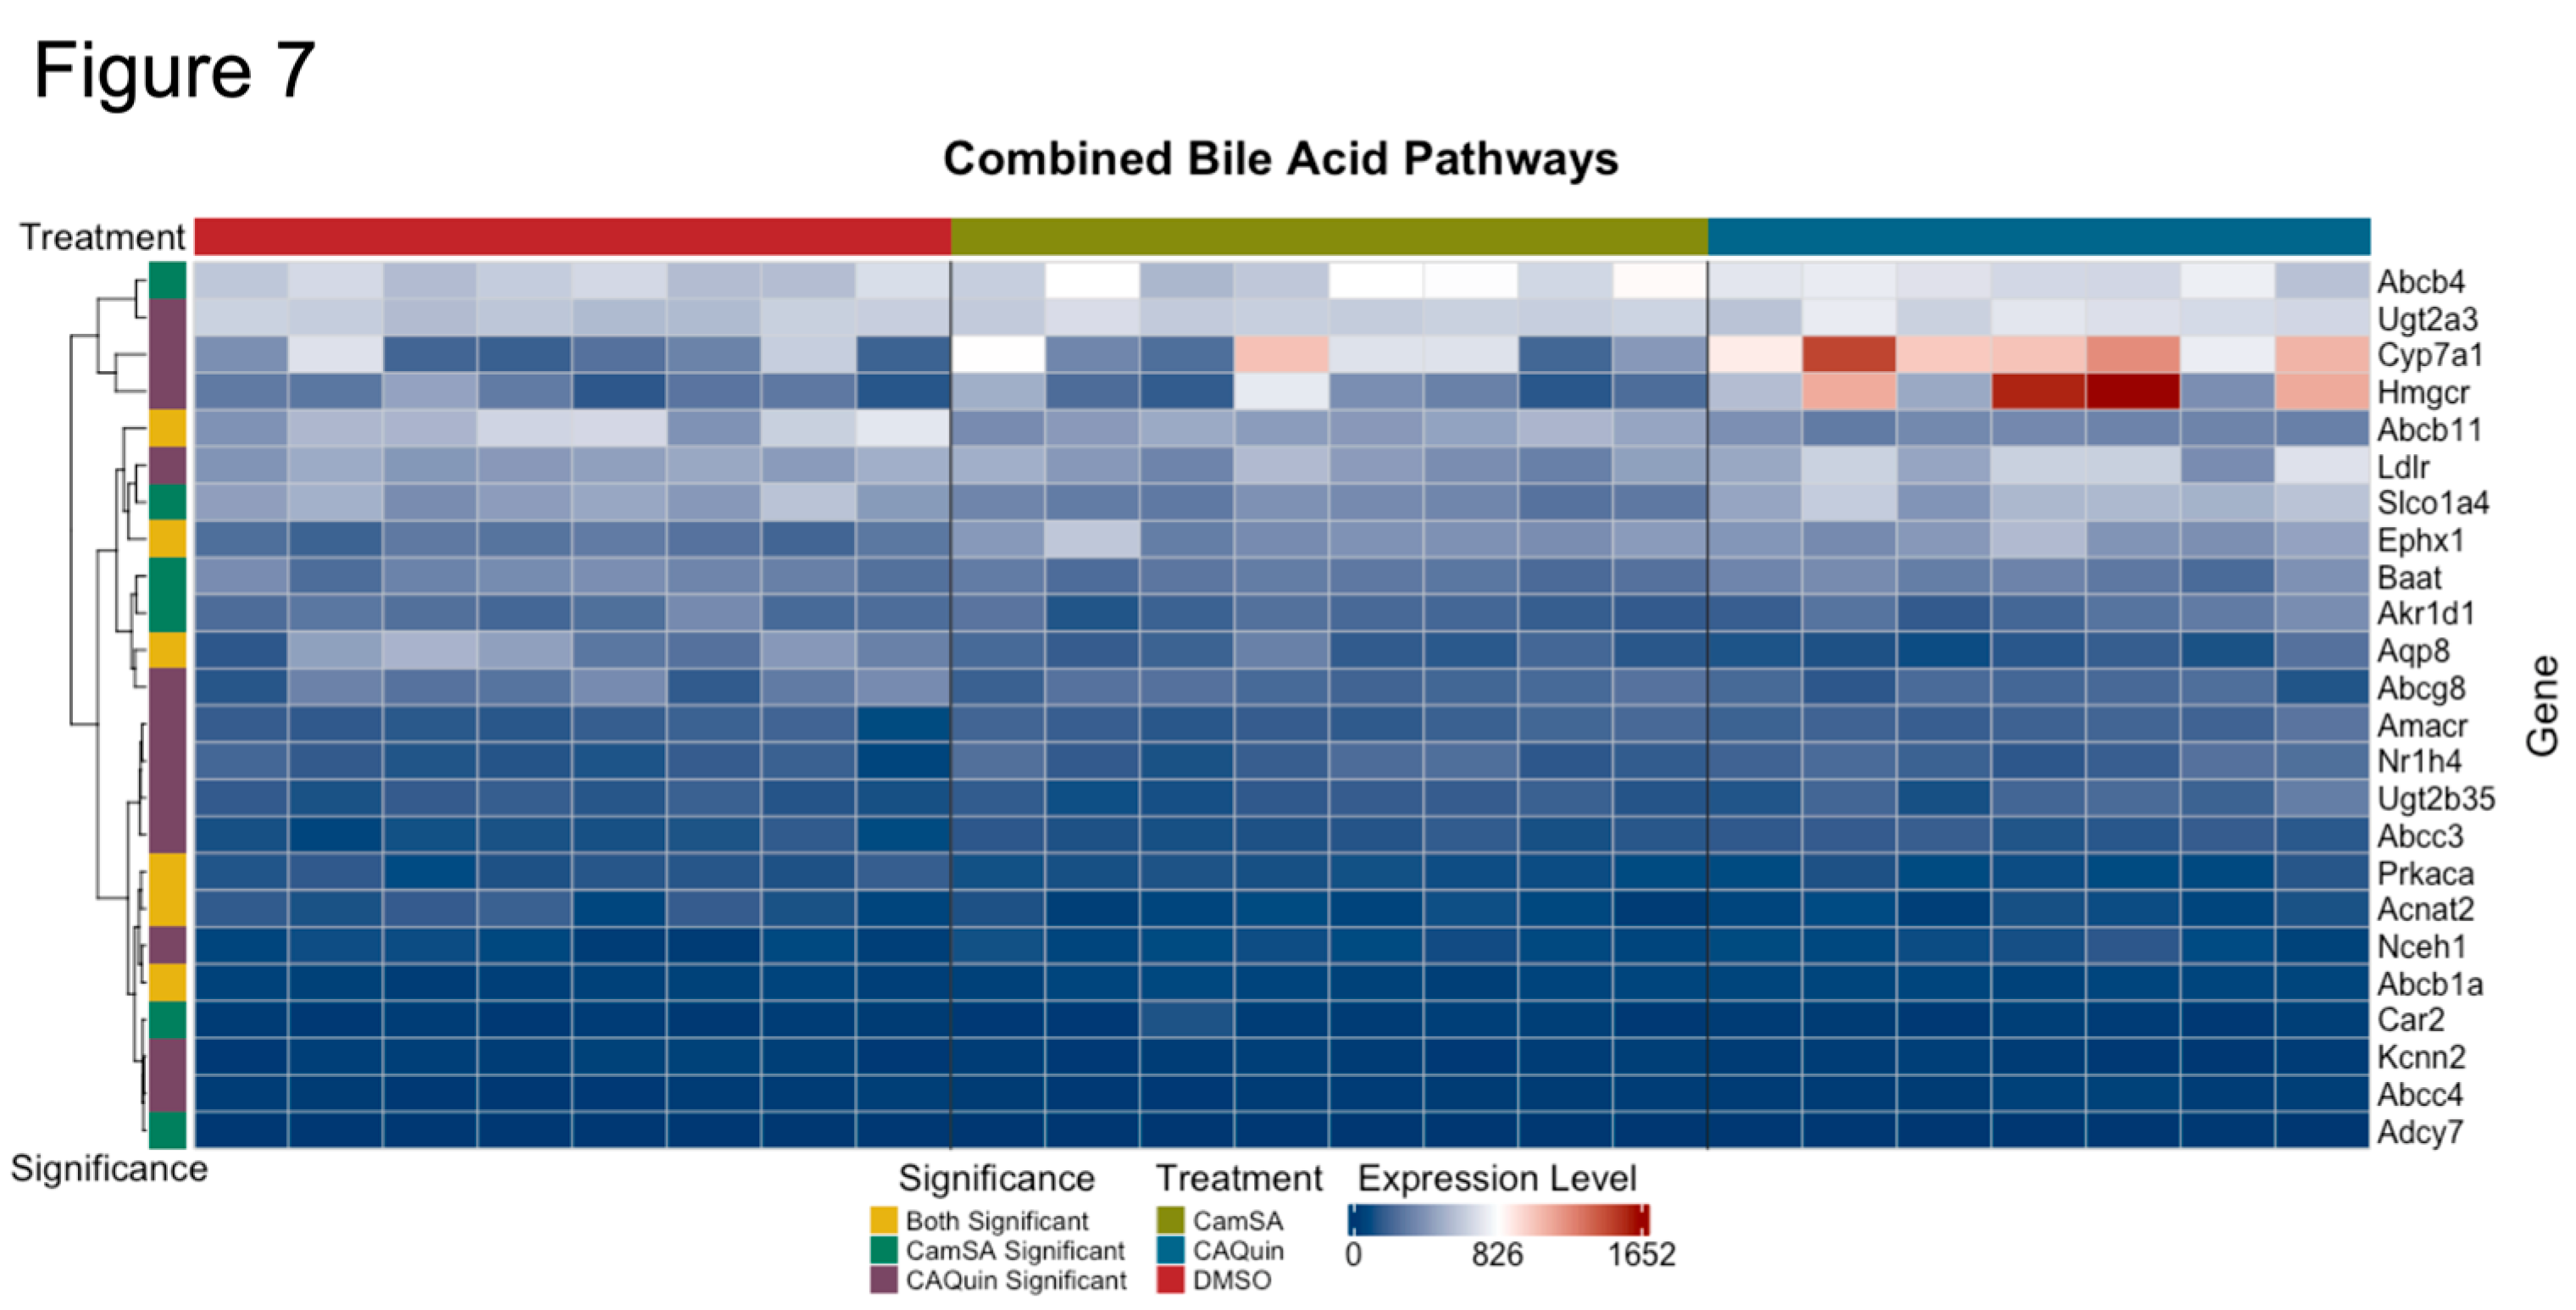
3.3. Impact of drug treatment on bile acid metabolism pathway in the liver
Both CamSA and CA-Quin are CA analogs and CamSA has been demonstrated to enter the EHC. Meanwhile, both treatments led to significantly altered BA profiles as noted above. Therefore, we conducted a targeted analysis on the expression of key genes involved in BA homeostasis. A heatmap of the genes involved in the pathways for primary bile acid synthesis and bile secretion (extracted from KEGG [
50,
51,
52]) showed several genes that demonstrated a statistically significant change in the treatment groups compared to the control group (
Figure 7).
In CA-Quin-treated mice
Cyp7a1,
Cyp8b1,
Amacr, and
Fxr (Nr1h4) were upregulated while s
Cyp2c70 and
Bsep (Abcc11) were downregulated . Similarly, in CamSA-treated mice
Cyp2c70, Baat and
Bsep were downregulated. All genes from the KEGG pathways are shown in
Supplementary Figure S5. The normalized counts for the genes in the respective treatment group are shown in
Supplementary Figure S6.
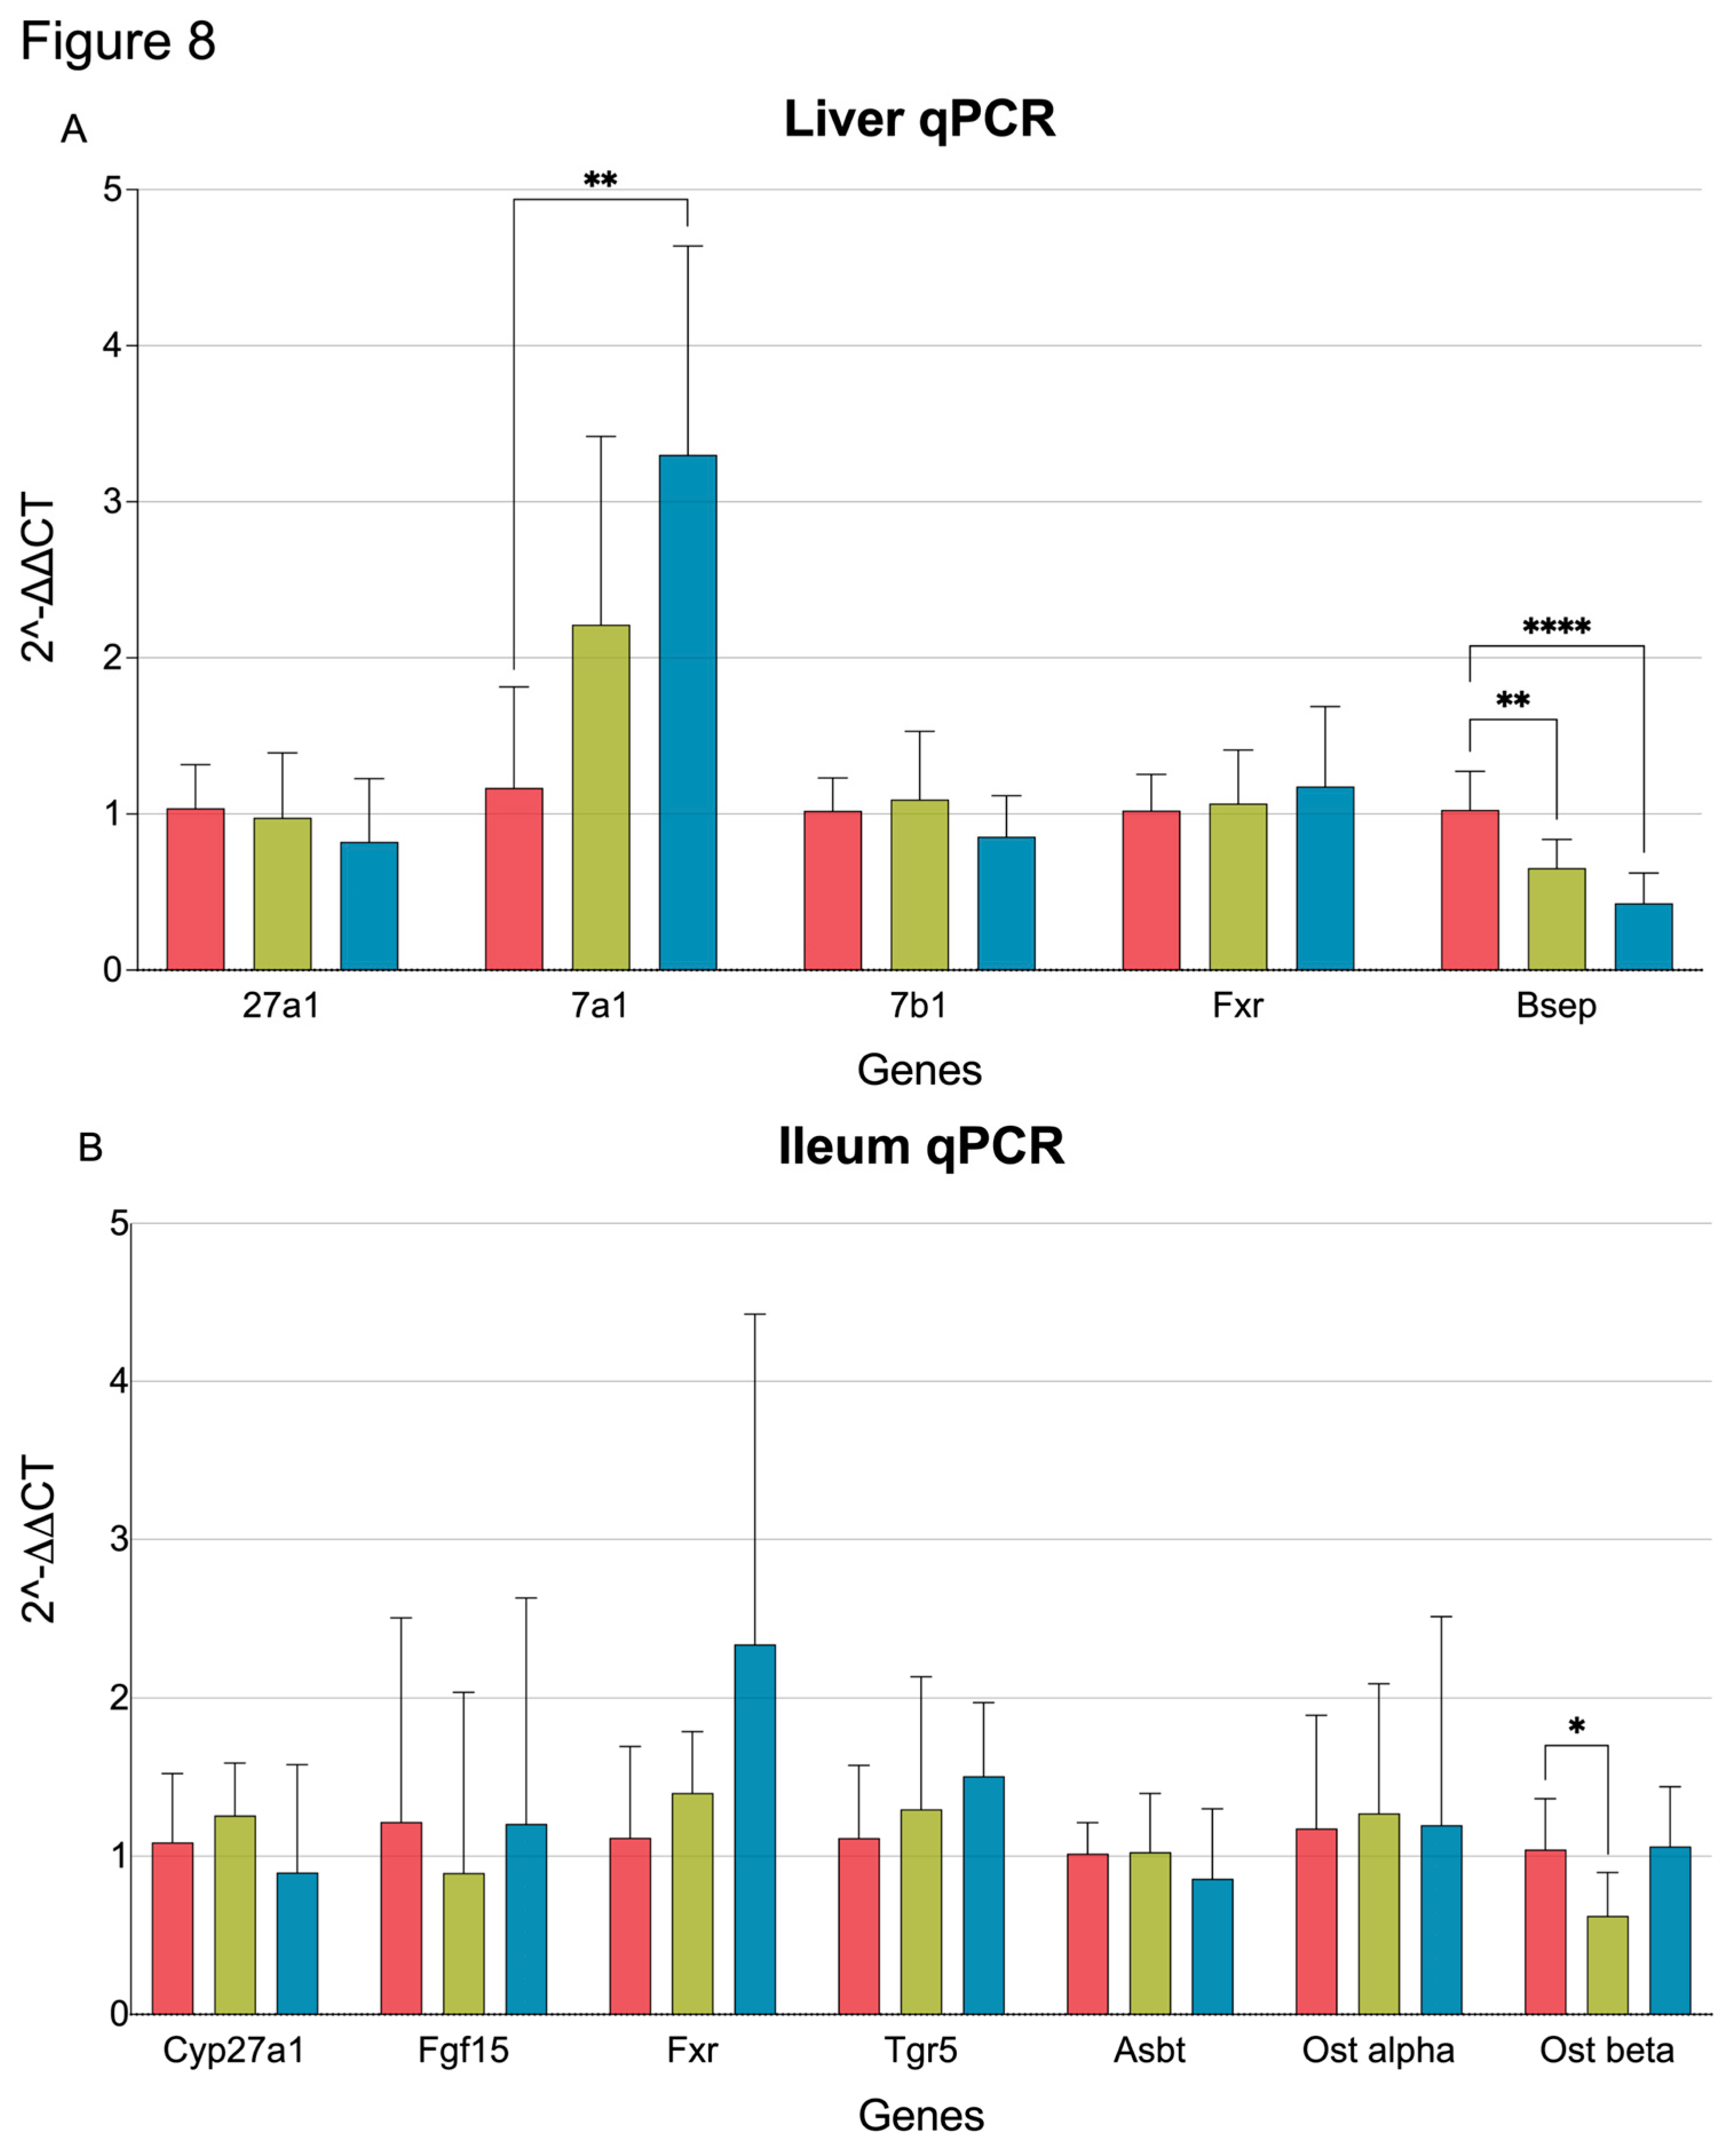
3.4. qPCR quantification of BA metabolism and transporter genes in the liver and ileum
To validate the transcriptome results, qPCR was performed for selected genes involved in bile synthesis and transport.
Cyp7a1 expression was significantly increased in CA-Quin-treated animals, while
Bsep (
Abcb11) was significantly decreased in both treatment groups. Similar to the transcriptomic data, qPCR showed that expression of
Cyp27a1,
Cyp7b1, and
Fxr (
Nr1h4) was not altered by either CamSA or CA-Quin (
Figure 8A).
EHC transport of bile involves numerous proteins in the ileum. Our qPCR data shows that
Ostβ, a key transporter involved in bile resorption [
53], was significantly downregulated in the ileum from the CamSA-treated mice (
Figure 8B).
4. Discussion.
Previously, we have shown that our first generation germination inhibitor, CamSA, can be maintained at therapeutic levels due to recycling via the EHC[
14,
54,
55]. However, CamSA can be hydrolyzed by the gut bacteria and becomes inactive and can potentially release toxic byproducts [
54]. In addition, one of our other parent inhibitors, CA-Quin, has shown significant potency without being metabolized by the murine microbiota (data not shown). While both compounds do not show obvious signs of toxicity, detailed studies on hepatotoxicity and the effects on bile acids have not been performed. To address this issue, we conducted a transcriptomic and bile acid acids metabolomic analysis on mice treated with the vehicle (DMSO) and the inhibitors, CamSA and CA-Quin for 7 days.
The minimal alteration of hepatic transcriptome by both treatments as demonstrated in the PCA plots indicates that the potential hepatic toxicity of these two compounds is very limited. We also found that the DEG patterns associated with both treatments are largely shared, indicating that that the two compounds may have a highly similar pharmacokinetic and pharmacodynamic profile. Most significant changes based on fold change and adjusted p values were only observed in a few genes. Among those,
Cyp3a11 expression is noted to be related to changes in the gut microbiome, cholesterol and bile synthesis, high fat diet, and drug metabolism[
56,
57,
58,
59] [
60]. The
Sgk2 gene is a serine/threonine kinases, that was demonstrated to be related to PI3K-AKT signaling and stimulator for ion channels [
61,
62,
63,
64,
65,
66,
67]. This signaling pathway can play a role in cholesterol metabolism as well [
68,
69]. The
Tubb2a and
Tuba4a genes are involved numerous pathways from various transport pathways to immune response related pathways [
70,
71,
72,
73,
74,
75,
76,
77,
78].
Ces2a is known to be part of xenobiotic metabolism and fatty acids/lipids metabolism pathways[
79,
80,
81,
82,
83,
84,
85,
86].
Nrep was shown to be involved in wound healing, TGF-β signaling, and lipid related pathways [
87,
88,
89,
90,
91,
92,
93,
94]. Altogether, the significant up/down regulation of the most significantly affected genes is not noted to be specific to hepatotoxicity.
While both compounds are BA analogs, our previous study has demonstrated that CamSA enters the EHC. It is thus logically hypothesized that both compounds may interfere with the EHC and homeostasis of BAs. Examination of samples from mice treated with these bile salt analogs demonstrated a few interesting patterns. First, the overall alteration of all BAs among different tissues are highly similar between the CamSA and CA-Quin treatment compared to the DMSO control, which further suggests a similar impact of the two compounds on BA homeostasis.
We also found that the major changes in BA profiles associated with both treatments are the increased BA levels, largely attributed to unconjugated primary and secondary species, among fecal samples, with a high similarity between the samples collected at the two timepoints, suggesting an increased excretion of BAs following both treatments. This trend may suggest a decreased re-absorption of BAs from the intestine back to the liver. This is further supported by the reduced levels of a few secondary BA species in the liver and decreased transcription of the transporter Ostβ in the CamSA-treated ileum samples.
Reduced BA re-absorption by the EHC may signal to the liver to increase production of BAs. Because BAs are sterol-derivatives, the net effect would be an elevated need of cholesterol usage. This is evidenced by the significant upregulation of hepatic expression of Cyp7a1 (the rate-limiting enzyme controlling the conversion of cholesterol to BA) and Hmgcr (rate limiting enzyme for cholesterol biosynthesis). Furthermore, the downregulation of Bsep perhaps also reflects the tendency of BA retention in the liver. Therefore, both CamSA and CA-Quin likely inhibit BA re-absorption and promote intestinal BA excretion.
More detailed analysis of the BA profiles further demonstrated that intestinal TCA and CDCA levels are significantly altered by the two treatments. TCA and CDCA were demonstrated to contribute to the activation and inhibition of
C. difficile germination, respectively [
19,
95]. In this study, we found that the TCA level was significantly reduced in both the chyme and feces samples of the CamSA-treated mice, while CDCA level was significantly increased in the chyme of CA-Quin group, and in feces samples of both treatment groups. Therefore, our data accounts for, at least in part, the inhibitory effects of the two compounds in treating CDI.
In a previous pharmacokinetic analysis of CamSA, we found that it is hydrolyzed into CA and metanilic acid (mSA)[
54]. Thus, the increase in CA level observed in the CamSA treated mice, may be due to the hydrolysis of the drug. However, we have shown that CA-Quin is not hydrolyzed by the gut bacteria and remains unchanged in the gut (data not shown). Even though there is an increased level of CA in the ileum of CA-Quin-treated mice as well as in feces samples of both treatments, this increased CA is more likely attributed to the reduced reabsorption. Nevertheless, increased CA in the gut may be also beneficial in treating CDI, as it has been found that CA can bind to one of the
C. difficile toxins, TcdB, and reduce its toxic effects [
96].
Despite no direct observation, our data also indicates an altered gut microbiome following the two treatments. We previously reported that 10 days of treatment with CamSA in uninfected animals resulted in significantly different microbiome diversity [
55]. The BA profile changes shown here are consistent with those prior microbiota observations. Because both de-conjugation of primary BAs and the production of secondary BAs rely on bacterial enzymes [
8,
96,
97,
98], the increased level of de-conjugated primary and unconjugated secondary BAs in the feces of treated groups likely reflect the increased beta diversity of the gut microbiota as compared to the control group. Indeed, the metabolization of primary BAs into secondary BAs can only be done in certain bacterial species that have the necessary enzymes, such as 7-alpha-dehydroxylases in bacteria like
C. scindens,
P. hiranonis, or
E. hylemonae [
99] [
97,
100]. Therefore, the significantly increased secondary BAs in the feces may reflect the enrichment of these species which may directly compete with
C. difficile. Previous studies have shown that
C. scindens is associated with the prognosis of
C. difficile infection [
96,
97]. Therefore, the retention of these products in the gut may also contribute to the therapeutic effect of the two compounds. Furthermore, secondary bile acids produced in the gut such as DCA or LCA can act as natural inhibitors for
C. difficile infection [
100]. In addition to these changes in BA profiles, the hepatic transcriptomic data demonstrated shared enrichment in GO pathways of monocarboxylic acids and organic acids. It is known that short-chain fatty acids (SCFAs) are primarily produced by gut microbiota. This hepatic transcriptome signature may imply an increased production of SCFAs following the two treatments. Additionally, the hepatic transcriptome data demonstrated shared enrichment in the KEGG pathway, peroxisome. It is known that peroxisomes are important for the beta-oxidation of bile acid precursors[
101,
102]. Taken together, our data suggests that both compounds demonstrated anti-
C. difficile activity via altering the BA-gut microbiome homeostasis and interaction.
5. Conclusions
In summary, our data from our previous studies in potency and pharmacokinetics, in conjunction with the results from the present study, indicate that bile acid analogs are promising therapeutics for C. difficile infection. Our study provided further evidence that these analogs are safe, and their unique inferences with the bile acids EHC may normalize the gut microbiota and modulate the profiles of key bile acids that critically impact the C. difficile activity.
Supplementary Materials
The following supporting information can be downloaded at the website of this paper posted on Preprints.org. Figure S1: All Bile Species Among All Samples (Percent Composition), Figure S2: Enrichment analysis of CamSA DEGs, Figure S3: Enrichment analysis of CA-Quin DEGs, Figure S4: Enrichment analysis of Shared DEGs, Figure S5: Heatmap of Bile Related Genes, Figure S6: RNA Seq Normalized Counts for Significant Bile Related Genes; Table S1: Materials/Reagents, Table S2: Primer Sequences, Table S3: Categorization of Bile Species, Table S4: Quantities of Bile Acids Present;
Author Contributions
Conceptualization: N.V., E.H., C.H., S.F., E.A-S., W.L. Methodology: N.V., E.H., C.H., S.S., S.F., E.A-S., W.L. Validation: N.V., S.F., E.A-S., W.L. Formal analysis: N.V., S.F., E.A., W.L. Investigation: N.V., E.H., S.S., S.F., E.A-S., W.L. Data curation: N.V., E.H., C.H., S.F., E.A-S., W.L. Writing- original draft: N.V., S.F., E.A-S., W.L. Writing-review & editing: all authors. Project administration: S.F., E.A-S., W.L.
Funding
This research was funded by the NIH, grant number: R01AI109139. The Richmond VA Medical Center LC-MS/MS core is supported by VA ShEEP, grant number: 1IS1BX004777-01. Dr. Zhou is the recipient of a Research Career Scientist Award from the Department of Veterans Affairs, grant number IK6BX004477.
Institutional Review Board Statement
The animal study protocol was approved by the institutional Animal Investigational Committee of the University of Nevada, Las Vegas (R0914-297, date of approval: June 20th, 2025).
Data Availability Statement
All data produced or examined within this study are comprehensively incorporated in the manuscript.
Acknowledgments
The authors have reviewed and edited the output and take full responsibility for the content of this publication.
Conflicts of Interest
The authors declare no conflicts of interest. The funders had no role in the design of the study; in the collection, analyses, or interpretation of data; in the writing of the manuscript; or in the decision to publish the results.
Abbreviations
The following abbreviations are used in this manuscript:
| 12-keto-LCA |
2-keto-lithocholic acid |
| 3-keto,7α,12α(OH)₂ |
3-keto-7α,12α-dihydroxy-5β-cholan-24-oic acid |
| 3-keto-LCA |
3-keto-lithocholic acid |
| 7-keto-DCA |
7-keto-deoxycholic acid |
| 7-keto-LCA |
7-keto-lithocholic acid |
| C4 |
7α-hydroxy-4-cholesten-3-one |
| allo-isoLCA |
allo-isolithocholic acid |
| α-MCA |
alpha-muricholic acid |
| β-MCA |
beta-muricholic acid |
| BA |
bile acid |
| CDCA |
chenodeoxycholic acid |
| CDCA-3-S |
chenodeoxycholic acid-3-sulfate |
| CA |
cholic acid |
| CA-3-S |
cholic acid-3-sulfate |
| CA-7-S |
cholic acid-7-sulfate |
| CDI |
Clostridioides difficile infection |
| DCA |
deoxycholic acid |
| DCA-3-S |
deoxycholic acid-3-sulfate |
| DMSO |
dimethyl sulfoxide |
| EHC |
enterohepatic circulation |
| Gβ-MCA |
glyco-beta-muricholic acid |
| GCDCA |
glycochenodeoxycholic acid |
| GCA |
glycocholic acid |
| GDCA |
glycodeoxycholic acid |
| GHCA |
glycohyocholic acid |
| GHDCA |
glycohyodeoxycholic acid |
| GLCA |
glycolithocholic acid |
| GUDCA |
glycoursodeoxycholic acid |
| HCA |
hyocholic acid |
| HDCA |
hyodeoxycholic acid |
| isoDCA |
isodeoxycholic acid |
| isoLCA |
isolithocholic acid |
| LC-MS |
liquid chromatography- mass spectrometry |
| LCA |
lithocholic acid |
| LCA-3-S |
lithocholic acid-3-sulfate |
| mSA |
metanilic acid |
| MDCA |
murideoxycholic acid |
| ω-MCA |
omega-muricholic acid |
| PCA |
principle component analysis |
| Tα-MCA |
tauro-alpha-muricholic acid |
| Tβ-MCA |
tauro-beta-muricholic acid |
| Tω-MCA |
tauro-omega-muricholic acid |
| TCDCA |
taurochenodeoxycholic acid |
| TCA |
taurocholic acid |
| TCA |
taurodeoxycholic acid |
| THDCA |
taurohyodeoxycholic acid |
| TLCA |
taurolithocholic acid |
| TUDCA |
tauroursodeoxycholic acid |
| UDCA |
ursodeoxycholic acid |
| UDCA-3-S |
ursodeoxycholic acid-3-sulfate |
References
- Mada PK, A.M. Clostridioides difficile infection. StatPearls 2024 April 10, 2024 [cited 2024 October 4]; Available from: https://www.ncbi.nlm.nih.gov/books/NBK431054/.
- Research, M.F.f.M.E.a. C. Difficile Infection. 2024 September 1, 2023 [cited 2024 October 4]; Available from: https://www.mayoclinic.org/diseases-conditions/c-difficile/symptoms-causes/syc-20351691.
- Prevention, U.S.C.f.D.C.a. C. diff (Clostridioides difficile). 2024 March 6, 2024 [cited 2024 October 4]; Available from: https://www.cdc.gov/c-diff/about/index.html.
- Dicks, L.M.T.; et al. Clostridium difficile, the Difficult “Kloster” Fuelled by Antibiotics. Current Microbiology 2019, 76, 774–782. [Google Scholar]
- McDonald, L.C.; et al. Clinical Practice Guidelines for Clostridium difficile Infection in Adults and Children: 2017 Update by the Infectious Diseases Society of America (IDSA) and Society for Healthcare Epidemiology of America (SHEA). Clinical Infectious Diseases 2018, 66, e1–e48. [Google Scholar]
- Sorg, J.A.; Sonenshein, A.L. Chenodeoxycholate is an inhibitor of Clostridium difficile spore germination. J. Bacteriol. 2009, 191, 1115–1117. [Google Scholar] [CrossRef]
- Sorg, J.A.; Sonenshein, A.L. Bile salts and glycine as cogerminants for Clostridium difficile spores. J. Bacteriol. 2008, 190, 2505–2512. [Google Scholar] [CrossRef]
- Poland, J.C.; Flynn, C.R. Bile Acids, Their Receptors, and the Gut Microbiota. Physiology 2021, 36, 235–245. [Google Scholar] [CrossRef] [PubMed]
- Choudhuri, S.; Klaassen, C.D. Molecular Regulation of Bile Acid Homeostasis. Drug Metabolism and Disposition 2022, 50, 425–455. [Google Scholar] [CrossRef] [PubMed]
- Alvarez, Z.; Abel-Santos, E. Potential Use of Inhibitors of Bacteria Spore Germination in the Prophylactic Treatment of anthrax and Clostridium difficile-Associated Disease. Expert Review of Anti-infective Therapy 2007, 5, 783–792. [Google Scholar] [CrossRef]
- Sharma, S.; et al. 5,6-Fused Heterocycle Cholate Derivatives as Spore Germination Inhibitors of Clostridioides difficile. ChemRxiv 2024. [Google Scholar]
- Sharma, S.K.; et al. The design, synthesis, and inhibition of Clostridioides difficile spore germination by acyclic and bicyclic tertiary amide analogs of cholate. Eur J Med Chem 2023, 261, 115788. [Google Scholar] [CrossRef] [PubMed]
- Sharma, S.K.; et al. Studies on the Importance of the 7alpha-, and 12alpha- hydroxyl groups of N-Aryl-3alpha,7alpha,12alpha-trihydroxy-5beta-cholan-24-amides on their Antigermination Activity Against a Hypervirulent Strain of Clostridioides (Clostridium) difficile. Bioorg Med Chem 2021, 52, 116503. [Google Scholar]
- Sharma, S.K.; et al. The Design, Synthesis, and Characterizations of Spore Germination Inhibitors Effective against an Epidemic Strain of Clostridium difficile. J Med Chem 2018, 61, 6759–6778. [Google Scholar] [CrossRef] [PubMed]
- Phan, J.R.; et al. An Aniline-Substituted Bile Salt Analog Protects both Mice and Hamsters from Multiple Clostridioides difficile Strains. Antimicrobial Agents and Chemotherapy 2022, 66, e01435–21. [Google Scholar] [CrossRef]
- Howerton, A.; et al. Effect of the Synthetic Bile Salt Analog CamSA on the Hamster Model of Clostridium difficile Infection. Antimicrobial Agents and Chemotherapy 2018, 62. [Google Scholar] [CrossRef]
- Howerton, A.; Patra, M.; Abel-Santos, E. Fate of Ingested Clostridium difficile Spores in Mice. PloS one 2013, 8, e72620–e72620. [Google Scholar] [CrossRef]
- Howerton, A.; Patra, M.; Abel-Santos, E. A New Strategy for the Prevention of Clostridium difficile Infection. Journal of Infectious Diseases 2013, 207, 1498–1504. [Google Scholar] [CrossRef]
- Howerton, A.; Ramirez, N.; Abel-Santos, E. Mapping Interactions between Germinants and Clostridium difficile Spores. Journal of Bacteriology 2011, 193, 274–282. [Google Scholar] [CrossRef] [PubMed]
- Yip, C.; Phan, J.R.; Abel-Santos, E. Mechanism of germination inhibition of Clostridioides difficile spores by an aniline substituted cholate derivative (CaPA). bioRxiv, 2023: p. 2023.02.16.528851.
- Yip, C.; et al. Pharmacokinetics of Camsa, a Potential Prophylactic Compound Against Clostridioides difficile Infections. Biochemical Pharmacology 2021, 183, 114314. [Google Scholar] [CrossRef] [PubMed]
- Sharma, S.K.; et al. The Design, Synthesis, and Characterizations of Spore Germination Inhibitors Effective against an Epidemic Strain of Clostridium difficile. Journal of medicinal chemistry 2018, 61, 6759–6778. [Google Scholar] [CrossRef]
- Sattar, A.; et al. SMT19969 for Clostridium difficile infection (CDI): In Vivo Efficacy Compared with Fidaxomicin and Vancomycin in the Hamster Model of CDI. The Journal of antimicrobial chemotherapy 2015, 70, 1757–1762. [Google Scholar] [CrossRef]
- Shiv Sharma, J.P.; Abel-Santos, E.; Firestine, S. 5,6-Fused Heterocycle Cholate Derivatives as Spore Germination Inhibitors of Clostridioides difficile. ChemRxiv 2023. [Google Scholar] [CrossRef]
- Kakiyama, G.; et al. Insulin resistance dysregulates CYP7B1 leading to oxysterol accumulation: a pathway for NAFL to NASH transition. J Lipid Res 2020, 61, 1629–1644. [Google Scholar]
- Wang, Y.; et al. Berberine Prevents Disease Progression of Nonalcoholic Steatohepatitis through Modulating Multiple Pathways. Cells 2021, 10. [Google Scholar] [CrossRef]
- Andrews, S. FastQC: A Quality Control Tool for High Throughput Sequence Data. Available from: https://www.bioinformatics.babraham.ac.uk/projects/fastqc/.
- Bolger, A.M.; Lohse, M.; Usadel, B. Trimmomatic: a flexible trimmer for Illumina sequence data. Bioinformatics 2014, 30, 2114–2120. [Google Scholar] [CrossRef]
- Kim, D.; et al. Graph-based genome alignment and genotyping with HISAT2 and HISAT-genotype. Nature Biotechnology 2019, 37, 907–915. [Google Scholar] [CrossRef]
- Putri, G.H.; et al. Analysing high-throughput sequencing data in Python with HTSeq 2. 0. Bioinformatics 2022, 38, 2943–2945. [Google Scholar] [CrossRef]
- Anders, S.; Pyl, P.T.; Huber, W. HTSeq—a Python framework to work with high-throughput sequencing data. Bioinformatics 2014, 31, 166–169. [Google Scholar] [PubMed]
- 32.R Development Core Team, R: A language and environment for statistical computing. 2024, R Foundation for Statistical Computing: Vienna, Austria.
- Team, P. RStudio: Integrated Development Environment for R. 2024, Posit Software, PBC: Boston, MA.
- Love, M.I.; Huber, W.; Anders, S. Moderated estimation of fold change and dispersion for RNA-seq data with DESeq2. Genome Biology 2014, 15, 550. [Google Scholar] [CrossRef] [PubMed]
- Wickham, H. ggplot2: Elegant Graphics for Data Analysis. 2016: Springer-Verlag New York.
- Yan, L. ggvenn: Draw Venn Diagram by ‘ggplot2’. 2023.
- Gu, Z.; Eils, R.; Schlesner, M. Complex heatmaps reveal patterns and correlations in multidimensional genomic data. Bioinformatics 2016, 32, 2847–2849. [Google Scholar] [CrossRef] [PubMed]
- Gu, Z. Complex heatmap visualization. Imeta 2022, 1, e43. [Google Scholar] [CrossRef]
- Durinck, S.; et al. BioMart and Bioconductor: a powerful link between biological databases and microarray data analysis. Bioinformatics 2005, 21, 3439–3440. [Google Scholar] [CrossRef]
- Durinck, S.; et al. Mapping identifiers for the integration of genomic datasets with the R/Bioconductor package biomaRt. Nat Protoc 2009, 4, 1184–91. [Google Scholar] [CrossRef]
- Vaughan, H.W.a.R.F.a.L.H.a.K.M.a.D. dplyr: A Grammar of Data Manipulation. 2023.
- Slowikowski, K. ggrepel: Automatically Position Non-Overlapping Text Labels with 'ggplot2'. 2024.
- Li, H.P.a.M.C.a.S.F.a.N. AnnotationDbi: Manipulation of SQLite-based annotations in Bioconductor. 2024.
- Carlson, M. org.Mm.eg.db: Genome wide annotation for Mouse. 2024.
- Li, Y.T.a.M.H.a.W. ggfortify: Unified Interface to Visualize Statistical Result of Popular R Packages. The R Journal, 2016. 8(210.32614/RJ-2016-060): p. 474-485.
- Tang, M.H.a.Y. ggfortify: Data Visualization Tools for Statistical Analysis Results. 2018.
- Pedersen, T.L. patchwork: The Composer of Plots. 2024.
- Walker, P.S.a.A. openxlsx: Read, Write and Edit xlsx Files. 2025.
- Zhou, Y.; et al. Metascape provides a biologist-oriented resource for the analysis of systems-level datasets. Nat Commun 2019, 10, 1523. [Google Scholar] [CrossRef] [PubMed]
- Kanehisa, M.; Goto, S. KEGG: Kyoto Encyclopedia of Genes and Genomes. Nucleic Acids Research 2000, 28, 27–30. [Google Scholar] [CrossRef] [PubMed]
- Kanehisa, M. Toward understanding the origin and evolution of cellular organisms. Protein Science 2019, 28, 1947–1951. [Google Scholar] [CrossRef]
- Kanehisa, M.; et al. KEGG: biological systems database as a model of the real world. Nucleic Acids Research 2024, 53, D672–D677. [Google Scholar] [CrossRef]
- Science, W.I.o. SLC51B. 2024 [cited 2024 October 4]; Available from: https://www.genecards.org/cgi-bin/carddisp.pl?gene=SLC51B.
- Yip, C.; et al. Pharmacokinetics of CamSA, a potential prophylactic compound against Clostridioides difficile infections. Biochem Pharmacol 2021, 183, 114314. [Google Scholar] [CrossRef]
- Phan, J.R.; et al. An Aniline-Substituted Bile Salt Analog Protects both Mice and Hamsters from Multiple Clostridioides difficile Strains. Antimicrob Agents Chemother 2022, 66, e0143521. [Google Scholar] [CrossRef]
- Hashimoto, M.; et al. Knockout of mouse Cyp3a gene enhances synthesis of cholesterol and bile acid in the liver. J Lipid Res 2013, 54, 2060–2068. [Google Scholar] [CrossRef]
- Liu, X.; et al. Metabolomics reveals the formation of aldehydes and iminium in gefitinib metabolism. Biochem Pharmacol 2015, 97, 111–21. [Google Scholar] [CrossRef]
- Tajima, M.; et al. Different diets cause alterations in the enteric environment and trigger changes in the expression of hepatic cytochrome P450 3A, a drug-metabolizing enzyme. Biol Pharm Bull 2013, 36, 624–34. [Google Scholar] [CrossRef]
- Togao, M.; et al. Human gut microbiota influences drug-metabolizing enzyme hepatic Cyp3a: A human flora-associated mice study. J Toxicol Sci 2023, 48, 333–343. [Google Scholar] [CrossRef] [PubMed]
- Medicine, N.L.o. Cyp3a11. 2025 June 9, 2025 [cited 2025; Available from: https://www.ncbi.nlm.nih.gov/gene/13112#bibliography.
- Medicine, N.L.o. Sgk2. 2025 June 9, 2025 [cited 2025; Available from: https://www.ncbi.nlm.nih.gov/gene/27219.
- Zhou, B.; et al. Serum- and glucocorticoid-induced kinase drives hepatic insulin resistance by directly inhibiting AMP-activated protein kinase. Cell Rep 2021, 37, 109785. [Google Scholar] [CrossRef]
- Luo, J.; et al. Transcriptome analysis reveals the mechanism of Rhodiola polysaccharide affecting the proliferation of porcine Leydig cells under hypoxia. BMC Vet Res 2025, 21, 211. [Google Scholar] [CrossRef]
- Liu, Y.; et al. SGK2 is overexpressed in colon cancer and promotes epithelial-mesenchymal transition in colon cancer cells. Eur J Surg Oncol 2020, 46 Pt A, 1912–1917. [Google Scholar] [CrossRef]
- Park, C.H.; et al. Protein Kinase SGK2 Is Induced by the β(3) Adrenergic Receptor-cAMP-PKA-PGC-1α/NT-PGC-1α Axis but Dispensable for Brown/Beige Adipose Tissue Thermogenesis. Front Physiol 2021, 12, 780312. [Google Scholar] [CrossRef]
- Kobayashi, T.; et al. Characterization of the structure and regulation of two novel isoforms of serum- and glucocorticoid-induced protein kinase. Biochem J 1999, 344 Pt 1, 189–197. [Google Scholar] [CrossRef]
- Loffing, J.; Flores, S.Y.; Staub, O. Sgk kinases and their role in epithelial transport. Annu Rev Physiol 2006, 68, 461–490. [Google Scholar] [CrossRef]
- Tang, Y.; et al. Midkine Promote Atherosclerosis by Regulating the Expression of ATP-Binding Cassette Transporter A1 via Activator Protein-1. Cardiovasc Drugs Ther 2025. [Google Scholar] [CrossRef] [PubMed]
- Barbhuiya, P.A.; Yoshitomi, R.; Pathak, M.P. Understanding the Link Between Sterol Regulatory Element Binding Protein (SREBPs) and Metabolic Dysfunction Associated Steatotic Liver Disease (MASLD). Curr Obes Rep 2025, 14, 36. [Google Scholar] [CrossRef] [PubMed]
- Medicine, N.L.o. Tuba4a. 2025 June 9, 2025 [cited 2025; Available from: https://www.ncbi.nlm.nih.gov/gene/22145.
- Medicine, N.L.o. Tubb2a. 2025 June 9, 2025 [cited 2025; Available from: https://www.ncbi.nlm.nih.gov/gene/22151.
- Zarei Ghobadi, M.; Mozhgani, S.H.; Erfani, Y. Identification of dysregulated pathways underlying HTLV-1-associated myelopathy/tropical spastic paraparesis through co-expression network analysis. J Neurovirol 2021, 27, 820–830. [Google Scholar] [CrossRef] [PubMed]
- Du, J.; et al. Establishment and validation of a novel risk model based on CD8T cell marker genes to predict prognosis in thyroid cancer by integrated analysis of single-cell and bulk RNA-sequencing. Medicine (Baltimore) 2023, 102, e35192. [Google Scholar] [PubMed]
- Labrecque, M.; et al. Transcriptomic profiling of severe and critical COVID-19 patients reveals alterations in expression, splicing and polyadenylation. Sci Rep 2025, 15, 13469. [Google Scholar]
- Ryyti, R.; et al. Effects of Lingonberry (Vaccinium vitis-idaea L.) Supplementation on Hepatic Gene Expression in High-Fat Diet Fed Mice. Nutrients 2021, 13. [Google Scholar]
- Verstockt, B.; et al. Distinct transcriptional signatures in purified circulating immune cells drive heterogeneity in disease location in IBD. BMJ Open Gastroenterol 2023, 10. [Google Scholar]
- Zhang, Z.; et al. Identification of PPARG as key gene to link coronary atherosclerosis disease and rheumatoid arthritis via microarray data analysis. PLoS One 2024, 19, e0300022. [Google Scholar]
- Tien, N.T.N.; et al. Time-course cross-species transcriptomics reveals conserved hepatotoxicity pathways induced by repeated administration of cyclosporine A. Toxicol Mech Methods 2024, 34, 1010–1021. [Google Scholar]
- Medicine, N.L.o. Ces2a. 2025 June 9, 2025 [cited 2025; Available from: https://www.ncbi.nlm.nih.gov/gene/102022.
- Zhang, F.; et al. Inhibition of drug-metabolizing enzymes by Jingyin granules: implications of herb-drug interactions in antiviral therapy. Acta Pharmacol Sin 2022, 43, 1072–1081. [Google Scholar] [PubMed]
- Zhang, C.; et al. Alisol B alleviates MASLD by activating liver autophagy and fatty acid oxidation via Ces2a. Int Immunopharmacol 2025, 157, 114768. [Google Scholar]
- Song, Y.Q.; et al. Carboxylesterase inhibitors from clinically available medicines and their impact on drug metabolism. Chem Biol Interact 2021, 345, 109566. [Google Scholar]
- Liu, J.; et al. Carboxylesterase 2A gene knockout or enzyme inhibition alleviates steatohepatitis in rats by regulating PPARγ and endoplasmic reticulum stress. Free Radic Biol Med 2025, 232, 279–291. [Google Scholar] [PubMed]
- Li, W.R.; et al. Discovery of tri(indolyl)methanes as potent and selective inhibitors against human carboxylesterase 2. Int J Biol Macromol 2025, 307 Pt 1, 141868. [Google Scholar] [CrossRef]
- Chalhoub, G.; et al. Carboxylesterase 2a deletion provokes hepatic steatosis and insulin resistance in mice involving impaired diacylglycerol and lysophosphatidylcholine catabolism. Mol Metab 2023, 72, 101725. [Google Scholar] [CrossRef]
- Stok, J.E.; et al. Identification, expression, and purification of a pyrethroid-hydrolyzing carboxylesterase from mouse liver microsomes. J Biol Chem 2004, 279, 29863–9. [Google Scholar] [CrossRef] [PubMed]
- Medicine, N.L.o. Nrep. 2025 June 9, 2025 [cited 2025; Available from: https://www.ncbi.nlm.nih.gov/gene?Db=gene&Cmd=DetailsSearch&Term=27528.
- Wang, S.; et al. Reconstruction and Functional Annotation of P311 Protein-Protein Interaction Network Reveals Its New Functions. Front Genet 2019, 10, 109. [Google Scholar] [CrossRef] [PubMed]
- Nunez, S.; et al. P311, a novel intrinsically disordered protein, regulates adipocyte development. Biochem Biophys Res Commun 2019, 515, 234–240. [Google Scholar] [CrossRef]
- Duan, F.F.; et al. P311 Promotes Lung Fibrosis via Stimulation of Transforming Growth Factor-β1, -β2, and -β3 Translation. Am J Respir Cell Mol Biol 2019, 60, 221–231. [Google Scholar] [CrossRef]
- Du, Y.; et al. Butyrate alleviates diabetic kidney disease by mediating the miR-7a-5p/P311/TGF-β1 pathway. Faseb j 2020, 34, 10462–10475. [Google Scholar] [CrossRef] [PubMed]
- De Jesus, D.F.; et al. NREP contributes to development of NAFLD by regulating one-carbon metabolism in primary human hepatocytes. Cell Chem Biol 2023, 30, 1144–1155.e4. [Google Scholar] [CrossRef]
- Cheng, T.; et al. Neuronal Protein 3.1 Deficiency Leads to Reduced Cutaneous Scar Collagen Deposition and Tensile Strength due to Impaired Transforming Growth Factor-β1 to -β3 Translation. Am J Pathol 2017, 187, 292–303. [Google Scholar] [CrossRef]
- Chen, C.; et al. P311 Promotes IL-4 Receptor‒Mediated M2 Polarization of Macrophages to Enhance Angiogenesis for Efficient Skin Wound Healing. J Invest Dermatol 2023, 143, 648–660.e6. [Google Scholar] [CrossRef]
- Ramirez, N.; Liggins, M.; Abel-Santos, E. Kinetic evidence for the presence of putative germination receptors in Clostridium difficile spores. J Bacteriol 2010, 192, 4215–4222. [Google Scholar] [CrossRef] [PubMed]
- McMillan, A.S.; Theriot, C.M. Bile acids impact the microbiota, host, and C. difficile dynamics providing insight into mechanisms of efficacy of FMTs and microbiota-focused therapeutics. Gut Microbes 2024, 16, 2393766. [Google Scholar] [CrossRef]
- Li, W.; Chen, H.; Tang, J. Interplay between Bile Acids and Intestinal Microbiota: Regulatory Mechanisms and Therapeutic Potential for Infections. Pathogens 2024, 13. [Google Scholar] [CrossRef]
- Fuchs, C.D.; et al. Bile acid metabolism and signalling in liver disease. Journal of Hepatology 2025, 82, 134–153. [Google Scholar] [CrossRef]
- Gou, H.; et al. Gut microbial metabolites: Shaping future diagnosis and treatment against gastrointestinal cancer. Pharmacological Research 2024, 208, 107373. [Google Scholar] [CrossRef]
- Mullish, B.H. and J.R. Allegretti, The contribution of bile acid metabolism to the pathogenesis of Clostridioides difficile infection. Therapeutic Advances in Gastroenterology 2021, 14, 17562848211017725. [Google Scholar] [CrossRef] [PubMed]
- Ferdinandusse, S.; Houten, S.M. Peroxisomes and bile acid biosynthesis. Biochimica et Biophysica Acta (BBA) - Molecular Cell Research 2006, 1763, 1427–1440. [Google Scholar] [CrossRef]
- Autio, Kaija J. ; et al. Role of AMACR (α-methylacyl-CoA racemase) and MFE-1 (peroxisomal multifunctional enzyme-1) in bile acid synthesis in mice. Biochemical Journal 2014, 461, 125–135. [Google Scholar] [CrossRef]
Figure 1.
PCA Plots of the quantified bile species within each sample. The raw bile acid concentration was utilized to generate these PCA plots.
Figure 1.
PCA Plots of the quantified bile species within each sample. The raw bile acid concentration was utilized to generate these PCA plots.
Figure 2.
Overall statistics of bile acid quantifications for the 4 tissue samples. A) The total concentration of bile acids quantified in each sample was summed up and log2 transformed. B) Ratio between the total level of unconjugated bile acids and total level of conjugated bile acids. Statistics was based on the post hoc Tukey pair-wise test under One-way ANOVA after the ratio was log2 transformed. (**** <0.0001, *** <0.001, ** <0.01, *<0.05).
Figure 3.
Levels of the total bile acids in four categories for each tissue sample. Statistics was based on the post hoc Tukey pair-wise test under One-way ANOVA after the ratio was log2 transformed. (**** <0.0001, *** <0.001, ** <0.01, *<0.05).
Figure 3.
Levels of the total bile acids in four categories for each tissue sample. Statistics was based on the post hoc Tukey pair-wise test under One-way ANOVA after the ratio was log2 transformed. (**** <0.0001, *** <0.001, ** <0.01, *<0.05).
Figure 4.
Level of each bile acid within the four tissue samples. Statistics was based on the post hoc Tukey pair-wise test under One-way ANOVA after the ratio was log2 transformed. (**** <0.0001, *** <0.001, ** <0.01, *<0.05). Heatmap was generated based on the log2 transformed data. Hashed cells denote bile salts species undetectable in the sample.
Figure 5.
Hepatic transcriptomic analyses. A) PCA plot of the overall hepatic transcriptomic data of the three groups). B) Venn diagram showing the number of up- and down-regulated genes as well as shared genes in each group. Genes with nominal p<0.05 were utilized for plotting the Venn diagram. “Down” indicates the downregulated genes and “Up” indicates the upregulated genes. The corresponding percentage is out of the total number of genes with a p < 0.05. C and D) Volcano plots of the DEGs for CamSA and CA-Quin treatment groups, respectively. Highlighted genes had a -log10 (adjusted p) < 0.05 and a log2 fold change +/- 1.5. The highlighted genes in blue were downregulated while the genes in red were upregulated as compared to the control group.
Figure 6.
Enrichment analysis of transcriptomic hepatotoxicity data. All genes with a p value less than 0.05 for the respective treatment group from the DEG analysis utilized in previous figures were utilized. Analysis was done utilizing Metascape. A custom analysis utilizing GO, KEGG, and Reactome pathways was utilized with a p value less than 0.01 and minimum overlap of 3 genes. Figures are generated by the Metascape website analysis tool. A and B) Respective genes for each treatment with a p value less than 0.05 were utilized to generate the enrichment analysis. C) Genes in both treatments with a p value less than 0.05 were utilized to generate the enrichment analysis.
Figure 7.
Expression pattern of genes involved in bile synthesis and secretion pathways. Showing here are normalized expression (normalized gene count) levels of significant (unadjusted p < 0.05) DEGs between at least one treatment group and the control group. Statistical significance (unadjusted p < 0.05) in each treatment was indicated by the color bar on the left.
Figure 8.
Relative expression level quantified with qPCR of genes involved in bile synthesis, transport, and signaling. Statistics was based on the post hoc Tukey pair-wise test under One-way ANOVA. (**** <0.0001, *** <0.001, ** <0.01, *<0.05).
Figure 8.
Relative expression level quantified with qPCR of genes involved in bile synthesis, transport, and signaling. Statistics was based on the post hoc Tukey pair-wise test under One-way ANOVA. (**** <0.0001, *** <0.001, ** <0.01, *<0.05).
|
Disclaimer/Publisher’s Note: The statements, opinions and data contained in all publications are solely those of the individual author(s) and contributor(s) and not of MDPI and/or the editor(s). MDPI and/or the editor(s) disclaim responsibility for any injury to people or property resulting from any ideas, methods, instructions or products referred to in the content. |
© 2025 by the authors. Licensee MDPI, Basel, Switzerland. This article is an open access article distributed under the terms and conditions of the Creative Commons Attribution (CC BY) license (http://creativecommons.org/licenses/by/4.0/).